cardiovascular autonomic modulation in essential...
TRANSCRIPT

556
Cardiovascular Autonomic Modulationin Essential Hypertension
Effect of Tilting
Alberto Radaelli, Luciano Bernardi, Felice Valle, Stefano Leuzzi, Fabrizio Salvucci,Luisa Pedrotti, Eugenia Marchesi, Giorgio Finardi, Peter Sleight
Abstract To better understand the role played by the autonomicnervous system in essential hypertension, we used autoregressivepower spectrum analysis to study the noncasual oscillations in RRinterval, blood pressure, and skin blood flow in 40 subjects with mildto moderate hypertension and in 25 age-matched control subjects atlow frequency (index of sympathetic activity to the heart and theperipheral circulation) and high frequency, respiratory related (indexof vagal tone to the heart). RR interval, respiration, noninvasivesystolic blood pressure, and skin arteriolar blood flow were simulta-neously and continuously recorded with subjects in the supine posi-tion and immediately after tilting. The low-frequency component wasnot significantly different in the two groups either at the cardiac level(control versus hypertensive subjects: 39.1 ±4.3 versus 39.9±3.7 nor-malized units [NU]) or at the vascular level (1.52+0.17 versus1.69±0.13 In mm Hg2). After head-up tilting, the RR interval fluctu-ations were less in hypertensive subjects (low-frequency componentsfrom 39.9±3.7 to 48.4±4.1 NU, P<.05; high-frequency componentsfrom 53.9±3.7 to 44±4 NU, P<.05) than in control subjects (low-frequency components from 39.1±4.3 to 64.4±4.9 NU, P<.001;high-frequency components from 56.0±4.5 to 31.2±4.6 NU,/><.001); the low-frequency components in systolic blood pressureincreased similarly in hypertensive subjects (to 2.43±0.17 In mm Hg2,
The arterial baroreceptors are known to maintainblood pressure in a normal range by actions oncardiac output and peripheral resistance.1'2 In
essential hypertension, cardiovascular homeostasis ispartially lost or at least is maintained at a level of bloodpressure different from that of normotensive subjects.3-4
The cause of this abnormality is currently not known, butthe early alteration of baroreceptor control suggests thatthe autonomic nervous system is deeply involved in theprocess.56 An alteration of sympathovagal balance,caused by increased sympathetic tone or decreasedparasympathetic activity, has also been postulated.78 RRinterval, blood pressure, and arteriolar blood flow shownoncasual oscillations closely related to the activity ofthe cardiovascular control systems. Spectral analysis ofthese oscillations shows low-frequency (0.03 to 0.14 Hz)
Received November 8, 1993; accepted in revised form July 6,1994.
From the Department of Internal Medicine, First MedicalClinic, University of Pavia (Italy), and the Department of Cardio-vascular Medicine, University of Oxford (United Kingdom) (P.S.).
Presented in part as an oral presentation at the XIV EuropeanCongress of Cardiology, Barcelona, Spain, August 30-September 3,1992.
Correspondence to Luciano Bernardi, Clinica Medica 1, Univer-sita di Pavia, 27100 Pavia, Italy.
© 1994 American Heart Association, Inc.
/><.0OOl) and in control subjects (to 2.44±0.21 In mm Hg2, /><.01),but the low-frequency components in skin blood flow increased onlyin control subjects (from 5.34±0.45 to 6.55+0.53 mm Hg2, P<.01),not in hypertensive subjects (from 5.55 ±0.34 to 5.60±0.35 Inmm Hg2). In hypertensive subjects with left ventricular hypertrophy,the low-frequency components in systolic blood pressure did notincrease after tilting (from 1.75+0.33 to 2.05±0.41 In mmHg2).Baroreflex sensitivity, as assessed by spectrum analysis, was signifi-cantly lower in hypertensive than in control subjects (5.17±0.49versus 13.18±2.44 ms/mm Hg, /><.OO1). Power spectrum analysis didnot reveal an increased sympathetic activity or reactivity either at thecardiac or at the vascular level. The decreased baroreceptor sensitiv-ity in hypertensive subjects could explain the reduced change insympathovagal balance in the tilt position at the cardiac level. Inhypertensive subjects without left ventricular hypertrophy, cardiopul-monary reflex deactivation induced by tilting and/or amplification ofsympathetic nervous tone by arteriolar structural change could havepreserved the sympathetic activation at the vascular level.(Hypertension. 1994^4:556-563.)
Key Words • hypertension, essential • heart rate •spectrum analysis • autonomic nervous system
and high-frequency, respiratory-related, oscillatory com-ponents.9 The low-frequency component influences car-diac (RR interval) and, particularly, vascular control(blood pressure and arteriolar blood flow) mostlythrough sympathetic activity. However, our recentwork10 confirms the hypothesis of de Boer et al11 thatarterial baroreflexes play a major role in the origin of thelow-frequency component. The high-frequency oscilla-tory component, synchronous with respiration, actsthrough parasympathetic activity at the cardiac level.1214
Different studies15"21 with different methodologies haveinvestigated cardiovascular control in hypertensive pa-tients. While it is clear that early alteration of theparasympathetic activity is present in hypertension, therole played by the sympathetic activity is still beingdebated. Therefore, we used a new technique to studysimultaneously the parasympathetic activity to the heartand the sympathetic activity to the peripheral bloodvessels both in baseline conditions and during physiolog-ical maneuvers, such as passive tilting, that can increasesympathetic activity.
Methods
SubjectsWe studied 40 subjects with mild to moderate hyperten-
sion and 25 age-matched healthy control subjects. Thirty-five
by guest on May 31, 2018
http://hyper.ahajournals.org/D
ownloaded from

Radaelli et al Autonomic Nervous System and Hypertension 557
TABLE 1. Characteristics of Subjects Studied
Variable
Age, y
SBP, mm Hg
DBP, mm Hg
HR, bpm
Height, cm
Weight, kg
ControlSubjects
(n=25)
46 ±2 (18-63)
125±2
79±2
66±2
168±2
71 ±2
HypertensiveSubjects
(n=40)
45 ±2 (23-65)
155±3
99±2
77±2
168±2
72±2
t
P=NS
P<.001
P<.001
P<.001
P=NS
P=NS
SBP indicates systolic blood pressure; DBP, diastolic bloodpressure; and HR, heart rate. Values are mean±SEM.
of the hypertensive subjects were newly diagnosed anduntreated. The remaining 5 hypertensive subjects, who wereon angiotensin-converting enzyme inhibitors (3) and diuret-ics (2), discontinued the treatment 4 weeks before the study.The characteristics of the subjects are shown in Table 1.Arterial blood pressure was measured with a random-zerosphygmomanometer (Hawksley). Subjects with a diastolicblood pressure consistently greater than 95 mm Hg asassessed by repeated measurements (at least three) onseparate days (at least 3) were classified as establishedhypertensive patients. Only 1 hypertensive patient wasobese; none had insulin resistance. No other cardiovascularor kidney disease was found by electrocardiogram, chestradiograph, or routine blood examination (blood urea nitro-gen, creatinine, electrolytes, hematocrit, fasting plasmaglucose, cholesterol, and triglycerides). The hypertensivesubjects underwent two-dimensional echocardiograph exam-ination (Hewlett-Packard 1000).
Protocol and Data AcquisitionThe subjects were asked not to smoke or drink coffee, tea,
chocolate drinks, or alcohol on the day of the study, and theyhad a light meal at noon. Studies were always carried out at thesame hour (3:30 PM) in a quiet room at a stable temperature(22°C). The study was approved by the Hospital ReviewCommittee, and informed consent was obtained from allvolunteers and patients. Insulin resistance was tested with theoral glucose tolerance test. All patients had blood drawn forfasting insulin and fasting glucose determination. All patientsreceived 100 g oral glucose. Blood was drawn for glucose andinsulin determination at 30, 60, 120, and 180 minutes. Hyper-insulinemia was defined as fasting or sum of insulin levels (60-and 120-minute postload) above the 75th percentile of the suminsulin distribution in the reference group. Left ventriculardiameters were measured by monodimensional echocardiogra-phy by using bidimensional Doppler echocardiography to per-form the measurements from the septal leading edge to theposterior wall leading edge. The measurements were made atthe peak of the R wave of the electrocardiogram and wereaccompanied by measurements of septal wall thickness and leftposterior wall thickness. Left ventricular mass index was calcu-lated according to the Penn convention formula.22 The follow-ing signals were directly and continuously recorded on acomputer (Macintosh II Apple) by means of a 12-bit analog-to-digital convertor (NB-Mio-16 board, National Instruments;sampling rate of 500 samples per second per channel): RRinterval (with an electrocardiograph), respiration (with animpedance method), blood pressure (with Finapres [Ohmeda2300], which has been shown23 to follow blood pressure oscil-lations accurately during tests), and skin arteriolar blood flowby infrared photoplethysmography (measured on the volarsurface of the finger, on the same hand as the Finapres). Thissimple device, which measures the fluctuations of a 1-mW,950-nm infrared light backscattered from the red blood cells
moving in the skin vessels, particularly the arterioles, can detectspontaneous fluctuations in skin arteriolar flow related toautonomic control of the microcirculation. The theory andapplications of this device have been reviewed extensively.24-25
After at least 20 minutes for stabilization, the signals weresimultaneously and continuously recorded for 10 minutes withsubjects both in the supine position and immediately after 90°passive tilting on an electrically driven tilt table (Akron) duringfree (first 5 minutes) and controlled breathing (15 breaths perminute, second 5 minutes).
Univariate AnalysisThe power spectrum analysis program was written in our
laboratory as previously described.26 A C program identified allthe QRS complexes in each sequence and then located thepeak of each R wave. The RR intervals were obtained fromthese data. For each step of the protocol, 250 consecutive RRintervals were analyzed. The nonoscillatory (DC) componentwas removed from each sequence.26 The respiratory signalobtained by the impedance pneumograph and the skin arterio-lar blood flow obtained by the infrared plethysmograph wereexpressed in absolute arbitrary values (millivolt output fromthe device). Total variability of each signal has been expressedas the SD because variance does not have a normal distribu-tion. Power spectral analysis was carried out by using anautoregressive model.142627 Model coefficients were evaluatedaccording to the Burg algorithm28; model order was assessed byAkaike criteria.1426-28 In most cases, a model order of 11 wasfound to be adequate. Spectral components were obtained by adecomposition method to measure the area below each spec-tral peak.27 The respiration-related oscillations on the RRinterval, blood pressure, and skin arteriolar blood flow spectrawere identified by comparison with the oscillations of therespiratory spectrum. Spectral analysis of all signals exceptrespiration shows two separate peaks: the low-frequency peak(between 0.03 and 0.14 Hz) is usually thought to reflect mainlythe sympathetic nervous activity at both the cardiac andvascular levels.1114 However, more recent analyses suggest thatthis is an oversimplification, so the low-frequency peak may bereduced considerably if the baroreflex control of vagal efferentactivity is reduced (see "Discussion"). The low-frequency peakshould be better considered as the result of the slower responseof the sympathetic system and/or of the vascular responsivity toany mechanical change in blood pressure sensed by the barore-ceptors.101'29 The high-frequency peak, identified on the dif-ferent signals by correspondence with the peak on the respira-tory spectrum, reflects at the cardiac level the efferentparasympathetic activity,1430 and at the vascular level it largelyreflects the mechanical effects of respiration on cardiac output.Thus, the ratio of low-frequency to high-frequency (LF/HFratio) reflects at the cardiac level (RR) a complex interaction ofthe sympathovagal balance but modulated by the gain of thebaroreflex arc and particularly the vagal arm of the baroreflex.To further highlight the relative aspects of the sympathovagalbalance to the heart, the low- and high-frequency oscillations inthe RR interval were also expressed as a percentage of totaloscillatory power (ie, normalized units [NU]).14 Normalizedunits also allow comparison between different subjects ordifferent situations characterized by different variabilities.!4'31
Conversely, low- and high-frequency components, derived fromthe analysis of blood pressure and blood flow, have beenexpressed as absolute values because they reflect not only abalance between the two interacting branches of the autonomicnervous system but also the sympathetic versus the mechanicaleffects of respiration at the vascular level.
Bivariate AnalysisBaroreceptor Sensitivity
Pagani et al32 described a method to obtain an index for theanalysis of the relation between the beat-to-beat variability ofRR and systolic blood pressure (SBP) during steady-state
by guest on May 31, 2018
http://hyper.ahajournals.org/D
ownloaded from
558 Hypertension Vol 24, No 5 November 1994
SPONTANEOUS RESPIRATION
10000
CONTROLLED RESPIRATION (15 br/min)
10000
RR interval(msec2/Hz)
0
25000
RESPIRATION
(a.u.2/Hz)
0.85 0
• 1000
CROSS<X>RREIAT)ON
(a.u.)
0.97
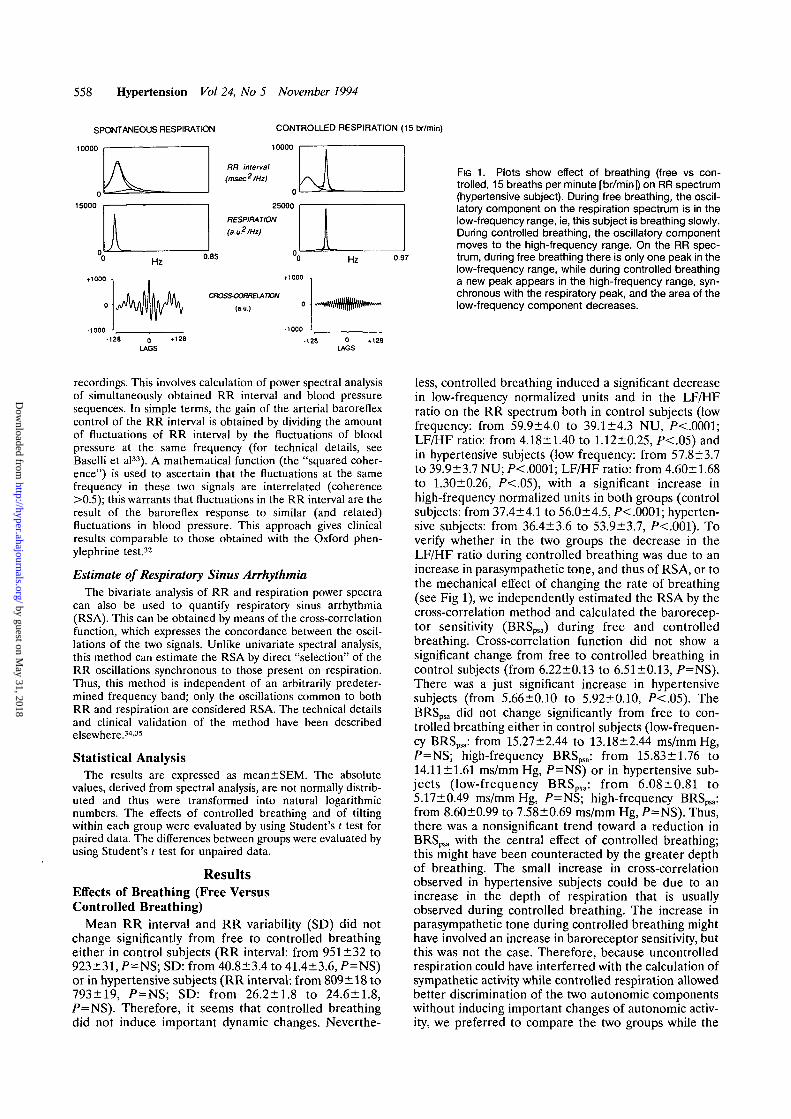
FIG 1. Plots show effect of breathing (free vs con-trolled, 15 breaths per minute [br/min]) on RR spectrum(hypertensive subject). During free breathing, the oscil-latory component on the respiration spectrum is in thelow-frequency range, ie, this subject is breathing slowly.During controlled breathing, the oscillatory componentmoves to the high-frequency range. On the RR spec-trum, during free breathing there is only one peak in thelow-frequency range, while during controlled breathinga new peak appears in the high-frequency range, syn-chronous with the respiratory peak, and the area of thelow-frequency component decreases.
0LAGS
0LAGS
recordings. This involves calculation of power spectral analysisof simultaneously obtained RR interval and blood pressuresequences. In simple terms, the gain of the arterial baroreflexcontrol of the RR interval is obtained by dividing the amountof fluctuations of RR interval by the fluctuations of bloodpressure at the same frequency (for technical details, seeBaselli et al33). A mathematical function (the "squared coher-ence") is used to ascertain that the fluctuations at the samefrequency in these two signals are interrelated (coherence>0.5); this warrants that fluctuations in the RR interval are theresult of the baroreflex response to similar (and related)fluctuations in blood pressure. This approach gives clinicalresults comparable to those obtained with the Oxford phen-ylephrine test.32
Estimate of Respiratory Sinus ArrhythmiaThe bivariate analysis of RR and respiration power spectra
can also be used to quantify respiratory sinus arrhythmia(RSA). This can be obtained by means of the cross-correlationfunction, which expresses the concordance between the oscil-lations of the two signals. Unlike univariate spectral analysis,this method can estimate the RSA by direct "selection" of theRR oscillations synchronous to those present on respiration.Thus, this method is independent of an arbitrarily predeter-mined frequency band; only the oscillations common to bothRR and respiration are considered RSA. The technical detailsand clinical validation of the method have been describedelsewhere.34'35
Statistical AnalysisThe results are expressed as mean±SEM. The absolute
values, derived from spectral analysis, are not normally distrib-uted and thus were transformed into natural logarithmicnumbers. The effects of controlled breathing and of tiltingwithin each group were evaluated by using Student's t test forpaired data. The differences between groups were evaluated byusing Student's t test for unpaired data.
ResultsEffects of Breathing (Free VersusControlled Breathing)
Mean RR interval and RR variability (SD) did notchange significantly from free to controlled breathingeither in control subjects (RR interval: from 951 ±32 to923±31, P=NS; SD: from 40.8±3.4 to 41.4+3.6, P=NS)or in hypertensive subjects (RR interval: from 809±18 to793±19, P=NS; SD: from 26.2 + 1.8 to 24.6±1.8,/*=NS). Therefore, it seems that controlled breathingdid not induce important dynamic changes. Neverthe-
less, controlled breathing induced a significant decreasein low-frequency normalized units and in the LF/HFratio on the RR spectrum both in control subjects (lowfrequency: from 59.9±4.0 to 39.1±4.3 NU, /><.0001;LF/HF ratio: from 4.18±1.40 to 1.12±0.25, P<.05) andin hypertensive subjects (low frequency: from 57.8±3.7to 39.9±3.7 NU; P<.0001; LF/HF ratio: from 4.60+1.68to 1.30+0.26, P<.05), with a significant increase inhigh-frequency normalized units in both groups (controlsubjects: from 37.4+4.1 to 56.0±4.5, /><.0001; hyperten-sive subjects: from 36.4±3.6 to 53.9+3.7, P<.001). Toverify whether in the two groups the decrease in theLF/HF ratio during controlled breathing was due to anincrease in parasympathetic tone, and thus of RSA, or tothe mechanical effect of changing the rate of breathing(see Fig 1), we independently estimated the RSA by thecross-correlation method and calculated the barorecep-tor sensitivity (BRSpsa) during free and controlledbreathing. Cross-correlation function did not show asignificant change from free to controlled breathing incontrol subjects (from 6.22±0.13 to 6.51 ±0.13, P=NS).There was a just significant increase in hypertensivesubjects (from 5.66±0.10 to 5.92±0.10, P<.05). TheBRSpsa did not change significantly from free to con-trolled breathing either in control subjects (low-frequen-cy BRSpsa: from 15.27±2.44 to 13.18+2.44 ms/mm Hg,P=NS; high-frequency BRSpsa: from 15.83±1.76 to14.11 ±1.61 ms/mm Hg, P=NS) or in hypertensive sub-jects (low-frequency BRSpsa: from 6.08±0.81 to5.17±0.49 ms/mm Hg, />=NS; high-frequency BRSpsa:from 8.60±0.99 to 7.58±0.69 ms/mm Hg, P=NS). Thus,there was a nonsignificant trend toward a reduction inBRSpsa with the central effect of controlled breathing;this might have been counteracted by the greater depthof breathing. The small increase in cross-correlationobserved in hypertensive subjects could be due to anincrease in the depth of respiration that is usuallyobserved during controlled breathing. The increase inparasympathetic tone during controlled breathing mighthave involved an increase in baroreceptor sensitivity, butthis was not the case. Therefore, because uncontrolledrespiration could have interferred with the calculation ofsympathetic activity while controlled respiration allowedbetter discrimination of the two autonomic componentswithout inducing important changes of autonomic activ-ity, we preferred to compare the two groups while the
by guest on May 31, 2018
http://hyper.ahajournals.org/D
ownloaded from

Radaelli et al Autonomic Nervous System and Hypertension 559
TABLE 2.
Variable
HH Interval: Effect of Tilting
Control
Supine
in Control and
Subjects
Upright
Hypertensive Subjects
Hypertensive
Supine
Subjects
Upright
Mean
SD
LF, In-ms2
LF, NU
HF, In-ms2
HF, NU
LF/HF ratio
BRSpsa LF
• HF
923±3141.4±3.65.62±0.2039.1 ±4.36.07±0.2456.0±4.51.12±0.2513.1 ±2.414.1±1.6
789±30*34.6±2.25.55+0.2364.4±4.9||
4.67±0.20*
31.2±4.6||4.45+0.92H5.3±0.6§4.8±0.7*
793±19t
24.6±1.8t
4.36+0.15t
39.9±3.7
4.81±0.18f
53.9±3.7
1.30±0.26
5.1±0.4f
7.5±0.6t
697 ±16*$
21.7±1.7f§
4.13±0.21t
48.4+4.1 H#
4.03±18*#
44.0±4.0P
3.90±1.61U
2.9±0.3t"
3.1 ±0.4#"
LF indicates low frequency; NU, normalized units; HF, high frequency; BRSpsa, baroreceptor sensitivity by powerspectrum analysis. Values are mean±SEM.
*P<.0001, supine vs upright (paired t test).tP<.001, t P<.01, hypertensive vs control (unpaired t test).§P<.01, ||P<.001, HP<.05, supine vs upright (paired t test).#P<.05, **P<.0001, hypertensive vs control (unpaired f test).
subjects were breathing in a controlled way. For simplic-ity, Table 2 reports only the results on controlledbreathing.
Baseline DataIn hypertensive subjects, mean RR interval and RR
interval variability (SD) were significantly lower than incontrol subjects. Nevertheless, low-frequency compo-nents, high-frequency components, and the LF/HF ratiowere not significantly different in the two groups (Table2). In hypertensive subjects, SBP was significantly higherthan in control subjects, while SBP variability (SD) andthe two oscillatory components (low-frequency and high-frequency, respectively) were not significantly different(Table 3). Diastolic blood presssure (DBP) was alsosignificantly higher in hypertensive than in control sub-jects, but DBP variability and the two oscillatory com-ponents did not show a significant difference in the twogroups (Table 4). The skin arteriolar blood flow variabil-ity (SD) was not significantly different in the two groups(for simplicity, only systolic values will be considered forthis signal because diastolic values gave similar results).The low-frequency oscillatory component also showedno difference, but the high-frequency oscillatory compo-nent was significantly lower in the hypertensive subjects(Table 5). The blood flow variability (SD) and the twooscillatory components were similar in the two groups.
The BRS was significantly lower in hypertensive than incontrol subjects (Table 2).
Effect of TiltingIn the tilt position, the RR interval decreased signif-
icantly both in control and in hypertensive subjects, butthis decrease was significantly greater in the hyperten-sive subjects. The low-frequency component increasedand the high-frequency component decreased more incontrol than in hypertensive subjects, so in the tiltposition these were significantly different in the twogroups. Consequently, the LF/HF ratio increased morein control than in hypertensive subjects (Table 2, Figs 2and 3). SBP did not change significantly in the tiltposition in either control or hypertensive subjects. SBPvariability (SD) and the low-frequency oscillatory com-ponent increased significantly in both groups. In the tiltposition, the high-frequency oscillatory component in-creased more significantly in hypertensive than in con-trol subjects (Table 3). DBP, DBP variability (SD), andthe low-frequency oscillatory component increased sig-nificantly in both groups, while the high-frequency oscil-latory component increased significantly only in thehypertensive subjects (Table 4). Skin arteriolar bloodflow variability (SD) did not change significantly ineither control or hypertensive subjects. The low-fre-quency oscillatory component of the skin blood flow
TABLE 3. Systolic Blood Pressure: Effect of Tilting inControl and Hypertensive Subjects
Control Subjects Hypertensive Subjects
Variable Supine Upright Supine Upright
Mean 127±3 121+7 155±3f 155±4f
SD 4.6±0.2 6.4±0.4|| 4.9±0.2 6.8±0.3*
LF, In-ms2 1.52±0.17 2.44±0.21§ 1.69±0.13 2.43±0.17*
HF, In-ms2 1.44+0.11 1.93±0.17fl 1.53+0.09 2.43±0.55*
LF indicates low frequency; HF, high frequency.Symbols indicating significance are as in Table 2.
TABLE 4. Oiastolic Blood Pressure: Effect of Tilting inControl and Hypertensive Subjects
Control Subjects Hypertensive Subjects
Variable Supine Upright Supine Upright
Mean 71 ±2 81±3|| 89±3t 95+3+§
SD 2.6±0.1 3.5±0.2| 2.8±0.1 3.6±0.2*
LF, In-ms2 0.99±0.11 1.78±0.17§ 1.27±0.10 1.82±0.13*
HF, In-ms2 0.62±0.09 0.81±0.09 0.75±0.08 1.14±0.12||
Definitions and symbols indicating significance are as inTable 2.
by guest on May 31, 2018
http://hyper.ahajournals.org/D
ownloaded from

560 Hypertension Vol 24, No 5 November 1994
TABLE 5. Skin Arteriolar Blood Flow: Effect of Tilting inControl and Hypertensive Subjects (Systolic Values)
Control Subjects Hypertensive Subjects
Variable Supine Upright Supine Upright
SD 76.4+10.7 89.9+14.8 62.0±13.4 87.1 ±26.6
LF, In-ms2 5.34+0.45 6.55+0.53§ 5.55±0.34 5.60±0.35
HF, In-ms2 4.64+0.41 4.71+0.44 3.90±0.35 4.50±0.36§
Definitions and symbol indicating significance are as inTable 2.
increased significantly only in control subjects, and thehigh-frequency oscillatory component increased signifi-cantly only in hypertensive subjects (Table 5). Barore-ceptor sensitivity decreased significantly with tilt in bothcontrol and hypertensive subjects; it remained signifi-cantly lower in hypertensive than in control subjects(Table 2).
Effect of Left Ventricular HypertrophySeven hypertensive subjects with echocardiographic
evidence of left ventricular hypertrophy (LVH) and theremaining hypertensive subjects without any echocardio-graphic or electrocardiographic evidence of LVH werecompared (Table 6). The BRS was not significantlydifferent in the two subgroups either supine or in the tiltposition. Nevertheless, at the vascular level the low-frequency oscillatory component of SBP and DBP in-creased significantly on tilting only in the subgroupwithout LVH, on both the SBP and the DBP signals.
DiscussionEffect of Breathing Pattern on RRInterval Variability
To study the two oscillatory components of the RRpower spectrum, it is necessary that the frequencies ofbreathing and of RSA are higher than the 0.1 Hzcharacteristic of sympathetic activity. On the other hand,
we realized that during free breathing the presence of afew slow breaths could generate a low-frequency com-ponent superimposed on that related to the sympatheticactivity, thus interfering with its calculation. To avoidthis artifact, we asked our subjects to breathe in a regularway at 15 breaths per minute. Because controlledbreathing did not induce important changes in auto-nomic modulation, we focused on the results obtainedduring controlled respiration.
Baseline ObservationsWith subjects in the supine position, heart rate and
blood pressure were higher in hypertensive than incontrol subjects. Previous studies15"21 suggested a para-sympathetic inhibition and/or a sympathetic stimulationto the heart in hypertensive subjects. The technique weused could not confirm a sympathetic hyperactivity toeither the heart or blood vessels. A reduced responsive-ness of the cardiac j3-receptors36 and the baroreceptorinfluence on low-frequency RR10 could in part be re-sponsible for this finding. Moreover, because powerspectral analysis detects only nervous oscillatory compo-nents of heart rate and blood pressure variability, itcould have missed tonic influences such as those exertedby humoral catecholamines. The high-frequency compo-nent RSA was not different in the two groups, despite analtered baroreflex control of heart rate in the hyperten-sive subjects. Because less than one fourth of the hyper-tensive subjects we studied had echocardiographic evi-dence of LVH, the cardiopulmonary reflexes, whosesensitivity has been found to be normal or even en-hanced in hypertensive animals or subjects withoutLVH,3739could have played an important compensatoryrole in the origin of RSA, as previously suggested.40
Effect of TiltingIn the tilt position, heart rate and DBP showed a
similar increase in the two groups. During sympatheticactivation, the low-frequency component RR and bloodpressure were not higher in hypertensive than in control
CONTROL SUBJECT - CONTROLLED BREATHING
SUPINE PASSIVE TILTING
35000
25000
0
400
180000
35000RESPIRATION(a.i£ /Hi)
25000RR INTERVAL
(msec2/Hi)
0400
SYSTOUCBIOCO PRESSURE
(mmHg2/Hz)
180000
FINGER PHOTOPLSYSTOUC
(mV 2/Hl)
Hz0.54
FIG 2. Plots show effect of tilting on the powerspectra of different signals in a control subjectduring controlled breathing. An increase of thelow-frequency component at about 0.1 Hz(sympathetic) is evident in all the signals (ex-cept, of course, respiration).
Hz 0.66
by guest on May 31, 2018
http://hyper.ahajournals.org/D
ownloaded from
Radaelli et al Autonomic Nervous System and Hypertension 561
HYPERTENSIVE SUBJECT - CONTROLLED BREATHING
SUPINE PASSIVE TILTING
25000
02000
0
200
0
15000
0
kJV.
25000
RESPIRATION
(a.u.2 /Hz)
0
2000
RR INTERVAL
(ms8C2/H2)
0
200
SYSTOUCBLOOO PRESSURE
(mmHg 2/H2)
0
15000
FINGER PHOTOPLSYSTOUC
(mV 2IHz)
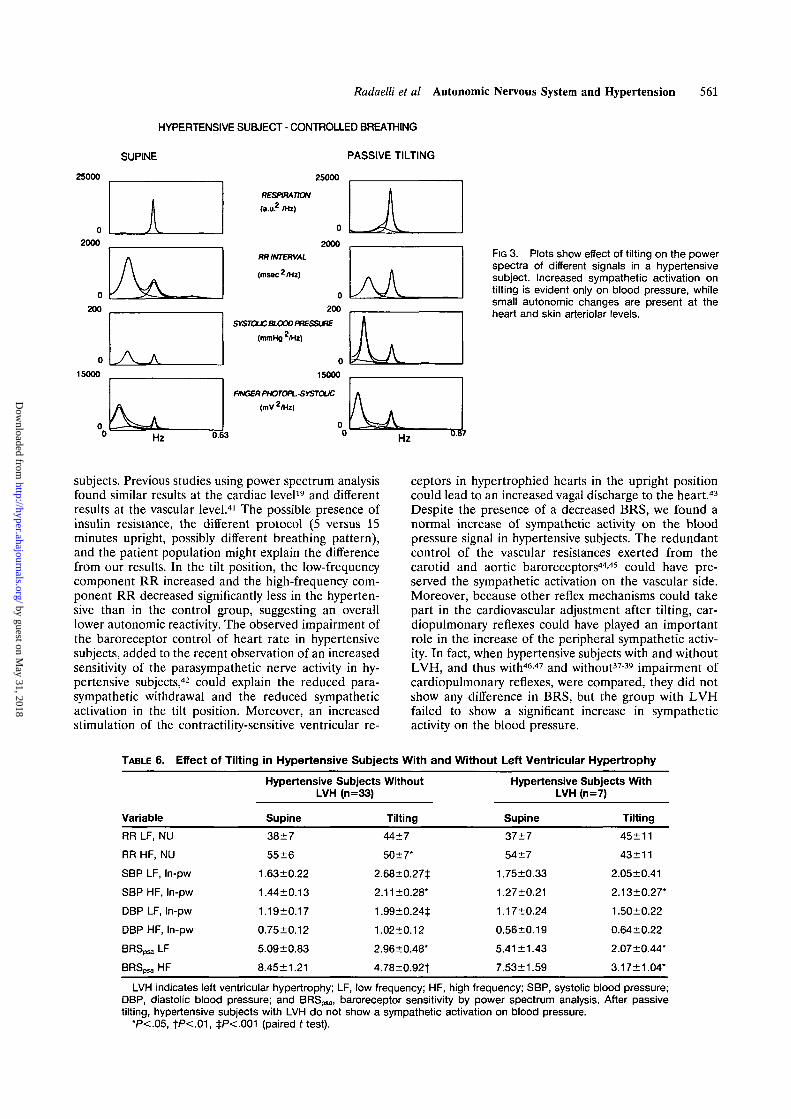
AAFIG 3. Plots show effect of tilting on the powerspectra of different signals in a hypertensivesubject. Increased sympathetic activation ontilting is evident only on blood pressure, whilesmall autonomic changes are present at theheart and skin arteriolar levels.
Hz 0 6 3 Hz
subjects. Previous studies using power spectrum analysisfound similar results at the cardiac level19 and differentresults at the vascular level.41 The possible presence ofinsulin resistance, the different protocol (5 versus 15minutes upright, possibly different breathing pattern),and the patient population might explain the differencefrom our results. In the tilt position, the low-frequencycomponent RR increased and the high-frequency com-ponent RR decreased significantly less in the hyperten-sive than in the control group, suggesting an overalllower autonomic reactivity. The observed impairment ofthe baroreceptor control of heart rate in hypertensivesubjects, added to the recent observation of an increasedsensitivity of the parasympathetic nerve activity in hy-pertensive subjects,42 could explain the reduced para-sympathetic withdrawal and the reduced sympatheticactivation in the tilt position. Moreover, an increasedstimulation of the contractility-sensitive ventricular re-
ceptors in hypertrophied hearts in the upright positioncould lead to an increased vagal discharge to the heart.43
Despite the presence of a decreased BRS, we found anormal increase of sympathetic activity on the bloodpressure signal in hypertensive subjects. The redundantcontrol of the vascular resistances exerted from thecarotid and aortic baroreceptors4445 could have pre-served the sympathetic activation on the vascular side.Moreover, because other reflex mechanisms could takepart in the cardiovascular adjustment after tilting, car-diopulmonary reflexes could have played an importantrole in the increase of the peripheral sympathetic activ-ity. In fact, when hypertensive subjects with and withoutLVH, and thus with46-47 and without3739 impairment ofcardiopulmonary reflexes, were compared, they did notshow any difference in BRS, but the group with LVHfailed to show a significant increase in sympatheticactivity on the blood pressure.
TABLE 6. Effect of Tilting in Hypertensive Subjects With and Without Left Ventricular Hypertrophy
Variable
RR LF, NU
RR HF, NU
SBP LF, In-pw
SBP HF, In-pw
DBP LF, In-pw
DBP HF, In-pw
BRSpsa LF
BRSpsa HF
Hypertensive Subjects WithoutLVH (n=33)
Supine
38±7
55±6
1.63±0.22
1.44 + 0.13
1.19±0.17
0.75±0.12
5.09±0.83
8.45±1.21
Tilting
44+7
50 ±7*
2.68±0.27+
2.11 ±0.28*
1.99±0.24±
1.02+0.12
2.96+0.48*
4.78+0.92+
Hypertensive Subjects WithLVH (n=7)
Supine
37±7
54±7
1.75±0.33
1.27±0.21
1.17+0.24
0.56±0.19
5.41 ±1.43
7.53±1.59
Tilting
45±11
43±11
2.05±0.41
2.13±0.27*
1.50±0.22
0.64+0.22
2.07±0.44*
3.17+1.04*
LVH indicates left ventricular hypertrophy; LF, low frequency; HF, high frequency; SBP, systolic blood pressure;DBP, diastolic blood pressure; and BRSpsa, baroreceptor sensitivity by power spectrum analysis. After passivetilting, hypertensive subjects with LVH do not show a sympathetic activation on blood pressure.
*P<.05, +P<-01, +P<.001 (paired t test).
by guest on May 31, 2018
http://hyper.ahajournals.org/D
ownloaded from
562 Hypertension Vol 24, No 5 November 1994
The different characteristics of the vessels in hyper-tensive and control subjects could also play a role inmaintaining the sympathetic response. Vascular remod-eling in hypertension can increase the effect of sympa-thetic stimulation,48 so even a reduced sympatheticactivation can be amplified (low-frequency componentblood pressure), but further studies are needed to verifythis hypothesis. Unlike in the blood pressure signal, wecould not see a sympathetic activation at the skinarterioles in the hypertensive subjects (with or withoutLVH), while it was present in the control group. Thereare clear indications that skin flow takes part in thecardiovascular adjustments to postural change.24-49-50 It ispossible that the high wall-radius ratio present in skina-v anastomoses51 together with vascular hypertrophy52
has decreased the sympathetic discharge needed toincrease the vascular resistance, so that this was no moredetectable.
Respiratory-related vascular oscillations increased sig-nificantly in hypertensive subjects compared with controlsubjects. These oscillations are commonly thought to bedue to the mechanical effect of respiration on cardiacoutput through an increase in venous return, which isaugmented in the upright position. Therefore, in thepresence of impaired autonomic control of the cardiacoutput,53 this mechanical effect could become moreevident at the vascular level.
Study LimitationsThe interpretation of the components of heart rate
and blood pressure variability is complex and not fullyexplained. As we have outlined above, there is increasingevidence that the low-frequency variability seen onpower spectrum analysis could be largely generated bythe activity of the arterial baroreceptors.1011-29 In addi-tion, the blood pressure variability may reflect not onlythe autonomic modulation but also the vascular reactiv-ity to autonomic stimulation. Further studies are neededto clarify this point. Moreover, static influences on bloodpressure and heart rate such as those exerted by humoralcatecholamines could not be detected by power spec-trum analysis.
In conclusion, power spectrum analysis did not showevidence of increased sympathetic activity in the hyper-tensive subjects studied. After tilting, the hypertensivesubjects showed a differing autonomic control at theheart and periphery. The decreased baroreceptor con-trol of heart rate in the hypertensive subjects might havebeen responsible for the reduced autonomic changes atthe heart. Cardiopulmonary reflex deactivation and vas-cular hypertrophy are among possible explanations forthe preserved sympathetic activation at the periphery.
References1. Mancia G, Mark AL. Arterial baroreflexes in humans. In: Shepherd
JT, Abboud FM, eds. Handbook of Physiology, Section 2: The Car-diovascular System. Bethesda, Md: American Physiological Society;1983;3:755-793.
2. Karemaker JM. Neurophysiology of the baroreceptor reflex. In:Kitney RI, Rompelman O, eds. The Beat to Beat Investigation ofCardiovascular Function. 1st ed. New York, NY: Oxford UniversityPress; 1987.
3. Zanchetti A, Mancia G. Cardiovascular reflexes and hypertension.Hypertension. 1991;18(suppl III):III-13-III-21.
4. Sleight P. Role of the baroreceptor reflexes in circulatory control,with particular reference to hypertension. Hypertension. 1991;18(suppl III):III-31-HI-34.
5. Eckberg DL. Carotid baroreflex function in young men with bor-derline blood pressure elevation. Circulation. 1979;59:632-635.
6. Bristow JD, Honour AJ, Pickering GW, Sleight P, Smyth HS.Diminished reflex sensitivity in high blood pressure. Circulation.1969;39:48-54.
7. Julius S. Changing role of the autonomic nervous system in humanhypertension. J Hypertens. 1990;8(suppl 7):S59-S65.
8. Mark AL. Regulation of sympathetic nerve activity in mild humanhypertension. / Hypertens. 1990;8(suppl 7):S67-S75.
9. Sayers BMcA. Analysis of heart rate variability. Ergonomics.1973;16:17-32.
10. Bernardi L, Leuzzi S, Piepoli M, Calciati A, Johnston JA, Bain G,Frankel HL, Radaelli A, Passino C, Sleight P. Evidence that lowfrequency (LF) variability of the RR interval power spectrum analy-sis (PSA) in humans is generated by the arterial baroreflex. Pre-sented at the XXXII Congress International Union of PhysiologicalSciences; August 1-6, 1993; Glasgow, Scotland.
11. de Boer RW, Karemaker JM, Strackee J. Hemodynamic fluctu-ations and baroreflex sensitivity in humans: a beat to beat model.Am J Physiol. 1987;253:H680-H689.
12. Ewing DJ, Neilson JMM, Travis P. New methods for assessingcardiac parasympathetic activity using 24 hour electrocardiograms.Br Heart J. 1984;52:396-402.
13. Akselrod S, Gordon D, Ubel FA, Shannon DC, Barger AC, CohenRJ. Power spectrum analysis of heart rate fluctuation: a quanti-tative probe of beat to beat cardiovascular control. Science.1981;213:220-222.
14. Pagani M, Lombardi F, Guzzetti S, Rimoldi O, Furlan R, PizzinelliP, Sandrone G, Malfatto G, Dell6rto S, Piccaluga P, et al. Powerspectral analysis of heart rate and arterial pressure variabilities as amarker of sympatho-vagal interaction in man and conscious dog.Cat Res. 1986;59:178-193.
15. Morlin C, Wallin C, Eriksson BM. Muscle sympathetic activity andplasma noradrenaline in normotensive and hypertensive man. AdaPhysiol Scand. 1983;119:11-21.
16. Anderson EA, Sinkey CA, Lawton WJ, Mark AL. Elevated sym-pathetic nerve activity in borderline hypertensive humans: evidencefrom direct intraneural recordings. Hypertension. 1989;14:177-183.
17. Goldstein DS. Plasma catecholamine and essential hypertension:an analytical review. Hypertension. 1983;5:86-99.
18. Esler M, Jennings G, Korner P, Willet I, Duley F, Hasking G,Anderson W, Lambert G. Assessment of human sympatheticnervous system activity from measurements of norepinephrineturnover. Hypertension. 1988;ll:3-20.
19. Guzzetti S, Piccaluga E, Casati R, Cerutti S, Lombardi F, Pagani M,Malliani A. Sympathetic predominance in essential hypertension: astudy employing spectral analysis of heart rate variability. JHypertens. 1988;6:711-717.
20. Frohlich ED, Tarazi RC, Ulrich M, Dustan HP, Page IH. Tilt testfor investigating a neural component in hypertension. Circulation.1967;36:387-393.
21. London GM, Weiss YA, Pannier PB, Laurent SC, Safar ME. Tilttest in essential hypertension: differential responses in heart rateand vascular resistance. Hypertension. 1987;10:29-34.
22. Devereux RB, Reickeck N. Echocardiographic determinant of leftventricular mass: anatomic validation of the method. Circulation.1977;55:613-618.
23. Parati G, Casadei R, Groppelli A, Di Rienzo M, Mancia G. Com-parison of finger and intraarterial blood pressure monitoring at restand during laboratory testing. Hypertension. 1989;13:647-655.
24. Bernardi L, Leuzzi S. Laser-Doppler flowmetry and photoplethys-mography: basic principles and hardware. In: Berardesca E, EisnerP, Maibach H, eds. Handbook of Skin Engineering, II. Boca Raton,Fla; CRC Press. In press.
25. Challoner AVJ. Photoelectric plethysmography for estimatingcutaneous blood flow. In: Rolfe P, ed. Non-invasive PhysiologicMeasurements. London, England: Academic Press; 1979:125-151.
26. Bernardi L, Salvucci F, Suardi R, Solda PL, Calciati A, Perlini S,Falcone C, Ricciardi L. Evidence of an intrinsic mechanism regu-lating the heart rate variability in the transplanted and in the intactheart during submaximal dynamic exercise? Cardiovasc Res.1990;24:969-981.
27. Kay SM, Marple SL Jr. Spectrum analysis: a modern perspective.Proc IEEE. 1981;69:138-141.
28. Ulrych TJ, Bishop TN. Maximum entropy spectral analysis and autore-gressive decomposition. Rev Geophys Space Phys. 1975;13:183-200.
29. Saul JP, Berger RD, Albrecht P, Stein SP, Chen MH, Cohen RJ.Transfer function analysis of the circulation: unique insights intocardiovascular regulation. Am J Physiol. 1991;261:H1231-H1245.
by guest on May 31, 2018
http://hyper.ahajournals.org/D
ownloaded from

Radaelli et al Autonomic Nervous System and Hypertension 563
30. Pomeranz BR, McCaulay JB, Caudill MA, Kutz I, Adam D,Gordon D, Kilborn KM, Barger C, Shannon DC, Cohen RJ, et al.Assessment of autonomic function in humans by heart rate spectralanalysis. Am J Physiol. 1985;248:H151-H153.
31. de Trafford JC, Lafferty K, Kitney RI, Cotton LT, Roberts VC.Modelling of the human vasomotor control system and its appli-cation to the investigation of arterial disease. Proc IEEE.1982;129:646-650.
32. Pagani M, Somers V, Furlan R, Dell6rto S, Conway J, Baselli G,Cerutti S, Sleight P, Malliani A. Changes in autonomic regulationinduced by physical training in mild hypertension. Hypertension.1988;12:600-610.
33. Baselli G, Cerutti S, Civardi S, Liberati D, Lombardi F, Malliani A,Pagani M. Spectral and cross-spectral analysis of heart rate andarterial blood pressure variability signals. Comput Biomed Res.1986;19:520-534.
34. Bernardi L, Keller F, Sanders M, Reddy PS, Griffith B, Meno F,Pinsky MR. Respiratory sinus arrhythmia in the denervated humanheart. J Appl Physiol. 1989;67:1447-1455.
35. Bernardi L, Rossi M, Soffiantino F, Marti G, Ricordi L, Finardi G,Fratino P. Cross-correlation of heart rate and respiration versusdeep breathing: assessment of a new test of cardiac autonomicfunction in diabetes. Diabetes. 1989;38:589-596.
36. Trimarco B, Volpe M, Ricciardelli B, Picotti GB, Galva M,Petracca R, Condorelli M. Studies of the mechanisms underlyingimpairment of beta-adrenoceptor mediated effects in human hyper-tension. Hypertension. 1983;5:584-590.
37. Thoren P, Noresson E, Ricksten SE. Cardiac reflexes in normo-tensive and spontaneously hypertensive rats. Am J Cardiol.1979;44:884-888.
38. Mark AL, Kerber RE. Augmentation of cardiopulmonarybaroreflex control of forearm vascular resistance in borderlinehypertension. Hypertension. 1982;4:39-46.
39. Rea R, Hamdan M. Baroreflex control of muscle sympathetic nerveactivity in borderline hypertension. Circulation. 1990;82:856-862.
40. Kitney RI. Beat-by-beat interrelationships between heart rate,blood pressure, and respiration. In: Kitney RI, Rompelman O, eds.The Beat-by-Beat Investigation of Cardiovascular Function, Mea-surement, Analysis and Applications. Oxford, England: ClarendonPress; 1987:147-178.
41. Furlan R, Gentile E, Piazza S, Dell6rto S, Barbie F, Pagani MR,Lombardi F, Pagani M, Malliani A. Increased vascular sympatheticactivity at rest and reduced responsiveness to excitatory stimuli inessential hypertension. J Hypertens. 1991;9(suppl 6):S60-S61.
42. Ferrari AU, Daffonchio A, Franzelli C, Mancia G. Cardiac para-sympathetic hyperresponsiveness in spontaneously hypertensiverats. Hypertension. 1992;19:653-657.
43. Brown AM. Cardiac reflexes. In: Shepherd JT, Abboud FM, eds.Handbook of Physiology, Section 2: The Cardiovascular System.Bethesda, Md: American Physiological Society; 1983;3:677-689.
44. Mancia G, Ludbrook J, Ferrari A, Gregorini L, Zanchetti A. Barore-ceptor reflexes in human hypertension. Ore Res. 1978;43:170-177.
45. Guo BG, Thames MD, Abboud FM. Arterial baroreflexes in renalhypertensive rabbits. Circ Res. 1983;53:223-234.
46. Trimarco B, Lembo G, De Luca N, Volpe M, Ricciardelli B, CondorelliG, Rosiello G, Condorelli M. Blunted sympathetic response to cardiopul-monary receptor unloading in hypertensive patients with left ventricularhypertrophy. Cumulation. 1989;80:883-892.
47. Giannattasio C, Cattaneo BM, Seravalle G, Grassi G, Mancia G.Left ventricular hypertrophy and the cardiogenic reflex in man. /Hypertens. 1991;9(suppl 2):S43-S50.
48. Folkow B, Karlstrom G, Nilsson H, Sjoblom W. How do changes indiameter at the precapillary level affect cardiovascular function? /Cardiovasc Pharmacol. 1984;6:S280-S288.
49. Kellogg DL Jr, Johnson JM, Kosiba WA. Baroreflex control of thecutaneous active vasodilator system in humans. Circ Res. 1990;66:1420-1426.
50. Bernardi L, Rossi M, Fratino P, Finardi G, Orlandi C. Relationshipbetween phasic changes of human skin blood flow and autonomictone. Microvasc Res. 1989;37:16-27.
51. Folkow B. Physiological aspects of primary hypertension. PhysiolRev. 1982;62:347-504.
52. Clement DL, Duprez D. Circulatory changes in muscle and skinarteries in primary hypertension. Hypertension. 1984;6(supplIII):III-122-III-127.
53. Casadei B, Meyer TE, Coats AJS, Conway J, Sleight P. Baroreflexcontrol of stroke volume in man: an effect mediated by the vagus. /Physiol. 1992;448:539-550.
by guest on May 31, 2018
http://hyper.ahajournals.org/D
ownloaded from

SleightA Radaelli, L Bernardi, F Valle, S Leuzzi, F Salvucci, L Pedrotti, E Marchesi, G Finardi and P
Cardiovascular autonomic modulation in essential hypertension. Effect of tilting.
Print ISSN: 0194-911X. Online ISSN: 1524-4563 Copyright © 1994 American Heart Association, Inc. All rights reserved.
is published by the American Heart Association, 7272 Greenville Avenue, Dallas, TX 75231Hypertension doi: 10.1161/01.HYP.24.5.556
1994;24:556-563Hypertension.
http://hyper.ahajournals.org/content/24/5/556World Wide Web at:
The online version of this article, along with updated information and services, is located on the
http://hyper.ahajournals.org//subscriptions/
is online at: Hypertension Information about subscribing to Subscriptions:
http://www.lww.com/reprints Information about reprints can be found online at: Reprints:
document. Permissions and Rights Question and Answer process is available in the
Request Permissions in the middle column of the Web page under Services. Further information about thisOffice. Once the online version of the published article for which permission is being requested is located, click
can be obtained via RightsLink, a service of the Copyright Clearance Center, not the EditorialHypertension Requests for permissions to reproduce figures, tables, or portions of articles originally published inPermissions:
by guest on May 31, 2018
http://hyper.ahajournals.org/D
ownloaded from