claire wilson, debra wright, tom barton
TRANSCRIPT

DATA QUALITY IN A DATA QUALITY IN A MIXED MODE SURVEYMIXED MODE SURVEY
Claire Wilson, Debra Wright, Tom Barton Claire Wilson, Debra Wright, Tom Barton Mathematica Policy ResearchMathematica Policy Research
and Paul and Paul GuerinoGuerinoAmerican Institutes for ResearchAmerican Institutes for Research

Outline
!! Overview of 2003 NSRCGOverview of 2003 NSRCG
!! Research QuestionsResearch Questions
!! FindingsFindings
!! ConclusionsConclusions

Overview of 2003 NSRCG
!! PurposePurpose
!! Sponsor and HistorySponsor and History
!! Sample CharacteristicsSample Characteristics

Why Mixed Mode?
!! Declining response rates to telephone Declining response rates to telephone surveyssurveys
!! Sample characteristicsSample characteristics

Data Collection Protocol
!! October 2003: First Questionnaire Mailing, October 2003: First Questionnaire Mailing, CATI callCATI call--in availablein available
!! December 2003: Second Questionnaire December 2003: Second Questionnaire Mailing, Web survey and CATI callMailing, Web survey and CATI call--in in availableavailable
!! February 2004: CATI followFebruary 2004: CATI follow--up of up of nonrespondentsnonrespondents
!! April 2004: Incentive letters mailed $30/Web April 2004: Incentive letters mailed $30/Web or $20/CATIor $20/CATI

Instrument Development
!! One instrument, three modes for CATI, Web One instrument, three modes for CATI, Web and data entry of mail questionnairesand data entry of mail questionnaires–– AdvantagesAdvantages–– ProceduresProcedures–– ChallengesChallenges–– Comparisons between Mail, Web and CATIComparisons between Mail, Web and CATI

Example: Paper Questionnaire

Example: Web Survey
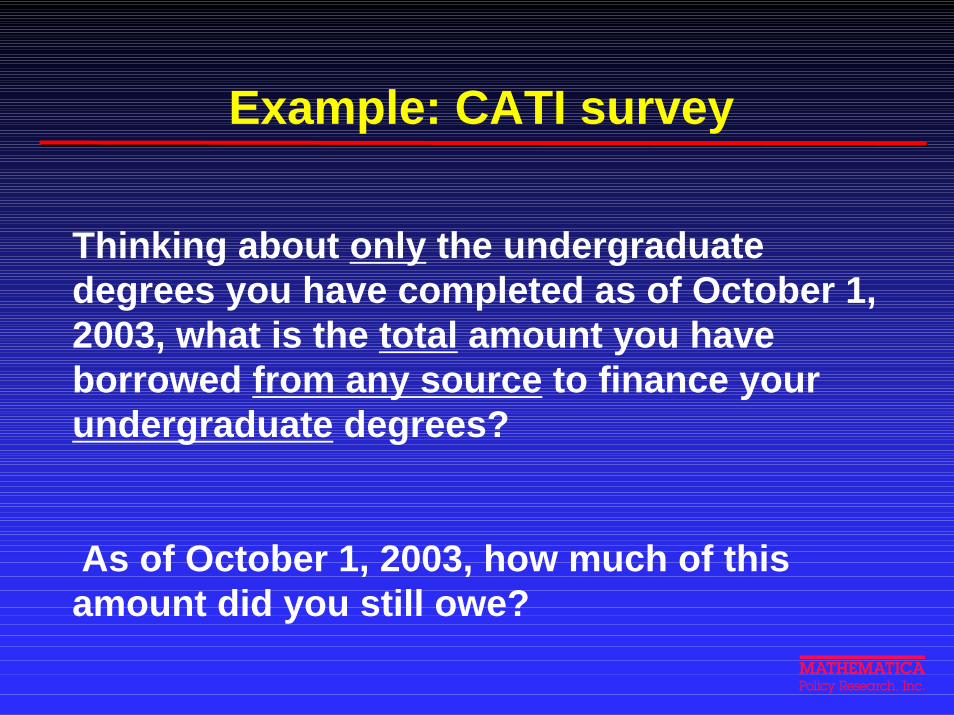
Example: CATI survey
Thinking about only the undergraduate degrees you have completed as of October 1, 2003, what is the total amount you have borrowed from any source to finance your undergraduate degrees?
As of October 1, 2003, how much of this amount did you still owe?

Research Questions
!! Did respondent characteristics differ by Did respondent characteristics differ by mode?mode?
!! How did the three modes compare in terms How did the three modes compare in terms of data quality?of data quality?–– Item Item Nonresponse Nonresponse ratesrates–– “Back“Back--Coding” ratesCoding” rates

Results
Respondent Characteristics: Respondent Characteristics: !! Degree level and Ethnicity did not differ Degree level and Ethnicity did not differ
significantly by modesignificantly by mode!! Gender, Race, Major, Age significantly Gender, Race, Major, Age significantly
different across modesdifferent across modes!! Caveat: Web mode first offered 6 weeks after Caveat: Web mode first offered 6 weeks after
mail and CATImail and CATI

Respondent Characteristics: Gender
0
10
20
30
40
50
60
Male Female
Perc
ent
Mail Phone Web
X2 = 140.71, df=2, p<0.001Cramer's V = 0.11

Respondent Characteristics: Race
0
10
20
30
40
50
60
Asian Black White Other
Perc
ent
Mail Phone Web
X2 = 185.43, df=6, p<0.001Cramer's V = 0.10

Respondent Characteristics: Major
0
10
20
30
40
50
60
Compu
ter an
d Info
rmati
on Sci
Life a
nd R
elated
Sci
Mathem
atica
l Sci
Physic
al an
d Rela
ted Sci
Psych
ology
Social
and R
elated
SciEng
ineeri
ngHea
lth-R
elated
Perc
ent
Mail Phone Web
X2 = 180.13, df=14, p<0.001Cramer's V = 0.10

Respondent Characteristics: Age
27.5
28
28.5
29
29.5
30
Mail Phone Web
Age
(in
year
s)
F = 27.21 , df=2, p<0.001

Results: Item Nonresponse Rates2003 NSRCG Comparison of Item Nonresponse Across Items and Modes, Controlling for Gender, Race, Major, Level, and
Age, Sections C & D
Model Not Significant
29.4%
Model Significant,
no difference between modes7.8%
Model Significant, difference between modes62.7%

Item Nonresponse Comparisons
CATI versus Mail CATI versus Web Web versus Mail
CATI < Mail : 16 items(50%)
CATI < Web : 13 items(40.63%)
Web < Mail: 12 items(37.5%)
CATI > Mail : 6 items(18.75%)
CATI > Web : 8 items(25%)
Web > Mail: 8 items(25%)
CATI = Mail : 10 items(31.25%)
CATI = Web : 11 items(34.38%)
Web = Mail: 12 items(37.5)

Findings: Back-Coding Rates
!! No significant differences for twoNo significant differences for two--thirds of thirds of items items
!! No consistent pattern among the items that No consistent pattern among the items that showed differencesshowed differences
!! Interviewers have difficulty backInterviewers have difficulty back--coding “on coding “on the fly”the fly”

Summary and Conclusions
!! Implications of Data Quality Implications of Data Quality resultsresults
!!LimitationsLimitations!!Directions for future researchDirections for future research

Respondent Characteristics: Ethnicity
0
10
20
30
40
50
60
Hispanic Non-Hispanic
Perc
ent
Mail Phone Web
X2 = 5.42, df=2, p>0.05Cramer's V = 0.02

Respondent Characteristics: Degree
0
10
20
30
40
50
60
Bachelor's Master's
Mail Phone Web
X2 = 33.90, df=2, p>0.05Cramer's V = 0.06