city sanitation plan - india environment portal | news ... · pdf filegovernment of orissa...
TRANSCRIPT
Government of Orissa Housing and Urban Development Department
Rourkela Municipality
October 2011
City Sanitation Plan Draft Report
Table of Contents
Executive Summary1
Introduction 1
2
Back Ground 1
2.1
Objective 1
2.2
National Urban Sanitation Policy 1
2.3
Odisha Urban Sanitation Strategy 2
2.4
National Rating Scheme for Sanitation 3
2.5
Overview of the Scope of work 3
2.6
Sanitation Components 4
3
Situation Analysis 5
3.1
Approach 5
3.1.1 The Base line Data Collection 5
3.1.2 Field Survey 6
3.1.3 Councilor Interaction 6
3.1.4 Focused Group Discussion 6
3.1.5 Condition Assessment Survey 6
3.2
Rourkela City 7
3.2.1 Location 7
3.2.2 Climate 7
3.2.3 Culture 8
3.2.4 Economy 8
3.3
Demography 8
3.4
Water Supply Service 11
3.4.1 Water Supply Performance 11
3.4.2 Access to Water Supply 12
3.4.3 Ground Water 13
3.4.4 Water Bodies 13
3.4.5 Key Issues 14
3.5
Sanitation 11
3.5.1 Access to Toilets 14
3.5.2 Condition Assessment of Community/Public Toilets 15
3.5.3 Wastewater Management 16
3.5.4 Key Issues 17
3.6
Solid Waste Management 17
3.7
Storm Water Management 20
3.8
Overall Citizen Satisfaction on Basic Services 21
3.9
Financial Status of Rourkela Municipality 27
4.0
Population Projection 29
5.0
Waste Water Management 31
5.1
Waste Water Effluent Standard 31
5.2
Sanitation Options 31
City Sanitation Plan - Draft Rourkela Municipality
5.2.1 House Hold Sanitation 31
5.5.2 Options for collection, treatment & Disposal of Waste Water 32
5.2.3 Evaluation of Options of Waste Water Disposal 37
5.2.4 Waste Water from Industries 38
5.2.5 Waste Water From Other Public Institutions 38
5.2.6 Treatment Technology Options 38
5.3
Strategy 39
5.3.1 Water Supply 39
5.3.2 Sewerage Zoning 39
5.3.3 Household Sanitation 39
5.3.4 Collection and Treatment System 40
5.4
Option Analysis 41
5.5
Policy Framework 42
5.6
Planning 42
5.6.1 Assumptions & Data 42
5.6.2 Sewage Generation 45
5.6.3 Pipe Cost Comparative Statement 45
5.7
Infrastructure Need 45
5.8
Implementation & Investment 46
5.8.1 Implementation 46
5.8.2 Investment 47
5.8.3 Investment Abstract 48
6.0
Solid Waste Management 49
6.1
Objective 49
6.2
Strategy 49
6.3
Generation and Characteristics of Waste 52
6.3.1 Type of Waste 52
6.3.2 Waste Generation Rate 52
6.3.3 Characteristics 53
6.3.4 Waste Generation 54
6.4
Design Parameters for SWM 54
6.4.1 Storage 54
6.4.1.1 Household Bins 56
6.4.1.2 Community Bins for Slum Area 56
6.4.1.3 Bins for Commercial Establishments/ Shops 56
6.4.1.4 Bins for Institutions 57
6.4.1.5 Bins for Marriage Hall & Kalyan Mandap 57
6.4.1.6 Bins for Hotel & Restaurants 57
6.4.2 Primary Collection Vehicles 58
6.4.3 Transfer & Transportation 58
6.4.4 Treatment & Disposal 61
6.4.5 Boi-Medical Waste 66
6.5
Infrastructure, Investment & Implementation 73
City Sanitation Plan - Draft Rourkela Municipality

6.6
Private Sector Participation in SWM 73
6.7
Recommended Measures 74
6.8
Estimation of Manpower Requirement 75
7.0
Storm Water Drainage 75
7.1
Strategy 76
7.2
Investment 77
8.0
IEC & Capacity Building 77
8.1
Stakeholders 77
8.2
Approach 77
8.3
Message 78
8.4
Implementation Components & Phasing 78
8.5
Effective Mix & Media Planning 79
8.6
Institutional Strengthening 79
8.7
Investment 79
Capital Cost Summary 80
Annexure
Annexure - 1 Ward wise Observation Notes- Rourkela 81
Annexure - 2 Abstract of Primary Survey results conducted in Rourkela Municipal
Area 89
Annexure - 3 Focus Group Discussion (Councilor) 91
Annexure - 4 Focus Group Discussion (Officers) 96
Annexure - 5 Staff Position in Rourkela Municipality 101
Annexure - 6 Budget Estimate of Rourkela Municipality for the year 2010-11&
2011-12 103
Annexure - 7 Calculation of Solid Waste Generation 105
Annexure - 8 Ward wise sanitation status 107
List of Tables
Table 1 : Rourkela population Growth 8
Table 2 : Ward-wise estimated population in Rourkela as on 2011 9
Table 3 : Water Supply Service Indicators 11
Table 4 : Solid Waste Management Indicators 18
Table 5 : Drainage Indicators 21
Table 6 : Literacy Rate of Rourkela 23
Table 7 : Service Status in Slum 23
Table 8 : Legislatives Governing Institutions 24
Table 9 : Institutional Framework and Roles 24
Table 10 : Financial Receipts and Expenditure in Rourkela Municipality 27
Table 11 : Details of Taxes in Rourkela 27
Table 12 : Tax Demand and Collection in Rourkela 28
City Sanitation Plan - Draft Rourkela Municipality
List of Figures
Figure 1 : Ward wise Distribution of Total and Slum population 10
Figure 2 : Water Source in non slum area 12
Figure 3 : Water Source in slum area 13
Figure 4 : Access to Toilets in Non slum 14
Figure 5 : Access to Toilets in slum area 15
Figure 6 : Source wise Solid waste Generated 19
Figure 7 : Citizen Satisfaction on basis services in non slum and slum area 22
City Sanitation Plan - Draft Rourkela Municipality
Executive Summary Provision of universal access to safe drinking water and sa nitation facilities is a prime need t o enhance quality of life in any community. The Government of Orissa (GoO) has formulated the Odisha Urban Sanitation Strategy (OUSS) on t he l ines of, National Urban Sanitation Policy (NUSP) that was announced by, the Ministry of Urban Development, in December 2008. As a first step in implementing the OUSS, the GoO has undertaken to assist some 8 ci ties/towns in developing City Sanitation Plans (CSP) with funding support from Government of India with National Institute of Urban Affairs as the central coordinating agency.
OP&HS is appointed as the consultant for assisting the three cities of Rourkela, Sambalpur and Berhampur in the preparation of CSPs for the respective towns and had earlier submitted the Inception Reports. In line with the methodology of NUSP, the consultant has carried a structured survey and f ocused group discussions for undertaking the S ituation Analysis of the sanitation status in the city covering the three key areas of wastewater, solid waste and t he storm water drainage.
This Draft Report on City Sanitation Plan provides an insight on the present sanitation practices/situation in the city, sanitation deficiencies and further provides a detailed planning for city wide s anitation for attaining t he goal o f op en de fecation free ci ty. A structured sa mple survey was co nducted t hroughout t he ci ty on va rious attributes that co ncern t he sa nitation facilities in its vicinity and anal ysis of t he same is carried out t o assess its present sanitation situation.
The following methodology was adapted to selection of samples for the field survey:
• The city was divided as per its administrative wards. The sample size in each ward is fixed i n pr oportion t o the w ard popul ation and t he sa mple house holds were selected duly taking in to account the geographical spread and ensures good representation of the characteristic of the ward.
• Separate survey questionnaires for sample su rvey and t he f ocused group di scussions were de veloped and t he dr afts discussed w ith t he ci ty adm inistration and am ended based on feedback and used in collecting the data.
• The survey team was trained and se nsitized on the fundamental aspects of sanitation and were provided with sufficient background knowledge on the theme and objectives of CSP.
• The community and publ ic toilets existing i n t he ci ty were physically i nspected by t he survey team on walk in and walk around method and also by interaction with the users present during the walk around.
Demography The population of the town for the census year 2001 was 2,24,987 , and the current population as of 2011 i s estimated to be 2,69,602 with t he sl um popul ation o f 1,14,980(43%). T he total number of households as of 2011 is 59,239 out of which 25,994 are slum households. The town divided into 33 administrative wards is spread over 31.6 Sqkm sloping west to east and has a total road net work o f 630 km. D ue to i ts i mportance o f the l ocation w ith a m ajor st eel p lant, fertilizer plant and many small steel plants, there are good number of floating population in the town.
City Sanitation Plan - Draft Rourkela Municipality

Situation Analysis Access to Water Supply It i s obse rved from t he pr imary su rvey t hat 17% o f non sl um and 31% of slum po pulation depend on publ ic stand post w here as 41% of non sl um pr operties and onl y 8% o f sl um properties have piped water connection. There is a high level of dependence on open w ell and tube well (41%) in the slum area. However due to low water table the open wells and 60% of the tube wells go dry during the summer season.
Water Supply Service Indicators
The water supply coverage is about 35% where in there are 14,437 direct piped water supply connections. The physical coverage is also quite low. As against 630 km road length the water network is available in about 220 km only. Majority population depends upon some 431 public taps, 1132 hand pumps, open wells & tanker supply. The town has adequate water with treatment capacity of 79 MLD. NRW is 33%. The citizens get water supply at an average of 2.8 hours a day.
Access to Toilets
According to the survey about 99% of the non slum households and 67% of slum households in t he town have i ndividual t oilets About 25% of slum popul ation an d 1% o f non sl um population resort to open defecation in the open field, r iver bank, alongside ponds, drains or road side
Wastewater Management
The town has limited i mplementation of wastewater management only in one colony (Koel Nagar) with co llection and septic tank treatment which accounts for the 5% of non slum households. The rest of the 95% of the area are without facility of sewerage system though a large number of households have access to toilets and water abundance in the city as a whole is observed. About 86% of non slum households and 61% of slum households have onsite sanitation facilities and the remaining population either discharges the sewage into water bodies or resort to open defecation. The sewage generation presently is 38 MLD and as per estimates about 15% of this waste water finds its way into the storm water drains every day. This waste water ultimately flows into the Koel and Brahmini River, thereby polluting the river and posing a potential environmental hazard. There a re nine such out fall poi nts wherein t he nat ural dr ains flow in to t he r iver. The U LB does not hav e a se ptage management policy nor a sci entific treatment facility for septage.
Solid Waste Management The ULB introduced door to door collection of garbage by private contractors and 15 wards are covered by the f acility. The total solid waste g enerated per month a mounts to 4,980 tons of which only 4,410 tons are collected and di sposed at low lying area within and out side the city. The average collection efficiency of the garbage is about 89%. No land has yet been identified for disposal and treatment facility.
City Sanitation Plan - Draft Rourkela Municipality

Storm Water Management There ar e four major n atural d rains namely Bandha Munda N allah, PF nallaha, main drain nallaha and Kalinga Vihar nallaha flowin into the Koel river. The city has a natural slope towards north which helps in quick drainage of storm water. In total 488 Km drains within the city and nine outfall points into the river. However due to encroachment and deposition of solid waste the Nallah is Choked causing flood in the city.
Basic Services to Urban Poor
Rourkela has total 114 numbers of slums. The slum population total to 1,14,980 with 26,994 households. Nearly 43% of the total population of the town comprises o f t he s lums. The slums in t he city are scattered all around the city and increasing over time. The slums are facing difficulties due to deficiency in various infrastructure facilities like roads, water supply, drainage, street lighting, solid waste management etc. Municipality i s taking up a number of slum improvement and poverty alleviation programs with assistance from state gov. and central Govt. Few to mention ar e S JSRY, NSDP, RAY, IHSDP, ILCS et c. The data collected through primary survey and secondary source suggest that the situation in Rourkela town is much better than many cities of Odisha and are the situation can be much improved with small interventions.
Financial Status of Rourkela Municipality
It can be seen above that the own source revenues are very low and the town depends almost on grant devolutions from the state government. Also the expenditure on sa laries is very high. The tax collection efficiency varies in a range of 40% - 50% leading to increased arrears.
Key Issues Water supply
• Low coverage; inequality of distribution;
• wastage and theft of water; illegal connection and high system loss
• Lack of proper maintenance of infrastructure
Sewerage
• Only 5% sewage network, transmission and primary treatment facility
• Lack of proper septage management
• No community toilets leading to open defecation
• Raw sewage being disposed to water bodies leading to health hazards
Solid waste
• Lack of proper a scientific land fill site or even a proper dump yard
City Sanitation Plan - Draft Rourkela Municipality
• River and ponds are widely used for dumping solid waste
• ULB lacks a waste management plan
Drainage
• Inadequate carrying capacity of drains leading to flooding
• Encroachment into drain; choking of drains due to garbage dumping
• Lack of comprehensive drainage master plan
Others
• Low level of awareness more so in the slum area
• Unhygienic condition in slum area
• Lack of co ordination between v arious institutions responsible for ur ban se rvices and development
• Inadequate staff strength
• Inadequate initiative on reforms
• Ring fencing of expenditure not practiced
• E-governance has not yet been implemented leading to manual method which results requirement of large man power and delay in working.
City Sanitation Plan Population Projection The population projection was arrived using graphical progression with 2012 as the base year and 2027 as the intermediate year and 2042 as the design year. The population projected are 2,74,064, 3,40,986 and 4,07,909 respectively.
Waste Water Management Option analysis has been done for various components of the waste water management such as household level sanitation, collection, treatment and disposal of waste water. The options of recycle and reuse have also been explored.
The strategy adopted in the planning process focuses on augmentation of water supply system with additional capacity of production, increased coverage and improved management resulting in low NRW.
The waste water management has been formulated with the concept of providing 100% access to toilets to all residents and floating population. As far as possible individual toilets are to be promoted with subsidy support, shared toilets being the next best option followed by community & publ ic toilets. T he i nstitutional sa nitation i n sch ools, co lleges & o ffices also needs to be addressed simultaneously. The sewer zoning has been adopted based on the topography of the ar ea. The co llection hav e been co nsidered w ith pr ioritization o f s ewer net work sy stem considering the fact that most of the septic tanks are under designed leading to poor effluent
City Sanitation Plan - Draft Rourkela Municipality

quality. Also the service level benchmark suggests for 100% collection efficiency as one of the indicators. S mall bor e system hav e been ado pted w ere ev er appl icable. C onsidering the constraints and land availability and local resistance for treatment facility in the neighborhood, decentralized system with bigger zoning has been proposed.
The base y ear i s taken as 2012 and the desi gn y ear has been co nsidered as 2042 w ith implementation period being six years i.e. 2012 to 2017. The sewage generation is computed at 45 MLD for the design year considering 110 LPCD sewage generation at 80% of water supply. A comparative statement of different construction of pipes shows that RCC pipes are the most suitable for the collection system. The additional infrastructure required includes
• 3746 individual toilets for both slum and non slum area
• 86 shared toilets being shared by two households
• 17 community toilet seats in 2 toilets suitably located within accessible distance of the targeted slum
• 40 public toilet seats in 8 toilets suitably located in the public places
• 30 public urinals with provision of two urinals in each facility
• 50539 new household connection
• 556 Km sewer collection network in two zones (Zone 1 & 2)
• 2 treatment facilities totaling to 38 MLD. One of 3.5 MLD capacity and second of 34.5 & is proposed.
The total subsidized capita cost is proposed as 242.00 crores to be implemented in time frame of five years.
Solid Waste Management The so lid waste m anagement p roposal has been developed with t he obj ective o f pr oper and effective co llection, se gregation, transportation, pr ocessing and di sposal of municipal so lid waste. P rotection o f pu blic health, m inimize env ironmental and occu pational haz ards are t he other primary goal.
The approach taken to conclude the planning process is ensure 100% collection with segregation at source. Easy access of service to every citizen is priority. There has to be a eco friendly transfer and transportation system. A feasible processing facility has to be adopted to ensure optimal utilization of waste for productive output. A scientific land fill is also proposed.
The base year is taken as 2012 and the design year has been considered as 2015 for collection & transportation and 2030 for treatment & landfill. The collection and transportation infrastructure designed for 2015 itself has a over loading capacity of 10% which can take care of next 7- 10 years upto 2022 and al so the addition of infrastructure required for this component are in small modules which can be added at intervals of 5 years. The treatment and landfill are designed for 15 y ears since the construction o f these infrastructures are a long term process and are economical with size. The ULB already has good number of equipments for collection and transportation of solid waste with a available land fill site.
The w aste generation i n base y ear i s 85 MT per day . I t i s projected t hat the generation w ill increase to 91 MT per day during 2015 and 118 MT per day during 2030. The water generation projection is based on the study conducted for similar cities in Odisha and confirmed by sample
City Sanitation Plan - Draft Rourkela Municipality

verifications. The characteristics waste suggests that it contains 63% organic component, 13% recyclable components and 24% inert components.
The additional infrastructure consists of primary collection system, street sweeping, transportation vehicle, secondary transfer station, recovery centers, composting unit, mechanical & electrical equipments, bi o-methanation plant, land fill site, bi o medical waste handling and cost of land acquisition.
The total project cost is arrived at Rs. 28.70 crores to be implemented in a time horizon of three years i.e. 2012 to 2015.
Storm water Drainage Proper drainage & disposal of storm water and prevention water logging are very vital component o f a good s anitation sy stem and improved publ ic health. A properly networked drainage system of proper design standards is required to achieve the required goal.
All the roads need to have a drain well networked with the primary drains and finally disposal to the natural drains or water bodies. The drains have to be covered type. It is assumed that 50% of the roads would be required to have drains on both side. Total road length of the is city is 629 Km. A total of 6 29 Km o f drains are proposed out of which 192 Km of pucca drains are in existence. The additional infrastructure required is 437 Km out of which 66 Km main drain, 153 Km secondary drain and 219 Km tertiary drain are proposed.
The total cost of additional infrastructure is calculated at Rs. 103.50 crores to be i mplemented over a period of 4 years i.e. 2012 to 2016
IEC and Institutional Strengthening Awareness generation, promotion o f cu ltural & so cial sh ifts are t he major co mponent for success of planning process. The required objective can only be achieved when the citizens are educated, conscious, responsive and adaptive. These should be supported by a strong institutional reform including capacity building and a equally strong enforcement mechanism.
It is proposed to adopt various medium for awareness generation with delivery in next four years. However this process should continue on a annual basis to continue the momentum. The process can be categorized as design phase, implementation phase and review phase. Midterm correction should be adopted for effectiveness of the programs. Simultaneously the capacity as well as the structure of the institution needs to be strengthened.
The total IEC cost is arrived at Rs. 3.50 crores to be i mplemented over a per iod of 4 y ears i.e. 2012 to 2016.
City Sanitation Plan - Draft Rourkela Municipality
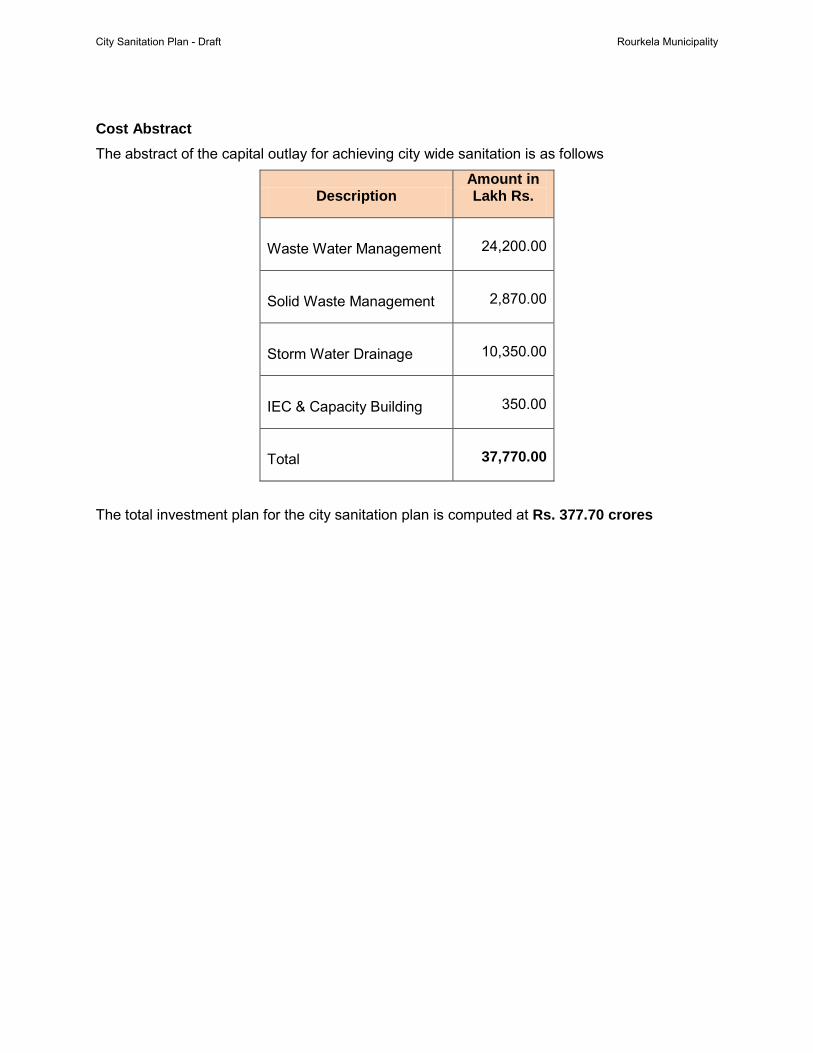
Cost Abstract The abstract of the capital outlay for achieving city wide sanitation is as follows
Description Amount in Lakh Rs.
Waste Water Management
24,200.00
Solid Waste Management
2,870.00
Storm Water Drainage
10,350.00
IEC & Capacity Building
350.00
Total
37,770.00
The total investment plan for the city sanitation plan is computed at Rs. 377.70 crores
City Sanitation Plan - Draft Rourkela Municipality

Acronyms CSP - City Sanitation Plan DTDC - Door to door collection GoI - Government of India GoO - Government of Orissa HH - Household LPCD - Liters per Capita per Day MoUD - Ministry of Urban Development MSW - Municipal Solid Waste MSWM - Municipal Solid Waste Management NUSP - National Urban Sanitation Policy SWD - Storm Water Drainage SWM - Solid Waste Management ULB - Urban Local Body SUSP - State Urban Sanitation Policy CSP - City Sanitation Plan SAR - Sanitation Analysis Report PPP - Public Private Partnership RM - Rourkela Municipality EMD - Earnest Money Deposit SD - Security Deposit
City Sanitation Plan - Draft Rourkela Municipality

1. Introduction Provision of universal access to safe drinking water and s anitation facilities is a prime need t o enhance quality of life in any community. The State of Orissa is taking several steps to improve the quality of life of its urban population. This vision of providing basic facilities for all is driven by Orissa’s remarkable progress in several areas in the recent past. The Government of Orissa (GoO) has formulated the Odisha Urban Sanitation Strategy (OUSS) on the lines of, National Urban Sanitation Policy (NUSP) that was announced by, the Ministry of Urban Development, in December 2008. By implementing the strategy, the state is planning to drive itself towards total sanitation, thereby, enhancing the standard of living across the cities and towns.
As a first step in implementing the SUSP, the GoO has undertaken to assist some 8 cities/towns in developing City Sanitation Plans (CSP) with funding support from Government of India with National I nstitute o f U rban A ffairs as the central coordinating agency. For ensu ring inclusive development appr oach, t he C SP, as envisaged i n N USP, w ill be pr epared by t aking i nto consideration ground realities, local conditions, and an up -to-date assessment of the situation. It shall be prepared through consultations with al l relevant stakeholders in each of the sectors covered.
OPHS is appointed as the consultant for assi sting t he three ci ties of Berhampur, Sambalpur, and Rourkela in the preparation of CSPs for the respective towns and had earlier submitted the Inception Reports. In line with the methodology of NUSP, the consultant has carried a structured survey and f ocused group discussions for undertaking the S ituation Analysis of the sanitation status in the city covering the three key areas of wastewater, solid waste and t he storm water drainage.
This City S anitation P lan co mprises of t wo par ts. Fi rst the si tuation A nalysis and se cond t he planning for city wide planning. The Situation Analysis Report provides an insight on the present sanitation pr actices/situation i n t he ci ty. P roper anal ysis of t he situation pr ovides inputs for preparing a effective and implementable strategy which finally translated into a detailed city sanitation plan.
2. Background 2.1. Objective
To determine the gravity of the current sanitation facilities in the Rourkela and to prepare a plan to ach ieve g oal o f z ero open de fecation & a sanitized ci ty, the City Sanitation Plan report i s prepared so as to address all the issues like: coverage of individual toilets, availability of public toilets, transport and disposal of liquid and solid wastes, and other key issues pertaining to sanitation.
2.2. National Urban Sanitation Policy NUSP which forms basis for the situation assessment and further dev elopment planning for improving the sanitation in the city. The vision of National Urban Sanitation Policy is “ all Indian cities and towns become totally sanitized, healthy and livable and ensure and sustain good
City Sanitation Plan - Draft Rourkela Municipality
1
public health and env ironmental outcomes for all their citizens with a sp ecial focus on hygienic and affordable sanitation facilities for the urban poor and woman”. The key objectives of NSUP are:
• Cities must be free of open defecation
• They m ust el iminate the pr actice o f manual s cavenging and pr ovide ade quate protective equipment that ensures the safety of sanitary workers.
• Proper disposal of municipal wastewater and storm water dr ainage should be arranged
• Recycle and reuse of t reated w astewater for n on-portable appl ications should be implemented wherever, possible
• Solid waste should be fully collected and safely disposed off
• Basic services to the poor should be provided adequately and maintained properly
• Measures for improved public health and environmental standards should be taken
• Awareness generation and behavior change
2.3. Odisha Urban Sanitation Strategy The main objective of the State Urban Sanitation Strategy is to develop citywide sanitation plans and implement them by integrating al l aspects of sanitation in an e ffective way. The program implementation strategy is based on the following principles:
• Develop sanitation facilities in the urban areas with special emphasis on the slums, through active participation of the communities, especially women.
• Eradicate the practice of open def ecation in the city by providing household toilets, community toilets and public toilets.
• Safe di sposal o f hum an excreta, so lid and l iquid waste, i ncluding i nstitutionalizing and provisioning the implementation of policy guidelines of Government of India on Management of Municipal Solid Waste and Management of Biomedical Waste.
• Improve the ‘quality of life’ of the sanitation workers.
• Engage civil societies and communities (women in particular) in awareness generation, hygiene education, creation of sanitation infrastructure and its maintenance.
• Strengthen institutional set up and build the capacity of the municipal staff for effective pr ogram i mplementation and m eeting t he ch allenges of t echnology and management.
• Encourage P ublic Private P artnerships (PPPs) t o ensu re g eneration o f funds and sustainable program implementation.
City Sanitation Plan - Draft Rourkela Municipality
2

• Ensure inter-departmental coordination and integration o f various relevant projects/schemes/program for their optimum use and outcome
2.4. National Rating Scheme for Sanitation
In order to rapidly promote sanitation in Urban areas of the country (as provided for in the National Urban Sanitation policy and Goals, 2008), and to recognize excellent performance in this area, the Government of India has instituted an annual rating and award scheme for cities. The award (Nirmal Shahar Purskara) is based on the premise that improved public health and environment standards are two key outcomes that cities must seek to ensure for their citizens. In doing so, government i n states and urban areas will need to plan and implement hol istic citywide sa nitation pl ans, thereby put ting i n pl ace pr ocesses that hel p achieve outputs pertaining to safe collection, confinement and disposal (including conveyance, treatment , and/ or reuse without advance impacts on the environment in and around the cities).
The first rating of cities with regards to their performance in sanitation improvement based on a se t o f obj ective i ndicators of ou tputs, pr ocesses and out comes, w as carried out i n 2010 to set the baseline ranking. Cities are expected to undertake an objective self-assessment from time to time. The NUSP document on ratings states that those in the red category are “Cities on the brink of Public health and environmental ‘emergency’ and needing immediate remedial action”.
2.5. Overview of the Scope of Work
The following are the broad t asks included i n the scope o f w ork; the current status is also mentioned:
o Task 1 – Formation of City-level Implementation task force
A City-level committee consisting of government and private sectors stakeholders has been formed for the purpose of overseeing preparation and implementation of the City Sanitation Plan.
o Task 2 – Conduct 1st
A f irst consultation has been conducted to orient the city stakeholders on the objectives of the NUSP and OUSS, and on the process and methodology of preparing the City Sanitation Plan.
Consultation
o Task 3 – Reconnaissance Survey & Focused Group Discussion
A reconnaissance survey has been conducted to authenticate the secondary data. This survey includes information on the following, which has been reviewed and used as part of the situation analysis:
• Field Survey of Public Latrines in Wards and Slums • Field Survey of Surface Drains • Field Survey of Solid Waste Arrangement • Testing of Quality of Water and Waste Water • Sample survey of slum and non slum households • Focused group discussion with elected representative and officials
City Sanitation Plan - Draft Rourkela Municipality
3

o Task 4 – Preparation of Situation Analysis
The situation analysis report, has been prepared which det ails out existing house hold sanitation arrangement, public sanitary conveniences, waste water disposal, solid waste management and water supply. It highlights the def iciencies in sanitation facilities. The analysis also provides the strategy to address the deficiencies.
o Task 5 – Conduct 2nd
A second consultation workshop was held with the city implementation task force to present the findings of the situation analysis for feedback and suggestions.
Consultation
o Task 6 – Preparation of Draft City Sanitation Plan
A draft city sanitation plan is presented incorporating assessment of strategies and technology opt ions for safe co llection, transportation, t reatment and disposal of bot h so lid and liquid waste in the city.
o Task 8 – Conduct 3rd
The d raft C ity Sanitation Plan and implementation pl an w ill be presented t o the city-level implementation task force. The recommendations of the committee and other stakeholders will be documented for their incorporation into the final version of the City Sanitation Plan.
Consultation
o Task 9 – Final City Sanitation Plan
The final version of the City Sanitation Plan will be prepared after appropriately addressing al l comments and suggestions of the 3rd
2.6. Sanitation Components
consultation meeting.
The CSP needs to include a comprehensive plan for the following:
Safe disposal of human excreta and liquid waste at household level. Safe disposal of Human excreta and liquid waste at public sanitary conveniences. Safe co llection, co nveyance, treatment and disposal of liquid waste from individual
communities (like wards and slums) and the city. Safe disposal of storm water drainage from communities and city. Safe collection, transport, treatment and disposal of solid waste. Safe collection, treatment and disposal of hazardous wastes.
Improvement and Management of Sanitation facility
City Sanitation Plan - Draft Rourkela Municipality
4
3. Situation Analysis “I am willing to pay….but where is the matching service” – says a common man
The city ranks at 134 in City Sanitation Ranking conducted during the year 2010.
3.1. Approach
• Study of past development history, growth, economy, values & culture, demographic, socio-economic status etc.
• Secondary data collection on spatial spread, basic services, institutional setup, key stakeholders and financial reports
• Reconnaissance survey on sa mple basi s scientifically di stributed acr oss t he municipal area
• Interact with key stake holder with special inputs from councilors on the status and issued related to the ward
• Walk through survey of the wards and observation on the physical situation of infrastructure, service quality and condition assessment
• Conduct focused group discussion on basic services
• Assessment o f cu rrent service st atus in w ater, se werage, so lid w aste and drainage sector
• Assessment of current institutional arrangement and financial strength
• Identification of key issues and challenges with special reference to urban poor
3.1.1. The base line data collection covered the following aspects.
• Base maps, and available secondary dat a on the ci ty’s demographics, service levels of water and sanitation
• Information on water supply, wastewater generation, collection and disposal, including initiatives which are being implemented or planned.
• Information on solid waste (collection, transportation and disposal)
• Data on institutional setup
• Data on municipal finances especially demand and collection of water and sewerage/sanitation charges, including connection fees and user charges; and ca pital co sts and operation and m aintenance co sts for w ater an d sewerage/sanitation services, and solid waste.
City Sanitation Plan - Draft Rourkela Municipality
5

3.1.2. Field Survey
The assessment o f sanitation si tuation i s further determined through a s tructured field su rvey covering three groups; (i) reasonable sample of households covering non-slum and slum areas; (ii) focused group discussion with the councilors and (iii) focused group discussion with the municipal managers and operational staff.
The following methodology was adapted to selection of samples for the field survey:
• The city was divided as per its administrative wards. The sample size in each ward is fixed i n pr oportion t o the w ard popul ation and t he sa mple house holds were se lected duly t aking into account the g eographical sp read and ensu res good r epresentation o f the ch aracteristic of the w ard. 5% o f non sl um and 10% non sl um H ouse hol d w ere selected for survey
• Separate su rvey q uestionnaires for sample su rvey and t he f ocused group di scussions were developed and the drafts discussed w ith t he ci ty administration and amended based on feedback and used in collecting the data.
• The su rvey t eam was trained and sensitized on t he fundamental aspects of sanitation and were provided with sufficient background knowledge on the theme and objectives of CSP.
• The co mmunity and public toilets existing i n t he ci ty were physically i nspected by t he survey team on w alk in and walk around method and al so by interaction with the users present during the walk around.
The data analysis is undertaken to determine the status by application of appropriate statistical analytical t ools and t he resultant trend was further confirmed t hrough a feedback discussion with the operational staff through a test of reasonableness of the findings. The findings of the primary survey is annexed to this report as Annexure 2.
3.1.3. Councilor Interaction
A questionnaire was prepared for taking inputs from the councilors on the current status of the ward, perception on the quality of service and issues related to the ward.
3.1.4. Focused Group Discussion
Focused group discussion was conducted in two separate groups
• Elected representatives (councilors)
• Officials and managers of service providers
The findings of the focused group discussion is encloses as Annexure 3 & 4
3.1.5. Condition Assessment Survey
Condition assessment survey f or the ex isting community toilets was conducted to assess the capacity, phy sical co ndition and t he usa ge. A lso so me i nformation on the operational issues were collected.
City Sanitation Plan - Draft Rourkela Municipality
6
3.2. Rourkela City
3.2.1. Location
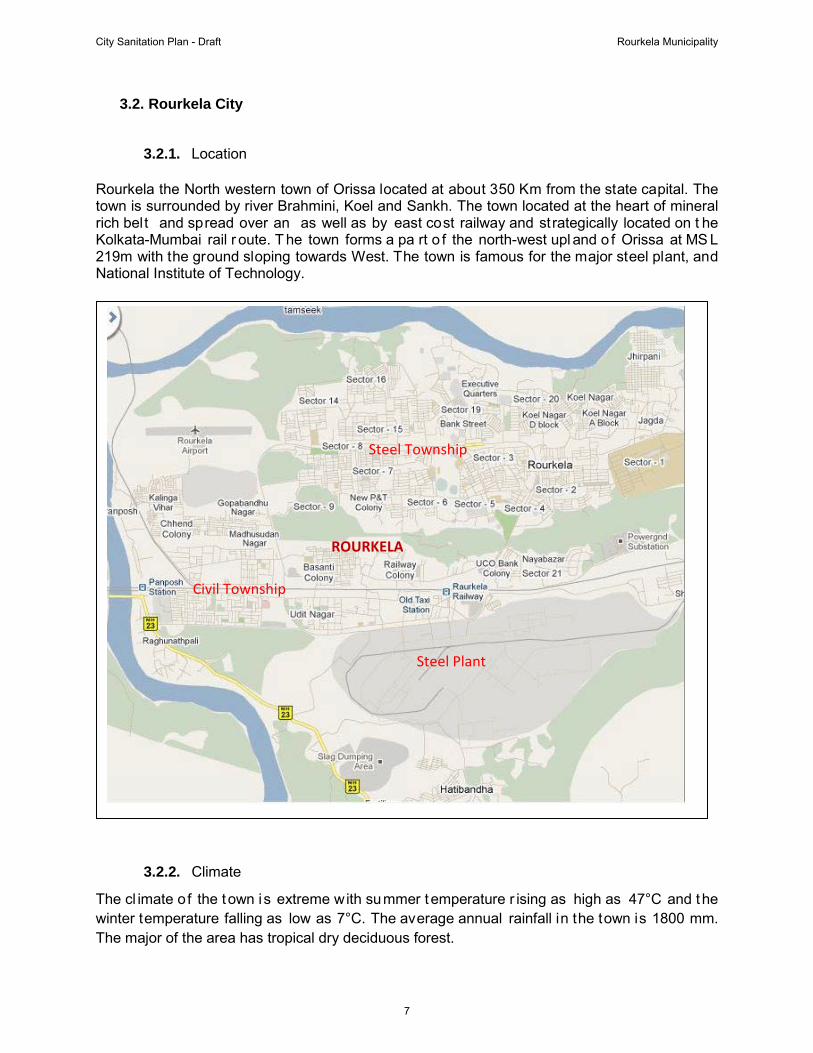
Rourkela the North western town of Orissa located at about 350 Km from the state capital. The town is surrounded by river Brahmini, Koel and Sankh. The town located at the heart of mineral rich belt and spread over an as well as by east cost railway and strategically located on t he Kolkata-Mumbai rail r oute. T he town forms a pa rt o f the north-west upl and o f Orissa at MS L 219m with the ground sloping towards West. The town is famous for the major steel plant, and National Institute of Technology.
3.2.2. Climate
The cl imate o f the town is extreme with summer temperature r ising as high as 47°C and the winter temperature falling as low as 7°C. The average annual rainfall in the town is 1800 mm. The major of the area has tropical dry deciduous forest.
Steel Township
Steel Plant
Civil Township
ROURKELA
City Sanitation Plan - Draft Rourkela Municipality
7

3.2.3. Culture
Rourkela has been t raditionally a t ribal bel t with more o f forest area. It has a t ouch o f t ribal culture in the out skirt villages. S ubsequently it developed into a industrial township with a cosmopolitan culture.
3.2.4. Economy
Rourkela is the industrial capital of Odisha. The main economy of the area revolves around the mega steel pl ant. The steel plant supports a number of ancillary units. Rourkela also has a fertilizer plant which is a subsidiary of the steel plant. Some of the other major industries in and around Rourkela are L&T at Kansbhal, OCL India Ltd. At Rajgangpur and IDL at Jagda. The city is in the growth trajectory with real estate, housing development and shopping malls remarkably visible since last five years..
3.3. Demography
Table 1 : Rourkela Population growth
Year Area of the City
Total Population
Slum Population
Decadal Growth Rate
1961
90,287
1971
1,72,502 91% 1981
3,22,610 87%
1991
3,98,864 24%
2001 31.6 4,84,292 / 2,24,987
23%
2011 31.6 2,69,602 1,14,980 20%
City Sanitation Plan - Draft Rourkela Municipality
8

Rourkela NAC was established in the year 1855 and upgraded to Municipality in 1989. It is the third largest town of Orissa and has been declared as a Class-I Town as per 2001 census. The town is divided into 33 wards with a total area of 31.6SqKm.
The Municipality of Rourkela also included the steel township till late nineties. Subsequently the steel township has been separated out of Rourkela Municipal limits. The population of the town for t he ce nsus year 2001 was 2,24,987, and t he cu rrent popul ation as of 2011 i s said t o be 2,69,602 with the slum population of 1,14,980(43%). The total number of households as of 2011 is 59,239 out o f which 25,994 are sl um house holds. The t own divided i nto 33 administrative wards is spread over 31.6 Sqkm sloping towards north and has a total road network of 629 km. Due to its importance of industrial and trading activity, there are good number of floating population in the town.
Table 2 : Ward-wise estimated population in Rourkela as on 2011
Ward Population
2001 Population
2011
Total House Holds
Number of
Slums Slum
Population
Slum House Holds
% of slum
Population
Geographical area
1 5622 7576 1652 10 6681 1519 88% 1.95 2 6174 5956 1249 3 3579 842 60% 1 3 7529 14043 3129 3 8810 1814 63% 3.29 4 10790 11475 2407 5 1511 339 13% 1.25 5 6835 9033 2100 5 4245 1009 47% 0.54 6 9720 10612 2500 9 6007 1555 57% 1.44 7 11535 7590 1707 6 6035 1536 80% 0.6 8 8493 11500 2600 1 517 160 4% 0.44 9 7114 10329 2309 6 7651 1729 74% 0.52
10 7846 10410 2580 3 4606 1169 44% 0.2 11 5842 5807 1351 5 5572 1988 95% 0.47 12 9745 9643 2241 4 2209 516 23% 1 13 9611 13456 3006 4 8715 1041 65% 0.46 14 4841 7500 1680 3 3473 784 46% 0.31 15 5391 5102 1020 3 2951 557 58% 0.26 16 5911 8320 1960 3 3921 942 47% 0.24 17 3849 4950 1091 1 1523 369 31% 0.31 18 5905 4260 960 1 1727 423 41% 0.2 19 6667 6120 1280 1 1756 338 29% 0.22 20 6888 9312 1615 3 4130 826 44% 0.12 21 4911 5157 983 2 3524 676 68% 0.11 22 4827 4427 857 3 2397 463 54% 0.95 23 4906 4697 1103 3 2254 576 48% 2.72 24 5572 7236 1559 4 5688 1164 79% 0.34 25 5123 4903 1153 3 1109 267 23% 0.3
City Sanitation Plan - Draft Rourkela Municipality
9

Ward Population
2001 Population
2011
Total House Holds
Number of
Slums Slum
Population
Slum House Holds
% of slum
Population
Geographical area
26 3439 3510 795 2 1653 409 47% 1.29 27 7064 6054 1361 2 697 154 12% 1.23 28 5754 7341 1600 1 555 125 8% 1.84 29 6278 7170 1463 1 297 63 4% 1.86 30 7636 9404 1504 2 2929 736 31% 3.13 31 7828 10374 2453 5 4083 982 39% 1.41 32 8495 11894 2606 7 4175 923 35% 0.46 33 6846 14441 3365 0 0 0 0% 1.14
Total 224987 269602 59239 114 114980 25994 31.6
Figure 1 : Ward wise distribution of total and slum population
The ward wise status of sanitation and services as inferred from the focused group discussions and field survey is summarized at Annexure 1.
City Sanitation Plan - Draft Rourkela Municipality
10

3.4. Water Supply service Water supply and wastewater services are provided by the Public Health Engineering Organisation and the town receives two hours forty five minutes water supply per day. The water service indicators and the targets proposed are shown in the following table
3.4.1. Water Supply Performance Table 3 : Water Supply Service Indicators
Performance Indicator Benchmark 2009-10 20010-11 Target for 2011-12
Coverage (%) 100% 34.1 35.0 40 Per Capita Supply of
Water(lpcd) 135 293.0 275.0 250
Extent of Metering (%) 100% 0 0 2 Extent of Non-Revenue
Water (%) 15% 74.2 33.2 30 Continuity of water
supply 24x7 2.9 2.8 2.8 Eff. in redressal of
customer complaints (%) 80% 76.4 78.3 80
Quality of Water Supplied (%) 100% 81.5 89.5 100
Cost Recovery (%) 100% 23 21.5 30 Eff. In Collection of Water Charges (%) 90% 65.5 66.5 80
55 MLD WTP at Rourkela
City Sanitation Plan - Draft Rourkela Municipality
11
The water supply coverage is about 35% where in there are 14,437 direct piped water supply connections. The physical coverage is also quite low. As against 630 km road length the water network is available in about 220 km only. Majority population depends upon some 431 public taps, 1132 hand pumps, open wells & tanker supply. The town has adequate water with treatment capacity of 79 MLD.
The average daily water supply to the town from these sources is 48 MLD. The Per capita water supply of 275 is high as compared to the national benchmark. No meters have been installed and the users are charged at flat rate which is a major cause of wastage leading to high Non Revenue Water (33%). The town has interim water supply with average 2.8 Hrs of supply daily
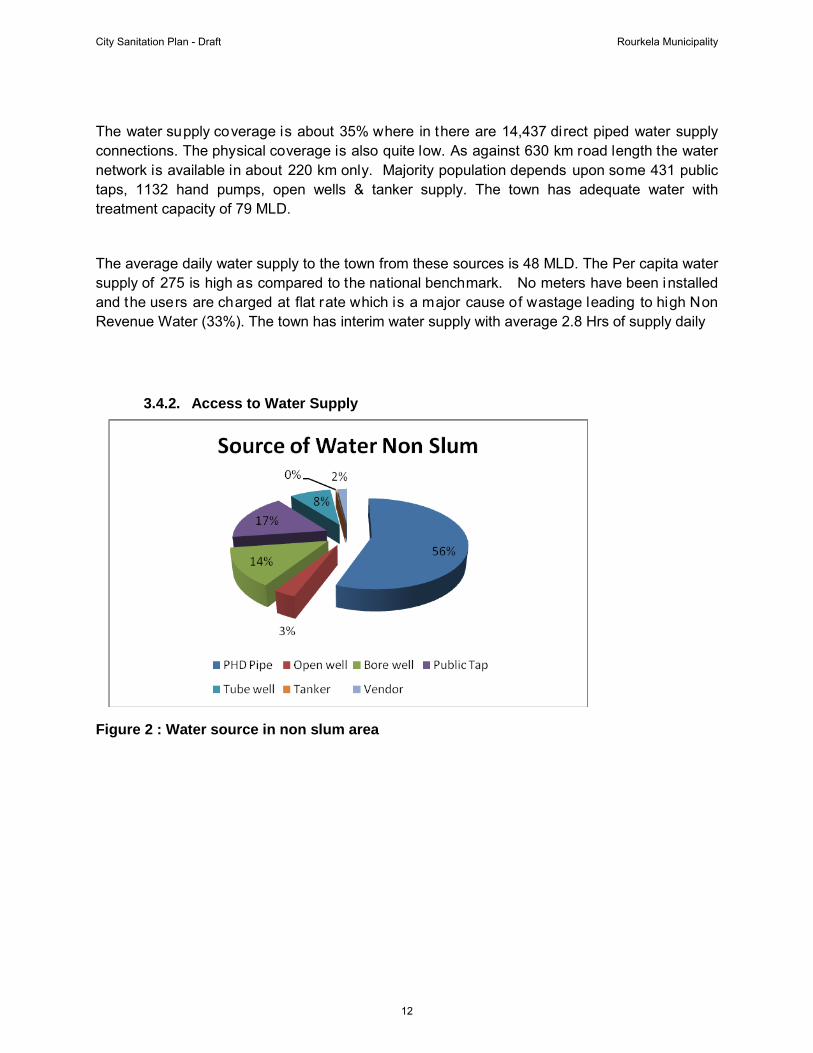
3.4.2. Access to Water Supply
Figure 2 : Water source in non slum area
City Sanitation Plan - Draft Rourkela Municipality
12

Figure 3 : Water source in slum area
It i s observed from the primary survey t hat 17 % o f non slum and 31 % o f slum population depend on public stand post where as 41% o f non slum properties and only 10 % o f slum properties have piped water connection. There is a high level of dependence on open w ell and tube well (41%) in the slum area. However due to low water table the open wells and 60% of the tube wells go dry during the summer season resulting in scarcity of water. The slum areas are most affected during summer due to high dependence on hand pump tube well.
3.4.3. Ground Water
The city being situated amidst a hilly mining region, the water table is very low and the yield is very poor. The water table normally is 6-7m below GL and fall as low as 20m during summer. The open wells and m ajority o f hand pum p t ube wells dry up dur ing monsoon. The y ield of deep bore well is also quite low.
3.4.4. Water Bodies
River water bodies and other still water bodies are useful domestic sources for people residing in water scarcity areas. It is no different in Rourkela town where residents depend upon su ch water bodies due to either inadequate or irregular access to potable water. There are very few ponds in t he t own. T he r ivers are widely used f or variety of pur poses including bat hing and drinking. The ponds have deteriorated in water q uality due to several c auses such as quick siltation, natural damage and rapid & concentrated population growth in concerned area. There is a constant increase in BOD due to presence of organic waste primarily due to open defecation and sewage inflow into the water bodies.
City Sanitation Plan - Draft Rourkela Municipality
13

3.4.5. Key issues
• The city has adequate water but there is inequality in distribution and urban poor are the victim of the system.
• Coverage is low due t o scattered location of wards leading to o inadequate distribution network
• There is large wastage and theft of water due to lack of metering and proper surveillance.
• Illegal connections, suction f rom distribution l ine and system leakages are a m atter o f concern
• Inadequate maintenance of the existing infrastructure
• Open de fecation is in practice though co mparatively l ow in t he river side leading t o unhealthy and unhygienic conditions. Quality of water bodies in the city is degrading rapidly and the ponds are heavily silted.
3.5. Sanitation 3.5.1. Access to Toilets
Figure 4 – Access to Toilets in non slum
City Sanitation Plan - Draft Rourkela Municipality
14

Figure 5 – Access to Toilets in slum area
According to the survey about 99% of the non slum households and 67% of slum households in the town have i ndividual t oilets and t he remaining popul ation, ei ther us e t he publ ic toilets or share with other households or resort to open defecation. The following figure above shows the availability / access to toilets for the current population in non slum and slum areas of Rourkela. Out of the remaining household 8% o f house holds use ei ther community t oilets or sh are the toilets with neighbors / owners. About 25% of slum population and 1% of non sl um population resort to open defecation in the open field, river bank, alongside ponds, drains or road side. The town has 5% of non slum houses with sewerage collection network. This is observed mainly in the K oel N agar area. The se werage sy stem has a dece ntralized se ptic tank and the e ffluent from the septic tank is discharged to river Koel.
3.5.2. Condition Assessment of Community/Public Toilets
There are no community toilets in the ULB. The town has 6 public toilets with 64 seats which are also extensively used by the slum dwellers. Three are maintained by Municipality, two are maintained by S ulabh International, one by RDA. One of the Municipality toilets has been out sourced to a private agency for operation and maintenance. All the toilets are are being operated with user charges and have been observed to be in condition. The source o f water to the community t oilet is either from PHD or bore well. The disposal of sewage into individual soak pits. The public toilets charge f ees in t he r ange of Rs.2.00 – Rs.4.00 for usage and hence the maintenance of the same is relatively better than the community toilets. On an average some 200 – 250 people use the facilities.
City Sanitation Plan - Draft Rourkela Municipality
15

3.5.3. Wastewater Management
The town has limited implementation of wastewater management only in one colony (Koel Nagar) with collection and septic tank treatment which accounts for the 5% o f non slum households. The rest of the 95% of the area are without facility of sewerage system though a large number o f house holds have acce ss to t oilets and w ater abundance i n t he ci ty as a whole is observed. About 86% of non slum house holds and 61 % of slum households have onsite sanitation facilities and the remaining population either discharges the sewage into water bodies or resort to open de fecation. The critical factors for such a status are pressure on urban space in highly dense old residential areas, high cost of living and migration of rural mass to the urban area in search of work. Such a scenario has resulted in unhygienic conditions; with the highly polluted river poses a great threat
There are very few water bodies in the town. The water bodies are not maintained and ar e silted over a period of t ime. These are pr imarily used by the local residents for their day to day water requirement. However these locations are used for open defecation and di sposal for solid waste there by creating hygiene problems.
The slum dwellers basically from the labour class resort to open defecation along the river side and water bodies. These places are widely used for dumping of solid waste.
City Sanitation Plan - Draft Rourkela Municipality
16

to t he publ ic health and welfare of the co mmunity. Non-existent of f ull-fledged t reatment and disposal system for the town is posing a great threat to the public health. At present the supply of water to the city is around 48 million liters per day. The sewage generation presently is 38 MLD and as per es timates about 15% o f this waste water finds i ts way into t he storm water drains every day. This waste water ultimately flows into the Koel and Brahmini River, thereby polluting the river and posing a potential environmental hazard. Even the households with onsite sanitation, there is no scientific disposal of sludge and the residents hire local suction machines and the septage is disposed off into open pits/nalas located outside the town limits. The ULB owns two cesspool equipments which is provided to the residents on hi re but does not have a septage management policy nor a sci entific treatment facility for septage. At many of the slum area the residents resort to manual scavenging which leads to health hazards.
Thereby, the entire town’s wastewater disposal needs a complete changeover in order to achieve a sa fe sa nitized env ironment. OWSSB i s preparing a D PR for sewerage sy stem f or Rourkela town.
3.5.4. Key Issues
• There is no proper sewerage collection system in the ULB except one colony
• There is no sewerage treatment plant. Septage management is not practiced by the ULB
• There is practice of open defecation though less as compared to other cities of Odisha. This is creating unhygienic conditions and health problems.
• The sewage is drained out into the open drains which ultimately find its way into the river leading to contamination.
• There are no awareness campaigns run by the municipality for the slum dwellers.
• Populations residing in slums are facing unbearable unhygienic conditions.
• There are no community toilets in the ULB. Only Public toilets are present which is also used by the slum dwellers.
3.6. Solid Waste Management The Health Department of Municipality i s responsible for collection and transportation o f solid waste generated in Rourkela municipal area. For operational purposes the entire area is divided into 33 solid waste wards. Sanitary inspectors are in charge of the operation of SWM headed by a health officer. The primary collection in the Rourkela municipal is carried out through door to door collection, open collection points, secondary collection & transportation through tractors/trucks.
The current service levels in the town in regard to solid waste management as notified in the Orissa gazette are shown in the following table.
City Sanitation Plan - Draft Rourkela Municipality
17
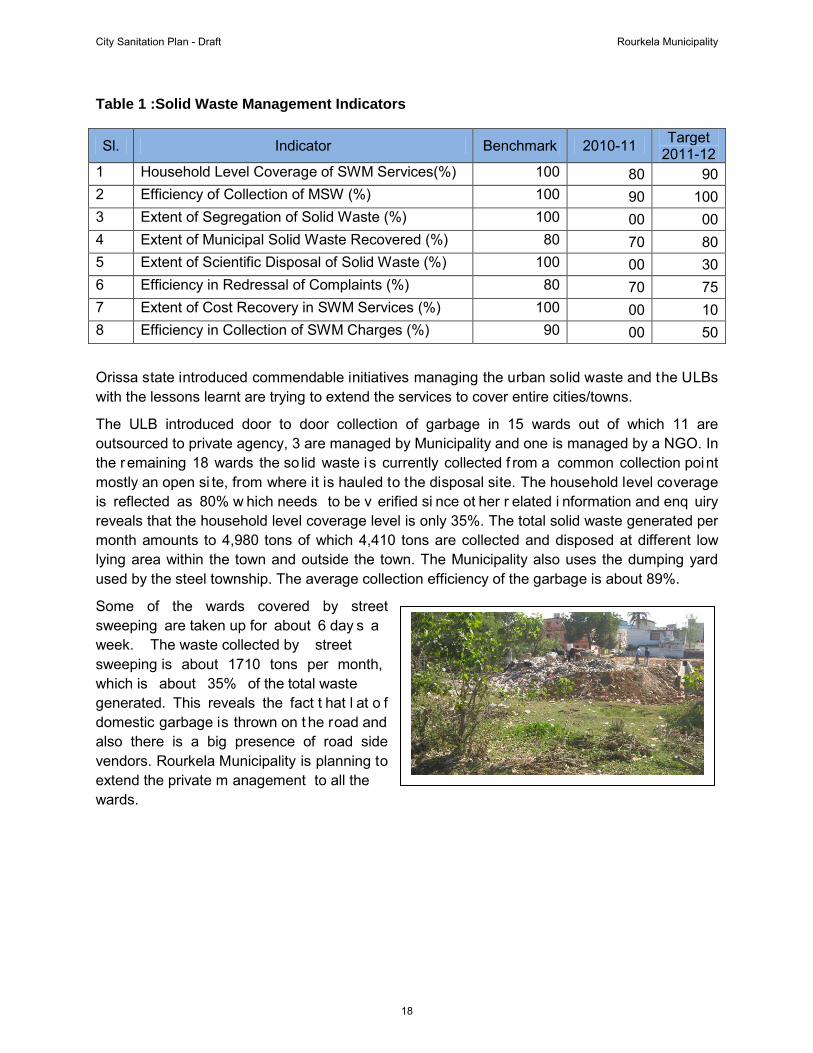
Table 1 :Solid Waste Management Indicators
Sl. Indicator Benchmark 2010-11 Target 2011-12
1 Household Level Coverage of SWM Services(%) 100 80 90 2 Efficiency of Collection of MSW (%) 100 90 100 3 Extent of Segregation of Solid Waste (%) 100 00 00 4 Extent of Municipal Solid Waste Recovered (%) 80 70 80 5 Extent of Scientific Disposal of Solid Waste (%) 100 00 30 6 Efficiency in Redressal of Complaints (%) 80 70 75 7 Extent of Cost Recovery in SWM Services (%) 100 00 10 8 Efficiency in Collection of SWM Charges (%) 90 00 50
Orissa state introduced commendable initiatives managing the urban solid waste and the ULBs with the lessons learnt are trying to extend the services to cover entire cities/towns.
The ULB introduced door to door collection of garbage in 15 wards out of which 11 are outsourced to private agency, 3 are managed by Municipality and one is managed by a NGO. In the remaining 18 wards the so lid waste i s currently collected f rom a common collection point mostly an open si te, from where it is hauled to the disposal site. The household level coverage is reflected as 80% w hich needs to be v erified si nce ot her r elated i nformation and enq uiry reveals that the household level coverage level is only 35%. The total solid waste generated per month amounts to 4,980 tons of which 4,410 tons are collected and disposed at different low lying area within the town and outside the town. The Municipality also uses the dumping yard used by the steel township. The average collection efficiency of the garbage is about 89%.
Some of the wards covered by street sweeping are taken up for about 6 day s a week. The waste collected by street sweeping is about 1710 tons per month, which is about 35% of the total waste generated. This reveals the fact t hat l at o f domestic garbage is thrown on t he road and also there is a big presence of road side vendors. Rourkela Municipality is planning to extend the private m anagement to all the wards.
City Sanitation Plan - Draft Rourkela Municipality
18

There are new growth area which are being added to the municipal area also there is a long standing demand to add other outskirt areas like Jalda into the municipal limits and to convert it into a corporation. The cattle wastes from t hhse areas also require a sa fe and scientific disposal.
Reforms in Solid Waste Management in Rourkela
Rourkela Municipality has added new equipments for improving the SWM system with funding from 12th FC grant. The m unicipality has put in service 5 tippers/trucks, 7 t ractor trolleys, 2 excavators and 9 aut o t ippers. Also they have 88 dustbins and 66 garbage bins placed within the town. Over and abov e this the private agency deploys its own equipments for SWM in the 15 wards outsourced to it.
The following figure shows the percentage-wise breakup of solid waste generation sources. The waste g enerated from st reet sweeping suggests t he l ack o f pr oper i nfrastructure i n collection and disposal of solid waste in the town.
Figure 6 - Source- wise Solid Waste Generated
City Sanitation Plan - Draft Rourkela Municipality
19
It is observed that the quantity of waste generated from street sweeping is almost 35% which suggests that there is big presence of road side vendors which caters to the transit passengers. Due to the presence of large number of floating population and lack of adequate disposal bins in the busy area, the waste are thrown on the road.
It i s observed that t he waste f rom the areas located on t he banks of River i s indiscriminately dumped in the River posing a serious public health hazard to the number of bathing ghats along the river bank.
Rourkela Municipality i s proposing to set up a treatment and di sposal unit in association with steel township.
Key Issues
• The ULB lacks a solid waste management plan
• There is no scientific landfill si te. A lso t here i s lack of i dentified di sposal si te r esulting indiscriminate spreading of solid waste
• River bank is widely used to dump garbage leading to water contamination and hygiene issues
• Low level of awareness amongst the citizens on solid waste handling
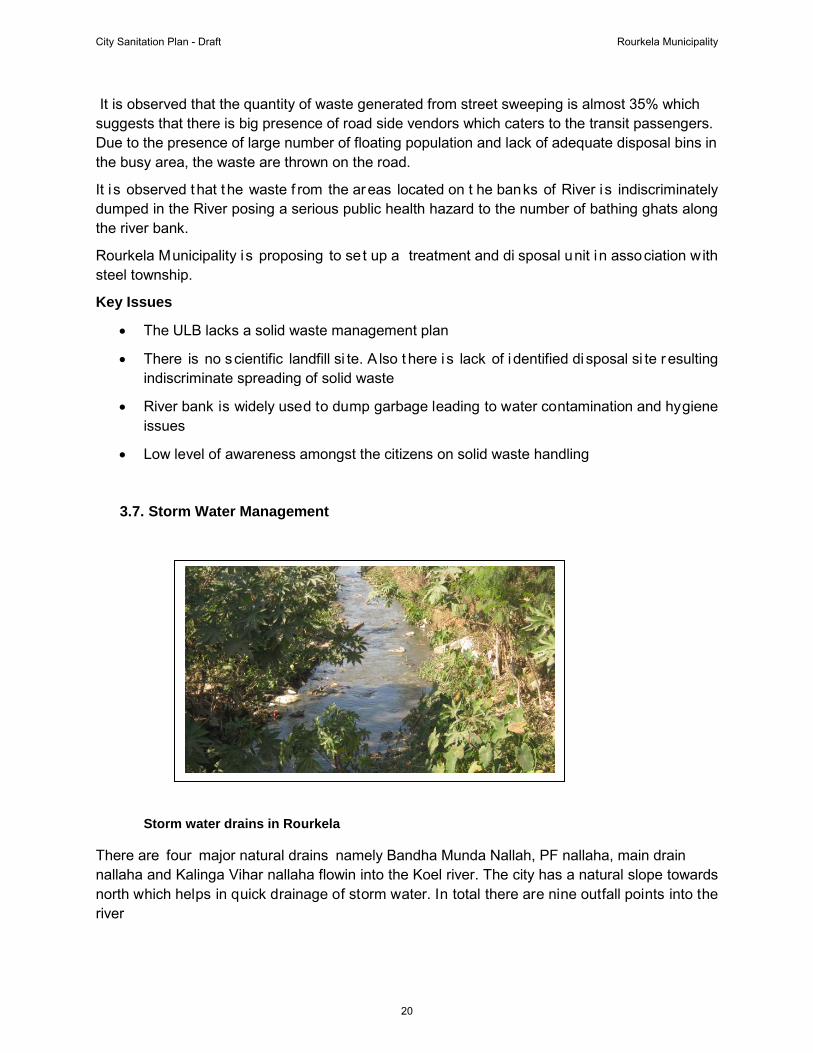
3.7. Storm Water Management
Storm water drains in Rourkela
There are four major natural drains namely Bandha Munda Nallah, PF nallaha, main drain nallaha and Kalinga Vihar nallaha flowin into the Koel river. The city has a natural slope towards north which helps in quick drainage of storm water. In total there are nine outfall points into the river
City Sanitation Plan - Draft Rourkela Municipality
20

Table 5 :Drainage Indicators
Sl.No. Indicator Benchmark March 2011
Target 2011-12
1 Coverage of Storm Water Drainage Network (%) 100 21 25 2 Incidence of Water Logging/Flooding (Number) 0 05 03
The drains are in a s tate o f disrepair and the situation is further aggravated by clogging by plastic. The m unicipal conservancy st aff ar e sa id t o be de -silting t he dr ains on a dai ly basi s. Most of t he d rains are Kucha. T he total l ength of d rain ar e r eported to be 488 K m and ar e isolated without proper connectivity. I t is observed that though there is presence of 488 K m of drain as compared to 629 Km road but the coverage is reported as low as 21%. This data needs further verification.
Key Issues
• Comprehensive storm water system is not present in the city. Natural storm water drains are presently act ing as the conveyance channels for the untreated sewage into river
• The condition of the drains presently is not up to the mark. Majority of the drains are chocked due to the dumping of the solid waste
• It is also important to conduct awareness programs at the ci ty level t o cover all cl asses of the residents to highlight the function of storm water drains, prevention of encroachment of the storm water drain areas, prevention of dumping of solid waste and discharge of sewage/sullage from households and other related issues
3.8. Overall Citizen satisfaction on Basic services
The citizen perception on urban basic services as analysed from the primary survey is depicted below. It is observed that the slum areas are more deprived of the basic services. There is a huge scope for improvement in the service levels.
• 83% of non slum and 51 % of slum r esidents complain about the sufficiency o f water.
• 63% of non slum and 84% of slum residents feel that door to door collection is not regular
• Almost 50 -60% of t he residents complaint abo ut easy access to municipal bi ns which calls for more deployment of bins
• More than 60% of citizens feel that the drainage facility is inadequate and disposal of storm water is not proper
City Sanitation Plan - Draft Rourkela Municipality
21
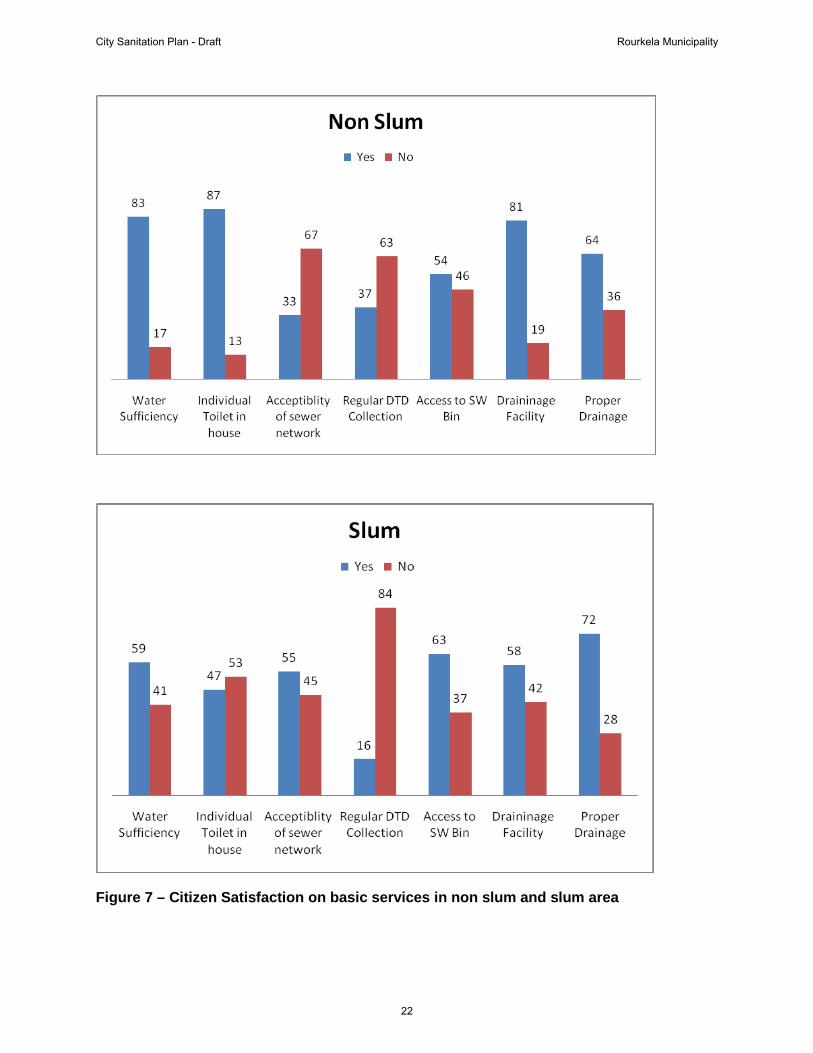
Figure 7 – Citizen Satisfaction on basic services in non slum and slum area
City Sanitation Plan - Draft Rourkela Municipality
22

Basic Services to Urban Poor
Rourkela has total 11 4 numbers o f slums. The slum p opulation t otal t o 1,14,980 w ith 26,994 households. Nearly 43% of the total population of the town comprises of t he slums. The slums in t he city are scattered all around the city and increasing over time. The slums are facing difficulties due to deficiency in various infrastructure facilities like roads, water supply, drainage, street lighting, solid waste management etc.
Table 6 : Literacy rate of Rourkela
Category 2001 City Slum
Average Literacy Rate 75% 50% Male Literacy Rate 81% 62% Female Literacy Rate 69% 37%
The slum areas are deprived of the basic services due to land tenure problem and accessibility issues. The population density has been the major bottleneck in providing of basic service. The result of primary survey reveals the following
Table 7 :Service status in slum
Service Status
Housing 25% are w ith K uchha house s and 68% a re w ith P ucca house which reveals a better status of the slums
water supply Only 9% have PHD direct piped connection; 31% depend on public taps and 41% depend on hand pump tube well
Access to toilet 31% of the houses do not have individual toilets resulting in open defecation; there are no community toilets in the town
Solid waste Collection DTD collection is operational in limited areas of the slum; also the frequency of garbage lifting is very less;
Drainage 42% of slum area do not have proper drainage facility
Municipality is taking up a num ber of slum improvement and pov erty alleviation programs with assistance from state govt. and central Govt. Few to mention are SJSRY, NSDP, RAY, IHSDP, ILCS etc. The dat a co llected t hrough p rimary su rvey and se condary so urce suggest t hat t he situation in Rourkela town is much better than many cities of Odisha and are the situation can be much improved with small interventions.
City Sanitation Plan - Draft Rourkela Municipality
23

Institutional Framework
Table 8 :Legislatives governing Institutions
Names of Institution Governing Institutions
Rourkela Municipality Orissa Municipal Act –1950 Rourkela Development Authority RDA Orissa Development Authorities Act, 1982
Orissa Water Supply and Sewerage Section 67 of OWSSB 1991 Board Public Health and Engineering Formed by Government of Orissa
Organisation Orissa Pollution Control Board Section 4 of the (water prevention and control
of pollution) amendment act 1975
Table 9 :Institutional framework and roles
Sl. No
Name of the Institution
Responsibilities and Functions Remarks
1 Rourkela Municipality
• Responsible for basic services within t he town su ch as S WM, road, drainage, street lighting,
• Responsible for city sanitation, preventive health care
• Responsible f or i mplementation of slum development and poverty alleviation programs
• Birth and death registration
• Parking, plantation, markets
• As per 74 th CAA UL B is responsible for 18 basic functions
2 Rourkela Development Authority
• Preparation and implementation of Area Development plans and projects for ensuring scientific land use pattern
• Working as coordinating agency between various Government and other agencies for development activities.
• Determining and phasing development.
• All functions pertaining to Master plan and development plan Preparation. Preparation of development schemes a nd its implementation
City Sanitation Plan - Draft Rourkela Municipality
24
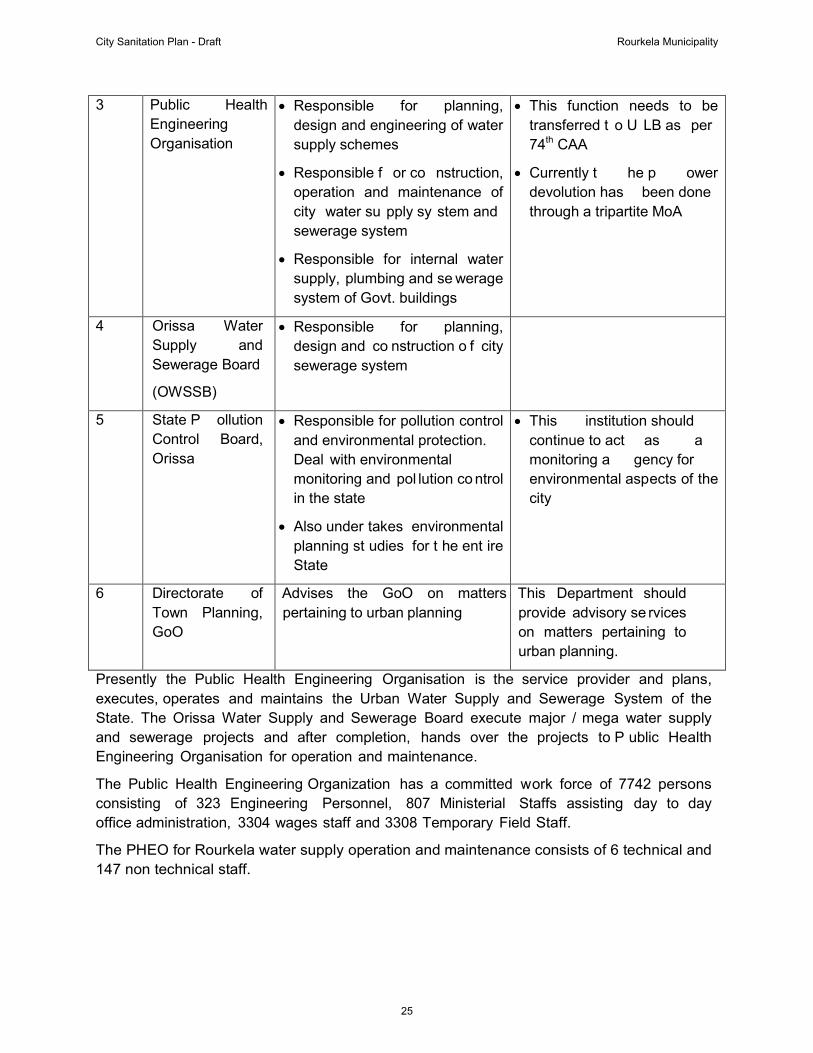
3 Public Health Engineering Organisation
• Responsible for planning, design and engineering of water supply schemes
• Responsible f or co nstruction, operation and maintenance of city water su pply sy stem and sewerage system
• Responsible for internal water supply, plumbing and se werage system of Govt. buildings
• This function needs to be transferred t o U LB as per 74th
• Currently t he p ower devolution has been done through a tripartite MoA
CAA
4 Orissa Water Supply and Sewerage Board
(OWSSB)
• Responsible for planning, design and co nstruction o f city sewerage system
5 State P ollution Control Board, Orissa
• Responsible for pollution control and environmental protection. Deal with environmental monitoring and pol lution co ntrol in the state
• Also under takes environmental planning st udies for t he ent ire State
• This institution should continue to act as a monitoring a gency for environmental aspects of the city
6 Directorate of Town Planning, GoO
Advises the GoO on matters pertaining to urban planning
This Department should provide advisory se rvices on matters pertaining to urban planning.
Presently the Public Health Engineering Organisation is the service provider and plans, executes, operates and maintains the Urban Water Supply and Sewerage System of the State. The Orissa Water Supply and Sewerage Board execute major / mega water supply and sewerage projects and after completion, hands over the projects to P ublic Health Engineering Organisation for operation and maintenance.
The Public Health Engineering Organization has a committed work force of 7742 persons consisting of 323 Engineering Personnel, 807 Ministerial Staffs assisting day to day office administration, 3304 wages staff and 3308 Temporary Field Staff.
The PHEO for Rourkela water supply operation and maintenance consists of 6 technical and 147 non technical staff.
City Sanitation Plan - Draft Rourkela Municipality
25

As per the provisions of the OM Act, 1950 the apex body is the ‘General Body’ of Rourkela Municipality headed by the honorable Chair Person. The Act provides for four authorities in a Municipality as indicated below
• Municipality
• Chair Person;
• Council Committees
• Executive Officer.
Various functional departments under the Municipality are
Department Role
Accounts & Cash Looks after the Budget, revenue and expenditure of the ULB, Maintains accounts for the ULB
Scavenging Establishment
Looks after the matters of Sewerage, drainage cleaning and Road sweeping through manually operated persons under the various areas of Municipality by Sweepers. The direct authority for the same is Executive Officer.
Vehicle, Transport, Cesspool & Kalyan Mandap
Looks after the Sanitation and sewerage cleaning around the Municipality through mechanized method. The department also takes care of Kalyan Mandap & Water Tank.
Works Department Looks after various developmental work like building and repairing of roads and others along with works under BRGF scheme etc.
Stores & Consumables
Deals with all kind of stores, tools, tackles and consumables for other departments
Tax Department Looks after various tax collections activities under Municipality areas like Holding Tax, Water Tax etc.
Shop & License Looks after various Commercial Establishments allocation, issuing of License for various commercial establishments etc.
Electrical Engineering Looks after various Electrical works under Municipal area with street lighting
Health Department Looks after various health issue including public health and sanitation along with birth & death registration
Urban Poverty Alleviation Section
Looks after various poverty alleviation program of State and Central government , BPL , APL etc program, SGSRY etc
The Municipality is facing shortage of manpower which is affecting effective delivery of services. Currently the ULB has 44 vacant posts against the sanctioned posts. The detail of staff position is annexed to this report as Annexure 5
City Sanitation Plan - Draft Rourkela Municipality
26
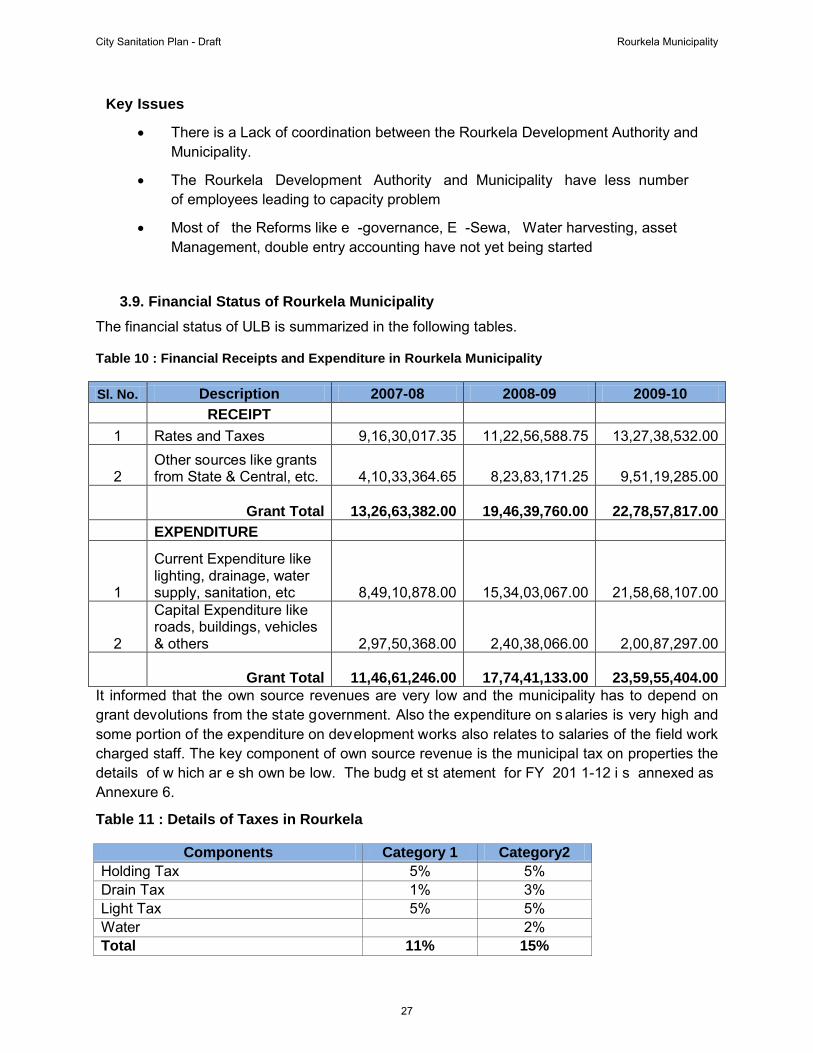
Key Issues
• There is a Lack of coordination between the Rourkela Development Authority and Municipality.
• The Rourkela Development Authority and Municipality have less number of employees leading to capacity problem
• Most of the Reforms like e -governance, E -Sewa, Water harvesting, asset Management, double entry accounting have not yet being started
3.9. Financial Status of Rourkela Municipality The financial status of ULB is summarized in the following tables.
Table 10 : Financial Receipts and Expenditure in Rourkela Municipality
Sl. No. Description 2007-08 2008-09 2009-10 RECEIPT
1 Rates and Taxes 9,16,30,017.35 11,22,56,588.75 13,27,38,532.00
2 Other sources like grants from State & Central, etc.
4,10,33,364.65
8,23,83,171.25
9,51,19,285.00
Grant Total 13,26,63,382.00 19,46,39,760.00 22,78,57,817.00
EXPENDITURE
1
Current Expenditure like lighting, drainage, water supply, sanitation, etc
8,49,10,878.00
15,34,03,067.00
21,58,68,107.00
2
Capital Expenditure like roads, buildings, vehicles & others
2,97,50,368.00
2,40,38,066.00
2,00,87,297.00
Grant Total
11,46,61,246.00
17,74,41,133.00
23,59,55,404.00 It informed that the own source revenues are very low and the municipality has to depend on grant devolutions from the state government. Also the expenditure on salaries is very high and some portion of the expenditure on development works also relates to salaries of the field work charged staff. The key component of own source revenue is the municipal tax on properties the details of w hich ar e sh own be low. The budg et st atement for FY 201 1-12 i s annexed as Annexure 6.
Table 11 : Details of Taxes in Rourkela
Components Category 1 Category2 Holding Tax 5% 5% Drain Tax 1% 3% Light Tax 5% 5% Water 2% Total 11% 15%
City Sanitation Plan - Draft Rourkela Municipality
27

The demand and collection of the taxes is shown in the following table.
Table 12 : Tax Demand and Collection in Rourkela
Sl. No. Subject 2007-08 2008-09 2009-10 2010-11 1 Demand
Arrear
1,51,57,583.00
1,34,35,752.00
1,41,08,453.00
1,40,93,498.00
Current
42,02,619.00
42,02,619.00
42,02,619.00
1,20,77,022.00
Total
1,93,60,202.00
1,76,38,371.00
1,83,11,072.00
2,61,70,520.00 2 Collection
Arrear
39,31,310.00
15,83,220.00
20,03,108.00
33,52,415.00
Current
19,93,140.00
19,46,698.00
22,14,466.00
56,78,850.00
Total
59,24,450.00
35,29,918.00
42,17,574.00
90,31,265.00 3 Balance
Arrear
1,12,26,273.00
1,18,52,532.00
1,21,05,345.00
1,07,41,083.00
Current
22,09,479.00
22,55,921.00
19,88,153.00
63,98,172.00
Total
1,34,35,752.00
1,41,08,453.00
1,40,93,498.00
1,71,39,255.00
The collection efficiency varies in a range of 40% - 50% leading to increased arrears.
Key Issues
• Cash based single entry accounting system is followed
• Accounting system has not been computerized
• Ring fencing of expenditure not practiced
• Collection efficiency is low
• Revenue from own source is very low raising serious questions on self sustainability approach
City Sanitation Plan - Draft Rourkela Municipality
28
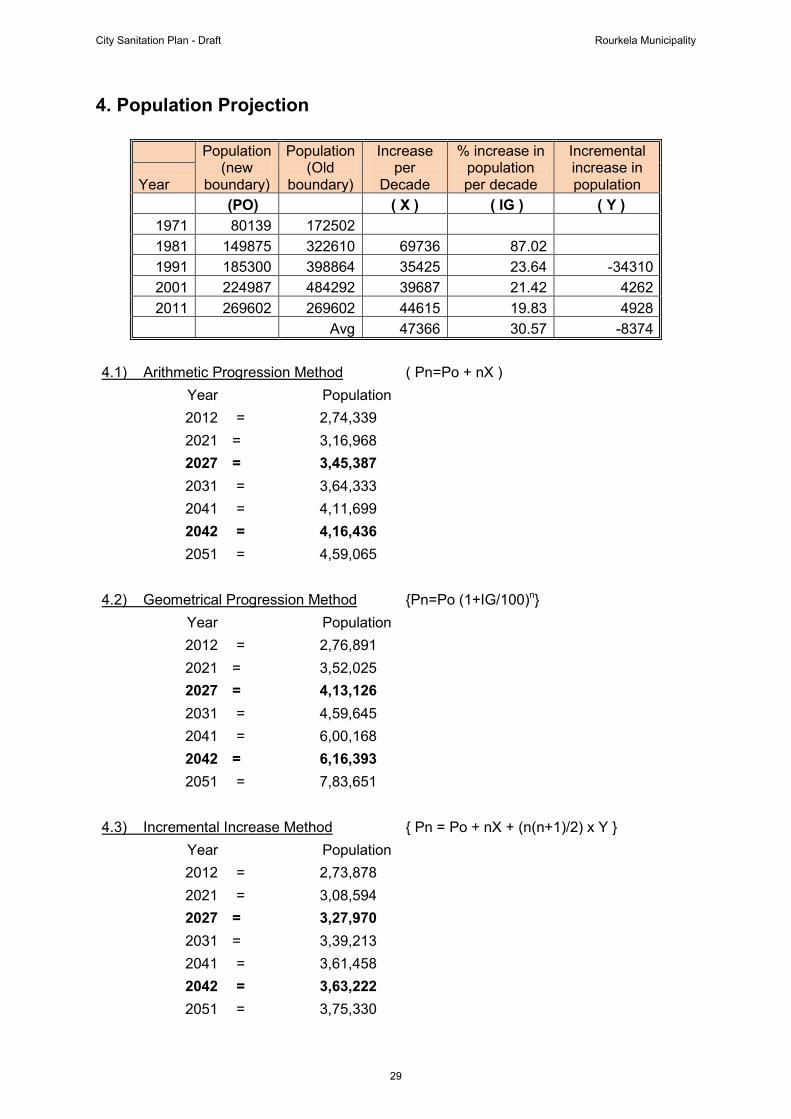
4. Population Projection
Population
(new boundary)
Population (Old
boundary)
Increase per
Decade
% increase in population per decade
Incremental increase in population Year
(PO)
( X ) ( IG ) ( Y ) 1971 80139 172502
1981 149875 322610 69736 87.02 1991 185300 398864 35425 23.64 -34310
2001 224987 484292 39687 21.42 4262 2011 269602 269602 44615 19.83 4928
Avg 47366 30.57 -8374
( Pn=Po + nX ) 4.1) Arithmetic Progression Method Year
Population
2012 = 2,74,339 2021 = 3,16,968 2027 = 3,45,387 2031 = 3,64,333 2041 = 4,11,699 2042 = 4,16,436 2051 = 4,59,065
{Pn=Po (1+IG/100)4.2) Geometrical Progression Method n
Year }
Population
2012 = 2,76,891 2021 = 3,52,025 2027 = 4,13,126 2031 = 4,59,645 2041 = 6,00,168 2042 = 6,16,393 2051 = 7,83,651
{ Pn = Po + nX + (n(n+1)/2) x Y } 4.3) Incremental Increase Method Year
Population
2012 = 2,73,878 2021 = 3,08,594 2027 = 3,27,970 2031 = 3,39,213 2041 = 3,61,458 2042 = 3,63,222 2051 = 3,75,330
City Sanitation Plan - Draft Rourkela Municipality
29

4.4)
Graphical method
Year Population1991 = 182916
2001 = 224987
2011 = 269602
2012 = 274064
2021 = 314217
2027 = 3409862031 = 358832
2041 = 403447
2042 = 4079092051 = 448062
y = 44615x + 180372
050000
100000150000200000250000300000350000400000450000
1991 2001 2011 2021 2031 2041
Popu
latio
n
Year
Rourkela Population
Population
Projection
City Sanitation Plan - Draft Rourkela Municipality
30
5. Waste Water Management
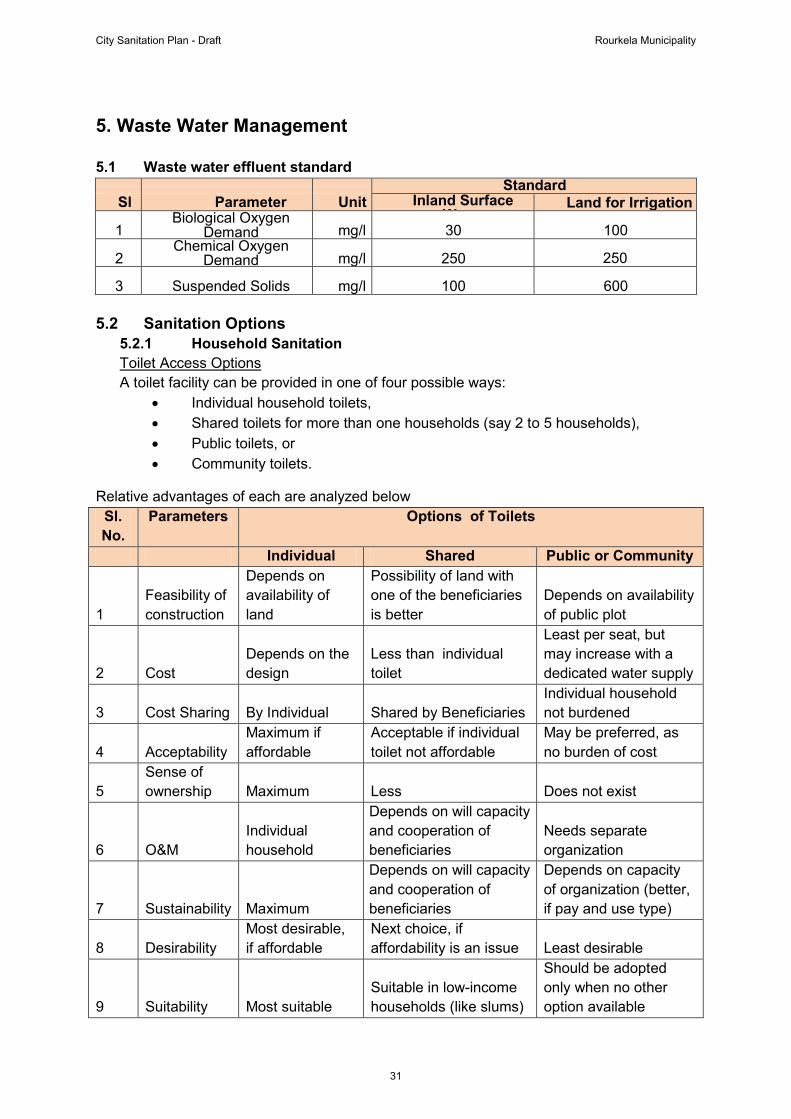
5.1 Waste water effluent standard Sl
Parameter
Unit
Standard Inland Surface
W Land for Irrigation
1
Biological Oxygen Demand
mg/l
30
100
2 Chemical Oxygen
Demand mg/l 250 250
3 Suspended Solids mg/l 100 600
5.2 Sanitation Options5.2.1 Household Sanitation
A toilet facility can be provided in one of four possible ways: Toilet Access Options
• Individual household toilets, • Shared toilets for more than one households (say 2 to 5 households), • Public toilets, or • Community toilets.
Relative advantages of each are analyzed below Sl.No.
Parameters Options of Toilets
Individual Shared Public or Community
1 Feasibility of construction
Depends on availability of land
Possibility of land with one of the beneficiaries is better
Depends on availability of public plot
2 Cost Depends on the design
Less than individual toilet
Least per seat, but may increase with a dedicated water supply
3 Cost Sharing By Individual Shared by Beneficiaries Individual household not burdened
4 Acceptability Maximum if affordable
Acceptable if individual toilet not affordable
May be preferred, as no burden of cost
5 Sense of ownership Maximum Less Does not exist
6 O&M Individual household
Depends on will capacity and cooperation of beneficiaries
Needs separate organization
7 Sustainability Maximum
Depends on will capacity and cooperation of beneficiaries
Depends on capacity of organization (better, if pay and use type)
8 Desirability Most desirable, if affordable
Next choice, if affordability is an issue Least desirable
9 Suitability Most suitable Suitable in low-income households (like slums)
Should be adopted only when no other option available
City Sanitation Plan - Draft Rourkela Municipality
31

ChoiceIt is desirable to choose an alternative, which is affordable, sustainable and likely to be most used and well maintained. It is recommended to provide individual toilets to most of the households. Where individual households cannot afford, have no suitable land for construction, and ar e willing t o sh are a facility, sh ared toilets should be pr omoted. Surveys also reveal that, in a few cases, households with individual toilets may be defecating i n the open. A co nsiderable e ffort of c reating aw areness and ch ange i n attitude is called for.
5.2.2 Options for collection, treatment & Disposal of Waste Water
Domestic waste water generated at the household level, including the waste from toilets, can be disposed of either on-site of off-site or a combination of both. Possible options are:
• Fully on-site disposal (septic tanks or soak pits) • Local sewer network (small-bore sewerage or decentralized waste water
treatment system), • Centralized or decentralized full-scale sewerage system • Combined system
a. Fully on Site sanitation systemFully on site sanitation arrangements will be involve on-plot treatment and disposal of all domestic waste water. This is achieved by using on-plot sanitation technologies--- septic tanks and soak pits--- to receive and treat the entire waste water flow from the household. However, it is recommended that the septage (sludge from septic tank) is removed and transferred to another location for further treatment and final disposal.
In this option, all discharge of domestic waste water resulting from bathing, washing, cooking, cleaning and usage of toilets is treated in the septic tank. The septic tank effluent is disposal in dispersion trenches or soak pits. Septage is periodically cleared and taken away to a common treatment facility.
Septic tank with soak pits
Wastewater from the l atrine is discharged i nto soak pi t i n t his option. Waste water from domestic use, such as domestic waste water from bathing, washing, cooking, cleaning, etc. is also disposed into another soak pit. For an uninterrupted and proper functioning, it is recommended to use a set of two pits.
Twin soak pits (Leach pits)
It will be necessary to set up an effluent septage collection system, operated by either the Municipality Corporation or a private agency. Appropriate regulation and monitoring mechanisms, in respect of septic tanks and septage handling and disposal, need to introduced. Suggested septage treatment consists of septage drying beds consisting of sa nd filters for dewatering the sl udge. This requires low capital and has low O&M and technical requirements; thus, it can be operated easily. The dried sludge cakes can be used as fertilisers.
Septage Management
City Sanitation Plan - Draft Rourkela Municipality
32
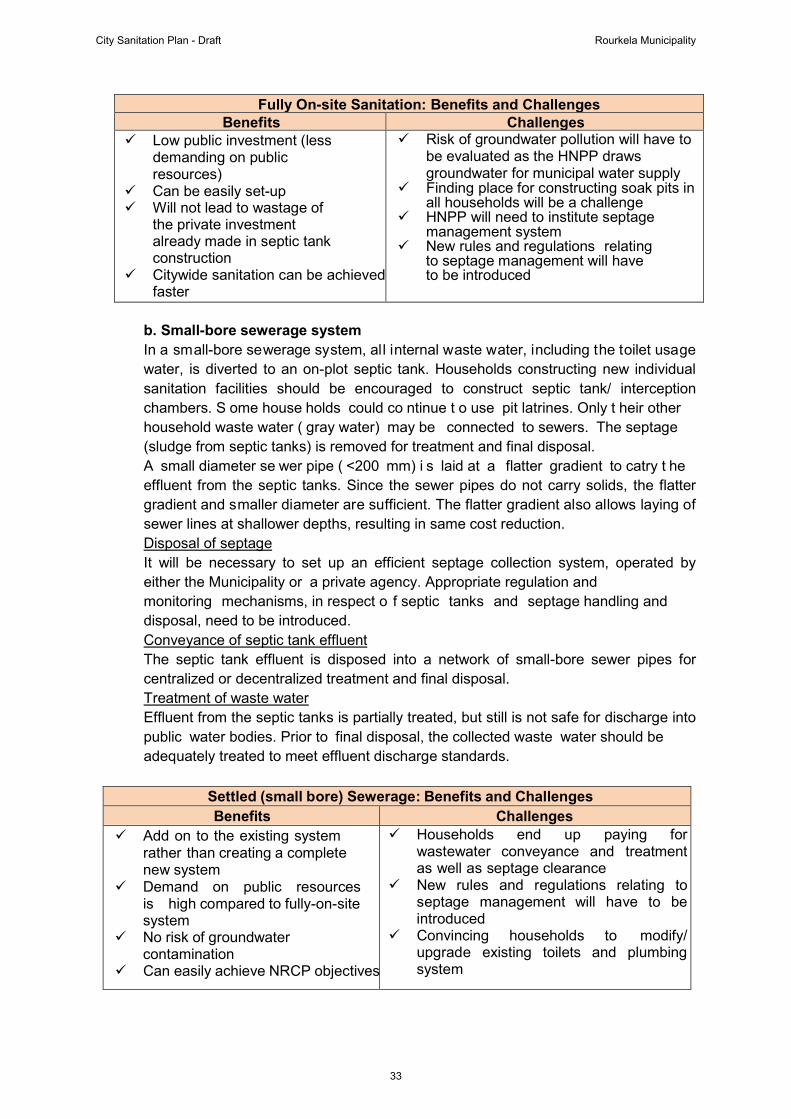
Fully On-site Sanitation: Benefits and Challenges Benefits Challenges
Low public investment (less demanding on public resources)
Can be easily set-up Will not lead to wastage of
the private investment already made in septic tank construction
Citywide sanitation can be achieved faster
Risk of groundwater pollution will have to be evaluated as the HNPP draws groundwater for municipal water supply
Finding place for constructing soak pits in all households will be a challenge
HNPP will need to institute septage management system
New rules and regulations relating to septage management will have to be introduced
b. Small-bore sewerage systemIn a small-bore sewerage system, all internal waste water, including the toilet usage water, is diverted to an on-plot septic tank. Households constructing new individual sanitation facilities should be encouraged to construct septic tank/ interception chambers. S ome house holds could co ntinue t o use pit latrines. Only t heir other household waste water ( gray water) may be connected to sewers. The septage (sludge from septic tanks) is removed for treatment and final disposal. A small diameter se wer pipe ( <200 mm) i s laid at a flatter gradient to catry t he effluent from the septic tanks. Since the sewer pipes do not carry solids, the flatter gradient and smaller diameter are sufficient. The flatter gradient also allows laying of sewer lines at shallower depths, resulting in same cost reduction.
It will be necessary to set up an efficient septage collection system, operated by either the Municipality or a private agency. Appropriate regulation and monitoring mechanisms, in respect o f septic tanks and septage handling and disposal, need to be introduced.
Disposal of septage
The septic tank effluent is disposed into a network of small-bore sewer pipes for centralized or decentralized treatment and final disposal.
Conveyance of septic tank effluent
Effluent from the septic tanks is partially treated, but still is not safe for discharge into public water bodies. Prior to final disposal, the collected waste water should be adequately treated to meet effluent discharge standards.
Treatment of waste water
Settled (small bore) Sewerage: Benefits and Challenges Benefits Challenges
Add on to the existing system rather than creating a complete new system
Demand on public resources is high compared to fully-on-site system
No risk of groundwater contamination
Can easily achieve NRCP objectives
Households end up paying for wastewater conveyance and treatment as well as septage clearance
New rules and regulations relating to septage management will have to be introduced
Convincing households to modify/ upgrade existing toilets and plumbing system
City Sanitation Plan - Draft Rourkela Municipality
33

c. Sewerage systemThis alternative i ncludes a pr oposal for a r egular se werage net work ( either a local simplified network or an elaborate citywide network) to collect the waste water f rom the households. The network is normally laid through most of the town. Waste water is collected at different locations in the decentralized systems and is treated before final disposal or reuse. In a ce ntralized system(s), the waste water is collected at a central location(s) for treatment and final disposal or reuse (like land irrigation). Whether a series of de centralized system i s feasible depends on land availability. Otherwise, a centralized treatment plant for the whole (or major) part of the city may be proposed. A detailed topographical and l and availability survey will be necessary to determine the feasibility and required number of decentralized waste water treatment plants. In the area covered with a sewerage network, efforts should be made t o connect al l households to t he sewerage network. Even i n t his alternative, there i s a possibility t hat a few households will still be served by on-site sanitation systems – mainly pit latrines. Under this option, the following household/ public sanitation and waste treatment and disposal arrangements will be possible. The choice of between decentralized vs. centralized mainly depends on feasibility in terms of availability of land for decentralized systems, their acceptability to the people and cost (both capital and O&M).
d. Decentralized systemsDecentralized systems are feasible and desirable in areas that are isolated and have space t o acco mmodate sm all m ultiple w aste w ater treatment pl ants and disposal systems. S ince these systems are localized small systems, they will be simpler for operation and m aintenance. It may be al so possible to form local committees or co-operative societies, which may take up the O&M of these plants. A substantial community effort, of course, will be nece ssary. If this is not feasible and achievable, the alternative is to outsource the O&M to a private party. A third alternative is for the Municipal C orporation t o t ake ov er t his responsibility. H owever t he O &M co st and manpower requirement is high. The biggest constraint is the availability of land. Decentralized waste water treatment systems (DEWATS) technology has been developed and promoted by BORDA (Bremen Overseas Research and Development Association). The system provides treatment for waste water from both domestic and industrial so urces, esp ecially f rom s mall and i solated ar eas. The ca pacity r anges from 1 to 500 cum per day. It works without electrical energy, guarantees permanent and continuous operation, with occasional fluctuation in effluent quality, and is best suited where skilled and responsible operation and maintenance cannot be guaranteed. DEWATS is based on four treatment systems:
• Sedimentation and pr imary t reatment in sedimentation ponds, septic tanks or imhoff tanks (septic tanks being more familiar in cities like Rourkela)
• Secondary anaerobic treatment in fixed bed filters or baffled septic tanks (baffled reactors).
• Secondary and tertiary aerobic/ anaerobic treatment in constructed wetlands (subsurface flow filters).
• Secondary and tertiary aerobic/ anaerobic treatment in ponds.
City Sanitation Plan - Draft Rourkela Municipality
34

Combination of primary treatment (a) with any of the other systems mentioned above is done in accordance with the quality of the waste water influent and desired effluent quality
Decentralised Wastewater Treatment: Benefits and Challenges Benefits Challenges
Most of the wastewater is treated off-site
No need to augment a water supply Low maintenance No risk of groundwater
contamination No dependence on power
supply for operation Simple operation and maintenance
Both capital intensive system High O&M cost Management is difficult Households will have to invest
substantial amount in upgrading Convincing households to modify/
upgrade existing toilets and plumbing system
e. Centralized systemsIn ar eas, l ike t he co re c ity wards, densi ty o f population i s high, open plots are not likely to be available, and peopl e may not accept multiple treatment a nd disposal systems within the vicinity. Hence, localized dispersed systems may not be feasible. A centralized system, which collects the waste water from a large city area through a sewer net work and conveys it t o a ce ntral, l arge-size t reatment plant and di sposal system, may beco me imperative. S uch a system w ill be more ex pensive t han t he decentralized systems for the same area, but may be bet ter for unitary control over its O&M. T he responsibility will be taken over by Municipality and participation of the beneficiary population will be limited. Sewerage treatment plants have, basically, three stages of treatment:
• Pre-treatment for removal of large floating, suspended and settlement inorganic solids in screens and grit removal chambers.
• Primary treatment for removal of organic and inorganic settleable solids. • Secondary biological treatment for conversion of organic matter into
settleable boi-floc and stable inorganic matter (like in aerobic processes) or into methane gas, carbon dioxide and stable organic residue (as in anaerobic processes)
Centralised Sewerage: Benefits and Challenges Benefits Challenges
All of the wastewater is treated off-site
Initial investment of individual resident is very low
Low user fee Demand on public resources is high
compared to fully-on-site system Less risk of groundwater
contamination
Both capital and O&M intensive option
Convincing households to modify/ upgrade existing toilets and plumbing system
High on operation and maintenance Power outages may interrupt wastewater treatment
City Sanitation Plan - Draft Rourkela Municipality
35
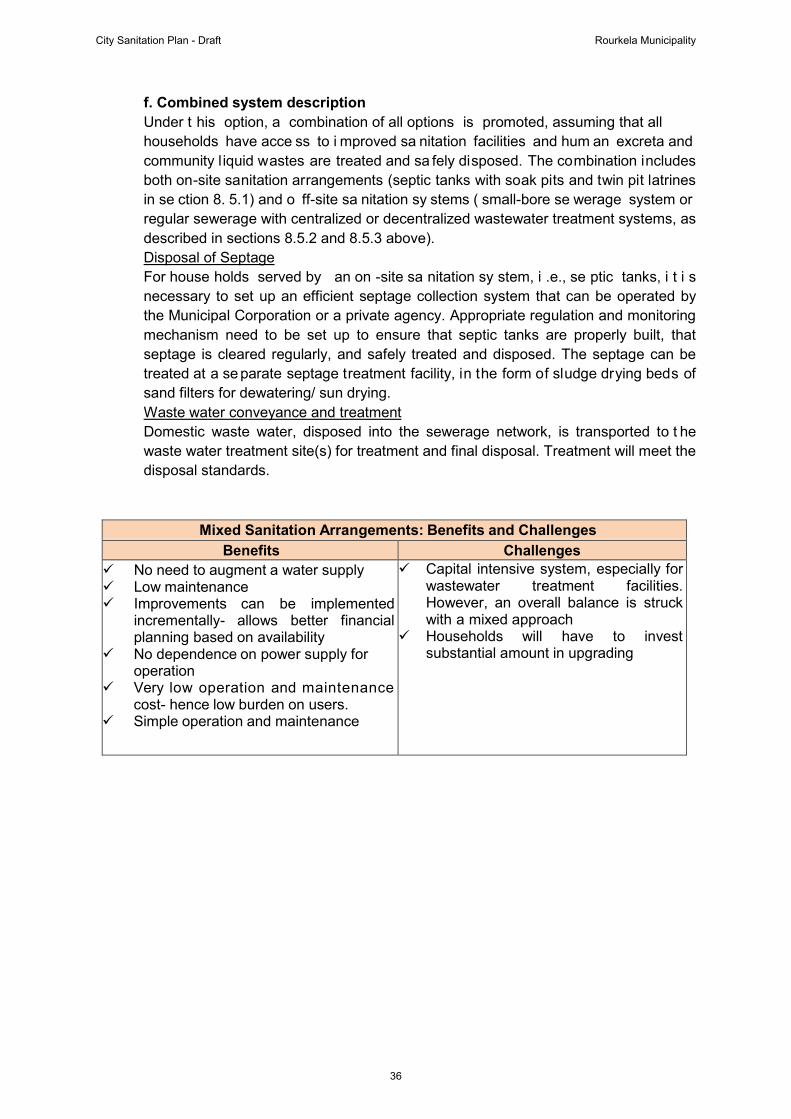
f. Combined system description Under t his option, a combination of all options is promoted, assuming that all households have acce ss to i mproved sa nitation facilities and hum an excreta and community l iquid wastes are treated and sa fely disposed. The combination includes both on-site sanitation arrangements (septic tanks with soak pits and twin pit latrines in se ction 8. 5.1) and o ff-site sa nitation sy stems ( small-bore se werage system or regular sewerage with centralized or decentralized wastewater treatment systems, as described in sections 8.5.2 and 8.5.3 above).
For house holds served by an on -site sa nitation sy stem, i .e., se ptic tanks, i t i s necessary to set up an efficient septage collection system that can be operated by the Municipal Corporation or a private agency. Appropriate regulation and monitoring mechanism need to be set up to ensure that septic tanks are properly built, that septage is cleared regularly, and safely treated and disposed. The septage can be treated at a se parate septage treatment facility, in the form of sludge drying beds of sand filters for dewatering/ sun drying.
Disposal of Septage
Domestic waste water, disposed into the sewerage network, is transported to t he waste water treatment site(s) for treatment and final disposal. Treatment will meet the disposal standards.
Waste water conveyance and treatment
Mixed Sanitation Arrangements: Benefits and Challenges Benefits Challenges
No need to augment a water supply Low maintenance Improvements can be implemented
incrementally- allows better financial planning based on availability
No dependence on power supply for operation
Very low operation and maintenance cost- hence low burden on users.
Simple operation and maintenance
Capital intensive system, especially for wastewater treatment facilities. However, an overall balance is struck with a mixed approach
Households will have to invest substantial amount in upgrading
City Sanitation Plan - Draft Rourkela Municipality
36
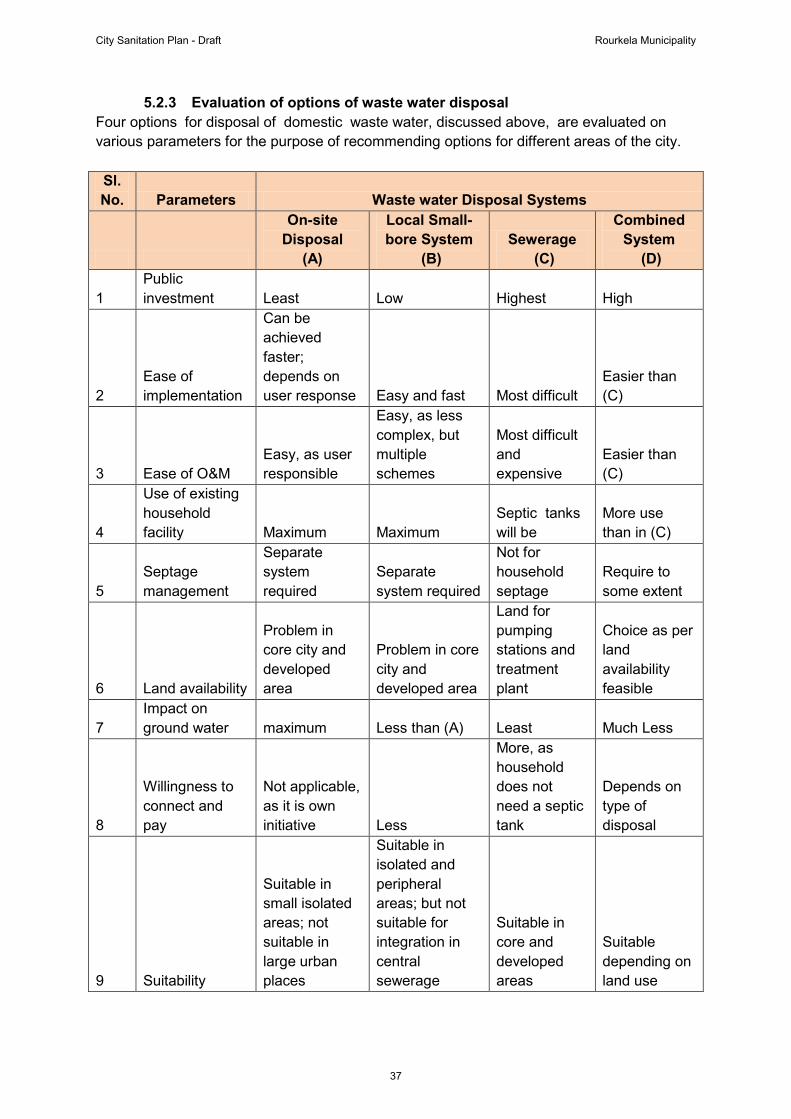
5.2.3 Evaluation of options of waste water disposalFour options for disposal of domestic waste water, discussed above, are evaluated on various parameters for the purpose of recommending options for different areas of the city. Sl.No. Parameters Waste water Disposal Systems
On-siteDisposal
(A)
Local Small-bore System
(B)Sewerage
(C)
CombinedSystem
(D)
1 Public investment Least Low Highest High
2 Ease of implementation
Can be achieved faster; depends on user response Easy and fast Most difficult
Easier than (C)
3 Ease of O&M Easy, as user responsible
Easy, as less complex, but multiple schemes
Most difficult and expensive
Easier than (C)
4
Use of existing household facility Maximum Maximum
Septic tanks will be
More use than in (C)
5 Septage management
Separate system required
Separate system required
Not for household septage
Require to some extent
6 Land availability
Problem in core city and developed area
Problem in core city and developed area
Land for pumping stations and treatment plant
Choice as per land availability feasible
7 Impact on ground water maximum Less than (A) Least Much Less
8
Willingness to connect and pay
Not applicable, as it is own initiative Less
More, as household does not need a septic tank
Depends on type of disposal
9 Suitability
Suitable in small isolated areas; not suitable in large urban places
Suitable in isolated and peripheral areas; but not suitable for integration in central sewerage
Suitable in core and developed areas
Suitable depending on land use
City Sanitation Plan - Draft Rourkela Municipality
37
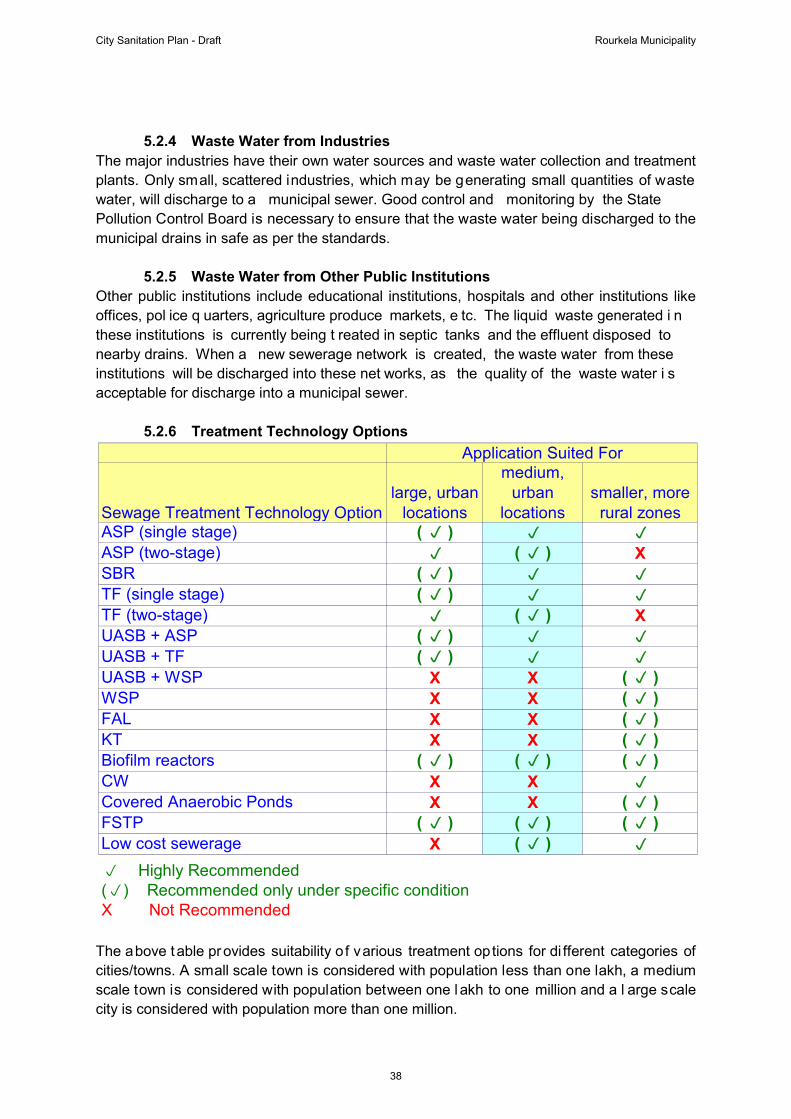
5.2.4 Waste Water from IndustriesThe major industries have their own water sources and waste water collection and treatment plants. Only small, scattered industries, which may be generating small quantities of waste water, will discharge to a municipal sewer. Good control and monitoring by the State Pollution Control Board is necessary to ensure that the waste water being discharged to the municipal drains in safe as per the standards.
5.2.5 Waste Water from Other Public InstitutionsOther public institutions include educational institutions, hospitals and other institutions like offices, pol ice q uarters, agriculture produce markets, e tc. The liquid waste generated i n these institutions is currently being t reated in septic tanks and the effluent disposed to nearby drains. When a new sewerage network is created, the waste water from these institutions will be discharged into these net works, as the quality of the waste water i s acceptable for discharge into a municipal sewer.
5.2.6 Treatment Technology Options
The above table provides suitability o f various treatment options for di fferent categories of cities/towns. A small scale town is considered with population less than one lakh, a medium scale town is considered with population between one l akh to one million and a l arge scale city is considered with population more than one million.
Sewage Treatment Technology Optionlarge, urban
locations
medium, urban
locationssmaller, more
rural zonesASP (single stage) ( p ) p p
ASP (two-stage) p ( p ) XSBR ( p ) p p
TF (single stage) ( p ) p p
TF (two-stage) p ( p ) XUASB + ASP ( p ) p p
UASB + TF ( p ) p p
UASB + WSP X X ( p )WSP X X ( p )FAL X X ( p )KT X X ( p )Biofilm reactors ( p ) ( p ) ( p )CW X X p
Covered Anaerobic Ponds X X ( p )FSTP ( p ) ( p ) ( p )Low cost sewerage X ( p ) p
Application Suited For
(p) Recommended only under specific conditionX Not Recommended
p Highly Recommended
City Sanitation Plan - Draft Rourkela Municipality
38

5.3 Strategy5.3.1 Water Supply
Water supply coverage has to be increased along with equitable distribution. There is adequacy of production capacity with two water treatment plant with total capacity of 79 MLD which ca n ca ter to t he future dem and o f nex t 30 y ears. However al l t he w ards are not properly covered by distribution system and also there are growth centers within and outside the Municipal limits. Hence it has become important for implementation of a planned distribution system to best utilise the available capacity.
5.3.2 Sewerage Zoning
KANTAJHAR
JAGAD
BONDAMUNDA
ROURKELASTEEL PLANT
2
H LL
H LL
FERTILISER PLANT
KOEL NAGAR
I.G PARK
TO HOWRAH
TO BISRA
O ROURKELA
AERODROME
VEDVYAS TEMPLE
DURGAPUR R.F
W 29W 28
W 30
W
W 2
W
6
3
W 7W
10 1
W 7W 2 W 5
6 2
W9
W 15
H C
D OG 0N
CI I OWNSHI
l o ce
RING ROAD
ANUMAN
JHIRPANI
1
INDUSTRIALTOWNSHIP AREA
1
W 2
6
W 21
W 9
R NG ROAD
ST
The municipal area have been divided into two sewerage zones based on the topography and ar ea contour. Zone 1 co nsists of ward no 28, 29 and 30 with present popul ation of 23915 and zone 2 consists of rest of the 33 wards with present population of 245687.
5.3.3 Household sanitation• Objective is to achieve 100% access to sanitary toilets to all residents • Provide i ncentives for e ncouraging i ndividual t oilets to peopl e w ho ca n afford and
available space • Support subsidies for individual toilets for low income households • Provide shared or community toilets for slum clusters where individual toilets are not
feasible • Ensure adequate toilet facility in institutions like schools, colleges, offices, shopping
complex etc. • Public toilets at all public places (markets, bus stand, etc.) • Structured communication for regular usage and maintenance of toilets • Encourage community management of community/public toilets and encourage cost
recovery
Zone 1
ZONE 2
STP
STP
City Sanitation Plan - Draft Rourkela Municipality
39

5.3.4 Collection and Treatment systemThe treatment option to be adopted in the context of Odisha has been considered with the following issues in the background
• There i s no regulatory f ramework, pol icy or guideline f or on site sanitation system. On the contrary the Water Works Rule proposed amendment proposes for compulsorily phasing out all the septic tanks once the sewerage network are provided
• Most of the cities in Odisha have more than 30% slum population which are highly unorganised settlements
• Due to lack of strong building by law and monitoring mechanism, most of the houses being constructed in cities across Odisha cover 90% of the plot area without much space. This leads to construction of under designed septic tank or discharge to drain. The possible exception could be Bhubaneswar after 2008
• The Govt. lands available within the municipal limits are few in numbers and small. More over the land o wnership lies with revenue department and not with the municipality.
• All t he apartments are being directed to i nstall their own t reatment and drainage facility
• The National bench mark for ‘coverage of sewerage network’ is 100% which means the entire city should be connected with a sewer collection system
• The pr imary su rvey reveals that residents prefer connectivity t o sewerage network even if they have individual septic tank
• Going by the logic o f economy of scale, community facility i s always cheaper for operation and maintenance
• Odisha water rules provides for compulsory connection to available sewerage network
In v iew of the above situation the sanitation strategy adopted for developing CSP i s as follows
• Utmost priority i s given f or net work co llection sy stem based on the feasibility. T he factors influencing the feasibility in a ar ea are number of individual toilets, feasibility of laying sewer pipe line, growth potential etc.
• Areas where co llection network i s not feasible or t he ut ility co rridor i s very narrow, small bore system should be adopted
• On site sanitation should be promoted where new colonies are developing or community t oilets are not within close pr oximity of t he proposed/available network, provided adequate space is available within the property
• Adequate measures are taken in terms of regulatory frame work for implementation of properly designed system and a proper septage management policy is in place.
• Increase coverage of sewerage network and connections to achieve national benchmark
• In view of the constraint of land availability, resident’s objection and increased cost of O&M, a centralized system is more preferable to decentralized system within a gravity zone.
• Decentralized system shall be preferred in areas of uneven terrain which might call for a number of pumping stations or the gravity flow demands higher depths
City Sanitation Plan - Draft Rourkela Municipality
40
• Off site treatment and disposal coupled with onsite septage management for existing community/individual septic tanks to manage the sanitation system as a intermediate arrangement before transiting to full fledged collection network. This would also support phasing of investment and improve financial feasibility position.
• Adopt natural bio-degradation technologies economically feasible and locally suitable and minimise energy requirement in transport and treatment of sewage
• Citizen’s aspiration is provided the maximum importance • Importance has to be attached to critical issues of sludge management, odour control
and mosquito menace • Encourage recycled and reuse of treated effluent water for non portable purpose
5.4 Option Analysis Various treatment options are analysed based on the topography of the area, existing infrastructure, so cio-economic status and i mplementation feasibility. T he si tuation anal ysis reveals that the old Rourkela area is a more of a planned city. The colonies are well planned with accessible internal roads. The socio economic profile of t he city reveals that the average income of the residents are quite reasonable or high. Even the slums are resided by workers with average monthly income of 8000-10000. The f ield survey and discussion with the officials suggests that most of the septic tanks and soak pits are under designed due to space constraint. At many places the overflow effluent is discharged to the open drain. This leads to ground water contamination. The factor affecting choice of treatment options for the various zones are as follows
• Most of the colonies are well planned Zone 1 & 2
• Roads are wider • Adjacent ar ea o f these zones are pot ential gr owth centres and t he l and pr ices are
quite high • Availability of land is a issue • Strong public opinion not to have sewerage treatment within the residential area • Shortage of operational manpower with the ULB • Proper topography of the area • Existing sewerage system in part of zone 1 • Slum ar eas ar e w ell ac cessible and hav e been pr ovided w ith so me o f the basi c
amenities like road & water • High degree of individual toilets in slum households as well • Better paying capacity of the slum as well as non slum residents
Orissa Water supply & Sewerage Board is a organisation under H &UD department, Government of Odisha, responsible for implementation of sewerage schemes in cities of Odisha. They are preparing a D PR for implementation o f sewerage system in Sambalpur. The DPR preparation is in process and the data could not be shared by the Board. It i s proposed to hav e sewerage co llection net work w ith ce ntralised Sewerage Treatment Plant in all the zones. ASP or SBR treatment process is proposed for these zones.
City Sanitation Plan - Draft Rourkela Municipality
41

5.5 Policy Framework• City sanitation should be fore seen in the light of NUSP and OUSS• The ULB needs to take care to prevent any kind of increase or growth of slums• The vision for slum free city needs to be drawn up and implemented• Building by laws should be strictly implemented for proper sanitation facility • Strict regulatory frame work should be embedded into the existing system in respect
of sanitation issues• Adequate steps needs to be taken for addressing the housing need of EWS/LIG and
migrating population
5.6 Planning5.6.1 Assumptions & Data
The City Sanitation Planning is based on a set of data and certain assumptions which very much city specific and are based on the following factors
• Available data • Citizen need and aspirations • Field survey findings • Need assessment • Stakeholder consultations • Existing situation and limitations • Service providers priority
Base year : 2012 Design Year : 2042 Sewerage network Design : 2042 STP design : 2027 Target Year : 2017 Implementation period : 2012 – 2017 Average Per capita water demand : 135 LPCD Sewage Generation : 110 LPCD (80% of water supply)
Data
Zone 1
Data Description UnitNon
slum SlumSubtotal
Population Nos 20134 3781 23915 Number of households Households 3643 924 4567 Number of community toilets Number 0 Number of seats in community toilets Number 0 Households with individual toilets Households 3502 745 4247 Households with sharing toilets Households 141 127 268 Households practicing open defecation Households 0 52 52 Slum households using community toilets Households 0 Total Road length Km 50 Available sewer length Km 35
City Sanitation Plan - Draft Rourkela Municipality
42

Zone 1
Data Description UnitNon
slum SlumSubtotal
Persons per house persons 5.2 Individual toilets under construction Toilets 0 Number of Public toilets Toilets 0 Number of community toilets under construction Toilets 0 Bituminous road length Km 24.09 Cement concrete Km 23.53 Mettal road length Km 0.95 Kacha road length Km 1.51 Pucca road length Km 48.49 Zone 2
Data Description Unit
Nonslum Slum
Subtotal
Population Nos 134695 110992 245687 Number of households Household 30252 24420 54672 Number of community toilets Number 0 Households with individual toilets Household 28488 17757 46245 Households with sharing toilets Household 1764 1943 3707 Households practicing open defecation Household 0 4720 4720 Slum households using community toilets Household 0 Total Road length Km 579 Available sewer length Km 0 Persons per house persons 4.5 Individual toilets under construction Toilets 262 Number of Public toilets Toilets 5 Number of Public toilet seats Seats 50 Number of community toilets under construction Toilets 0 Bituminous road length Km 278.91 Cement concrete Km 272.47 Metal road length Km 11.05 Kacha road length Km 17.49 Pucca road length Km 561.51 Total
Data Unit TotalPopulation Nos 269602 Number of households Households 59239 Number of community toilets Number 0 Households with individual toilets Households 50492
City Sanitation Plan - Draft Rourkela Municipality
43

Total
Data Unit TotalHouseholds with sharing toilets Households 3975 Households practicing open defecation Households 4772 Slum households using community toilets Households 0 Total Road length Km 629 Available sewer length Km 35 Persons per house persons 4.6 Individual toilets under construction Toilets 262 Number of Public toilets Toilets 5 Number of Public toilet seats Seats 50 Number of community toilets under construction Toilets 0 Bituminous road length Km 303 Cement concrete Km 296 Metal road length Km 12 Kacha road length Km 19 Pucca road length Km 610
Assumption
Assumptions Unit Value Road length with possibility for laying sewers in pucca roads % 95% Road length with possibility for laying sewers in kucha roads % 60% Toilets connected to sewers % 94% Computed Toilets connected to soak pits % 6% Computed No. of households sharing one toilet in a shared toilet Number 2 Number of seats per public toilet Number 5 Number of seats per community toilet Number 10
Number of users for community toilet per seat Number 35 Number of users for public toilet per seat Number 60
Zone 1 Zone 2
Non Slum road length based on HH density % 84% 55% Slum road length based on HH density % 16% 45% Road cutting and restoration required % 95% 95%
Cost Cost of individual toilet connected to sewer Rs. 8,000.00 Per no.
Cost of individual toilet connected to soak pit Rs. 10,000.00 Per no. Cost of community toilet connected to septic tank (10 Seater) Rs. 6,60,000.00 Per no. Cost of community toilet connected to sewer(10 Seater) Rs. 2,40,000.00 Per no. Cost of pumping station Rs. 25,00000.00 Per no. Cost of STP Rs. 75,00,000.00 Per MLD
City Sanitation Plan - Draft Rourkela Municipality
44

5.6.2 Sewage Generation Zone 1 2 Population 2011 23915 245687 % 9% 91%
Year Population Water supply
(MLD) Total Sewage
generation (MLD) Zone 1 (MLD)
Zone 2 (MLD)
2012 270098 36.4 29.7 2.6 27.1 2027 340986 46.0 37.5 3.3 34.2 2042 407909 55.0 44.9 4.0 40.9
5.6.3 Pipe Cost Comparative statement
Sl.No. Dia mm
Cost of GSW withCM joints andLabour/m
Cost of RCC withRubber joints andLabour/m Difference
1 100 142 264 122 2 150 217 272 55 3 200 450 286 164 4 225 313 313 5 250 627 338 289 6 300 1035 479 556
5.7 Infrastructure Need
Zone 1 & Zone 2
Sanitation development Unit Base Target BoQOpen Defecation % 25 0
Individual toilet coverage % 85% 92% HH covered under Community toilet coverage % 0% 1% HH Shared toilet coverage % 7% 7% Coverage of sewer connection % 0% 95% Number of individual toilets Number 50754 54500 3746 Total Number of shared toilets Number 1988 2073 86 Number of community toilet seats Number 0 17 17 Number of community toilets Number 0 2 2 Public Toilets Number 10 18 8 Number of Public Toilets seats Number 50 90 40 Number of Public Urinals Number 0 30 30 Number of sewer connection Number 0 50539 50539 Construction of sewerage networks Km 35 591 556 STP MLD 0 38 38
City Sanitation Plan - Draft Rourkela Municipality
45
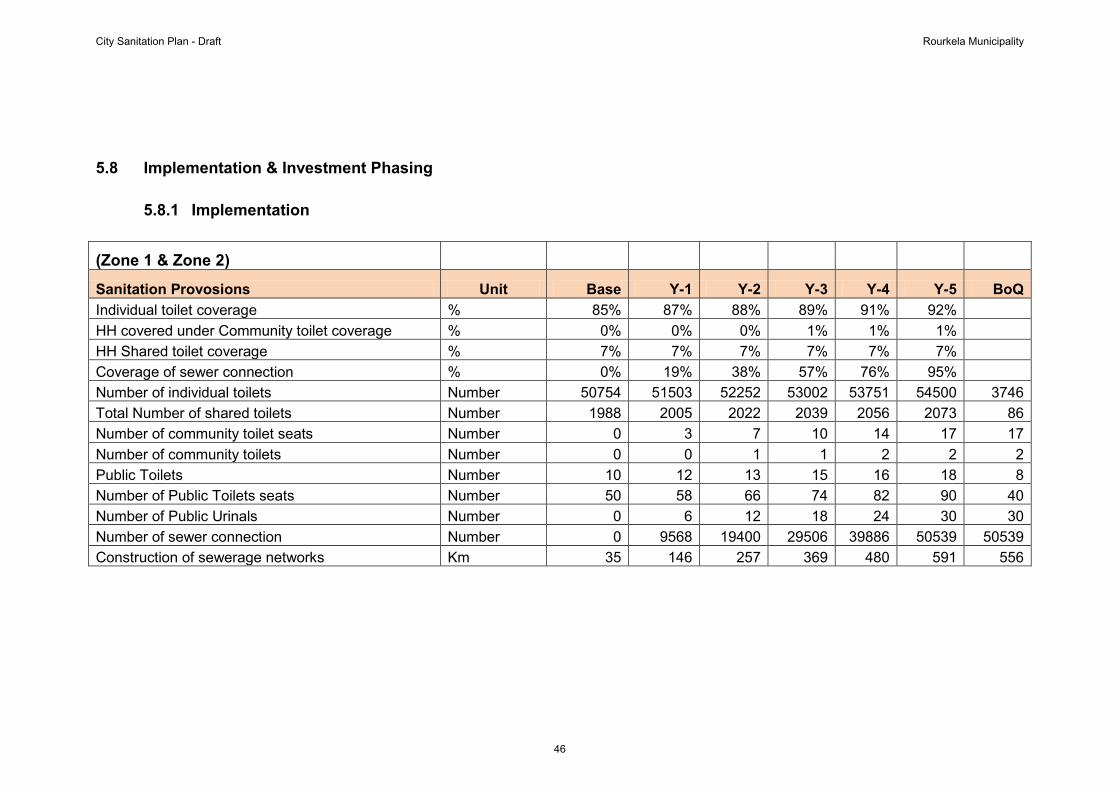
5.8 Implementation & Investment Phasing
5.8.1 Implementation
(Zone 1 & Zone 2)
Sanitation Provosions Unit Base Y-1 Y-2 Y-3 Y-4 Y-5 BoQIndividual toilet coverage % 85% 87% 88% 89% 91% 92% HH covered under Community toilet coverage % 0% 0% 0% 1% 1% 1% HH Shared toilet coverage % 7% 7% 7% 7% 7% 7% Coverage of sewer connection % 0% 19% 38% 57% 76% 95% Number of individual toilets Number 50754 51503 52252 53002 53751 54500 3746 Total Number of shared toilets Number 1988 2005 2022 2039 2056 2073 86 Number of community toilet seats Number 0 3 7 10 14 17 17 Number of community toilets Number 0 0 1 1 2 2 2 Public Toilets Number 10 12 13 15 16 18 8 Number of Public Toilets seats Number 50 58 66 74 82 90 40 Number of Public Urinals Number 0 6 12 18 24 30 30 Number of sewer connection Number 0 9568 19400 29506 39886 50539 50539 Construction of sewerage networks Km 35 146 257 369 480 591 556
City Sanitation Plan - Draft Rourkela Municipality
46
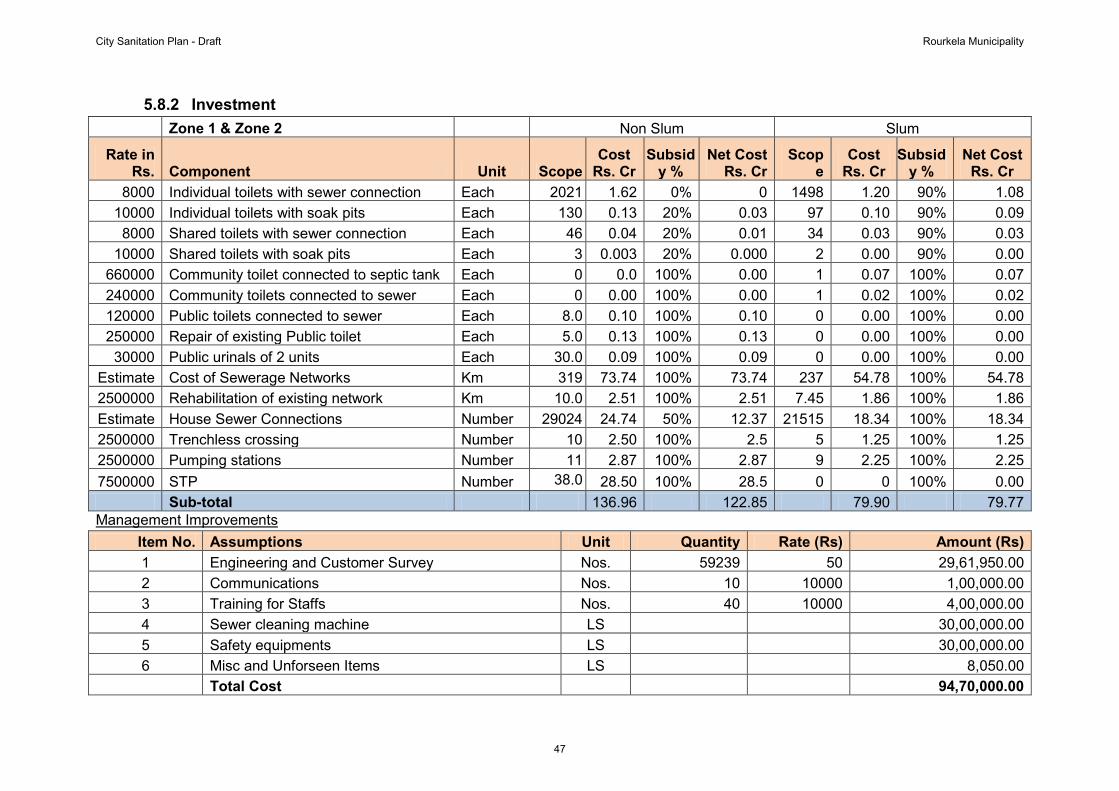
5.8.2 Investment Zone 1 & Zone 2 Non Slum Slum
Rate inRs. Component Unit Scope
CostRs. Cr
Subsidy %
Net CostRs. Cr
Scope
CostRs. Cr
Subsidy %
Net CostRs. Cr
8000 Individual toilets with sewer connection Each 2021 1.62 0% 0 1498 1.20 90% 1.08 10000 Individual toilets with soak pits Each 130 0.13 20% 0.03 97 0.10 90% 0.09 8000 Shared toilets with sewer connection Each 46 0.04 20% 0.01 34 0.03 90% 0.03
10000 Shared toilets with soak pits Each 3 0.003 20% 0.000 2 0.00 90% 0.00 660000 Community toilet connected to septic tank Each 0 0.0 100% 0.00 1 0.07 100% 0.07 240000 Community toilets connected to sewer Each 0 0.00 100% 0.00 1 0.02 100% 0.02 120000 Public toilets connected to sewer Each 8.0 0.10 100% 0.10 0 0.00 100% 0.00 250000 Repair of existing Public toilet Each 5.0 0.13 100% 0.13 0 0.00 100% 0.00 30000 Public urinals of 2 units Each 30.0 0.09 100% 0.09 0 0.00 100% 0.00
Estimate Cost of Sewerage Networks Km 319 73.74 100% 73.74 237 54.78 100% 54.78 2500000 Rehabilitation of existing network Km 10.0 2.51 100% 2.51 7.45 1.86 100% 1.86 Estimate House Sewer Connections Number 29024 24.74 50% 12.37 21515 18.34 100% 18.34 2500000 Trenchless crossing Number 10 2.50 100% 2.5 5 1.25 100% 1.25 2500000 Pumping stations Number 11 2.87 100% 2.87 9 2.25 100% 2.25 7500000 STP Number 38.0 28.50 100% 28.5 0 0 100% 0.00 Sub-total 136.96 122.85 79.90 79.77 Management Improvements
Item No. Assumptions Unit Quantity Rate (Rs) Amount (Rs)1 Engineering and Customer Survey Nos. 59239 50 29,61,950.00 2 Communications Nos. 10 10000 1,00,000.00 3 Training for Staffs Nos. 40 10000 4,00,000.00 4 Sewer cleaning machine LS 30,00,000.00 5 Safety equipments LS 30,00,000.00 6 Misc and Unforseen Items LS 8,050.00
Total Cost 94,70,000.00
City Sanitation Plan - Draft Rourkela Municipality
47

5.8.3 Investment Abstract
Rate inRs. Component Unit
Total(Cr. Rs.)
Subsidisedcost
(Cr. Rs.) Contingency
GrandTotal
(Cr. Rs.)
Grand Netsubsidised
Cost (Cr. Rs.)8000 Individual toilets with sewer connection Each 2.8 1.1 5% 3.0 1.1
10000 Individual toilets with soak pits Each 0.2 0.1 5% 0.2 0.1 8000 Shared toilets with sewer connection Each 0.1 0.0 5% 0.1 0.0
10000 Shared toilets with soak pits Each 0.0 0.0 5% 0.0 0.0
660000 Community toilets(10 Seat) connected to septic tank Each 0.1 0.1 10% 0.1 0.1
240000 Community toilets(10 seater) connected to sewer Each 0.0 0.0 10% 0.0 0.0
120000 Public toilets ( 10 seater) connected to sewer Each 0.1 0.1 5% 0.1 0.1 250000 Repair of existing Public toilet Each 0.1 0.1 5% 0.1 0.1 30000 Public urinals of 2 units Each 0.1 0.1 5% 0.1 0.1
Estimate Cost of Sewerage Networks Km 128.5 128.5 5% 134.9 134.9 2500000 Rehabilitation of existing network Km 4.4 4.4 5% 4.6 4.6 Estimate House Sewer Connections Number 43.1 30.7 5% 45.2 32.2 2500000 Trenchless crossing Number 3.8 3.8 5% 3.9 3.9 2500000 Pumping stations Number 5.1 5.1 5% 5.4 5.4 7500000 STP Number 28.5 28.5 0% 28.5 28.5
Sub-total 216.86 202.62 226.28 211.33 Estimate Management Improvements 0.95
1.50% Project management fee 3.17 5.00% Cost escalation 26.53
LS Miscellaneous Items 0.02 Grand total 242.00 Total Sewerage project cost is Rs. 242.00 Crores
City Sanitation Plan - Draft Rourkela Municipality
48
6.0 Solid Waste Management6.1 Objective:
Scientific management of MSW of the Rourkela City.
Ensure proper segregation, collection, transportation, processing and disposal of MSW generated in the townships.
Upgrade the existing facilities to minimize contamination of soil and water from the MSW
Protection of public health and environment from hazardous effect of MSW
Development of environmentally sustainable and eco nomically feasible solid waste management system
Minimize occupational (adverse) exposure to the waste handlers.
6.2 Strategy:The basic approaches of the proposed SWM system would be:
100% waste collection
Segregation of waste at source
No accumulation of waste in the streets and lanes
Accessibility of service to every citizen
Elimination of road side open dumps
Setting of optimum number of transfer station
Economic and eco-friendly transport system
Elimination of multiple handling of waste
Institutionalization of recycling system
Category wise treatment and disposal
Sound personnel management
Immediate introduction of Containerization of solid waste from storage to disposal.
Engagement of NGOs/Private Firms for door to door collection.
Popularization of ‘ Segregation at so urce’ pr actice t hrough p roper aw areness campaign with effective IEC materials and group discussions.
All organic waste including market waste may be used for composting (Preferable semi-mechanical). Compost plant should be located near by the land fill site.
Market m echanism for segregated r ecyclable wastes must be dev eloped f or proper management of the said waste and f or revenue generation to be use d for welfare purposes.
Training o f al l l evel of st aff associated w ith SWM t o be i mparted by r ecognized institute/personnel.
Awareness and m otivation campaigns m ust be given adeq uate emphasis to get support from the community for effective operation of the system
City Sanitation Plan - Draft Rourkela Municipality
49
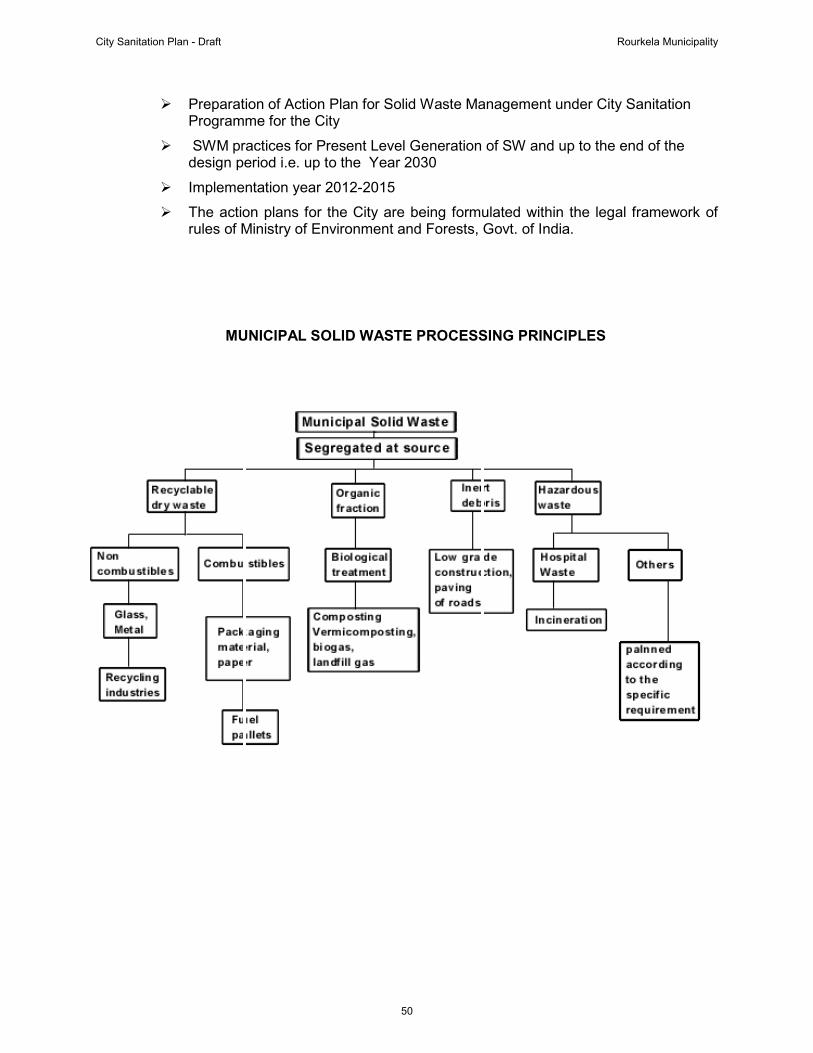
Preparation of Action Plan for Solid Waste Management under City Sanitation Programme for the City
SWM practices for Present Level Generation of SW and up to the end of the design period i.e. up to the Year 2030
Implementation year 2012-2015
The action plans for the City are being formulated within the legal framework of rules of Ministry of Environment and Forests, Govt. of India.
MUNICIPAL SOLID WASTE PROCESSING PRINCIPLES
City Sanitation Plan - Draft Rourkela Municipality
50

Principles of solid waste management
Landfill Site Compost Unit Bio gas Plant
Low Lying Area
By Tripper Truck Transfer Station
Trash Bins
By TATA 407 or Tractor
Industry / Big Dealer
Household Bags
Household Bins
Organic
By TATA 407
Recyclable
By TATA 407 or Tractor
Waste from Street Sweeping
Trash Bins For Construction
Waste
Recovery Centre
Community Bins
City Sanitation Plan - Draft Rourkela Municipality
51

66..33 GGeneraattion aanndd cchharaacctteerristiics off waste
6.3.1 Type of Waste
Sl.No.
Establishment Type of Wastes
1 Residence Food Wastes (animal, vegetable and fruit residues) ;
Garden trimmings; Combustible rubbish- Paper; cardboard; plastics; polythenes; Leather; Rubber; Rags and Cloths; Noncombustible rubbish- Metal foils; Tin cans; glass and glass bottles; crockery;
2 Commercial establishments
Combustible and noncombustible rubbishes are main constituents but a s mall amount o f food wastes are also generated
3 Market Vegetables, Fruits and animal residues (Garbage)
are m ainly g enerated but a small amount of rubbish i s also generated.
4 Restaurant/ Food Establishment
Food Wastes are mainly generated
5 Health care establishment (Hospital, Nursing Homes etc;)
Infectious and hazardous waste are the main concerned.
A significant amount of food waste and rubbish i s also generated
6.3.2 Waste Generation Rate
In almost all growing urban cities of India having population more than 2 lakhs, the average generation of waste is 350 gms/cap/day and the generation of solid waste is estimated in the range of 300-600 gms/capita/day for residential house holds.
It is proposed that the individual houses will be co vered with house to house collection and the slums will be covered by Community bins collection.
For the city of Rourkela the quantity of generation is calculated on the basis of preliminary data collected from Municipal authorities and on assumption of per capita generation rate of 350gm/c/day in house holds & 200 gm/cap/day in slum pockets.
City Sanitation Plan - Draft Rourkela Municipality
52
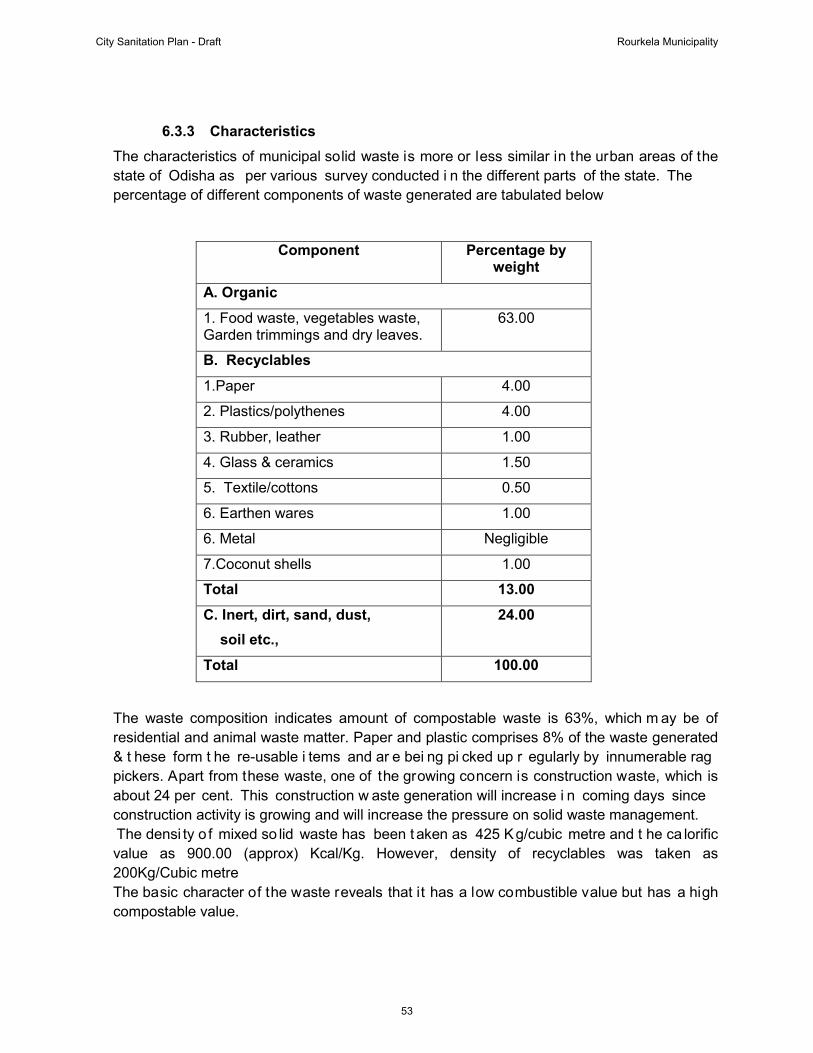
6.3.3 CharacteristicsThe characteristics of municipal solid waste is more or less similar in the urban areas of the state of Odisha as per various survey conducted i n the different parts of the state. The percentage of different components of waste generated are tabulated below
Component Percentage byweight
A. Organic1. Food waste, vegetables waste, Garden trimmings and dry leaves.
63.00
B. Recyclables
1.Paper 4.00
2. Plastics/polythenes 4.00
3. Rubber, leather 1.00
4. Glass & ceramics 1.50
5. Textile/cottons 0.50
6. Earthen wares 1.00
6. Metal Negligible
7.Coconut shells 1.00
Total 13.00C. Inert, dirt, sand, dust,
soil etc., 24.00
Total 100.00
The waste composition indicates amount of compostable waste is 63%, which m ay be of residential and animal waste matter. Paper and plastic comprises 8% of the waste generated & t hese form t he re-usable i tems and ar e bei ng pi cked up r egularly by innumerable rag pickers. Apart from these waste, one of the growing concern is construction waste, which is about 24 per cent. This construction w aste generation will increase i n coming days since construction activity is growing and will increase the pressure on solid waste management. The densi ty o f mixed so lid waste has been t aken as 425 Kg/cubic metre and t he ca lorific value as 900.00 (approx) Kcal/Kg. However, density of recyclables was taken as 200Kg/Cubic metre The basic character of the waste reveals that it has a low combustible value but has a high compostable value.
City Sanitation Plan - Draft Rourkela Municipality
53
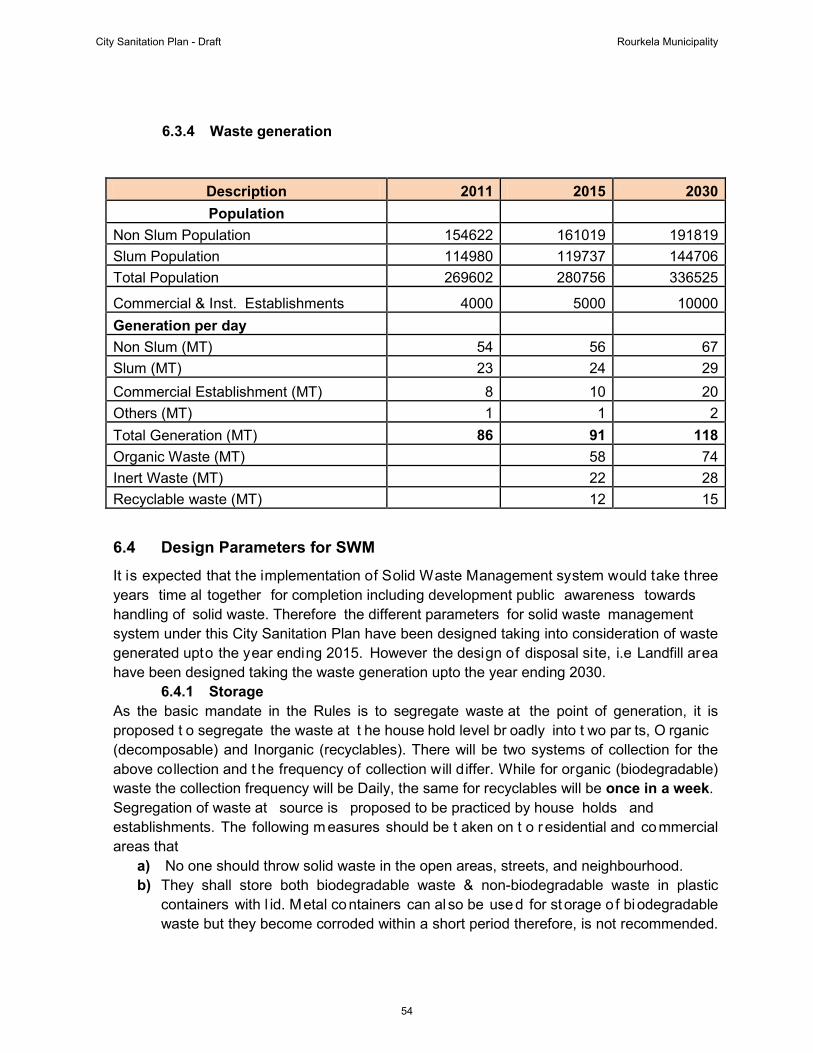
6.3.4 Waste generation
Description 2011 2015 2030Population
Non Slum Population 154622 161019 191819 Slum Population 114980 119737 144706 Total Population 269602 280756 336525
Commercial & Inst. Establishments 4000 5000 10000 Generation per day Non Slum (MT) 54 56 67 Slum (MT) 23 24 29 Commercial Establishment (MT) 8 10 20 Others (MT) 1 1 2 Total Generation (MT) 86 91 118Organic Waste (MT) 58 74 Inert Waste (MT) 22 28 Recyclable waste (MT) 12 15
6.4 Design Parameters for SWMIt is expected that the implementation of Solid Waste Management system would take three years time al together for completion including development public awareness towards handling of solid waste. Therefore the different parameters for solid waste management system under this City Sanitation Plan have been designed taking into consideration of waste generated upto the year ending 2015. However the design of disposal site, i.e Landfill area have been designed taking the waste generation upto the year ending 2030.
6.4.1 StorageAs the basic mandate in the Rules is to segregate waste at the point of generation, it is proposed t o segregate the waste at t he house hold level br oadly into t wo par ts, O rganic (decomposable) and Inorganic (recyclables). There will be two systems of collection for the above collection and t he frequency of collection will differ. While for organic (biodegradable) waste the collection frequency will be Daily, the same for recyclables will be once in a week. Segregation of waste at source is proposed to be practiced by house holds and establishments. The following m easures should be t aken on t o r esidential and commercial areas that
a) No one should throw solid waste in the open areas, streets, and neighbourhood. b) They shall store both biodegradable waste & non-biodegradable waste in plastic
containers with l id. Metal containers can al so be used for st orage o f biodegradable waste but they become corroded within a short period therefore, is not recommended.
City Sanitation Plan - Draft Rourkela Municipality
54

A standard design and s ize of the containers will be prescribed by the department to facilitate the activities.
System Description Advantages Disadvantages
Shared Residents can bring waste at any time
Shared container
Residents and other generators put their waste inside a container which is emptied or removed at definite time interval
Low oper ating cost and co nvenient f or the pedestrians and market places.
There is every possibility that occa sionally the waste will spill out from the containers. Placement of containers will be difficult in a busy and narrow streets and lanes. Adjacent residents and sh opkeepers may complain about the smell and appearance.
Individual In these systems the generators need a su itable container and must store the waste on their property/premises until it is collected.
Block collection
Collector so unds horn or rings bell and w aits at specified locations for residents to bring waste to the collection vehicle.
Economical. Less waste on streets. Staff requirement is less though the standard of service is satisfactory.
If family members are not present during time of collection, the accessibility of the service reduces.
Kerb side Collection
Waste is left out side property i n a container and picked up by passing collection vehicle, or swept up and collected by conservancy worker
Convenient for t he households. No permanent storage point i s required i n the streets or lanes
Waste that is left out may be scattered by animals, children and waste pickers. Vacant area outside the premises for keeping the container may not be available in many cases.
Door to door collection
Waste collector knocks on each door and waits for waste to be brought out by resident.
Convenient for resident. Little waste on street
Residents must be available to hand w aste over. A l arge number of workers is required as much time will be needed by each worker to attend every house.
As mentioned ear lier t hat each family will be pr ovided with t wo se parate st orage facilities. They shall store biodegradable waste and non-biodegradable waste in plastic containers with lid. Shared container (community bins) system is proposed for collection of organic waste as
City Sanitation Plan - Draft Rourkela Municipality
55

well as inorganic waste for slum area. It will be difficult for the vehicles to wait in some of the narrow but busy lanes. Community bins are proposed in those areas.
The number and size of household bins and community bins are estimated as follows
6.4.1.1 Household Bins
Door-to-door daily collection is proposed for collection of organic waste. Door-to-door collection is also proposed for collection of inorganic recyclable waste with frquency ofcollection, once in a week.
CATEGORY MATERIALNUMBER
REQUIRED SIZEFREQUENCY OF
COLLECTIONHOUSEHOLD BINS(Organic
Waste) PLASTIC 60,000 8
LITRES DAILY HOUSEHOLD
BINS(Recyclable Waste)
PLASTIC / METAL 60,000
10 LITRES ONCE IN A WEEK
6.4.1.2 Community bins for slum area
It is assumed that a community bin will serve 25 families or 125 persons. Organic waste will be collected daily & recyclable waste will be collected once in a week.
CATEGORY MATERIAL NUMBERREQUIRED
SIZE FREQUENCY OFCOLLECTION
COMMUNITY BIN (ORGANIC)
FIBRE GLASS
1000 100 LITRES
DAILY
COMMUNITY BIN (RECYCLABLE)
FIBRE GLASS
1000 200 LITRES
ONCE IN A WEEK
6.4.1.3 Bins for Commercial Establishments/Shops
It i s assumed that one bin w ill serve 25 shops. Organic waste will be collected daily & recyclable waste will be collected once in a week.
CATEGORY MATERIAL NUMBERREQUIRED
SIZE FREQUENCY OFCOLLECTION
BIN FOR ORGANIC MATTER
FIBRE GLASS
200 100 LITRES
DAILY
BIN FOR RECYCLABLE
MATTER
FIBRE GLASS
200 300 LITRES
ONCE IN A WEEK
City Sanitation Plan - Draft Rourkela Municipality
56
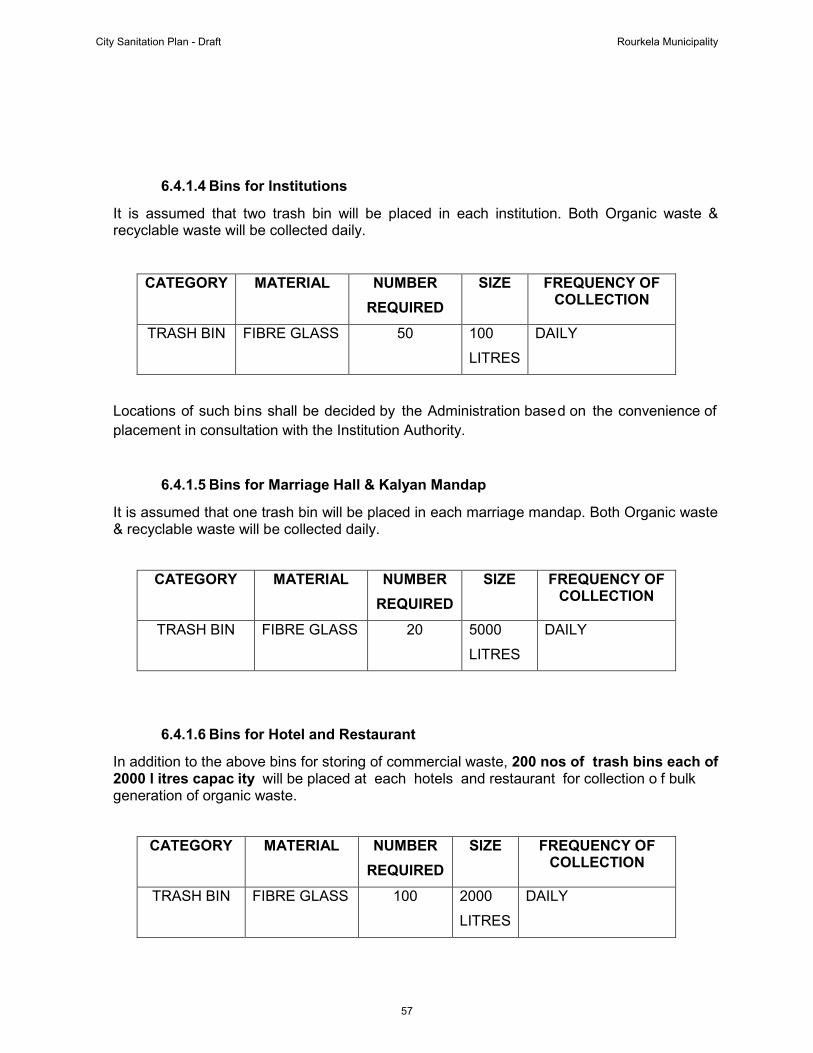
6.4.1.4 Bins for Institutions
It is assumed that two trash bin will be placed in each institution. Both Organic waste & recyclable waste will be collected daily.
CATEGORY MATERIAL NUMBERREQUIRED
SIZE FREQUENCY OFCOLLECTION
TRASH BIN FIBRE GLASS 50 100
LITRES
DAILY
Locations of such bins shall be decided by the Administration based on the convenience of placement in consultation with the Institution Authority.
6.4.1.5 Bins for Marriage Hall & Kalyan Mandap
It is assumed that one trash bin will be placed in each marriage mandap. Both Organic waste & recyclable waste will be collected daily.
CATEGORY MATERIAL NUMBERREQUIRED
SIZE FREQUENCY OFCOLLECTION
TRASH BIN FIBRE GLASS 20 5000
LITRES
DAILY
6.4.1.6 Bins for Hotel and Restaurant
In addition to the above bins for storing of commercial waste, 200 nos of trash bins each of2000 l itres capac ity will be placed at each hotels and restaurant for collection o f bulk generation of organic waste.
CATEGORY MATERIAL NUMBERREQUIRED
SIZE FREQUENCY OFCOLLECTION
TRASH BIN FIBRE GLASS 100 2000
LITRES
DAILY
City Sanitation Plan - Draft Rourkela Municipality
57

6.4.2 Primary Collection Vehicles
Common types of primary collection vehicle are
• The handcart, which is pushed by the operator as he/she walks along,
• The pedal tricycle with containers/box in front of or behind the operator.
It is proposed that 40% 0f the waste will be collected through hand carts having 4 nos. of 30 lit. Capacity container and 60% of the waste will be collected by pedal tricycles having 8 nos. of 30 lit. Capacity container.
It is considered that one sweeper will make 3trips/day from the household/community to the primary transfer stations.
Carrying capacity of hand cart /day = 3x4x30lit.=360lit. or 0.360cum.
No. required= 69MTx .40= 27.6 MTx 1000/425= 64.94 cum/.360 = 180.38 or say 180
Carrying capacity of pedal tricycle/day = 3x8x30lit.=720 lit. or 0.720cum.
No. required= 69 MTx .60= 41.4MTx 1000/425= 97.41 cum/.0.720= 135.29 or say 135
ITEM Capacity Number
Hand Cart 4 container 180
Pedal Tri cycle 8 container 135
Container 30 Litres 1800
6.4.3 Transfer and transportationMain objectives of the proposed solid waste transportation system are
• Optimum Utilization of the transport vehicles.
• Avoid Multiple Handling of Solid waste
• Environment friendly and hygienic system
1. Primary Transfer StationThe method of transferring waste from the primary transport cum collection vehicle to Primary transfer stations should be chosen with ca re, in order to avoid env ironmental pol lution and occupational health risk of the workers.
Total Road length of 33nos of ward of Rourkela City = 629 km.
Calculation of Dumper Placer Container
Average road length per ward =629/33 = 19.06 km.
Total Area of Rourkela city = 31.60 Sq km.
Average area per ward = 31.60/33 = 0.96 Sq km.
City Sanitation Plan - Draft Rourkela Municipality
58

Taking into consideration of average road length & area of a ward it is proposed to have 2 no of dumper placer containers of 1 Cum capacity in each ward at suitable locations for organic waste, 1 no of dumper placer container of 3 Cum capacity in each ward for recyclable waste.
a) In addition to this it is proposed to place one no of dumper placer container of 3 cum Capacity in each ward at suitable locations for waste from street sweeping.
b) 20 nos. of 4.5 cum capacity dumper placer containers at major commercial area
c) 4 nos. of 4.5 cum capacity at vegetable markets
Considering generation of 2015 total dumper placer container required
Total no of 1 cum capacity container= 33x2 = 66
Total no of 3 cum capacity container = 33x3 = 99
Total no of 4.5 cum capacity container = 24
2. Container Lifting Vehicles
These container lifting vehicles will engage to transport the waste from primary transfer stations to secondary transfer stations.
Considering 4 nu mbers of containers can be l ifted & t ransported per vehicles per day , t he number of Dumper Placer required = 189/5 = 37.8 or say 38 nos. Add 10% extra = 38+4 = 42nos. Out of the above, 14 nos. will be of Auto transported dumper placer and rest 28 nos. will be Tractor/Mini truck carried dumper placer.
3. Secondary Transfer StationsSplit-level transfer is proposed for the town. S plit level transfer can b e o f three types as mentioned below
Method Description Advantages DisadvantagesRamp Rapid and hygienic
transfer : The collection
vehicle is moved up a slope until it is high enough for the waste to fall by gravity into the secondary transport vehicle
It requires considerable sp ace t o provide a desirable slope for t he motor vehicles. That much of free space may not be available in most areas.
Pit No restriction imposed on the size of the Primary transport vehicle
: The secondary transport vehicle is driven into a pi t, so that the waste can be tipped from a primary t ransport v ehicle into it.
If t he pi t is not well drained and regularly cleaned, it may become filled with water or waste, or both.
Using natural ground level allow split level transfer
Problems of Ramp and Pit do not arise
Some special construction arrangements have to be made sometimes, if the l and where transfer will take place is uneven.
City Sanitation Plan - Draft Rourkela Municipality
59

For the Rourkela City one numbers of two level transfer stations (Ramp type) are proposed at the following locations
i- Ward No-17
For the above purpose land area of 2000 Sq.mt. (approximately 70mt.x30mt) is required at the abov e l ocations. These t ransfer s tations should be w ithin 10 -15 km di stance from t he prosed Land fill Site. The waste collected through dumper placer from the city will be transferred t o prime movers (Truck a ttached w ith hy draulically operated tippers) and the waste will be transported to Landfill/Waste processing site from these transfer stations.
4. Prime Movers RequiredTotal solid waste to be transported to disposal site = 57 MT per day
Capacity of each Prime Mover = 5 MT
No. of Prime Mover required = 57/ (5 x 3 trips) = 3.8 say 4 nos.
Provide 10% extra as stand by unit.
Total No. of Prime Mover = 4+1= 5 nos.5. Transportation of Construction Material/Inert Waste
It is proposed that the construction waste will be kept by the waste generator in their premises or a t road side and i t w ill be lifted di rectly f rom the construction si te by Rourkela Municipality. These materials will be disposed at low lying area of the city or in the river bank through Tractors or Mini truck. It should be ensured that such waste should be free from any type o f organic waste & recyclable waste otherwise it will create environmental or river pollution.
Calculation of no. of vehicle required/day for disposal of Construction Waste
It is assumed that one vehicle will run 20 km/trip and 5 trips/day.
Capacity of one Tractor = 1cum x 5 trips/day = 5 cum.
Density of Inert waste is considered as 1000kg/cum.
Inert Material is 22 MT/day
No. of vehicles to be engaged for lifting of 22 cum = 4.4 or say 5 nos.
Add 10% extra =5+1= 6 nos. 6. Street sweeping
Total length of the road of Rourkela City = 629km.
The w idth of t he r oads are di fferent. Considering 3 0% of r oad l ength having 10 Mt. width, 40% of the road length having 7 Mt. width & 30% of road length having 3 Mt. width, the length of the roads of different width are as follows-
10 Mt. width road = 189km; 7 Mt. width road = 251km; 3 Mt. width road = 189km
Considering one sweeper can sweep 2500 Sqmt. of road/day and also be allotted the duty for primary collection of waste from road side to dumper placer container.
City Sanitation Plan - Draft Rourkela Municipality
60

The no of sweeper required
For 10Mt.width road = (10x189000)/2500 = 756nos.
For 7Mt.width road = (7x251000)/2500 = 703 nos.
For 3Mt.width road = (3x189000)/2500 = 227 nos.
Total = 1686 nos.6.4.4 Treatment & Disposal
1. Recycling or resource recovery
Each family of the City will be provided with m etal/plastic bins for storing of recyclables generated in the house. As these wastes are not biodegradable, seven days storing inside the house will not pose problem. The waste will be handed over to the waste collectors who will collect the waste at doorsteps once in a week. These materials will be taken to Recovery Centres.
Recyclable waste that would be collected from residences, commercial establishments and markets, needs t o sort. For t hat two r ecovery centres are pr oposed to be constructed j ust adjacent to the secondary transfer stations. It would be a si mple enclosure with a boundary wall, where individual components of recyclables will be sorted and stored separately so that selling of the ar ticles will be ef fective. There w ill be weighing machines in the centre for regular stock checking and quantification of items. Workers who will be engaged for material sorting must be protected from health hazards associated with waste handling by providing Personal Protective E quipments (PPE). A piece of land of 40Mt.x 30 Mt. size will be adequate for one recovery centre.
The schematic representation of recovery
Itinerate waste buyer
Household / Commercial firms / Institutions
Public Dustbins / Garbage dumps
Waste dealer
Waste Picker
Wholesalers Supplies to recyclers
City Sanitation Plan - Draft Rourkela Municipality
61

2. Disposal
The disposal of solid waste is proposed to be carried out in a combination of three methods:
1. Composting
2. Biomethanation
3. Land filling
As it is already proposed that most inorganic waste will be taken care by recycling system, the organics and mixed w aste will be disposed o ff. A ccording t o the R ules organic waste must be used for production of compost & for energy recovery. On that basis flow sheet of disposal operation to be practiced is depicted below
Flow Sheet of Disposal Operation by the Transport Vehicles
Entry point Checking of vehicle
Computerized weigh bridge
Weighment of solid waste
Disposal sites for unloading
Compost plant site
Container washing
Exit
Landfill site Biomedical waste site
Hazardous waste site
(To be required
later)
Biomethanation
City Sanitation Plan - Draft Rourkela Municipality
62
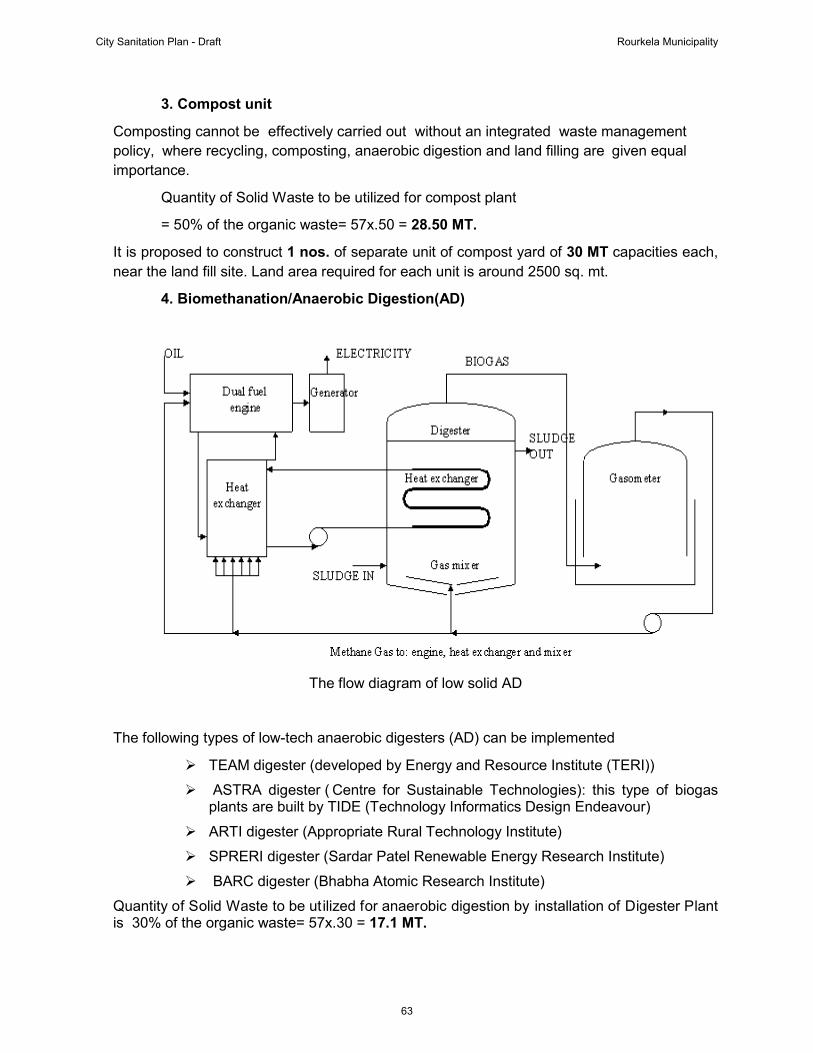
3. Compost unit
Composting cannot be effectively carried out without an integrated waste management policy, where recycling, composting, anaerobic digestion and land filling are given equal importance.
Quantity of Solid Waste to be utilized for compost plant
= 50% of the organic waste= 57x.50 = 28.50 MT.
It is proposed to construct 1 nos. of separate unit of compost yard of 30 MT capacities each, near the land fill site. Land area required for each unit is around 2500 sq. mt.
4. Biomethanation/Anaerobic Digestion(AD)
The flow diagram of low solid AD
The following types of low-tech anaerobic digesters (AD) can be implemented
TEAM digester (developed by Energy and Resource Institute (TERI))
ASTRA digester ( Centre for Sustainable Technologies): this type of biogas plants are built by TIDE (Technology Informatics Design Endeavour)
ARTI digester (Appropriate Rural Technology Institute)
SPRERI digester (Sardar Patel Renewable Energy Research Institute)
BARC digester (Bhabha Atomic Research Institute)
Quantity of Solid Waste to be utilized for anaerobic digestion by installation of Digester Plant is 30% of the organic waste= 57x.30 = 17.1 MT.
City Sanitation Plan - Draft Rourkela Municipality
63

It is proposed to install 2 nos. of separate unit of Digester Plant of 10 MT capacities each, near to the land fill site. Land area required for each unit is around 1000 sq. mt.
5. Modified sanitary land fill (MSLF)
The basic criteria for site selection for land fill are
1. The landfill site shall be large enough to last for 20-25 years and preferably within 5 km from present city limits.
2. The site shall be at least 0.5 km away from habitation clusters, forest areas, monuments, N ational pa rks, w etlands and pl aces of i mportant cu ltural, historical or religious interest.
3. Landfill site shall be at least 20 km away from airport including airbase. Implementing authority shall obtain approval of airport/airbase authorities prior to the setting up of the landfill site.
4. 500 meters, wide buffer zone of no-development i s to be maintained around landfill site and shall be incorporated in the City Planning Department’s land-use plans.
The land fill si te has to be designed for 2030 pr ojection. The proposed site should fulfils all the criteria. Considering 20% of organic waste will be disposed off in the modified sanitary landfill (MSLF), 50%will be utilized in the compost plant and 30% will be utilized for anaerobic digestion for production of bio-gas.
The total land area should be approximately 15% more than the area required for land filling to accommodate al l infrastructure and support facilities as well as to al low formation of a green belt around the landfill.
A landfill is operated in phase because it allows the progressive use of the landfill area, such that at any given time a par t of the site may have a final cover, a par t being actively filled, a part being prepared to receive waste, and a part undisturbed. Each phase is typically designed for a period of 365 days.
Waste generation by 2015(Organic Waste) : 57 tonnes / day
Waste generation by 2030(Organic Waste) : 67 tonnes / day
Design Life : Active period = 15 years
Average total rainfall : 1200 mm per year
i) Waste to be disposed at landfill site by 2015
Land Fill Area
@ 20% of 57MT (organic waste) = 11.4 tonnes / day
ii) Waste to be disposed at landfill site by 2030
@ 20% of 67MT (organic waste) = 14.0 tonnes / day
iii) Total waste to be disposed in 15 years(0.5*(11.4+14)x365x15)=0.7x10⁵
iv) Total volume of the waste, (considering density of the waste 0.85 ton/cum
tons
Volume of Waste Vw = 0.7 x 10⁵ /0.85 =0.85 x 10⁵
v) Volume of daily cover Vde= 0.1 x 0.85 x 10
Cum 5 Cum
City Sanitation Plan - Draft Rourkela Municipality
64

vi) Volume of liner and cover system Ve=0.125 x 0.85x 105 =0.106 x 10⁵
vii) Volume likely become available within 30 days due to settlement of biodegradable waste and inert waste@ 7.5%
Cum
Vs = 0.075 x 0.85 x 105 =0.064 x 10⁵
viii) Estimate of landfill volume
cum
Ci Vw + Vde
= (0.85+ 0.085+ 0.106– 0.064) x 10
+ Ve – Vs
= 0.977 x 10
5 5
ix) Proposed L:B ratio = 1:1
Cum
x) Proposed landfill height = 3.50mt
x) Land area required = (0.977 x 105
= 27914 Sqm
/ 3.5 )Sqm
= 6.95 Acre or say 7 Acre
The land needs to be a cquired for 9 acres. Out of which 1.0 acre of land is proposed to be utilized for compost unit and 1.00 acre to be utilized for setting up digester plant. No land has yet been allotted for treatment plant and land fill. This need to be taken up with topmost priority. The Municipality is also exploring the possibility of associating with RSP for common treatment and land fill unit or to provide the solid waste to the private operator appointed by RSP for their township. The Municipality should strongly pursuer the latter.
a) Site Entrance and Boundary Wall.
Land fill Infrastructure
b) Administrative and Site Control Offices
c) Access Roads
d) Waste Inspection and Sampling Facility
e) Equipment Workshops and Garages
f) Signs and Direction
g) Water Supply
h) Lighting
i) Vehicle Cleaning Facility
j) Fire Fighting Equipment
City Sanitation Plan - Draft Rourkela Municipality
65

The following equipment is required at a landfill site
Landfill equipment
a) Dozers – for spreading waste and daily cover -1 Nos
b) Landfill Compactors – for compaction waste - 1 Nos
c) Loader– for loading of Waste (internal movement) – 1 Nos
d) Tractor trailers –for internal movement of waste/daily cover soil – 2 Nos.e) Soil compactos – sheep foot rollers and smooth steel drum rollers – 2 Nos. f) Water tanker - 1 No.
6.4.5 Bio-medical Waste
Bio–medical Waste means any waste, which is generated during the diagnosis, treatment or immunization of human beings or animals or research activities pertaining thereto or in the production or testing o f biological and including ca tegories mentioned i n S chedule-I of t he Rules.
A facility wherein t reatment, di sposal o f bi o-medical waste or pr ocesses i ncidental t o such treatment or disposal is carried out and includes common treatment facilities.
Bio-medical waste treatment facility
The M unicipal B odies can onl y pi ck-up and transport duly treated bi o-medical w astes for disposal at t he municipal dump si te ( Rule 6 ). The main r esponsibilities of collection and segregation bio-medical waste are with the hospital authority.
Categories of Health Care Waste
General Waste Biomedical Waste
Anatomical Waste
Infectious non-sharp Waste
Sharp Waste
Food Waste, Paper, Cardboard, Floor sweeping, earthen vessels, woods, rags, etc.
Placenta, human tissue, tumours, etc.
Soiled Waste
Waste contaminated with blood, body fluid (cotton, dressing, soiled plaster cut, linen, etc.)
: Needles, syringes, scalpel, blade, broken glass, nails and any other items that may cause puncture and cuts.
Solid Waste
Disposable items other than waste sharps (rubber gloves, plastic tubing, catheters, IV sets, etc.
:
City Sanitation Plan - Draft Rourkela Municipality
66

Colour Coding for different Categories of Waste
Waste Category Colour of Bag Colour Bin
General Waste (Non-hazardous) Black Black
Anatomical Waste Yellow Yellow
Infectious Non-sharp Waste Red Red
Sharp Waste Blue Blue
• If the proper segregation of the waste is not done at source then the bio-medical waste might get mixed up with the municipal waste of the hospital.
Need for the Segregation of BMW at Source
• This will jeopardize the entire process of the bio-medical waste treatment.
• Besides, this will endanger the human and the animal lives.
• Therefore, it is vital that all the health care units – both in the Government and in the Private Sector – strictly follow the segregation of bio-medical waste at source.
The bio-medical waste is segregated into Yellow, Red and Blue bags, containers and bins
Total No of Bed- Rourkela Govt Hospital - 200
Generation of Bio-Medical Waste
Other Primary Hospitals & Nursing Homes
(10 Nosx 30 bed average )
Total - 500 beds.
-300
Considering the waste generated @1.5 Kg/cap/day
The total waste generated = 0.75 MT/Day
Out of which the municipal solid waste is considered as 75%, = 0.56MT
and the Bio- Medical Waste is considered as 25% i = 0.19 MT
City Sanitation Plan - Draft Rourkela Municipality
67
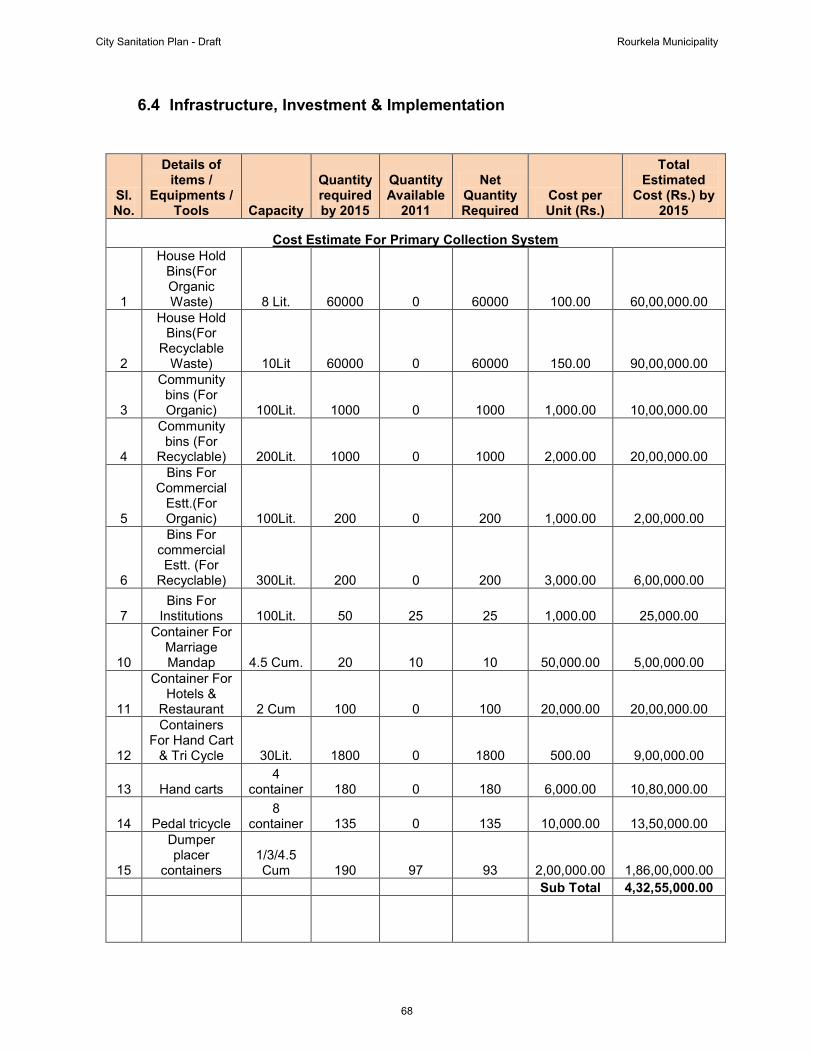
6.4 Infrastructure, Investment & Implementation
Sl.No.
Details ofitems /
Equipments /Tools Capacity
Quantityrequiredby 2015
QuantityAvailable
2011
NetQuantityRequired
Cost perUnit (Rs.)
TotalEstimated
Cost (Rs.) by2015
Cost Estimate For Primary Collection System
1
House Hold Bins(For Organic Waste) 8 Lit. 60000 0 60000 100.00 60,00,000.00
2
House Hold Bins(For
Recyclable Waste) 10Lit 60000 0 60000 150.00 90,00,000.00
3
Community bins (For Organic) 100Lit. 1000 0 1000 1,000.00 10,00,000.00
4
Community bins (For
Recyclable) 200Lit. 1000 0 1000 2,000.00 20,00,000.00
5
Bins For Commercial
Estt.(For Organic) 100Lit. 200 0 200 1,000.00 2,00,000.00
6
Bins For commercial Estt. (For
Recyclable) 300Lit. 200 0 200 3,000.00 6,00,000.00
7 Bins For
Institutions 100Lit. 50 25 25 1,000.00 25,000.00
10
Container For Marriage Mandap 4.5 Cum. 20 10 10 50,000.00 5,00,000.00
11
Container For Hotels &
Restaurant 2 Cum 100 0 100 20,000.00 20,00,000.00
12
Containers For Hand Cart
& Tri Cycle 30Lit. 1800 0 1800 500.00 9,00,000.00
13 Hand carts 4
container 180 0 180 6,000.00 10,80,000.00
14 Pedal tricycle 8
container 135 0 135 10,000.00 13,50,000.00
15
Dumper placer
containers 1/3/4.5 Cum 190 97 93 2,00,000.00 1,86,00,000.00
Sub Total 4,32,55,000.00
City Sanitation Plan - Draft Rourkela Municipality
68
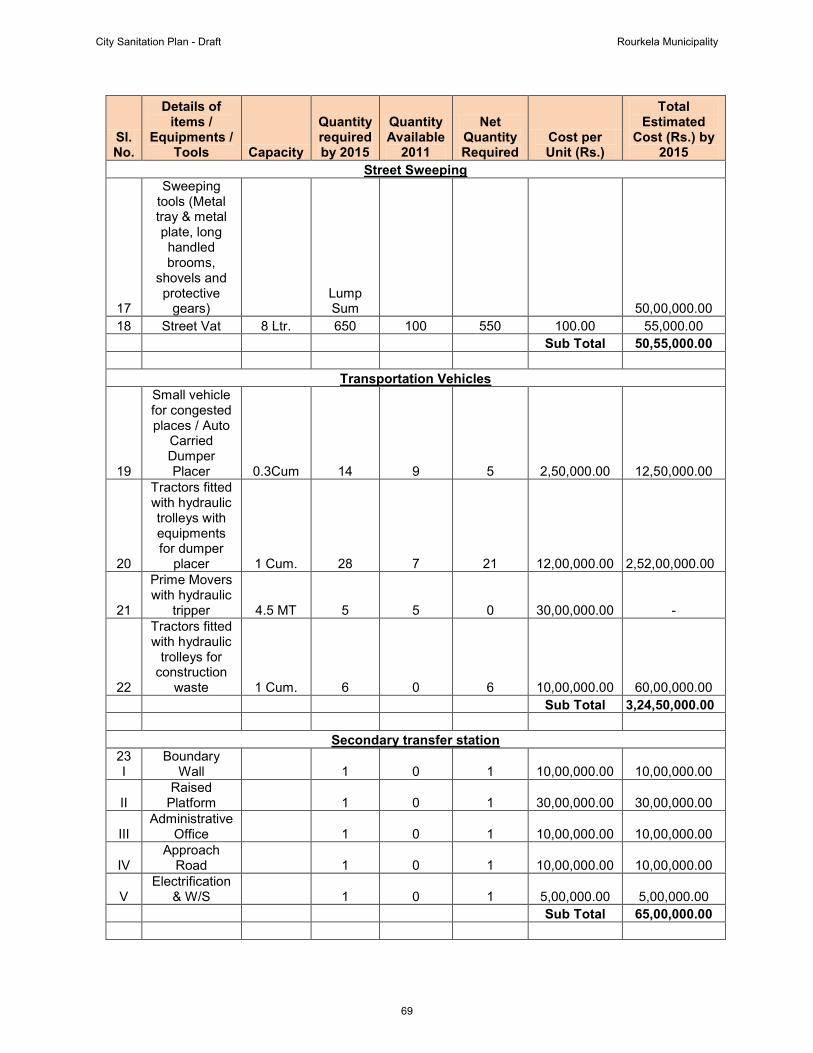
Sl.No.
Details ofitems /
Equipments /Tools Capacity
Quantityrequiredby 2015
QuantityAvailable
2011
NetQuantityRequired
Cost perUnit (Rs.)
TotalEstimated
Cost (Rs.) by2015
Street Sweeping
17
Sweeping tools (Metal tray & metal plate, long handled brooms,
shovels and protective
gears)
Lump Sum
50,00,000.00
18 Street Vat 8 Ltr. 650 100 550 100.00 55,000.00
Sub Total 50,55,000.00
Transportation Vehicles
19
Small vehicle for congested places / Auto
Carried Dumper Placer 0.3Cum 14 9 5 2,50,000.00 12,50,000.00
20
Tractors fitted with hydraulic trolleys with equipments for dumper
placer 1 Cum. 28 7 21 12,00,000.00 2,52,00,000.00
21
Prime Movers with hydraulic
tripper 4.5 MT 5 5 0 30,00,000.00 -
22
Tractors fitted with hydraulic
trolleys for construction
waste 1 Cum. 6 0 6 10,00,000.00 60,00,000.00
Sub Total 3,24,50,000.00
Secondary transfer station 23 I
Boundary Wall
1 0 1 10,00,000.00 10,00,000.00
II Raised
Platform
1 0 1 30,00,000.00 30,00,000.00
III Administrative
Office
1 0 1 10,00,000.00 10,00,000.00
IV Approach
Road
1 0 1 10,00,000.00 10,00,000.00
V Electrification
& W/S
1 0 1 5,00,000.00 5,00,000.00
Sub Total 65,00,000.00
City Sanitation Plan - Draft Rourkela Municipality
69
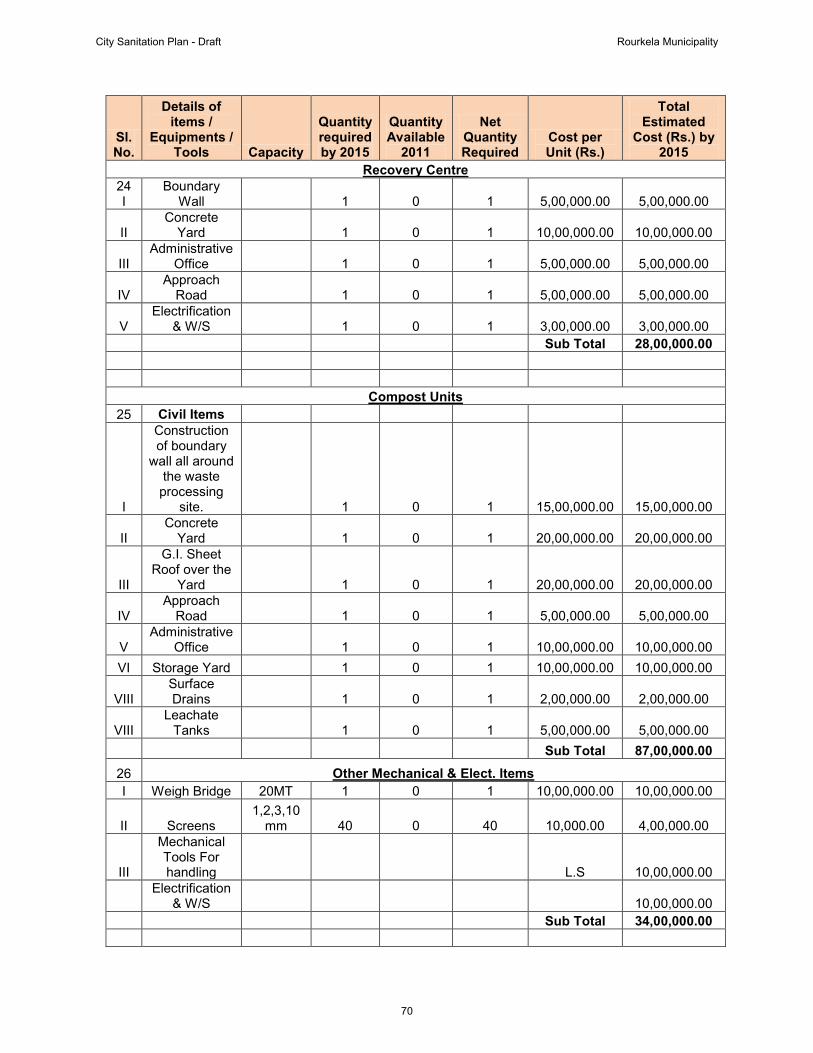
Sl.No.
Details ofitems /
Equipments /Tools Capacity
Quantityrequiredby 2015
QuantityAvailable
2011
NetQuantityRequired
Cost perUnit (Rs.)
TotalEstimated
Cost (Rs.) by2015
Recovery Centre 24 I
Boundary Wall
1 0 1 5,00,000.00 5,00,000.00
II Concrete
Yard
1 0 1 10,00,000.00 10,00,000.00
III Administrative
Office
1 0 1 5,00,000.00 5,00,000.00
IV Approach
Road
1 0 1 5,00,000.00 5,00,000.00
V Electrification
& W/S
1 0 1 3,00,000.00 3,00,000.00
Sub Total 28,00,000.00
Compost Units
25 Civil Items
I
Construction of boundary
wall all around the waste processing
site.
1 0 1 15,00,000.00 15,00,000.00
II Concrete
Yard
1 0 1 20,00,000.00 20,00,000.00
III
G.I. Sheet Roof over the
Yard
1 0 1 20,00,000.00 20,00,000.00
IV Approach
Road
1 0 1 5,00,000.00 5,00,000.00
V Administrative
Office 1 0 1 10,00,000.00 10,00,000.00 VI Storage Yard 1 0 1 10,00,000.00 10,00,000.00
VIII Surface Drains
1 0 1 2,00,000.00 2,00,000.00
VIII Leachate
Tanks
1 0 1 5,00,000.00 5,00,000.00
Sub Total 87,00,000.00
26 Other Mechanical & Elect. Items I Weigh Bridge 20MT 1 0 1 10,00,000.00 10,00,000.00
II Screens 1,2,3,10
mm 40 0 40 10,000.00 4,00,000.00
III
Mechanical Tools For handling
L.S 10,00,000.00
Electrification & W/S 10,00,000.00
Sub Total 34,00,000.00
City Sanitation Plan - Draft Rourkela Municipality
70

Sl.No.
Details ofitems /
Equipments /Tools Capacity
Quantityrequiredby 2015
QuantityAvailable
2011
NetQuantityRequired
Cost perUnit (Rs.)
TotalEstimated
Cost (Rs.) by2015
Bio-methanation Plant
27
Package anaerobic
digester plant L.S 2,00,00,000.00
Land Fill Sites
28 Civil Items
I
Construction of boundary
wall all around the Land Fill
site.
L.S. 20,00,000.00
II
Shed for equipments workshop
L.S. 20,00,000.00
III
Approach Road & Internal
access road
L.S. 40,00,000.00
IV Administrative
Office L.S. 15,00,000.00
V Surface Drains
L.S. 20,00,000.00
VI Leachate
Tanks
L.S. 50,00,000.00
VII Sedimentation
Tank
L.S. 5,00,000.00
VIII
Treatment Unit for
Leachate
L.S. 1,00,00,000.00
Landfill gas recovery
arrangements
L.S. 1,00,00,000.00
Sub Total 3,70,00,000.00
29 Other Mechanical & Elect. Items I Weigh Bridge 20MT
0 0 L.S. 8,00,000.00
II
Mechanical Tools &
Equipments for Works
L.S. 20,00,000.00
III Loader ( 2
nos ) 2 2 0 30,00,000.00 -
IV Compactors (
3nos ) 3 0 3 40,00,000.00 1,20,00,000.00
V Dozer ( 1 nos
) 1 0 1 25,00,000.00 25,00,000.00
VI Water Tanker
( 1 no ) 1 0 1 10,00,000.00 10,00,000.00
City Sanitation Plan - Draft Rourkela Municipality
71

Sl.No.
Details ofitems /
Equipments /Tools Capacity
Quantityrequiredby 2015
QuantityAvailable
2011
NetQuantityRequired
Cost perUnit (Rs.)
TotalEstimated
Cost (Rs.) by2015
VII Tractor Trailer
( 2 nos ) 2 0 2 8,00,000.00 16,00,000.00
VIII Electrification
& W/S
30 Gas Flaring
Arrangement L.S 20,00,000.00
31
Environmental Monitoring
Units L.S 50,00,000.00
32
Leachate Collection
Pipe L.S 60,00,000.00
33
HDPE Geo Membrane
Liner L.S 1,50,00,000.00
34
Under Drainage
Arrangements L.S 1,00,00,000.00
35
Taking up plantation all around the disposal /
processing site L.S 50,00,000.00
36
Plantation over the
completed phase of Landfill L.S 1,00,00,000.00
Sub Total 7,29,00,000.00
Bio-Medical Waste Management
37
Cost towards collection,
transportation, Waste from Municipal hospitals L.S 50,00,000.00
Land Acquisition
38
Cost towards land
acquisition for different sites
L.S 5,00,00,000.00
GRAND TOTAL Rs. 28,70,05,000.00
SAY Rs. 28.70 Crores
City Sanitation Plan - Draft Rourkela Municipality
72

6.6 Private Sector Participation in SWM
Private sector participation or public private partnerships may be encouraged / attempted by the Rourkela Municipality.
Some of the areas where private sector participation can be considered are as under
• Door to door collection of domestic waste,
• Door to door collection of commercial waste
• Collection of hospital waste
• Collection of construction waste
• Collection of Market waste
• Setting up of waste disposal facility with its operation and maintenance.
• Setting up of waste treatment plants with its operation and maintenance.
• Supplying vehicles on rent
• Supplying vehicles on lease
• Repairs and maintenance of vehicles,
• Transportation of waste on contractual basis etc.
• Processing of MSW
• Awareness programs on community participation in solid waste management.
6.7 Recommended Measures
1. Household residents should be encouraged to segregate recyclables and non -recyclables organics a nd inert wastes at the source through public awareness campaigns
2. Door to Door collection systems in al l residential area and Community bin collection systems in the slums
3. Collection of non-recyclables organics and inert wastes daily and recyclables once in a week by container carrier hand cart/ Pedal Tricycles
4. NGOs/Private Farms will be engaged for Primary collection systems by hand cart/pedal tricycles
5. Replacement of existing handcarts by containerized handcart to avoid double handling and less productivity
6. Involvement of m arket committees and participation o f NGOs to be encouraged in managing the collection system w ithin the market. Market mechanisms of the recyclables should be totally controlled by NGOs/Private Firm.
7. To f ix sweeping Norms for different t ype of ar eas as well as di fferent categories of roads according to population, commercial activities, length & width of the roads
8. Monitoring by routine visits to areas by the ULB representatives. Submission of daily report cards by NGOs engaged
City Sanitation Plan - Draft Rourkela Municipality
73

9. Containers should be placed i n locations (Transfer st ations) where vehicles can access properly and loading and unloading operation can be comfortably made.
10. Recyclables should be totally managed by NGOs and the transportation of solid wastes may be given as contracts to private agencies under supervision of ULB.
11. Compost Units & Anareobic digester plant should be outsourced to Private agencies
12. Consultancy support and specific recommendations of subject experts should be availed for effective management
13. Capacity building activities and training should be a taken up regularly
14. It is possible to make SWM a peopl e’s programme by launching comprehensive IEC activities for awareness generation
6.8 Estimation of manpower requirement
Sl. Position Sanitation workers Drivers1 Street sweepers for street
sweeping and 1686 --
2 primary collection of waste through hand cart & pedal cycle 315 --
3 For Auto carried Dumper placers . 14 14 4 For tractor /minitruck carried Dumper
placers with tipping arrangement 28 28 5 For tractor /mini truck for lifting of
construction waste/debris 6 6 6 For Tipper with hydraulic arrangement 10 5 7 For bulldozer and excavators for landfill
site 2 1 8 Labour at landfill site 20 -- 9 Labour at Bio-Gas Plant site 20 -- 10 Labour at Compost Plant site 15 -- 11 Labour at Recycling Centre 10 11 Tractor trailer at landfill site 4 2 12 Loader, Compactor & water tanker
required for landfill site 8 4
13 Labour required for secondary transfer station 10 --
Total 2148 55 14 Weekly off relievers /Leave Reserve @
10% 215 6
Grand Total 2363 61 Note : The above manpower requirement will be reduced based on private sector participation
City Sanitation Plan - Draft Rourkela Municipality
74

7.0 Storm Water DrainageDrainage system of a ci ty i s best judged by the coverage of t he drainage network and the number and frequency o f water logging in t he city during heavy rains. Water logging is defined as the i nundation of water within a area f or a depth o f more than si x inches for a period greater than four hours. The city should have drainage network which should be well connected with proper slope and of adequate capacity t o carry storm water. The drains should be connected to the main drains and then to the nearest water body. A improvised system can also explore the possibility of cost effective method of water harvesting.
7.1 Strategy The city should have the drainage master plan which needs to be synchronous with the road network master plan of the city. The implementation of the drainage system could be t aken up in a phased manner by following the master plan. Storm water disposal can be taken care of through either a combined sewer system, which provides common collection and disposal of domestic waste water (sewerage) and storm water, or a se parate sy stem, i n w hich st orm w ater w ill be d isposed t hrough a se parate collection, conveyance and disposal system. Looking to the rainfall pattern, with rainy days mainly in the period June to October and w ith other months largely dry, a co mbined system will prove to be expensive, besides being grossly under-utilized in dry months. The separate storm water disposal system is likely to be the preferred option. Also the combined system is not a preferred option for project proposals. The tertiary and secondary drains, which will discharge into the primary drains, may be in the form of surface drains, with appropriate size and shape and constructed in locally available materials or pre-cast sections. The design o f the st orm water dr ains should be done by usi ng appr opriate meteorological and hydraulic parameters. The Indian M eteorological Department ( IMD) supplies data on rainfall pattern from which it is possible to develop the relationship between the return period, duration o f rainfall and intensity of rainfall, and develop charts useful for design o f tertiary, secondary and pr imary drains. IMD al so publishes monograms, w hich provide charts of rainfall intensity and duration for different return periods for the entire country. Suitable design parameters can be generated by using these charts. Natural drains, which are the primary drains in storm water drainage system, are likely to be adequate for accommodating the storm water generated in the city. But they will need some improvements l ike t raining, removal o f blockages due to vegetation, l ining in ce rtain c ritical locations, etc. The resultant design needs to identify the improvements, based on field observations. The existing drains need renovation and all the drains are necessary to be covered type with provisions for grit traps for cleaning.
City Sanitation Plan - Draft Rourkela Municipality
75

Description RourkelaDATARoad Length 629 Length of available Pucca Drain 192 TARGET
Target for coverage 100% ASSUMPTIONS
Drain Length per Km of Road 1 Cost per Km for Main drain Rs. 60.00 Lakh /Km Cost per Km for secondary drain Rs. 27.00 Lakh /Km Cost per Km for tertiary drain Rs. 8.50 Lakh /Km INFRASTRUCTURE
Main Drain (Km) 15% 66 Secondary Drain (Km) 35% 153 Tertiary drains (Km) 50% 219 CAPEX
New Construction (Crores Rs.) 103.50 Cr. Repair & Renovation (Crores Rs.) 6.50 Cr.
Total Cost (Crores Rs.) 110.00 Cr.IMPLEMENTATION
Period 2012 to 2016
7.2 Investment
Description Unit Quantity Rate (LakhRs.)
Cost (LakhsRs)
DATA Road Length Km 629 Length of available Pucca Drain Km 192 Drain Length per Km of Road 1 Total Drain Length Km 629 Balance Drain to be executed Km 437 Target for coverage 100% INFRASTRUCTURE Main Drain (Km) 10% Km 66
60.00
3,933.00 Secondary Drain (Km) 30% Km 153
27.00
4,129.65 Tertiary drains (Km) 50% Km 219 8.50 1,857.25 Sub Total Rs. 9,919.90 Repair of existing drains Km 142 3.00 426.00 Total 10,345.90
SAY 10,350.00Rs. 103.50 Crores
City Sanitation Plan - Draft Rourkela Municipality
76
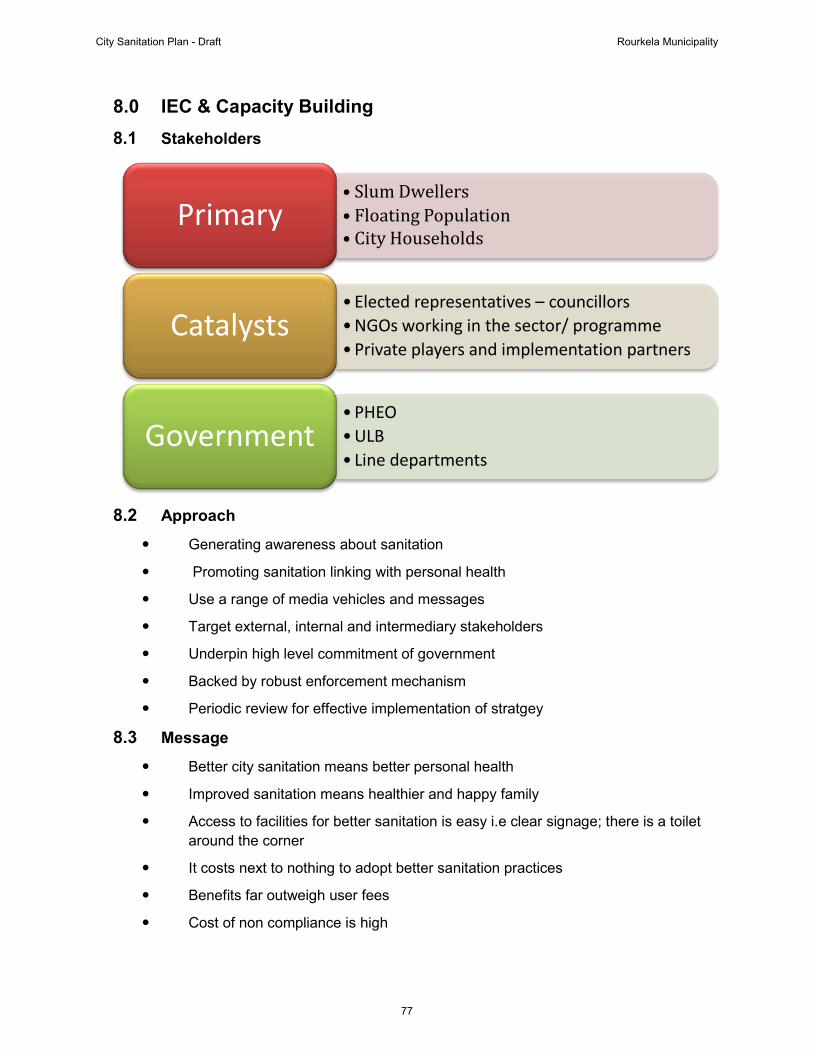
8.0 IEC & Capacity Building8.1 Stakeholders
8.2 Approach
Generating awareness about sanitation
Promoting sanitation linking with personal health
Use a range of media vehicles and messages
Target external, internal and intermediary stakeholders
Underpin high level commitment of government
Backed by robust enforcement mechanism
Periodic review for effective implementation of stratgey
8.3 Message
Better city sanitation means better personal health
Improved sanitation means healthier and happy family
Access to facilities for better sanitation is easy i.e clear signage; there is a toilet around the corner
It costs next to nothing to adopt better sanitation practices
Benefits far outweigh user fees
Cost of non compliance is high
• Slum Dwellers• Floating Population • City Households
Primary
•Elected representatives – councillors •NGOs working in the sector/ programme •Private players and implementation partners
Catalysts
•PHEO •ULB• Line departments
Government
City Sanitation Plan - Draft Rourkela Municipality
77
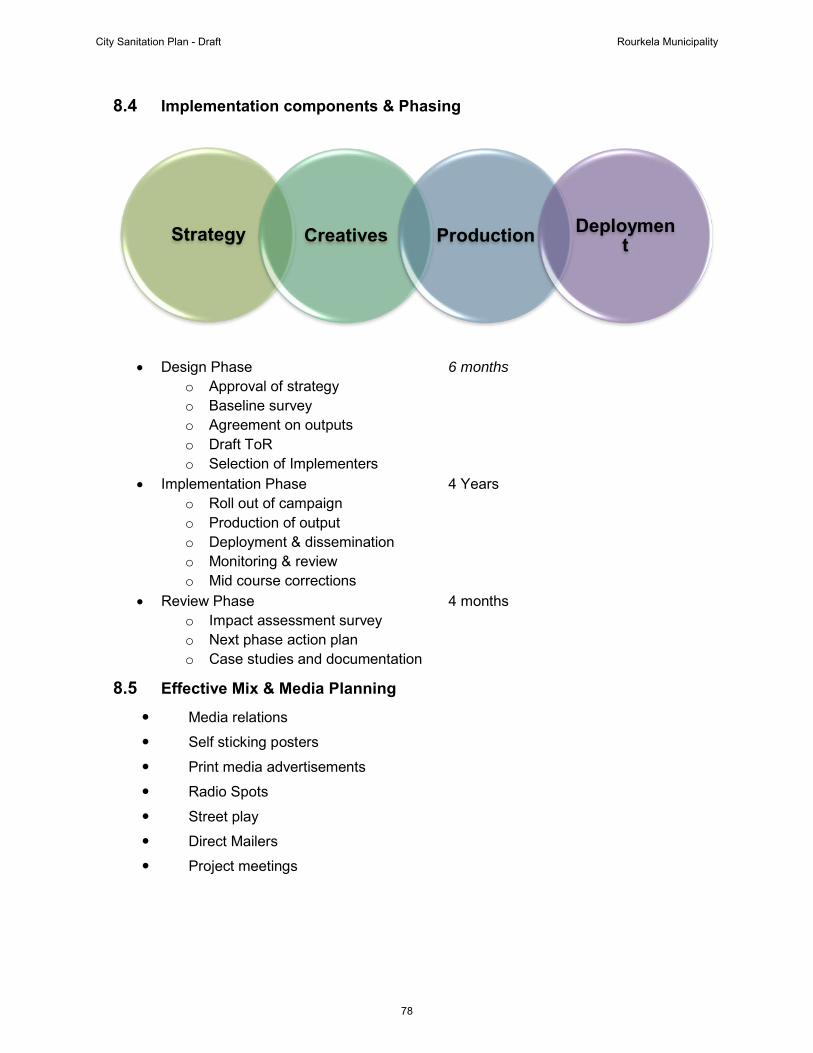
8.4 Implementation components & Phasing
• Design Phase 6 months o Approval of strategy o Baseline survey o Agreement on outputs o Draft ToR o Selection of Implementers
• Implementation Phase 4 Years o Roll out of campaign o Production of output o Deployment & dissemination o Monitoring & review o Mid course corrections
• Review Phase 4 months o Impact assessment survey o Next phase action plan o Case studies and documentation
8.5 Effective Mix & Media Planning
Media relations
Self sticking posters
Print media advertisements
Radio Spots
Street play
Direct Mailers
Project meetings
Strategy Creatives Production Deployment
City Sanitation Plan - Draft Rourkela Municipality
78

8.6 Institutional Strengthening
ULB shall be the obligated entity for ensuring clean sanitation
Capacity building to ULB staff in the aspects of contract management needs to be enhanced
The ULB needs to be trained on Service Level Benchmarking which supports measurement of the city sanitation health.
Governance reforms shall have to be implemented in the city. All fixed assets and infrastructure needs to be owned by ULB
Movable infrastructure/equipment shall be partially owned by ULB or provided by private sector
Management and service provision shall have to be outsourced to private sector
New infrastructure could be developed on Design, Build and Operate contracts
Operational cost recovery to be ensured through direct and indirect user fee/tax regimes
8.7 Investment
Description Cost in Lakhs Rs.
Strategy finalisation 5.00
Personal contact drive 30.00
Print advertisements 55.00
Radio spots 25.00
Posters and flyers 25.00
Events and workshops 47.00
Media relations 10.00
Street theatre 20.00
Audio visual for promotion in fairs 10.00
Flex boards and hoardings 40.00
Supervision 36.00
Documentation and surveys 15.00
Creatives 5.00
Training & Capacity Building 27.00
Total 350.00
City Sanitation Plan - Draft Rourkela Municipality
79

Capital Cost Summary
DescriptionAmount inLakh Rs.
Waste Water Management
24,200.00
Solid Waste Management
2,870.00
Storm Water Drainage
10,350.00
IEC & Capacity Building
350.00
Total 37,770.00
City Sanitation Plan - Draft Rourkela Municipality
80

Annexure 1 - Ward wise Observation Notes- Rourkela
Ward No Major Observations 1 • Ward 1 constitute of two old revenue vi llages, named as Pradhanpalli and
Chend • In this ward maximum number of slums (mostly unauthorized) • Land belongs to Railway Deptt, railway line passes through the ward. • Well spaced between the houses • No drainage and sewerage system in the ward • Solid waste collection is more organized • Maximum BPL households • In few areas water supply through pipeline but most of the areas people are
using well water for drinking purpose • All the main roads are Pacca and lane and bi-lanes are Murom • Most of the drains are broken and maximum area water logging • Most of the slum HH do not have toilet • More dustbin required for waste collection
2 • 90% HHs have toilet provision • In this ward maximum business community people leaving • All the main roads, lanes and bi-lanes are Pacca • Land used for commercial purpose • Very rich people are leaving • Only one slum in the ward • No sewerage and drainage system • Well spaced between the houses • Solid waste collection is more organized • Drinking water is a problem in this ward • More dustbin required for waste collection
3 • Houses are well spaced in non slum area • In this ward maximum number of slums (mostly unauthorized) • No drainage and sewerage system in the ward • No door to door Solid Waste collection practice • No pipe water supply in t he ward but most o f the areas people are using
tube well water for drinking purpose • All the main roads are Pacca and lane and bi-lanes are Murom • Most of the drains are broken and maximum area water logging • Most of the slum HH do not have toilet • Economically people of this ward are very poor • Only Deogaon village is good in water supply and sanitation • More dustbin required for waste collection
4 • Houses are well spaced • In this ward maximum number of slums (mostly unauthorized)
City Sanitation Plan - Draft Rourkela Municipality
81

• No drainage and sewerage system in the ward • No door to door Solid Waste collection • Pipe water supply to each nock and corners of the ward • All the roads are Pacca • Most of the drains are broken and maximum area water logging • Economically people of this ward are very rich • More dustbin required for waste collection
5 • No drainage and sewerage system in the ward • No door to door Solid Waste collection • Pipe water supply to each nock and corners of the ward • All the roads are Pacca • 50% HHs have toilet facility • Most of the drains are broken and maximum area water logging • Economically people of this ward are very poor • More dustbin required for waste collection
6 • This is basically industrial belt area • Houses are well spaced • No drainage and sewerage system in the ward • Door to door Solid Waste collection is practiced by Municipality • No one is defecating outside • Pipe water supply to each nock and corners of the ward • All the roads are Pacca • Economically people of this ward are very rich • Community Latrine is required in slum area • Drinking water crisis in the ward • Drain cleaning is required and awareness not to jam the drain • All the drains are not connected properly • Educational i nstitutions like I TI, U GI, B PUT U niversity, and N CC ca mpus
are located 7 • People are economically rich
• Houses are well spaced in non slum area • No drainage and sewerage system in the ward • Very less number of slums in the ward • Regular water supply is practiced in the ward • No door to door Solid Waste collection practice • All the main roads are Pacca • One p rivate pond i n t he w ard –it i s managed by DAV publ ic School
management • Railway land occupied by Slum people • Only one sl um i n t he w ard –Ambedkar S lum ( water su pply and dr ainage
facility in this slum) • In slum , open defecating in railway line; HH do not have toilet
City Sanitation Plan - Draft Rourkela Municipality
82

• Dustbin is available in the ward but no one is using- need awareness camp for using the garbage bin
8 • People are economically not much well up • Houses are well spaced in non slum area • No drainage and sewerage system in the ward • Maximum area is water logging • Regular water supply is practiced in the ward • No door to door Solid Waste collection practice • All the main roads are Pacca • Drinking water crisis in the ward • Drain cleaning is required and awareness not to jam the drain • All the drains are not connected properly
9 • People are economically not much well up • Houses are well spaced in non slum area • No drainage and sewerage system in the ward • Maximum area covered by slum dwellers • No door to door Solid Waste collection practice • All the main roads are Pacca • Drinking water crisis in the ward • Drain cleaning is required and awareness not to jam the drain • All the drains are not connected properly • Community Latrine required • More Dustbin required and also awareness to use dustbin
10 • People are economically not much well up • Houses are closely spaced in non slum area • Most of the drains are narrow • No sewerage system in the ward • Maximum area covered by slum dwellers • No door to door Solid Waste collection practice • All the main roads are Pacca • Drain cleaning is required and awareness not to jam the drain • All the drains are not connected properly • Community Latrine required • More Dustbin required and also awareness to use dustbin
11 • People are economically not much well up • Houses are closely spaced in non slum area • Most of the drains are narrow • No sewerage system in the ward • Maximum area covered by slum dwellers • No door to door Solid Waste collection practice • Basically residentially area • All the main roads are Pacca
City Sanitation Plan - Draft Rourkela Municipality
83
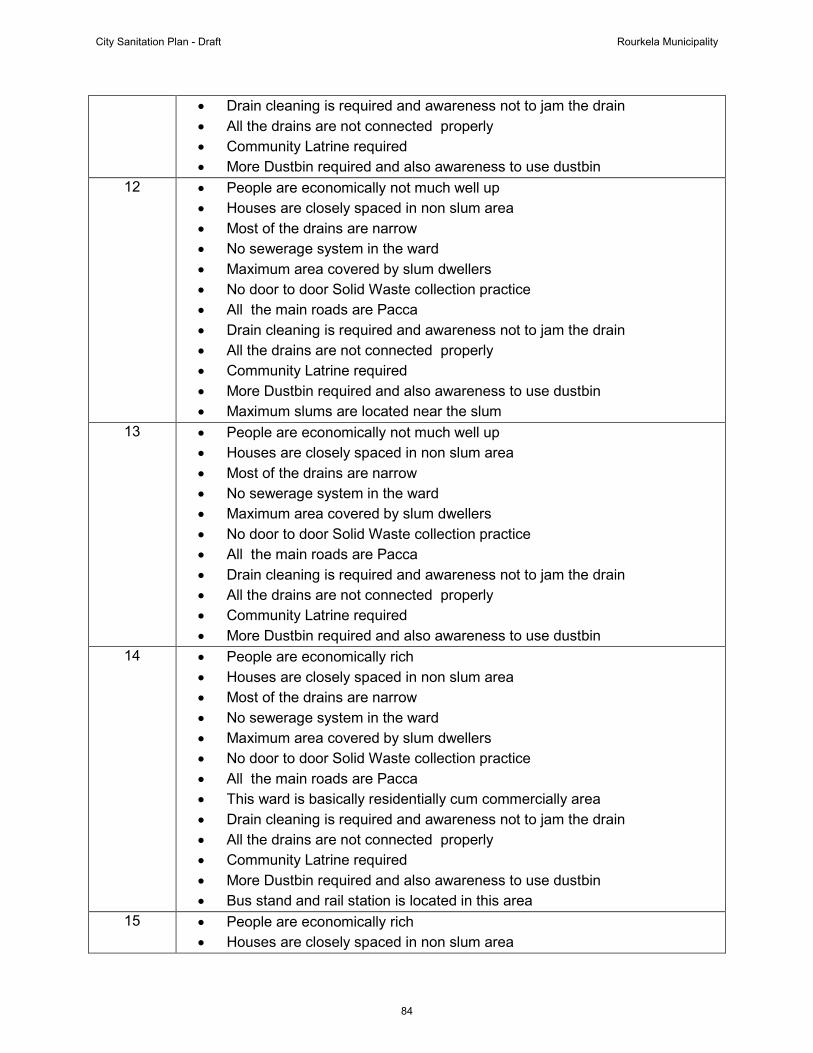
• Drain cleaning is required and awareness not to jam the drain • All the drains are not connected properly • Community Latrine required • More Dustbin required and also awareness to use dustbin
12 • People are economically not much well up • Houses are closely spaced in non slum area • Most of the drains are narrow • No sewerage system in the ward • Maximum area covered by slum dwellers • No door to door Solid Waste collection practice • All the main roads are Pacca • Drain cleaning is required and awareness not to jam the drain • All the drains are not connected properly • Community Latrine required • More Dustbin required and also awareness to use dustbin • Maximum slums are located near the slum
13 • People are economically not much well up • Houses are closely spaced in non slum area • Most of the drains are narrow • No sewerage system in the ward • Maximum area covered by slum dwellers • No door to door Solid Waste collection practice • All the main roads are Pacca • Drain cleaning is required and awareness not to jam the drain • All the drains are not connected properly • Community Latrine required • More Dustbin required and also awareness to use dustbin
14 • People are economically rich • Houses are closely spaced in non slum area • Most of the drains are narrow • No sewerage system in the ward • Maximum area covered by slum dwellers • No door to door Solid Waste collection practice • All the main roads are Pacca • This ward is basically residentially cum commercially area • Drain cleaning is required and awareness not to jam the drain • All the drains are not connected properly • Community Latrine required • More Dustbin required and also awareness to use dustbin • Bus stand and rail station is located in this area
15 • People are economically rich • Houses are closely spaced in non slum area
City Sanitation Plan - Draft Rourkela Municipality
84

• No sewerage system in the ward • Maximum area covered by slum dwellers • All the main roads are Pacca • This ward is basically residentially cum commercially area • All the drains are not connected properly • Community Latrine required • More Dustbin required and also awareness to use dustbin
16 • Maximum area covered by slum dwellers • Houses are closely spaced in non slum area • Most of the drains are narrow • No sewerage system in the ward • No door to door Solid Waste collection practice • All the main roads are Pacca • This ward is basically residentially cum commercially area
17 • People are economically rich • No sewerage and drainage system in the ward • Maximum area covered by govt officials • Door to door Solid Waste collection is practiced • All the roads are Pacca • It well planned, neat and clean ward
18 • People are economically rich • Houses are closely spaced in non slum area • No sewerage and drainage system in the ward • Maximum area covered by govt officials • Door to door Solid Waste collection is practiced • All the roads are Pacca • It well planned, neat and clean ward
19 • Maximum area covered by slum dwellers • People are economically poor • Houses are closely spaced in non slum area • Most of the drains are narrow • No sewerage system in the ward • No door to door Solid Waste collection practice • All the main roads are Pacca
20 • Maximum area covered by slum dwellers • People are economically rich • Houses are closely spaced in non slum area • Most of the drains are narrow • No sewerage system in the ward • Drinking water is a problem in this ward • No door to door Solid Waste collection practice • All the main roads are Pacca
City Sanitation Plan - Draft Rourkela Municipality
85

• This ward is basically residentially cum commercially area • All the drains are not connected properly • Community Latrine required • More Dustbin required and also awareness to use dustbin • Bus stand and rail station is located in this area
21 • People are economically rich • Houses are closely spaced in non slum area • No sewerage system in the ward • Maximum area covered by slum dwellers • No door to door Solid Waste collection practice • All the main roads are Pacca • This ward is basically residentially cum commercially area • Maximum business community people stay
22 • People are economically rich • Houses are closely spaced in non slum area • Most of the drains are narrow • No sewerage system in the ward • Maximum area covered by slum dwellers • No door to door Solid Waste collection practice • All the main roads are Pacca • This ward is basically residentially cum commercially area • Drain cleaning is required and awareness not to jam the drain
23 • People are economically rich • Houses are closely spaced in non slum area • Most of the drains are narrow • No sewerage and drainage system in the ward • Maximum area covered by slum dwellers • No door to door Solid Waste collection practice • All the roads are Pacca • This ward is basically residentially cum commercially area • All the drains are not connected properly • 70% slum people open defecate
24 • Maximum area covered by slum dwellers • People are economically rich • Houses are closely spaced in non slum area • Most of the drains are narrow • No sewerage system in the ward • No door to door Solid Waste collection practice • All the main roads are Pacca • This ward is basically residentially cum commercially area • Drain cleaning is required and awareness not to jam the drain • All the drains are not connected properly
City Sanitation Plan - Draft Rourkela Municipality
86

• More Dustbin required and also awareness to use dustbin 25 • People are not economically well up
• Houses are closely spaced in non slum area • No sewerage and drainage system in the ward • Maximum area covered by slum dwellers • No door to door Solid Waste collection practice • All the main roads are morum
26 • People are economically rich • Maximum area covered by official quarters • All the slums are unauthorized • No sewerage system in the ward • No door to door Solid Waste collection practice • All the main roads are Pacca • Maximum area covered by railway department • This ward is basically residentially cum commercially area • Drain cleaning is required and awareness not to jam the drain • All the drains are not connected properly • Community Latrine required • More Dustbin required and also awareness to use dustbin • Bus stand and rail station is located in this area
27 • People are economically rich • Houses are well spaced in non slum area • Most of the drains are pacca and open • No sewerage system in the ward • Maximum area covered by official quarters • No door to door Solid Waste collection practice • All the main roads are Pacca
28 • People are economically rich • Houses are well spaced in non slum area • sewerage and drainage system in the ward • Door to door Solid Waste collection is practiced • All the roads are Pacca • This ward is basically residentially area and well planned • Drain cleaning is required and awareness not to jam the drain • All the drains are connected properly • Municipality market and hospital is located in the ward
29 • People are economically rich • Houses are well spaced in non slum area • sewerage and drainage system in the ward • Door to door Solid Waste collection is practiced • All the roads are Pacca • This ward is basically residentially area and well planned
City Sanitation Plan - Draft Rourkela Municipality
87

• Drain cleaning is required and awareness not to jam the drain • All the drains are connected properly • Municipality market and hospital is located in the ward
30 • Houses are closely spaced in non slum area • No sewerage and drainage system in the ward • Maximum area covered by slum dwellers • No door to door Solid Waste collection practice • All the main roads are Pacca • In slums all the HH have toilets • This ward is basically residentially area
31 • People are economically rich • Drainage system is available • No sewerage system in the ward • No door to door Solid Waste collection practice • All the main roads are Pacca • This ward is basically residentially area • All the drains are not connected properly • Wide and neat clean road is available
32 • People are economically rich • Most of the drains are narrow • No sewerage system in the ward • No door to door Solid Waste collection practice • All the main roads are Pacca • This ward is basically residentially area
33 • Newly developed ward • Maximum open space • People are economically rich • Wide road and drainage facility • No sewerage system in the ward • No door to door Solid Waste collection practice • All the main roads are Pacca
City Sanitation Plan - Draft Rourkela Municipality
88
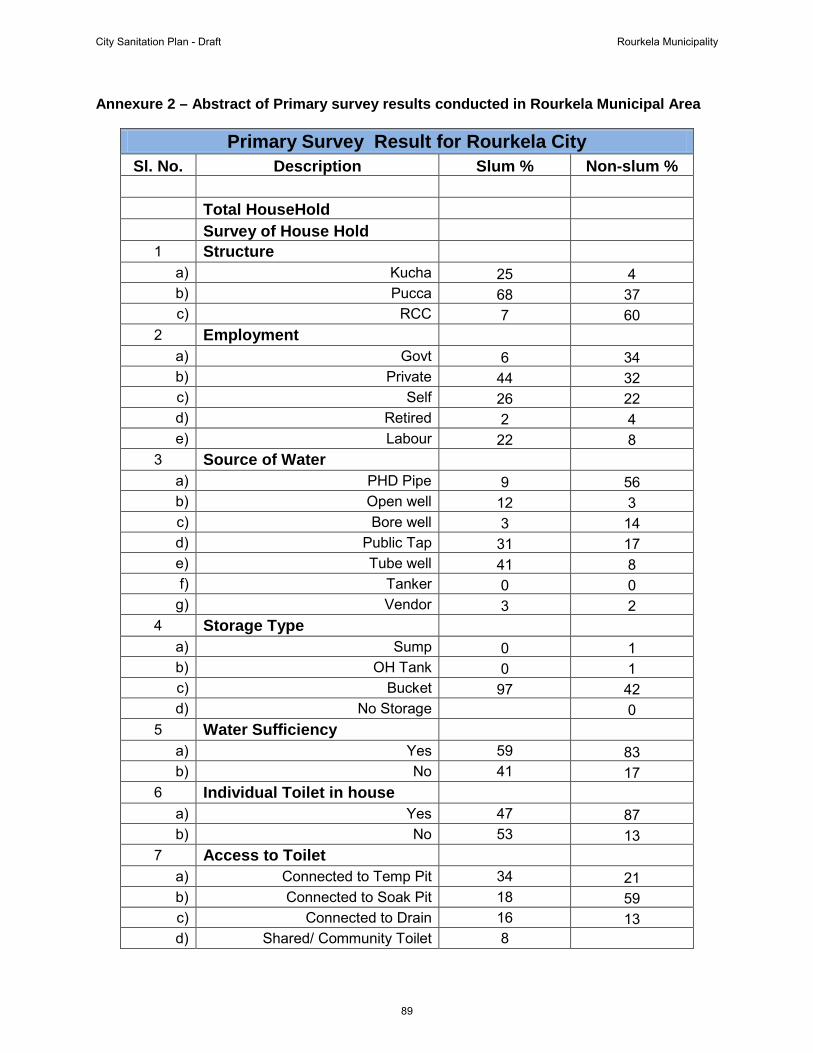
Annexure 2 – Abstract of Primary survey results conducted in Rourkela Municipal Area
Primary Survey Result for Rourkela City Sl. No. Description Slum % Non-slum %
Total HouseHold Survey of House Hold 1 Structure
a) Kucha 25 4 b) Pucca 68 37 c) RCC 7 60
2 Employment a) Govt 6 34 b) Private 44 32 c) Self 26 22 d) Retired 2 4 e) Labour 22 8
3 Source of Water a) PHD Pipe 9 56 b) Open well 12 3 c) Bore well 3 14 d) Public Tap 31 17 e) Tube well 41 8 f) Tanker 0 0
g) Vendor 3 2 4 Storage Type
a) Sump 0 1 b) OH Tank 0 1 c) Bucket 97 42 d) No Storage 0
5 Water Sufficiency a) Yes 59 83 b) No 41 17
6 Individual Toilet in house a) Yes 47 87 b) No 53 13
7 Access to Toilet a) Connected to Temp Pit 34 21 b) Connected to Soak Pit 18 59 c) Connected to Drain 16 13 d) Shared/ Community Toilet 8
City Sanitation Plan - Draft Rourkela Municipality
89

e) Open Defecation 25 1 f) Sewer Line 5
8 Acceptiblity of sewer network a) Yes 55 33 b) No 45 67
9 Open defecation Location a) Drain b) Open Field 76 91 c) Road side 3 3 d) Public Toilet 21 6
10 Kitchen water disposal a) Drain 55 65 b) Open Field 37 19 c) Road side 5 9 d) Soak Pit 2 3 e) Sewer Line 1 5
11 Regular DTD Collection a) Yes 16 37 b) No 84 63
12 Access to SW Bin a) Yes 63 54 b) No 37 46
13 Solid Waste Disposal Point a) SW Bin b) Road Side c) Open Field d) Drain
14 Drainage Facility a) Yes 58 81 b) No 42 19
15 Type of Drain a) Pucca 90 98 b) Kucha 10 2
16 Proper Drainage a) Yes 72 64 b) No 28 36
17 Domestic Animal a) Yes 8 5 b) No 92 95
City Sanitation Plan - Draft Rourkela Municipality
90
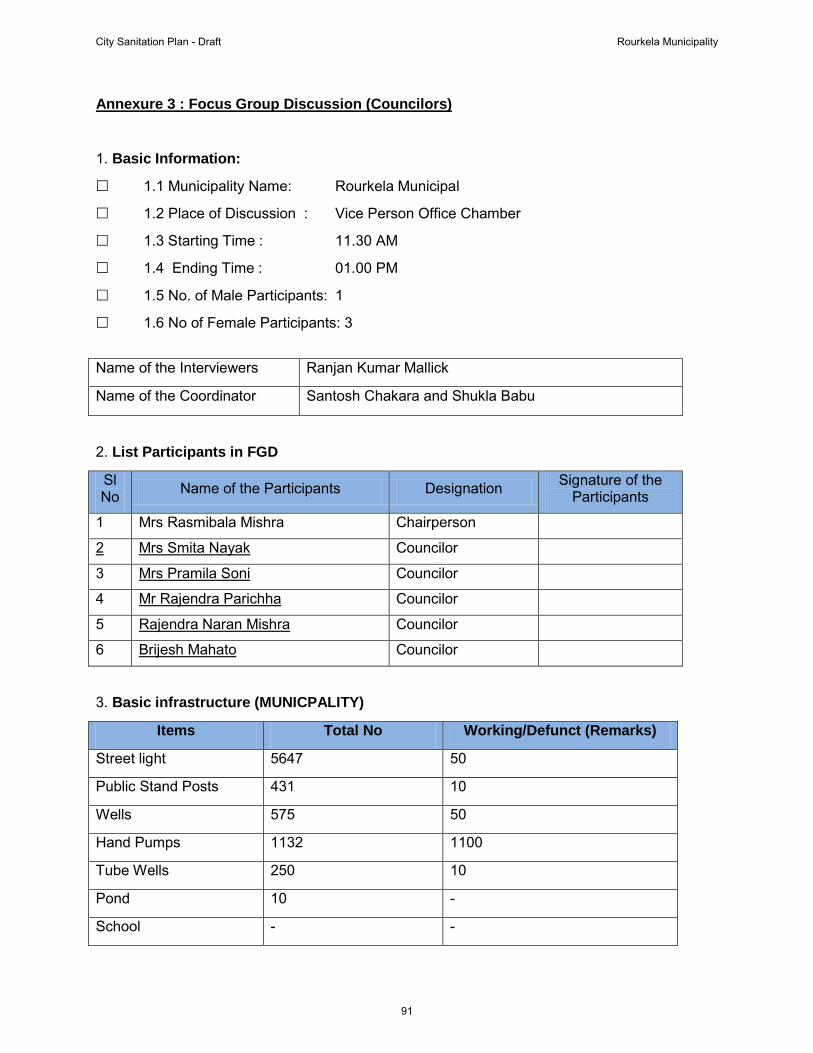
1.1 Municipality Name: Rourkela Municipal
Annexure 3 : Focus Group Discussion (Councilors)
1. Basic Information:
1.2 Place of Discussion : Vice Person Office Chamber
1.3 Starting Time : 11.30 AM
1.4 Ending Time : 01.00 PM
1.5 No. of Male Participants: 1
1.6 No of Female Participants: 3
2. List Participants in FGD
Sl No Name of the Participants Designation Signature of the
Participants
1 Mrs Rasmibala Mishra Chairperson
2 Councilor Mrs Smita Nayak
3 Councilor Mrs Pramila Soni
4 Councilor Mr Rajendra Parichha
5 Councilor Rajendra Naran Mishra
6 Councilor Brijesh Mahato
3. Basic infrastructure (MUNICPALITY)
Items Total No Working/Defunct (Remarks)
Street light 5647 50
Public Stand Posts 431 10
Wells 575 50
Hand Pumps 1132 1100
Tube Wells 250 10
Pond 10 -
School - -
Name of the Interviewers Ranjan Kumar Mallick
Name of the Coordinator Santosh Chakara and Shukla Babu
City Sanitation Plan - Draft Rourkela Municipality
91
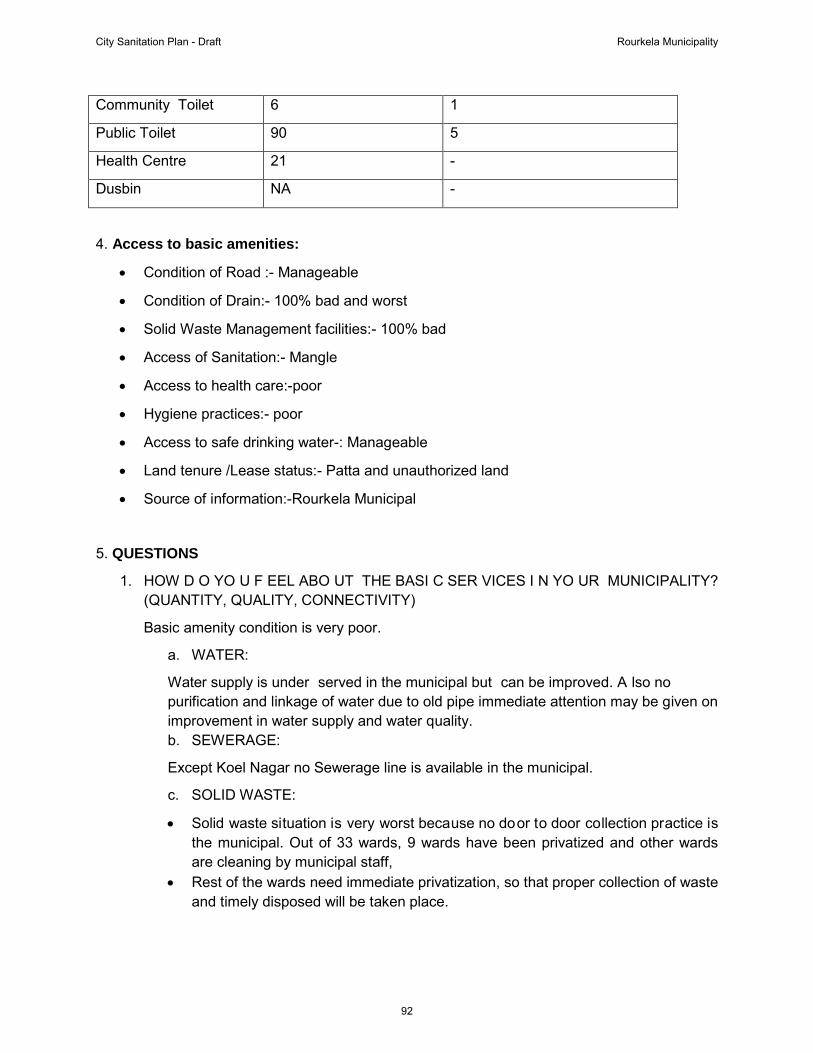
Community Toilet 6 1
Public Toilet 90 5
Health Centre 21 -
Dusbin NA -
4. Access to basic amenities:
• Condition of Road :- Manageable
• Condition of Drain:- 100% bad and worst
• Solid Waste Management facilities:- 100% bad
• Access of Sanitation:- Mangle
• Access to health care:-poor
• Hygiene practices:- poor
• Access to safe drinking water-: Manageable
• Land tenure /Lease status:- Patta and unauthorized land
• Source of information:-Rourkela Municipal
5. QUESTIONS
1. HOW D O YO U F EEL ABO UT THE BASI C SER VICES I N YO UR MUNICIPALITY? (QUANTITY, QUALITY, CONNECTIVITY)
Basic amenity condition is very poor.
a. WATER:
Water supply is under served in the municipal but can be improved. A lso no purification and linkage of water due to old pipe immediate attention may be given on improvement in water supply and water quality. b. SEWERAGE:
Except Koel Nagar no Sewerage line is available in the municipal.
c. SOLID WASTE:
• Solid waste situation is very worst because no door to door collection practice is the municipal. Out of 33 wards, 9 wards have been privatized and other wards are cleaning by municipal staff,
• Rest of the wards need immediate privatization, so that proper collection of waste and timely disposed will be taken place.
City Sanitation Plan - Draft Rourkela Municipality
92

d. DRAINAGE: • In most of the areas drains are not available, where drains are available, that is
broken condition • All the drains are not connected to main drain, for that water logging is a major
problem in the municipal • Poor engineering work for construction drainage • In most of the drain areas houses and temples are built
2. HOW CAN THE WATER SUPPLY SERVICE BE IMPROVED?
For improvement of water supply system in the municipal, following steps are needed
• Two so urce poi nts for Rourkela Municipal ; K oel and B ramani E mbankment i n river
• Supply water to industry needs to be controlled • Proper maintenance of pipe and stop pilferage
3. DO YOU THINK COMMUNITY TOILET IS FEASIBILE IN YOUR CITY, THEN WHICH ARE THE AREAS?
• Land is a problem for community Toilet construction. • Also encroachment • Community toilet is required in wards 26, 13, 9, 10, 11, 12, 19, 20, 1, & 2
4. DO YOU NEED SEWERAGE TREATMENT PLAT IN YOUR CITY. IF YES, WHERE IT SHOULD BE LOCATED?
Yes we need t he se werage treatment plant. This sewerage t reatment plant should be constructed in strategic points of the municipal area.
5. HOW TO SL OVE THE PR OBLEM O F OPEN D EFECATION IN YO UR C ITY? SUGGEST SOME MEASURES?
To solve the open defecation problem, at first to
• Community toilet • Create awareness program for use of toilets • IEC activity in ward level
City Sanitation Plan - Draft Rourkela Municipality
93
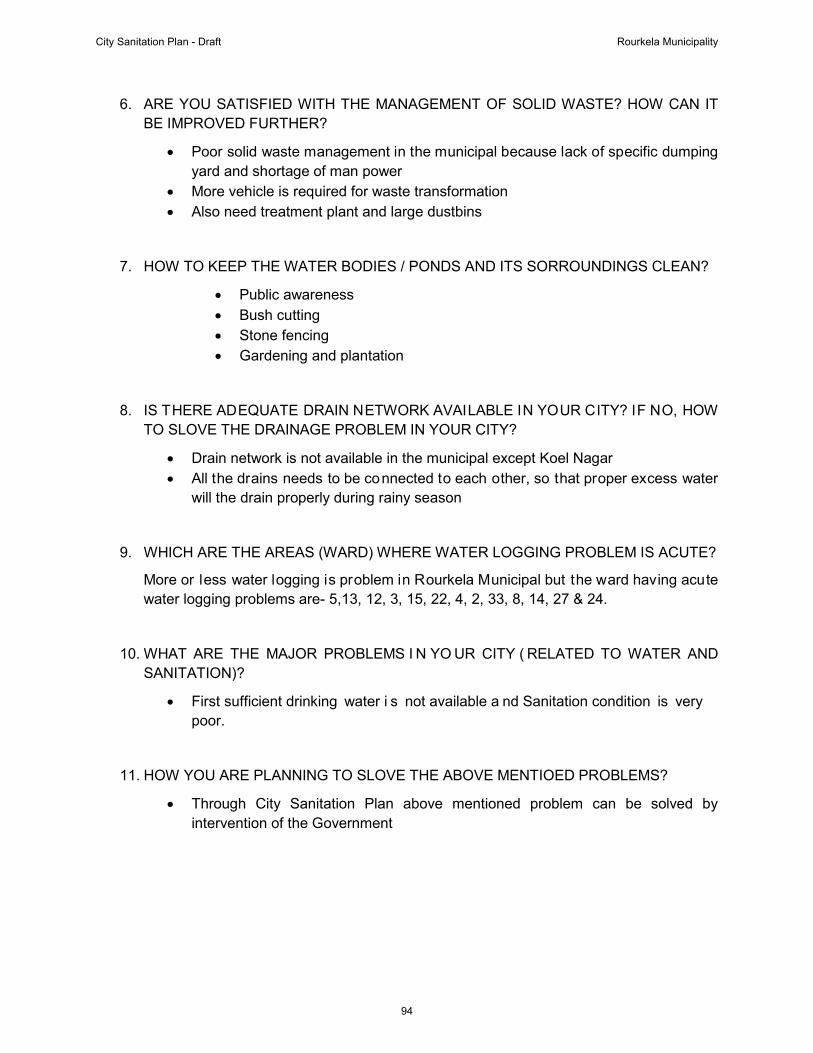
6. ARE YOU SATISFIED WITH THE MANAGEMENT OF SOLID WASTE? HOW CAN IT BE IMPROVED FURTHER?
• Poor solid waste management in the municipal because lack of specific dumping yard and shortage of man power
• More vehicle is required for waste transformation • Also need treatment plant and large dustbins
7. HOW TO KEEP THE WATER BODIES / PONDS AND ITS SORROUNDINGS CLEAN?
• Public awareness • Bush cutting • Stone fencing • Gardening and plantation
8. IS THERE ADEQUATE DRAIN NETWORK AVAILABLE IN YOUR CITY? IF NO, HOW TO SLOVE THE DRAINAGE PROBLEM IN YOUR CITY?
• Drain network is not available in the municipal except Koel Nagar • All the drains needs to be connected to each other, so that proper excess water
will the drain properly during rainy season
9. WHICH ARE THE AREAS (WARD) WHERE WATER LOGGING PROBLEM IS ACUTE?
More or less water logging is problem in Rourkela Municipal but the ward having acute water logging problems are- 5,13, 12, 3, 15, 22, 4, 2, 33, 8, 14, 27 & 24.
10. WHAT ARE THE MAJOR PROBLEMS I N YO UR CITY ( RELATED TO WATER AND SANITATION)?
• First sufficient drinking water i s not available a nd Sanitation condition is very poor.
11. HOW YOU ARE PLANNING TO SLOVE THE ABOVE MENTIOED PROBLEMS?
• Through City Sanitation Plan above mentioned problem can be solved by intervention of the Government
City Sanitation Plan - Draft Rourkela Municipality
94

12. WHICH ARE THE COMMUNITY ORGANISATIONS, ACTIVE IN YOUR MUNICIPALITY?
• Not a single CBO is active in Rourkela Municipality.
13. HOW MUCH DO YOU SPEND ON THE FOLLOWING IN A MONTH?
a. Cable TV: Rs. 150.00
b. Mobile Phone : Rs. 500.00
c. Hospital and medical expenses: Rs. 500
d. Water Supply – To Municipality and Own expenses: to PHD
14. ARE YO U WILLING TO PAY U SER F EE T O G ET BET TER SER VICE, A BET TER LIVING CONDITION AND CLEAN CITY? IF NO, WHY?
• Poor people cannot pay the user fee and minimum amount for all the people.
City Sanitation Plan - Draft Rourkela Municipality
95

Annexure 4: Focus Group Discussion (Officials)
1. Basic Information:
1.1 Municipality Name: Rourkela Municipal
1.2 Place of Discussion : Chairperson Chamber
1.3 Starting Time : 03.00 PM
1.4 Ending Time : 04.00 PM
1.5 No. of Male Participants: 10
1.6 No of Female Participants: 0
2. List Participants in FGD
Sl No
Name of the Participants Designation Signature of the Participants
1 Bijay Kumar Swain Executive Officer
2 Manoranjan Dash City Engineer
3 Dr Hardip Singh Health Officer
4 Planning Officer Dr P.K Nayak
5 Sanitary Inspector Suresh Chandra Jena
6 Sanitary Inspector Purna Chandra Nayak
7 Sanitary Inspector B.K.Padhi
8 Sanitary Inspector K.P.Biswakamal
9 Sanitary Inspector Sisir Sahoo
10 Sanitary Inspector B.K swain
Name of the Interviewers Ranjan Kumar Mallick
Name of the Coordinator Santosh Chakara and Sukla babu
City Sanitation Plan - Draft Rourkela Municipality
96
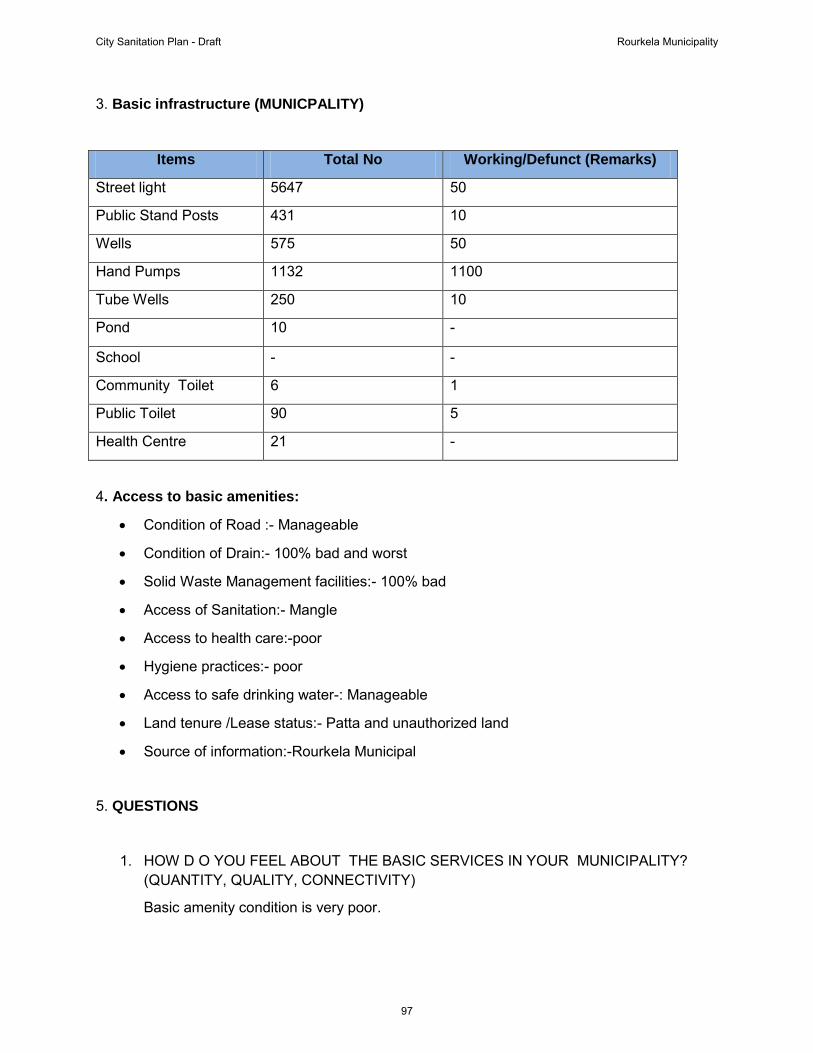
3. Basic infrastructure (MUNICPALITY)
Items Total No Working/Defunct (Remarks)
Street light 5647 50
Public Stand Posts 431 10
Wells 575 50
Hand Pumps 1132 1100
Tube Wells 250 10
Pond 10 -
School - -
Community Toilet 6 1
Public Toilet 90 5
Health Centre 21 -
4. Access to basic amenities:
• Condition of Road :- Manageable
• Condition of Drain:- 100% bad and worst
• Solid Waste Management facilities:- 100% bad
• Access of Sanitation:- Mangle
• Access to health care:-poor
• Hygiene practices:- poor
• Access to safe drinking water-: Manageable
• Land tenure /Lease status:- Patta and unauthorized land
• Source of information:-Rourkela Municipal
5. QUESTIONS
1. HOW D O YOU FEEL ABOUT THE BASIC SERVICES IN YOUR MUNICIPALITY? (QUANTITY, QUALITY, CONNECTIVITY)
Basic amenity condition is very poor.
City Sanitation Plan - Draft Rourkela Municipality
97
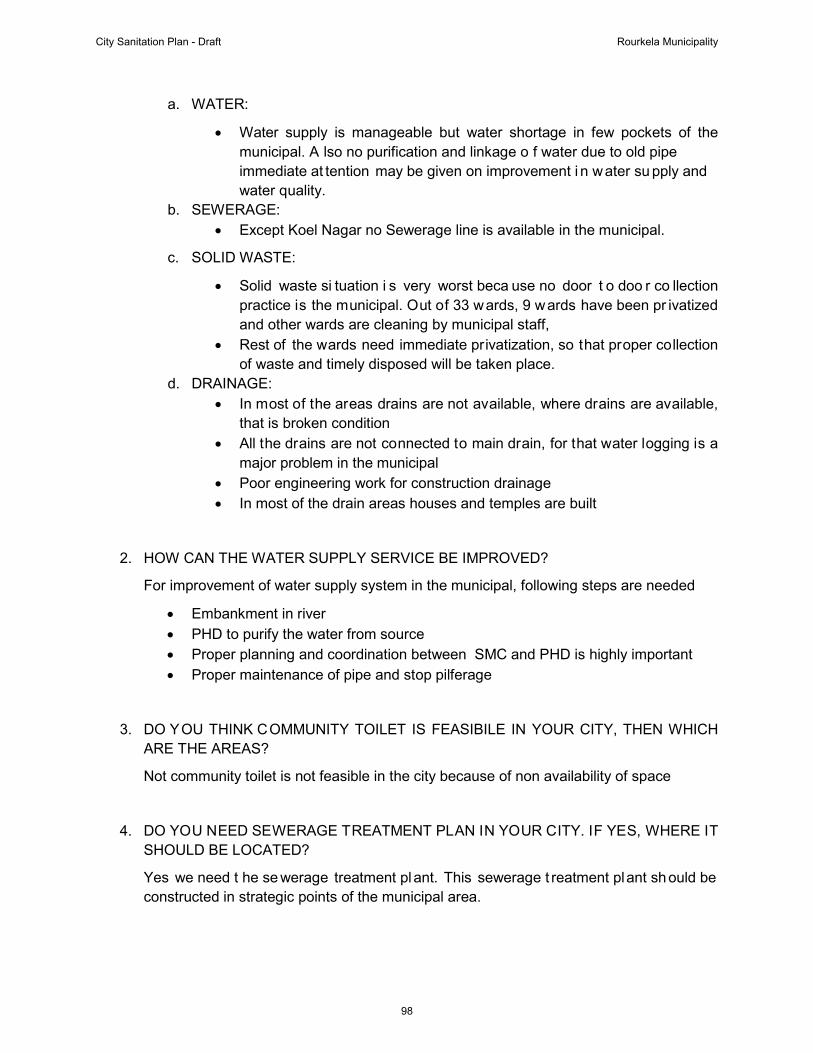
a. WATER:
• Water supply is manageable but water shortage in few pockets of the municipal. A lso no purification and linkage o f water due to old pipe immediate at tention may be given on improvement i n water su pply and water quality.
b. SEWERAGE: • Except Koel Nagar no Sewerage line is available in the municipal.
c. SOLID WASTE:
• Solid waste si tuation i s very worst beca use no door t o doo r co llection practice is the municipal. Out of 33 wards, 9 wards have been pr ivatized and other wards are cleaning by municipal staff,
• Rest of the wards need immediate privatization, so that proper collection of waste and timely disposed will be taken place.
d. DRAINAGE: • In most of the areas drains are not available, where drains are available,
that is broken condition • All the drains are not connected to main drain, for that water logging is a
major problem in the municipal • Poor engineering work for construction drainage • In most of the drain areas houses and temples are built
2. HOW CAN THE WATER SUPPLY SERVICE BE IMPROVED?
For improvement of water supply system in the municipal, following steps are needed
• Embankment in river • PHD to purify the water from source • Proper planning and coordination between SMC and PHD is highly important • Proper maintenance of pipe and stop pilferage
3. DO YOU THINK COMMUNITY TOILET IS FEASIBILE IN YOUR CITY, THEN WHICH ARE THE AREAS?
Not community toilet is not feasible in the city because of non availability of space
4. DO YOU NEED SEWERAGE TREATMENT PLAN IN YOUR CITY. IF YES, WHERE IT SHOULD BE LOCATED?
Yes we need t he se werage treatment plant. This sewerage t reatment plant should be constructed in strategic points of the municipal area.
City Sanitation Plan - Draft Rourkela Municipality
98
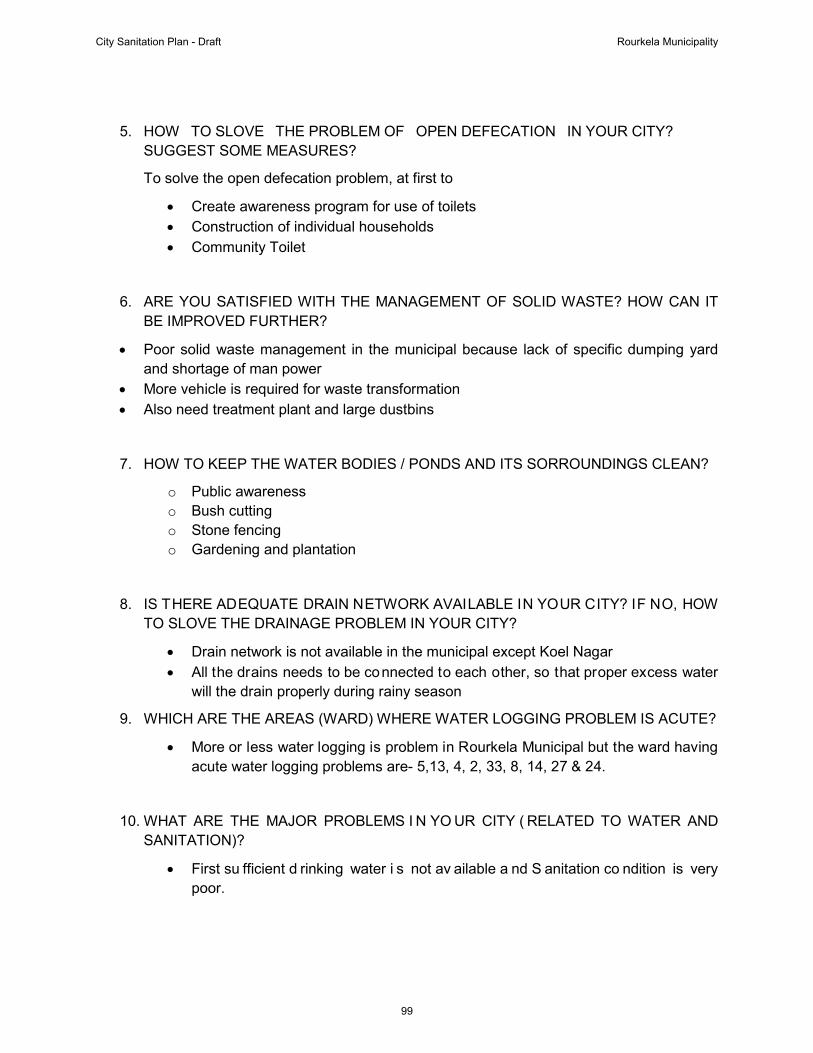
5. HOW TO SLOVE THE PROBLEM OF OPEN DEFECATION IN YOUR CITY? SUGGEST SOME MEASURES?
To solve the open defecation problem, at first to
• Create awareness program for use of toilets • Construction of individual households • Community Toilet
6. ARE YOU SATISFIED WITH THE MANAGEMENT OF SOLID WASTE? HOW CAN IT BE IMPROVED FURTHER?
• Poor solid waste management in the municipal because lack of specific dumping yard and shortage of man power
• More vehicle is required for waste transformation • Also need treatment plant and large dustbins
7. HOW TO KEEP THE WATER BODIES / PONDS AND ITS SORROUNDINGS CLEAN?
o Public awareness o Bush cutting o Stone fencing o Gardening and plantation
8. IS THERE ADEQUATE DRAIN NETWORK AVAILABLE IN YOUR CITY? IF NO, HOW TO SLOVE THE DRAINAGE PROBLEM IN YOUR CITY?
• Drain network is not available in the municipal except Koel Nagar • All the drains needs to be connected to each other, so that proper excess water
will the drain properly during rainy season
9. WHICH ARE THE AREAS (WARD) WHERE WATER LOGGING PROBLEM IS ACUTE?
• More or less water logging is problem in Rourkela Municipal but the ward having acute water logging problems are- 5,13, 4, 2, 33, 8, 14, 27 & 24.
10. WHAT ARE THE MAJOR PROBLEMS I N YO UR CITY ( RELATED TO WATER AND SANITATION)?
• First su fficient d rinking water i s not av ailable a nd S anitation co ndition is very poor.
City Sanitation Plan - Draft Rourkela Municipality
99

11. HOW YOU ARE PLANNING TO SLOVE THE ABOVE MENTIOED PROBLEMS?
• Through City Sanitation Plan above mentioned problem can be solved by intervention of the Government
12. WHICH ARE THE COMMUNITY ORGANISATIONS, ACTIVE IN YOUR MUNICIPALITY?
• Not a single CBO is active in Rourkela Municipality.
13. HOW MUCH DO YOU SPEND ON THE FOLLOWING IN A MONTH?
a. Cable TV: Rs. 150.00
b. Mobile Phone : Rs. 500.00
c. Hospital and medical expenses: Rs. 500
d. Water Supply – To Municipality and Own expenses: to PHD
14. ARE YO U WILLING TO PAY U SER F EE T O G ET BET TER SER VICE, A BET TER LIVING CONDITION AND CLEAN CITY? IF NO, WHY?
• Poor people cannot pay the user fee and minimum amount for all the people.
City Sanitation Plan - Draft Rourkela Municipality
100
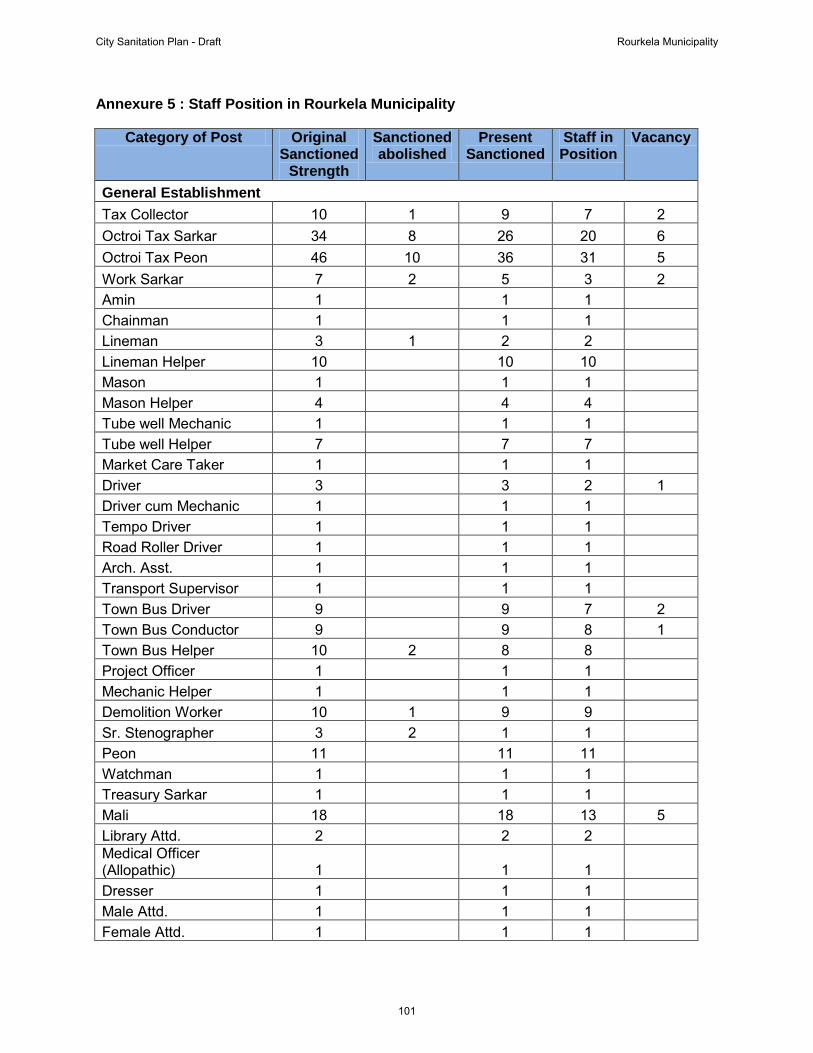
Annexure 5 : Staff Position in Rourkela Municipality
Category of Post Original Sanctioned
Strength
Sanctioned abolished
Present Sanctioned
Staff in Position
Vacancy
General Establishment Tax Collector 10 1 9 7 2 Octroi Tax Sarkar 34 8 26 20 6 Octroi Tax Peon 46 10 36 31 5 Work Sarkar 7 2 5 3 2 Amin 1 1 1 Chainman 1 1 1 Lineman 3 1 2 2 Lineman Helper 10 10 10 Mason 1 1 1 Mason Helper 4 4 4 Tube well Mechanic 1 1 1 Tube well Helper 7 7 7 Market Care Taker 1 1 1 Driver 3 3 2 1 Driver cum Mechanic 1 1 1 Tempo Driver 1 1 1 Road Roller Driver 1 1 1 Arch. Asst. 1 1 1 Transport Supervisor 1 1 1 Town Bus Driver 9 9 7 2 Town Bus Conductor 9 9 8 1 Town Bus Helper 10 2 8 8 Project Officer 1 1 1 Mechanic Helper 1 1 1 Demolition Worker 10 1 9 9 Sr. Stenographer 3 2 1 1 Peon 11 11 11 Watchman 1 1 1 Treasury Sarkar 1 1 1 Mali 18 18 13 5 Library Attd. 2 2 2 Medical Officer (Allopathic) 1 1 1 Dresser 1 1 1 Male Attd. 1 1 1 Female Attd. 1 1 1
City Sanitation Plan - Draft Rourkela Municipality
101

Category of Post Original Sanctioned
Strength
Sanctioned abolished
Present Sanctioned
Staff in Position
Vacancy
Chowkidar 1 1 1 Supervisor 1 1 1 Scavenging Driver 3 3 3 Truck Cleaner 1 1 1 Super Zamadar 10 10 7 3 Sweeper 120 120 120 Defunct NAC (ST) Tax collector 22 1 21 21 Treasury Sarkar 1 1 1 Fees Collector 10 2 8 8 ATS 1 1 1 Fees Peon 4 4 4 Work Sarkar 2 2 2 Electrician 1 1 1 Electrician Wireman 1 1 1 Electric Helper 2 2 2 Plumbing Helper 2 2 2 Ward Attendant 3 2 1 1 Process Server 1 1 1 Peon 3 3 3 Mali 1 1 1 Sweeper Jamadar 2 2 2 Sweeper 24 15 9 9 Peon cum Chowkidar 4 2 2 2 Chowkidar 6 2 4 4 Driver 4 4 4 LFS CADRE Executive Engineer 1 1 1 Asst. Engineer 1 1 1 Junior Engineer (Civil) 3 3 3 Junior Engineer (Electrical) 1 1 1 Sr Asst. 5 5 3 2 Jr. Asst. 17 17 11 6 Community Organiser 4 4 4 Homeopathic Doctor 5 5 5 Pharmacists 1 1 1
TOTAL 482 51 431 387 44
City Sanitation Plan - Draft Rourkela Municipality
102
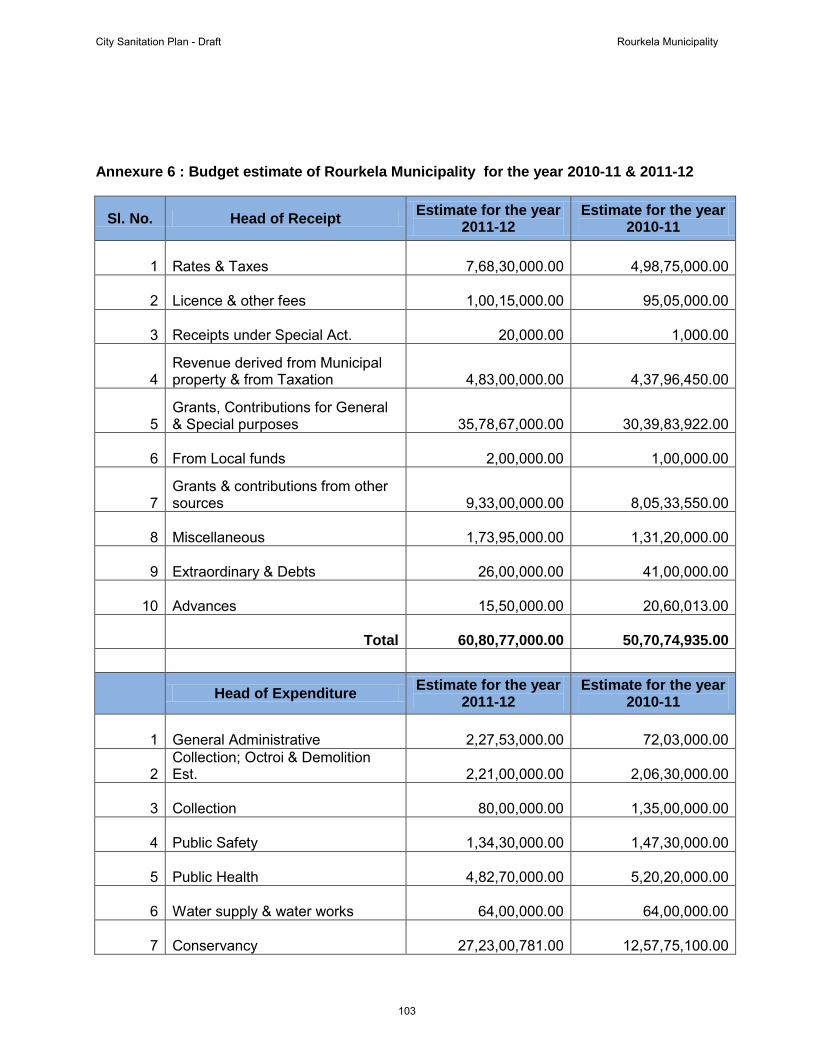
Annexure 6 : Budget estimate of Rourkela Municipality for the year 2010-11 & 2011-12
Sl. No. Head of Receipt Estimate for the year 2011-12
Estimate for the year 2010-11
1 Rates & Taxes
7,68,30,000.00
4,98,75,000.00
2 Licence & other fees
1,00,15,000.00
95,05,000.00
3 Receipts under Special Act.
20,000.00
1,000.00
4 Revenue derived from Municipal property & from Taxation
4,83,00,000.00
4,37,96,450.00
5 Grants, Contributions for General & Special purposes
35,78,67,000.00
30,39,83,922.00
6 From Local funds
2,00,000.00
1,00,000.00
7 Grants & contributions from other sources
9,33,00,000.00
8,05,33,550.00
8 Miscellaneous
1,73,95,000.00
1,31,20,000.00
9 Extraordinary & Debts
26,00,000.00
41,00,000.00
10 Advances
15,50,000.00
20,60,013.00
Total
60,80,77,000.00
50,70,74,935.00
Head of Expenditure Estimate for the year
2011-12 Estimate for the year
2010-11
1 General Administrative
2,27,53,000.00
72,03,000.00
2 Collection; Octroi & Demolition Est.
2,21,00,000.00
2,06,30,000.00
3 Collection
80,00,000.00
1,35,00,000.00
4 Public Safety
1,34,30,000.00
1,47,30,000.00
5 Public Health
4,82,70,000.00
5,20,20,000.00
6 Water supply & water works
64,00,000.00
64,00,000.00
7 Conservancy
27,23,00,781.00
12,57,75,100.00
City Sanitation Plan - Draft Rourkela Municipality
103
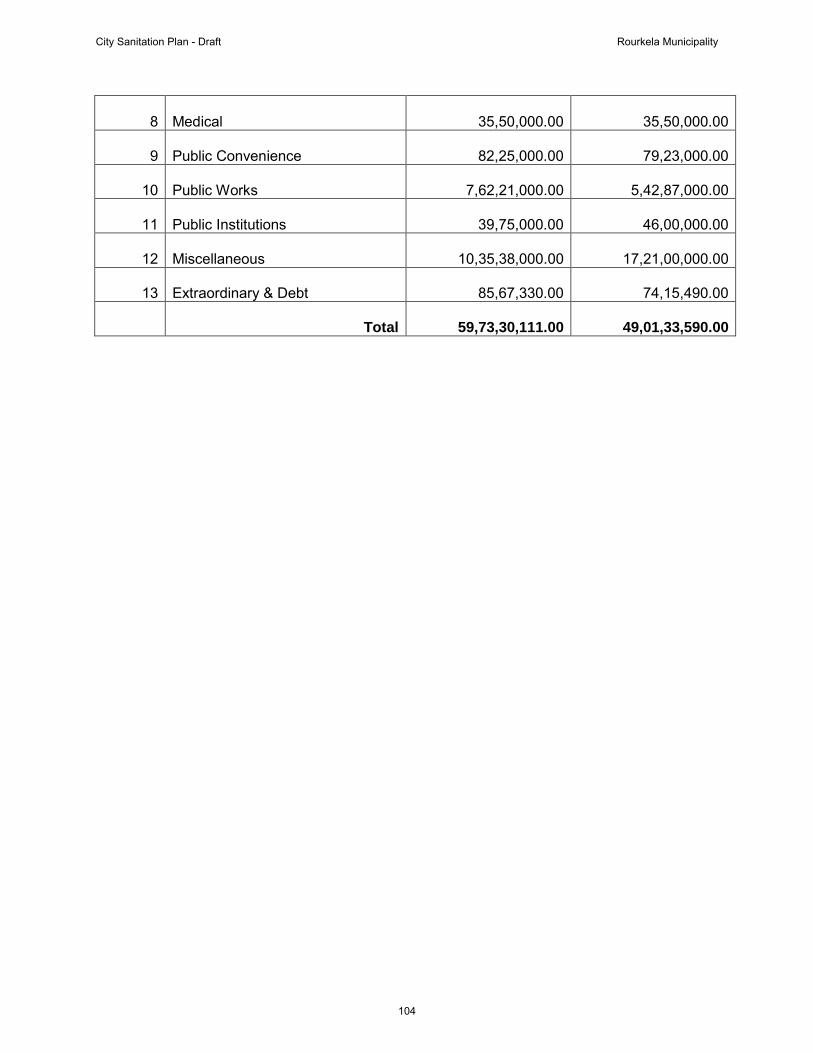
8 Medical
35,50,000.00
35,50,000.00
9 Public Convenience
82,25,000.00
79,23,000.00
10 Public Works
7,62,21,000.00
5,42,87,000.00
11 Public Institutions
39,75,000.00
46,00,000.00
12 Miscellaneous
10,35,38,000.00
17,21,00,000.00
13 Extraordinary & Debt
85,67,330.00
74,15,490.00
Total
59,73,30,111.00
49,01,33,590.00
City Sanitation Plan - Draft Rourkela Municipality
104

ANNEXURE 7
Calculation of solid waste generation
Present Generation
The total population by 2011 - 269602
Present Population
The total Non Slum population - 154622
The total population in slums -114980
Approximate no. of Commercial Estt. - 4000
per capita generation rate in house holds = 350gm/c/day
Present Level of Generation
slum pockets. = 200 gm/cap/day
I) From residential zone - (154622x 0.350)/ 1000 M.T = 54.12 MT
II) From slums - (114980 x 0.200)/ 1000 MT = 23.00 MT III) From commercial Establishment - ( 4000x 2.00 Kg)/1000MT = 08.00 MT
Total = 85.12 MT
Say, 86 MT/day Total Generation at end of Implementation period (2015)
The projected population by 2015 - 280756
Projected Population
Projected households population - 161019
Projected population in slums -119737
Projected no. of Commercial Estt. - 5000
I) From residential zone - (161019 x 0.350)/ 1000 = 56.35 MT
Projected Generation
II) From slums - (119737 x 0.200)/ 1000 = 23.95 MT III) From commercial Establishment ( 5000x 2.00 Kg)/1000 = 10.00 MT IV) MSW from hospitals & nursing homes = 0.56 MT
Total = 90.86MT Say 91 MT/day
City Sanitation Plan - Draft Rourkela Municipality
105

Out of which, organic waste would be 57 MT (63.00%); Inert waste would be 22 MT (24%) and 12 MT (13.00% ) of recyclables waste.
Generation at end of 2030
The projected population by 2030 - 336525
Projected Population
Projected households population - 191819
Projected population in slums - 144706
Projected no. of Commercial Estt. - 15000
Projected Generation of Solid Waste by 2030:
I) From residential zone - (191819 x 0.350)/ 1000 M.T = 67.14 MT
II) From slums - (144706x 0.200)/ 1000 MT = 28.94 MT III) From commercial Establishment - (10000x 2.00 Kg)/1000MT = 20.00 MT
IV) MSW from hospitals & nursing homes = 1.00 MT Total = 117.08 MT Say 118 MT/day
Out of which, organic waste would be 75 MT (63.00%), Inert waste would be 28 MT (24%) and 15 MT (13.00%) of recyclables waste.
City Sanitation Plan - Draft Rourkela Municipality
106
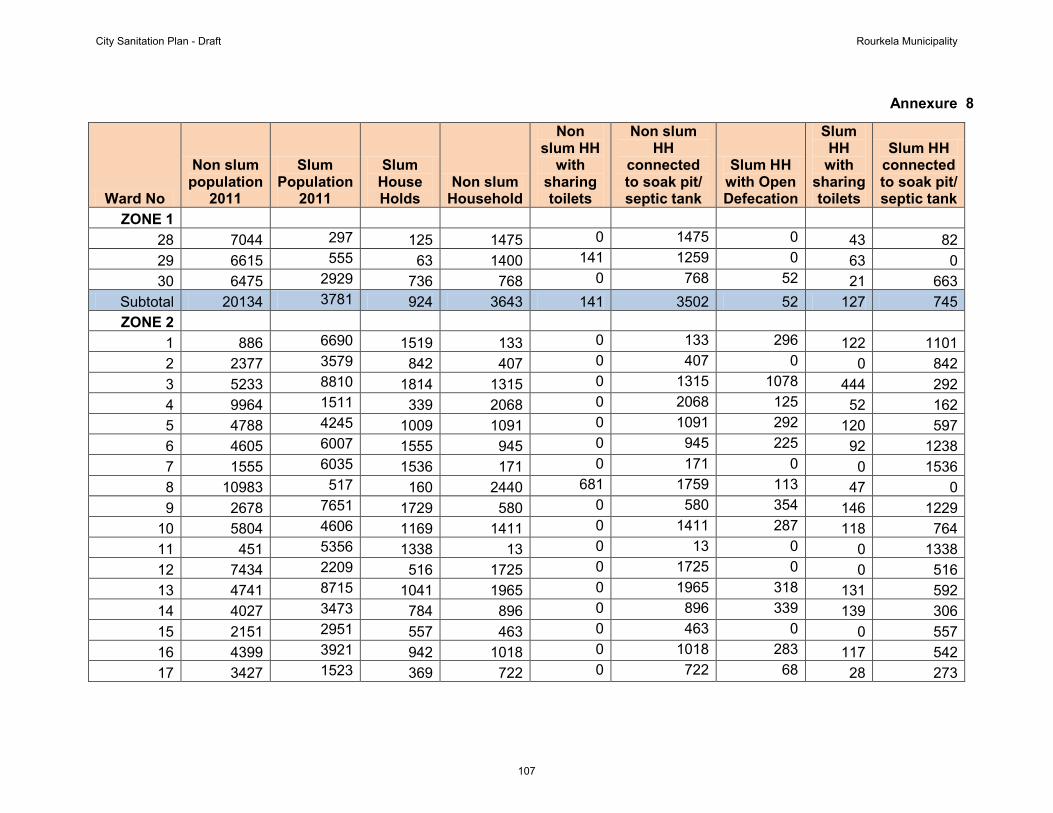
Annexure 8
Ward No
Non slum population
2011
Slum Population
2011
Slum House Holds
Non slum Household
Non slum HH
with sharing toilets
Non slum HH
connected to soak pit/ septic tank
Slum HH with Open Defecation
Slum HH
with sharing toilets
Slum HH connected to soak pit/ septic tank
ZONE 1
28 7044 297 125 1475 0 1475 0 43 82
29 6615 555 63 1400 141 1259 0 63 0 30 6475 2929 736 768 0 768 52 21 663
Subtotal 20134 3781 924 3643 141 3502 52 127 745 ZONE 2
1 886 6690 1519 133 0 133 296 122 1101 2 2377 3579 842 407 0 407 0 0 842 3 5233 8810 1814 1315 0 1315 1078 444 292 4 9964 1511 339 2068 0 2068 125 52 162 5 4788 4245 1009 1091 0 1091 292 120 597 6 4605 6007 1555 945 0 945 225 92 1238 7 1555 6035 1536 171 0 171 0 0 1536 8 10983 517 160 2440 681 1759 113 47 0 9 2678 7651 1729 580 0 580 354 146 1229
10 5804 4606 1169 1411 0 1411 287 118 764 11 451 5356 1338 13 0 13 0 0 1338 12 7434 2209 516 1725 0 1725 0 0 516 13 4741 8715 1041 1965 0 1965 318 131 592 14 4027 3473 784 896 0 896 339 139 306 15 2151 2951 557 463 0 463 0 0 557 16 4399 3921 942 1018 0 1018 283 117 542 17 3427 1523 369 722 0 722 68 28 273
City Sanitation Plan - Draft Rourkela Municipality
107

Ward No
Non slum population
2011
Slum Population
2011
Slum House Holds
Non slum Household
Non slum HH
with sharing toilets
Non slum HH
connected to soak pit/ septic tank
Slum HH with Open Defecation
Slum HH
with sharing toilets
Slum HH connected to soak pit/ septic tank
18 2533 1727 423 537 0 537 0 0 423 19 4364 1756 338 942 0 942 0 0 338 20 5182 4130 826 789 0 789 298 122 406 21 1633 3524 676 307 0 307 30 12 634 22 2030 2397 463 394 0 394 0 0 463 23 2443 2254 576 527 0 527 0 0 576 24 1548 5688 1164 395 0 395 178 73 913 25 3130 1773 409 744 0 744 0 0 409 26 2521 989 267 528 0 528 0 0 267 27 5357 697 154 1207 0 1207 0 0 154 31 6291 4083 982 1471 0 1471 436 180 366 32 7719 4175 923 1683 0 1683 0 0 923 33 14441 3365 1083 2282 0 0 0
Subtotal 134695 110992 24420 30252 1764 28488 4720 1943 17757 Grand total 154829 114773 25344 33895 1905 31990 4772 2070 18502
City Sanitation Plan - Draft Rourkela Municipality
108