city richmond...statistics canada 6 canada mortgage and housing c01poration 5938515 . richmond •...
TRANSCRIPT

To:
From:
City of Richmond
Finance Committee
Jerry Chong Director, Finance
Report to Committee
Date: August 10, 2018
File: 03-0970-09-01/2018-Vol 01
Re: Financial Information -2nd Quarter June 30, 2018
Staff Recommendation
That the staff report titled, "Financial Information- 2nd Quarter June 30, 2018", dated August 10, 2018 from the Director, Finance be received for information.
'NL'~ r J eny Chong
Director, Finance (604-276-4064)
Att: 5
ROUTED TO: Arts, Culture & Heritage Building Approvals Community Bylaws Community Social Development Development Applications Economic Development Engineering Fire Rescue Parks Services Public Works RCMP Recreation Services Library Services
REVIEWED BY STAFF REPORT I AGENDA REVIEW SUBCOMMITTEE
5938515
REPORT CONCURRENCE
CONCURRENCE [3'
[9"
1M 5I or rn-[3"
1:9' rn-@
ltr cgr [9""
INITIALS:
CONCURRENCE OF GENERAL MANAGER
APPROVED BY CA~f L~71A
I' I
I FIN - 7

August 10, 2018 - 2-
Origin
Pre-audited financial information for the 2nd quarter ended June 30, 2018 is being provided to the Finance Committee for review. The repmi provides details on the economic environment, financial results and other key indicator information. The financial information provides Council with an overview of the City's financial results throughout the year and before the annual audited financial statements are presented.
Analysis
Macroeconomic Indicators & Forecast
1) Global Growth- Real Gross Domestic Product (GDP)% Change1
12.0
10.0
8.0
6.0
4.0
2.0
0.0
-2.0
-4.0
2009 2010 2011 2012 2013 2014 2015 2016 2017 2018f 2019f
- Canada - United States - China - World
• Global growth in GDP is projected to reach 3.9% in both 2018 and 2019, unchanged from the International Monetary Fund's World Economic Outlook from April2018.
• The GDP growth forecast for the U.S. and Canada also remains unchanged, though downside risks are increasing amid escalating trade and geopolitical tensions.
• In Canada, GDP growth is forecasted at 2.1% in 2018 and 2.0% in 2019. The U.S. economy is expected to expand by 2.9% and 2.7%, and China is forecasted at 6.6% and 6.4% in 2018 and 2019 respectively.
2) Interest Rates- US and Canadian Overnight Central Bank Rate% at Year-End2
4.00
3.50
3.00
2.50
2.00
1.50
1.00
0.50
0.00 ~----------~---
2009 2010 2011 2012 2013 2014 2015 2016 2017 20l8f 20l9f
- US FED - Canada BOC
1 International Monetary Fund, World Economic Outlook (July 2018)
2 US Federal Reserve, Bank of Canada and Royal Bank Research
5938515
• Throughout the first half of the year, Canadian economic conditions were balanced by accelerating business investment offset by the drop in housing market activity. The Bank of Canada (BoC) overnight lending rate is expected to increase to 2.25% by the end of2019.
• The U.S. Federal Reserve raised the overnight rate in Q2 2018 to 2.0%, the highest level since 2008. Citing strong economic conditions including job creation, wage growth and consumer spending, the rate is forecasted to increase to 3.5% by the end of2019.
FIN - 8

August 10, 2018
3) Exchange Rates- CAD/USD at Year-End3
1.45
1.35
1.25
1.15
1.05
0.95
0.85
0.75 2010 2011 2012 2013 2014 2015 2016 2017 2018f2019f
- CAD per $1 USD
- 3 -
• A national economy performing at capacity caused the U.S. currency to continue to strengthen in Q2 2018.
• Strong data out of Canada influenced the position of the Canadian dollar (CAD). It was the best performing currency against the U.S. dollar (USD) falling only 2.6%.
• The CAD/USD exchange rate ended Q2 2018 at $1.31 CAD per $1 USD. It is expected to end 2019 at $1.28 CAD per $1 USD in anticipation of continued oil price stabilization, economic growth and resulting federal policy rate hikes.
• Downside risks to the CAD include uncertainty over NAFT A negotiations and broader trade tensions sparked by the U.S.
Regional & Local Economic Activity Indicators
4) Unemployment4
7.5
7
6.5
6
5.5
5 I 4.5 I
4 L--------------------~~~ Q3-15
- canada - BC - Metro Vancouver
3 Bank of Canada, Monetary Policy Report (July 2018)
4 Statistics Canada
5938515
02-18
• National and regional economies continue to operate at close to full employment levels throughout the first half of 2018. The unemployment rate in Canada increased in Q2 2018, mainly due to growth in the overall labour force by nearly 76,000 workers.
• Unemploy'ment rates ended the quarter at a low 6.0%, 5.2%, and 4.3% for Canada, B.C. and Metro Vancouver respectively. This represents a decrease of 7. 7% and 15.7% for Canada and Metro Vancouver compared to the same quarter in 2017.
• Over the same period, B.C. ' s unemployment rate increased by 2.0% but remains the lowest in the country.
• This employment growth is expected to put upward pressure on wages due to competition for skilled employees.
FIN - 9

August 10,2018
5) Consumer Price Index (CPI- 2002=100)5
135
130
125
120
115
110 Q3-15
- Canada - BC - Metro Vancouver
6) Housing Starts6
- 4 -
• Inflation, as measured by the consumer price index (CPI), increased in Metro Vancouver, B.C. and Canada in Q2 2018, with energy prices, interest rates and minimum wages contributing to the rise.
• The country's annual inflation rate rose by 2.5% in June as consumer prices grew at their fastest pace in more than six years.
• At the end of Q2 2018, the CPI increased by 3.0% in Metro Vancouver and 2.7% in B.C., compared to the previous year.
• The BoC continues to monitor inflation closely, and increases to its policy interest rate are intended to maintain the CPI rate of increase at the midpoint between 1 and 3 percent.
Housing Sl:uts L ...... - ........ ,. ............ -·--- ----·--·····-,-------"'"-"~"- '-"-- :o:c:c' .. ~ ....................... , .. ,................... ---! • '-~clroVan
• Construction of new homes in Richmond, particularly condos and townhouses, continued to surge in Q2 2018.
.19 ·a
SK
7K
6K
SK
:::l 4K
3K
2K
lK
OK
5 Statistics Canada
6 Canada Mortgage and Housing C01poration
5938515
. Richmond
• Housing starts in Richmond increased by 60% in the first half of 2018, compared to the same period in 2017.
• This contrasts regional totals, where housing starts slowed in Q2 over Q 1. Overall, 2018 year-to-date housing starts in Metro Vancouver increased by 2.4% over the same period last year.
• There were 12,562 housing starts in Metro Vancouver throughout the first six months of2018, and 1,413 in Richmond during the same period.
FIN - 10

August 10, 2018
7) Building Permits - Richmond7
250 ~
.. .2 150 .. > c 0 'P ~ 100
t: c 0 u
2016
Richmond Building Pennlts Issued
Period 2017
- 5 -
Comm~rdo l
Q3 Q4 Ql Q2 Q3 Q4 Ql Q2
7 City of Richmond Building Permits
5938515
• The total number of building permits issued in Richmond throughout the first half of 2018 increased by 9. 0% over the same period in 2017.
• Residential construction was the only category that contributed to this increase, where year-to-date new home construction increased 25% over the same period last year.
• Commercial and industrial building permit activity declined in the same period, by 10% and 33% respectively.
• In total there were 628 residential, 21 7 commercial, and 54 industrial building permits issued in the first half of 2018.
• The total value of construction activity throughout Richmond in the first half of 2018 totaled $485 million.
• Ih the second quarter of 2018 alone, the value of construction activity in Richmond increased by a significant 92% over the same period last year.
• This was mainly attributed to a surge in multi-family residential construction activity that occurred prior to a planned average 2.2% increase in development cost charges in May 2018.
FIN - 11

August 10,2018 - 6 -
8) Commercial Space8
a) Industrial Space
Industrial Space Inventory ('000 SF) • "'"' vno=voo
2016 2017 2018 • "'""'"""
~;~1 .iiliillllnll Q3 Q4 Q1 Q2 Q3 Q4 Q1 Q2
Industrial Space Vacancy (%)
3.0
2.0
Q2-16 Q4-16 Q2-17 Q4-17 Q2-18
b) Office Space
Office Space Inventory ('000 SF) • "''"'v'"''""'" 2016 2017 2018 . Richmond
~ 60K ~-- ------, - ~----------------1 Rlehtnood Trar~slt
! ::IIIIIIIIJ t::!ll:lllllll
Q3 Q4 Ql Q2 Q3 Q4 Q1 Q2
Office Space Vacancy(%) 10 e--------------------------
j a !
2! 0 l---·-···--·-------·-----·---,---------
Q2-16 Q4-16 Q2-17 Q4-17 Q2-18
8 Cushman & Wakefield Office and Industrial Market Beat Reports
59385 i5
• Despite a net addition of 545,000 square feet of industrial space in Richmond over the same period last year, high demand and absorption has kept the industrial vacancy rate low. It ended Q2 2018 at 3.1 %.
• Meanwhile, the vacancy rate in Metro Vancouver decreased again year over year, by 8.3%, and ended Q2 2018 at 2.2%.
• With this acute shortage of industrial space, Richmond and Metro Vancouver are experiencing difficulty accommodating new large users as well as the expansion of existing businesses.
• At 38.5 million square feet, Richmond has the largest inventory of industrial space in the region followed by Surrey (35 million), Burnaby (30 million), Delta (24 million), and Vancouver (24 million).
• The overall office vacancy rate in Richmond increased by 13% over the same period last year. It is now 9% city-wide and close to nil in the City Center.
• Demand for office space around rapid transit stations is increasing as companies seek amenity rich locations that aid their talent attraction and retention efforts amidst a constrained labour market. The uptick in the Richmond office vacancy rate is likely due to companies relocating to this type of space in other communities.
• High demand throughout Metro Vancouver caused the office vacancy rate to decline by 27% year-over-year and ended Q2 2018 at alow4.9%.
FIN - 12

August 10,2018
9) Business Growth - Richmond
a) New Business Licences
Richmond NeW Business Licences .. Number & Employees
...... 20.1~ .. ?QF . . . . . . . . ?Q1,_8 600
fJ § 500 1
. :J
• ~ 400
i 300 ~1 z '
-~QQ..:
2,000
Q3 Q4 Q1 Q2 QJ Q4 Q1
- 7 -
Q2
• There were 982 new business licences issued in Richmond during the first half of 2018, an increase of 6% over the same period in 2017 .
• The addition of 3,556 jobs was attributed to these new businesses.
b) New Business Licences- Commercial Space
900K
BOOK
700K
~ ~SOOK ~ ~
&400K
OK
New Business Licences - Commercial Space Added 2o16 2011 I
Q3 Q4 Q1 Q2 QJ Q4 Ql Q2
5938515
• Almost 1 million square feet of commercial space absorption was tied to the new business licences issued throughout the first half of 2018.
• As industrial users typically require more space, it is not surprising that 56% of total commercial space absorption was warehouse-type industrial space.
• One third of commercial absorption in the first halfof2018 was tied to office-based businesses. Only 13% of commercial space absorption throughout this period was from retail businesses
FIN - 13

August 10, 2018
1 0) Goods and People Movement
a) Regional Cargo Movement9
Regional Cargo Movement Cargo Movon1ont • Alf C01go (Tonncs)
I 2016 2017 , J 201M J• POf1 Con~•c fS (TEU I Q3 Q4 Qt lill_, Q3 I Q4 Qt Q2
900K I il - ~--~-- --
! : l I bOOK i ! I I
J::l . :. I• .I
~ 6 111 c 0
g 4 X
"' 0..
~ 2
0
~60 ~
:!:'!;40 QJ
:J
ID > ~ 20 E 0 0 c:: 0
b) Airport Passengers10
Airport Passengers 2016 2017 2018
1""1 .... 1""1 .... 0' 0' 0' 0'
c) Richmond Hotel Room Revenue 11
Richmond Hotel Room Revenue 2016 2017 2018
1""1 "'" 0' 0' .-t N 0' 0'
1""1 0'
.-t N 0' 0'
- 8 -
• Regional cargo data indicators of regional trade activity continued to demonstrate solid year over year growth in Q2 2018.
• The Port of Vancouver hit a record shipping container volume. In the first half of2018, container movements measured by Twenty-Foot Equivalent Units increased by 5% over the previous year.
• 156,967 tonnes of air cargo moved through the Vancouver International Airpmi (YVR) in the first 6 months of 2018, an 11% increase over the same period last year.
• 2017 was a record-breaking year of growth for YVR. The airport saw 24.2 million passengers throughout the year, an 8.4% increase over 2016.
• 2018 is on track to be another record breaking year. Passenger traffic throughout the first half of the year increased by 8.8% to 12.4 million passengers, over the same period in 2017.
• $78.5 million was collected in hotel room revenue throughout the first five months of 2018 in Richmond, an increase of6.2% over the same period last year.
• 02 data for both 2017 and 2018 include figures from April and May. June figures not yet available.
9 Port of Vancouver Monthly Cargo Statistics
10 YVR Monthly Statistics
11 City of Richmond Additional Hotel Room Tax Ledger; Destination BC
5938515 FIN - 14

August 10,2018 - 9-
Residential Real Estate
In the first half of2018, horne buyer activity has decreased with increasing interest rates, more restrictive mortgage requirements, increases to the property transfer tax and foreign buyer' s tax, introduction of the speculation tax, and the upcoming school tax increase.
Richmond · Q2 YTD Residential Sales 3,453
02-2014 02-2015 02-2016 02-2017 02-2018
90% ' 80% J 70% 1
so% I
30%
20%
Richmond - Q2 YTD Residential Sales-to-Active Listings
--single Family
_.,_ Townhouse
.._Apartmenl
- • All Properties :~: 1-
10%
0% ~--------~----~--~----~
5938515
02-2014 02-2015 02-2016 02-2017 02-2018
Richmond- Q2 YTD Average Residential Days on Market
02-2014 02-2015 02-2016 02-2017 02-2018
-+-Single Family
.... Townhouse
..... Apartment
• Single family detached (SFD) horne sales have continued to decline with a 44% year-over-year decrease.
• Apartment and townhorne sales have declined 27% and 29% respectively yearover-year.
• Apartment sales currently comprise more than half of the residential horne sales in the city. Townhorne sales remain relatively constant and are approximately 23% of cunent horne sales in the city.
• There were 1,810 residential horne sales in Richmond at the end ofQ2 2018, a 32% decrease compared to the same period last year.
• Richmond residential properties had a sales-to-active listings ratio of 20% as at June 30, 2018 which indicates that 20% of the homes listed are sold in the first half of 2018. This is an approximate 15% year-over-year decrease .
• At Q2 2018, SFD properties in Richmond and the Greater Vancouver Regional District (GVRD) had an average of 48 and 42 days on the market, respectively. Comparing to the average of 42 and 40 days in Q2 2017, both Richmond and GVRD SFD markets are slowing.
FIN - 15

August 10,2018
Greater Vancouver· Q2 YTD Average Residential Days on Market
60 T ···---------······-····-······-····-····-····--··-······------------------·-······-·-···- ··-
j
- 10-
: F~=;=== 20 1 ----~---
-+-Single Family
i ' 10 +------------------------------------- ······--------------
.. l ..... ·-······ ·························································· ····r·····
-11-Townhouse
-+-Apartment
02-2014 02-2015 02-2016 02-2017 02-2018
Richmond vs. Greater Vancouver Residential Home Price Index (HPI)
$1 ,700,000
$1,500.000
$1,300,000 -t-----/------
$1,100,000
As at June 30
Gaming Revenue
-+-Richmond Single Family
- r Greater Vancouver Single Family
-+- Richmond Town House
-k Greater Vancouver Town House
-+-Richmond Apartment
-tr Greater Vancouver Apartment
• The Richmond townhorne and apartment average days on market exceed the GVRD average. In Q2 2018, Richmond showed an average of 31 and 26 days for townhomes and apartments, respectively, while GVRD indicated an average of 25 and 21 days.
• The Horne Price Index (HPI) 12 for SFD properties in Richmond at Q2 2018 is $1,648,600 and decreased 0.1% compared to the same time last year.
• The HPI for townhouse properties in Richmond is $854,800 and increased 12% compared to the same time last year.
• The HPI for apmirnents is $683,800 and increased 19% compared to the same time last year. Based on the recent HPI increases, Richmond apmirnent prices are approaching the average GVRD price of $704,200.
In accordance with the Host Financial Assistance Agreement with the Province of BC, the Province pays 10% of net gaming income to the City. Net gaming revenue is calculated as net win from casino games less (i) fees payable by BC Lottery Corporation (BCLC) to the service provider and (ii) BCLC's administrative and operating costs. Distributions are subject to volatility due to fluctuations in net win from casino games, operating costs, and accounting adjustments.
12 Home Price Index is a tool to measure home prices trends in Metro Vancouver and other major markets in the country. It is an alternative
measure of real estate prices that provides the market trends over traditional tools such as mean or median average prices.
5938515 FIN - 16

August 10,2018
Gaming Revenue by Quarter $6.0M
$4.0M
$2.0M
$.OM
Q1 Q2 Q3 Q4
- 11 -
• 2017
• 2018
• Gaming revenue for Q2 2018 increased by 0.2% to $4.39 million compared to $4.38 million in Q2 2017.
• Q2 2018 increased by 1.1% compared to the previous quarter from $4.34 million to $4.39 million.
• At the end of Q2 2018, the City received $8.73 million or 52.9% ofthe annual budgeted amount.
River Rock continues to see a decrease in Tables Drop 13 revenue as a result of the new procedures enacted earlier in the year. The decline continues to be offset by increased Slot CoinIn14 revenue, attributable to the renovations completed in the first quarter.
Effective June 3, 2018, Great Canadian Gaming Corporation (GCGC) signed new Operational Services Agreements (OSA) which replaced the existing casino operating and services agreements with BCLC for all gaming facilities in BC. The new OSAs will increase GCGC's accountability to BCLC through annual business planning requirements, compliance, and standards, while also creating strategic opportunities for greater alignment between BCLC and the GCGC.
On June 27, 2018, the BC provincial government released a repmi on the review of anti-money laundering (AML) policies and practices in Lower Mainland casinos. GCGC has stated that they are continuing to work in collaboration with regulators and Crown corporations to enhance the AML system and that the repmi's recommendations are not expected to have a material impact on GCLC's business.
At the December 11, 2017 Council meeting, the 2018 Budget was approved which included the gaming revenue allocation for 2018. The distribution of these funds is detailed in Table 1 with any surplus revenue transfened to the major capital community facility program (Capital Building Infrastructure Reserve). The distribution is consistent with the 2017 gaming revenue allocation.
Table 1: Distribution of the 2018 gaming revenue allocation Distribution 2018 Budget
Capital Reserves Grants Council Community Initiatives Account Debt Servicing Operating (RCMP) Capital Building Infrastructure Reserve
30% 15% 2%
Fixed Four Officers
Remainder
$5.0M 2.5M 0.3M 5.0M 0.7M 3.0M
Total $16.5M
13 Table drop means the collective amount of money customers deposit to purchase casino chips to wager on table games.
14 Coin in/coin out refer to the number of credits or units both played and paid out. Coin in are the number of units played and coin out are the
number of units won.
5938515 FIN - 17

August 10,2018 - 12-
Operating Activity Table 2 compares budget to unaudited actual activity up to June 30,2018. The net figure represents combined revenue and expense amounts. Actuals includes estimates for revenues earned and expenses incurred to date where invoices may not yet be issued or received.
Table 2: Net Operational Activity for the period January 1, 2018 to June 30, 2018 (in $000 's)
Community Safety (including business licences) ($1 '195)
21,355 ($1,917)
20,356 $722 60%
Community Services Corporate Administration Engineering and Public Works Finance and Corporate Services Fire Rescue Library Planning and Development Policing Fiscal
5,454 20,316 13,179 18,565 4,688 2,719
23,694 (87,543)
4,911 19,700 12,372 18,527 4,674
985 22,925
(88,079)
999 543 616 807
38 14
1,734 769 536
Total Operating $21,232 $14,454 $6,778
Water utility Sanitary sewer utility Sanitation and recycling utility
(864) (154) (267)
(1,174) (291)
(1,138)
310 137 871
Total Utilities ($1 ,285) ($2,603) $1 ,318
5% 10% 3% 6% 0% 0%
64% 3% 1%
36% 89%
326%
1Net Operational Activity does not include amounts related to capital such as: contributed assets, developer contributions, amortization, etc. 2Based on the organizational structure in place as of June 30, 20 18. 3Includes budgeted equity transactions such as transfer to reserves, transfer to provision etc.
The following section provides an explanation on a Division/Departmental basis of year to date variances in relation to the 2018 Financial Plan:
• Community Safety's favourable variance is mainly due to higher than expected revenues from Business Licences and vacant positions which are in the recruitment process.
• Community Services' favourable variance is primarily due to Parks expenditures being lower than budget to date but is expected to be more active throughout the summer months. Recreation also has a favourable variance due to vacant positions that are in the process of being filled.
• Corporate Administration's favourable variance is due to vacant positions in Corporate Programs.
5938515 FIN - 18

August 10, 2018 - 13-
• Engineering and Public Works' favourable variance is mainly due to lower consulting in Engineering and lower contract expenses in Roads.
• Finance and Corporate Services' favourable variance is mainly due to vacant positions which are in the recruitment process and timing of IT maintenance contracts.
• Fire Rescue is on budget.
• Library is on budget.
• Planning and Development's favourable variance is primarily due to higher than expected building permit fees for multi residential buildings and lower than budgeted salary expense due to vacancies in the process of being filled.
• Policing's favourable variance is mainly due to lower than budgeted RCMP contract costs incurred year-to-date, as well as savings from multiple vacant municipal positions.
• Fiscal is on budget.
• The Water Utility's surplus is mainly driven by lower year-to-date Water Purchases as a result of lower water consumption relative to budget, offset by higher material and equipment expenses.
• Sanitary Sewer Utility's favourable variance is due to unbudgeted revenues received from developers for sanitary sewer user fees during construction of residential developments.
• Sanitation and Recycling's favourable variance due to higher than budgeted Garbage Utility and Multi-Material BC revenues, offset by increasing costs to address illegal dumping.
The presentation of the figures for the Financial Statement, Statement of Operations is different than the Net Budget presentation above. The above presentation combines revenues and expenses and presents the net amount inclusive oftransfers. The Statement of Operations presents the revenues and expenses separately and prior to any surplus appropriations and transfer to reserves. The Statement of Operations for the Six Month Period Ended June 30, 2018, with comparative figures for 2017 is included in Attachment 3.
5938515 FIN - 19
August 10,2018 - 14-
Investment Portfolio
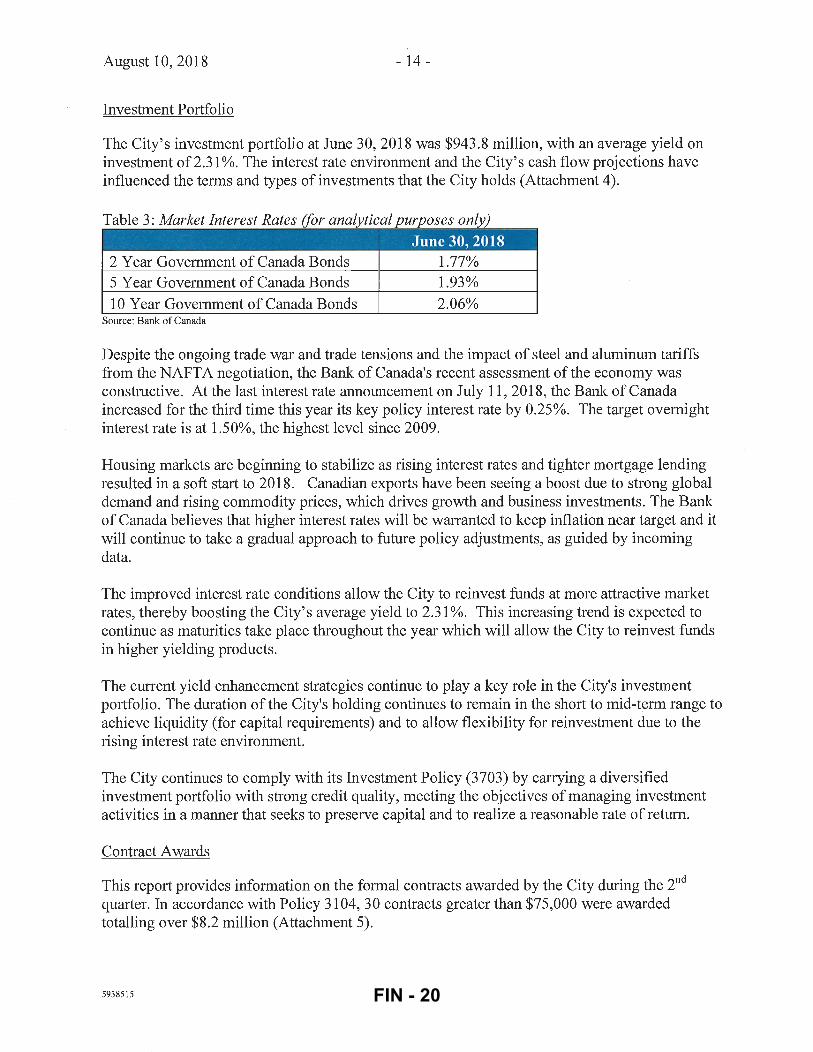
The City's investment portfolio at June 30, 2018 was $943.8 million, with an average yield on investment of2.31 %. The interest rate environment and the City's cash flow projections have influenced the terms and types of investments that the City holds (Attachment 4).
Table 3: Market Interest Rates (for analytical purposes only) ----------------------~--
June 30, 2018 2 Year Government of Canada Bonds 1.77% 5 Year Government of Canada Bonds 1.93%
1 0 Year Government of Canada Bonds 2.06% Source: Bank of Canada
Despite the ongoing trade war and trade tensions and the impact of steel and aluminum tariffs from the NAFTA negotiation, the Bank of Canada's recent assessment ofthe economy was constructive. At the last interest rate announcement on July 11, 2018, the Bank of Canada increased for the third time this year its key policy interest rate by 0.25%. The target ovemight interest rate is at 1.50%, the highest level since 2009.
Housing markets are beginning to stabilize as rising interest rates and tighter mortgage lending resulted in a soft stati to 2018. Canadian exports have been seeing a boost due to strong global demand and rising commodity prices, which drives growth and business investments. The Bank of Canada believes that higher interest rates will be warranted to keep inflation near target and it will continue to take a gradual approach to future policy adjustments, as guided by incoming data.
The improved interest rate conditions allow the City to reinvest funds at more attractive market rates, thereby boosting the City's average yield to 2.31 %. This increasing trend is expected to continue as maturities take place throughout the year which will allow the City to reinvest funds in higher yielding products.
The cunent yield enhancement strategies continue to play a key role in the City's investment portfolio. The duration of the City's holding continues to remain in the shmi to mid-term range to achieve liquidity (for capital requirements) and to allow flexibility for reinvestment due to the rising interest rate environment.
The City continues to comply with its Investment Policy (3703) by carrying a diversified investment portfolio with strong credit quality, meeting the objectives of managing investment activities in a manner that seeks to preserve capital and to realize a reasonable rate of retum.
Contract A wards
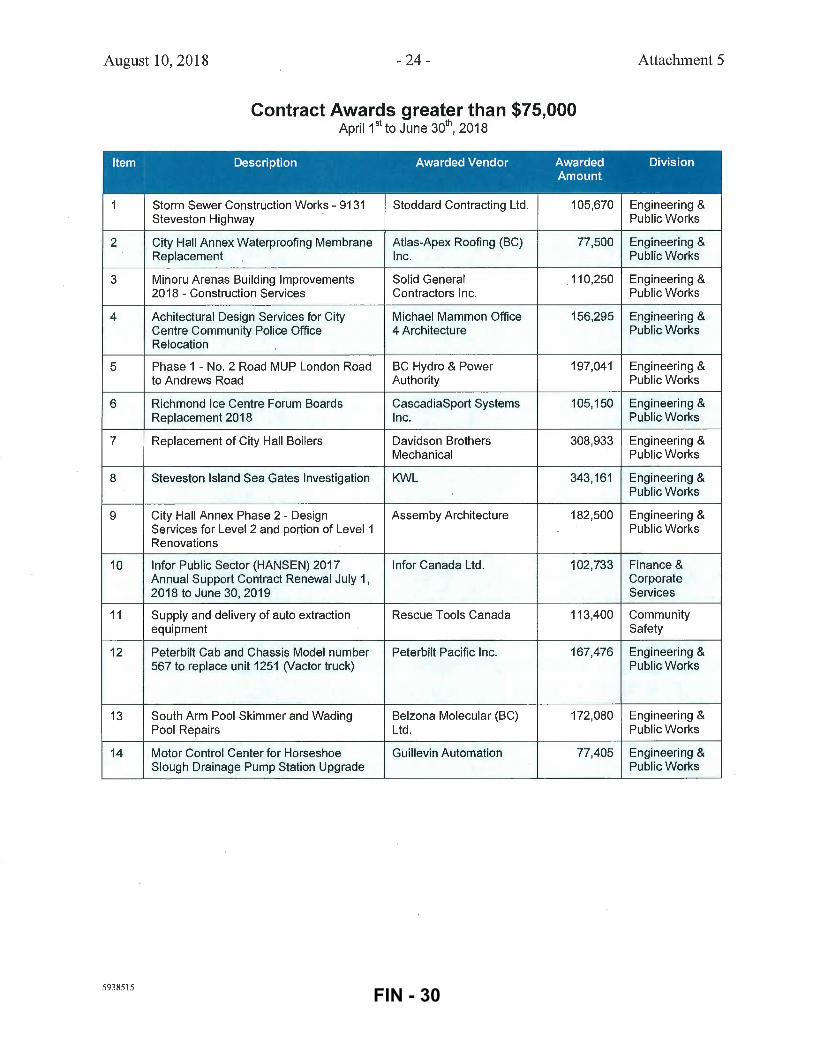
This report provides information on the formal contracts awarded by the City during the 2nd quarter. In accordance with Policy 3104, 30 contracts greater than $75,000 were awarded totalling over $8.2 million (Attachment 5).
5938515 FIN - 20

August 10, 2018 - 15 -
Financial Impact
None.
Conclusion
The City of Richmond is maintaining its strong financial position through the second quarter of 2018. Building construction and development activity are showing signs of moderating from the extreme levels of the past few years due to the constraints on new construction. It is expected that these trends will continue throughout 2018.
' !' I
. ( ! Cindy' Gilfillab, CPA; CMA Manager, Fini ncial Reporting (604) 276-4077
Att. 1: Att. 2: Att. 3: Att. 4: Att. 5:
5938515
Economic Indicators Financial and Key Indicators Unaudited Statement of Operations Investment Portfolio Contract Awards greater than $75,000
FIN - 21
August 10, 2018 - 16- Attachment 1
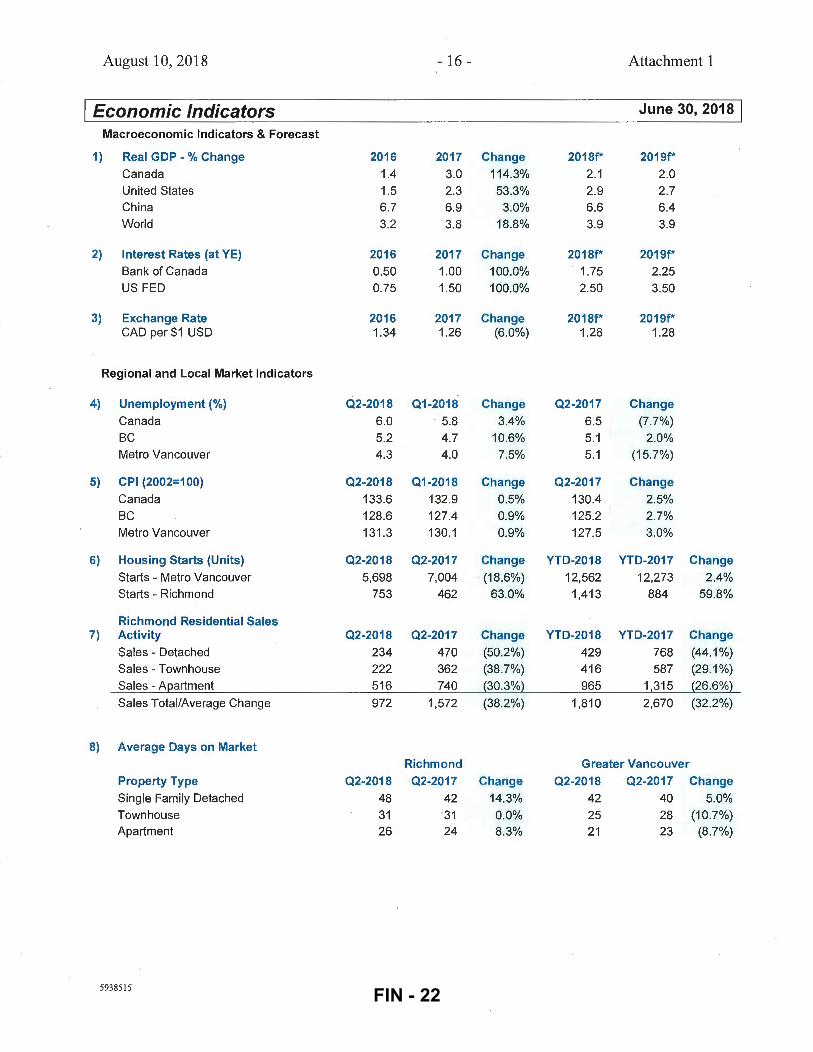
I Economic Indicators June 30, 2018 I Macroeconomic Indicators & Forecast
1) Real GOP -% Change 2016 2017 Change 2018f* 2019f*
Canada 1.4 3.0 114.3% 2.1 2.0
United States 1.5 2.3 53.3% 2.9 2.7
China 6.7 6.9 3.0% 6.6 6.4 World 3.2 3.8 18.8% 3.9 3.9
2) Interest Rates (at YE) 2016 2017 Change 2018f* 2019f*
Bank of Canada 0.50 1.00 100.0% 1.75 2.25
US FED 0.75 1.50 100.0% 2.50 3.50
3) Exchange Rate 2016 2017 Change 2018f* 2019f* CAD per $1 USD 1.34 1.26 (6.0%) 1.28 1.28
Regional and Local Market Indicators
4) Unemployment(%) 02-2018 01-2018 Change 02-2017 Change
Canada 6.0 . 5.8 3.4% 6.5 (7.7%)
BC 5.2 4.7 10.6% 5.1 2.0% Metro Vancouver 4.3 4.0 7.5% 5.1 (15.7%)
5) CPI (2002=1 00) 02-2018 01-2018 Change 02-2017 Change
Canada 133.6 132.9 0.5% 130.4 2.5%
BC 128.6 127.4 0.9% 125.2 2.7%
Metro Vancouver 131 .3 130.1 0.9% 127.5 3.0%
6) Housing Starts (Units) 02-2018 02-2017 Change YTD-2018 YTD-2017 Change
Starts - Metro Vancouver 5,698 7,004 (18 .6%) 12,562 12,273 2.4%
Starts - Richmond 753 462 63.0% 1,413 884 59.8%
Richmond Residential Sales 7) Activity 02-2018 02-2017 Change YTD-2018 YTD-2017 Change
Sales - Detached 234 470 (50.2%) 429 768 (44.1 %)
Sales- Townhouse 222 362 (38.7%) 416 587 (29.1 %)
Sales - A~artment 516 740 (30.3%} 965 1,315 (26.6%}
Sales Total/Average Change 972 1,572 (38.2%) 1,810 2,670 (32.2%)
8) Average Days on Market
Richmond Greater Vancouver
Property Type 02-2018 02-2017 Change 02-2018 02-2017 Change
Single Family Detached 48 42 14.3% 42 40 5.0%
Townhouse 31 31 0.0% 25 28 (10.7%) Apartment 26 24 8.3% 21 23 (8 .7%)
5938515 FIN - 22

August 10,2018 - 17- Attachment 1
I Economic Indicators June 30, 20181
Regional and Local Market Indicators (continued)
9) Home Price Index ($000 at QE)
Richmond Metro Vancouver
Property Type Q2-2018 Q2-2017 Change Q2-2018 Q2-2017 Change
Single Family Detached 1,649 1,650 (0.1%) 1,598 1,588 0.1%
Townhouse 855 766 11.6% 860 746 15.3%
Apartment 684 573 19.4% 704 601 17.1%
10) Richmond Building Permits Q2-2018 Q2-2017 Change YTD-2018 YTD-2017 Change
Building Permits - Residential 350 270 29.6% 628 502 25.1%
Building Permits - Commercial 116 133 (12.8%) 217 242 (10.3%)
Building Permits- Industrial 39 37 5.4% 54 81 (33.3%}
Building Permits Total 505 440 14.8% 899 825 9.0%
Construction Value ($ million) 269.8 140.4 92.2% 484.7 329.7 47.0%
11) Commercial Space (at QE) Richmond Metro Vancouver
Q2-2018 Q2-2017 Change Q2-2018 Q2-2017 Change
Office Vacancy(%) 9.0 8.0 12.5% 4.9 6.7 (26.9%)
Transit Oriented Office Vacancy (%) 2.3 2.3 0.0% 13.6 13.6 0.0%
Office Inventory (000 sf) 4,419 4,419 0.0% 58,243 57,599 1.1%
Industrial Vacancy(%) 3.1 2.7 14.8% 2.2 2.4 (8.3%)
Industrial Inventory (000 sf) 38,539 37,994 1.4% 207,097 203,535 1.8%
12) Richmond Business Growth Q2-2018 Q2-2017 Change YTD-2018 YTD-2017 Change Total Valid Business Licences
(at QE) n/a n/a n/a 14,368 13,912 3.3%
New Licences - Number Issued 529 449 17.8% 982 927 5.9%
New Licences - Employees 1,747 1,845 (5.3%) 3,556 3,551 0.1%
New Licences - Office Added (sf) 137,396 143,711 (4.4%) 296,656 370,485 (19.9%)
New Licences - Retail Added (sf) 73,035 76,517 (4.6%) 129,665 169,241 (23.4%)
New Licences - Industrial Added (sf) 208,990 540,735 (61.4%) 538,743 741,446 (27.3%)
Total Space Added (sf)/Avg. Change 419,421 760,963 (44.9%) 965,064 1,281,172 (24.7%)
5938515 FIN - 23

August 10,2018
Economic Indicators
Regional and Local Market Indicators (continued)
13) Goods & People Movement 02-2018
YVR Air Cargo (tonnes) 84,908 PMV Container Movement
(TEUs) 836,224
YVR Passengers (million) 6.5 Richmond Hotel Revenue
($million)* 35.5 • Hotel room revenue data for 02 excludes June figures.
Notes: a) b) c)
QE indicates quarter end YTD indicates year to date including adjustments f*-forecast to year-end
- 18-
02-2017
73,425
818,294
6.1
34.0
List of Sources: 1)
2)
3)
International Monetary Fund, World Economic Outlook (July 2018)
US Federal Reserve, Bank of Canada and Royal Bank Research
Bank of Canada, Monetary Policy Report (July 2018)
4) &5)
6)
7), B) & 9)
10)
11)
12) 13)
59385 15
Statistics Canada
Canada Mortgage and Housing Corporation Real Estate Board of Greater Vancouver
City of Richmond Building Permits
Cushman & Wakefield Office and Industrial Market Beat Reports
City of Richmond Business Licences Port of Vancouver Monthly Cargo Statistics YVR monthly statistics City of Richmond Additional Hotel Room Tax Ledger, Destination BC
Attachment 1
June 30, 2018
Change YTD-2018 YTD-2017 Change
15.6% 156,967 141,488 10.9%
2.2% 1,637,441 1,558,534 5.1%
6.6% 12.4 11.4 8.8%
4.4% 78.5 73.9 6.2%
FIN - 24

August 10, 2018 - 19- Attachment 2
I Financial and Key Indicators June 30, 20181 (All dollar amounts in $000's)
1) Development Cost Charges 02-2018 02-2017 Change YTD-2018 YTD-2017 Change Contributions Roads, Water, Sewer DCC's
Received $6,820 $3,817 78.7% $11,337 $7,342 54.4%
Parks DCC's Received $7,035 $376 1771 .0% $12,632 $2,055 514.6%
Total DCC Fees Received $13,855 $4,193 230.4% $23,969 $9,397 155.1% DCC Reserves - Uncommitted
balance at QE 87,340 71 ,735 21 .8% n/a n/a n/a
2) Uncommitted Reserves (at OE) 02-2018 02-2017 Change
Capital Funding Reserves . $120,336 $118,639 1.4%
Utility Reserves $93,133 $103,775 (10.3%)
Affordable Housing Reserves $2 ,249 $1,519 48.1%
Other Reserves $65,170 $57,189 14.0%
Total Uncommitted Reserves $280,888 $281 ,122 (0.1%)
3) Taxes to date 02-2018 02-2017 Change YTD-2018 YTD-2017 Change
Taxes Collected $253,195 $248,696 1.8% $263,517 $258,390 2.0%
City Portion of Taxes Collected $124,065 $121,861 1.8% $129,123 $126,611 2.0% Unpaid Taxes- Delinquent &
Arrears (at QE) $5,148 $5,515 (6.7%) n/a n/a n/a No. of Participants on Pre-
authorized withdrawal (at QE) 6,248 6,302 (0.9%) n/a n/a n/a Pre-authorized withdrawals
payments $5,838 $5,619 3.9% $14,542 $13,931 4.4%
Interest rate % paid 1.20% 0.70% 71.4% 1.20% 0.70% 71.4% Sources: All data is from City of Richmond records
4) Investments 02-2018 02-2017 Change
Total Investments $943,806 $1 ,004,077 (6.0%) Average City Rate of Return on
Investments % 2.31 % 1.90% 21 .6%
59385 15 FIN - 25

August 10, 2018 -20- Attachment 2
I Financial and Key Indicators June 30, 20181 (All dollar amounts in $000's)
Financial and Key Indicators (continued)
5) Planning and Development 02-2018 02-2017 Change YTD-2018 YTD-2017 Change Building Permit Fees
Collected $2,568 $2,509 2.4% $5,169 $4,463 15.8% Development Applications
Received 62 60 3.3% 111 100 11.0% Development Applications
Fees $335 $312 7.4% $568 $479 18.6%
6) Business Licences 02-2018 02-2017 Change YTD-2018 YTD-2017 Change Revenue Received for
Current Year Licences $1 '159 $1 ,257 (7.8%) $3,009 $2,888 4.2% Revenue Received for Next
Year (Deferred} $262 $232 12.9% $352 $322 9.3%
Total Licence Revenue $1,421 $1,489 (4.6%) $3,361 $3,210 4.7% Year to date valid licences and revenue include current year licences issued in the prior year.
7) Other Revenues 02-2018 02-2017 Change YTD-2018 YTD-2017 Change
Parking Program Revenue $524 $485 8.0% $974 $917 6.2%
Gaming Revenue $4,389 $4,378 0.3% $8,730 $8,386 4.1%
Traffic Fine Revenue $1,985 $1,948 1.9% $1,985 $1 ,948 1.9%
8) Employees 02-2018 02-2017 Change Full Time Equivalent (FTE}
Employees (at QE) 1,583 1,495 5.9% (City and Library) FTE includes Regular Full Time, Temporary and Auxiliary status employees. The calculation is based on actual results.
9) Operating Indicators 02-2018 02-2017 Change YTD-2018 YTD-2017 Change
Fire Rescue Responses 2,433 2,676 (9.1%) 5,093 5,494 (7.3%) RCMP - Calls for Service
Handled 16,910 16,598 1.9% 32,191 32,596 (1 .2%)
Public Works calls for Service 3,847 4,199 (8.4%) 7,054 8,202 (14.0%)
59385 15 FIN - 26
August 10,2018 - 21 - Attachment 2
I Financial and Key Indicators June 30, 20181 (All dollar amounts in $DOD's)
Financial and Key Indicators (continued)
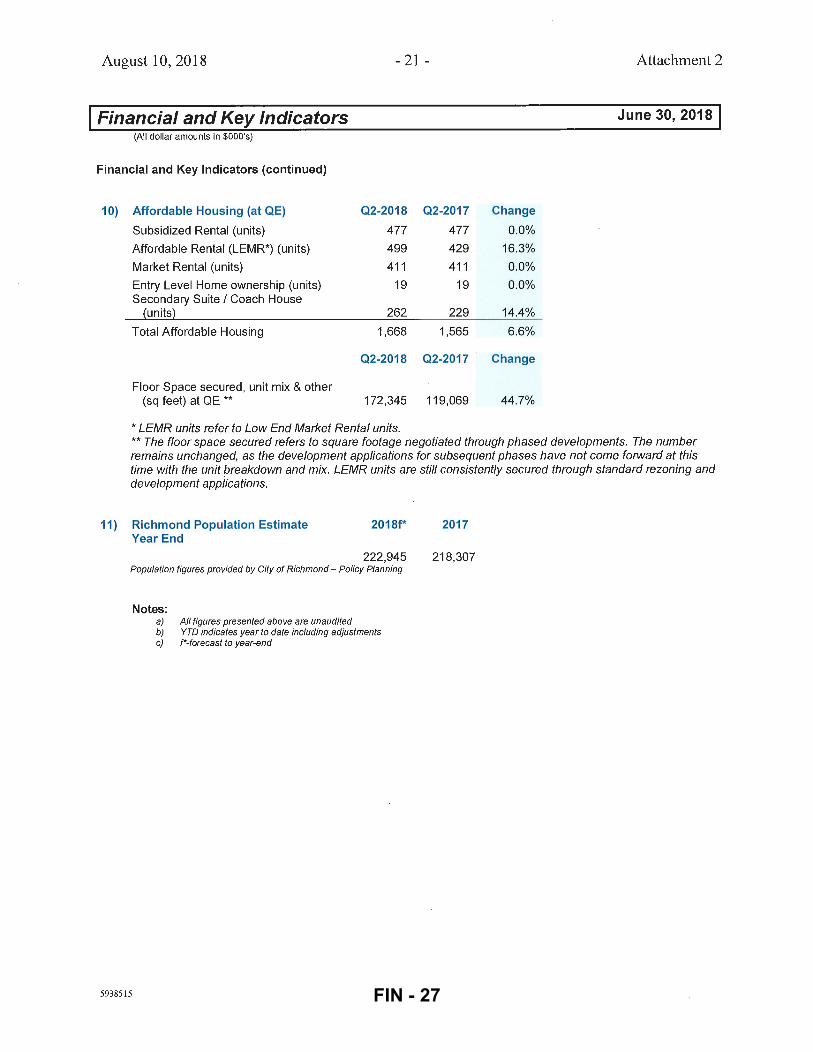
10) Affordable Housing (at QE) Q2-2018 Q2-2017 Change
Subsidized Rental (units) 477 477 0.0%
Affordable Rental (LEMR*) (units) 499 429 16.3%
Market Rental (units) 411 411 0.0%
Entry Level Home ownership (units) 19 19 0.0% Secondary Suite I Coach House
{units} 262 229 14.4%
Total Affordable Housing 1,668 1,565 6.6%
Q2-2018 Q2-2017 Change
Floor Space secured, unit mix & other (sq feet) at QE ** 172,345 119,069 44.7%
* LEMR units refer to Low End Market Rental units. ** The floor space secured refers to square footage negotiated through phased developments. The number remains unchanged, as the development applications for subsequent phases have not come forward at this time with the unit breakdown and mix. LEMR units are still consistently secured through standard rezoning and development appiications.
11) Richmond Population Estimate Year End
2018f*
222,945 Population figures provided by City of Richmond- Policy Planning
59385 15
Notes: a) b) c)
All figures presented above are unaudited YTD indicates year to date including adjustments f*-forecast to year-end
2017
218,307
FIN - 27

August 10, 2018 -22- Attachment 3
Unaudited Statement of Operations 1
For the Six Month Period Ended June 30, 2018, with comparative figures for 2017.
~Ex~ressed in thousands of dollars~
Budget Actuals Actuals4
June 30 June 30 June 30 2018 2018 2017
Revenues:
Taxes and levies $108,352 $108,439 $103,411
User fees 50,393 51,121 48,759
Sales of services 16,354 16,085 15,192
Payments-in-lieu of taxes 7,122 7,324 7,385
Provincial and federal grants 3,142 4,073 3,982
Development cost charges 15,819 8,048 8,973
Other capital funding sources 29,343 12,508 14,373
Investment in Lulu Island Energy Company 414
Other revenues:
Investment income 7,347 9,789 9,383
Gaming revenue 9,895 8,730 8,386
Licences and permits 5,946 7,853 6,546
Other 8,638 17,329 10,801
262,351 251,713 237,191
Expenses:
Community safety 51,017 48,596 44,395 Engineering, public works and project
development 37,735 30,702 29,576
General government 33,559 27,206 26,064
Parks, recreation and community services 32,846 28,315 27,469
Utilities: Water supply and distribution 20,199 19,891 18,414
Sewerage collection and disposal 15,811 15,328 14,662
Sanitation and recycling services 7,918 7,683 6,971
Planning and development 7,833 6,856 6,676
Librarl' services 5,379 5,010 4,789
212,297 189,587 179,016
YTD Surplus (Annual Surplus)2 50,054 62,126 58,175
Accumulated surplus, beginning of year 2,907,697 2,907,697 2,805,390
Accumulated sur~lus, end of June 303 $2,957,751 $2,969,823 $2,863,565
1 Statement of Operations for City and Library after intercompany eliminations, includes investment in Lulu Island Energy Company, but excludes Oval results. 2 Annual Surplus is the difference between revenues and expenses and reflects the change in the accumulated surplus on the Statement of Financial Position. Annual Surplus is prior to transfer to reserves and surplus appropriations. The revenues include capital contributions, development cost charges and other items that impact the investment in tangible capital assets within the accumulated surplus. The expenses include amortization which impacts the investment in tangible capital assets in accumulated surplus. 3 Accumulated surplus is equivalent to the net worth of an organization and is comprised of investment in tangible capital assets, reserves, appropriated surplus, general surplus and other equity. 4 Statement of Operation figures for 2017 were adjusted for comparative purposes.
5938515 FIN - 28

August 10,2018 - 23- Attachment 4
DBRS Asset Long Term Class Rating
Provincial
M(high)
M(high)
A(high)
A(high)
M(low)
Chartered Banks
M
M
M
M(low)
A(high)
M
A(low)
A(low)
M
BC Credit Unions
Pooled Investments
Investment Portfolio June 30, 2018 (in OOO's)
Issuer Term Net Book Value
Alberta 2019-2022 $ 68,574
British Columbia 2019 65,127
Quebec 2022-2023 22,213
Manitoba 2018 12,000
Ontario 2024 11 '199
Total $ 179,114
Bank of Nova Scotia 2018-2022 $ 134,852
TO Bank 2018-2023 81,324
Royal Bank 2018-2023 68,069
NationaiBankofCanada 2018-2021 55,527
HSBC Bank of Canada 2021-2023 32,215
Bank of Montreal 2018-2025 29,941
Canadian Western Bank 2018 15,000
B2B/Laurentian Bank 2018 10,000
CIBC 2018-2022 10,010
Total $ 436,937
Coast Capital Savings 2018-2019 $ 86,909
Van city 2018 62,000
Gulf and Fraser 2018-2019 49,913
Blue Shore Financial 2018-2019 47,716
Westminster Savings 2018 35,642
Total $ 282,180
MFA Pooled Investment Fund $ 45,575
Total Investment Portfolio Balance $ 943,806
7 to 8 years -6to7 years ~
5 to 6 years
4 to 5 years
3 to 4 years
2 to 3 years
1 to 2 years
Investment Maturity
%of Total Portfolio
7.27%
6.90%
2.35%
1.27%
1.19%
18.98%
14.29%
8.62%
7.21%
5.88%
3.41%
3.17%
1.59%
1.06%
1.06%
46.29%
9.21%
6.57%
5.29%
5.06%
3.78%
29.90%
4.83%
100.00%
6 months to 1 year ~-----·------'------... -----·----3 to 6 months
0 to 3 months
50 100 150 200
Millions ($)
5938515
Investment Limit
(%of Portfolio)
50%
50%
30%
20%
250
FIN - 29
August 10, 2018 -24-
Item
1
2
3
4
5
6
7
8
9
10
11
12
13
14
59385 15
Contract Awards greater than $75,000 April 1st to June 301
h, 2018
Description Awarded Vendor Awarded Amount
Storm Sewer Construction Works - 9131 Stoddard Contracting Ltd. 105,670 Steveston Highway
City Hall Annex Waterproofing Membrane Atlas-Apex Roofing (BC) 77,500 Replacement Inc.
Minoru Arenas Building Improvements Solid General . 110,250 2018 - Construction Services Contractors Inc.
Achitectural Design Services for City Michael Mammon Office 156,295 Centre Community Police Office 4 Architecture Relocation
Phase 1 - No. 2 Road MUP London Road BC Hydro & Power 197,041 to Andrews Road Authority
Richmond Ice Centre Forum Boards CascadiaSport Systems 105,150 Replacement 2018 Inc.
Replacement of City Hall Boilers Davidson Brothers 308,933 Mechanical
Steveston Island Sea Gates Investigation KWL 343,161
City Hall Annex Phase 2 - Design Assemby Architecture 182,500 Services for Level 2 and portion of Level 1 Renovations
lnfor Public Sector (HANSEN) 2017 lnfor Canada Ltd . 102,733 Annual Support Contract Renewal July 1, 2018 to June 30, 2019
Supply and delivery of auto extraction Rescue Tools Canada 113,400 equipment
Peterbilt Cab and Chassis Model number Peterbilt Pacific Inc. 167,476 567 to replace unit 1251 (Vactor truck)
South Arm Pool Skimmer and Wading Belzona Molecular (BC) 172,080 Pool Repairs Ltd.
Motor Control Center for Horseshoe Guillevin Automation 77,405 Slough Drainage Pump Station Upgrade
Attachment 5
Division
Engineering & Public Works
Engineering & Public Works
Engineering & Public Works
Engineering & Public Works
Engineering & Public Works
Engineering & Public Works
Engineering & Public Works
Engineering & Public Works
Engineering & Public Works
Finance & Corporate Services
Community Safety
Engineering & Public Works
Engineering & Public Works
Engineering & Public Works
FIN - 30

August 10,2018 - 25-
15
16
17
18
19
20
21
22
23
24
25
26
27
59385 15
Contract Awards greater than $75,000 (continued) April1 51 to June 301
h, 2018
Installation and upgrade of CCTV systems Safe and Sound 128,104 for City Hall and City Hall Annex
Consulting services for Watermania Kasian 91,573 Infrastructure Replacement Project 2018
Sidaway Pavement Improvements BA Blacktop Ltd . 105,303
Sidaway Operations Trailer Britco BOXX Limited 153,622 Partnership
Supply and Deliveryi of Extreme Networks X10 Networks, Inc. 93,837 Equipment
Software upgrades, technical consulting Avolve Software 141,000 services and training .
2018 Oracle (PeopleSoft) Software Oracle Canada ULC 299,102 License & Support
Production Services for the Richmond Anigraph Productions 150,000 Maritime Festival Ltd .
Street and Sidewalk Vegetation Control Western Weed Control 115,000 (2018- 2021) (1980) Ltd .
Consulting Services to Develop a Hemmera Envirochem 134,905 Richmond Middle Arm Waterfront Inc. Brownfield Action Plan
Supply and Delivery of Self-Contained Guillevin International 115,110 Breathing Apparatus Systems for Inc. Richmond Fire Rescue
Supply and Delivery of 1 (one) Tier 4 Finning (Canada) 254,918 (four) Compliant Backhoe
Supply and Install Fitness Equipment for Technogym USA, 401,271 the Minoru Centre for Active Living National Fitness Products
of Canada Inc., Tower Fitness Equipment Services Inc., Fitness Town Commercial , Stak Fitness International Inc.
Attachment 5
Engineering & Public Works
Engineering & Public Works
Engineering & Public Works
Engineering & Public Works
Engineering & Public Works
Finance & Corporate Services
Finance & Corporate Services
Community Services
Community Services
Community Services
Community Safety
Engineering & Public Works
Community Services
FIN - 31

August 10,2018 - 26-
28
29
30
5938515
Contract Awards greater than $75,000 (continued) April 1st to June 301
h, 2018
2018 Paving Program BA Blacktop Ltd. 3,139,337
Supply and Delivery of 1 (one) Excavator Finning Canada 414,341
Supply and Delivery of Multiple Types of Dueck Richmond GM 263,249 Hybrid and Electric Vehicles
Attachment 5
Engineering & Public Works
Engineering & Public Works
Engineering & Public Works
FIN - 32