housing the richmond region - townnews
TRANSCRIPT

Prepared by the Virginia Center for Housing Research at Virginia Tech and the Center for Urban and Regional Analysis at VCU
On behalf of the Capital Region Collaborative, The Partnership for Housing Affordabilitycommissioned this report to determine how we can work together to ensure adequate
housing quality for Richmond residents of all incomes and circumstances.
Housing the Richmond Region:Needs, Impediments, and Strategies

Acknowledgements
The publication of this reportwas made possible through the
generous support of:
• The Community Foundation
• Housing Virginia• The National Association of REALTORS®,
through a Housing Opportunity Grant• The Richmond Association of REALTORS®
• Virginia Housing Development Authority• Virginia Nonprofit Housing Coalition
would also like to acknowledge the following partners:
• Members of the Capital Region Collaborati e, ho concei ed the idea of a Regional Housing Reportand in ited PHA to o ersee its completion;
• The Regional Housing Alliance, a steering group of pri ate, public and nonprofit leaders that o ersathe production of this report;
• The Virginia Center for Housing Research at Virginia Tech, the primary researchers responsible for thedata contained in this report; and
• VCU Center for Urban and Regional Analysis, hich as responsible for collecting and analyzinginformation pro ided by stakeholders through sur eys, inter ie s and a community orkshop
Serving Richmond & Central Virginia

Executive Summary
The Capital Region Collaborative (CRC), a joint effort of the Richmond Regional Planning
District Commission and the Greater Richmond Chamber, asked the Partnership for Housing
Affordability (PHA) to lead the CRC’s efforts to convene a Regional Housing Alliance and develop
a plan to achieve the region’s housing goals. PHA commissioned this study to inform the planning
process. The report discusses the most important results of research and analysis conducted by
Virginia Tech and Virginia Commonwealth University (VCU) and provides information on housing
affordability strategies practiced by communities throughout Virginia and the United States.
The Richmond Regional Planning District faces a big challenge: an annual housing
affordability deicit of $862 million, averaging $6,422 per cost burdened household. Approximately 35% of all households in the planning district are cost burdened, paying more than 30% of their
income for housing, including 15% who are severely cost burdened, paying more than 50% of their
income for housing. Cost-burdened households may have dificulty affording necessities such as food, clothing, transportation, and medical care. Severely cost-burdened households face even
harder choices between housing and other necessities.
The challenge is regional and is shared by each jurisdiction. More than 25% of residents living in each jurisdiction within the Richmond Regional Planning District are cost burdened and
more than 10% are severely cost burdened. Housing cost burdens span all income levels but are
most common among households with low and moderate incomes. Severe housing cost burden is
more common among lower income households, although the majority share of the region’s cost-
burdened households is split relatively evenly among households with extremely low, very low, and low-incomes. A little more than half, 53%, of cost-burdened households own their home.
13.6%
32.3%
0%
10%
20%
30%
40%
50%
60%
70%
80%
90%
100%
Chesterfield Henrico Richmond
City
Charles City
Co
Goochland Hanover New Kent Powhatan
Chart 1: Percent of Households by Cost BurdenData Source: U.S. Census, 2013 American Community Survey, PUMS
Cost Burden >50% Cost Burden 30-49%
Not Cost Burdened PHA Average Cost Burden > 30%
PHA Average Cost Burden > 50%

Thedeicitisgrowing,andmustbeaddressed. In addition to the existing housing affordability challenges faced by the region, the Richmond Regional Planning District will require
100,000 to 132,000 new housing units in order to meet housing demand associated with anticipated growth in the next 20 years. Job growth drives household formation and in-migration, increasing housing demand. Higher- and lower-wage jobs grow in tandem, so the housing affordability deicit grows with demand. Further, regional inlation-adjusted housing costs have increased signiicantly, while inlation-adjusted incomes have increased very little, or not at all. If this trend continues, the affordability problem will increase at an even faster pace than overall housing demand.
Inadequate or unaffordable housing and associated consequences like involuntary moves,
economic segregation, stress, and inancial hardship have well documented ramiications for children and families.1 Studies have associated affordable housing with greater cognitive development in
children2 and housing has been established as the foundation for family well-being.3 Recently,
studies have dispelled myths about the negative effects of affordable housing on property values,
crime, and taxes.4 Further, affordable housing has become central to community development as
housing cost burdens have become more widespread and begun to affect both community resilience
and economic development. Housing unaffordability can have severe long-term consequences for
the economy: slowed population growth and family formation, falling school enrollment rates, and a
less attractive business environment.5
Therearebarrierstoovercome,butwehavetheresourcestobuildasolution. Funding,
negative perceptions, misconceptions, economics, politics, and legacy all present challenges.
Education, collaboration, and creativity can overcome those challenges. More than 170 individuals
including local government oficials, non-proit and for-proit housing developers, service providers, and philanthropic organizations participated in this study. Each interviewee, survey respondent,
and workshop participant takes the affordable housing gap seriously and most are already working
toward solutions or are ready to do so. The efforts of participants in this study indicate a promising
movement to organize the region’s leaders and develop realistic, effective strategies to improve
housing affordability in the planning district.
1Mueller, Elizabeth and Tighe, J. Rosie. 2007. “Making the Case for Affordable Housing: Connecting Housing with Health and Education Outcomes 2Newman, Sandra J. and Holupka, C. Scott. July 2014. MacArthur Foundation “How Housing Matters” Policy Research Brief 3Bratt, Rachel G. 2002. “Housing and family well-being.” Housing Studies, 17(1), 13-26. 4Albright, L., Derickson, E. S., & Massey, D. S. 2011. “Do affordable housing projects harm suburban communities? Crime, property values, and property taxes in Mt. Laurel, New Jersey.” Rochester: Social Science Research Network. doi:http://dx.doi.org/10.2139/ssrn.1865231 5The Urban Institute and the Metropolitan Washington Council of Governments. 2014. “Housing Security in the Washington Region.”
The Partnership for Housing Affordability held a workshop in November 2014 to gather public input.

Solutionscomeinmanyshapesandsizes.The Richmond Regional Planning District
includes three broad types of communities– urban, suburban, and exurban (rural). Each jurisdiction has somewhat different housing affordability challenges and perhaps different political values. Each
community may take a different approach to housing affordability for the population segment most in
need within its community, but each community must take the challenge seriously.
Therearegoodexamplestofollow. Henrico, Chesterield, and Richmond each provided $250,000 in funding to support a 21-room addition to Virginia Supportive Housing’s South Richmond Single Room Occupancy (SRO) complex, expanding the region’s ability to prevent and end homelessness. The City of Portland, Oregon created a coalition of stakeholders, including the U. S.
Department of Housing and Urban Development (HUD), local nonproits, lenders, and city agencies to preserve 11 buildings that provide affordable housing in desirable locations. Similar approaches
could preserve garden style apartments that provide affordable housing throughout our region.
Rockville, Maryland adopted a master plan to create a new, vibrant town center in place of a failing
strip mall. The new center includes 175,000 square feet of shops and restaurants and 644 residential units--both owner-occupied and rental, 15% of which are dedicated as affordable. This project is
very similar to developments throughout Virginia that have attracted signiicant interest from retailers and residents who still want to live in the suburbs, but prefer walkable communities. Across the
country, in virtually every type and size of community, good examples of successful responses to the affordable housing challenge exist.
Wehaveaplacetostart. Building on strategies suggested by participants in the
Partnership’s Affordable Housing initiative, VCU and Virginia Tech have developed eight
recommendations for the Richmond Regional Planning District. Based on the study’s indings, these recommendations include the following approaches.
1. Develop a lexible, dedicated funding source for affordable housing.2. Improve access to the regional transit system, including dedicated funding, expansion, or new service.
3. Create incentives or requirements to site affordable housing near job centers.
Rockville Town Center in Rockville, Maryland is an example of a retroitting retail development project.

4. Expand by-right development to include: • Mixed-use retail-residential centers; • Accessory Dwelling Units such as granny lats or alley lats; and • Inill multifamily development within the urban core and commercial corridors.5. Prioritize the preservation of existing federally-assisted housing and market-affordable units.6. Support access to affordable housing through employer-assisted housing programs.7. Develop a community land trust to support long term affordable housing.
8. Strengthen local and regional coalitions to provide advocacy at the project and policy levels. These practical advocacy efforts should include the coordination and execution of regional demonstration projects that are based upon the joint contributions of the public, private, and non-
proit sectors and that relect best practices in mixed use and mixed income development.
VCU, Virginia Tech, and PHA have also identiied next steps for the Partnership:1. Educate (and frequently reeducate) the entire community about the nature and magnitude of the
lack of affordable housing.
2. Educate the community about options that similar communities have used to address the lack of affordable housing, and the roles that public, private, and nonproit entities can play.3. Monitor the region’s progress in addressing the affordable housing challenge.
4. Celebrate every genuine effort and success. One of PHA’s most valuable tools to change community attitudes may be positive reinforcement--continuously searching for and
inding examples of positive contributions in the region, describing them, and rewarding them with positive media attention.
We can accomplish our goals with community commitment, education, and regional
collaboration. Reducing our regional housing affordability deicit requires each jurisdiction and all community members (employers, for-proit and nonproit developers, elected oficials, county and city staff, advocates, educators, service providers, and individual citizens, etc.) to commit to making
affordable housing more accessible. Education is a key component. Some solutions to the affordable
housing problem, such as building smaller units and multi-family structures, might frighten some
residents who are concerned about negative impacts of higher density development, despite ample
evidence to the contrary. Education will foster community understanding and generate the political
will needed to tackle this challenge. Where there’s a will, there’s a way. For example, the Coalition of Nonproit Housing and Economic Development (CNHED) in Washington, DC, represents 140 organizations, including service providers, nonproit and for-proit housing developers, technical assistance providers, and intermediary lenders in housing and economic development. CNHED led
a “Housing for All” campaign to rally tenants, CNHED members, city council members, and private citizens. CNHED successfully advocated for a dedicated funding source for affordable housing.
ThereportthatfollowsprovidesevidenceofthecomplexaffordablehousingchallengepresentedintheRichmondRegionalPlanningDistrict,butalsodemonstratesthatwehavemanyoftheresourcesweneedtomeetthatchallenge.ThehealthofallcommunitiesintheRichmondRegionalPlanningDistrictdependsontheircitizens’commitmenttoasolution.CommunitiesthroughouttheCommonwealthandthenationhavefoundsuccessfulstrategiestohelpeveryoneaccessaffordablehousing.Buildingontheirexampleandourresources,wecan too.

ExecutiveSummary
1. Introduction...................................................................................................................................1
Background.....................................................................................................................................1
Study Methodology..........................................................................................................................1
2.DeiningtheAffordableHousingChallengefortheRichmondRegionalPlanningDistrict...3
Residents Who Need More Affordable Housing..............................................................................5
The Housing Supply.......................................................................................................................10
Housing Demand Projections........................................................................................................12
3.UnderstandingthePerspectivesofRegionalStakeholders...................................................14 Survey and Interview Results........................................................................................................14
Why Does an Affordability Gap Exist?...........................................................................................15
Who is Responsible for Addressing the Gap?...............................................................................17 What Solutions Would Address the Underlying Causes?..............................................................18 Barriers to Implementation.............................................................................................................22 Overcoming the Barriers................................................................................................................24
November 21, 2014 Housing Stakeholder Workshop....................................................................25
4.ApproachestoAddressingtheChallenge.................................................................................27
1. Develop a lexible, dedicated funding source for affordable housing.........................................27 2. Improve access to the regional transit system, including dedicated funding, expansion, or new service................................................................................................................................28 3. Create incentives or requirements to site affordable housing near job centers.........................28 4. Expand by-right development....................................................................................................29 5. Prioritize the preservation and renovation of existing affordable housing.................................30 6. Support access to affordable housing through employer-assisted programs............................31 7. Develop a community land trust to support long-term affordable housing.................................32 8. Strengthen local and regional coalitions to provide advocacy at the project and policy levels..........................................................................................................................................33
5.RecommendationstoActions....................................................................................................34
Contents

The Social Stability Work Plan of the Capital Region Collaborative (CRC) calls for the
development of “a Regional Housing Alliance to coordinate the research and evaluation of existing housing availability and impediments to achieving the goal of a community with adequate quality
housing for all incomes and circumstances with access to jobs and commerce.” The CRC is a
joint effort of the Richmond Regional Planning District Commission and the Greater Richmond
Chamber. The CRC was formed to address issues that are not conined by city or county limits. It is a partnership between government, business, and community, committed to improving the quality
of life across the Capital Region of Virginia by supporting collaboration. The CRC is made up of
18 representatives from the Greater Richmond Chamber of Commerce and 18 members of the Richmond Regional Planning District Commission (2 representatives from each of the 9 jurisdictions that make up the RRPDC). As such, the area examined in this study includes all 9 jurisdictions in the Richmond Regional Planning District: Charles City County, Chesterield County, Goochland County, Hanover County, Henrico County, New Kent County, Powhatan County, the City of Richmond and the
Town of Ashland.
The CRC asked the Partnership for Housing Affordability (PHA) to convene an alliance and
develop a plan to achieve the region’s housing goals. PHA assembled a group of local housing
and data experts to form the Regional Housing Alliance and commissioned this study to inform the planning process. The Virginia Center for Housing Research at Virginia Tech (VCHR) and
the Virginia Commonwealth University Center for Urban and Regional Analysis (VCU CURA)
collaborated with PHA to:
1. Identify the gap between the current need for affordable housing across all income levels
and the current housing supply that is available for both owners and renters.
2. Research/identify reasons for the gap and identify speciic impediments. 3. Develop strategies for addressing the gap by reducing impediments and creating incentives
for achieving the goal.
4. Develop metrics to evaluate progress towards closing the gap.
This report to the Partnership for Housing Affordability relects the most important results of research and analysis conducted by VCHR and VCU CURA and information on housing affordability
strategies practiced by communities throughout Virginia and the United States. The appendices
included in the web version of the report provide data and additional details. The web version of the
report can be found at www.PartnershipHousingAffordability.com, www.vchr.vt.edu, and www.wilder.
vcu.edu/research/cura/. One to two page descriptions of housing affordability in each of the county-
equivalent Richmond Regional Planning District jurisdictions are included in Appendix 1.
VCHR analyzed quantitative data to deine the housing affordability gap and the current need for affordable housing across all income levels. Preliminary results of the quantitative data analysis
informed qualitative analysis conducted by VCU CURA. VCU CURA solicited expert views on the reasons for the housing affordability gap and ways to solve it. VCU CURA and VCHR identiied and assessed strategies for addressing the gap, in partnership with PHA, the Regional Housing Alliance,
and study participants. In addition, VCHR and VCU CURA consulted with housing policy expert Charles Buki to identify practical solutions and examples from comparable communities.
Background1. Introduction
Study Methodology
1

VCHR analyzed American Community Survey (ACS) and Comprehensive Housing Affordability
Strategy (CHAS) data at the county and independent city level to:
• Assess cost burdened households by income category, tenure, and household
characteristics (age, household type, number of children); • Proile housing demand by income category, number of households, tenure, age, household type, household size, number of children, housing assistance and other public assistance,
housing costs and cost burden, presence of subfamilies and grandchildren, adult progeny,
non-relatives, persons with disabilities by age of person, and veteran status; • Proile of housing supply by price or rent affordable to each income tier and the following housing stock characteristics: tenure, occupancy, age, size, and housing problems as
deined by the U.S. Census; • Prepare multiple measures of the affordability gap to identify affordability problems (e.g.
inadequate gross supply, inadequate supply available to occupy, excess turn-over or ‘churning’, inadequate supply due to demand from next tier income categories, and the total housing affordability deicit).
VCHR used standard (published) ACS and CHAS tables whenever possible. For detailed
characteristics unavailable in published tables, VCHR prepared estimates by calculating segmented
distributions from ACS Public Use Microdata Sample (PUMS) iles and applied these PUMS distributions to published tables using a best-it algorithm for each jurisdiction. VCHR used PUMS iles for 1, 3, or 5-year ACS samples based on the sample size for the applicable Public Use Mircodata Area(s) for each jurisdiction.
VCHR also projected housing demand using two alternative projection scenarios. Scenario A
assumes that the pattern of growth in ‘birth cohorts’ between 2000 and 2010 for each jurisdiction will stay constant across 2010-2020 and 2020-2030, whereas Scenario B uses a population projection that relies on the trend from 1950 through 2010 to project total population into the future and on the average Cohort Change Ratio for 1990 to 2000 and 2000 to 2010. Scenario B uses the age-speciic population projections published by the Weldon Cooper Center at the University of Virginia, but
substitutes Chesterield County’s own projections for that county. Scenario A uses Cohort Change Ratios for 2000 to 2010.
VCU CURA conducted in-depth interviews with 12 regional housing experts. The interviews were semi-structured with a standard set of questions to guide the discussion. VCU CURA used the
responses collected from these interviews to develop an online survey instrument and sent it to more
than 700 practitioners in the region. 162 people completed the survey.
VCU CURA led the design and planning for the housing affordability workshop. PHA invited
260 regional housing experts to attend the workshop to review the results of the research conducted by VCHR and VCU CURA; 65 attended. The workshop participants examined the responses to the survey and interviews and discussed potential ways to decrease the affordability gap in the planning
district. Workshop facilitators divided the participants into groups based on the type of jurisdiction
they represented (rural, suburban, or urban) to better focus the discussions. These groups reported
to the larger group and engaged in a discussion about the feasibility of the proposed solutions.
VCU CURA synthesized indings from the qualitative research described above, recommendations from housing policy expert Charles Buki, and a summary of literature on
2

successful strategies for increasing the availability of housing affordable to households and special
populations in each income category. VCU CURA proposed eight strategy recommendations, three
key regional objectives, and four action items for PHA, based on their analysis of these three bodies
of work and the scale of the housing affordability challenge as deined by VCHR.
2. Deining the Affordable Housing Challenge for the Richmond Regional Planning District
The planning district’s annual housing affordability deicit is $862 million, an average of $6,422 per household. This deicit is the amount of additional money needed to completely eliminate the region’s housing cost burdens (the gap between actual gross housing costs and 30% of the
household’s income). The housing affordability deicit igure is useful because it characterizes the degree to which the entire community is challenged by the inaccessibility of affordable housing. The
deicit incorporates households that cannot obtain affordable housing because of low household income and households that are cost burdened in order to have an appropriate space for their
family or because affordable housing is not available where they need to live. Further, the affordable
housing income deicit is responsive to all strategies for increasing access to affordable housing (or combinations thereof), many of which are discussed in Section 5, below.
3
$0
$50,000,000
$100,000,000
$150,000,000
$200,000,000
$250,000,000
$300,000,000
$350,000,000
Chart 2: Size of Aggregated Affordability Deficit by Cost Burden Level and AMI CategoryData Source: U.S. Census, 2012 American Community Survey, PUMS
Cost Burden 30-39% Cost Burden 40-49% Cost burden >50%
42,163
31,26033,689
12,160
6,677
8,282
Total number of cost burdened
households in AMI category
shown at top of each column

Low-income households (households with incomes less than 80% of the area median) bear 80% of the region’s affordable housing income deicit and moderate-income households (households with income between 80% and 120% of the area median) bear the majority of the remaining 20%. Severely cost-burdened households (those paying 50% or more of their income for housing) account
for 45% of the income deicit. Since the percent of cost-burdened households (those paying 30% or more of their income for housing) is similar in each of the planning district jurisdictions, jurisdictions
with larger populations bear the largest part of the deicit. Residents of Chesterield, Henrico, and the City of Richmond bear 84% of the regional deicit. Table 1 in Appendix 2 provides income limits by household size for 1-8 person households.
In addition to the existing housing affordability challenges faced by the region, VCHR projects that the region will require 100,000 to 132,000 new housing units in order to meet housing demand associated with anticipated growth in the next 20 years. Job growth drives household formation and in-migration, increasing both housing demand and the housing affordability deicit. Higher-wage and lower-wage jobs grow in tandem. High-wage employment generates more demand for the services
that continue to pay low wages such as retail, restaurants, and home healthcare services. Low-wage
jobs constitute over one third of the total jobs in regions such as the Richmond Regional Planning
District, hence it is not possible to solve the affordable housing problem by recruiting higher-wage
jobs to the region or by providing more training to low-wage workers (although these are good
strategies for other reasons). Without a strategy to ensure adequate housing for its lowest earners,
4

a growing community will always face a growing housing affordability problem.
The housing affordability deicit is also expected to grow, in large part, because regional inlation-adjusted housing costs have increased signiicantly, whereas inlation-adjusted incomes have increased very little, or not at all. This trend has contributed to the growing deicit for some time, but became particularly acute as incomes decreased during the Great Recession and had not
rebounded as of 2012.
-0.1
-0.05
0
0.05
0.1
0.15
0.2
0.25
0.3
20
01
20
02
20
03
20
04
20
05
20
06
20
07
20
08
20
09
20
10
20
11
20
12
Chart 3: Change in Real Incomes, Wages, and Housing CostsData Source: U.S. Census 2000-2012, Decentenial Summary Files and American Community Survey
Median Household Income Average Annual Wages
Median Gross Rent Median Housing Costs for Owners
Median Housing Costs for Owners Without a Mortgage
The consequences of the housing bubble have led to wide spread struggles to access
affordable housing. In the Richmond Regional Planning District, inaccessibility to affordable housing
is a challenge for each jurisdiction, for households with low and moderate incomes, and for renters
and homeowners alike.
Residents Who Need More Affordable Housing Approximately 35% of all households in the Richmond Regional Planning District are “cost burdened.” The U.S. Department of Housing and Urban Development (HUD) established the
term “cost burdened” to deine households that need more affordable housing. HUD deines cost-burdened households as “families who pay more than 30% of their income for housing… and may have dificulty affording necessities such as food, clothing, transportation, and medical care.” Households that pay more than 50% of their income for housing are considered severely cost
burdened and may face even harder choices between paying for housing and other necessities.
Approximately 15% of all households in the Richmond Regional Planning District pay more than 50% of their income for housing.
Housing cost burden is a regional challenge. More than 25% of residents living in each jurisdiction within the planning district are cost burdened and more than 10% are severely cost
burdened, as shown in chart 4, on the next page. The dotted lines in chart 4 show the average cost burden and severe cost burden for the region. The City of Richmond has the highest proportion of
cost burdened residents —nearly half of all households are cost burdened, including 22.9% with severe cost burdens.
5

Even Goochland, with the smallest percentage of cost burden residents, compared to other
jurisdictions in the planning district, faces a signiicant challenge: 25% of Goochland residents have a housing cost burden, and more than 10% are severely cost burdened. Table 1 in Appendix 3 provides cost burden counts for each jurisdiction in the planning district. The map below shows the
number of cost-burdened households by census tract in the region. The map further illustrates that
housing cost burden is experienced by residents across the planning district.
6
13.6%
32.3%
0%
10%
20%
30%
40%
50%
60%
70%
80%
90%
100%
Chesterfield Henrico Richmond
City
Charles City
Co
Goochland Hanover New Kent Powhatan
Chart 4: Percent of Households by Cost BurdenData Source: U.S. Census, 2013 American Community Survey, PUMS
Cost Burden >50% Cost Burden 30-49%
Not Cost Burdened PHA Average Cost Burden > 30%
PHA Average Cost Burden > 50%

Housing cost burdens span all income levels, but are most common among households with
low incomes (80% of AMI or lower) and moderate incomes (80-120% AMI). Of the region’s cost-burdened households, more than three-fourths are in the low-income category. A family of four with
a household income below $58,300 would be classiied as having a low income. The Area Median Income (100% of AMI) for a family of four is $72,900. HUD estimates household AMI for Metro Fair Market Rent Areas (FMR) and assigns income limits based on level of income and household size.
The entire Richmond Regional Planning District is contained in the Richmond, Virginia HUD Metro
FMR Area. Table 1 in Appendix 2 gives the income limits for households with 1-8 people and for 30%, 50%, 80%, 100%, and 120% of AMI.
The majority share of the region’s cost-burdened households is split relatively evenly among
households with extremely low (30% of AMI or less), very low (between 30% of AMI and 50% of AMI); and low (between 50% of AMI and 80% of AMI) incomes as shown in chart 5.
Housing cost burden shifts from moderate to severe as incomes decrease, as shown in chart
6. Among households with incomes from 50-80% of AMI, 33,286 households are cost burdened, but only 6,037 households are severely cost burdened. Among households with incomes from 30-50% of AMI, there are slightly fewer cost-burdened households, 31,488, but there are more than double the number of households that are severely cost burdened compared to the 50-80% AMI category. In the 0-30% of AMI category, 81% of the 38,188 cost burdened-households area severely cost burdened.
<30% AMI
30-50%AMI
50-80% AMI
80-100% AMI
100-120% AMI
120%+ AMI
Chart 5: Cost Burdened Households by Income Data Source: U.S. Census, 2013 American Community Survey, PUMS
29%
25%24%
10%
5%6%
7

A little more than half, 53%, of cost-burdened households own their home. This owner/renter
split is similar to the overall tenure split of all households in the Richmond Regional Planning District:
57% of all households own their home. This comparison indicates that owners and renters are
equally likely to be cost burdened, in general. In the subgroup of low- income households, renters
and owners are also equally likely to be cost burdened. Themajorityofhouseholdswithincomesbelow80%ofAMIarecostburdenedregardlessoftenure.
0
20000
40000
60000
80000
100000
120000
140000
160000
<30%AMI 30-50%AMI 50-80%AMI 80-100%AMI 100-120%AMI >120%AMI
Chart 6: Cost Burden by Income Category, PHA RegionData Source: US Census, 2013 American Community Survey, PUMS
Cost Burden > 50% Cost Burden 30-49% Not Cost Burdened
0
5000
10000
15000
20000
25000
30000
35000
40000
<30%AMI 30-50%AMI 50-80%AMI 80-100%AMI 100-120%AMI >120%AMI
Chart 7: Cost Burdened Households by AMI Level and TenureData Source: U.S. Census, 2013 American Community Survey, PUMS
Cost Burdened Renters Cost Burdened Owners
35%
38%59%
82%
90% 95%
65%
62%
41%
10% 5%18%
Percent of cost-burdened
owner and renters in each
8
The subgroup of households with more moderate incomes does not follow this trend.
Nearly 60% of households with incomes greater than 80% of AMI, but less than 120% of AMI are homeowners. But, homeowners make up 85% of moderate-income households that are cost burdened. This signiicant difference in the tenure split of moderate-income homeowners compared to moderate-income, cost-burdened homeowners indicates that moderate-income homeowners
are disproportionately cost burdened. That is, in the moderate-income category, owners are more
likely to be cost burdened than renters. Tenure choice among moderate-income households may
be a signiicant factor in determining cost burden. This disproportionality could also suggest that moderate-income households may have to accept higher housing cost burdens in order to be
homeowners. They may also bear greater risk of mortgage delinquency or default should their
incomes decrease, utilities increase, or should they experience an unexpected life event.
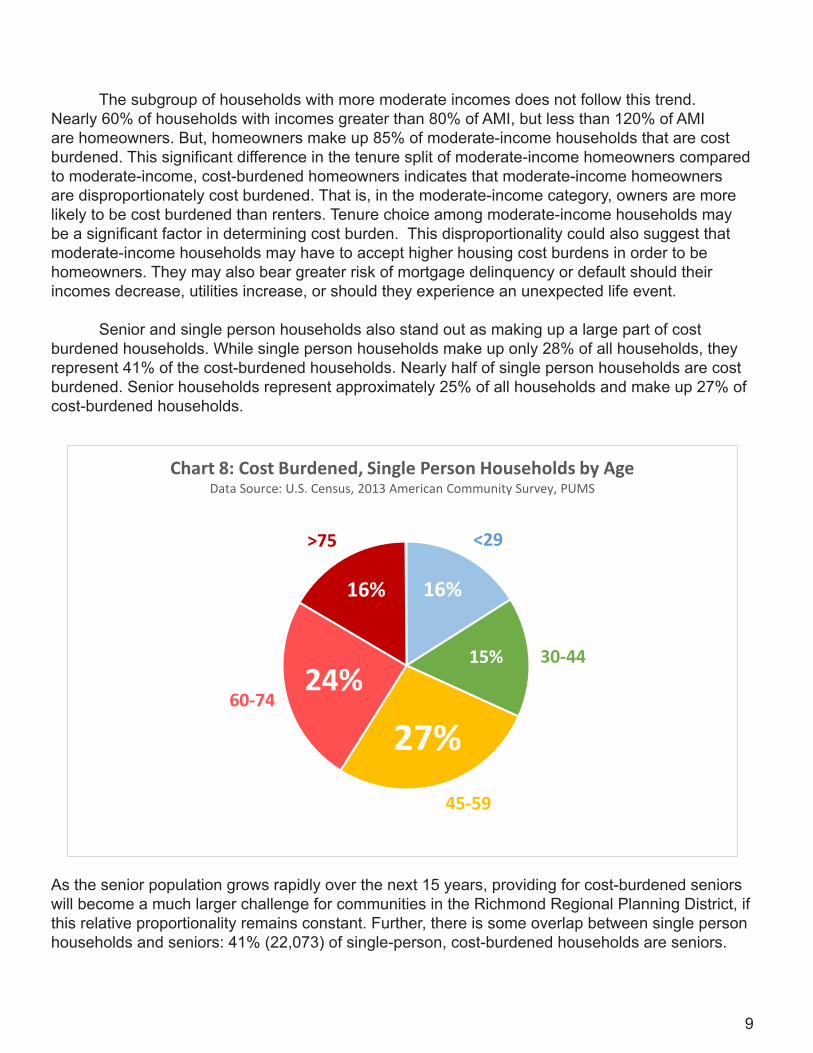
Senior and single person households also stand out as making up a large part of cost
burdened households. While single person households make up only 28% of all households, they represent 41% of the cost-burdened households. Nearly half of single person households are cost burdened. Senior households represent approximately 25% of all households and make up 27% of cost-burdened households.
As the senior population grows rapidly over the next 15 years, providing for cost-burdened seniors will become a much larger challenge for communities in the Richmond Regional Planning District, if
this relative proportionality remains constant. Further, there is some overlap between single person
households and seniors: 41% (22,073) of single-person, cost-burdened households are seniors.
<29
30-44
45-59
60-74
>75
Chart 8: Cost Burdened, Single Person Households by AgeData Source: U.S. Census, 2013 American Community Survey, PUMS
27%
16%
15%
24%
16%
9

The Housing Supply
The U.S. Census Bureau classiies the housing stock by its level of affordability, as a part of a special tabulation of the American Community Survey produced for HUD. HUD assigns units as
affordable to speciic income levels based on the size of the unit, the unit’s value or rent, and the level of income required for a household of corresponding size to affordably rent or own the unit
(see Table 1 in Appendix 3 for more detail.) This tabulation also provides data on the income levels of occupants of units at each affordability level. Appendix 3 provides a summary of this data for the planning district.
There are a number of important conclusions that can be drawn from this data. First, there is
not enough physical stock to accommodate households with incomes less than 50% of AMI. There
is a shortage of more than 15,000 units when comparing the number of units that are affordable to
households in this income category to the number of households needing those units. Further, at
least 37% of the rental stock that is affordable to households with incomes less than 30% of AMI is
occupied by households with incomes greater than 30% of AMI. At least 65% of the owned or for sale housing stock that would be affordable to households with incomes less than 50% of AMI is
occupied by households with incomes greater than 50% of AMI.
10
0
50000
100000
150000
200000
250000
Households with
Income <= 50% of AMI
Stock affordable to
households with
income <= 50% of AMI
Households with
income 50%-80% of
AMI
Stock affordable to
households with
income 50%-80% of
AMI
Households with
income >80% of AMI
Stock affordable to
households with
income >80% of AMI
Chart 9: Cost Burden by Income, and Housing Stock by Level of Affordability
Data Source: U.S. Department of Housing and Urban Development (HUD), 2011 CHAS
tabulation
Vacant Units Occupied by Owners with Household Income < Affordability Income Range
Units Occupied by Owners within Affordability Income Range Units Occupied by Owners with Household Income > Affordability Income Range
Cost Burdened Households Households that are not cost burdened

Second, although there is enough affordable housing stock to accommodate households
with incomes between 50% and 80% of AMI, 52% of this housing stock is occupied by households making more than 80% of AMI. The housing market obviously does not match the affordable supply to those who most need it, except for subsidized units with occupancy restrictions. Many households prefer to spend much less for housing, i.e., less than 30% of their incomes. These households
“crowd out” many lower income households that need more affordable housing.
Households with higher incomes may have better access to lower priced housing, but part of
the “crowding out” effect may result from a gap in housing supply for moderate-income households with incomes between 80% and 120% of AMI, commonly referred to as “workforce housing”. Households with incomes higher than necessary to comfortably afford their home (i.e., without being
cost burdened) rent over 35% of the rental stock that households with incomes below 80% of AMI could afford.
There is a signiicant shortfall between the number of moderate and higher rental priced units and the number of households who can afford these units, with this ‘excess’ demand occupying less expensive units. There are an estimated 27,476 more households renting in the 80-120% of AMI category than corresponding units affordable to this income group (exclusive of those units affordable to households with lower incomes). Among households in the 80-120% AMI category, those who do not rent a unit that costs closer to 30% of their incomes rent less expensive units that would also be affordable to households with lower incomes (hence the ‘crowd out’ problem).
This gap is more extreme among homeowners, potentially because many households may have bought their home when their incomes were lower and have not “upgraded” to a higher valued home as their incomes increased. Nonetheless, the number of households with incomes greater
than 100% of AMI is nearly 50,000 more than the number of units affordable to households making
more than 100% of AMI. Those who do not own a home assigned to this category, own homes
affordable to households with lower incomes. Households with incomes higher than necessary to
comfortably afford their home (i.e., without being cost burdened) occupy over 65% of the owner occupied housing stock that households with incomes below 100% of AMI could afford. Housing
markets are known to be ‘sticky’---for a variety of reasons, households cannot adjust their housing
choices quickly and often the housing they might prefer is unavailable at the time and price needed.
The Richmond Regional Planning District would require a carefully crafted building strategy to
relieve the “crowding out” effect without over-building and depressing the market. This strategy would need to combine the addition of new market-rate units targeted at moderate-income households,
with the addition of subsidized units dedicated to low-income households. For instance, building new
units targeted at households making between 80% and 120% of AMI could give many households the opportunity to improve their housing without becoming cost burdened. These “upgrades” could free up lower priced housing for currently cost-burdened households, but only if enough units are
built. New units would need to be added at the same pace as overall demand growth to avoid
vacancy consequences. For these reasons, targets would have to be achieved in increments; so monitoring the market impact and iltering effect of new affordable units, as they are added, is critical to the success of the strategy.
Setting an appropriate affordable housing production goal is extremely dificult, but the housing stock and occupancy data suggest three reasons why adding additional “workforce” and low-income housing may relieve “crowding out.” First, there are 53,421 fewer housing units that are
11

affordable to households that earn over 80% of AMI than households in this income group. The market for new homes is less likely to provide for households with incomes closer to 80% of AMI because construction costs, including regulatory requirements for land development, proffers, fees,
design requirements, etc., make it exceedingly dificult to develop new housing, especially single family housing for moderate-income households; so the “gap” in housing stock for households making more than 80% of AMI is likely at the lower end of the household incomes. Building “workforce housing” units targeted at households with incomes from 80% to 120% of AMI may help to address this issue, if new units are absorbed quickly enough that they do not drastically affect the
long-term vacancy rate.
Second, there are approximately 70,000 more housing units that are affordable to households that earn 50-80% of AMI, than households in this income category. A nearly equivalent number of the units that are affordable to households making 50-80% AMI are occupied by households making more than 50-80% of AMI, who could afford higher cost housing. If these households had access to higher priced, but still affordable, housing they may “upgrade.” New “workforce housing” units would likely have a ripple effect, relieving “crowding out” pressure on low and very low-income households. The region could reasonably expect the housing market to absorb at least 30,000 new “workforce housing” units because at least 50,000 households could afford higher priced affordable housing but
cannot currently ind it. As these households “upgrade,” lower income households likely could absorb the vacancies, because there are at least 30,000 more households in each lower income category
that could afford higher priced housing.
Finally, 15,000 additional low-income housing units would be necessary to accommodate very
low and extremely low-income households, even if 30,000 workforce units were built and absorbed, relieving pressure exclusively on extremely low and very low income households as described above. Therefore, 15,000 is a conservative estimate of new low-income housing (with some portion
dedicated for extremely low income households) needed within the region.
Housing Demand Projections
Several factors will inluence future housing demand in the region, including population growth, employment, income trends, and consumer preferences for housing types and locations
within the region. Among these, population growth is possibly the most important factor affecting
housing demand. Population growth and especially net migration into or out of an area in turn relect employment opportunities for people in the labor force. Younger and early-middle age workers are
the most likely to move toward job opportunities.
Housing demand is heavily inluenced by a person’s age and the likelihood of being a householder (the person identiied as being primarily responsible for the housing unit) increases in the middle adult years. Younger adults, including those in their teens, are more likely to be
dependents in someone else’s house (mainly their parents) and do not start forming their own
households until they are into their early twenties. Older adults are more likely to be in their own
households. By deinition, a household is an occupied housing unit, so there is a 1-to-1 equivalence between households and housing demand.
VCHR has developed two alternative projection scenarios for future housing demand in the
region. The major difference in the two scenarios is in the time period used to establish the trend
in changes in ‘birth cohorts’. Scenario A depends entirely on the 2000-2010 growth patterns to be constant at the jurisdiction level, whereas Scenario B relies on trends established over a longer
12

period and controls to state totals (with the exception of Chesterield County which uses the County’s own projection). Appendix 4 provides more detail regarding the development of VCHR’s projections.
Scenario A forecasts signiicant growth in housing demand across the region, but the primary growth areas are Chesterield, Henrico, Richmond, and Hanover (in order of growth). In this Scenario, Chesterield accounts for 38% of the region’s housing demand growth over the twenty-year period, with Henrico, Richmond, and Hanover accounting for 29%, 14%, and 8% respectively. Nearly 90% of the growth in housing demand is in these four jurisdictions and with 80% in the irst three. Appendix 4 includes a similar graph for the remaining jurisdictions and detailed tables for all jurisdictions.
Across the region, the demographic segment with the most growth is senior housing. The
65 and older age group accounts for 58% of increased housing demand in Scenario A and 67% in Scenario B. Most of this growth is due to the aging of the baby-boom cohort already living in
the region. The impact on demand for new housing will depend on a variety of factors, including
consumer preferences and incomes. In any case, an increase in the number of 65 and older householders in the region between 66,000 (Scenario B) and 77,000 (Scenario A) from 2010 to 2030 will undoubtedly have a substantial impact on the demand for housing and housing related services.
The youngest age group (under 25) accounts for very little growth in both scenarios, but 25-34 year-olds are projected to increase between 15,000 (Scenario B) to 18,000 households (Scenario A). If the more recent trend established for location choice among this age group prevails, this would
result in a signiicant increase in demand in the City of Richmond (as relected in the Scenario A projection). If longer term growth rates and location preferences prevail, there will be less demand
13
0
25000
50000
75000
100000
125000
150000
175000
Chart 10: Housing Demand Projection Scenario A,
Chesterfield, Henrico, Richmond: 2010, 2020, 2030
15-34 35-64 >65
2010 2010 20102010 2010 2010 2010 2010 2010
Chesterfield Henrico Richmond

from this age group overall, but particularly for Richmond.
In many ways, the economic shock of the Great Recession dealt young adults a serious blow,
but whether and how much young adult housing demand will bounce back in the future remains to
be determined. If incomes, housing costs, and preferences become more favorable for household
formation by young adults over the projection period, the growth in demand for this segment should
be even higher. For example, at the rate of young adult household formation in the year 2000 (rather than the 2010 rate), there would be an additional 9,000 housing units needed for young adults (under age 35).
The region is also expected to have signiicant expansion in the 35-44 year householder segment, which is projected to increase by 18,000 to 26,000 households. This is an age group where incomes, family status, and life-styles are expected to boost demand for owner-occupied housing, particularly for irst-time buyers.
The slowest growing market segment is for householders aged 45 to 64, which is only projected to increase by 7,700 region-wide in Scenario A and is projected to contract by 1,100 in
Scenario B. Additionally, both scenarios project contraction in this segment for the City of Richmond.
As this is traditionally an age group where homeownership demand for larger and more expensive housing is very high, the housing market could experience a signiicant shift toward the preferences of younger and of older age groups.
3. Understanding the Perspectives of Regional Stakeholders This section presents the responses of regional housing leaders, decision-makers, and other
stakeholders to the data describing the housing affordability gap in the Richmond Regional Planning
District. VCU asked these study participants to review the VCHR data during in-depth interviews,
on-line surveys, and a workshop. Interviewees and survey respondents responded to the following
questions:
1. Why does an affordability gap exist and what are its underlying causes? Do the causes vary within the Richmond Regional Planning District? 2. Who is responsible for addressing the gap? 3. What solutions would address the underlying causes? 4. What are the barriers to introducing and implementing these solutions? 5. How can we address those barriers?
Participants in the workshop examined the responses to the survey and interviews and discussed potential ways to decrease the affordability gap in the planning district. Facilitators divided
the participants into groups based on the type of jurisdiction they represented (rural, suburban, or
urban) to better focus the discussions. These teams reported to the larger group and engaged in a
discussion about the feasibility of the solutions proposed.
Survey and Interview Results
The VCU CURA team interviewed 12 housing experts, including local government oficials, non-proit and for-proit developers, service providers, and philanthropic organizations. The interviews were semi-structured with a standard set of questions to guide the discussion. VCU CURA
used the responses collected from these interviews to develop an online survey instrument and sent
14
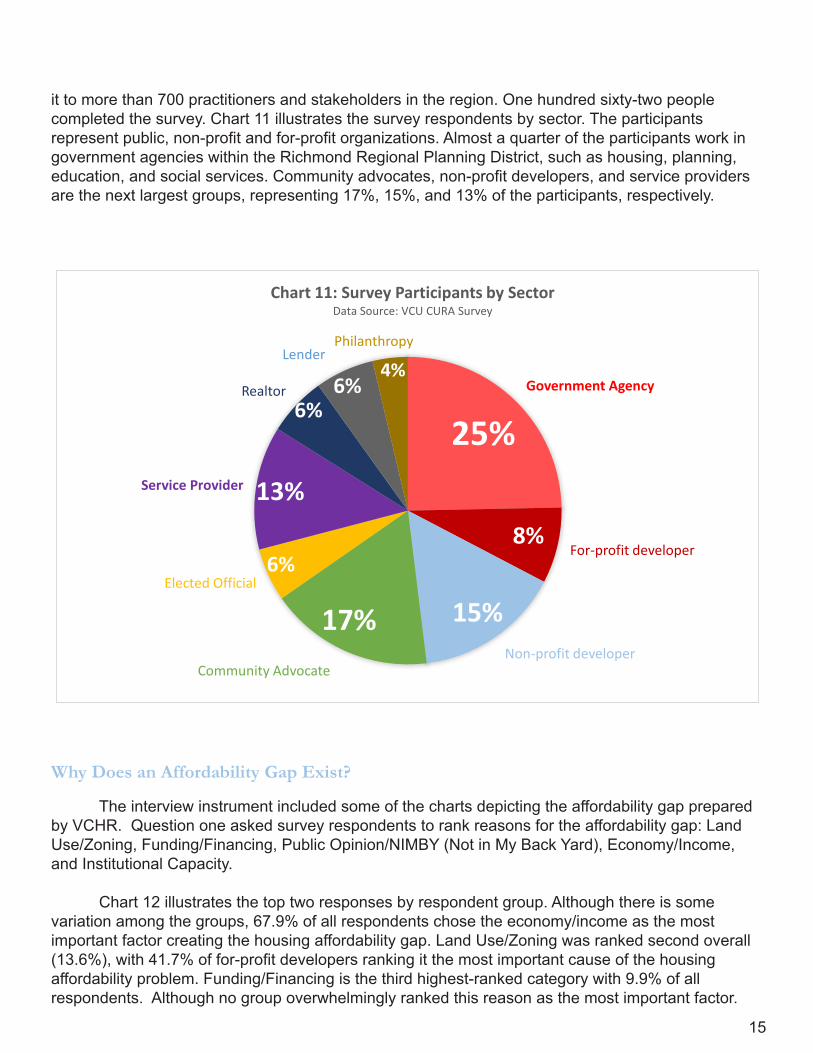
it to more than 700 practitioners and stakeholders in the region. One hundred sixty-two people completed the survey. Chart 11 illustrates the survey respondents by sector. The participants
represent public, non-proit and for-proit organizations. Almost a quarter of the participants work in government agencies within the Richmond Regional Planning District, such as housing, planning,
education, and social services. Community advocates, non-proit developers, and service providers are the next largest groups, representing 17%, 15%, and 13% of the participants, respectively.
Government Agency
For-profit developer
Non-profit developerCommunity Advocate
Elected Official
Service Provider
Realtor
LenderPhilanthropy
Chart 11: Survey Participants by SectorData Source: VCU CURA Survey
25%
15%
8%
6%6%
6%
4%
13%
6%
17%
Why Does an Affordability Gap Exist?
The interview instrument included some of the charts depicting the affordability gap prepared
by VCHR. Question one asked survey respondents to rank reasons for the affordability gap: Land
Use/Zoning, Funding/Financing, Public Opinion/NIMBY (Not in My Back Yard), Economy/Income,
and Institutional Capacity.
Chart 12 illustrates the top two responses by respondent group. Although there is some variation among the groups, 67.9% of all respondents chose the economy/income as the most important factor creating the housing affordability gap. Land Use/Zoning was ranked second overall
(13.6%), with 41.7% of for-proit developers ranking it the most important cause of the housing affordability problem. Funding/Financing is the third highest-ranked category with 9.9% of all respondents. Although no group overwhelmingly ranked this reason as the most important factor.
15

The following are typical quotes from interviewees:
At one point … the annual income of wages and housing costs marched at a reasonable pace
together. Then we hit the period where housing prices began to appreciate so fast and the cost of
inancing went up. Not only can we not individually afford the same housing as we could before, we can’t produce it. It costs so much more per square foot now that even if we could inance it, we can’t produce it. It’s a wage lag.
It’s an issue of employment and income. If you are making less than 30% of area median family income, it’s dificult to build anything [affordable].
We’re dealing with a crisis of intergenerational poverty. I think a big part of it is job training and placement.
My fundamental belief on the root cause is the jobs-transportation-housing balance. It’s that simple. I don’t really think it’s something we need to argue. If we located jobs with a diverse housing choice, [we wouldn’t have such a severe problem].
I think another thing is transportation. You can’t have people [living] away from transportation and keep a job.
The supply question is interesting. I think there’s a lot of supply of affordable housing – or that could be affordable. … [It’s] tax delinquent. There are a lot of places that aren’t on the market – inherited. … I don’t think we’re attacking it in a way that’s addressing those issues.
Interviewees were also asked to state if they think that the factors contributing to the affordable
housing gap vary by type of jurisdiction – urban, suburban, and rural – or population group
16
13.6%
67.9%
1.9% 9.9% 6.2%0%
10%
20%
30%
40%
50%
60%
70%
80%
Land Use/Zoning Economy/Income Institutional
Capacity
Funding/Financing Public
Opinion/NIMBY
Chart 12: Why do you think there is a housing affordability gap?Data Source: VCU CURA Survey

(especially age group). Some perceive there to be such differences, as indicated in the following
comments:
The city has a critical need for affordable rental housing. They also need to provide some support for older homeowners. … The problem in the cities is really a problem of neighborhoods – bad schools, unsafe – people won’t live there. In the inner-ring suburban areas, there’s a need for rental housing. We’re seeing a deterioration in the irst-ring suburbs. … This is going to affect our competitive advantage.
Who is Responsible for Addressing the Gap?
Chart 13 shows this question’s responses for all survey respondents. Almost 60% of respondents see housing affordability as a local government responsibility. State government
was identiied as the directly responsible party by 40.7% of survey-takers, followed by individuals (36.4%), developers (35.2%), and the federal government (35.2%).
Government agency staff show great variation in their responses compared to other groups.
While 38% of staff stated that local government is directly responsible, 40% maintained that individuals themselves are directly responsible, 25% stated that developers are responsible, and another 25% stated that state government is responsible.
Interviewee comments include the following:
It really rests with mayors. When I’ve seen this [providing affordable housing] work, it’s them going out on a limb and doing it. They know how to give people cover. They stand up at a public hearing and stick their necks out. It’s their responsibility to do that and make it work.
17
59.3%
35.2% 36.4% 35.2%
40.7%
25.3%
18.5%
0%
10%
20%
30%
40%
50%
60%
70%
Local
government
Developers Individuals Federal
government
State
government
Non-profits Philanthropy
Chart 13: Who is responsible for addressing housing affordability?Data Source: VCU CURA Survey

Corporations are the irst line of responsibility, but they’ve not taken that responsibility.
This problem is very expensive and very complex. [It’s wrong to think] that it should be completely solved by local government. … Banks, lenders, inancial institutions, investment, private and non-proit real-estate development needs to be at the table, service providers, … they all have a role in it, but some of those folks don’t recognize that they have a role in this.
This is a community-wide challenge. … It requires a collaborative approach.… People who need some kind of assistance; government has to address [that].
It is very dificult for local government to take on issues like this in a meaningful way with the scarce resources we have. People want local governments to do more, but they don’t want to pay for it.
The survey and interview responses regarding possible solutions to address the underlying
causes of the housing affordability gap fall broadly into two categories: those that address the supply
of housing and those that address demand for housing. Strategies to increase the production of
housing units for people at various income levels address housing supply. These strategies include
dedicated funding for affordable housing and lowering the costs of building by reducing the size
of housing units, or by increasing the number of units per development. Strategies to increase the
income of residents or otherwise enhance their ability to purchase or rent housing affect demand for
housing. Many interviewees and survey respondents argued that a combination of solutions would
be required to address the affordability gap. Overall, the top ive solutions that were ranked “very effective” in order of respondent support are:
• Site affordable housing near job centers and transit (67.9%); • Improve the regional transportation system (67.9%); • Increase job training resources (56.8%); • Dedicate a local funding source for affordable housing (54.9%); and • Improve housing focus within local government, and improve coordination between
government and private housing providers (54.9%).
What Solutions Would Address the Underlying Causes?
18

Responses regarding which solutions would be “very effective” varied signiicantly among respondent groups. Table 3 breaks down demand-side solutions identiied as “very effective” by sector of survey respondent. For example, while nearly all community advocate, non-proit developer, and philanthropic organization respondents stated that an improved regional transportation system would be a very effective solution, this solution is regarded as very effective
by only half of the lenders, for-proit developers, elected oficials, and government staff persons who completed the survey. Transportation is seen largely as a means of connecting people to better jobs
– particularly those in suburban locations where there has been signiicant retail redevelopment. Also, lowering transportation costs may make it possible for workers to pay more for housing.
Wages and Housing Affordability: In open-ended comments, survey respondents highlighted
schools (K-12) as another key component in addressing poverty and, by extension, housing affordability. Respondents also emphasized the intersection of wages and buying power. While
only 38% of all respondents stated that the minimum wage should be increased, many survey respondents, as well as interviewees, suggested that companies should pay “living wages” and assist in providing or funding housing for new workers. Several interviewees and survey respondents
argued that wages have not kept pace with housing prices, suggesting that connecting residents
with jobs may not solve the problem because the wages paid for full-time employment are often
insuficient to house the region’s workforce.
Connecting Affordable Housing, Transit, and Jobs is a central theme throughout the interviews
and survey. Table 4 breaks down supply-side, development oriented solutions identiied as “very effective” by sector of survey respondent. Siting affordable housing near jobs and transit was
mentioned by many respondents. One interviewee argued that in recent developments, housing
for ofice workers has been supported, but affordable housing for low-wage employees has been ignored:
19

I say workforce housing should be a part of it [the policy discussion] when they [policy makers and advocates] make the connection that people who are working [in one location] should be living [housing] there. When you have the conversation about ofice space, stores…wouldn’t this work best if people working there could walk to work, ride their bike to work?
We ought not approve any new development that is not mixed income.
This sentiment was echoed through the written comments in the survey. Many respondents
speciically suggested that set-asides or inclusionary zoning should be used to encourage the development of housing for low-wage workers. Mixed-income development for low-wage workers was seen as an integral element in both the survey and the interviews.
Interviews and written survey comments indicated that the region needs greater density and
smaller housing units and that greater density and smaller units are central to reducing the costs
of development. While level of density would have to it with the surrounding development pattern, increased density would translate to increased affordability:
I think density is the answer. That and smaller-scale [smaller individual units] development. … The idea of density is an idea that never should have gone out of fashion. I think in the counties we ought to be doing planned communities. We ought to be thinking about that seriously. I think naturally the market is going to move to that. Our bigger issue will be how do we come back to the communities [in the counties] that were mis-designed and ix them?
Other respondents stated:
When [such a community] gets redone as an urban center, is [the local government] going to have a policy that when new commercial development happens [there], there will be a fund for
20
[worker] housing? The [business] owners don’t mind that; they see the connection. … ‘I don’t want to pay people more than I’m paying them right now, so let’s see if there’s a way to make it easier for people to live here.’
[D]ensity is one thing, and I think creating policies within [such developments] to make sure that there’s adequate workforce housing within them. … I think we do need to igure out how to make housing smaller.
A Dedicated Local Funding Source emerged as a very important solution, particularly
among non-proit developers, philanthropic organizations, lenders, and service providers. Nearly all interviewees argued that the market is unable to address affordable housing at the lowest income
levels – particularly for those earning less than 30% of Area Median Income. Those who develop
affordable housing also stated that there are insuficient public funds at the local level to address affordable housing challenges. Government oficials, non-proit developers, and philanthropic organizations stated that the current level of public funding is unable to meet the needs of the local
community.
One interviewee explained:
We’re tying the hands [of government] because we don’t have the funding. They’ve cut the syphon off at the federal level – but they don’t want to fund it at the local level. You can’t deny that if you have no money, you can’t do much.
The housing trust fund would certainly be a nice way of moving forward.
There are probably things we could do in the arena of inancing. One good thing is that we’re in this era of historically low interest rates. We haven’t really taken advantage of that, but we ought to. Some communities do a much better job of leveraging this ability to borrow at low rates. Some states and localities issue bonds for housing.
Developers speciically stated that proffers (cash and in-kind) and zoning (speciically, lot size requirements) greatly increase the cost of housing. Interviewees argued that the most problematic
proffers involve the types of materials, siting, and, in the case of a recently completed multifamily
development, the interior inishes required to complete the units.
Administrative Solutions also emerged from the interviews. Table 5 presents administrative,
supply-side solutions ranked by survey respondents as “very effective” strategies to address the affordability gap. More than half of non-governmental respondents identiied interagency coordination as an area for improvement.
While respondents from all jurisdictions identiied this issue, one interviewee articulated the problem as the absence of a strategy within any of the jurisdictions to address affordable housing:
[I]f the city alone had a housing policy, that would [constitute] a leadership move. They’re the ones housing people… the city can be a leader by saying it’s about us as a city and we’re not going to be successful if we don’t talk about this…they’re not uniied on their own policies. They aren’t aligned on a direction.
21

Others identiied the issue of interagency coordination as a “friction” that leads to challenges in siting, funding, and zoning for housing affordability. Respondents frequently cited the connection
between zoning and housing development--speciically related to intensity of use, parking requirements, and lot sizes. Developers argued that the timing of the local government review and
approval processes results in delays to the start of construction. Additionally, agencies disagree
about how to use surplus property and affordable housing funds.
Regional Advocacy for affordable housing emerged in interviews as an important element, but
many interviewees allowed that this strategy is unlikely to be effective. Likewise, beyond non-proit developers (72.0% of whom support this strategy), a regional advocacy and policy coalition did not emerge as an effective solution to the region’s housing affordability challenges.
Barriers to Implementation
Notwithstanding the solutions that they offered to address the housing affordability challenge,
many interviewees and survey respondents cited signiicant barriers to implementing solutions. Chart 14 shows responses regarding barriers to implementation by sector of survey respondent. The two issues cited most often were lack of political will and lack of funding. Some groups--notably
philanthropic organizations, elected oficials, lenders, and non-proit developers--stated that lack of coordination among various public and private entities is also a signiicant barrier. This perspective is important because those groups are often the groups most involved with respect to affordable
housing development.
22

While lack of political will was frequently emphasized by survey respondents, community
resistance was cited in all interviews as the root of the lack of political will. Community resistance
is particularly salient in respect to the placement of attached homes and apartments, as well as
affordable housing construction in residential neighborhoods.
For-proit developers pointed to the cost of development and community resistance as barriers to solutions. One developer, after explaining the architectural and cash proffers that have been demanded of him, explained:
All of those things affect our costs. The complications of the zoning costs affect the developer’s costs. Just the cost of acquiring the lot. Before we’re ever to the point where we can build the house, the amounts we’re paying that are non-negotiable to be able to get the home built – they’re generally all lat rate. It doesn’t matter if you’re building a $200K house or a $1 million house – you have to amortize those costs.
When pressed to estimate the magnitude of extra costs related to rezoning, he suggested that these costs increase the per-unit cost of housing by approximately $50,000.
Others argued that inter-jurisdictional rivalries are so strong that they discourage localities
from crafting their own policies to confront affordable housing challenges:
I think one barrier is that we have such fragmented and dysfunctional regional governance. That it almost becomes hard for one jurisdiction to move progressively and creatively in this arena.
0
0.1
0.2
0.3
0.4
0.5
0.6
0.7
0.8
0.9
1
Community Resistance Lack of Funding Lack of political will Lack of stakeholder
coordination
Costs of development
are too high
Community Advocate Elected Officials For-profit Dev. Government Lender
Nonprofit Dev. Philanthropy Realtor Service Provider
Chart 14: What are the barriers to introducing and implementing these solutions?Data Source: VCU CURA Survey
23

They [fear that the] others will not and suddenly [they’re] going to become the recipient of all of the affordable housing. There has to be at least regional agreement around strategies. … I’m
heartened by what happened in Hampton Roads with their regional agreement to produce SROs [single-room occupancy apartments]. … They saw a problem and that individual jurisdictions couldn’t do it alone, but if they’re all in, no one jurisdiction is going to get stuck with the population.
Overcoming the Barriers
VCU CURA also asked interviewees to think of creative ways by which the region could
overcome some of these barriers to providing more affordable housing. Their responses fall into
three categories: organization, education, and demonstrations.
Organization related suggestions focus on better alignment of existing organizations:
[T]he philanthropic section of our community. … In order to have a healthy community, they need to work together. … They can lead by being better aligned. … And alignment there can align your corporations. And they have inluence and can inluence local government. … And what if local government and private funding were aligned? Then you’d have this unity of private, corporate and local government. Then I would plug in our academics.
Education related suggestions focus on addressing the negative perceptions of affordable
housing and density:
I think the irst thing is the attitude within the community, both from the public and the public oficials, that housing is a burden that creates burdens on the community. Many of these policies are reactions to that attitude – that housing is bad, but commercial is good. … We have to reshape that perception.
Having the people who are doing affordable housing inance get really serious about being lexible as well as being creative. I do think that’s a problem locally and regionally. It’s long-time advocacy. … Having the corporate community sit with us in those conversations [would] certainly change the dynamics.
We need translators. Most of us who talk in housing talk jargon. [We need] people who can
effectively take our message … to the corporate community and to the politicians.
Demonstrations. Several interviewees mentioned that the best way to address deep-seated
aversions to density and to providing affordable housing – even for retail workers at shopping
centers near the centers themselves – is to create demonstrations, model cases that are well done
and which show that denser, more affordable housing does not inherently present negative impacts
for the community:
Elevating best-practice models. … There are people who are doing really ine work, so instead of non-proits getting funded to not produce much, [we need to] really focus on best-practice models and take projects to scale.
I think inding the model project – building from the ground up as opposed to from the top down. That’s what happened in Hampton Roads. [It was a] very narrow issue – people were living
24

on the street. – It’s SRO housing, so how do we build up from there? So they were able to build a coalition around that very narrow problem. Finding some models and getting buy-in around those models as opposed to inding a solution to the whole affordable housing gap.
The best way to move forward is to get a sexy project and work together and create momentum. One really shining example of success. The other projects [that come afterward] don’t have to be exactly like that, but then [people] get together and they say: “We want to be part of that.”
Key Points
The survey and interview results presented above show agreement on many aspects of the
affordable housing issue, but no single message emerged from the responses. Nonetheless, a few
key points warrant emphasis:
1. Each jurisdiction must decide which segment(s) of the population to serve and how to
do so. The Richmond Regional Planning District contains three broad types of community: urban,
suburban, and exurban (rural). Each jurisdiction has somewhat different housing affordability challenges and perhaps different political values. Each community may take a different approach to
housing affordability for the population segment most in need within its jurisdiction, but it is essential
that each jurisdiction take the problem seriously. One interviewee said: “I want to take this chart [showing the housing affordability problem in each jurisdiction] to each [local legislative body] in the
region. They all think it’s a problem in the city.”
2. The community needs education. The affordable housing gap is a serious problem, but
the perception of interviewees and survey respondents is that the community is not yet ready to
acknowledge it, much less tackle it in earnest. “They’re living in a state of denial,” one interviewee said of certain jurisdictions. Possible solutions to at least some instances of the lack of affordable
housing, such as building smaller units and building more multi-family structures, i.e., increasing
density, frighten some residents and feed negative stereotypes. A successful communitywide
education process seems necessary to address these concerns effectively.
3. The region has leaders. At least 165 survey takers and 12 interviewees take the affordable housing gap seriously and most appear to be either working to resolve it or ready to do so. The
efforts of respondents indicate a promising moment to organize the leadership and develop realistic,
effective strategies to improve housing affordability in the region.
November 21, 2014 Housing Stakeholder Workshop
PHA invited 260 regional housing experts, including 50 local elected oficials, to attend a workshop to review the results of the research conducted by VCHR and VCU CURA; 65 participated in the intensive workshop. Following presentations by VCHR and VCU CURA, VCU CURA meeting
facilitators asked participants to select the most feasible and impactful solutions to address the
affordable housing gap from the solutions that were identiied in the interviews and surveys. Participants discussed solutions in jurisdiction type (urban, suburban, and rural) groups. Urban,
suburban, and rural groups reported their discussions for the entire workshop, while facilitators
tallied results in “real time”. The following solutions emerged from the discussions.
25

•Improveconnectionsbetweentransportationandhousing: Participants cited improved transportation connections as one the most impactful ways to
address the need for affordable housing. They reasoned that as more residents gain better access
to jobs--particularly those outside of the City of Richmond--resident income and stability will
improve.
•Increasejobtrainingandeducationopportunities:- Participants identiied that a lack of job readiness in skilled trades such as construction, HVAC, and electrical trades prevents some people from gaining well-paid employment and paying for market-
rate housing.
- Although employers and community colleges are collaborating to better meet employer needs
for skilled workers, these efforts can be expanded. More housing stakeholders need to work to connect residents to job training and readiness programs already underway.
•Linkaffordablehousingandnewdevelopment:- Participants stated that linking housing to jobs will help reduce the pipeline of demand for
affordable housing. A better-housed workforce is more stable and able to remain in jobs longer.
Henrico County’s redevelopment plan for Innsbrook provides for such linkages. Owners are using
unused parking lots for residential construction with increased density.
•Increasedensity: - Workshop participants identiied a need for increased housing unit density to reduce the costs of building, and thereby, the cost to the consumer. Participants suggested both the development
of accessory dwelling units in single-family communities and mixed-use, mixed-income areas as possible methods by which to increase density.
- Participants raised concerns about the public’s possible reluctance to accept more density,
especially for affordable housing. Strong leadership and education, with the help of “best-practice” models, may address this concern.
•Greaterengagementbypublicoficials: - Workshop attendees stated that public oficials should provide leadership on speciic issues, in spite of the political challenges inherent in trying to address affordable housing. Participants
suggested housing veterans who are at risk of homelessness or are experiencing homelessness as an example.
•Communitylandtrust:- Workshop attendees suggested that the development of a community land trust, using vacant
or surplus properties could spur development and increase tax revenues in declining areas, while ensuring long-term affordability of housing. Participants suggested that a community land trust
could be managed through a nonproit organization in partnership with local jurisdictions.
26

This section synthesizes the recommendations discussed in Section 3 and combines them
with research conducted by VCHR and VCU CURA on best practices in the provision of affordable
housing in communities throughout the United States. Each of the strategies discussed here
covers one or more points on the “continuum of housing need,” from homelessness, to low-income households earning minimum wage in retail and service employment, to moderate-income renters
who are still cost burdened, to persons ready to buy a house on the private market. The following
discussion presents eight recommendations. Each recommendation is accompanied by illustrative
examples of initiatives that other US communities have implemented and which can serve as guides for similar initiatives in the Richmond Regional Planning District.
The recommendations are:
1. Develop a lexible dedicated funding source for affordable housing. 2. Improve access to the regional transit system, including dedicated funding, expansion, or new service.
3. Create incentives to site affordable housing near job centers.
4. Expand by-right development to include: • Mixed-use retail-residential centers; • Accessory Dwelling Units such as granny lat or alley lats; and • Inill multifamily development within the urban core and commercial corridors. 5. Prioritize the preservation of existing federally-assisted housing and market-affordable units.
6. Support access to affordable housing through employer-assisted housing programs. 7. Develop a community land trust to support long term affordable housing.
8. Strengthen local and regional coalitions to provide advocacy at the project and policy levels. These practical advocacy efforts should include the coordination and execution of regional demonstration projects that are based upon the joint contributions of the public,
private, and non-proit sectors and that relect best practices in mixed use and mixed income development.
4. Approaches to Addressing the Challenge
1. Develop a lexible, dedicated funding source for affordable housing
Local government staff cited a lack of funding as a hurdle to addressing the affordability
gap, particularly for housing that serves residents earning 50% of the Area Median Income or less.
The region will continue to face funding shortages for housing with the decline in federal resources
for housing development. The unique challenges facing rural, suburban, and urban jurisdictions in
the region require signiicant and lexible local funding to address housing needs--which may be a combination of new construction, individual subsidy, preservation and rehabilitation of the aging
stock, or down payment assistance for homeownership. The goal of a dedicated funding source is to
remove the allocation from annual budget processes that have often stymied long term planning and
progress on affordable housing goals.
HousingTrustFunds–Lexington,KY;Washington,DC;Atlanta,GA;andSeattle,WA
Lexington, KY and Washington, DC, have developed housing trust funds supported through transfer taxes on all real estate transactions. In Washington, DC, 15% of the transfer taxes on real estate are, by statute, allocated to the trust fund annually, making it a true dedicated funding source.
27

In Lexington, the fund is supported through a modest increase in real estate taxes and general fund allocations, which are determined in the budget process. Atlanta uses 15% of Bond proceeds from
the Beltline development to support down payment assistance and incentives for developers who
build affordable housing. Seattle, WA’s trust funding comes from a multi-year levy. Voters passed the
levy, and the funds are based on property taxes.
The connection between affordable housing and real estate provides an opportunity for the
jurisdiction to use the community’s growth to support workers at all levels in the jurisdiction. It also
means that rising real estate prices can be mitigated.
2. Improve access to the regional transit system, including dedicated funding, expansion, or new service
Survey, interview, and workshop participants consistently cited the lack of connectivity for
workers without cars as one of the largest barriers to job access and income generation. According
to the Southern Poverty Law Center, there is a mismatch in the region between the location of
jobs that are available for low-skilled workers, housing to meet the needs of those workers, and
transportation to connect the two. Currently, the primary jurisdiction within the Richmond Regional
Planning District served by public transportation is the City of Richmond with lines reaching into parts
of Chesterield and Henrico counties. Meanwhile, the jobs available to low-skilled workers, such as big box retail and other service employment are heavily concentrated outside the city limits in new developments.
The proposed Bus Rapid Transit (BRT) line from Rocket’s Landing to the Willow Lawn
Shopping Center will be a positive step toward connecting the eastern and western ends of
Richmond and Henrico, if it is implemented. But a more widespread expansion of the public or para-transit system will be necessary for the Richmond region to become accessible to persons of limited
means. A primary challenge to this expansion is the lack of a dedicated, local funding source for public transportation.
TransportationTrustFunds–MultipleJurisdictions
Many jurisdictions, including the State of Virginia, statutorily dedicate a portion of existing fuel taxes, tolls, or other transportation-related fees for transportation projects such as public transportation, bike lanes, and road and bridge improvements. The state created a local dedicated
funding source for the Hampton Roads area, but the funds are limited by state law to be used for
road and highway projects in the area. Conversely, in Northern Virginia, 30% of the funding derived
from fees, taxes, and tolls is given to local jurisdictions for transportation projects and 70% is directed by the regional transportation board, allowing additional freedom to address the needs of
the local jurisdictions.
3. Create incentives or requirements to site affordable housing near job centers. Participants suggested that incentives to link commercial and affordable residential
development would also connect workers to housing opportunities This strategy would be particularly
useful in places like the Broad Street corridor in western Henrico County, where signiicant retail development has created a demand for workers in restaurants and retail establishments. Affordable
Dwelling Unit or Inclusionary Zoning programs and incentives such as credit enhancements, tax abatements, or density bonuses are all implementing strategies that could connect commercial and
affordable residential development.28

In surveys and interviews conducted for this project, producers of affordable and market-
rate housing cited challenges in the process of creating mixed-use and single-use multifamily housing in many jurisdictions due to the need to request zoning changes. Rezoning requests
often elicit neighborhood resistance to increased density. Proactive zoning, allowing uses such as
accessory dwelling units (granny lats, basement apartments, or alley lats within existing single-family developments), smaller single family starter homes on small lots, townhomes, and multifamily
housing would reduce the costs of development for market-rate and subsidized housing by
shortening the development time, as well as by increasing the number of units that can be added to
a lot.
SuburbanMixed-UseDevelopment–WestBroadVillage,RestonTownCenter,OneLoudon
Across the country, suburban jurisdictions have focused on applying a mixed use, new urbanist design for new retail centers. Examples of this application include developments such as West Broad Village in Henrico, County; Reston Town Center in Fairfax County; or One Loudoun in Ashburn, VA. These developments have attracted signiicant interest by both retailers and residents who still want to live in the suburbs, but prefer walkable communities. This development strategy
may be particularly useful in creating density for seniors, workers in the retail establishments serving
these communities, and young single residents working in nearby ofice parks.
RetroittingRetailRedevelopment–Rockville,MD
In 2001, Rockville, Maryland adopted a Master Plan to create a new, vibrant town center. Rockville chose a failing strip mall and parking lot with access to an arterial road and public
transportation for the Rockville Town Square which opened in 2004. The Town Square is a
AffordableDwellingUnit/InclusionaryZoning-FairfaxCounty,VA
The Fairfax County Affordable Dwelling Unit Program requires developers to designate between 5% and 6.25% of their multifamily units and 12.5% of units in single-family detached and townhouse developments of 50 units or greater as affordable housing. Under this ordinance, one-
third of the affordable units serve households earning 50% of the Area Median Income or less, and
the remaining two-thirds of the units serve households earning 65% of the Area Median Income or less. For-sale units in either category are targeted to households earning less than 70% of the Area
Median Income. In addition, the county’s housing authority can acquire one third of for-sale units (at
market value) and place them in the county rental program.
AffordableHousingIncentives–KingCounty,WA
King County, WA has a package of incentives for private developers to build new affordable
housing. The Credit Enhancement Program provides credit enhancements for an entire project
if it meets King County priorities, such as proximity to transit or new commercial development. Developers agree to set aside affordable units within projects, in exchange for project savings. King County also offers density bonuses for affordable housing. Developers can build a calculated
number of market-rate units greater than would be allowed otherwise, in exchange for each affordable unit they provide.
4. Expand by-right development
29

pedestrian square surrounded by mixed-use development. At street level there are 175,000 square feet of shops and restaurants, and 644 residential units—both owner-occupied and rental, 15% of which are affordable under Montgomery County’s Affordable Dwelling Unit ordinance. The Town
Square also contains a new public library, the Rockville Innovation Center, a new Visual Arts Center,
and three public parking garages.
InillRedevelopment–Austin,TX
Austin, Texas faced redevelopment challenges when its airport was relocated, vacating a 39-acre parcel less than two miles from downtown. The surrounding neighborhoods organized a planning and advocacy process to ensure that the old airport site would be developed to it the character of the surrounding neighborhoods, while providing mixed-use and mixed-income single-family and multifamily housing. The city used the neighborhood plan to zone the site to
feature houses of varying sizes on small lots. The site’s redevelopment included small attached
townhomes, 2,000 square foot single-family homes, market-rate and subsidized rental housing and homeownership housing, and a mix of big-box retail, ofice space, a children’s hospital, and park space that has helped to create a sense of place for the new inill community.
AccessoryDwellingandFamily/CaregiverSuitesOrdinance–ArlingtonCounty,VA
Arlington County, Virginia created an ordinance to allow one accessory dwelling unit or family/
caregiver suite (or granny lat) per lot in single-family neighborhoods in order to help elders age in place, increase the stock of affordable housing with little government investment, and provide an
income stream for homeowners to reduce housing costs. While this ordinance limits the total number
of affordable units added each year in the county, that number does not include bringing existing units up to code (in order to be legally rented). Accessory units may be no more than 750 square feet
and may only house up to two unrelated people.
Currently, the two largest types of affordable housing in the Richmond Regional Planning
District are unsubsidized, aging garden apartments and housing subsidized through federal
programs such as Section 8 and the Low Income Housing Tax Credit. In addition to housing otherwise unsubsidized households, these garden apartments support Housing Choice Voucher
households who cannot afford or are denied rental housing in other neighborhoods. While it is
dificult to obtain rezoning approval and acquire property for low-income housing, the existing stock of affordable housing provides an important supply for low-income workers in the region. This stock
has the potential to be acquired and rehabilitated within the existing zoning requirements, thus providing much needed affordable housing and eliminating the lengthy rezoning approval process.
The garden apartments located in the City of Richmond and the irst ring of suburban development in Henrico and Chesterield counties were built 40 years ago or more to support the baby boomers as they began to form households. Now these buildings house low-income
households but are in need of capital repairs to ensure that the units are both affordable and safe.
Subsidized units represent a small and declining percentage of overall affordable housing stock. As
a result, older apartments remain one of the largest supplies of affordable housing. Often though, the
rents will not support costly repairs such as new heating systems or modernization. The loss of these
5. Prioritize the Preservation and Renovation of Existing Affordable Housing
30

buildings would result in a signiicant loss of affordable stock. At the same time, federally subsidized housing such as place-based Section 8 or the Low Income Housing Tax Credit are some of the most effective privately-owned sources of affordable housing for very low-income households. These
buildings also house those using Housing Choice Vouchers to access housing. As the affordability
terms on these buildings end, the owners of these properties have the choice to leave the program
and offer the units at higher rents, further reducing the supply of affordable housing. Preservation
of these buildings has been an effective way to prevent displacement and provide stable long-term
housing for low-income workers, particularly seniors.
TheRehabilitationLoanProgramforSmallRentalProperties–MontgomeryCounty,MD
This program offers low-interest loans to owners of small market-affordable (where rents
are at least $200 below the countywide average) properties to make improvements. In exchange, owners must agree to limit the rent increases on a portion of the units. Agency staff work with the
owners to expand (if needed) the scope of improvements.
Portland11x13PreservationCampaign–Portland,OR
In 2008, the Portland Housing Bureau targeted 11 buildings (approximately 700 units) at risk of opt-out-of-other-subsidy loss. The buildings were in desirable locations. To address this risk, the
city created a coalition of stakeholders, including HUD, local nonproits, lenders, and city agencies. They used a variety of funding sources, including $22 million in Community Development Block Grant (CDBG) funds, Section 108 loans, and local urban renewal dollars. The coalition leveraged $110 million in private investments and more than $120 million in federal assistance over the next 20 years to preserve the buildings as affordable to extremely low-income households.
TheDCPreservationNetwork–Washington,DC
The DC Preservation Network (DCPN) is an organization of nonproit tenant organizers, nonproit and for-proit developers, intermediary lenders, city government staff, and HUD staff who meet monthly to discuss properties that are at risk of being lost from the affordable housing stock.
The network is primarily used as a data-sharing venue for stakeholders to coordinate preservation
resources at all points in the preservation process. The group was originally developed by the
National Low Income Housing Coalition, which created a database of federally-supported housing.
The network has grown in scope and membership since its inception in 2006 and is now coordinated through the Urban Institute and a local umbrella organization of housing organizations and includes
locally funded properties, as well as federal expiring uses. The network developed recommendations for the prioritization of preservation at the city level to include all expiring Section-8 eligible buildings near city-backed redevelopment and those serving households earning less than 30% of the Area
Median Income.
6. Support access to affordable housing through employee-assistance programs
Employer-assisted housing has been used to provide housing for workers in challenging
markets, support homeownership, and ultimately, increase the company’s competitiveness in hiring
and worker retention. Local governments cannot provide all the resources needed to address the
affordability gap, due to funds, political opposition, and the sheer volume of the need.
31

HouseKeysforEmployeesandLiveNearYourWork–Baltimore,MD
Maryland partners with more than 100 large and small employers across the state, including
nonproits, local jurisdictions, for-proit developers, and universities to provide matching funds for down-payment assistance. The state will match up to $2,500 of a zero- percent, deferred loan for employees of participating businesses. Johns Hopkins University has taken this initiative a step further and offers additional funding for employees who purchase homes within the neighborhood
where the hospital is located. Employees can receive up to $36,000 in forgivable loans, including foundation donations and funds from the City of Baltimore, the State of Maryland, and Johns Hopkins.
HousingTrustofSiliconValley-CA
Over the past two decades, businesses in Silicon Valley have complained of problems
recruiting and retaining top talent because their employees could not afford to rent or buy homes.
In response, community leaders partnered with locally headquartered companies to create the
Housing Trust of Silicon Valley (HTSV), a nonproit organization dedicated to making housing in the area affordable. Originally, the nonproit’s programs focused on creating rental housing for large families, the elderly, and special-needs individuals, as well as offering housing loans of up to
$6,500 for any resident living in Santa Clara County with an income level below 120% of the county median who wants to buy his or her irst house. The loan is later paid back when the house is either sold or reinanced. Since then, HTSV has grown rapidly in funding as well as scope; the Trust has invested over $75 million in housing construction and assistance, started a homelessness prevention program, and has leveraged almost $2 billion in capital to create thousands of new and affordable houses in the county.
AmericanFamilyLifeAssuranceCompany(AFLAC)–Columbus,GA
AFLAC partnered with NeighborWorks to launch an employer-assisted housing program
that offers a $1,000 grant to assist irst-time home buyers with the purchase of a home. AFLAC also offers an additional $4,000 to employees who buy houses in targeted neighborhoods, similar to Baltimore. Recipients are required to complete homeownership counseling and a inancial assessment implemented by NeighborWorks.
7. Develop a community land trust or land-banking program to support long- term affordable housing
Community land trusts or land banks acquire vacant properties through the local jurisdiction
via purchase, or eminent domain for redevelopment consistent with the neighborhood’s or
jurisdiction’s policy or planning goals. Community land trusts may be developed to encourage local
economic opportunity, affordable housing creation, and preservation, or to preserve open space. The
owning entity retains control over affordability and reduces the cost of the construction on the land by
retaining ownership of the land.
DudleyStreetNeighborhoodInitiative–Boston,MA
The Dudley Street Neighborhood in the Roxbury Section of Boston is one of the poorest and 32

most ethnically diverse neighborhoods in Boston. Neighborhood residents organized to create a
comprehensive development strategy for the neighborhood--particularly the large number of vacant
parcels--and acquire city-owned and vacant land that has been set aside for affordable housing,
economic development, and open spaces. The group has created 225 affordable units and two community centers on the land with a 99-year lease.
WestmorelandCountyLandBank–WestmorelandCounty,PA
The Westmoreland County Land Bank acquires, holds, and transfers interest in real property
throughout Westmoreland County for the following purposes: to deter the spread of blight; to promote redevelopment and reuse of vacant, abandoned, and tax-delinquent properties; to support targeted efforts to stabilize neighborhoods; and to stimulate residential, commercial and industrial development--all in ways that are consistent with goals and priorities established by the local
government and community stakeholders.
SurplusLandProgram–KingCounty,WA
The Metropolitan King County Council passed an ordinance that requires that if a parcel of
property is surplus to the needs of King County and is suitable for housing, then it should be sold
or leased for the purpose of affordable housing. While not a land bank or community land trust, the
program uses existing jurisdictional resources for affordable housing redevelopment.
8. Strengthen local and regional coalitions to provide advocacy at the project and policy levels. These practical advocacy efforts should include the coordination and execution of regional demonstration projects that are based upon the joint contributions of the public, private, and non-proit sectors and that relect best practices in mixed use and mixed income development.
One of the frequently cited challenges discussed by all groups that participated in the process
of developing this report is that local government cannot be tasked with tackling the affordability gap
alone. Funding is a challenge for local governments and there are signiicant gaps in support for affordable housing from local constituencies. Nevertheless, coalitions of local and state government
agencies, nonproits, for-proit developers, employers, philanthropic foundations, and investors can effectively address the affordable-housing issue.
SouthRichmondSingleRoomOccupancyProject–HenricoandChesterieldcountiesandtheCityofRichmond
In the Richmond region, Henrico, Chesterield, and the City of Richmond each provided $250,000 in funding to support a 21-room addition to Virginia Supportive Housing’s South Richmond Single Room Occupancy (SRO) complex. Local funds combined with $550,000 from the Virginia Department of Housing and Community Development, $50,000 from local foundations, and $2 million in tax credit equity from the Low Income Housing Tax Credit (LIHTC) program expanded the options for the homeless residents of the region. The pre-existing 39 units will be renovated using LIHTCs in the near future.
SouthHamptonRoadsRegionalTaskForcetoEndHomelessness-HamptonRoadsArea
The South Hampton Roads Regional Task Force to End Homelessness is an initiative 33

developed by mayors and county commissioners in 2005 to address a broad policy agenda. The task force includes the jurisdictions of Chesapeake, Franklin, Isle of Wight County, Norfolk,
Portsmouth, Southampton County, Suffolk, Virginia Beach, and 12 nonproit organizations. The task force works to increase resources to address homelessness and promote regional coordination to
provide services more eficiently. To date, the organization has facilitated the construction of 240 Single Room Occupancy (SRO) units for formerly homeless residents, coordinated multi-county
applications for US Housing and Urban Development funding, and hired a coordinator to manage the
process.
TheOhioPreservationCompact
The Ohio Preservation Compact is a group consisting of government and nonproit organizations focused on the preservation of affordable housing statewide. Since its creation in
2009, the organization has created an online database of all federally assisted housing, created a revolving loan fund of $18 million targeted for preservation projects, and has expanded to 85 member organizations that meet regionally to discuss and create strategies to preserve affordable
housing at the regional level.
CoalitionforNonproitHousingandEconomicDevelopment(CNHED)–Washington,DC
Founded in 2000 as a way of coordinating policy responses through a staffed umbrella organization, CNHED represents 140 organizations, including service providers, nonproit and for-proit housing developers, technical assistance providers, and intermediary lenders in housing and economic development in the region. The board members lead subcommittees that create proactive
policy priorities that CNHED staff use in advocacy to the city council. Most recently, CNHED has
implemented its Housing for All campaign as a way to rally tenants, members, city councilmembers,
and private citizens. CNHED has successfully advocated for a dedicated funding source for
affordable housing, regulatory changes to protect tenants in changing neighborhoods, and a
database of affordable housing. CNHED is active during the annual budget and oversight processes
to advocate on behalf of the City’s housing agency.
5. Recommendations to Actions
Although the magnitude of the affordable-housing challenge facing the Richmond Regional
Planning District is great and likely to continue growing, the discussion and recommendations above,
as well as the action and measures below show that there are many ways to address affordable
housing challenges one step at a time. No one entity needs to tackle the challenge alone; indeed, VCHR and VCU CURA have found no examples where a single entity or a single sector, such as nonproit, for-proit or government, has achieved sustained success by going it alone. If the region is to move forward on this issue, the public, private and non-proit sectors will have to create partnerships, at various geographic and organizational levels, to address speciic aspects of the issue as it is manifested in particular localities.
The most effective partnerships are generally voluntary in nature. But new partnerships
to address this issue are unlikely to form without a continuous public awareness campaign that
convinces the community to take action, shows how affordable housing issues can be addressed,
and commends those who take initiative and create solutions to meet the region’s housing needs.
VCU CURA and VCHR recommend that PHA launch this campaign, expanding on the work the34

organization has performed for several years. VCU CURA and VCHR suggest the following
components of the campaign:
1. Educate (and frequently reeducate) the entire community about the nature and magnitude
of the lack of affordable housing, as presented in this report.
2. Educate the community about the options that similar communities have used to address affordable housing issues, and the roles that public, private and nonproit entities can play, as the examples in this report illustrate.
3. Monitor the region’s progress in addressing the affordable housing challenge. We
recommend three levels of progress monitoring: inputs, outputs, and outcomes:
Inputs: Inputs include the private and public funds expended, partnerships formed, or policies changed which may effectively address the affordable housing challenge. VCU CURA and VCHR
recommend the following steps. First, PHA should create a list of the public entities, private for-proit developers and nonproit developers, as well as large employers, whose actions or policiesmay have an impact on affordable housing. Second, PHA should create an “activity baseline” by cataloging current policies and initiatives that affect affordable housing. Third, PHA should coordinate
with local governments to conduct an annual audit of housing affordability inputs (policies, programs,
funding, etc.). PHA should document new polices and identify opportunities that would create access
to affordable housing.
Outputs: Outputs are the results of efforts to supply more affordable housing or to increase the
ability of persons to pay for housing. Examples include the number of housing units brought to market at speciic, below-market price levels, or the number of Section-8 housing vouchers disbursed. To monitor outputs, VCHR and VCU CURA recommend that PHA develop a database of
the providers of affordable housing and similar types of services (updated annually) and maintain a
running ‘output account’, charting progress on an annual basis.
Outcomes: Section 2 presents an analysis of outcomes, the nature and magnitude of the housing affordability gap in the Richmond Regional Planning District. An analysis of this sort is the only way
to know the extent to which the region has effectively addressed its housing affordability challenge. Even massive efforts are unlikely to be able to move the needle appreciably in the course of one
or two years, therefore VCU CURA and VCHR recommend that PHA undertake an outcomes
assessment once every ive years to determine the state of the affordable housing gap in the Richmond Regional Planning District.
4. Celebrate every genuine effort and success. At various points during this research process, study participants stated that the chief barrier to progress on this issue is
negative community attitudes, which translate into a lack of political will to address the
issue. PHA may need to employ various tools to change community attitudes, perhaps
including frank discussion on occasion. One of PHA’s most valuable tools to change
community attitudes may be positive reinforcement--continuously searching for and
inding examples of positive contributions in the region, and then describing and rewarding them with positive media attention.
# # #
35

36
Partnership for Housing AffordabilityBoard of Directors
Jim Napier (Chair) Napier REALTORS® ERA
Nora Amos Town of Ashland
Bill Dupler Chesterield County
Rodney Hathaway New Kent County
James Hill City of Richmond
Tom Jacobson Virginia Commonwealth University
David Maloney Hanover County
Toni Ostrowski Virginia Housing Development Authority
John O’Reilly Base Camp Realty
Jackie Stewart Richmond Regional Planning District
Candice Streett Virginia LISC
S. Mark Strickler Henrico County
Craig Toalson Home Building Association of Richmond
Barbara Woodburn Village Bank
Laura Lafayette Executive Director