city of wheatland, california
TRANSCRIPT
CITY OF WHEATLAND, CALIFORNIA
COMPREHENSIVE ANNUAL FINANCIAL REPORT
FOR THE FISCAL YEAR ENDED
JUNE 30, 2019
111 C Street, Wheatland CA 95692
www.wheatland.ca.gov
CITY OF WHEATLAND, CALIFORNIA
COMPREHENSIVE ANNUAL FINANCIAL REPORT
FOR THE FISCAL YEAR ENDED
JUNE 30, 2019
Prepared by:
Susan Mahoney
Finance Director

1
111 C Street . Wheatland . California . 95692 _____________________________________________________________________________________
December 10, 2019
To the Honorable Mayor and Members of the City Council and Citizens of the City of Wheatland:
We are pleased to submit the City of Wheatland’s Comprehensive Annual Financial Report (CAFR) for
the fiscal year ended June 30, 2019. It is the policy of the Council to have a licensed certified public
accountant conduct an annual audit at the end of each fiscal year and to issue a complete set of
financial statements for the Council and all stakeholders of the City. The financial statements are
presented in conformity with generally accepted accounting principles (GAAP) and audited in
accordance with generally accepted auditing standards.
Responsibility for the accuracy of the data and the fairness of presentation, including all footnotes and
disclosures, rests with the City. We believe the data presented in this report is accurate in material
respects and all statements and disclosures necessary for the reader to obtain a thorough understanding
of the City’s financial activities have been included. Management of the City has established an internal
control framework that is designed both to protect the City’s assets from loss, theft, or misuse and to
compile sufficient reliable information of the preparation of the City’s financial statements in conformity
with GAAP. Because the cost of internal controls should not outweigh their benefits, the City’s
framework of internal controls has been designed to provide reasonable rather than absolute assurance
that the financial statements will be free from material misstatements.
While traditionally addressed to the governing body of the City, this report is intended to provide
relevant financial information to the citizens of the City of Wheatland, City staff, creditors, investors, and
other concerned readers. We encourage all readers to contact the Finance Department with any
questions or comments concerning this report.
The City’s financial statements have been audited by Moss, Levy & Hartzheim CPAs, a firm of certified
public accountants. The goal of the independent audit is to provide reasonable assurance that the
financial statements of the City for the fiscal year ended June 30, 2019 are free of material
misstatements. The independent audit involved examining, on a test basis, evidence supporting the
amounts and disclosures in the financial statements, assessing the accounting principles used and
significant estimates made by management, and evaluating the overall financial statement presentation.
Based upon the audit, the independent auditors concluded that there was a reasonable basis for
rendering an unmodified opinion, which states that the City’s financial statements for the fiscal year
ended June 30, 2019, are fairly presented in conformity with GAAP. The independent auditor’s report is
presented as the first component of the financial section of this report.
2
The independent audit of the financial statements of the City can be part of a broader, federally
mandated “Single Audit” designed to meet the special needs of federal grantor agencies. A Single Audit
is required when a state, local government, or not‐for‐profit organizations expends more than $750,000
per fiscal year in federal grant money. The standards governing Single Audit engagements require the
independent auditor to report not only on the fair presentation of the financial statements, but also on
the audited government’s internal controls and compliance with legal requirements, with special
emphasis on internal controls and legal requirements involving the administration of federal awards.
For the fiscal year ending June 30, 2019 the City was not required to issue a Single Audit Report.
GAAP requires that management provide a narrative introduction, overview, and analysis to accompany
the basic financial statements in the form of a Management’s Discussion and Analysis (MD&A). This
letter of transmittal is designed to complement the MD&A and should be read in conjunction with it.
The City’s MD&A can be found immediately following the report of the independent auditors.
Profile of the City of Wheatland
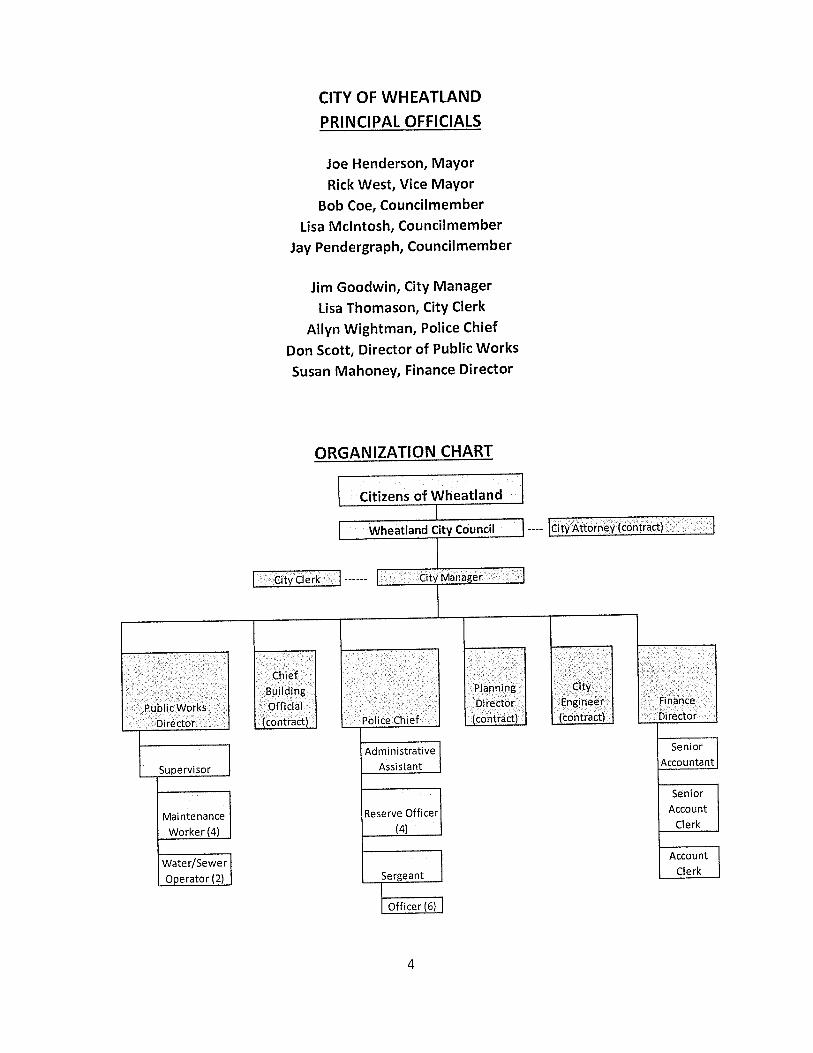
The City of Wheatland operates under a Council‐Manager form of government and provides municipal
services that include public safety, public works, parks and recreation, planning services, water and
wastewater services, and general administration. This report includes all funds of the City of Wheatland.
The City does not have Redevelopment Agency.
The City Council establishes an annual budget with a mid‐year review for the General Fund and all other
funds. Budgetary control is legally maintained at the fund level. Department heads submit budget
requests to the City Manager and Finance Director. The Finance Director prepares an estimate of
revenues and prepares recommendations for the next year’s budget. After approval by the City
Manager, the preliminary budget is presented to the City Council who may or may not make
amendments. The budget is adopted by resolution by the City Council on or before June 30 in
accordance with the municipal code.
The City of Wheatland, incorporated in 1874, is one of two incorporated cities in Yuba County. It is
nestled at the northeastern edge of California’s vast Sacramento Valley. Located 34 miles north of
Sacramento, 107 miles northeast of San Francisco and 417 miles northwest of Los Angeles. With a
population of more than 4,100 in a 42.2 square‐mile area, Wheatland is valued by its residents for its
small‐town atmosphere and rural setting.
The City of Wheatland City Council consists of five members, elected at‐large to four‐year overlapping
terms. Council members must be residents of the City. The position of Mayor and Vice Mayor are
chosen by the City Council. The Mayor conducts the Council meetings and represents the City on
ceremonial occasions.
The City Council serves as the policy board for the municipality. As elected officials, the City Council
provides policy direction, establishes goals, and sets priorities for the City government. In addition to
serving as the policy makers for the community, the City Council is also responsible for numerous land
3
use decisions within its borders in accordance with the General Plan and the Wheatland Municipal Code.
The City Council appoints the City Manager, City Attorney, and all members of advisory boards and
commissions.
Current Economic Conditions and Outlook
The City’s economic development efforts and implementation of the City’s financial policies help to
promote Wheatland’s long‐term fiscal stability. Each year, staff conducts a systematic review of
operations to make sure the blend of contract services and in‐house staffing promotes long‐term
savings and ensures long‐term stability. The City anticipates significant growth in the next ten years in
property tax revenue as planned subdivisions are being considered by several developers.
Acknowledgements
The preparation of this Financial Report could not be accomplished without the efficient and dedicated
service of the entire staff of the Finance Department and the auditing firm of Moss, Levy & Hartzheim
CPAs. I would like to express my appreciation to the members of the Finance Department who assisted
and contributed to its preparation – Cindy Brumley, Senior Accountant; Rafaela Vargas, Senior Account
Clerk; and Kaylie Rogers, Account Clerk.
I would also like to thank members of the City Council, the City Manager, and the various departments
for their cooperation and support in planning and conducting the financial operations of the City during
the fiscal year.
Respectfully submitted,
Susan Mahoney Susan Mahoney
Finance Director

7
MANAGEMENT’SDISCUSSIONANDANALYSIS
FOR THE FISCAL YEAR ENDED JUNE 30, 2019
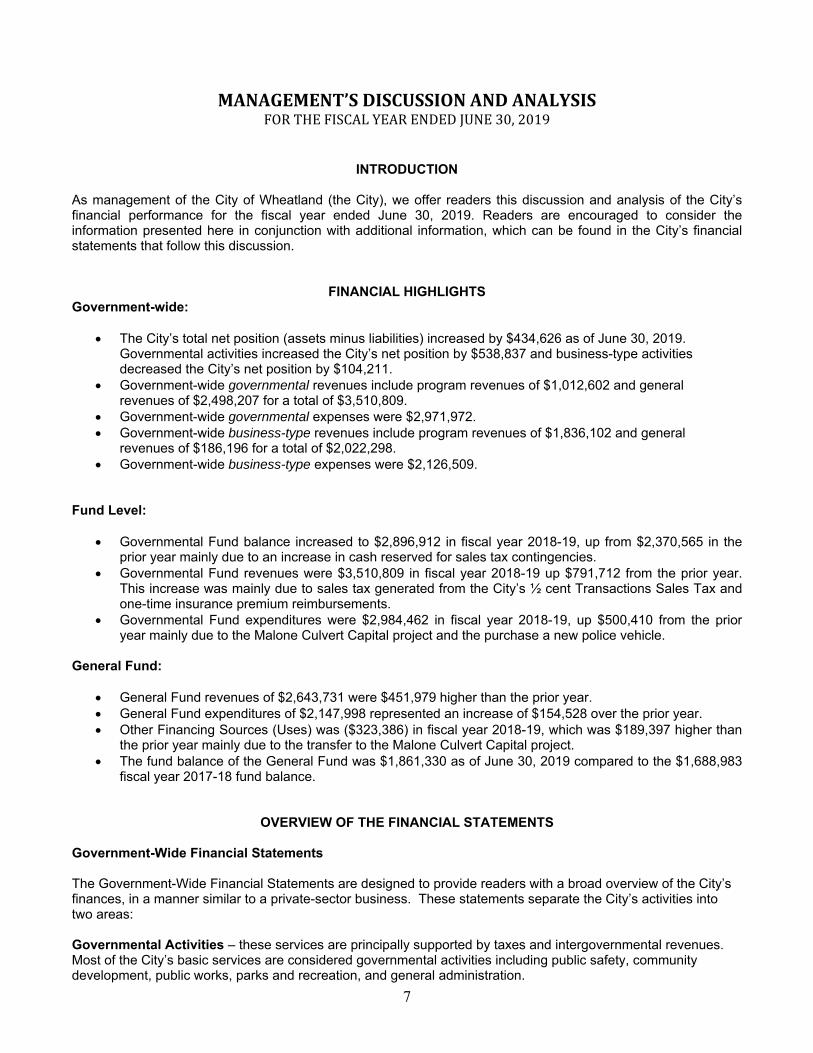
INTRODUCTION As management of the City of Wheatland (the City), we offer readers this discussion and analysis of the City’s financial performance for the fiscal year ended June 30, 2019. Readers are encouraged to consider the information presented here in conjunction with additional information, which can be found in the City’s financial statements that follow this discussion.
FINANCIAL HIGHLIGHTS Government-wide:
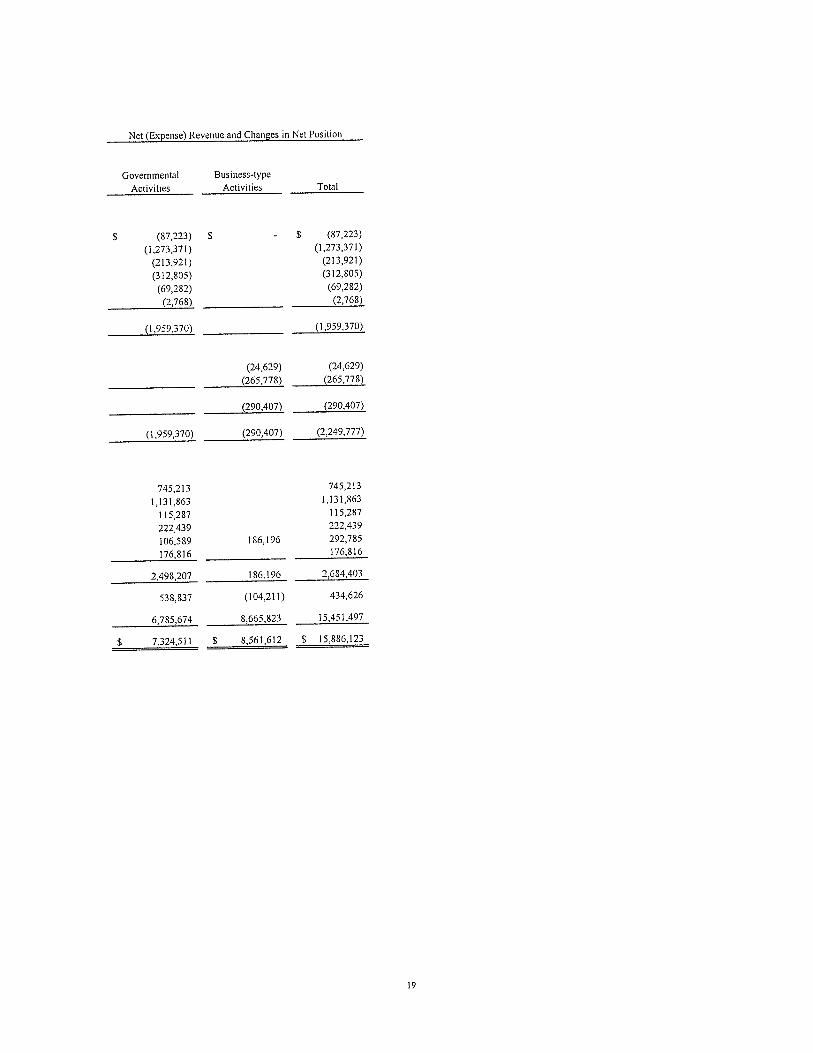
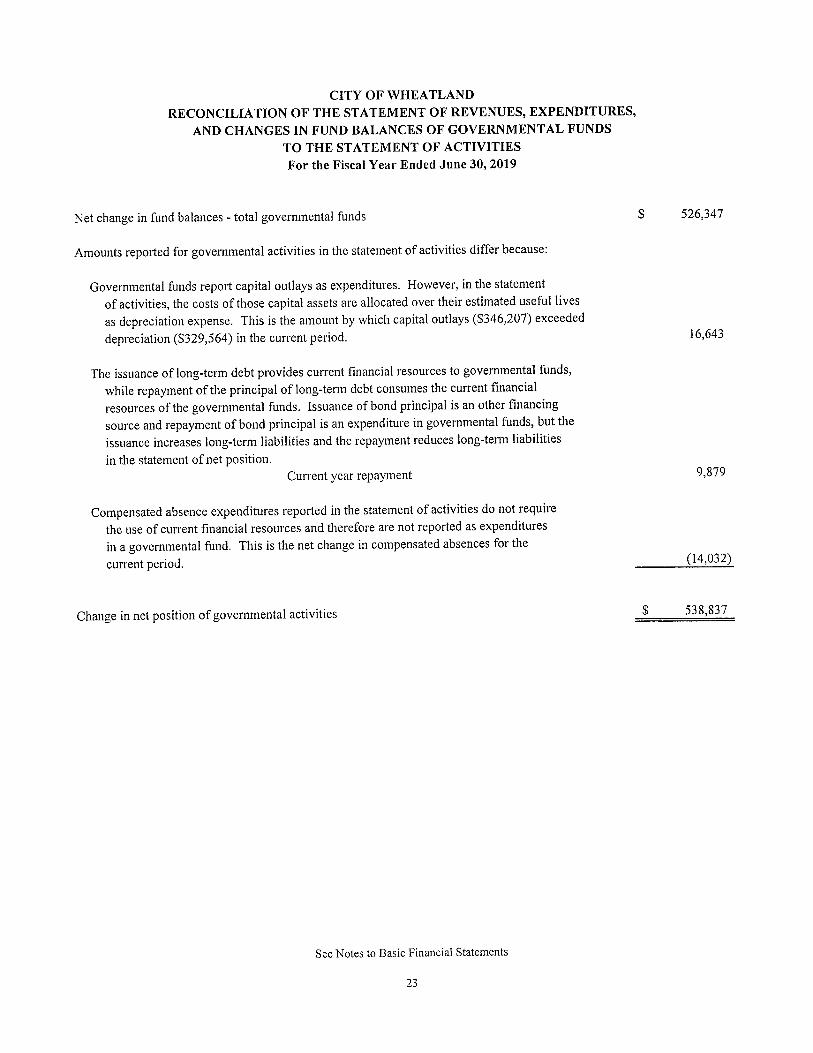
The City’s total net position (assets minus liabilities) increased by $434,626 as of June 30, 2019. Governmental activities increased the City’s net position by $538,837 and business-type activities decreased the City’s net position by $104,211.
Government-wide governmental revenues include program revenues of $1,012,602 and general revenues of $2,498,207 for a total of $3,510,809.
Government-wide governmental expenses were $2,971,972. Government-wide business-type revenues include program revenues of $1,836,102 and general
revenues of $186,196 for a total of $2,022,298. Government-wide business-type expenses were $2,126,509.
Fund Level:
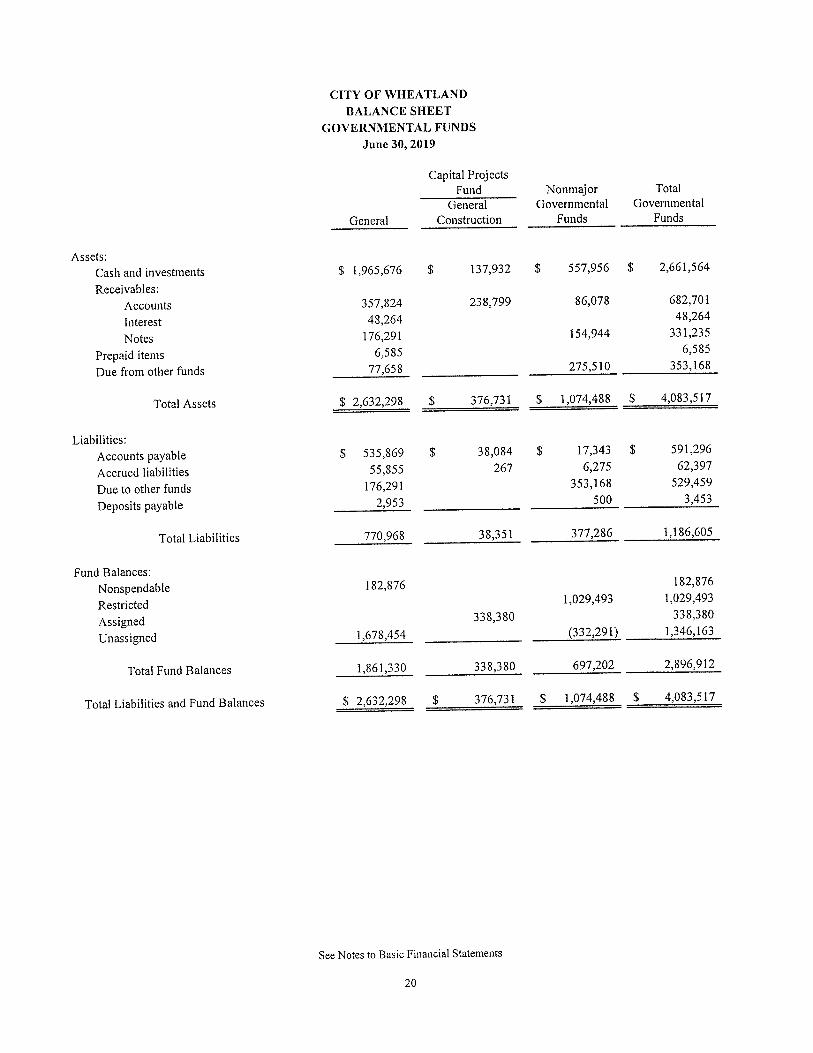
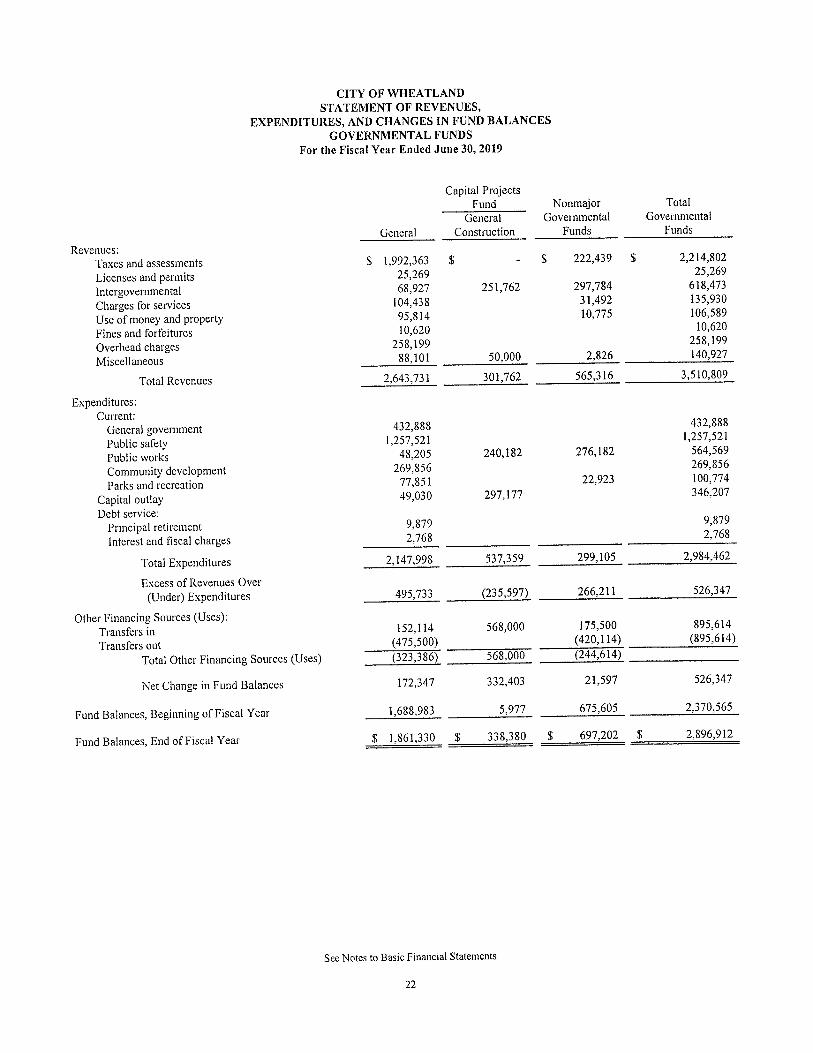
Governmental Fund balance increased to $2,896,912 in fiscal year 2018-19, up from $2,370,565 in the prior year mainly due to an increase in cash reserved for sales tax contingencies.
Governmental Fund revenues were $3,510,809 in fiscal year 2018-19 up $791,712 from the prior year. This increase was mainly due to sales tax generated from the City’s ½ cent Transactions Sales Tax and one-time insurance premium reimbursements.
Governmental Fund expenditures were $2,984,462 in fiscal year 2018-19, up $500,410 from the prior year mainly due to the Malone Culvert Capital project and the purchase a new police vehicle.
General Fund:
General Fund revenues of $2,643,731 were $451,979 higher than the prior year. General Fund expenditures of $2,147,998 represented an increase of $154,528 over the prior year. Other Financing Sources (Uses) was ($323,386) in fiscal year 2018-19, which was $189,397 higher than
the prior year mainly due to the transfer to the Malone Culvert Capital project. The fund balance of the General Fund was $1,861,330 as of June 30, 2019 compared to the $1,688,983
fiscal year 2017-18 fund balance.
OVERVIEW OF THE FINANCIAL STATEMENTS Government-Wide Financial Statements The Government-Wide Financial Statements are designed to provide readers with a broad overview of the City’s finances, in a manner similar to a private-sector business. These statements separate the City’s activities into two areas: Governmental Activities – these services are principally supported by taxes and intergovernmental revenues. Most of the City’s basic services are considered governmental activities including public safety, community development, public works, parks and recreation, and general administration.
8
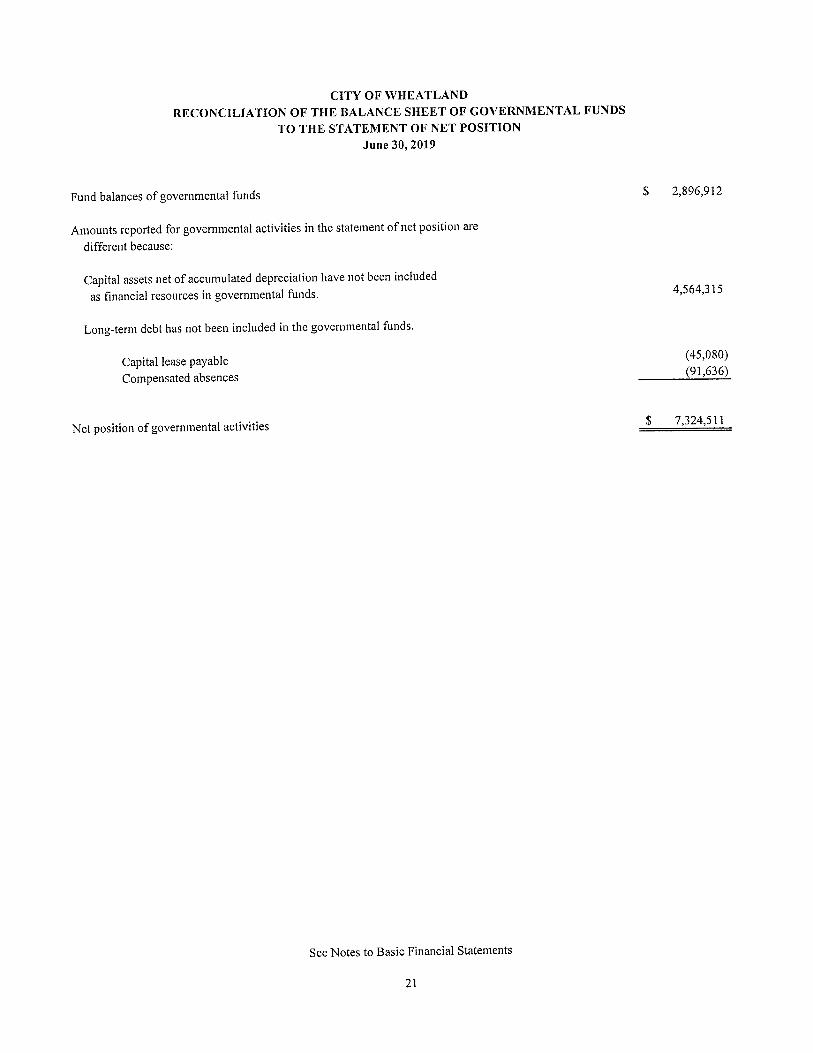
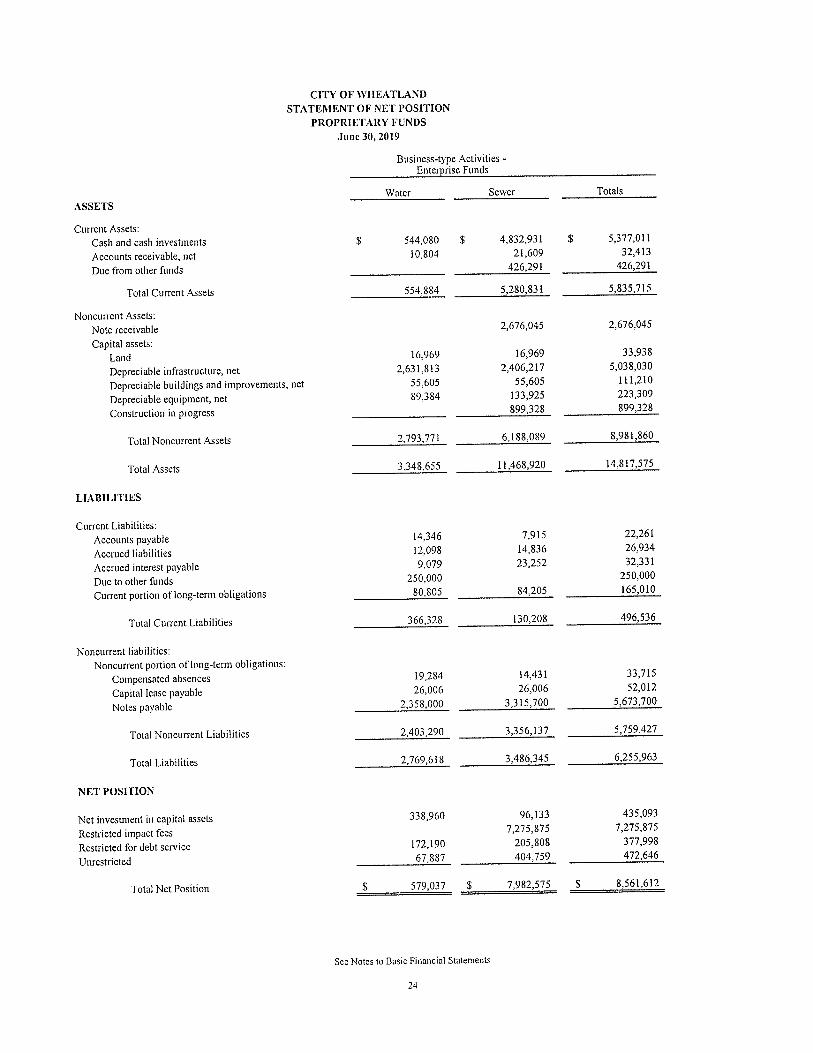
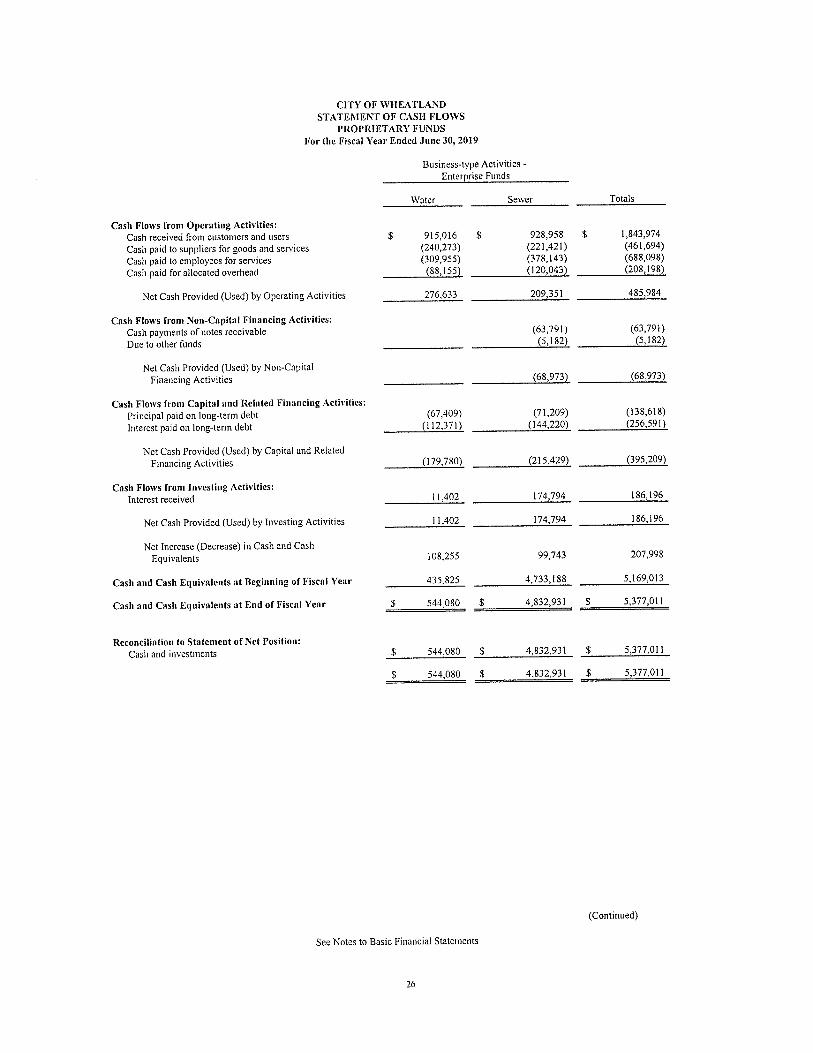
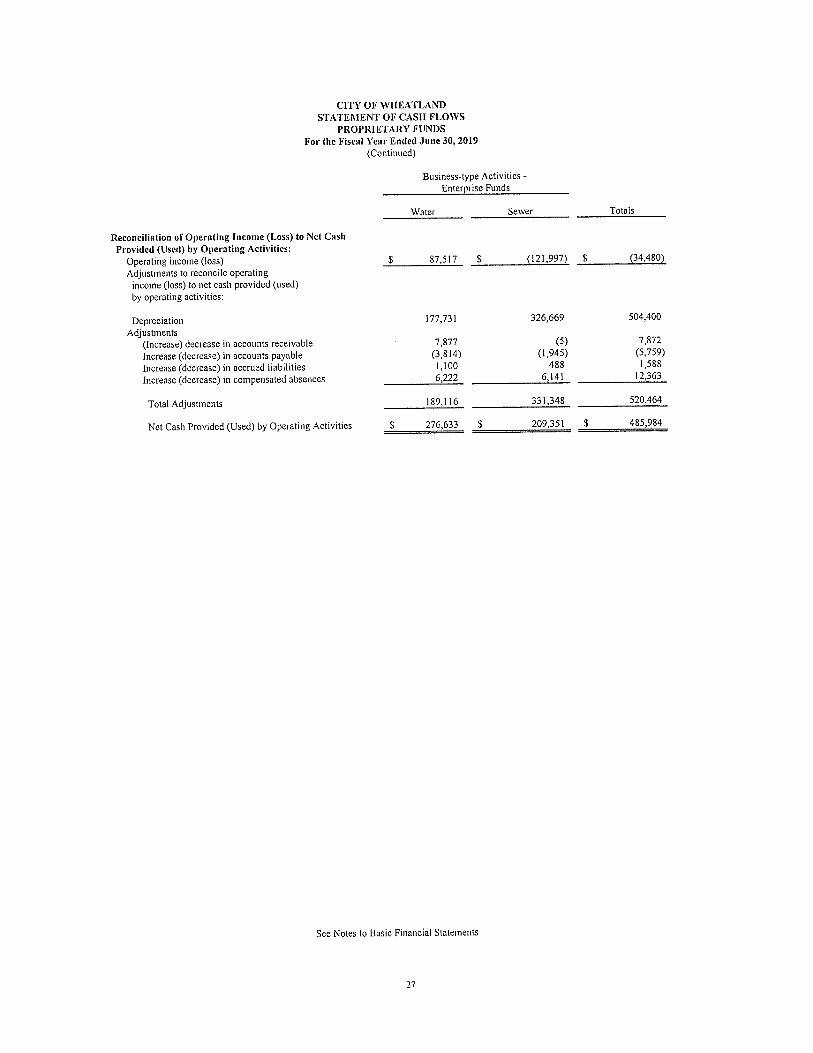
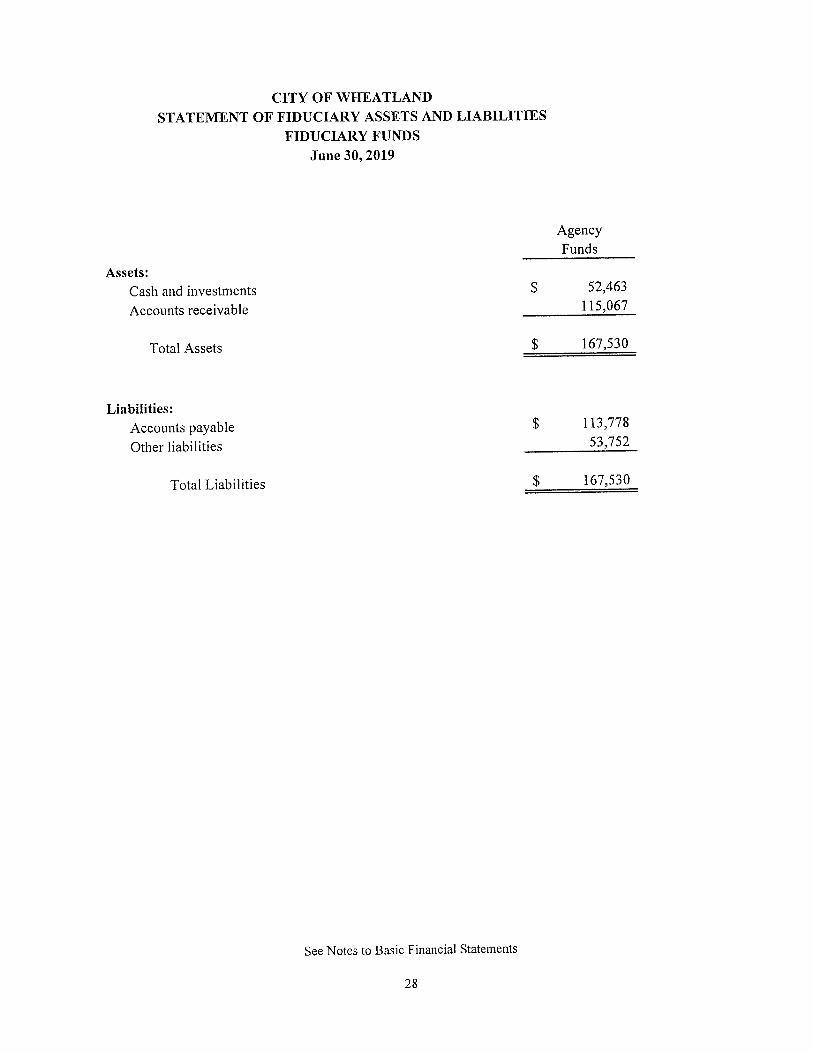
Business-Type Activities – these services rely upon user fees and charges to help cover all or most of their costs. The City’s water and wastewater systems are reported here. Within the framework of these activities, a Statement of Net Position and a Statement of Activities report information about the City as a whole. These statements include all assets and liabilities of the City (i.e., infrastructure and long-term debt) and use the accrual basis of accounting in which all the current year revenues and expenses are taken into account regardless of when the cash is received or paid. The two statements can be generally described as follows: The Statement of Net Position presents information on all of the City’s assets and liabilities, with the difference between the two reported as net position. Over time, increases or decreases in net position may serve as a useful indicator of whether the financial position of the City of Wheatland is improving or deteriorating. The Statement of Activities presents information showing how the City’s net position changed during the fiscal year. All changes in net position are reported as soon as the underlying event giving rise to the change occurs, regardless of the timing of related cash flows. Notably, these statements differ from the Fund Financial Statements in that they include all assets of the City (including infrastructure) and all liabilities (including long-term debt) and exclude certain interfund receivables, payables and other interfund activity as prescribed by GASB Statement No. 34. A reconciliation between the two is provided on pages 21 and 23 of this report. Fund Financial Statements A fund is a grouping of related accounts that is used to maintain control over resources that have been segregated for specific activities or objectives. The City of Wheatland, like other state and local governments, uses fund accounting to ensure and demonstrate compliance with finance-related legal requirements. All of the funds in the City of Wheatland can be divided into three categories: governmental funds, proprietary funds, and fiduciary funds. Governmental funds - most of the City’s basic services are reported in governmental funds, which focus on how money flows into and out of those funds and the balances left at fiscal year-end that are available for spending. These funds are reported using modified accrual accounting, which measures cash and all other financial assets that can be converted to cash. The governmental fund statements provide a detailed short-term view of the City’s general government operations and the basic services it provides. This information helps determine whether there are more or fewer financial resources that can be spent in the near future to finance the City’s programs. We describe the relationship between governmental activities (reported in the Statement of Net Position and the Statement of Activities) and the governmental funds in the reconciliation on pages 21 and 23. Proprietary Funds – when the City charges customers for services it provides, whether outside customers or to other units of the City, these services are generally reported in proprietary funds. Proprietary funds provide the same type of information as shown in the government-wide financial statements (i.e. business-type activities), only in more detail. The City uses proprietary funds to account for its water and wastewater operations. Fiduciary Funds – the City is the trustee, or fiduciary, for certain funds held on behalf of external parties. The City’s fiduciary activities are reported in separate Statement of Fiduciary Net Position. These activities are excluded from the City’s other financial statements because the resources of the funds are not available to support the City’s own programs. The City is responsible for ensuring that the assets reported in these funds are used for the intended purposes.
NOTES TO BASIC FINANCIAL STATEMENTS The notes provide additional information that is essential to a full understanding of the data provided in the government-wide and fund financial statements.
9
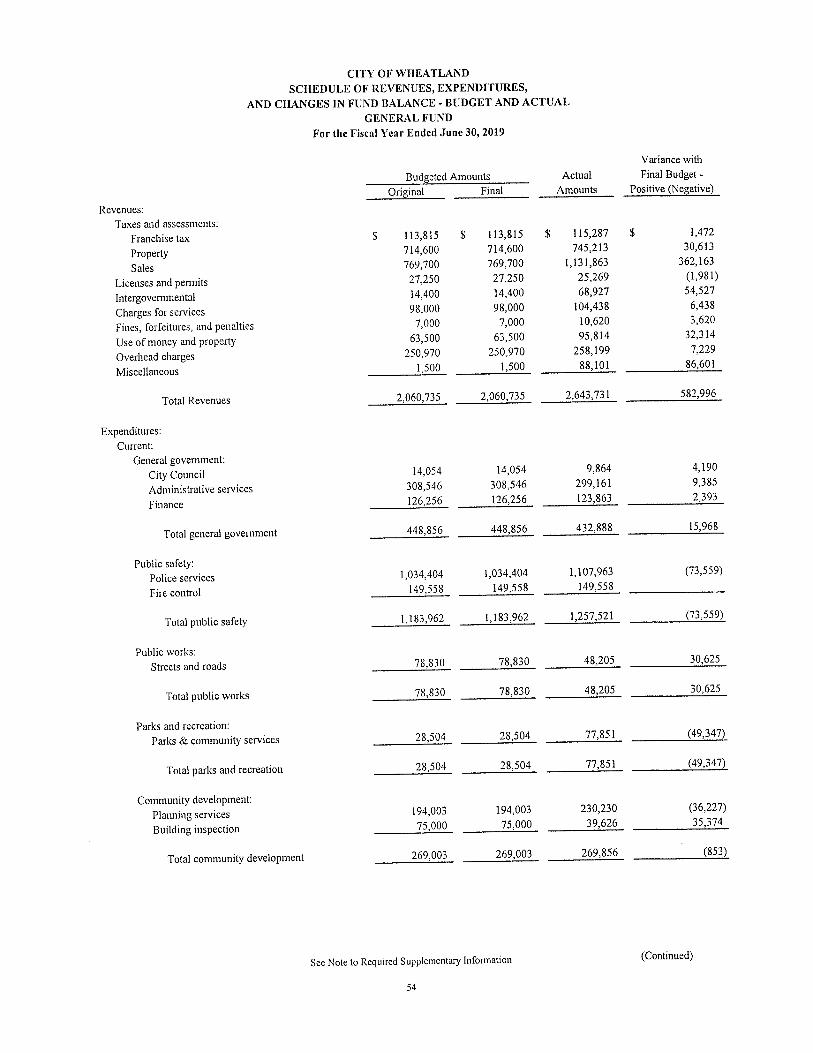
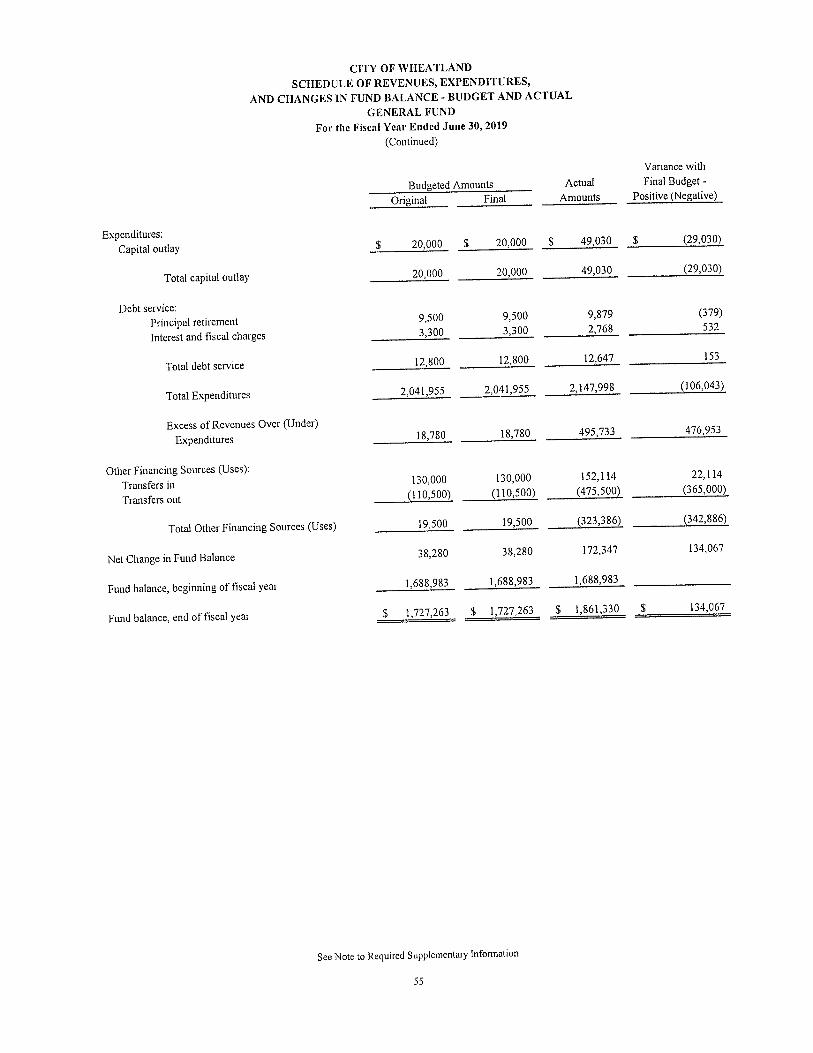
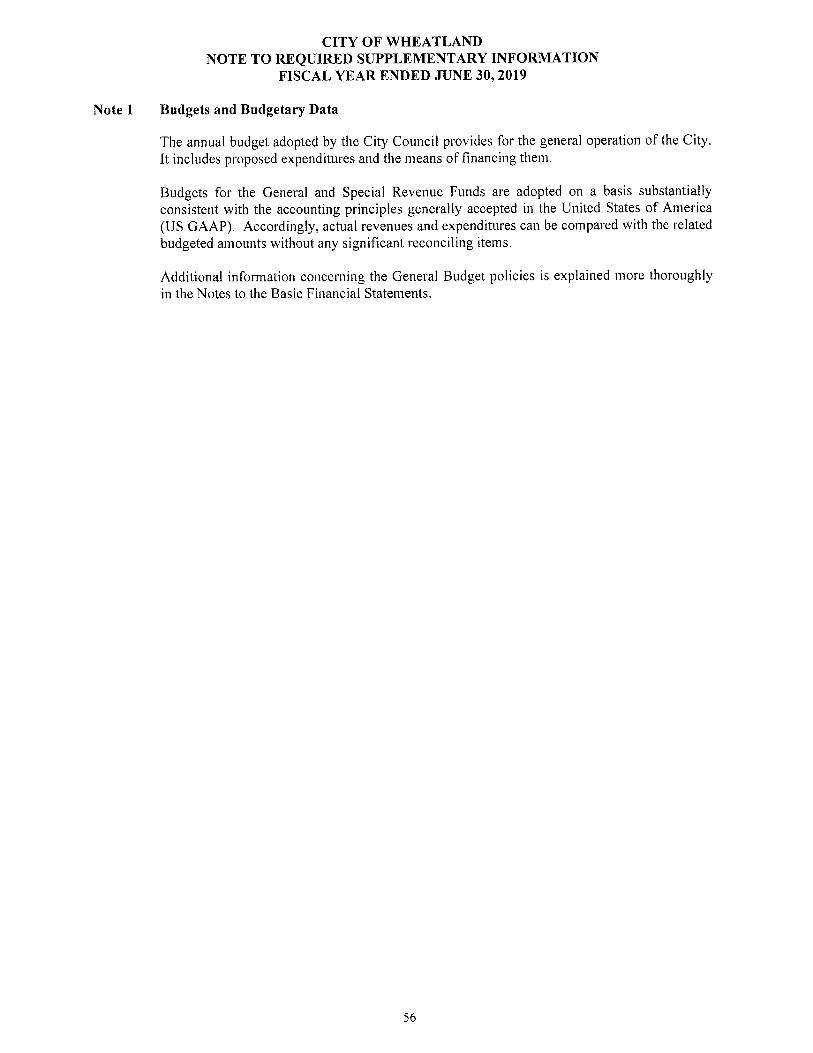
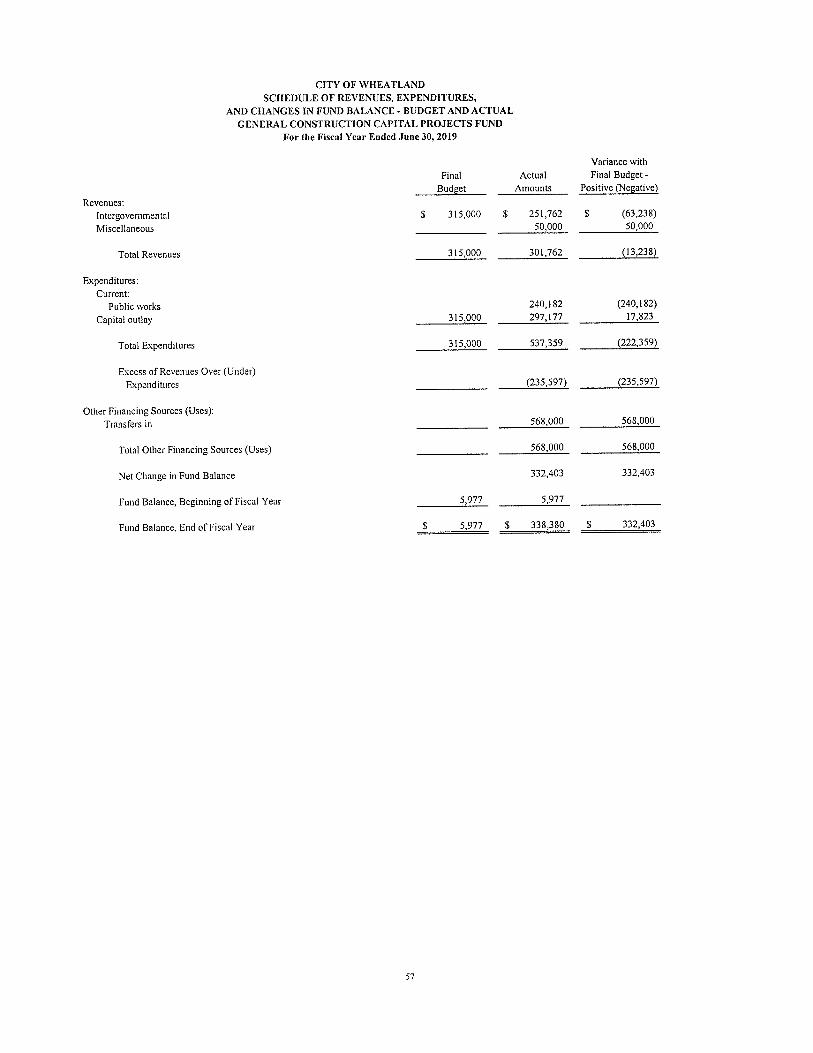
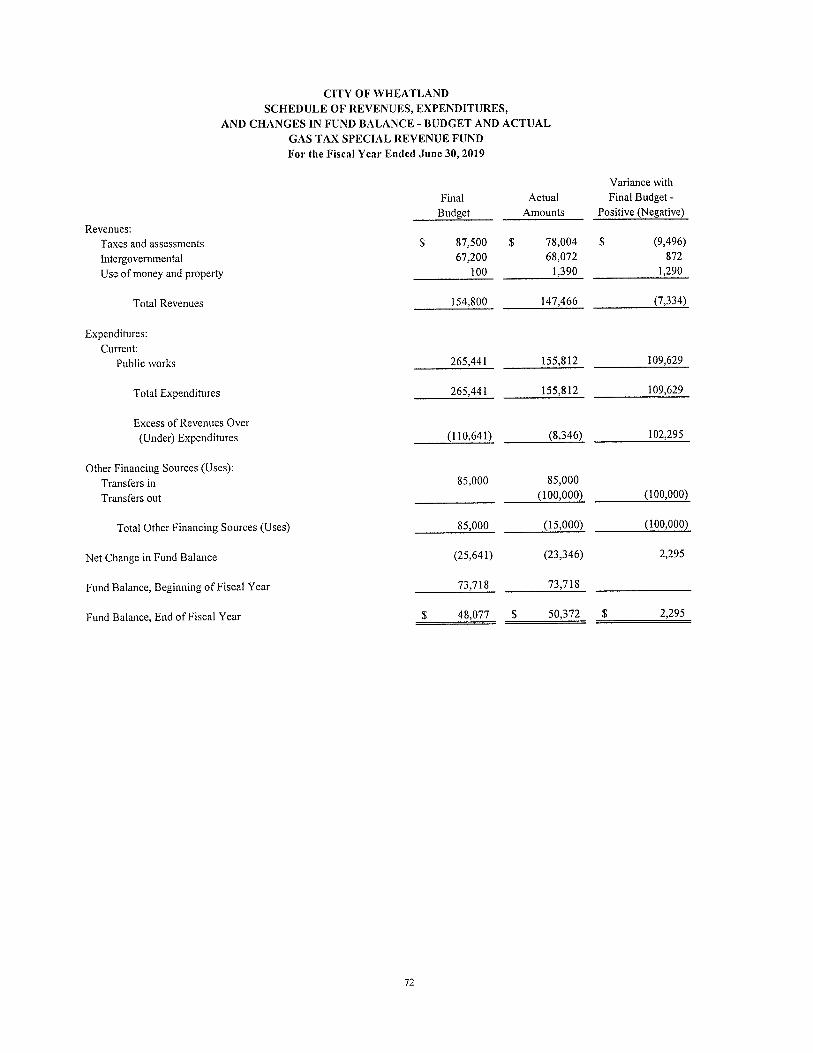
REQUIRED SUPPLEMENTARY INFORMATION In addition to the basic financial statements and accompanying notes, this report also presents the following required supplementary information: budgetary comparisons for the City’s General Fund as well as a description of the City’s accounting policies with regard to the annual budget.
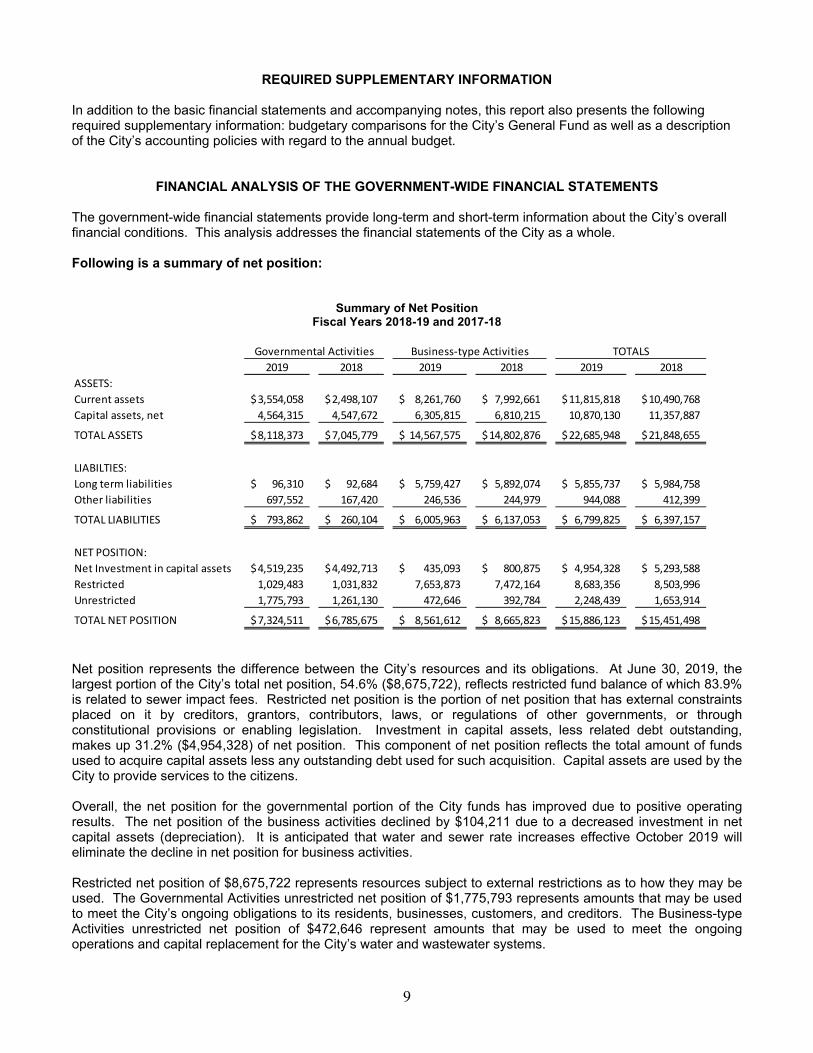
FINANCIAL ANALYSIS OF THE GOVERNMENT-WIDE FINANCIAL STATEMENTS The government-wide financial statements provide long-term and short-term information about the City’s overall financial conditions. This analysis addresses the financial statements of the City as a whole. Following is a summary of net position:
Summary of Net Position Fiscal Years 2018-19 and 2017-18
2019 2018 2019 2018 2019 2018
ASSETS:
Current assets 3,554,058$ 2,498,107$ 8,261,760$ 7,992,661$ 11,815,818$ 10,490,768$
Capital assets, net 4,564,315 4,547,672 6,305,815 6,810,215 10,870,130 11,357,887
TOTAL ASSETS 8,118,373$ 7,045,779$ 14,567,575$ 14,802,876$ 22,685,948$ 21,848,655$
LIABILTIES:
Long term liabilities 96,310$ 92,684$ 5,759,427$ 5,892,074$ 5,855,737$ 5,984,758$
Other liabilities 697,552 167,420 246,536 244,979 944,088 412,399
TOTAL LIABILITIES 793,862$ 260,104$ 6,005,963$ 6,137,053$ 6,799,825$ 6,397,157$
NET POSITION:
Net Investment in capital assets 4,519,235$ 4,492,713$ 435,093$ 800,875$ 4,954,328$ 5,293,588$
Restricted 1,029,483 1,031,832 7,653,873 7,472,164 8,683,356 8,503,996
Unrestricted 1,775,793 1,261,130 472,646 392,784 2,248,439 1,653,914
TOTAL NET POSITION 7,324,511$ 6,785,675$ 8,561,612$ 8,665,823$ 15,886,123$ 15,451,498$
TOTALSBusiness‐type ActivitiesGovernmental Activities
Net position represents the difference between the City’s resources and its obligations. At June 30, 2019, the largest portion of the City’s total net position, 54.6% ($8,675,722), reflects restricted fund balance of which 83.9% is related to sewer impact fees. Restricted net position is the portion of net position that has external constraints placed on it by creditors, grantors, contributors, laws, or regulations of other governments, or through constitutional provisions or enabling legislation. Investment in capital assets, less related debt outstanding, makes up 31.2% ($4,954,328) of net position. This component of net position reflects the total amount of funds used to acquire capital assets less any outstanding debt used for such acquisition. Capital assets are used by the City to provide services to the citizens. Overall, the net position for the governmental portion of the City funds has improved due to positive operating results. The net position of the business activities declined by $104,211 due to a decreased investment in net capital assets (depreciation). It is anticipated that water and sewer rate increases effective October 2019 will eliminate the decline in net position for business activities. Restricted net position of $8,675,722 represents resources subject to external restrictions as to how they may be used. The Governmental Activities unrestricted net position of $1,775,793 represents amounts that may be used to meet the City’s ongoing obligations to its residents, businesses, customers, and creditors. The Business-type Activities unrestricted net position of $472,646 represent amounts that may be used to meet the ongoing operations and capital replacement for the City’s water and wastewater systems.
10
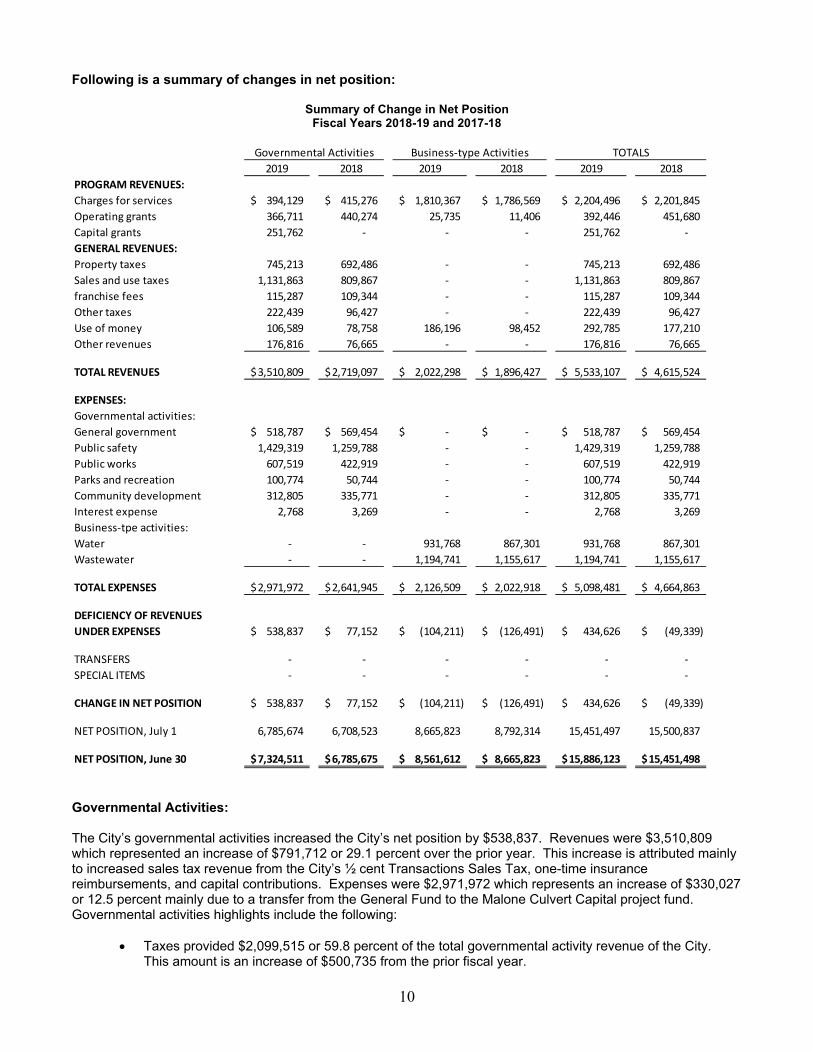
Following is a summary of changes in net position:
Summary of Change in Net Position Fiscal Years 2018-19 and 2017-18
2019 2018 2019 2018 2019 2018
PROGRAM REVENUES:
Charges for services 394,129$ 415,276$ 1,810,367$ 1,786,569$ 2,204,496$ 2,201,845$
Operating grants 366,711 440,274 25,735 11,406 392,446 451,680
Capital grants 251,762 ‐ ‐ ‐ 251,762 ‐
GENERAL REVENUES:
Property taxes 745,213 692,486 ‐ ‐ 745,213 692,486
Sales and use taxes 1,131,863 809,867 ‐ ‐ 1,131,863 809,867
franchise fees 115,287 109,344 ‐ ‐ 115,287 109,344
Other taxes 222,439 96,427 ‐ ‐ 222,439 96,427
Use of money 106,589 78,758 186,196 98,452 292,785 177,210
Other revenues 176,816 76,665 ‐ ‐ 176,816 76,665
TOTAL REVENUES 3,510,809$ 2,719,097$ 2,022,298$ 1,896,427$ 5,533,107$ 4,615,524$
EXPENSES:
Governmental activities:
General government 518,787$ 569,454$ ‐$ ‐$ 518,787$ 569,454$
Public safety 1,429,319 1,259,788 ‐ ‐ 1,429,319 1,259,788
Public works 607,519 422,919 ‐ ‐ 607,519 422,919
Parks and recreation 100,774 50,744 ‐ ‐ 100,774 50,744
Community development 312,805 335,771 ‐ ‐ 312,805 335,771
Interest expense 2,768 3,269 ‐ ‐ 2,768 3,269
Business‐tpe activities:
Water ‐ ‐ 931,768 867,301 931,768 867,301
Wastewater ‐ ‐ 1,194,741 1,155,617 1,194,741 1,155,617
TOTAL EXPENSES 2,971,972$ 2,641,945$ 2,126,509$ 2,022,918$ 5,098,481$ 4,664,863$
DEFICIENCY OF REVENUES
UNDER EXPENSES 538,837$ 77,152$ (104,211)$ (126,491)$ 434,626$ (49,339)$
TRANSFERS ‐ ‐ ‐ ‐ ‐ ‐
SPECIAL ITEMS ‐ ‐ ‐ ‐ ‐ ‐
CHANGE IN NET POSITION 538,837$ 77,152$ (104,211)$ (126,491)$ 434,626$ (49,339)$
NET POSITION, July 1 6,785,674 6,708,523 8,665,823 8,792,314 15,451,497 15,500,837
NET POSITION, June 30 7,324,511$ 6,785,675$ 8,561,612$ 8,665,823$ 15,886,123$ 15,451,498$
Governmental Activities Business‐type Activities TOTALS
Governmental Activities: The City’s governmental activities increased the City’s net position by $538,837. Revenues were $3,510,809 which represented an increase of $791,712 or 29.1 percent over the prior year. This increase is attributed mainly to increased sales tax revenue from the City’s ½ cent Transactions Sales Tax, one-time insurance reimbursements, and capital contributions. Expenses were $2,971,972 which represents an increase of $330,027 or 12.5 percent mainly due to a transfer from the General Fund to the Malone Culvert Capital project fund. Governmental activities highlights include the following:
Taxes provided $2,099,515 or 59.8 percent of the total governmental activity revenue of the City. This amount is an increase of $500,735 from the prior fiscal year.
11
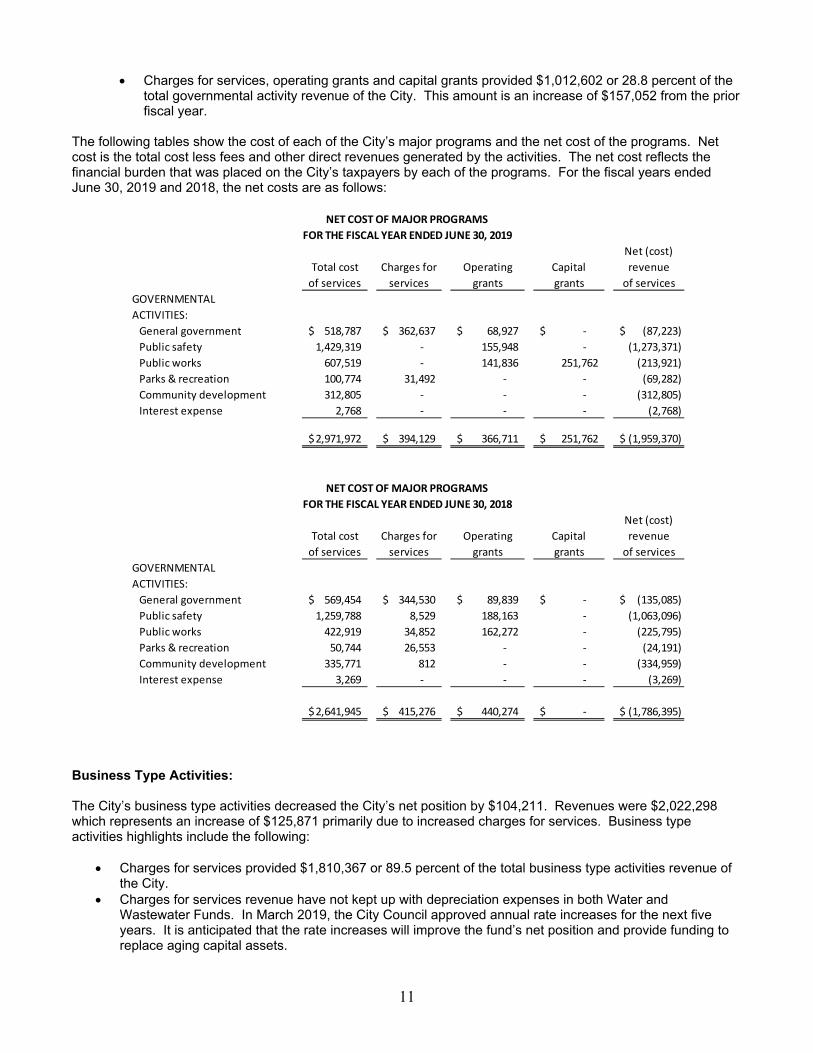
Charges for services, operating grants and capital grants provided $1,012,602 or 28.8 percent of the total governmental activity revenue of the City. This amount is an increase of $157,052 from the prior fiscal year.
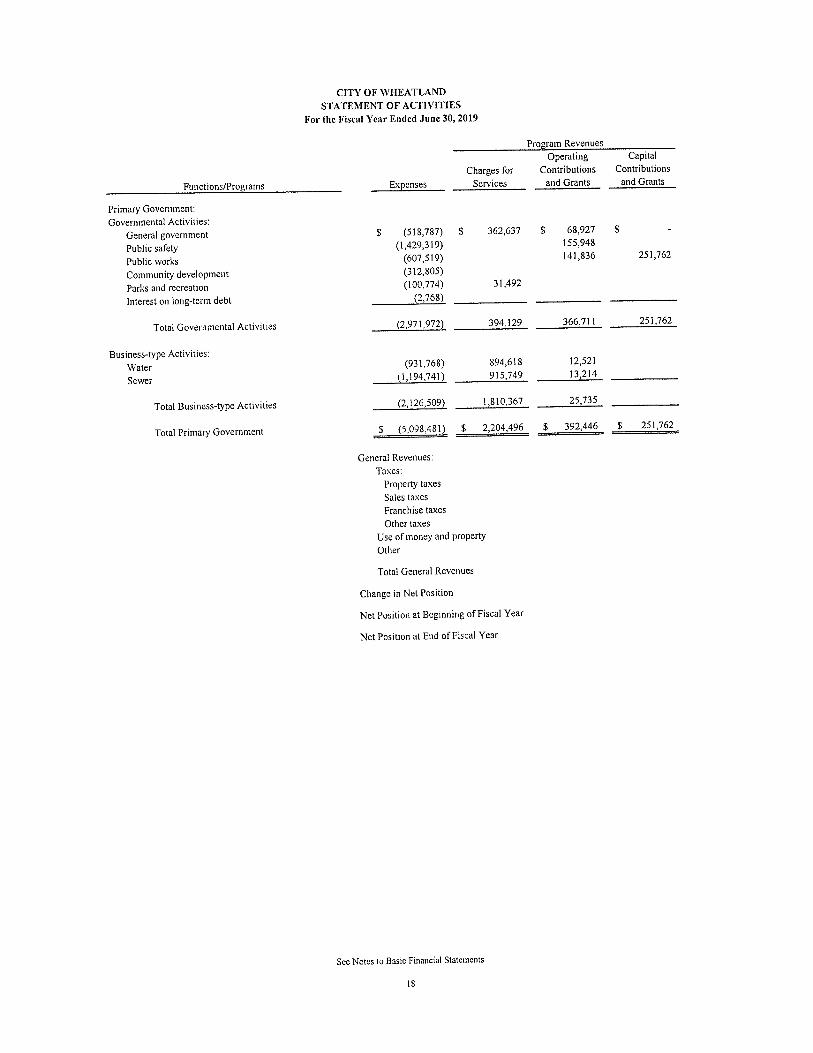
The following tables show the cost of each of the City’s major programs and the net cost of the programs. Net cost is the total cost less fees and other direct revenues generated by the activities. The net cost reflects the financial burden that was placed on the City’s taxpayers by each of the programs. For the fiscal years ended June 30, 2019 and 2018, the net costs are as follows:
Net (cost)
Total cost Charges for Operating Capital revenue
of services services grants grants of services
GOVERNMENTAL
ACTIVITIES:
General government 518,787$ 362,637$ 68,927$ ‐$ (87,223)$
Public safety 1,429,319 ‐ 155,948 ‐ (1,273,371)
Public works 607,519 ‐ 141,836 251,762 (213,921)
Parks & recreation 100,774 31,492 ‐ ‐ (69,282)
Community development 312,805 ‐ ‐ ‐ (312,805)
Interest expense 2,768 ‐ ‐ ‐ (2,768)
2,971,972$ 394,129$ 366,711$ 251,762$ (1,959,370)$
Net (cost)
Total cost Charges for Operating Capital revenue
of services services grants grants of services
GOVERNMENTAL
ACTIVITIES:
General government 569,454$ 344,530$ 89,839$ ‐$ (135,085)$
Public safety 1,259,788 8,529 188,163 ‐ (1,063,096)
Public works 422,919 34,852 162,272 ‐ (225,795)
Parks & recreation 50,744 26,553 ‐ ‐ (24,191)
Community development 335,771 812 ‐ ‐ (334,959)
Interest expense 3,269 ‐ ‐ ‐ (3,269)
2,641,945$ 415,276$ 440,274$ ‐$ (1,786,395)$
NET COST OF MAJOR PROGRAMS
FOR THE FISCAL YEAR ENDED JUNE 30, 2019
NET COST OF MAJOR PROGRAMS
FOR THE FISCAL YEAR ENDED JUNE 30, 2018
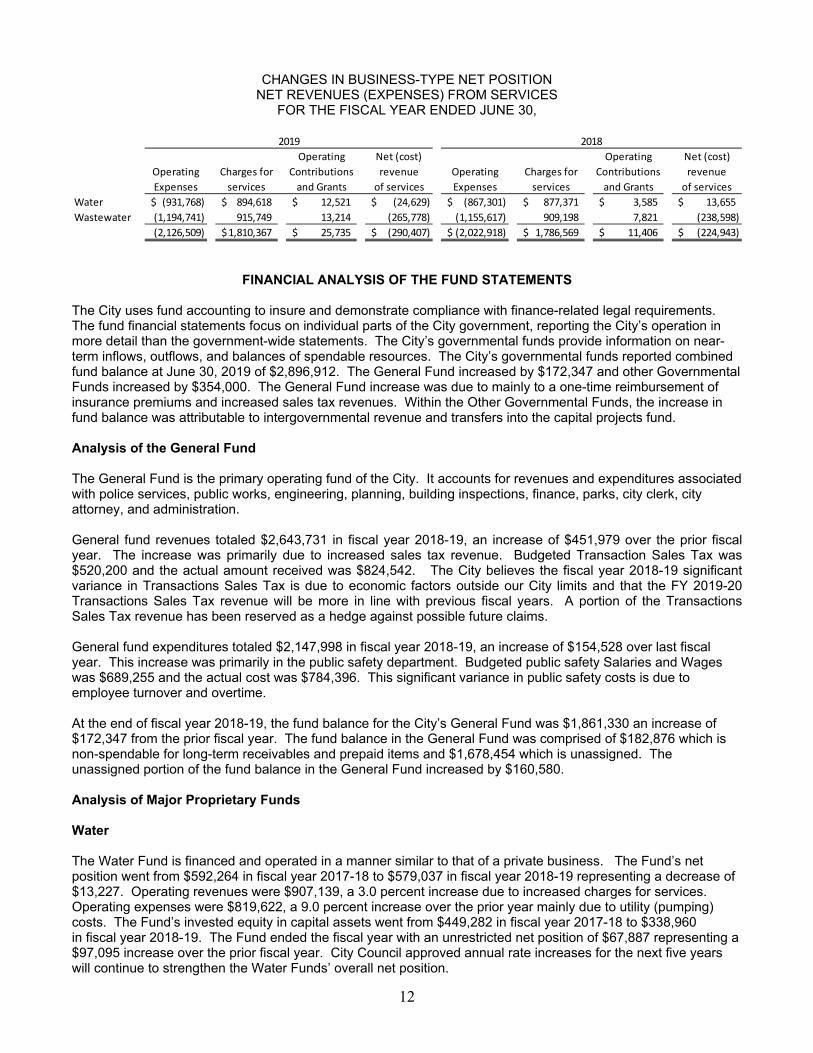
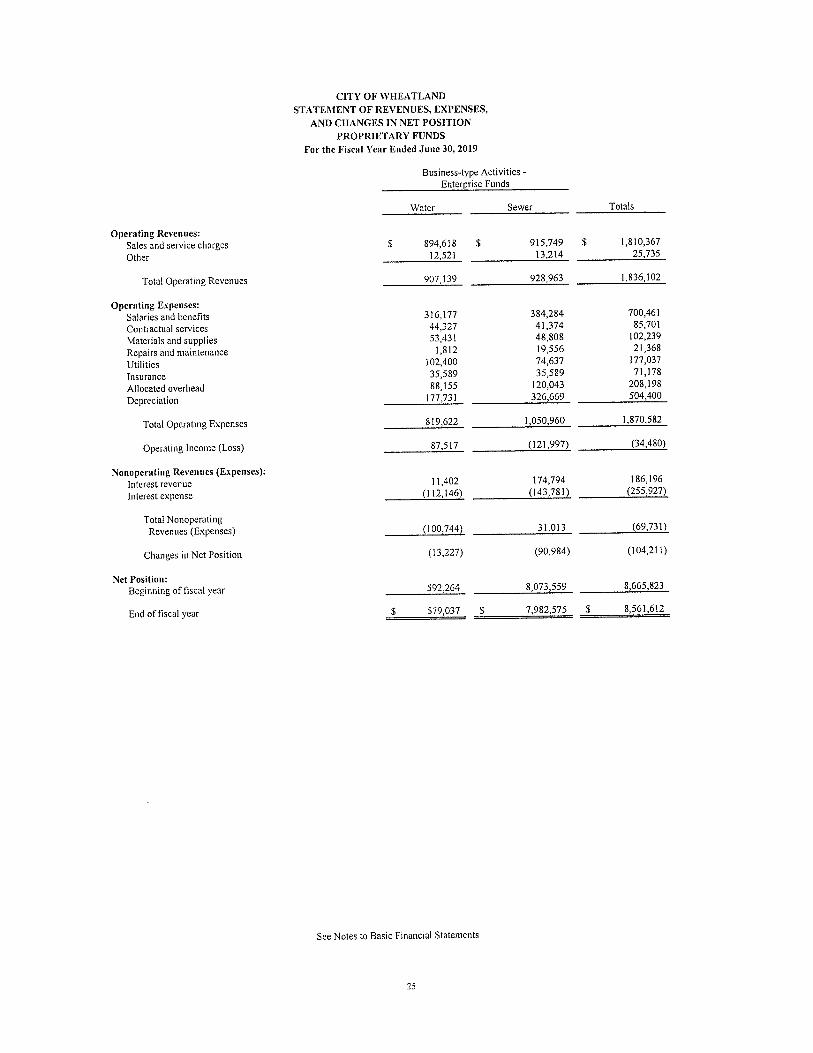
Business Type Activities: The City’s business type activities decreased the City’s net position by $104,211. Revenues were $2,022,298 which represents an increase of $125,871 primarily due to increased charges for services. Business type activities highlights include the following:
Charges for services provided $1,810,367 or 89.5 percent of the total business type activities revenue of the City.
Charges for services revenue have not kept up with depreciation expenses in both Water and Wastewater Funds. In March 2019, the City Council approved annual rate increases for the next five years. It is anticipated that the rate increases will improve the fund’s net position and provide funding to replace aging capital assets.
12
CHANGES IN BUSINESS-TYPE NET POSITION NET REVENUES (EXPENSES) FROM SERVICES
FOR THE FISCAL YEAR ENDED JUNE 30,
Operating Net (cost) Operating Net (cost)
Operating Charges for Contributions revenue Operating Charges for Contributions revenue
Expenses services and Grants of services Expenses services and Grants of services
Water (931,768)$ 894,618$ 12,521$ (24,629)$ (867,301)$ 877,371$ 3,585$ 13,655$
Wastewater (1,194,741) 915,749 13,214 (265,778) (1,155,617) 909,198 7,821 (238,598)
(2,126,509) 1,810,367$ 25,735$ (290,407)$ (2,022,918)$ 1,786,569$ 11,406$ (224,943)$
2019 2018
FINANCIAL ANALYSIS OF THE FUND STATEMENTS The City uses fund accounting to insure and demonstrate compliance with finance-related legal requirements. The fund financial statements focus on individual parts of the City government, reporting the City’s operation in more detail than the government-wide statements. The City’s governmental funds provide information on near-term inflows, outflows, and balances of spendable resources. The City’s governmental funds reported combined fund balance at June 30, 2019 of $2,896,912. The General Fund increased by $172,347 and other Governmental Funds increased by $354,000. The General Fund increase was due to mainly to a one-time reimbursement of insurance premiums and increased sales tax revenues. Within the Other Governmental Funds, the increase in fund balance was attributable to intergovernmental revenue and transfers into the capital projects fund.
Analysis of the General Fund The General Fund is the primary operating fund of the City. It accounts for revenues and expenditures associated with police services, public works, engineering, planning, building inspections, finance, parks, city clerk, city attorney, and administration. General fund revenues totaled $2,643,731 in fiscal year 2018-19, an increase of $451,979 over the prior fiscal year. The increase was primarily due to increased sales tax revenue. Budgeted Transaction Sales Tax was $520,200 and the actual amount received was $824,542. The City believes the fiscal year 2018-19 significant variance in Transactions Sales Tax is due to economic factors outside our City limits and that the FY 2019-20 Transactions Sales Tax revenue will be more in line with previous fiscal years. A portion of the Transactions Sales Tax revenue has been reserved as a hedge against possible future claims. General fund expenditures totaled $2,147,998 in fiscal year 2018-19, an increase of $154,528 over last fiscal year. This increase was primarily in the public safety department. Budgeted public safety Salaries and Wages was $689,255 and the actual cost was $784,396. This significant variance in public safety costs is due to employee turnover and overtime. At the end of fiscal year 2018-19, the fund balance for the City’s General Fund was $1,861,330 an increase of $172,347 from the prior fiscal year. The fund balance in the General Fund was comprised of $182,876 which is non-spendable for long-term receivables and prepaid items and $1,678,454 which is unassigned. The unassigned portion of the fund balance in the General Fund increased by $160,580. Analysis of Major Proprietary Funds Water The Water Fund is financed and operated in a manner similar to that of a private business. The Fund’s net position went from $592,264 in fiscal year 2017-18 to $579,037 in fiscal year 2018-19 representing a decrease of $13,227. Operating revenues were $907,139, a 3.0 percent increase due to increased charges for services. Operating expenses were $819,622, a 9.0 percent increase over the prior year mainly due to utility (pumping) costs. The Fund’s invested equity in capital assets went from $449,282 in fiscal year 2017-18 to $338,960 in fiscal year 2018-19. The Fund ended the fiscal year with an unrestricted net position of $67,887 representing a $97,095 increase over the prior fiscal year. City Council approved annual rate increases for the next five years will continue to strengthen the Water Funds’ overall net position.
13
Wastewater The Wastewater fund is financed and operated in a manner similar to that of a private business. The Fund’s net position went from $8,073,559 in fiscal year 2017-18 to $7,982,575 in fiscal year 2018-19, representing a decrease of $90,984. This is mainly due to a decrease in the fund’s net investment in capital assets (depreciation). Operating revenues were $928,963, a 1.3 percent increase over the prior fiscal year. The Fund’s invested equity in capital assets went from $351,593 in fiscal year 2017-18 to $96,133 in fiscal year 2018-19. The Fund ended the fiscal year with an unrestricted net position of $404,759 and restricted net position of $7,481,683 mostly attributable to the sewer collection impact fee fund. City Council approved annual rate increases for the next five years will continue to strengthen the Wastewater Funds’ overall net position.
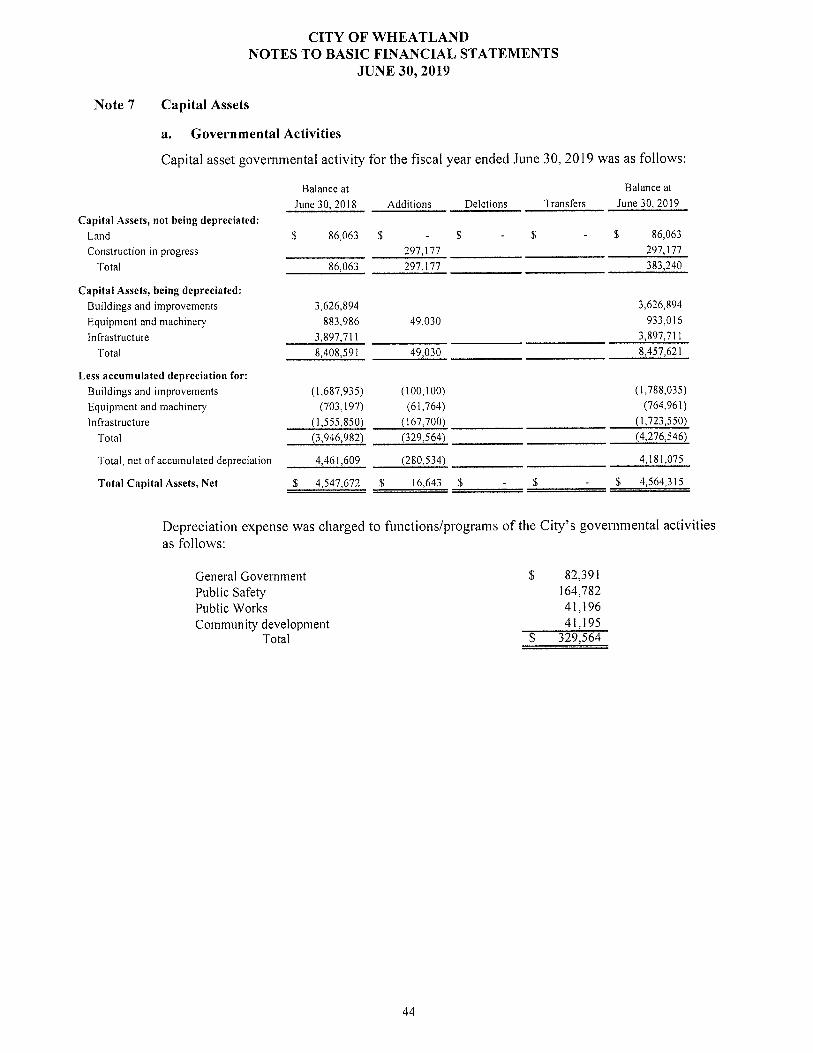
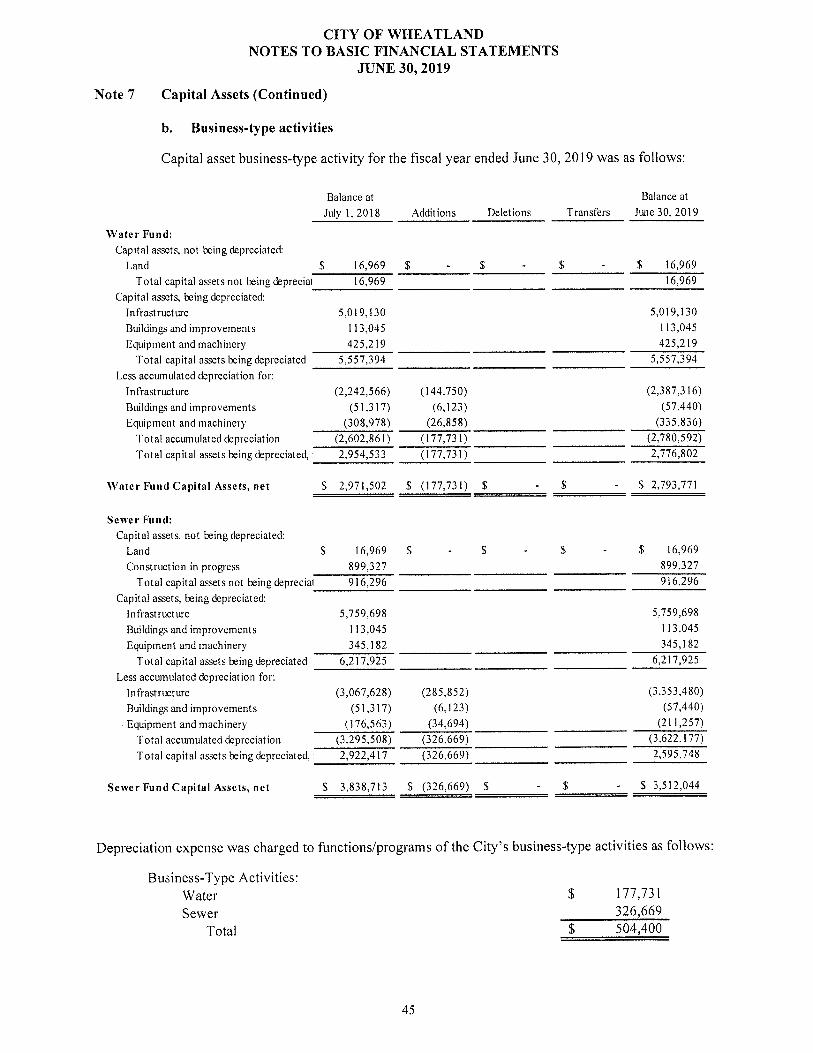
CAPITAL ASSETS AND LONG-TERM DEBT Capital assets At the end of fiscal year 2018-19, the City had invested $21,549,445 in a broad range of capital assets, including police and fire equipment, buildings, park facilities, street and storm drainage improvements and water and wastewater facilities. Additional detailed information on the City’s capital assets is presented Note 7 to the financial statements on pages 44 through 45. The financial statements summarize the City’s accounting policies regarding capital assets in Note 1 of the note disclosures. In general terms, the city capitalizes assets in governmental funds at the $5,000 level. These capital assets are depreciated on a straight-line basis varied from 3 years to 50 years. At June 30, 2019, major construction in progress included:
Sewer Treatment Plan design Malone Culvert Replacement Hooper Street Improvements
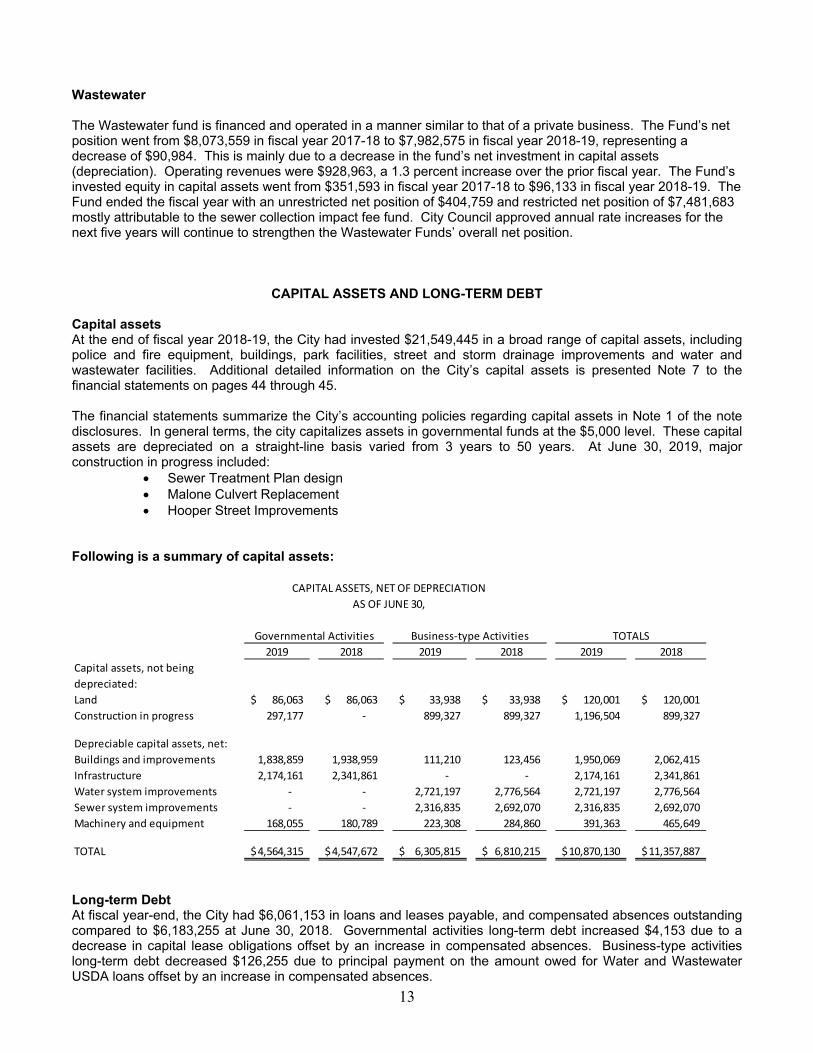
Following is a summary of capital assets:
2019 2018 2019 2018 2019 2018
Capital assets, not being
depreciated:
Land 86,063$ 86,063$ 33,938$ 33,938$ 120,001$ 120,001$
Construction in progress 297,177 ‐ 899,327 899,327 1,196,504 899,327
Depreciable capital assets, net:
Buildings and improvements 1,838,859 1,938,959 111,210 123,456 1,950,069 2,062,415
Infrastructure 2,174,161 2,341,861 ‐ ‐ 2,174,161 2,341,861
Water system improvements ‐ ‐ 2,721,197 2,776,564 2,721,197 2,776,564
Sewer system improvements ‐ ‐ 2,316,835 2,692,070 2,316,835 2,692,070
Machinery and equipment 168,055 180,789 223,308 284,860 391,363 465,649
TOTAL 4,564,315$ 4,547,672$ 6,305,815$ 6,810,215$ 10,870,130$ 11,357,887$
Governmental Activities Business‐type Activities TOTALS
CAPITAL ASSETS, NET OF DEPRECIATION
AS OF JUNE 30,
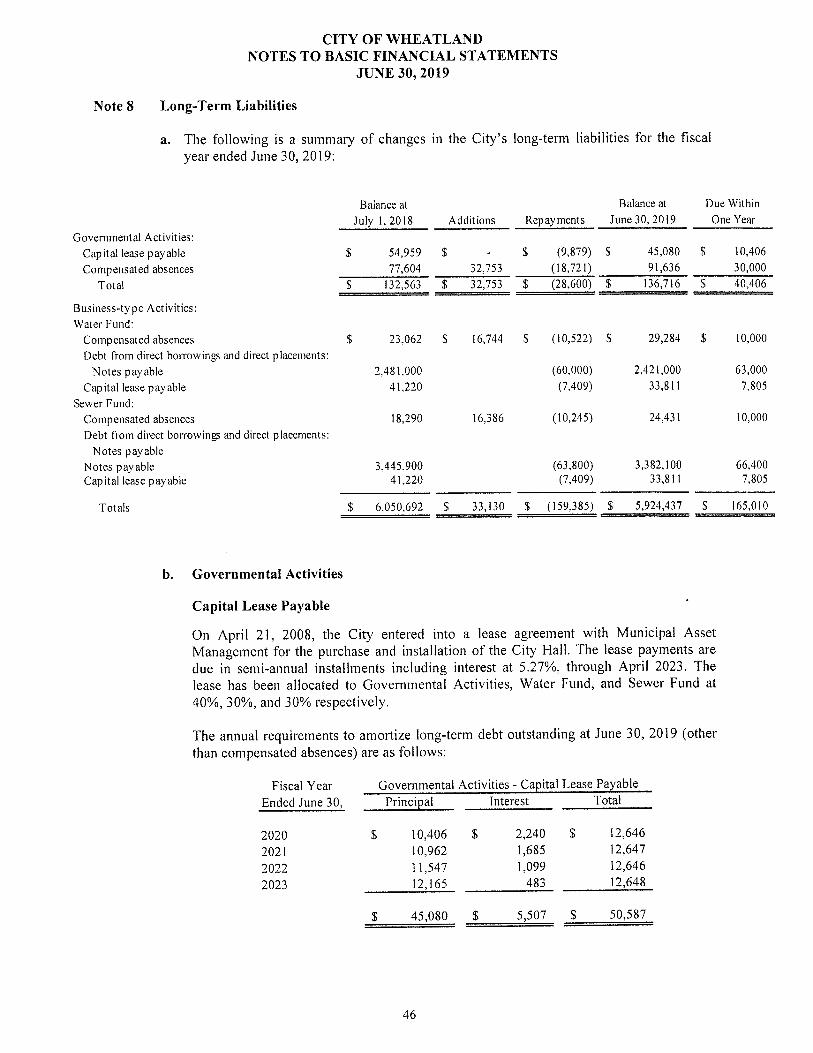
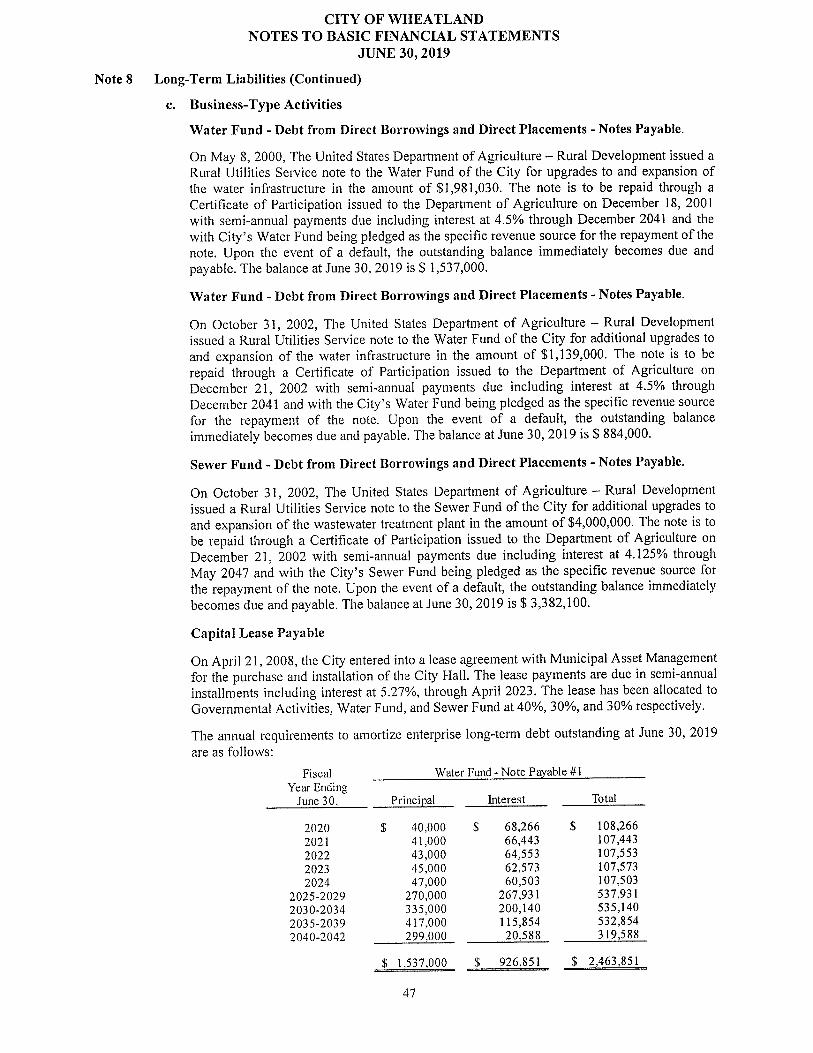
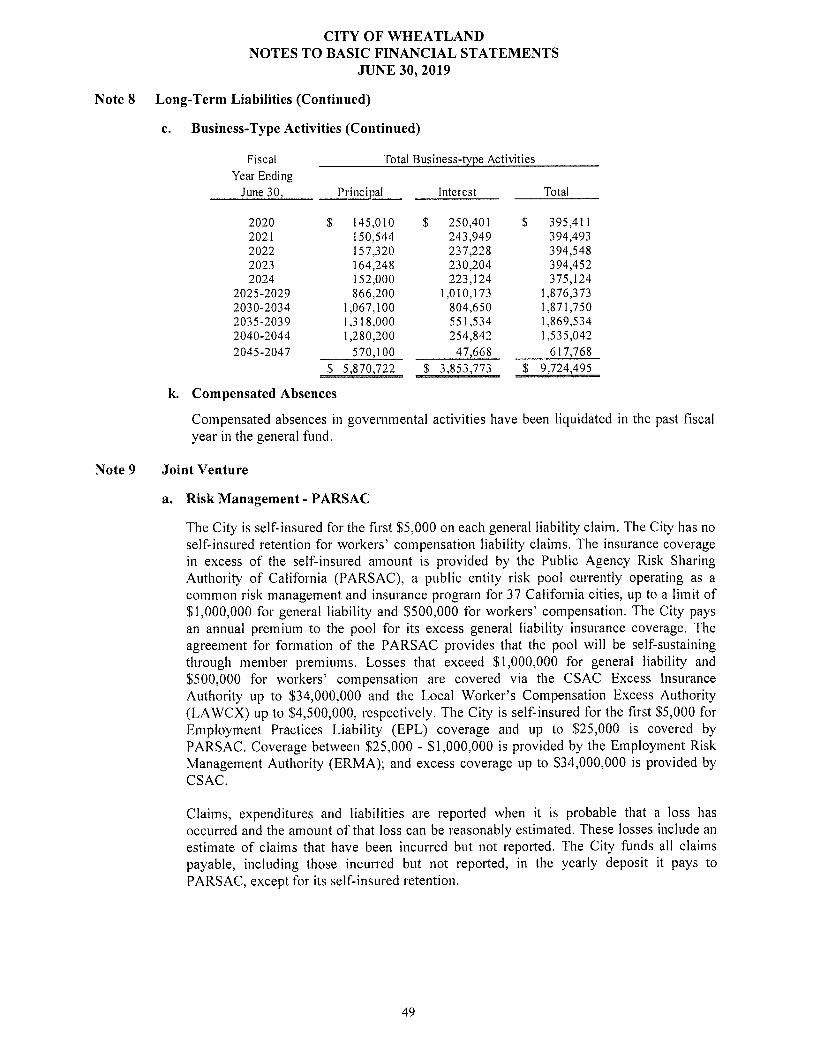
Long-term Debt At fiscal year-end, the City had $6,061,153 in loans and leases payable, and compensated absences outstanding compared to $6,183,255 at June 30, 2018. Governmental activities long-term debt increased $4,153 due to a decrease in capital lease obligations offset by an increase in compensated absences. Business-type activities long-term debt decreased $126,255 due to principal payment on the amount owed for Water and Wastewater USDA loans offset by an increase in compensated absences.
14
2019 2018 2019 2018 2019 2018
Compensated Absences 91,636$ 77,604$ 53,715$ 41,352$ 145,351$ 118,956$
US Department of Agriculture:
Loan #1 ‐ ‐ 1,537,000 1,575,000 1,537,000 1,575,000
Loan #3 ‐ ‐ 884,000 906,000 884,000 906,000
Wastewater Loan ‐ ‐ 3,382,100 3,445,900 3,382,100 3,445,900
Obligations under capital lease 45,080 54,959 67,622 82,440 112,702 137,399
TOTAL 136,716$ 132,563$ 5,924,437$ 6,050,692$ 6,061,153$ 6,183,255$
OUTSTANDING DEBT
AS OF JUNE 30,
Governmental Activities Business‐type Activities TOTALS
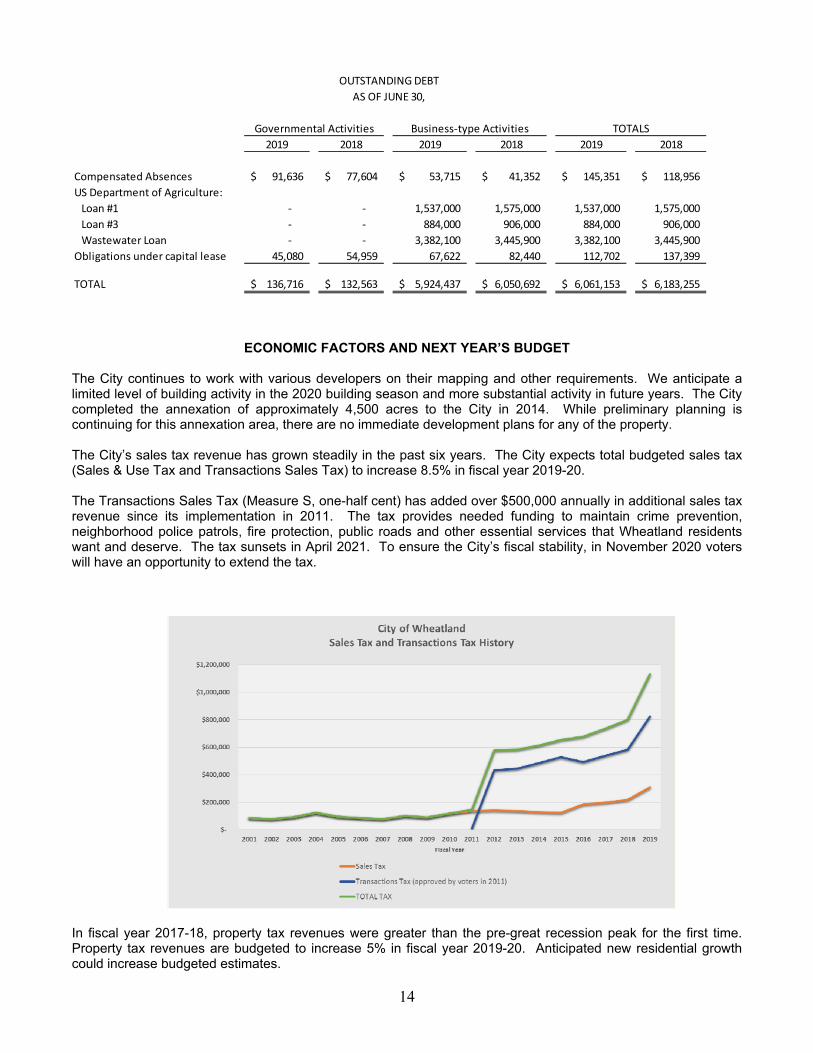
ECONOMIC FACTORS AND NEXT YEAR’S BUDGET The City continues to work with various developers on their mapping and other requirements. We anticipate a limited level of building activity in the 2020 building season and more substantial activity in future years. The City completed the annexation of approximately 4,500 acres to the City in 2014. While preliminary planning is continuing for this annexation area, there are no immediate development plans for any of the property. The City’s sales tax revenue has grown steadily in the past six years. The City expects total budgeted sales tax (Sales & Use Tax and Transactions Sales Tax) to increase 8.5% in fiscal year 2019-20. The Transactions Sales Tax (Measure S, one-half cent) has added over $500,000 annually in additional sales tax revenue since its implementation in 2011. The tax provides needed funding to maintain crime prevention, neighborhood police patrols, fire protection, public roads and other essential services that Wheatland residents want and deserve. The tax sunsets in April 2021. To ensure the City’s fiscal stability, in November 2020 voters will have an opportunity to extend the tax.
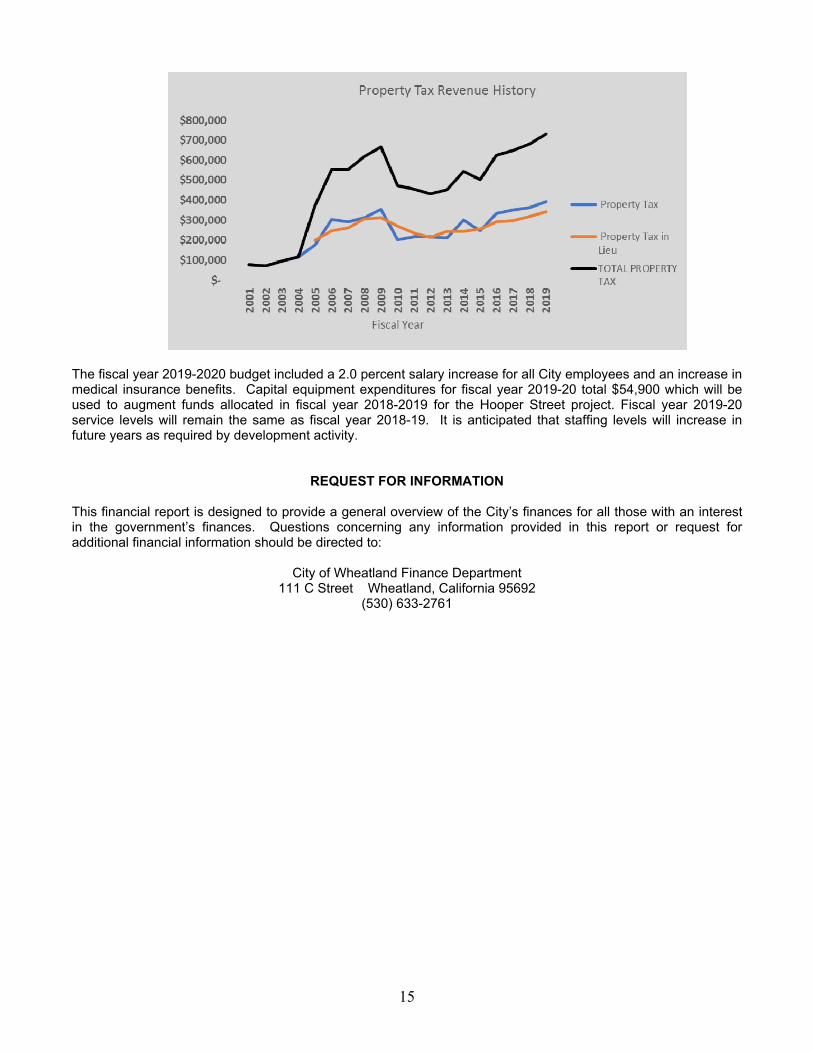
In fiscal year 2017-18, property tax revenues were greater than the pre-great recession peak for the first time. Property tax revenues are budgeted to increase 5% in fiscal year 2019-20. Anticipated new residential growth could increase budgeted estimates.
15
The fiscal year 2019-2020 budget included a 2.0 percent salary increase for all City employees and an increase in medical insurance benefits. Capital equipment expenditures for fiscal year 2019-20 total $54,900 which will be used to augment funds allocated in fiscal year 2018-2019 for the Hooper Street project. Fiscal year 2019-20 service levels will remain the same as fiscal year 2018-19. It is anticipated that staffing levels will increase in future years as required by development activity.
REQUEST FOR INFORMATION
This financial report is designed to provide a general overview of the City’s finances for all those with an interest in the government’s finances. Questions concerning any information provided in this report or request for additional financial information should be directed to:
City of Wheatland Finance Department 111 C Street Wheatland, California 95692
(530) 633-2761

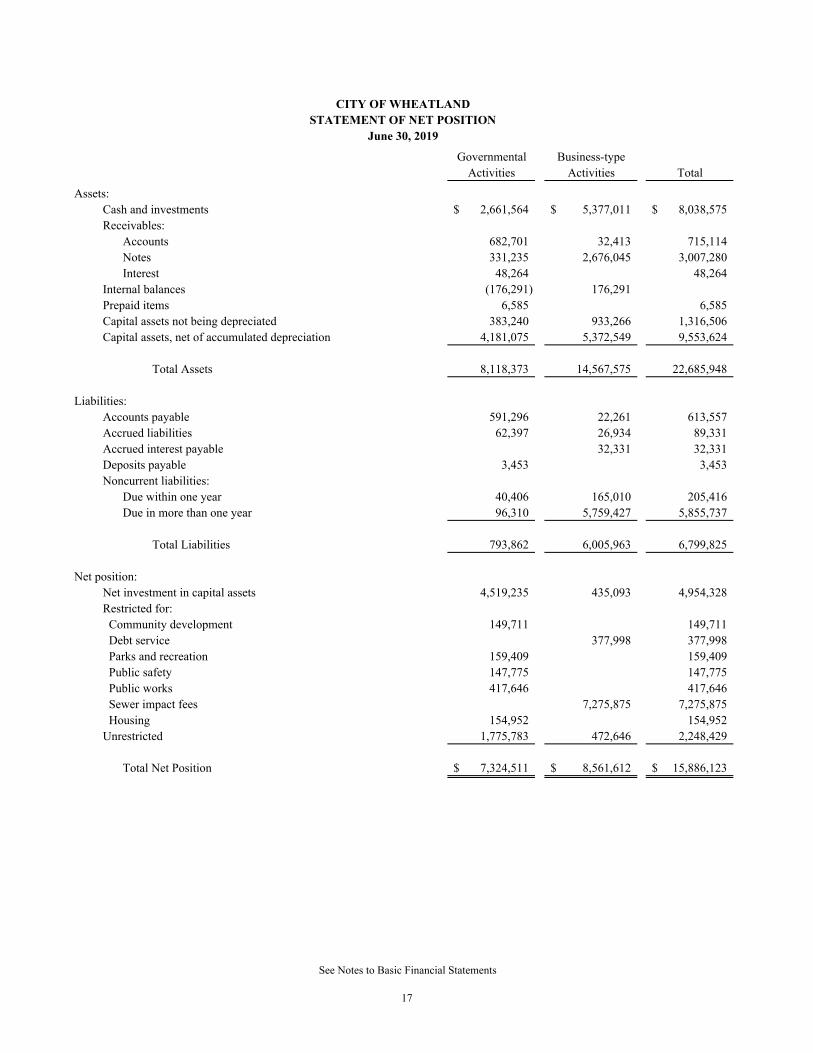
Governmental Business-typeActivities Activities Total
Assets:Cash and investments 2,661,564$ 5,377,011$ 8,038,575$ Receivables:
Accounts 682,701 32,413 715,114 Notes 331,235 2,676,045 3,007,280 Interest 48,264 48,264
Internal balances (176,291) 176,291 Prepaid items 6,585 6,585 Capital assets not being depreciated 383,240 933,266 1,316,506 Capital assets, net of accumulated depreciation 4,181,075 5,372,549 9,553,624
Total Assets 8,118,373 14,567,575 22,685,948
Liabilities:Accounts payable 591,296 22,261 613,557 Accrued liabilities 62,397 26,934 89,331 Accrued interest payable 32,331 32,331 Deposits payable 3,453 3,453 Noncurrent liabilities:
Due within one year 40,406 165,010 205,416 Due in more than one year 96,310 5,759,427 5,855,737
Total Liabilities 793,862 6,005,963 6,799,825
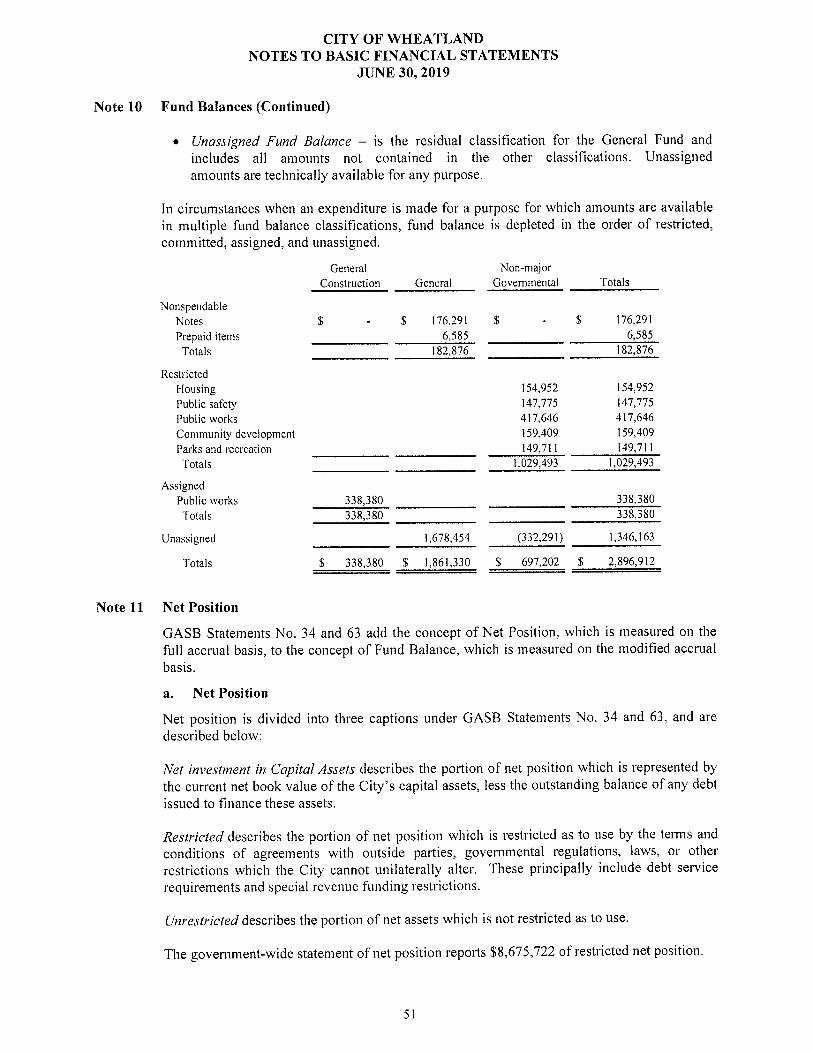
Net position:Net investment in capital assets 4,519,235 435,093 4,954,328 Restricted for: Community development 149,711 149,711 Debt service 377,998 377,998 Parks and recreation 159,409 159,409 Public safety 147,775 147,775 Public works 417,646 417,646 Sewer impact fees 7,275,875 7,275,875 Housing 154,952 154,952 Unrestricted 1,775,783 472,646 2,248,429
Total Net Position 7,324,511$ 8,561,612$ 15,886,123$
CITY OF WHEATLANDSTATEMENT OF NET POSITION
June 30, 2019
See Notes to Basic Financial Statements
17
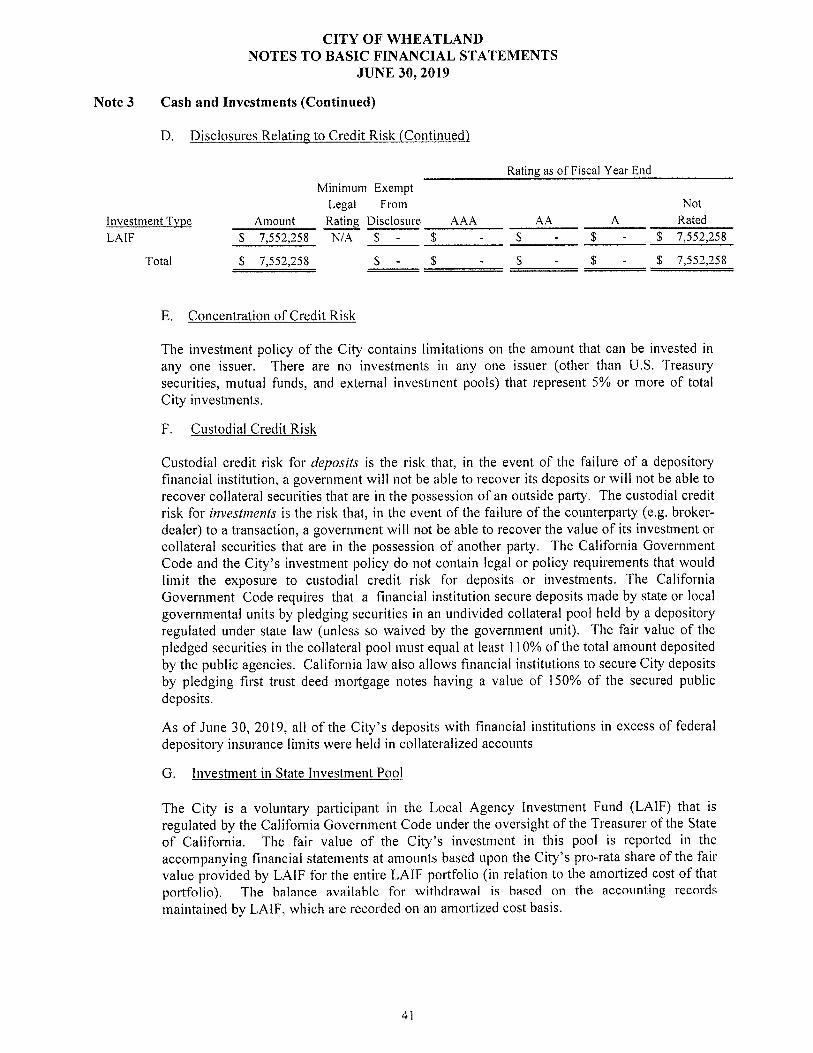
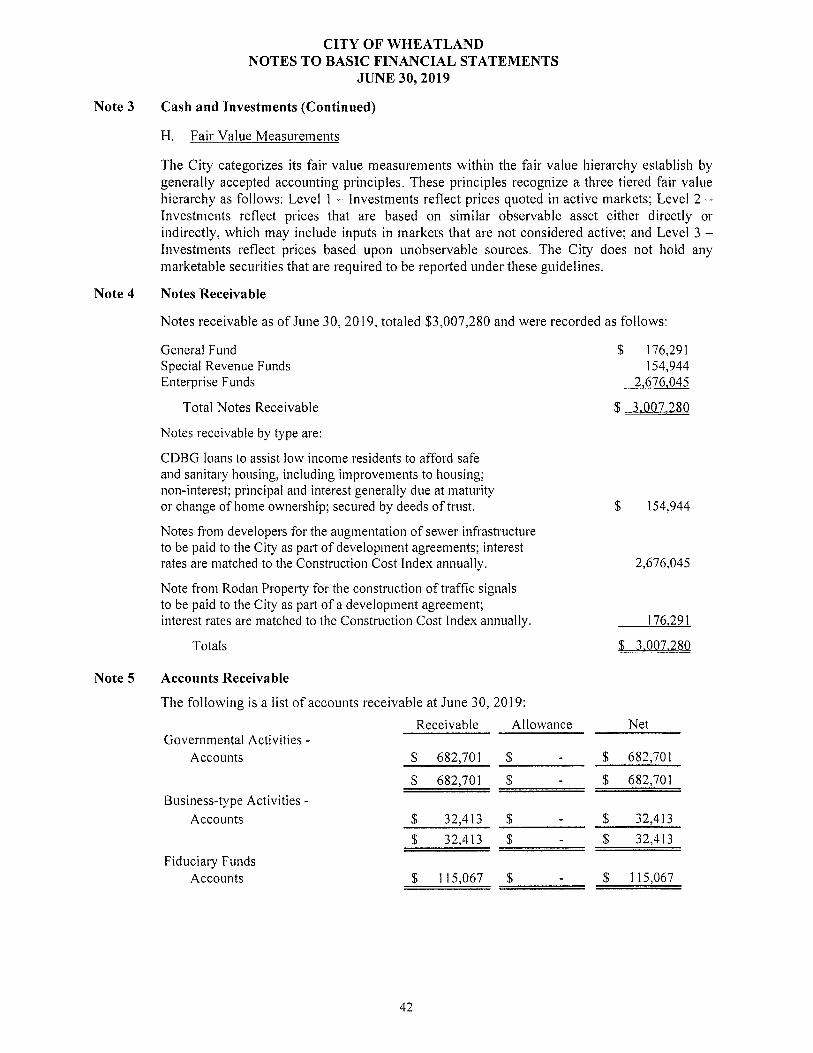
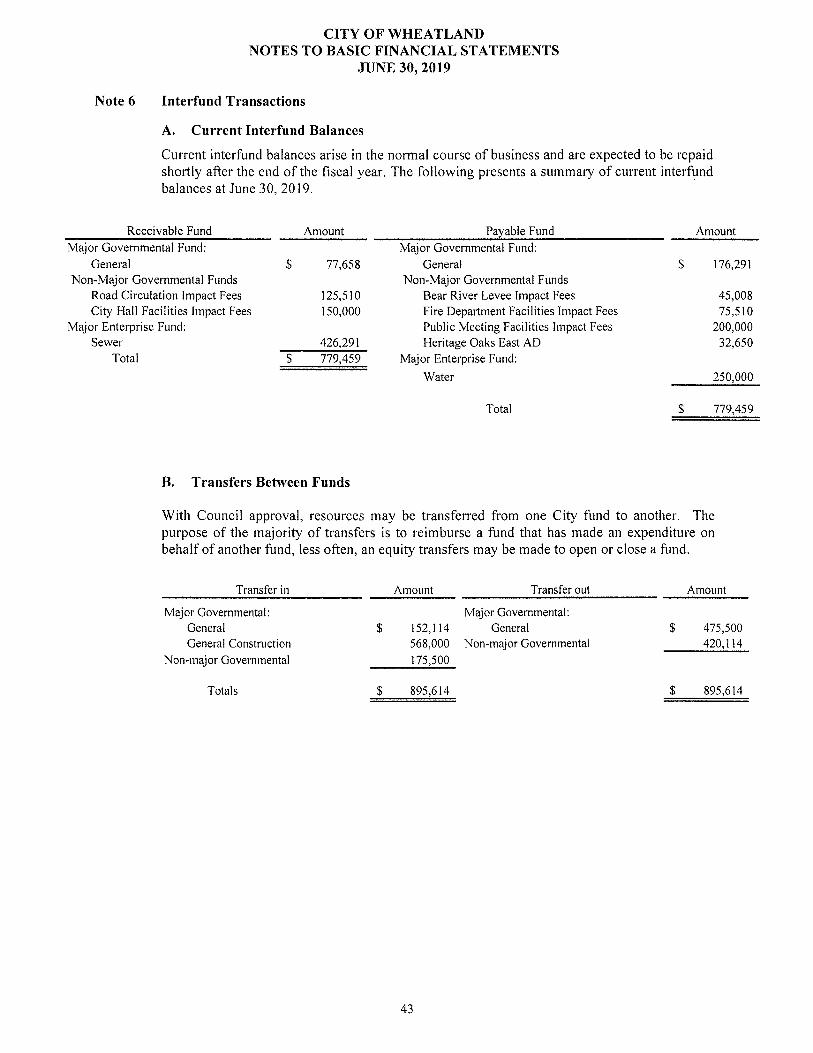

52
CITY OF WHEATLAND NOTES TO BASIC FINANCIAL STATEMENTS
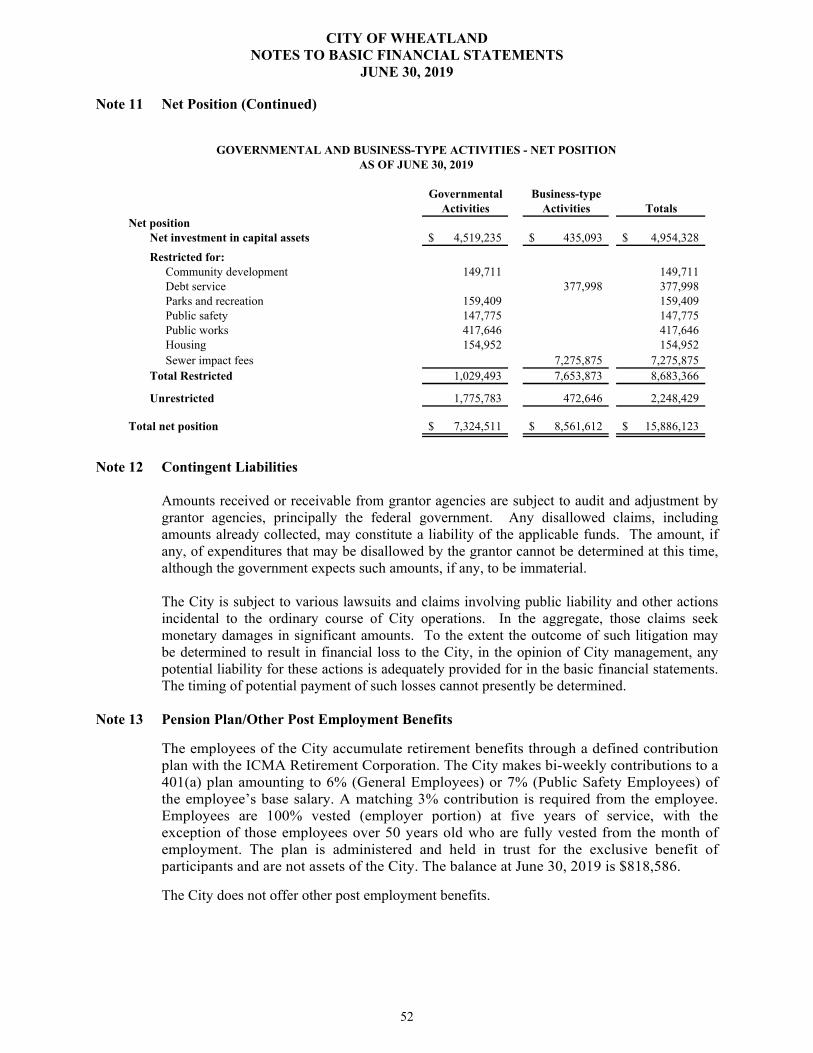
JUNE 30, 2019 Note 11 Net Position (Continued)
Governmental Business-typeActivities Activities Totals
Net positionNet investment in capital assets 4,519,235$ 435,093$ 4,954,328$
Restricted for:Community development 149,711 149,711 Debt service 377,998 377,998 Parks and recreation 159,409 159,409 Public safety 147,775 147,775 Public works 417,646 417,646 Housing 154,952 154,952 Sewer impact fees 7,275,875 7,275,875
Total Restricted 1,029,493 7,653,873 8,683,366
Unrestricted 1,775,783 472,646 2,248,429
Total net position 7,324,511$ 8,561,612$ 15,886,123$
GOVERNMENTAL AND BUSINESS-TYPE ACTIVITIES - NET POSITIONAS OF JUNE 30, 2019
Note 12 Contingent Liabilities Amounts received or receivable from grantor agencies are subject to audit and adjustment by
grantor agencies, principally the federal government. Any disallowed claims, including amounts already collected, may constitute a liability of the applicable funds. The amount, if any, of expenditures that may be disallowed by the grantor cannot be determined at this time, although the government expects such amounts, if any, to be immaterial.
The City is subject to various lawsuits and claims involving public liability and other actions
incidental to the ordinary course of City operations. In the aggregate, those claims seek monetary damages in significant amounts. To the extent the outcome of such litigation may be determined to result in financial loss to the City, in the opinion of City management, any potential liability for these actions is adequately provided for in the basic financial statements. The timing of potential payment of such losses cannot presently be determined.
Note 13 Pension Plan/Other Post Employment Benefits
The employees of the City accumulate retirement benefits through a defined contribution plan with the ICMA Retirement Corporation. The City makes bi-weekly contributions to a 401(a) plan amounting to 6% (General Employees) or 7% (Public Safety Employees) of the employee’s base salary. A matching 3% contribution is required from the employee. Employees are 100% vested (employer portion) at five years of service, with the exception of those employees over 50 years old who are fully vested from the month of employment. The plan is administered and held in trust for the exclusive benefit of participants and are not assets of the City. The balance at June 30, 2019 is $818,586.
The City does not offer other post employment benefits.


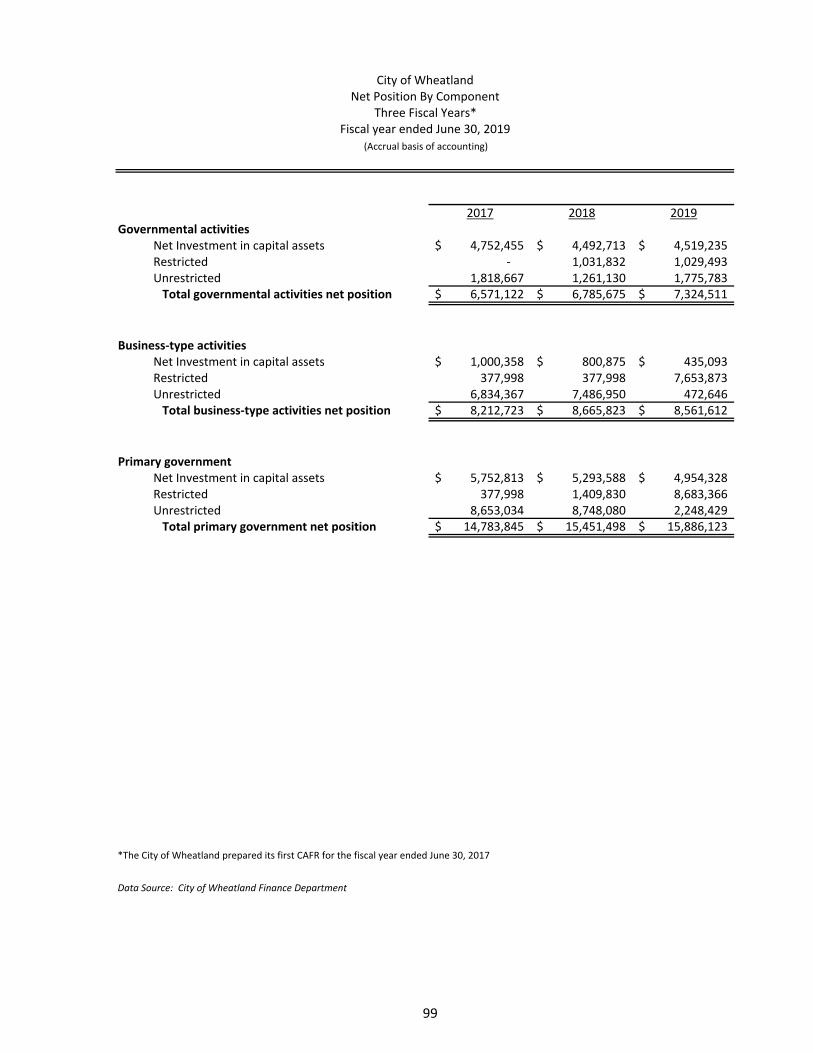
2017 2018 2019Governmental activities
Net Investment in capital assets 4,752,455$ 4,492,713$ 4,519,235$ Restricted ‐ 1,031,832 1,029,493 Unrestricted 1,818,667 1,261,130 1,775,783 Total governmental activities net position 6,571,122$ 6,785,675$ 7,324,511$
Business‐type activitiesNet Investment in capital assets 1,000,358$ 800,875$ 435,093$ Restricted 377,998 377,998 7,653,873 Unrestricted 6,834,367 7,486,950 472,646 Total business‐type activities net position 8,212,723$ 8,665,823$ 8,561,612$
Primary governmentNet Investment in capital assets 5,752,813$ 5,293,588$ 4,954,328$ Restricted 377,998 1,409,830 8,683,366 Unrestricted 8,653,034 8,748,080 2,248,429 Total primary government net position 14,783,845$ 15,451,498$ 15,886,123$
*The City of Wheatland prepared its first CAFR for the fiscal year ended June 30, 2017
Data Source: City of Wheatland Finance Department
City of WheatlandNet Position By Component
Three Fiscal Years*Fiscal year ended June 30, 2019
(Accrual basis of accounting)
99
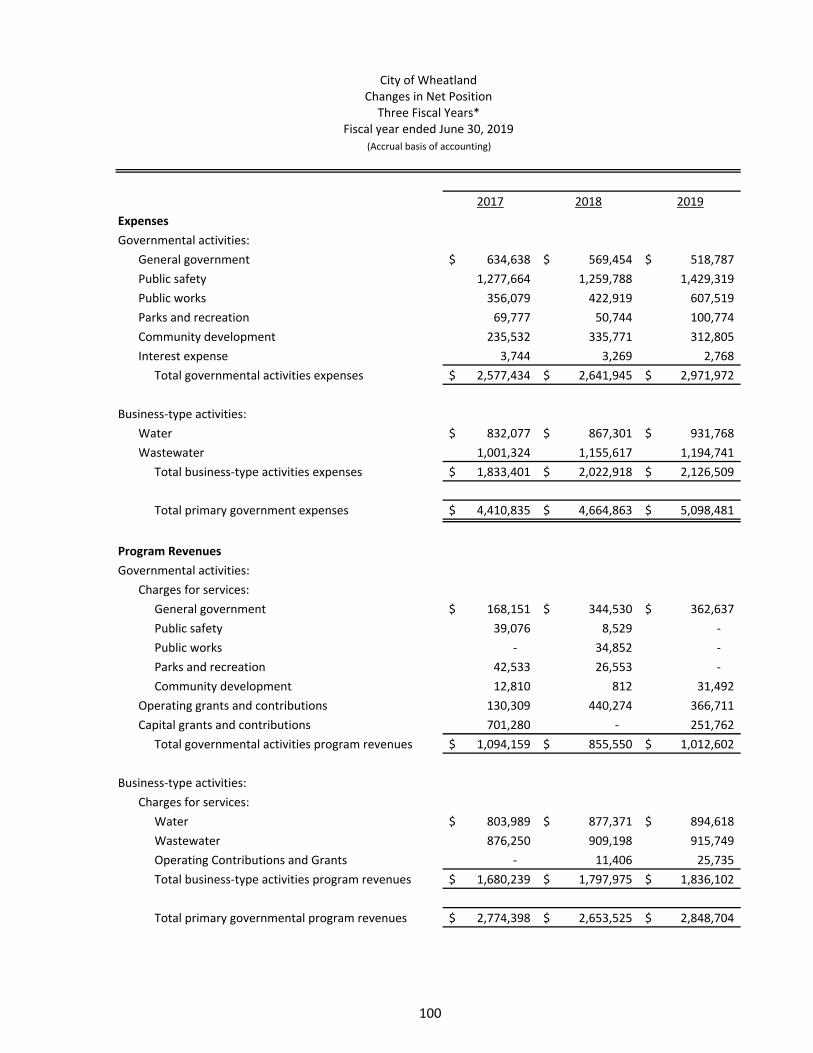
2017 2018 2019
Expenses
Governmental activities:
General government 634,638$ 569,454$ 518,787$
Public safety 1,277,664 1,259,788 1,429,319
Public works 356,079 422,919 607,519
Parks and recreation 69,777 50,744 100,774
Community development 235,532 335,771 312,805
Interest expense 3,744 3,269 2,768
Total governmental activities expenses 2,577,434$ 2,641,945$ 2,971,972$
Business‐type activities:
Water 832,077$ 867,301$ 931,768$
Wastewater 1,001,324 1,155,617 1,194,741
Total business‐type activities expenses 1,833,401$ 2,022,918$ 2,126,509$
Total primary government expenses 4,410,835$ 4,664,863$ 5,098,481$
Program Revenues
Governmental activities:
Charges for services:
General government 168,151$ 344,530$ 362,637$
Public safety 39,076 8,529 ‐
Public works ‐ 34,852 ‐
Parks and recreation 42,533 26,553 ‐
Community development 12,810 812 31,492
Operating grants and contributions 130,309 440,274 366,711
Capital grants and contributions 701,280 ‐ 251,762
Total governmental activities program revenues 1,094,159$ 855,550$ 1,012,602$
Business‐type activities:
Charges for services:
Water 803,989$ 877,371$ 894,618$
Wastewater 876,250 909,198 915,749
Operating Contributions and Grants ‐ 11,406 25,735
Total business‐type activities program revenues 1,680,239$ 1,797,975$ 1,836,102$
Total primary governmental program revenues 2,774,398$ 2,653,525$ 2,848,704$
City of WheatlandChanges in Net Position
Fiscal year ended June 30, 2019
(Accrual basis of accounting)
Three Fiscal Years*
100
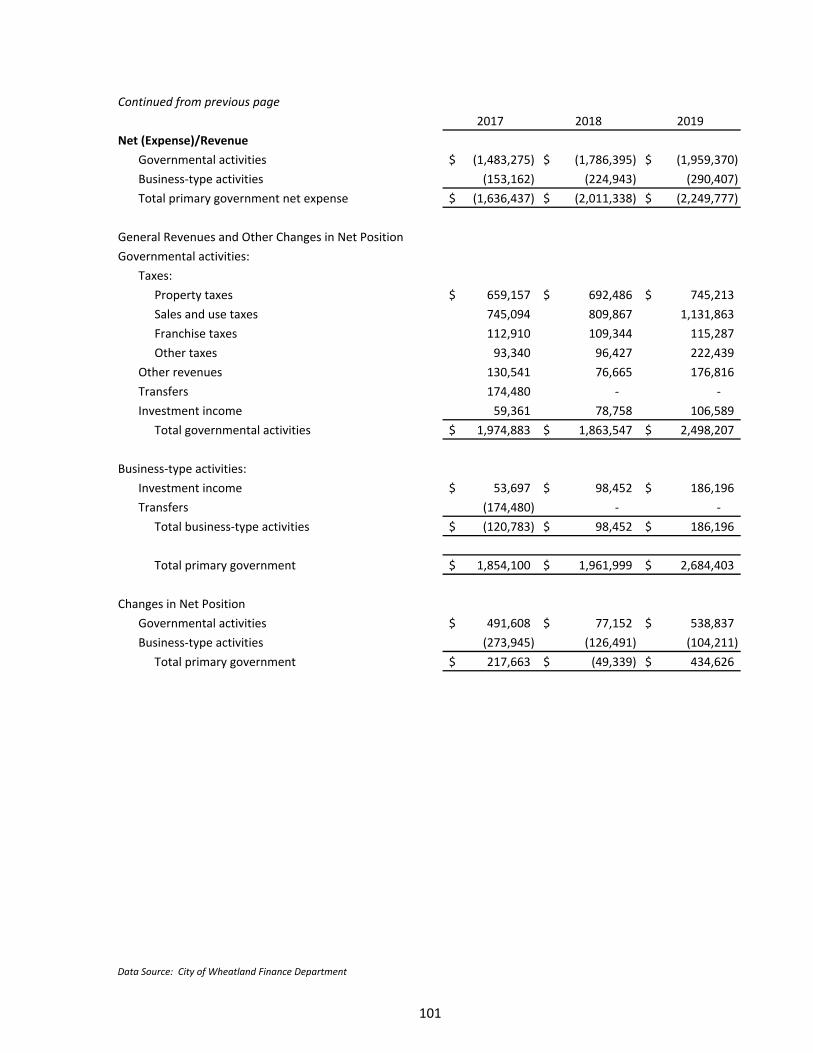
Continued from previous page
2017 2018 2019
Net (Expense)/Revenue
Governmental activities (1,483,275)$ (1,786,395)$ (1,959,370)$
Business‐type activities (153,162) (224,943) (290,407)
Total primary government net expense (1,636,437)$ (2,011,338)$ (2,249,777)$
General Revenues and Other Changes in Net Position
Governmental activities:
Taxes:
Property taxes 659,157$ 692,486$ 745,213$
Sales and use taxes 745,094 809,867 1,131,863
Franchise taxes 112,910 109,344 115,287
Other taxes 93,340 96,427 222,439
Other revenues 130,541 76,665 176,816
Transfers 174,480 ‐ ‐
Investment income 59,361 78,758 106,589
Total governmental activities 1,974,883$ 1,863,547$ 2,498,207$
Business‐type activities:
Investment income 53,697$ 98,452$ 186,196$
Transfers (174,480) ‐ ‐
Total business‐type activities (120,783)$ 98,452$ 186,196$
Total primary government 1,854,100$ 1,961,999$ 2,684,403$
Changes in Net Position
Governmental activities 491,608$ 77,152$ 538,837$
Business‐type activities (273,945) (126,491) (104,211)
Total primary government 217,663$ (49,339)$ 434,626$
Data Source: City of Wheatland Finance Department
101
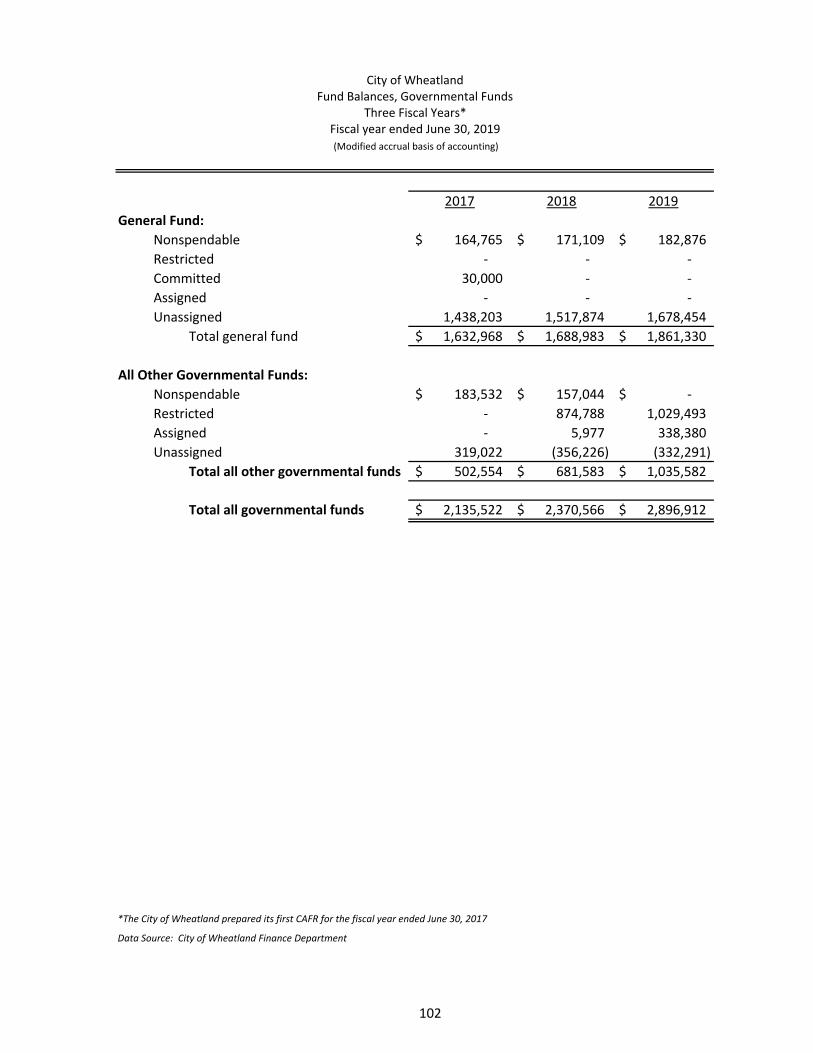
2017 2018 2019
General Fund:
Nonspendable 164,765$ 171,109$ 182,876$
Restricted ‐ ‐ ‐
Committed 30,000 ‐ ‐
Assigned ‐ ‐ ‐
Unassigned 1,438,203 1,517,874 1,678,454
Total general fund 1,632,968$ 1,688,983$ 1,861,330$
All Other Governmental Funds:
Nonspendable 183,532$ 157,044$ ‐$
Restricted ‐ 874,788 1,029,493
Assigned ‐ 5,977 338,380
Unassigned 319,022 (356,226) (332,291)
Total all other governmental funds 502,554$ 681,583$ 1,035,582$
Total all governmental funds 2,135,522$ 2,370,566$ 2,896,912$
*The City of Wheatland prepared its first CAFR for the fiscal year ended June 30, 2017
Data Source: City of Wheatland Finance Department
City of WheatlandFund Balances, Governmental Funds
Three Fiscal Years*Fiscal year ended June 30, 2019
(Modified accrual basis of accounting)
102
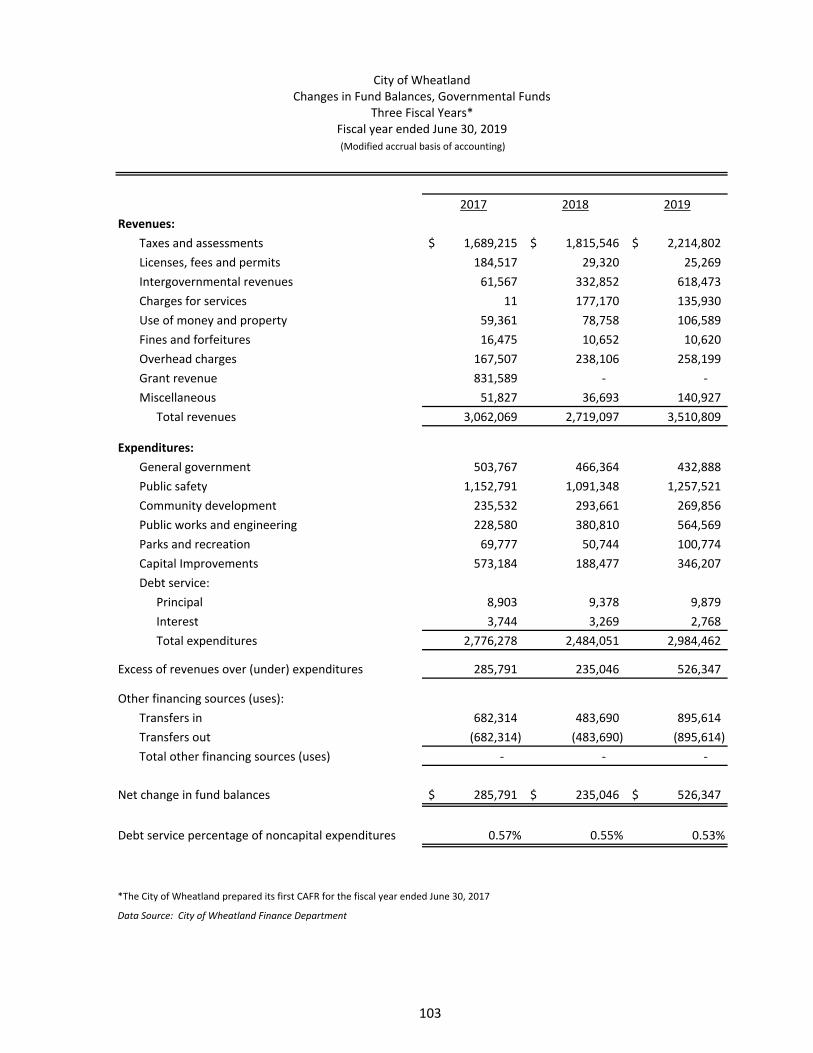
2017 2018 2019
Revenues:
Taxes and assessments 1,689,215$ 1,815,546$ 2,214,802$
Licenses, fees and permits 184,517 29,320 25,269
Intergovernmental revenues 61,567 332,852 618,473
Charges for services 11 177,170 135,930
Use of money and property 59,361 78,758 106,589
Fines and forfeitures 16,475 10,652 10,620
Overhead charges 167,507 238,106 258,199
Grant revenue 831,589 ‐ ‐
Miscellaneous 51,827 36,693 140,927
Total revenues 3,062,069 2,719,097 3,510,809
Expenditures:
General government 503,767 466,364 432,888
Public safety 1,152,791 1,091,348 1,257,521
Community development 235,532 293,661 269,856
Public works and engineering 228,580 380,810 564,569
Parks and recreation 69,777 50,744 100,774
Capital Improvements 573,184 188,477 346,207
Debt service:
Principal 8,903 9,378 9,879
Interest 3,744 3,269 2,768
Total expenditures 2,776,278 2,484,051 2,984,462
Excess of revenues over (under) expenditures 285,791 235,046 526,347
Other financing sources (uses):
Transfers in 682,314 483,690 895,614
Transfers out (682,314) (483,690) (895,614)
Total other financing sources (uses) ‐ ‐ ‐
Net change in fund balances 285,791$ 235,046$ 526,347$
Debt service percentage of noncapital expenditures 0.57% 0.55% 0.53%
*The City of Wheatland prepared its first CAFR for the fiscal year ended June 30, 2017
Data Source: City of Wheatland Finance Department
City of WheatlandChanges in Fund Balances, Governmental Funds
Three Fiscal Years*Fiscal year ended June 30, 2019
(Modified accrual basis of accounting)
103
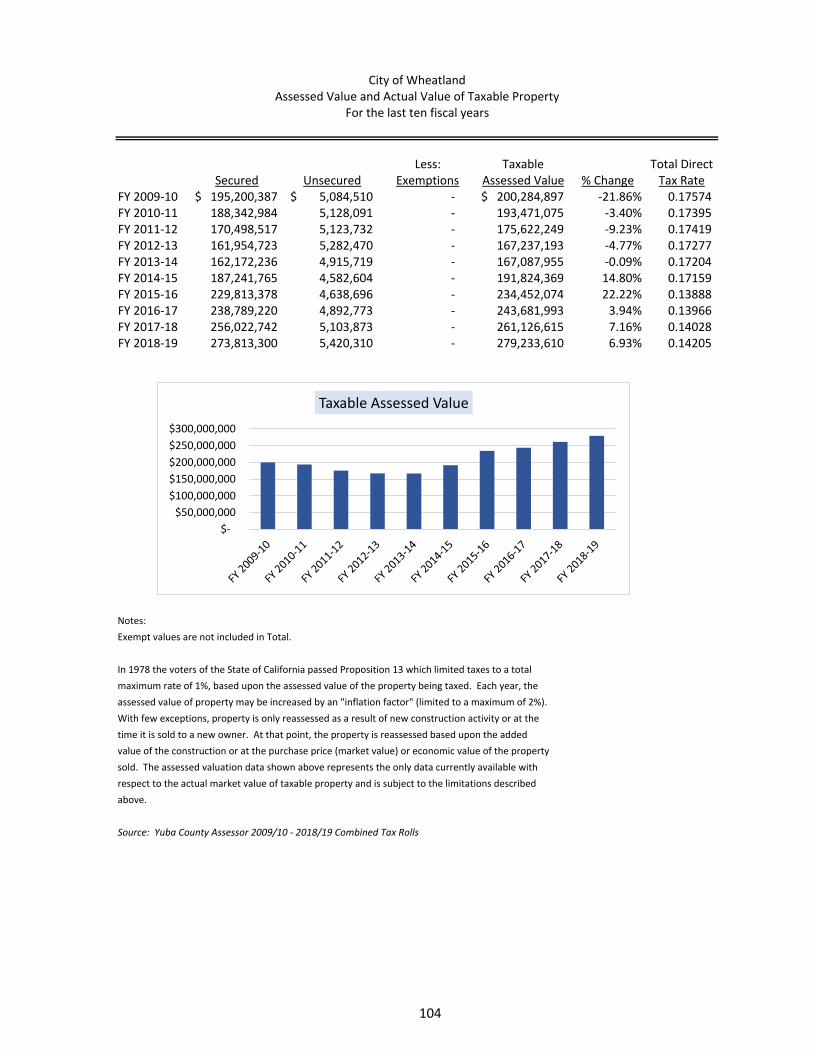
Less: Taxable Total DirectSecured Unsecured Exemptions Assessed Value % Change Tax Rate
FY 2009‐10 195,200,387$ 5,084,510$ ‐ 200,284,897$ ‐21.86% 0.17574 FY 2010‐11 188,342,984 5,128,091 ‐ 193,471,075 ‐3.40% 0.17395 FY 2011‐12 170,498,517 5,123,732 ‐ 175,622,249 ‐9.23% 0.17419 FY 2012‐13 161,954,723 5,282,470 ‐ 167,237,193 ‐4.77% 0.17277 FY 2013‐14 162,172,236 4,915,719 ‐ 167,087,955 ‐0.09% 0.17204 FY 2014‐15 187,241,765 4,582,604 ‐ 191,824,369 14.80% 0.17159 FY 2015‐16 229,813,378 4,638,696 ‐ 234,452,074 22.22% 0.13888 FY 2016‐17 238,789,220 4,892,773 ‐ 243,681,993 3.94% 0.13966 FY 2017‐18 256,022,742 5,103,873 ‐ 261,126,615 7.16% 0.14028 FY 2018‐19 273,813,300 5,420,310 ‐ 279,233,610 6.93% 0.14205
Notes:
Exempt values are not included in Total.
In 1978 the voters of the State of California passed Proposition 13 which limited taxes to a total
maximum rate of 1%, based upon the assessed value of the property being taxed. Each year, the
assessed value of property may be increased by an "inflation factor" (limited to a maximum of 2%).
With few exceptions, property is only reassessed as a result of new construction activity or at the
time it is sold to a new owner. At that point, the property is reassessed based upon the added
value of the construction or at the purchase price (market value) or economic value of the property
sold. The assessed valuation data shown above represents the only data currently available with
respect to the actual market value of taxable property and is subject to the limitations described
above.
Source: Yuba County Assessor 2009/10 ‐ 2018/19 Combined Tax Rolls
City of WheatlandAssessed Value and Actual Value of Taxable Property
For the last ten fiscal years
$‐
$50,000,000
$100,000,000
$150,000,000
$200,000,000
$250,000,000
$300,000,000
Taxable Assessed Value
104
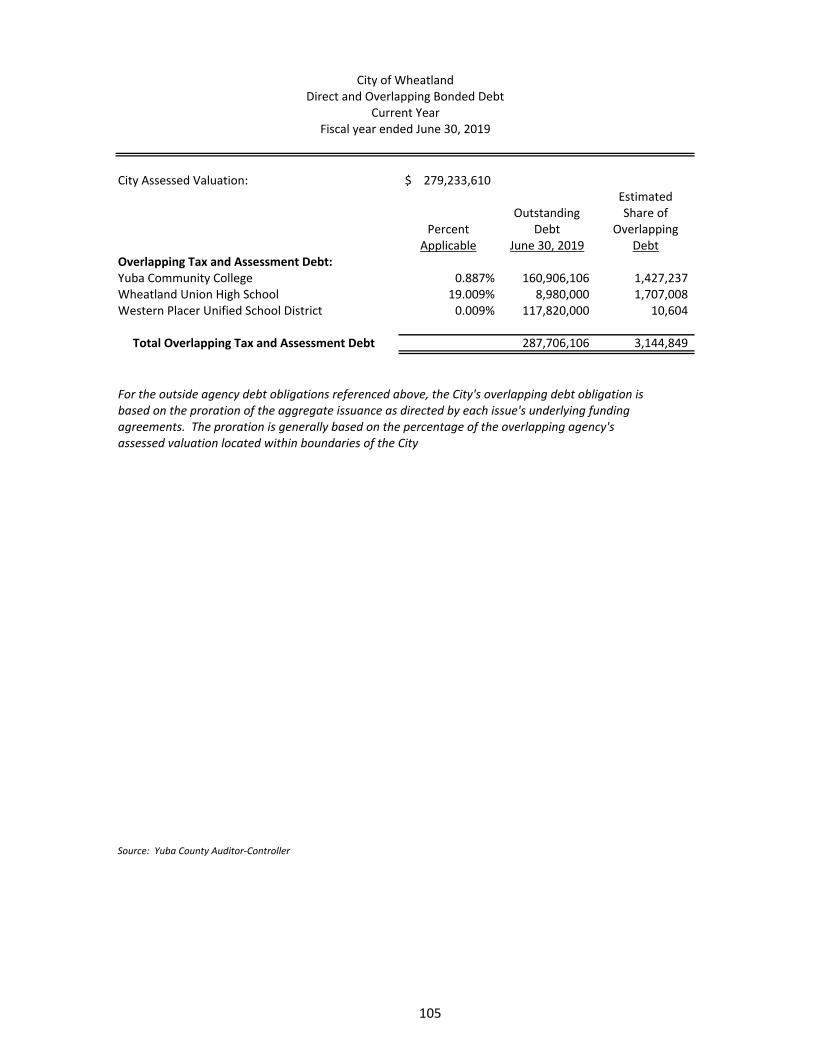
City Assessed Valuation: 279,233,610$ Estimated
Outstanding Share ofPercent Debt Overlapping
Applicable June 30, 2019 DebtOverlapping Tax and Assessment Debt:Yuba Community College 0.887% 160,906,106 1,427,237 Wheatland Union High School 19.009% 8,980,000 1,707,008 Western Placer Unified School District 0.009% 117,820,000 10,604
Total Overlapping Tax and Assessment Debt 287,706,106 3,144,849
For the outside agency debt obligations referenced above, the City's overlapping debt obligation is based on the proration of the aggregate issuance as directed by each issue's underlying fundingagreements. The proration is generally based on the percentage of the overlapping agency'sassessed valuation located within boundaries of the City
Source: Yuba County Auditor‐Controller
City of WheatlandDirect and Overlapping Bonded Debt
Current YearFiscal year ended June 30, 2019
105
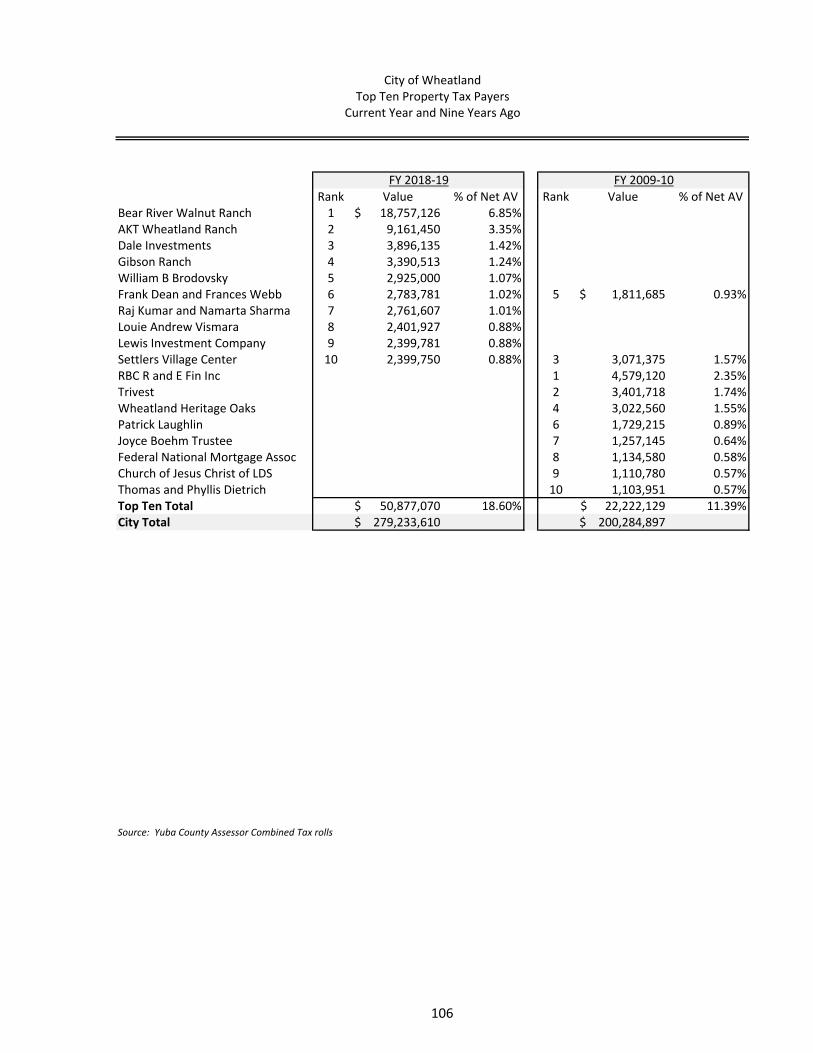
Rank Value % of Net AV Rank Value % of Net AVBear River Walnut Ranch 1 18,757,126$ 6.85%AKT Wheatland Ranch 2 9,161,450 3.35%Dale Investments 3 3,896,135 1.42%Gibson Ranch 4 3,390,513 1.24%William B Brodovsky 5 2,925,000 1.07%Frank Dean and Frances Webb 6 2,783,781 1.02% 5 1,811,685$ 0.93%Raj Kumar and Namarta Sharma 7 2,761,607 1.01%Louie Andrew Vismara 8 2,401,927 0.88%Lewis Investment Company 9 2,399,781 0.88%Settlers Village Center 10 2,399,750 0.88% 3 3,071,375 1.57%RBC R and E Fin Inc 1 4,579,120 2.35%Trivest 2 3,401,718 1.74%Wheatland Heritage Oaks 4 3,022,560 1.55%Patrick Laughlin 6 1,729,215 0.89%Joyce Boehm Trustee 7 1,257,145 0.64%Federal National Mortgage Assoc 8 1,134,580 0.58%Church of Jesus Christ of LDS 9 1,110,780 0.57%Thomas and Phyllis Dietrich 10 1,103,951 0.57%Top Ten Total 50,877,070$ 18.60% 22,222,129$ 11.39%City Total 279,233,610$ 200,284,897$
Source: Yuba County Assessor Combined Tax rolls
City of WheatlandTop Ten Property Tax Payers
Current Year and Nine Years Ago
FY 2009‐10FY 2018‐19
106
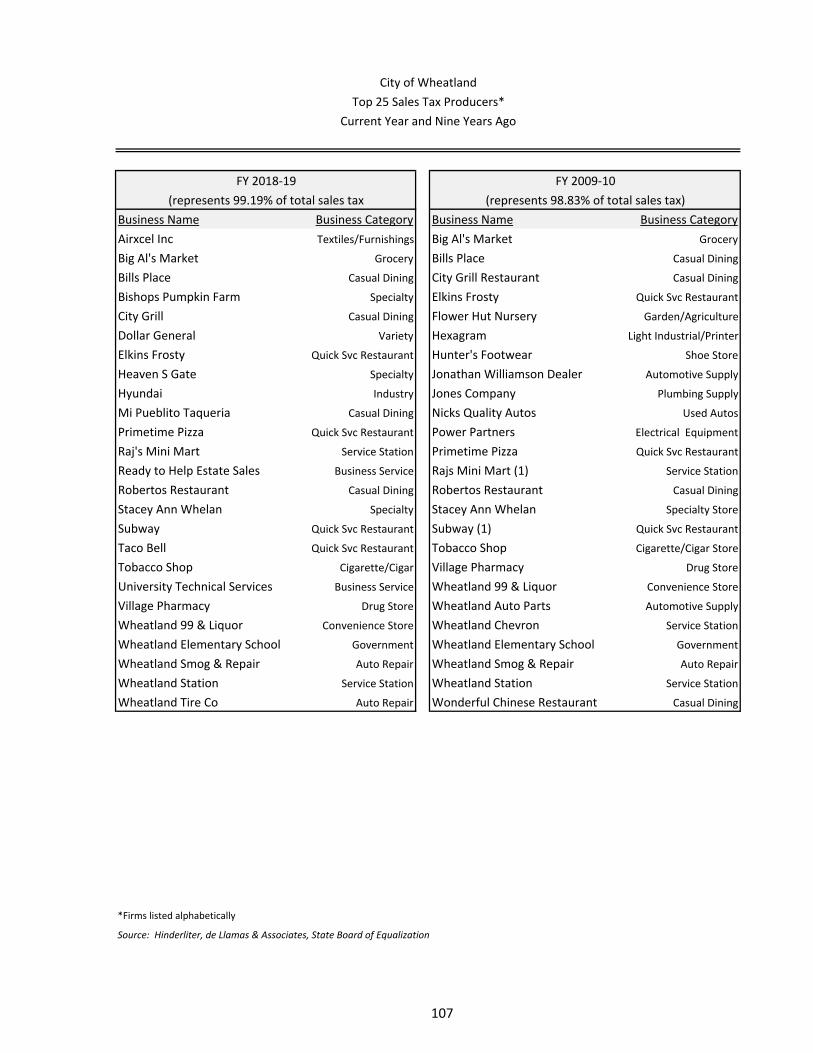
Business Name Business Category Business Name Business Category
Airxcel Inc Textiles/Furnishings Big Al's Market Grocery
Big Al's Market Grocery Bills Place Casual Dining
Bills Place Casual Dining City Grill Restaurant Casual Dining
Bishops Pumpkin Farm Specialty Elkins Frosty Quick Svc Restaurant
City Grill Casual Dining Flower Hut Nursery Garden/Agriculture
Dollar General Variety Hexagram Light Industrial/Printer
Elkins Frosty Quick Svc Restaurant Hunter's Footwear Shoe Store
Heaven S Gate Specialty Jonathan Williamson Dealer Automotive Supply
Hyundai Industry Jones Company Plumbing Supply
Mi Pueblito Taqueria Casual Dining Nicks Quality Autos Used Autos
Primetime Pizza Quick Svc Restaurant Power Partners Electrical Equipment
Raj's Mini Mart Service Station Primetime Pizza Quick Svc Restaurant
Ready to Help Estate Sales Business Service Rajs Mini Mart (1) Service Station
Robertos Restaurant Casual Dining Robertos Restaurant Casual Dining
Stacey Ann Whelan Specialty Stacey Ann Whelan Specialty Store
Subway Quick Svc Restaurant Subway (1) Quick Svc Restaurant
Taco Bell Quick Svc Restaurant Tobacco Shop Cigarette/Cigar Store
Tobacco Shop Cigarette/Cigar Village Pharmacy Drug Store
University Technical Services Business Service Wheatland 99 & Liquor Convenience Store
Village Pharmacy Drug Store Wheatland Auto Parts Automotive Supply
Wheatland 99 & Liquor Convenience Store Wheatland Chevron Service Station
Wheatland Elementary School Government Wheatland Elementary School Government
Wheatland Smog & Repair Auto Repair Wheatland Smog & Repair Auto Repair
Wheatland Station Service Station Wheatland Station Service Station
Wheatland Tire Co Auto Repair Wonderful Chinese Restaurant Casual Dining
*Firms listed alphabetically
Source: Hinderliter, de Llamas & Associates, State Board of Equalization
(represents 99.19% of total sales tax
FY 2009‐10
(represents 98.83% of total sales tax)
City of Wheatland
Top 25 Sales Tax Producers*
Current Year and Nine Years Ago
FY 2018‐19
107
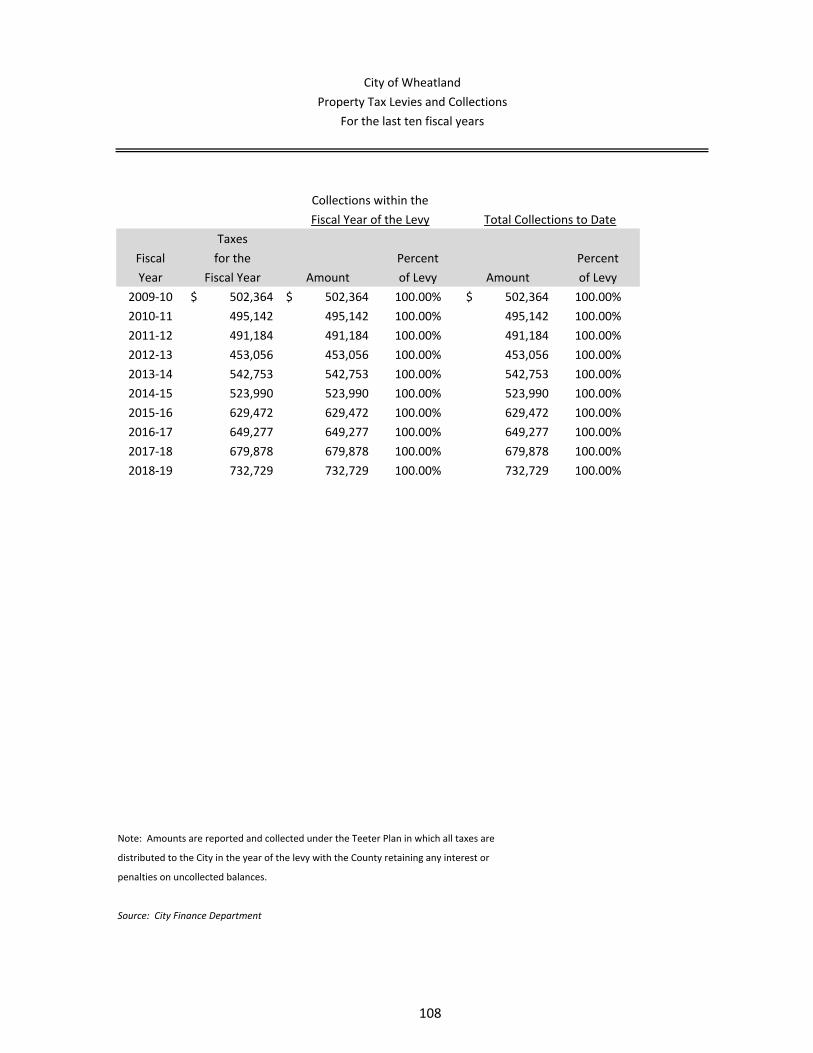
Taxes
Fiscal for the Percent Percent
Year Fiscal Year Amount of Levy Amount of Levy
2009‐10 502,364$ 502,364$ 100.00% 502,364$ 100.00%
2010‐11 495,142 495,142 100.00% 495,142 100.00%
2011‐12 491,184 491,184 100.00% 491,184 100.00%
2012‐13 453,056 453,056 100.00% 453,056 100.00%
2013‐14 542,753 542,753 100.00% 542,753 100.00%
2014‐15 523,990 523,990 100.00% 523,990 100.00%
2015‐16 629,472 629,472 100.00% 629,472 100.00%
2016‐17 649,277 649,277 100.00% 649,277 100.00%
2017‐18 679,878 679,878 100.00% 679,878 100.00%
2018‐19 732,729 732,729 100.00% 732,729 100.00%
Note: Amounts are reported and collected under the Teeter Plan in which all taxes are
distributed to the City in the year of the levy with the County retaining any interest or
penalties on uncollected balances.
Source: City Finance Department
Fiscal Year of the Levy Total Collections to Date
City of Wheatland
Property Tax Levies and Collections
For the last ten fiscal years
Collections within the
108
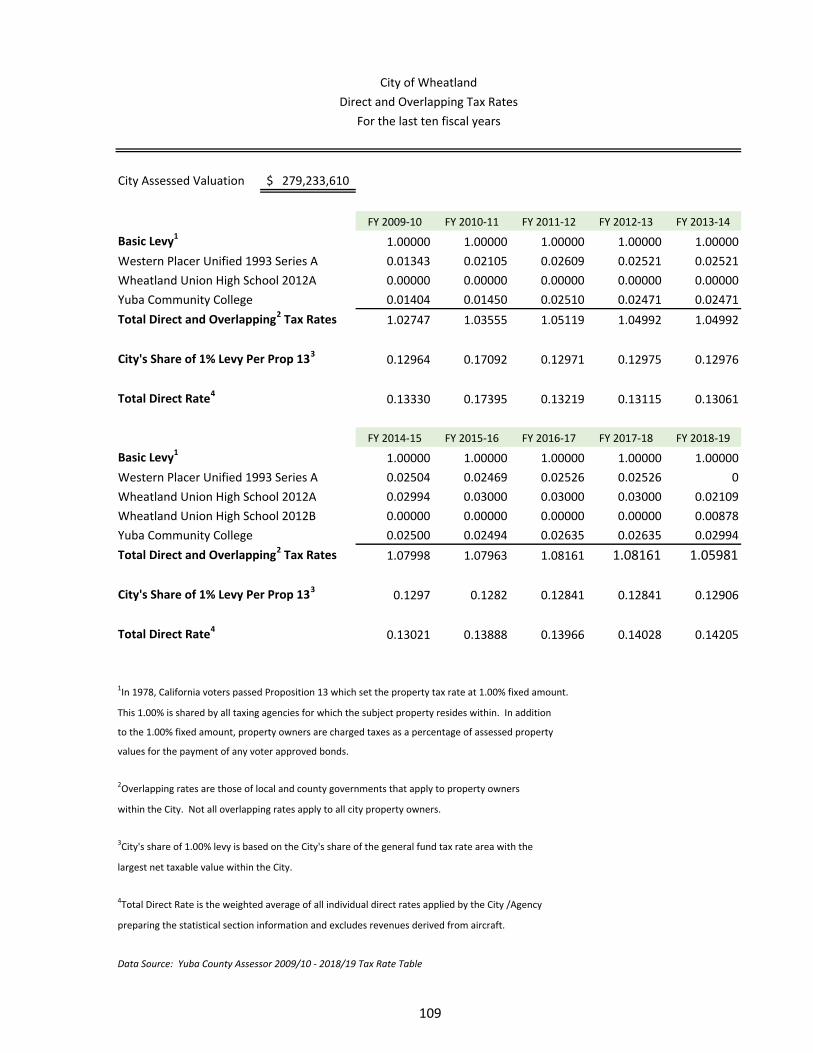
City Assessed Valuation 279,233,610$
FY 2009‐10 FY 2010‐11 FY 2011‐12 FY 2012‐13 FY 2013‐14
Basic Levy1 1.00000 1.00000 1.00000 1.00000 1.00000
Western Placer Unified 1993 Series A 0.01343 0.02105 0.02609 0.02521 0.02521
Wheatland Union High School 2012A 0.00000 0.00000 0.00000 0.00000 0.00000
Yuba Community College 0.01404 0.01450 0.02510 0.02471 0.02471
Total Direct and Overlapping2 Tax Rates 1.02747 1.03555 1.05119 1.04992 1.04992
City's Share of 1% Levy Per Prop 1330.12964 0.17092 0.12971 0.12975 0.12976
Total Direct Rate4 0.13330 0.17395 0.13219 0.13115 0.13061
FY 2014‐15 FY 2015‐16 FY 2016‐17 FY 2017‐18 FY 2018‐19
Basic Levy1 1.00000 1.00000 1.00000 1.00000 1.00000
Western Placer Unified 1993 Series A 0.02504 0.02469 0.02526 0.02526 0
Wheatland Union High School 2012A 0.02994 0.03000 0.03000 0.03000 0.02109
Wheatland Union High School 2012B 0.00000 0.00000 0.00000 0.00000 0.00878
Yuba Community College 0.02500 0.02494 0.02635 0.02635 0.02994
Total Direct and Overlapping2 Tax Rates 1.07998 1.07963 1.08161 1.08161 1.05981
City's Share of 1% Levy Per Prop 1330.1297 0.1282 0.12841 0.12841 0.12906
Total Direct Rate4 0.13021 0.13888 0.13966 0.14028 0.14205
1In 1978, California voters passed Proposition 13 which set the property tax rate at 1.00% fixed amount.
This 1.00% is shared by all taxing agencies for which the subject property resides within. In addition
to the 1.00% fixed amount, property owners are charged taxes as a percentage of assessed property
values for the payment of any voter approved bonds.
2Overlapping rates are those of local and county governments that apply to property owners
within the City. Not all overlapping rates apply to all city property owners.
3City's share of 1.00% levy is based on the City's share of the general fund tax rate area with the
largest net taxable value within the City.
4Total Direct Rate is the weighted average of all individual direct rates applied by the City /Agency
preparing the statistical section information and excludes revenues derived from aircraft.
Data Source: Yuba County Assessor 2009/10 ‐ 2018/19 Tax Rate Table
City of Wheatland
Direct and Overlapping Tax Rates
For the last ten fiscal years
109
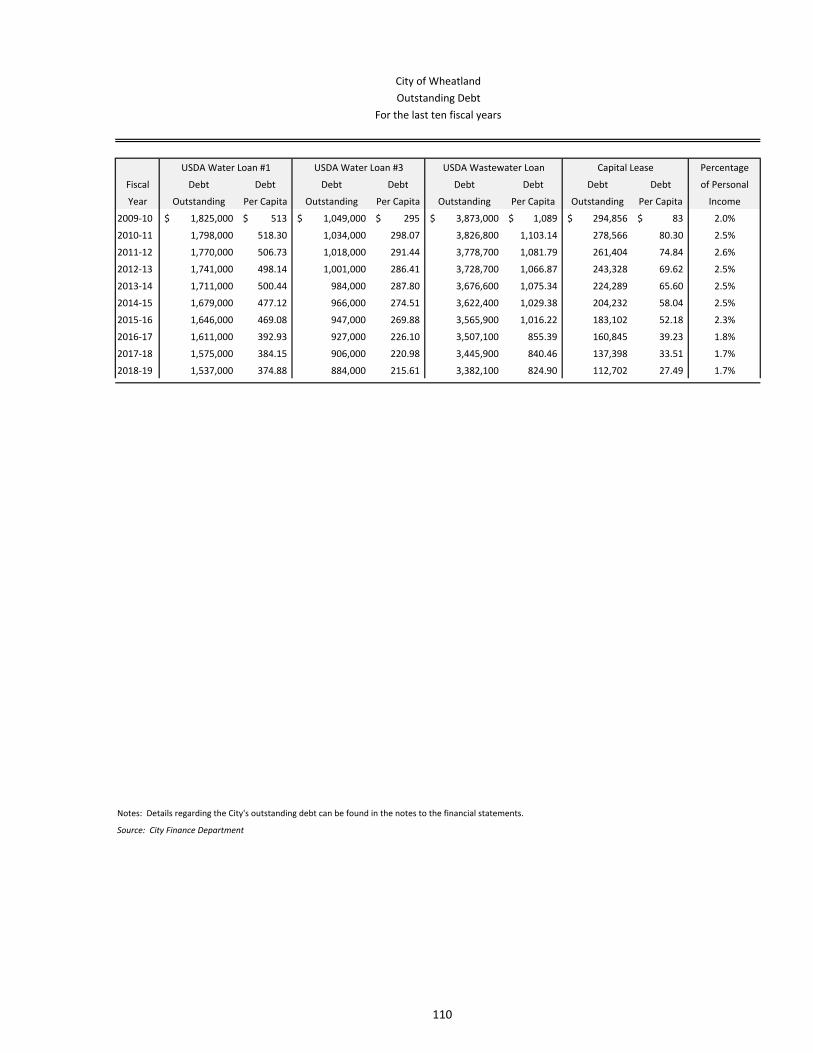
Percentage
Fiscal Debt Debt Debt Debt Debt Debt Debt Debt of Personal
Year Outstanding Per Capita Outstanding Per Capita Outstanding Per Capita Outstanding Per Capita Income
2009‐10 1,825,000$ 513$ 1,049,000$ 295$ 3,873,000$ 1,089$ 294,856$ 83$ 2.0%
2010‐11 1,798,000 518.30 1,034,000 298.07 3,826,800 1,103.14 278,566 80.30 2.5%
2011‐12 1,770,000 506.73 1,018,000 291.44 3,778,700 1,081.79 261,404 74.84 2.6%
2012‐13 1,741,000 498.14 1,001,000 286.41 3,728,700 1,066.87 243,328 69.62 2.5%
2013‐14 1,711,000 500.44 984,000 287.80 3,676,600 1,075.34 224,289 65.60 2.5%
2014‐15 1,679,000 477.12 966,000 274.51 3,622,400 1,029.38 204,232 58.04 2.5%
2015‐16 1,646,000 469.08 947,000 269.88 3,565,900 1,016.22 183,102 52.18 2.3%
2016‐17 1,611,000 392.93 927,000 226.10 3,507,100 855.39 160,845 39.23 1.8%
2017‐18 1,575,000 384.15 906,000 220.98 3,445,900 840.46 137,398 33.51 1.7%
2018‐19 1,537,000 374.88 884,000 215.61 3,382,100 824.90 112,702 27.49 1.7%
Notes: Details regarding the City's outstanding debt can be found in the notes to the financial statements.
Source: City Finance Department
City of Wheatland
Outstanding Debt
For the last ten fiscal years
Capital LeaseUSDA Water Loan #1 USDA Water Loan #3 USDA Wastewater Loan
110
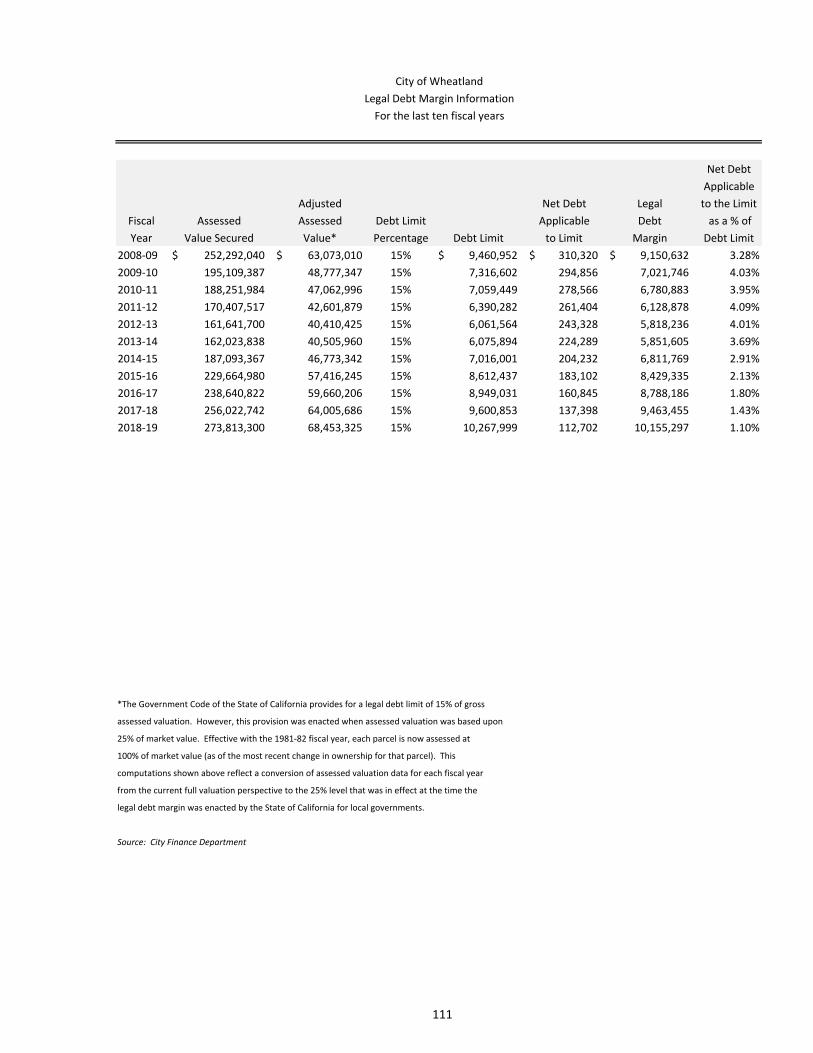
Net Debt
Applicable
Adjusted Net Debt Legal to the Limit
Fiscal Assessed Assessed Debt Limit Applicable Debt as a % of
Year Value Secured Value* Percentage Debt Limit to Limit Margin Debt Limit
2008‐09 252,292,040$ 63,073,010$ 15% 9,460,952$ 310,320$ 9,150,632$ 3.28%
2009‐10 195,109,387 48,777,347 15% 7,316,602 294,856 7,021,746 4.03%
2010‐11 188,251,984 47,062,996 15% 7,059,449 278,566 6,780,883 3.95%
2011‐12 170,407,517 42,601,879 15% 6,390,282 261,404 6,128,878 4.09%
2012‐13 161,641,700 40,410,425 15% 6,061,564 243,328 5,818,236 4.01%
2013‐14 162,023,838 40,505,960 15% 6,075,894 224,289 5,851,605 3.69%
2014‐15 187,093,367 46,773,342 15% 7,016,001 204,232 6,811,769 2.91%
2015‐16 229,664,980 57,416,245 15% 8,612,437 183,102 8,429,335 2.13%
2016‐17 238,640,822 59,660,206 15% 8,949,031 160,845 8,788,186 1.80%
2017‐18 256,022,742 64,005,686 15% 9,600,853 137,398 9,463,455 1.43%
2018‐19 273,813,300 68,453,325 15% 10,267,999 112,702 10,155,297 1.10%
*The Government Code of the State of California provides for a legal debt limit of 15% of gross
assessed valuation. However, this provision was enacted when assessed valuation was based upon
25% of market value. Effective with the 1981‐82 fiscal year, each parcel is now assessed at
100% of market value (as of the most recent change in ownership for that parcel). This
computations shown above reflect a conversion of assessed valuation data for each fiscal year
from the current full valuation perspective to the 25% level that was in effect at the time the
legal debt margin was enacted by the State of California for local governments.
Source: City Finance Department
City of Wheatland
Legal Debt Margin Information
For the last ten fiscal years
111
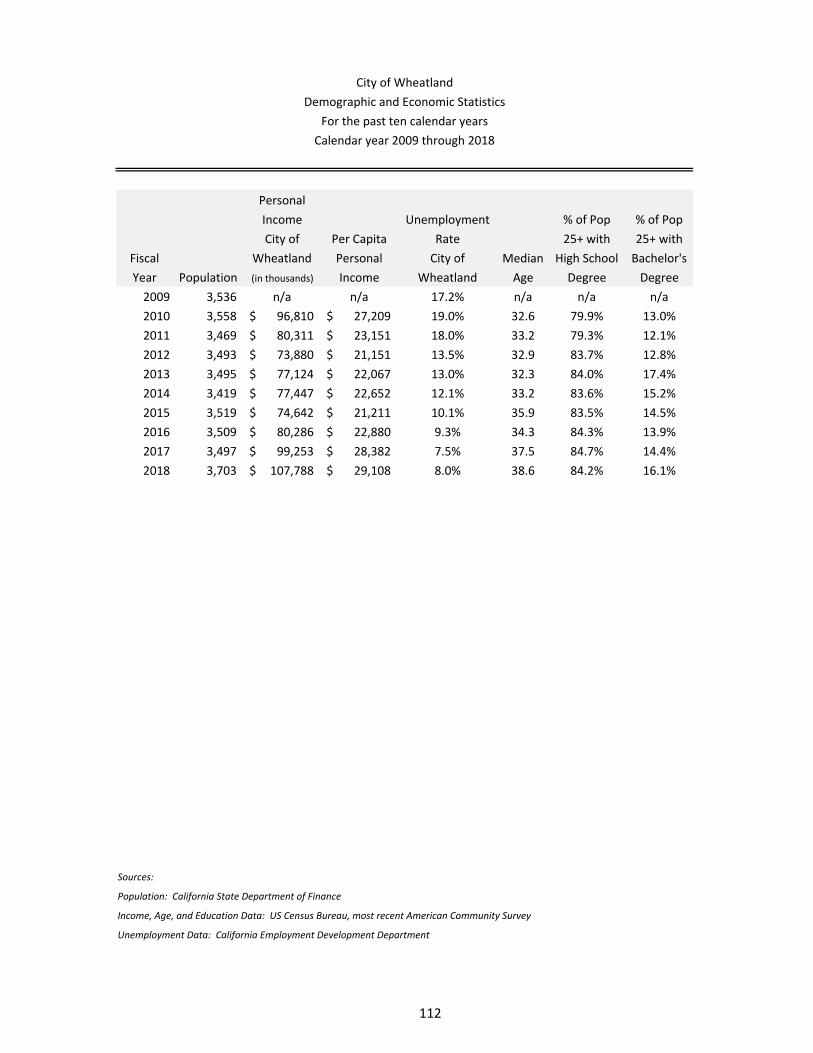
Personal
Income Unemployment % of Pop % of Pop
City of Per Capita Rate 25+ with 25+ with
Fiscal Wheatland Personal City of Median High School Bachelor's
Year Population (in thousands) Income Wheatland Age Degree Degree
2009 3,536 n/a n/a 17.2% n/a n/a n/a
2010 3,558 96,810$ 27,209$ 19.0% 32.6 79.9% 13.0%
2011 3,469 80,311$ 23,151$ 18.0% 33.2 79.3% 12.1%
2012 3,493 73,880$ 21,151$ 13.5% 32.9 83.7% 12.8%
2013 3,495 77,124$ 22,067$ 13.0% 32.3 84.0% 17.4%
2014 3,419 77,447$ 22,652$ 12.1% 33.2 83.6% 15.2%
2015 3,519 74,642$ 21,211$ 10.1% 35.9 83.5% 14.5%
2016 3,509 80,286$ 22,880$ 9.3% 34.3 84.3% 13.9%
2017 3,497 99,253$ 28,382$ 7.5% 37.5 84.7% 14.4%
2018 3,703 107,788$ 29,108$ 8.0% 38.6 84.2% 16.1%
Sources:
Population: California State Department of Finance
Income, Age, and Education Data: US Census Bureau, most recent American Community Survey
Unemployment Data: California Employment Development Department
City of Wheatland
Demographic and Economic Statistics
For the past ten calendar years
Calendar year 2009 through 2018
112
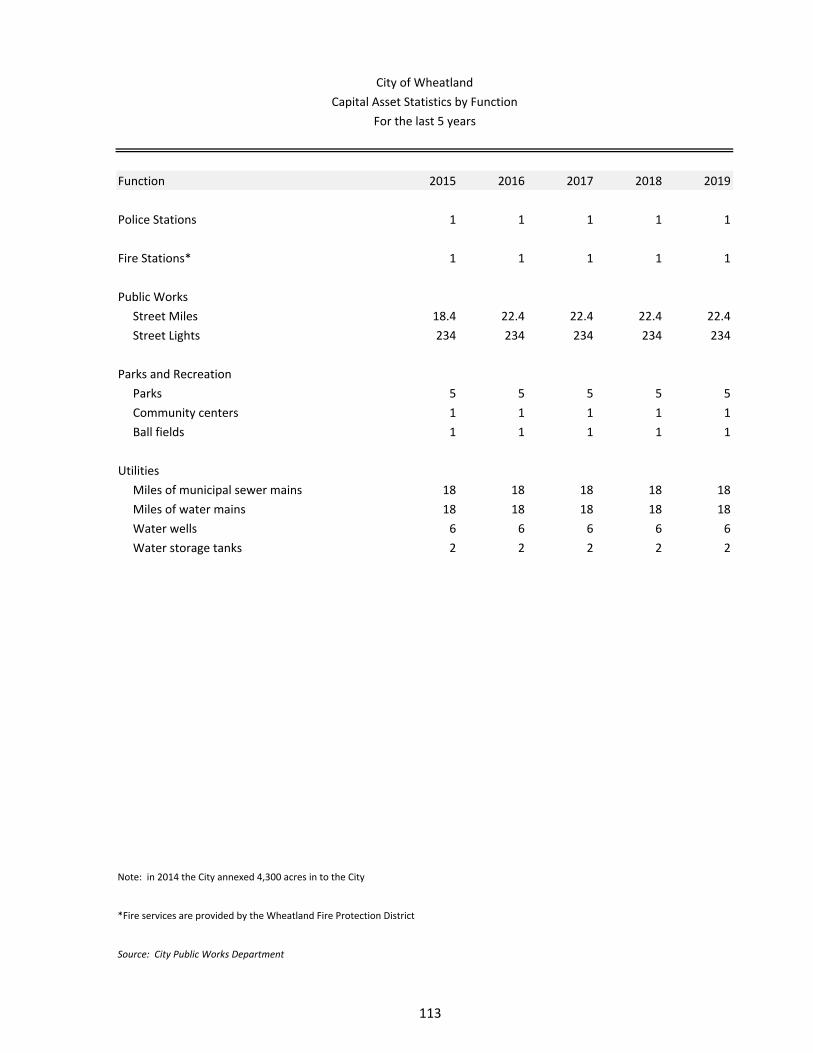
Function 2015 2016 2017 2018 2019
Police Stations 1 1 1 1 1
Fire Stations* 1 1 1 1 1
Public Works
Street Miles 18.4 22.4 22.4 22.4 22.4
Street Lights 234 234 234 234 234
Parks and Recreation
Parks 5 5 5 5 5
Community centers 1 1 1 1 1
Ball fields 1 1 1 1 1
Utilities
Miles of municipal sewer mains 18 18 18 18 18
Miles of water mains 18 18 18 18 18
Water wells 6 6 6 6 6
Water storage tanks 2 2 2 2 2
Note: in 2014 the City annexed 4,300 acres in to the City
*Fire services are provided by the Wheatland Fire Protection District
Source: City Public Works Department
City of Wheatland
Capital Asset Statistics by Function
For the last 5 years
113
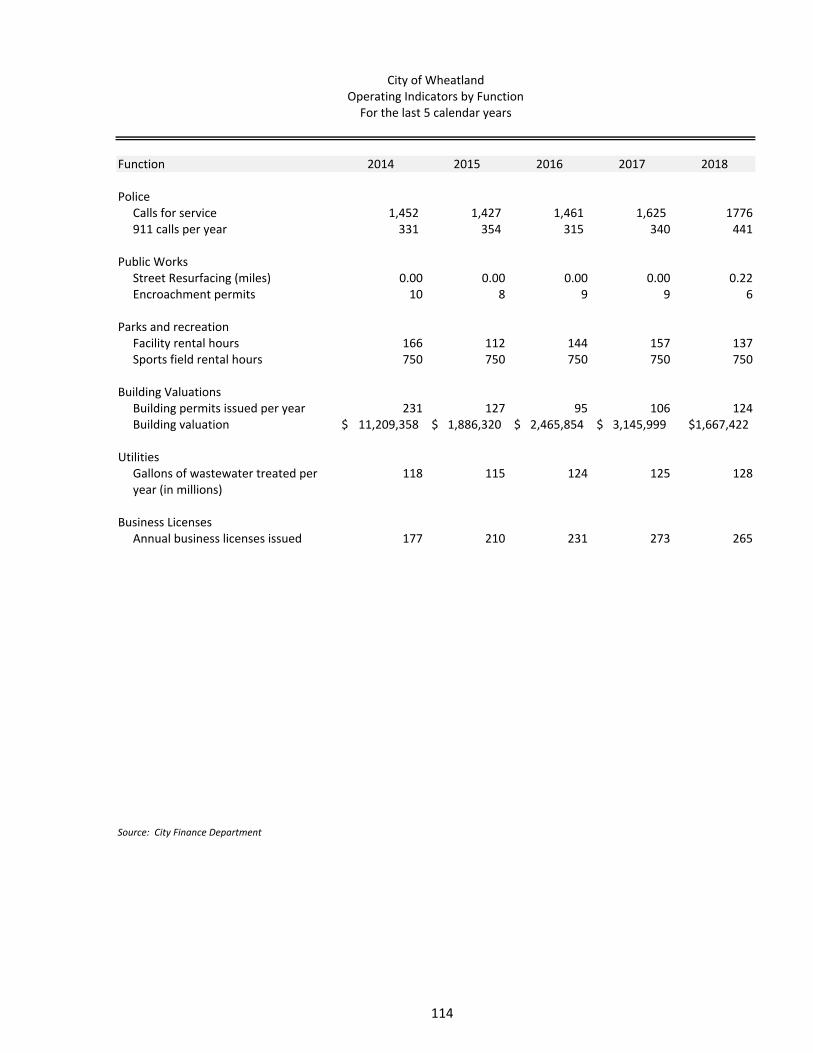
Function 2014 2015 2016 2017 2018
Police Calls for service 1,452 1,427 1,461 1,625 1776 911 calls per year 331 354 315 340 441
Public Works Street Resurfacing (miles) 0.00 0.00 0.00 0.00 0.22 Encroachment permits 10 8 9 9 6
Parks and recreation Facility rental hours 166 112 144 157 137 Sports field rental hours 750 750 750 750 750
Building Valuations Building permits issued per year 231 127 95 106 124 Building valuation 11,209,358$ 1,886,320$ 2,465,854$ 3,145,999$ $1,667,422
Utilities Gallons of wastewater treated per 118 115 124 125 128 year (in millions)
Business Licenses Annual business licenses issued 177 210 231 273 265
Source: City Finance Department
City of WheatlandOperating Indicators by FunctionFor the last 5 calendar years
114
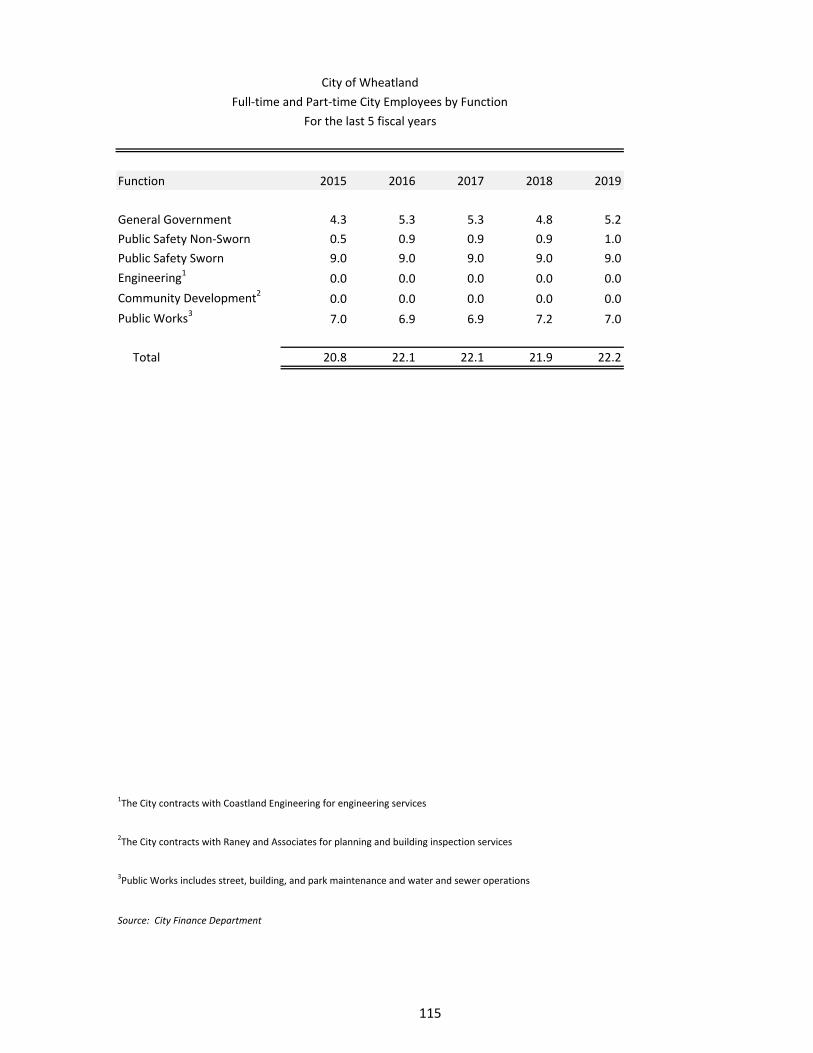
Function 2015 2016 2017 2018 2019
General Government 4.3 5.3 5.3 4.8 5.2
Public Safety Non‐Sworn 0.5 0.9 0.9 0.9 1.0
Public Safety Sworn 9.0 9.0 9.0 9.0 9.0
Engineering1 0.0 0.0 0.0 0.0 0.0
Community Development2 0.0 0.0 0.0 0.0 0.0
Public Works3 7.0 6.9 6.9 7.2 7.0
Total 20.8 22.1 22.1 21.9 22.2
1The City contracts with Coastland Engineering for engineering services
2The City contracts with Raney and Associates for planning and building inspection services
3Public Works includes street, building, and park maintenance and water and sewer operations
Source: City Finance Department
City of Wheatland
Full‐time and Part‐time City Employees by Function
For the last 5 fiscal years
115
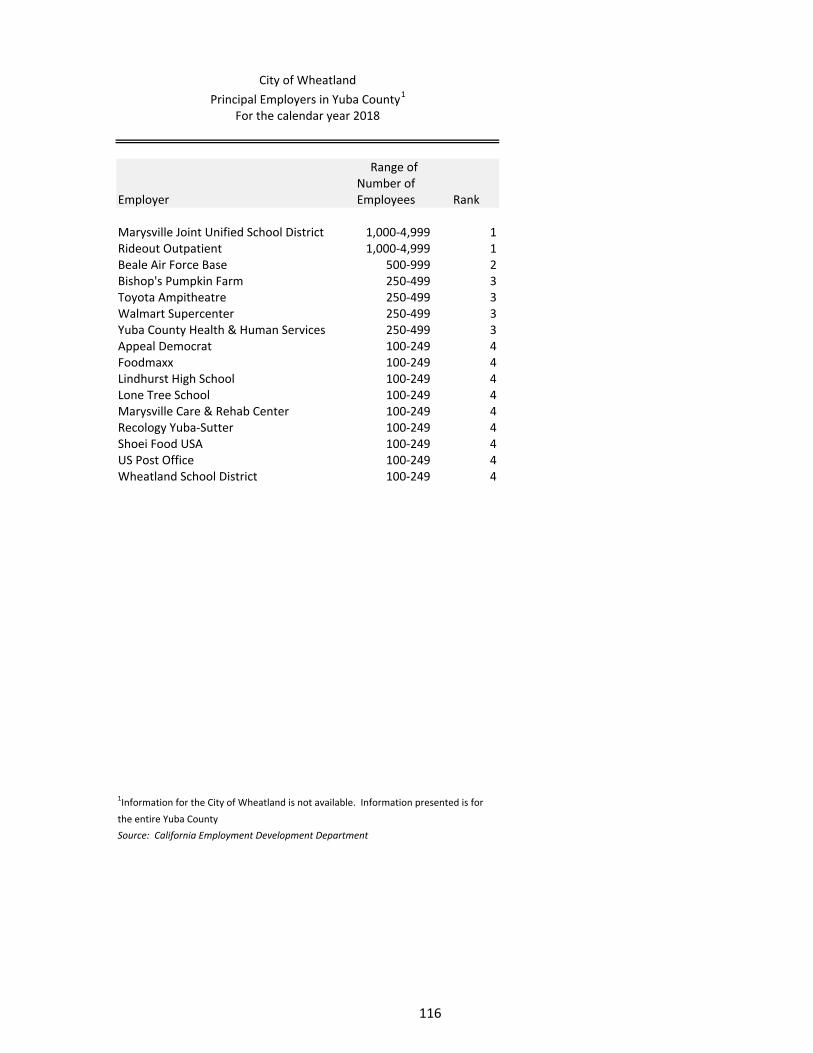
Range ofNumber of
Employer Employees Rank
Marysville Joint Unified School District 1,000‐4,999 1Rideout Outpatient 1,000‐4,999 1Beale Air Force Base 500‐999 2Bishop's Pumpkin Farm 250‐499 3Toyota Ampitheatre 250‐499 3Walmart Supercenter 250‐499 3Yuba County Health & Human Services 250‐499 3Appeal Democrat 100‐249 4Foodmaxx 100‐249 4Lindhurst High School 100‐249 4Lone Tree School 100‐249 4Marysville Care & Rehab Center 100‐249 4Recology Yuba‐Sutter 100‐249 4Shoei Food USA 100‐249 4US Post Office 100‐249 4Wheatland School District 100‐249 4
1Information for the City of Wheatland is not available. Information presented is for
the entire Yuba County
Source: California Employment Development Department
City of Wheatland
Principal Employers in Yuba County1
For the calendar year 2018
116