city of madras - university of oregon
TRANSCRIPT

Page 1
CITY OF MADRAS
COMPREHENSIVE PLAN
Madras, Oregon
REVISED THRU PERIODIC REVIEW ACKNOWLEDGED BY DLCD
JUNE 20, 2003

Page 2
Prepared by Tenneson Engineering and Adopted by the City of Madras City Council on
January 16, 1990
Revised through Periodic Review 1998 - 2003
Amended by Ordinance No. 754 Passed by Council on March 14, 2006
Amended by Ordinance No. 756
Passed by Council on March 14, 2006
Amended by Ordinance No. 770 Passed by Council on July 25, 2006
Amended by Ordinance No. 774
Passed by Council on August 22, 2006
Amended by Ordinances No. 780, 781, and 785 Passed by Council on December 12, 2006
Page 3
ACKNOWLEDGEMENTS:
Elected and Appointed Officials (During creation of the City’s Comprehensive Plan)
CITY COUNCIL: CITY PLANNING COMMISSION Dick Cowden, Mayor Ron Mobley, Chairman Jack McBride Bennie Jensen Reba Powell Georgie Meracle Ray Murray Jack Watts Paul Middleton Rudy Younger Cliff Herzberg Floyd Courtain Greg Smith Ray Carpenter
CITIZENS INVOLVEMENT CITY STAFF: COMMITTEE: Ray Carpenter A.P. Miller, City Recorder Roy Moodenbaugh Sumner Rodriguez, City Attorney Bob Kingery Dan Meader, Planning Consultant Susan Finlay Robert Duke COUNTY COURT: COUNTY PLANNING COMMISSION: Herschel Read, Judge Ted Freeman, Chairman Mary Norton Barbara Frazier Gordon Galbraith Bill Donaghu Shirley Joscelyn Robert Farrell Dick Kingsbury Rube Evans COUNTY PLANNING STAFF: Bryan Christian, Former County Planner Bob Martin, County Planner Sandy Krueger, Planning Secretary Michael Sullivan, District Attorney

Page 4
REVISIONS TO COMPREHENSIVE PLAN -
PERIODIC REVIEW, YEAR 2002/2003
ELECTED OFFICIALS
Rick Allen, Mayor Frank Morton, Council Member
Michael Goss II, Council Member Mark Heckathorn, Council Member Pamela Thomas, Council Member
Bob Sjolund, Council Member Melanie Widmer, Council Member
PLANNING COMMISSION MEMBERS:
Rosalie Starkovich Eugene Weatherby
Stan Howe Colleen Mock
Joyce Gottbreht Rob Hastings
Thomas Brown
CITY STAFF:
Steve Bogart, City Administrator Carol Parker, Community Development Director
Karen Coleman, City Recorder Bob Lovlien, City Attorney

Page 5
TABLE OF CONTENTS PAGE CHAPTER 1 COMPREHENSIVE PLAN Section I Introduction . . . . . . 11 Purpose and Implementation of the Comprehensive Plan . . . . 11 The Planning Process . . . . . 11 Section II Background Information . . . . 14 History . . . . . . 14 Physical Characteristics . . . . 15 Topography . . . . . 15 Hydrology . . . . . 15 Climate . . . . . 15 Geology . . . . . 16 Soils . . . . . . 16 Agriculture Lands . . . . 17 General Discussion . . . . 17 Forest Lands . . . . . 18 Natural Resources . . . . 18 Air, Water & Land Resource Quality . . . . . 19 Natural Hazards . . . . 20 Social Characteristics . . . . . 20 Recreation . . . . . 20 Economics . . . . . 21 Population . . . . . 22 Labor . . . . . . 30 Agriculture . . . . . 31 Crops . . . . . . 31 Livestock . . . . . 32 Manufacturing . . . . 32 Tourism . . . . . 38 Recreation . . . . . 39 Housing . . . . . 40

Page 6
Table of Contents - Continued PAGE Public Facilities . . . . 42 Water System . . . . 43 Deschutes Valley Water District . . 43 Wastewater System . . . . 48 Storm Water . . . . . 57 Schools . . . . . 66 Hospitals, Medical, Health & Mental Health . . . . 66 Churches, Lodges, Farm Organizations . . . . 67 Transportation . . . . 68 Regional Setting . . . 68 Highways . . . . 68 Railroads . . . . 69 Air Transportation . . . 69 Bus Service . . . . 70 Motor Freight . . . 70 Local Transportation . . . 71 Energy . . . . . 72 Urbanization . . . . . 72 Jefferson County "A-3" Zoning Area . . 73 Urban Growth Boundary Description . . . . . 74 General Discussion . . . . 75 Comprehensive Plan Addendum #1, Adopted by Ordinance #382, November 13, 1979 . . . . 75 Existing Housing within Urban Growth Boundary . . . 76 Urban Growth Boundary Analysis . . . 78 Analysis of Existing Development in Urban Growth Boundary . . . . 79 Comprehensive Plan Addendum #2, Adopted by Ordinance #703, January 14, 2003 . . . . . 83
Section III Goals and Policies . . . . . 84

Page 7
Table of Contents - Continued PAGE
Section IV Land Use Element . . . . . 101 General Discussion . . . . 101 Background for Land Use Category Decisions . . . . . 102 Establishment of Urban Growth Boundary and Urbanization . . 107 Urban Growth Management Plan . . 108 Areas Outside the Urban Growth Boundary . . . . . 109 Administrative Procedures . . . 98 Revisions . . . . . 109 Major Revisions (Legislative) . . 109 Quasi-Judicial Revisions . . 110 Urban Growth Boundary . . 111
Public Facilities Plan (Revised
thru Periodic Review 2003, Acknowledged by DLCD) 113
Parks and Open Space Master Plan (November, 2004) Included in Comp Plan by Reference. [Ordinance No. 756, March 14, 2006]

Page 8
LIST OF TABLES PAGE Climatological Data . . . . . . . 16 Table 24. Madras UGB Population Forecast 2005 to 2030 . . 23 Table 25. Madras City Limit Population 1980 to 2005. . . 24 Table 26. Compound Growth Rates by Time Period City of Madras . . . . . . . 25 Figure 7. Age Distribution, Madras and Jefferson County, 2000 . 26 Table 27. Population by Age, City of Madras 1990 and 2000 . 27 Table 28. Place of Residence in 1995, Jefferson County and Madras Persons 5 Years and Over . . 27 Table 29. Persons of Hispanic or Latino Origin City of Madras and Jefferson County, 1990 and 2000 . . 28 Employment Figures . . . . . . . 31 Manufacturing Firms in Jefferson County . . . . 33 Crops Harvested - Acres 1959, 1965 & 1969 , Jefferson County . . . . . . . 34 Unrelated Individuals Income By Income Range, Jefferson County, 1969 . . . . . . 35 Family Groups, Median Family Income and Family Incomes, Jefferson County - 1970 . . . . . 35 Median Earnings of Selected Occupation Groups, Jefferson County - 1960 and 1970 . . . . . 36 Major Occupational Group of Employed Jefferson County - 1970 . . . . . . . 36 Economic Growth Indicators . . . . . . 37 DVWD Future Projects and Timing . . . . . 46

Page 9
List of Table - Continued PAGE City Wastewater Future Projects and Timing . . . 49 DEQ Treatment Level Classification . . . . . 52 Levels of Treated Water to Reuse . . . . . 53 Deschutes River Effluent Quality above Pelton Dam . . 55 Deschutes River Effluent Quality below Pelton Dam . . 55 Pollutant Limits . . . . . . . 56 Storm Water Project and Timing . . . . . 59 Average Daily Membership . . . . . . 66 Existing Housing Mix, City of Madras . . . . 76

Page 10
FOREWARD PLANNING AREA While this document is titled the MADRAS COMPREHENSIVE PLAN, it must be recognized that the plan takes into consideration more than the corporate limits of the City of Madras. The plan was developed in close cooperation between the City of Madras and Jefferson County, and does allocate land resources outside the city limits. Because of this, it will be necessary for both governing bodies to adopt this plan: the Madras City Council for the lands inside the city limits, and the Jefferson County Court for those lands outside the city limits but inside the Urban Growth Boundary. The Urban Growth Boundary concept is relatively new to land use planning. Rather than attempt a definition here, it is recommended the reader turn to the Urbanization section on Page 55 for a complete explanation. PLAN FORMAT The plan is divided into four basic elements. The first element, the Introduction, outlines the reasons for land use planning, the process by which it is done, and the Citizen's Involvement Program. The second element, the inventories, describes the existing conditions concerning a variety of topics within the planning area. This section also attempts to identify future needs for the planning area and project future requirements. The third element identifies the Goals and Objectives of the plan. This element indicates what the City wishes to happen over the next two decades. The fourth element, the Land Use Element, allocates the land resources of the planning area to specific types of land uses and designates the locations of these land uses on the Comprehensive Land Use Map. This element also contains the formal policy statements concerning future growth and improvements in the planning area. The last portion of this element contains the administrative provisions of the plan. The administrative provisions deal with the methods by which the plan is changed or modified.

Page 11
SECTION I
INTRODUCTION The City of Madras developed and adopted a Comprehensive Plan in 1970. Requirements for the content of Comprehensive Land Use Plans were changed in 1973 by the Oregon State Legislature. The 1973 Legislature, through Senate Bill 100, established the Land Conservation and Development Commission. The Commission was charged with the duty of formulating a minimum criteria of what a Comprehensive Plan must address. This was done in the form of Statewide Planning Goals, which were adopted by the commission in 1975. The City Council reviewed the existing Plan and determined the Plan should be revised and updated to comply with the established Statewide Planning Goals and to meet changing needs of the City. The following pages contain the revised Comprehensive Plan for the City of Madras. The Goals and Objectives for the future development of Madras represent the decisions of interested citizens, elected and appointed officials, and other governmental agencies. These decisions are based on the best information available at the time of Plan formulation and development. This Plan is not meant to be cast in stone. As conditions and needs change over time, it shall be constantly monitored to insure that it responds to the community's requirements. PURPOSE AND IMPORTANCE OF THE COMPREHENSIVE PLAN The Comprehensive Plan serves as a guide for future community leaders in making land use decisions. Future land development must be in accordance with the adopted Plan. Recent Oregon Supreme Court decisions have clarified the importance of Comprehensive Plans by determining the Implementing Ordinances (Zoning and Subdivision) must be in accordance with the Comprehensive Plan. Because of the extreme importance of the Plan to the City, the planning process shall insure that: A. an adequate factual data base is developed; B. a broad Citizen Involvement Program is utilized; and C. information regarding the data and the draft and final adopted Plan are readily available
to the public. The adopted Comprehensive Plan shall be on file at the Jefferson County Clerk's Office and at the Madras City Hall.
THE PLANNING PROCESS The planning process involves several steps. It is initiated by establishing some preliminary goals that the Plan should accomplish. This is usually done by noting any particular problems of the City and specific needs that should be addressed. The next step is to conduct inventories and assemble information concerning various topics and conditions as they exist within the planning

Page 12
area. For example, some of the topics the Plan will address include economics, natural resources, and public facilities. After the information for each topic is assembled, tentative alternatives and goals are established. Once all topics have been inventoried and alternatives established, the next step is to compare the various goals and objectives alternatives with one another to insure compatibility. For example, it would not be compatible to project a population of 10,000 for a community and plan public facilities, such as schools, to serve a population of 2,000. This step, or phase, of the planning process requires the resolution of conflicts among the goals and objectives of the Plan and often will require some trade-offs between them. Once the goals and objectives are compatible, the last phase or step of the initial planning process is the actual land resource allocation. This is the establishment of the various land use categories the City will utilize, such as residential, commercial, and industrial. These land use categories will be mapped on the Comprehensive Land Use Map to indicate the specific boundaries of each. The adopted Plan is implemented by preparing and adopting Zoning and Subdivision Ordinances that carry out the goals and objectives of the Plan in terms of land use. The Planning Commission must then constantly monitor the Plan and Ordinances to determine their effectiveness. The Plan and Ordinance must be reviewed to insure they are responsive to the needs and desires of the residents of the City and planning area. Both the City and County must adopt the Plan. The City and County Planning Commissions, after formulation of a draft Plan will conduct public hearings to receive citizen input. Once that is completed and necessary revisions to the draft Plan made, the Commissions will recommend the draft to their respective governing bodies, the Madras City Council and the Jefferson County Court. Both of the elected bodies will conduct public hearings on the Plan prior to adopting it. The Plan must be adopted by Ordinance by both elected bodies. The City Planning Commission began work on the revision of the Comprehensive Plan in April of 1977. The Commission met every two weeks in workshop sessions to review the assembled data. The information gathering and coordination of the planning process were accomplished in cooperation with the Jefferson County Planning Commission and staff. To insure the maximum public input into all phases of the planning process, the Madras City Council appointed a separate Committee for Citizen Involvement in June 1976. The Committee formulated and recommended for adoption the following Citizens Involvement Program. Citizen Involvement Plan: The City shall provide opportunities for citizen involvement in all phases of the planning process. The process shall include a series of workshop meetings and public hearings to discuss inventories, identify the needs, formulate goals and objectives, consider alternatives, and finally

Page 13
adopt a Comprehensive Plan. The City will provide opportunities for citizen involvement in the preparation and adoption of the Implementing Ordinances. The City shall publicize the opportunities for citizen involvement by the following methods: A. The City shall post notices of Planning Commission meetings, outlining the date, time,
place and topics to be discussed, on public bulletin boards within the City. This would include the City Hall, the County Courthouse, and local markets.
B. In addition to the Oregonian and the Oregon Journal, there are two newspapers serving
the area--the Madras Pioneer (a weekly), and The Bulletin (a Bend daily). Both papers have indicated a willingness to publish articles announcing meetings and general discussions of Planning Commission topics including any decisions that are rendered.
C. Madras has a local television weather channel that allows placement of local notices.
This is anticipated to provide an excellent method of notification go the general public. D. Local service organizations and clubs shall be informed on Planning Commission
progress and discussion topics. These organizations include the Lions, Kiwanis, Chamber of Commerce, Epsilon Sigma Alpha Sorority, and the Jaycees.
E. Technical assistance shall be provided to the Planning Commission and the general
public by a planning consultant retained by the City. In addition, technical assistance is available from the City Manager's office. As Madras is the County Seat of Jefferson County, both the County Planner and the County Extension Agent have indicated a willingness to assist in the planning process and to provide assistance to interested citizens.
The Citizens Involvement Program will provide more than adequate means of communication between local government and residents. The workshop meetings and public hearings shall be conducted in a manner that will draw the maximum amount of citizen input available. Citizens will be asked to assist in developing inventories and reviewing progress of the Planning Commission. Most of the methods outlined in the Citizens Involvement Program can be accomplished with little cost other than time. The City has budgeted $250 per year toward implementation of the Citizens Involvement Program. Agency Involvement Program: A list of local, state and federal agencies and special districts was compiled at the outset of the planning process. These governmental units all have an interest in the development of the Comprehensive Plan for Madras. All interested agencies were notified and their input was

Page 14
requested during the planning process. In addition, many agencies were contacted personally by City staff to develop the data base from which the Plan is formed. All interested agencies have been given the opportunity to review and comment on the draft Plan. The City Council adopted the Citizens and Agency Involvement Program on June 8, 1976.
SECTION II
INVENTORIES
BACKGROUND INFORMATION The City of Madras is located near the center of Jefferson County. It is at the junction of U.S. Highway 26 and U.S. Highway 97, and is approximately 120 miles southeast of the City of Portland. The City serves as a retail service center for the surrounding agricultural lands. In addition, the City provides tourist facilities for travelers enjoying the many recreational opportunities of the Central Oregon area. Madras serves as the County Seat of Jefferson County and is the largest of the three incorporated cities within Jefferson County. HISTORY The first white man in the area was Peter Skene Ogden, a trader for the Hudson Bay Company. On his second Snake River journey from Fort Nez Perce (Walla Walla) between November, 1825, and July, 1826, he crossed the Deschutes River near the mouth. From the present site of The Dalles, he followed a route west of Tygh Ridge and crossed the Warm Springs and Deschutes Rivers again to arrive at the present site of Madras. From there he followed the Crooked River and made his way back to the Snake River. In 1843, John C. Fremont, guided by Kit Carson, crossed the Warm Springs area on his way to Nevada. Due to Indian trouble, settlement of the area did not follow very fast. In fact, settlement was discouraged officially. On August 7, 1856, General John E. Wool, Commander of the Department of the Pacific of the U.S. Army, issued an order to Colonel George Wright at The Dalles forbidding immigrants to locate east of the Cascades. The Cascade Mountain Range was considered a wall of separation between the Indians and the Whites. This order was revoked by General Harney on October 31, 1858. In 1862, the first road was built across the Cascades in order to provide a passageway for traders who wanted to supply the towns in Eastern Oregon, where mining was under way. As a result of these roads, White settlers began to move into what is now Jefferson County. In 1855, treaties were drawn up with bands of the Wasco and Walla Walla Indians, creating the Warm Springs Indian Reservation. In addition to the Wasco and Walla Walla Indians, a number of Paiutes arrested during the military campaign against them between 1865 and 1868 were also settled on this reservation. White settlers soon began to fill every available site with homes and farms. Shortly after 1900, the construction of two railroads began between the Columbia River

Page 15
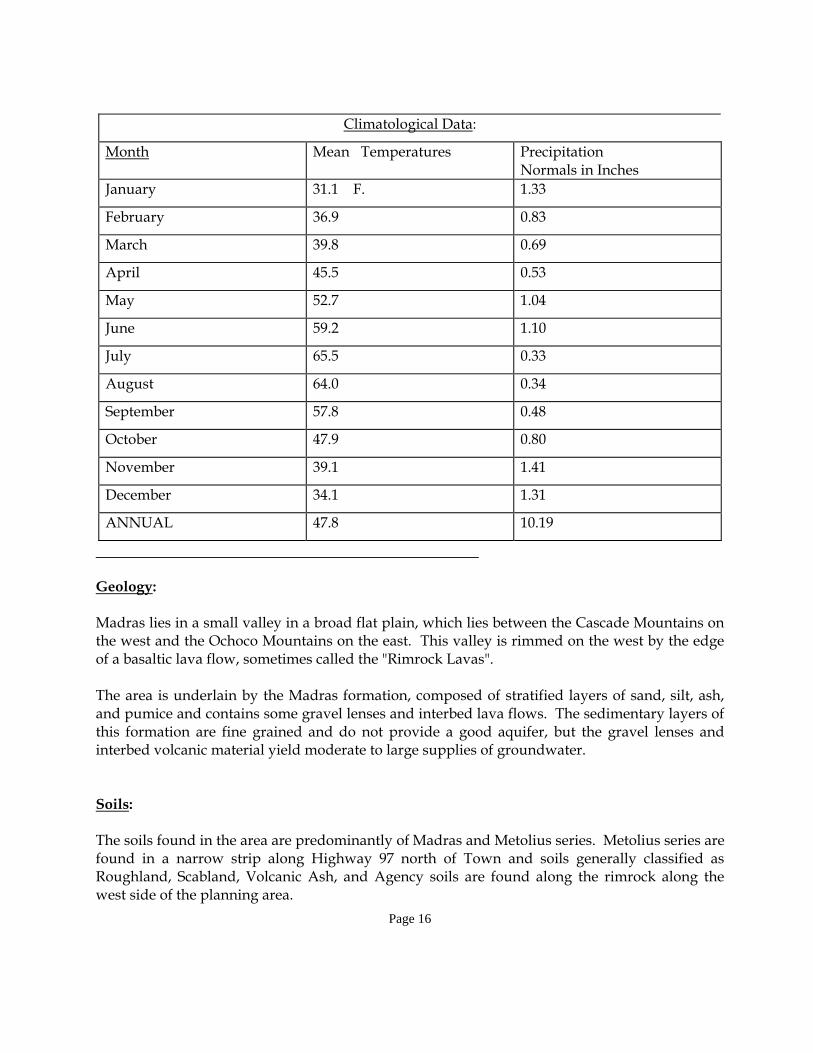
and Madras. The two lines were on opposite sides of the Deschutes River, and the crews had constant feuds and many bloody battles. Finally, the Deschutes line, backed by E.H. Harriman, was abandoned. The Oregon Trunk Railroad, built by James J. Hill, is still in operation. Arrival of the railroad in Madras was observed in Madras in ceremonies held February 15, 1911. At about this time, the first irrigation project was started. PHYSICAL CHARACTERISTICS Topography: The City of Madras lies in a basin at the head of the Willow Creek Canyon which cuts through Agency Plains to the Deschutes River. The land is moderately sloping except on the north side of the Town where it slopes steeply up to the Agency Plains. Except for the Madras Industrial Park, which is located on Agency Plains and tends to slope to the west, both the south and north areas drain into the City to Willow Creek. The elevation at the lowest part of Madras is about 2,230 feet. The elevation in the south area varies from 2,260 to 2,420 feet. The elevation in the north area varies from 2,250 feet to 2,480 feet on Agency Plains. Hydrology: Most of the planning area lies in the Willow Creek basin, a sub-basin of the Deschutes River basin. Willow Creek is an intermittent stream that normally flows from about mid-December through mid-July. During the summer and fall months, irrigation runoff and occasional heavy thunder showers are the only sources of flow to the creek. The groundwater table occurs at an altitude of about 1,900 feet in the Madras area (approximately 300 feet below the ground surface) and appears to have a gradient to the northwest, under Agency Plains to the Deschutes River. Perched groundwater can be found in a gravel layer on top of impermeable sandstone in some areas of Town. This water may be as shallow as 18 to 20 feet below the ground surface and appears to lie in old stream beds of Willow Creek. Climate: The Madras area lies in the weather shadow of the Cascade Range, causing a semi-arid climate. The area receives only about 10 inches of precipitation annually and experiences nearly 50 inches of evaporation. The area has an average annual snowfall of about 15 inches and a growing season of 100 days.
Page 16
Climatological Data:
Month Mean Temperatures Precipitation Normals in Inches
January 31.1� F. 1.33
February 36.9 0.83
March 39.8 0.69
April 45.5 0.53
May 52.7 1.04
June 59.2 1.10
July 65.5 0.33
August 64.0 0.34
September 57.8 0.48
October 47.9 0.80
November 39.1 1.41
December 34.1 1.31
ANNUAL 47.8 10.19
Geology: Madras lies in a small valley in a broad flat plain, which lies between the Cascade Mountains on the west and the Ochoco Mountains on the east. This valley is rimmed on the west by the edge of a basaltic lava flow, sometimes called the "Rimrock Lavas". The area is underlain by the Madras formation, composed of stratified layers of sand, silt, ash, and pumice and contains some gravel lenses and interbed lava flows. The sedimentary layers of this formation are fine grained and do not provide a good aquifer, but the gravel lenses and interbed volcanic material yield moderate to large supplies of groundwater. Soils: The soils found in the area are predominantly of Madras and Metolius series. Metolius series are found in a narrow strip along Highway 97 north of Town and soils generally classified as Roughland, Scabland, Volcanic Ash, and Agency soils are found along the rimrock along the west side of the planning area.

Page 17
The Metolius soil is a well-drained, sandy loam soil formed from alluvial or aeolian materials. The permeability is moderately rapid, but the runoff is slow. Because of the potential to flooding, the soils have been given a moderate rating for septic tank installations. These soils are highly suited for agricultural crops having an effective rooting depth of 60 inches or more. The Soil Conservation Service has rated the Metolius series in Capability Classifications II and III, when irrigated. The Madras series found in the planning area consists of sandy loam soils formed in colluvium. The soils are relatively shallow, having a depth to hardpan of 20 to 30 inches and a depth to bedrock of 25 to 40 inches. Both the hardpan and bedrock are "rippable". The Soil Conservation Service has rated the Madras series soils in Capability Classifications II, III, and IV, with irrigation. Drainage varies from rapid through the surface layers to very slow through the hardpan. The Madras soils generally have moderately severe to severe limitation for use for tilled crops. The land is used primarily as range land and dry farming with a low yield of grain crops being produced. The Roughland, Scabland, and Volcanic Ash and the Agency soils found along the "rimrock" are too stony to be tilled. Steep slopes limit irrigation, making this land unsuitable for agricultural uses. A soils map is not provided. A complete analysis of each soil type, together with soils maps, is available in the technical information as provided by the Soil Conservation Service. There are no "weak foundation" soils in the planning area. Agricultural Lands: Within the present city limits of Madras there is very little agricultural production, with the exception of some open lands used for pasturing livestock. There are several small acreages of producing agricultural lands in the Madras planning area. The principal crops are wheat, mint, and potatoes. General Discussion: Existing land use patterns in the Madras planning area pose difficult problems for comprehensive planning. The City has grown in a linear fashion from South to North, covering a large area--over four miles. In recent years, development has begun to move East and West from the City. Much of the development outside the City has occurred without the concurrence of the City. The Deschutes Valley Water District provides domestic water outside the city limits. The availability of public water and the allowance of septic tanks on 10,000 square foot lots with the public water has made the larger lot outside the City more attractive than smaller lots with additional taxes inside the City. The result has been development of an urban fringe area of over 12 square miles. Lands within that area, which are suitable for agricultural purposes have been

Page 18
maintained, primarily by the economic marketplace more than planning or zoning regulations. The land use pattern that has resulted is a patchwork quilt of agricultural lands on the flat lands with rural subdivision on ridges, the non-farmable lands. The City does not wish to discourage the continuation of farming on suitable lands in the urban area. However, in order to provide sensible planning for the future, future needs must be anticipated and the City considers the lands within the designated Urban Growth Boundary suitable for development over time. Forest Lands: There are no forest lands in the planning area; therefore, the State Planning Goal concerning forest lands is not applicable. Natural Resources: The geographic location of the Madras planning area in Central Oregon precludes the existence of many natural resources. There are no known mineral and aggregate resources, energy sources, or ecological and scientific natural areas within the planning area. There are also no wetlands or watersheds, wilderness areas, cultural areas, or developed recreation trails within the planning area. The existing development patterns of the City provide large areas of open space intermixed between areas of development. The City maintains a large City Park in the downtown core area. The park offers picnicking and limited playground facilities for children. A small neighborhood park on the northeast side of the City is yet to be developed. The stream of Willow Creek passes through Madras in a westerly direction. Willow Creek is an intermittent stream, which normally flows from mid-December through mid-July. During the summer and fall months, irrigation runoff and occasional heavy thundershowers are the only source of flow to the creek. Because of the periods of no flow during the summer months, there are no fish or fish habitats in the stream. The groundwater table occurs at an altitude of about 1,900 feet in the Madras area and is approximately 300 feet below the ground surface. It appears to have a gradient to the northwest under Agency Plains to the Deschutes River. The first groundwater can be found in a gravel layer on top of impermeable sandstone in some areas of Town. This water may be as shallow as 18 to 20 feet below the ground surface and appears to lie in old stream beds of Willow Creek. Almost any location in the City offers scenic views and vistas of the nearby Cascade Mountain Range. It is the desire of the City to preserve this scenic resource for the enjoyment of the residents of the City. To that end, the City shall establish height regulations to limit the height of structures, residential and commercial, in the Zoning Ordinance.

Page 19
There are two historic structures the City wishes to preserve in Madras. These are the old City Hall/County Courthouse and jail constructed in 1911. The City Hall/County Courthouse has been recently renovated and now serves as an office building for governmental agencies. The second story of the building is being converted into a museum operated by the Jefferson County Museum Association. Other historic sites identified by the Statewide Inventory of Historic Sites and Buildings in 1976 include the Madras Railroad Depot, the Madras Hotel, the Madras Conservative Baptist Church, the IOOF Hall, and the Mason House. These structures are under private ownership. The City will cooperate with the Museum Association should any of the structures become available for restoration. In the 1988 Periodic Review, the City officially designated the IOOF Hall as an historic resource. Wildlife in the area is limited to those species, which are common to urban residential areas. There are no known endangered species in the area. Air, Water, and Land Resource Quality: The air quality of the Madras planning area is considered quite good. There are five or six industrial plants, which are known to discharge particulate matter into the atmosphere. These are not known to violate current state and federal regulations. The nearest Department of Environmental Quality monitoring station is located in Bend. The City's source of domestic water is supplied by Deschutes Valley Water District (DVWD). The City of Madras has three wells, which supplement watering of yards during the summer months. Two of the existing wells are located to the North of the City and are approximately 175 to 200 feet apart. The third is located West of the City maintenance shops. The wells are drilled to a depth of 300 to 450 feet. The City has constructed, within the existing city limits, two separate wastewater collection systems, one to the north and the newest system to the east of the city. The City of Madras requires all users inside the City to connect to this system. Areas outside the City have been utilizing septic tanks and drainfields on 10,000 square foot lots where a public water system is available. The City developed with the assistance of the Environmental Protection Agency, a facilities plan. This plan was developed in October, 1976 to provide collection facilities to these outlying areas. The facilities plan notes that drainfields in the study area have very limited effectiveness because of the shallow topsoil. The impervious layer of sandstone just under the surface in most areas keeps the wastes in the very shallow topsoil. In most of the planning areas, the topsoil cannot meet the statewide requirements for drainfields. The area adjacent to the City, proposed to be provided with a wastewater collection system, is approximated by the Urban Growth Boundary as indicated on the Comprehensive Plan Map. Further support of the boundary designation is indicated by a recent study by the Oregon State Department of Environmental Quality. The study of the area surrounding the City of Madras revealed heavy use of sanitary sewage disposal wells. Oregon Revised Statutes require the discontinuation of the use of disposal wells by the first of January, 1980. The area involved adjacent to the City

Page 20
totals approximately 1,300 acres and involves over 400 structures. Over 300 of those structures presently utilize disposal wells as a means of sanitary sewer disposal. In order to meet Oregon law, this area must be considered for future sanitary sewer service when establishing an Urban Growth Boundary. The City of Madras recently expanded its Urban Growth Boundary, which will provide urban services to those properties when they are annexed into the city limits; or, if a health hazard exists on the parcel. Natural Hazards: The most significant natural hazard in the Madras planning area is the danger of flooding from Willow Creek during periods of heavy runoff. The flood plain limits are identified on the Natural Hazards Map and are also indicated on the Comprehensive Plan Map. The City has developed a special ordinance to preclude the development of these areas without proper flood proofing. The topography of the City precludes the danger of a landslide in most locations in the planning area. There are no known erosion areas or weak foundation soil areas in the planning area. The planning area is not located on a known earthquake fault or earthquake zone, although the City has felt the effects of aftershocks of earthquakes whose epicenters were located 50 to 60 miles North of the City. There are no other known natural hazards within the planning area. SOCIAL CHARACTERISTICS Recreation: The geographic location of the City, in the heart of the Central Oregon recreational area, provides a natural environment for the enjoyment of outdoor recreational activities. The City hosts many visitors who enjoy the fishing, water sports, and rockhounding opportunities that the area offers. Cove Palisades, a major Oregon State Park, lies approximately nine miles southwest of the City. The park offers outstanding fishing, waterskiing, and camping facilities. Currently, over one-half million people visit the park each year. Madras serves as the commercial center for the area. Most recreational activities available to area residents and visitors take place outside the City. Because of this, the City has only one developed City park. The park is provided with playground equipment for use by small children. There are also playgrounds available at both school locations. In addition, there are three baseball diamonds located at the County Fairgrounds. An extensive area wide Little League Baseball program is available each year. Other major recreational opportunities in or near the City include a public nine-hole golf course to the North of the City and an indoor rodeo arena at the Jefferson County Fairgrounds. The

Page 21
County Fairgrounds hosts the annual county fair, an annual rockhounders' convention, and various 4-H and FFA activities. There are three active gun clubs with rifle, pistol, and shotgun ranges located outside the City. The Central Oregon area offers some of the finest hunting in the State and many local residents are quite active in this outdoor sport. Tennis is becoming a major summer recreational activity in the area, although at the present time there are only four tennis courts in the City. The resultant overcrowding indicates the need for additional facilities. There has been recent interest in handball and racquet ball courts. The City has also determined a need for a municipal swimming pool. The City has begun to consider the feasibility of obtaining the necessary lands to construct a recreation facility that would meet the needs of the City. This would include tennis and handball courts, swimming pool, and other recreational activities. The topography and street layout of the City makes the use of bicycles very practical. Providing funding can be obtained, the City would like to establish several bike paths throughout the City. The City, in cooperation with Jefferson County, would like to improve and maintain a hiking/bike path along Willow Creek. Some of the path is inside the City with the remainder in Jefferson County. The now abandoned railroad bed along Willow Creek down to Pelton Dam is an excellent base for the path, but it needs to be upgraded. The path is now being utilized by local joggers. Economics: The City of Madras serves as the regional shopping center for all of Jefferson County. Commercial activity is conducted both within the existing city limits and in the surrounding lands adjacent to the city limits. The main commercial activity is conducted along the two main streets of the City which stretch out over two miles. There are various types of commercial and industrial activity carried on within these boundaries. In 2005 the City undertook a comprehensive look at the different characteristics of commercial areas within the City. This planning process resulted in new commercial standards for three distinct commercial districts. [The last two sentences of this paragraph were added by Ordinance No. 770, Passed by Council on July 25, 2006] Specific economic data concerning the City is not available, however, data for all of Jefferson County is. Because of the economic interrelationship of the jurisdiction, this data is presented to give an overview of the economic conditions of the City. In 1976, a committee was formed to develop an Overall Economic Development Plan. The project was finalized and formally adopted on June 29, 1977, by the Jefferson County Court. The following economic information was taken from that report.

Page 22
Population: Forecast Table Table 24 presents the population forecast for the City of Madras for the period 2005 to 2056. The forecast reaches a population of 13,115 by 2026, and of 27,997 by 2056. The assumed growth rate for the 2006-2011 period is 4.5% annually. This rate is based on Madras’ growth between 1980 and 2005, recent development activity and the impacts of the prison. The rate assumption is 4.0% annually for the 2011-2026 period. The assumed growth rate for the 2026-2056 period is 2.6% and is consistent with lower assumptions for the County during the later decades of the forecasting period.

Page 23
Table 24. Madras UGB Population Forecast, 2005-2030
Year Population Annual Increase Percent Change 2005 5,592 - - 2006 5,844 252 4.5% 2007 6,107 263 4.5% 2008 6,381 275 4.5% 2009 6,669 287 4.5% 2010 6,969 300 4.5% 2011 7,282 314 4.5% 2012 7,574 291 4.0% 2013 7,876 303 4.0% 2014 8,192 315 4.0% 2015 8,519 328 4.0% 2016 8,860 341 4.0% 2017 9,214 354 4.0% 2018 9,583 369 4.0% 2019 9,966 383 4.0% 2020 10,365 399 4.0% 2021 10,779 415 4.0% 2022 11,211 431 4.0% 2023 11,659 448 4.0% 2024 12,125 466 4.0% 2025 12,610 485 4.0% 2026 13,115 504 4.0% 2027 13,451 336 2.6% 2028 13,795 344 2.6% 2029 14,148 353 2.6% 2030 14,510 362 2.6% 2031 14,882 371 2.6% 2032 15,263 381 2.6% 2033 15,653 391 2.6% 2034 16,054 401 2.6% 2035 16,465 411 2.6% 2036 16,887 422 2.6% 2037 17,319 432 2.6% 2038 17,762 443 2.6% 2039 18,217 455 2.6% 2040 18,683 466 2.6% 2041 19,162 478 2.6% 2042 19,652 491 2.6% 2043 20,155 503 2.6% 2044 20,671 516 2.6% 2045 21,201 529 2.6% 2046 21,743 543 2.6% 2047 22,300 557 2.6% 2048 22,871 571 2.6% 2049 23,456 585 2.6% 2050 24,057 600 2.6% 2051 24,673 616 2.6% 2052 25,304 632 2.6% 2053 25,952 648 2.6% 2054 26,616 664 2.6% 2055 27,298 681 2.6% 2056 27,997 699 2.6%

Page 24
Factual Base The following sections provide factual evidence in support of the coordinated population forecast. Population Trends
Table 25 shows population estimates for Madras for the period between 1980 and 2005. The data show that Madras grew slowly during much of the 1980’s, with population decreases some years. The City averaged about 3% growth annually, adding 660 people during this period. Madras’ population began growing rapidly in 1989 and continued growing through the 1990’s. Madras added 1,637 people in the 1990’s, averaging 4% growth annually. Madras’ population has continued to grow since 2000. Annexations account for a population increase of 681 people between 1980 and 2004. The majority of the growth in population resulting from annexation occurred in the 1980’s. The largest annexation of 572 people took place in 1989, which explains the rapid growth in population in 1989.
Table 25. Madras City Limit Population, 1980 to 2005
Year City of Madras Annual Percent Change 1980 2,235 - - - - - 1981 2,290 2.46% 1982 2,320 1.31% 1983 2,250 -3.02% 1984 2,260 0.44% 1985 2,320 2.65% 1986 2,340 0.86% 1987 2,270 -2.99% 1988 2,295 1.10% 1989 2,895 26.14% 1990 3,443 18.93% 1991 3,570 3.69% 1992 3,820 7.00% 1993 4,020 5.24% 1994 4,290 6.72% 1995 4,675 8.97% 1996 4,770 2.03% 1997 4,940 3.56% 1998 5,005 1.32% 1999 5,080 1.50% 2000 5,078 -0.04% 2001 5,200 2.40% 2002 5,290 1.73% 2003 5,370 1.51% 2004 5,430 1.12% 2005 5,592 2.98%
Source: U.S. Census and Population Research Center at Portland State University

Page 25
The data in Table 25 includes only the population within the Madras UGB. The U.S. Census tracks the number of people within the city limits, as well as the population within the Madras urban cluster. According to the U.S. Census, an urban cluster is a densely settled territory that may or may not include a small incorporated city. In 2000, the Census estimated that there were 5,078 residents within the City of Madras and 7,252 people within the Madras urban cluster. The population living within Madras accounts for 70% of the population within the urban cluster. Although the forecast for Madras does not include this group of people, the coordinated forecast for Jefferson County does include growth in this population. Table 26 shows growth rates for Madras for several time periods. These historical growth rates provide context for developing a range of population projections. ECO calculated the rates using the compounding method. The data underscore several key points: ● The start and end dates have a big impact on the growth rate. This is because
population growth was slow in the 1980’s, then spiked in 1989 and 1990 and continued more gradually since 1991 to the present.
● The average annual growth rate (AAGR) was between 1.95% (2000-2005) and 4.50%
(1985 - 2005) depending on the time period.
Table 26. Compound Growth Rates by Time Period, City of Madras
Period
Number of
Years
AAGR (Compound Growth
Rate)
Population Increase
% Change
(Full Period)
1980 - 2005 25 3.74% 3,357 150% 1985 - 2005 20 4.50% 3,272 141% 1990 - 2005 15 3.29% 2,149 62% 1995 - 2005 10 1.81% 917 20% 2000 - 2005 5 1.95% 514 10%
Socioeconomic Trends This section reviews historical socioeconomic trends in the City of Madras. Socioeconomic trends provide a broader context for growth in a city; factors such as age, income, migration and other trends show how communities have grown and shape future growth. To provide context, the findings compare the City of Madras with Jefferson County. Characteristics such as age, household composition, and race are indicators of how population has grown in the past and provide insight into factors that may affect future growth. Figure 7 compares age in the City of Madras and Jefferson County for 2000. The data show that Madras has more young and old residents than Jefferson County. Madras has a higher percentage of its population in the following age classes: 39 years and younger and 80 years and

Page 26
older. Madras has a lower proportion of its population in the 40 to 79 age ranges. These trends suggest that Madras is attracting younger people, including families with children.
Source: U.S. Census, SF-1 During the 1990’s Madras experienced changes in the age structure of its residents. Table 27 shows population by age for Madras for 1990 and 2000. The Census data show that Madras grew by 1,635 people between 1990 and 2000, which is a 47% increase. Madras experienced an increase in population for every age group. The fastest growing groups were 5 to 17 years and 45 to 64 years. The slowest growing groups were under 5 years, as well as 65 years and over. A comparison of population increase by age between Madras and Jefferson County shows that: ● Madras grew faster than Jefferson County. The population of Madras increased by
47% between 1980 and 2000 and Jefferson County experienced a 39% population increase.
● Madras had a higher percentage increase in all age groups younger than 44 years.
Madras had proportionately slower growth in age groups older than 45 years.

Page 27
Table 27. Population by Age, City of Madras 1990 and 2000
1990 Age Group Number Percent
2000
Number Percent
Change
Number Percent Share
Under 5 395 11% 5 - 17 688 20% 18 - 24 366 11% 25 -44 1,020 30% 45 - 64 496 14% 65 and over 478 14%
521 10% 1,158 23% 538 11% 1,509 30% 818 16% 534 11%
126 89% -1% 470 114% 3% 172 100% 0% 489 100% 0% 322 112% 2% 56 76% -3%
Total 3,443 100% 5,078 100% 1,635 47% 0% Source: U.S. Census, 1990 and 2000 The U.S. Census collects information about migration patterns. Specifically, it asks households where their residence was in 1995 (5 years prior to the Census count). Table 28 shows place of residence in 1995 for Madras and Jefferson County. The data show that residents of Madras are more mobile than residents of Jefferson County. Thirty-five percent of residents in Madras lived in the same residence in 1995, compared with 45% in Jefferson County. About one-third of residents in Jefferson County and Madras lived in a different county in 1995; about 16% of Madras residents lived in a different state in 1995. These trends indicate that migration is an important factor in Madras’ past growth.
Table 28. Place of Residence in 1995, Jefferson County and Madras Persons 5 Years and Over
Jefferson County Madras Location Persons Percent Persons Percent Population 5 years and older 17,610 100% 4,537 100% Same house in 1995 8,007 45% 1,589 35% Different house in 1995 9,603 55% 2,948 65% Same county 3,976 23% 1,475 33% Different county 5,450 31% 1,389 31% Same state 3,520 20% 684 15% Different state 1,930 11% 705 16%
Source: U.S. Census, SF-3 Table 29 shows the number of persons of Hispanic or Latino origin for Madras and Jefferson County for 1990 and 2000. The Census data show that Madras has a larger proportion of Hispanic/Latino population. In 2000, Madras’ population was about 36% Hispanic/Latino, significantly higher than 18% in Jefferson County or 4% in Deschutes County. Madras’

Page 28
Hispanic/Latino population grew by 146% between 1990 and 2000. Madras’ Hispanic/Latino population is growing faster than the overall population, which conforms to statewide trends. National demographic trends suggest this trend will continue in Madras.
Table 29. Persons of Hispanic or Latino Origin City of Madras and Jefferson County, 1990 and 2000
Madras Jefferson County
1990 Total Population 3,443 13,676 Hispanic or Latino 739 1,448 Percent Hispanic or Latino 21.5% 10.6% 2000 Total Population 5,078 19,009 Hispanic or Latino 1,815 3,372 Percent Hispanic or Latino 35.7% 17.7% Change 1900 - 2000 Hispanic or Latino 1,076 1,924 Percent Hispanic or Latino 146% 133%
Source: U.S. Census, SF-1, 1990-2000 Summary of Findings This section summarizes the findings in support of the alternative Madras population forecast. Madras has experienced substantial population growth since 1990. ● Madras had a total of a 150% increase in population between 1990 and 2005. Between
1980 and 2005 the AAGR was 3.74%. The AAGR was 3.29% between 1990 and 2005. Madras’ population growth slowed between 2000 and 2005, with an AAGR of 1.95%.
● Between 1990 and 2005 Madras grew more than twice as fast as Oregon and slightly
faster than Jefferson County. ● The assumed growth rate of 4.5% annually for the 2006-2026 period is based on
historical growth rates, recent development activity, and the impacts of the prison.

Page 29
Madras is attracting younger people, many of whom have children. ● Madras has more young and old residents than Jefferson County. Madras has a
higher percentage of its population in the following age classes: 39 years and younger and 80 years and older. Madras has a lower proportion of its population in the 40 to 79 age ranges. These trends suggest that Madras is attracting younger people, including families with children.
● Madras experienced changes in the age structure of its residents between 1990 and
2000. Madras experienced an increase in population for every age group. The fastest growing groups were 5 to 17 and 45 to 64 years. The slowest growing groups were under 5 years, as well as 65 years and over.
In-migration accounts for some of the recent population growth. ● Residents of Madras are more mobile than residents of Jefferson County. Thirty-five
percent of residents in Madras lived in the same residence in 1995, compared with 45% in Jefferson County. About one-third of residents in Jefferson County and Madras lived in a different county in 1995; about 16% of Madras residents lived in a different state in 1995. These trends indicate that migration is an important factor in Madras’ past growth.
Madras has the largest proportion of Hispanic/Latino residents in Jefferson County. ● In 2000, Madras’ population was about 36% Hispanic/Latino, significantly higher
than 18% in Jefferson County, 4% in Deschutes County, or 8% for Oregon. Madras’ Hispanic/Latino population grew by 146% between 1990 and 2000.
Several other factors justify a higher growth rate in the near term (2005-2026). ● Madras is the least expensive housing market in Central Oregon. Lot prices are
significantly lower in Madras; land is a significant contributor to overall housing prices. Development activity is increasing in Madras and Jefferson County - due in large part to more affordable housing. A proposed 1,700 unit master planned community in Madras provides evidence of this trend. This housing and land price differential will have a measurable impact on population increases in Jefferson County and its communities.
● Development proposals that are under review or have been approved suggest a lot of
development is in the pipeline. For example, in March 2006 when this report was completed, Madras had over 3,000 single-family dwelling lots either platted or in process of submission for platting. Specifically, the east side development for Madras is planned for 1,700 units, plus commercial. A large Portland developer has submitted a proposal for 230 single-family dwelling units in Madras. These data

Page 30
suggest that Madras alone will average 70-75 new single-family dwellings annually in the 2007-2009 period and, more than 100 annually in the 2010-2020 period.
● The Community Impact Study estimates that the prison will have a direct population
impact of 1,582 new persons in Madras. These individuals would be on top of any baseline growth projection.
In summary, rapid employment growth near Madras from the correctional facility, combined with new housing opportunities that have very competitive pricing and options, suggests that growth rates in Jefferson County and its cities will occur in the near term (the next 10 years) at rates higher than recent historical averages. The findings above support the assumed growth rate of 4.5% annually for the 2006-2011 period, of 4.0% for the 2011-2026 period, and of 2.7% annually for the 2026-2056 period. [The population information in the revised Comprehensive Plan acknowledged by the DLCD on June 20, 2003 has been replaced with the above information as the result of passage of Ordinance No. 774 on August 22, 2006.] Labor: The City of Madras is experiencing a period of growth and economic prosperity unparalleled since the construction of the Pelton and Roundbutte dams in the early 1950s. The City serves as the regional center and County seat of Jefferson County. Almost all of the commercial, industrial, and governmental activity in the County takes place within the City and its Urban Growth Boundary. Jefferson County has been recognized as one of the fastest growing counties in the State, and in turn, Madras is the focal point for most of that growth. Recent developments in the City (1998) includes the development of a Bi-Mart retail complex, continued expansion of the Brightwood Enterprise operation and the Keith Foster Manufacturing operations, expansion of the Deschutes Valley Water District office/warehouse complex, and numerous residential subdivisions are currently either under construction or in the review/approval process. The projected nonagricultural employment forecast shown above are county wide and includes the City of Madras. In order to develop a realistic number of jobs in the Madras City Limits and Urban Growth Boundary, it is necessary to refine the information further. The Oregon Employment Department, in its Regional Economic profile dated 1998 provides a reasonable means of accomplishing this. The report shows in 1996 a total non-farm payroll for the county that was estimated at 6,000 jobs. Of those 27 percent were involved in manufacturing, 21 percent were involved in government related jobs, and 52 percent are involved in commercial retail and related activities. By projecting those percentages forward to 1998 a reasonable breakdown of the types of jobs available in the County can be determined. The estimated nonagricultural jobs for Jefferson County, taken from the Office of Economic Analysis table, is 6,843. Of those, 27 percent or 1,848 would be considered manufacturing, 52 percent of that total or 3,558 would be considered commercial retail jobs, and the remainder 21 percent or 1,437 jobs would be

Page 31
considered governmental type employment. The following table summarizes the estimated employment figures for Jefferson County.
EMPLOYMENT TYPE
JOBS
Manufacturing 1,848
Non-manufacturing 3,558
Governmental 1,437
TOTAL 6,843
The two figures that are important are the manufacturing (industrial) and non-manufacturing (commercial) employment totals. From this information, a realistic estimate of job numbers for the City of Madras and its Urban Growth Boundary are developed. It can reasonably be determined that there are over 2,800 (of these, 800 is within the public service employment) jobs in the commercial retail sector, and 1,848 manufacturing jobs in the Madras Urban Growth Boundary. Agriculture: Agriculture is the most important part of the economy of Jefferson County. A total of 356 farms reported by the 1969 agricultural census have a total area of 502,727 acres, about 44 percent of the County's total area. About 16 percent of the farms are under 50 acres in size while another 28 percent have between 50 and 180 acres. About 16 percent of the farms have more than 1,000 acres. The average is above 1,400 acres, due to the presence of large livestock raising operations. The main farms, by type, are field crop or livestock raising. About 20 percent of the farms are unclassified by type. The main crop in 1976 was peppermint, with $12.7 million in gross income. Crops: Wheat, $4.1 million; feed grains, $123,000; hay and silage, $1.4 million; grass and legume seed, $1.7 million; potatoes, $0.85 million; specialty crops, $0.6 million. Total crop income was $21,677.000.

Page 32
Livestock: Cattle, $3.8 million; hogs, $0.2 million; sheep and lambs, $0.36 million, miscellaneous animals and products, $0.12 million. Total livestock income was $4,462,000. Total agricultural income in 1976 was $26,139,000, basing the estimate on average crop yields and projected market prices, assuming all crops will be sold within the normal market year. Manufacturing: An analysis of the manufacturing firms of Jefferson County by industrial classification code, in terms of the number of people employed in each classification, indicates which industries are the major employers. The lumber and wood products industry employs 82 percent of the manufacturing related labor force. Of the employees remaining, 30 percent are employed by the manufacturers of agricultural related machinery, 39 percent by manufacturers of leisure-oriented products (Bramco Boats and Tote-Pac Company), and 31 percent miscellaneous manufacturing. This analysis indicates the dependency of Jefferson County on the economic climate of a few industries. The lumber and wood products industry, the agricultural industry, and tourism and recreation vitally affect the majority of the labor force. Industrial diversification may be a partial solution to this problem.

Page 33
MANUFACTURING FIRMS IN JEFFERSON COUNTY
NAME OF FIRM NUMBER OF STANDARD INDUSTRIAL (by City) EMPLOYEES CLASSIFICATION CODE CULVER Bramco, Inc. 45 3,732*** MADRAS
Bright Wood Corporation 85 2,431* Deschutes Ready-Mix 4 3,295 Evergreen Forest Products 6 2,875 Foster Manufacturing Co., Inc. 24 3,523** Full Circle, Inc. 20 2,875 H & S Custom Cabinets 2 2,434* Keith Manufacturing Company 10 3,523** Madras Pioneer, The 8 2,711 Madras Sash and Door 3 2,431* Meuret Pump and Plow Works 6 3,561 Modoc Leather Manufacturing Co. 5 2,386 Pum-Brik Tile N/A 3,271 Sun Ray Plastics, Inc. 1 3,079 Tompsett-Hogam Manufacturing Co. 15 3,523** Tote Pak Company 18 3,949*** Warm Springs Forest Products 250 2,436* WARM SPRINGS Brunoe Logging, Bruce 7 2,411* Smith Logging Company, Russell 25 2,411* Warm Springs Forest Products 380 2,421* Source: Directory of Oregon Manufacturers, 1976, State Department of Economic
Development.
* Lumber and Wood Products Industries ** The Manufacturing of Agricultural Related Machinery *** Manufacturers of Leisure-Oriented Products

Page 34
CROPS HARVESTED - ACRES 1959, 1965, AND 1969
JEFFERSON COUNTY Crops Harvested 1959 1965 1969 All Corn 262 93 172 Small Grains: Winter Wheat 13,071 17,175 14,637 Spring Wheat 7,995 5,218 4,816 Oats 1,355 269 405 Barley 9,561 6,527 4,788 Rye 127 50 245 Hay Crops: Alfalfa and Alfalfa Mixtures 11,486 9,694 5,964 Clover and Clover/Grass Mixture 727 715 476 Small Grains for Hay 1,983 1,639 1,550 Wild Hay, Cut 2,087 705 -- Other Hay, Cut 790 679 357 Silage - All Kinds 189 1,262 576 Field Seed Crops: Red Clover -- -- 115 Alfalfa Hay -- -- 6 Other Vetch 5 -- -- Other Field Crops 5,742 7,850 -- Vegetables for Sale: 1 105 8,091 Sweet Corn 1 63 -- Snap Beans 0 /1 -- -- Dry Onions -- -- -- Potatoes -- -- 8,091 Berries for Sale: Strawberries 0 /1 5 -- Blackberries -- -- -- Raspberries, Red and Black N/A 0 /1 -- Tree Fruits, Nuts and Grapes 4 0 /1 -- Nursery Products 0 /1 0 /1 -- /1 Reported in small fractions. N/A Not Available Source: U.S. Bureau of the Census, Census of Agriculture, 1969, Vol.1, Area Reports, Part 47,
Oregon, U.S. Government Printing Office, Washington, D.C., 1972.
Page 35
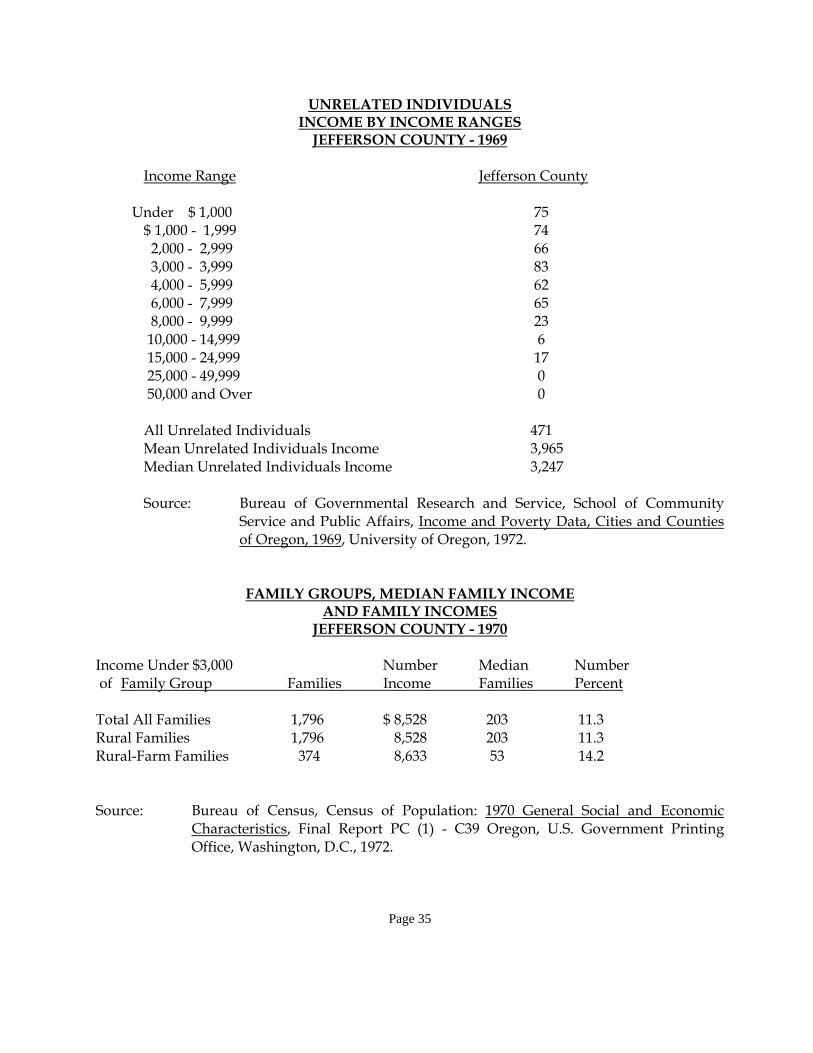
UNRELATED INDIVIDUALS INCOME BY INCOME RANGES
JEFFERSON COUNTY - 1969 Income Range Jefferson County Under $ 1,000 75 $ 1,000 - 1,999 74 2,000 - 2,999 66 3,000 - 3,999 83 4,000 - 5,999 62 6,000 - 7,999 65 8,000 - 9,999 23 10,000 - 14,999 6 15,000 - 24,999 17 25,000 - 49,999 0 50,000 and Over 0 All Unrelated Individuals 471 Mean Unrelated Individuals Income 3,965 Median Unrelated Individuals Income 3,247 Source: Bureau of Governmental Research and Service, School of Community
Service and Public Affairs, Income and Poverty Data, Cities and Counties of Oregon, 1969, University of Oregon, 1972.
FAMILY GROUPS, MEDIAN FAMILY INCOME AND FAMILY INCOMES
JEFFERSON COUNTY - 1970 Income Under $3,000 Number Median Number of Family Group Families Income Families Percent Total All Families 1,796 $ 8,528 203 11.3 Rural Families 1,796 8,528 203 11.3 Rural-Farm Families 374 8,633 53 14.2 Source: Bureau of Census, Census of Population: 1970 General Social and Economic
Characteristics, Final Report PC (1) - C39 Oregon, U.S. Government Printing Office, Washington, D.C., 1972.

Page 36
MEDIAN EARNINGS OF SELECTED OCCUPATION GROUPS
JEFFERSON COUNTY - 1960 AND 1970 Occupation Group 1960 1970 MALE: Total employed 16 years and older 4,341 6,532 Professional, managerial and kindred workers $5,784 $10,174 Farmers and farm managers 4,368 5,594 Craftsmen, foremen, and kindred workers 4,777 7,246 Operatives and kindred workers 4,394 7,084 Farm laborers 2,702 3,467 Laborers, excluding farm and mine 4,250 3,955 FEMALE: Total employed 16 years and older 1,250 2,889 Clerical and kindred workers -- $4,275 Operatives and kindred workers -- 1,773 Source: U.S. Bureau of the Census, Census of Population: 1970 General and Economic
Characteristics, Final Report PC (1) - C39, U.S. Government Printing Office, Washington, D.C., 1972.
MAJOR OCCUPATION GROUP OF EMPLOYED
JEFFERSON COUNTY - 1970 Occupational Group Male Female Professional technician and kindred workers 318 160 Managers and administrator, excluding farm 341 57 Sales workers 187 112 Clerical and kindred workers 376 312 Craftsmen, foremen and kindred workers 407 22 Operatives, excluding transport 357 186 Transport equipment operatives 164 25 Laborers, excluding farm 192 24 Farmers and farm management 299 18 Farm laborers and foremen 250 20 Service workers 440 271 Private household worker 22 22 Source: U.S. Bureau of the Census, Census of Population: 1970 General and Economic
Characteristics, Final Report PC (1) - C39 Oregon, U.S. Government Printing Office, Washington, D.C., 1972.

Page 37
ECONOMIC GROWTH INDICATORS TOURISM: Recreation Facilities Visitors in 1976 Forest Service Parks 318,337 Youth Camps 14,900 Cove Palisades 478,114 (Day) 809,324 (Overnight) Haystack Campgrounds 42,700 TOTAL EMPLOYMENT: Year Employment 1956 2,300 1966 3,540 1976 4,130 MANUFACTURING INCOME GROWTH: Year M. I. G. 1966 $ 2,000,000 1976 $ 8,200,000 RETAIL GROWTH: Year Sales (in thousands) 1958 9,594 1963 16,582 1967 16,611 1974 21,110 1976 28,096 CENTRAL ELECTRIC CO-OP: Year Customers 1948 172 1977 1,280
Most growth has occurred in the past five years due to irrigation pumps.

Page 38
CASCADE NATURAL GAS: Year Customers 1962 171 1977 609 DESCHUTES VALLEY WATER: Year Customers 1948 300 1977 2,000
Deschutes Valley Water has water rights to Opal Springs water. MADRAS CITY WATER: (Supply from two wells) Year Customers 1960 528 1977 679 ROWANS TV CABLE: Year Customers 1977 1,442 In the past two years, sewer systems have been installed in Madras, Culver, and Metolius. Other utility companies include Pacific Power and Light, Pacific Northwest Bell, United Telephone, and North Unit Irrigation District. Tourism: Tourism is also an important part of the economy. All travel from Portland to skiing areas around Bend comes through Madras. The area draws traffic on the Dalles-California Highway and, particularly in the late Spring, Summer, and Fall months through the general deer season, there is a continual stream of recreationists coming to the area to utilize recreational facilities at Lake Simtustus behind Pelton Dam, Lake Billy Chinook behind Round Butte Dam, Haystack Reservoir, etc. The Camp Sherman area, located on the Southwest corner of the county at the headwaters of the Metolius River, is a rapidly developing summer home area. The year around population of the Camp Sherman area is also on a steady rise.

Page 39
The average daily traffic (ADT) on Highway 97 is above the safe capacity of the highway, as determined by the Oregon Highway Division. Capacity of the highway is rated at 6,400 ADT but during July the count is past 9,000 ADT. Highway 26 traffic during the same period is estimated at 4,200 ADT. These figures emphasize the number of people who pass through Jefferson County annually. Rockhounding is an important part of the tourist industry in Jefferson County. Hobbyists by the tens of thousands come to the county, beginning with good weather in the Spring and continuing until late in the Fall, to dig for semi-precious stones, agates, jasper, thundereggs, etc. There are public "digs" located on public lands and many ranchers have opened deposits of desirable rock, managing their holdings on a fee basis. Tourism is one of the most important facets in Oregon's economy, accounting for an estimated $789,000,000 in spending from out-of-state travelers and recreationists in 1975, according to the Division of Motor Vehicles. During the same period, out-of-state tourists spending in Jefferson County was estimated at $8,130,000. Total tourist spending was $20 million. Recreation: In addition to the usual recreational opportunities offered by the school districts, the area is a bonanza for those who prefer outdoor activities. Hunting, fishing, camping, hiking, boating--all are readily available on the thousands of acres of public land in the county. Desert Peaks Golf Course at Madras (9 holes) offers public golfing facilities and annual memberships. Kah-Nee-Ta Resort has a championship caliber 18 hole golf course. Madras desires to add a new 18 hole public golf course to the City’s inventory of recreational opportunities. [Paragraph amended by Ordinance No. 781, Passed by Council on December 12, 2006] Cultural activities are understandably limited because of the size of the population but there is an active Community Concert Association and Central Oregon Community College brings many cultural offerings to the area high schools. Services available in the City of Madras include banking and savings and loan associations, medical facilities including a new hospital with five physicians in residence, and a weekly newspaper. For some time, Madras has been trying to attract additional industrial development utilizing the underdeveloped industrial park lying to the North of the existing City. The site contains approximately 300 acres. It lies adjacent to the Madras Airport, U.S. Highway 26, and is served by a spur from the Oregon Trunk Railroad. The major problem with any future expansion of the industrial park is the development of adequate water supply for fire protection. Development of

Page 40
such a system is the number one priority of the Overall Economic Development Plan for Jefferson County, adopted in 1977. In reviewing the existing commercial and industrial land use in the Madras area, there are approximately fifty-three (53) acres within the existing city limits currently zoned for commercial use. The amount of commercial activity would indicate a much larger population than currently exists. It is assumed the regional nature of the City within Jefferson County is the primary reason. Designation of additional commercial land use areas poses difficult problems due to the linear nature of the existing development. The county and the City must work together closely to insure adequate commercial area is available. The City would also encourage no further commercial activities be allowed outside the adopted Urban Growth Boundary. Housing: In 1998 the City of Madras hired a consultant (Kittelson & Associates) to research and prepare revised sections to the City’s Comprehensive Plan in order to comply with Periodic Review. The original version of this element stated that information was “somewhat limited” concerning the housing stock for the city. In 1998, the consultant wrote, “this element has been extremely difficult to prepare due to the lack of information available. The City and Jefferson County do not have a GIS system on line and most of the information contained in this report has been gathered by hand. City and County records are sketchy at best, thus, the data gathering process has been lengthy and arduous.” Following is the updated information from the consultant. There have been 30 duplex units constructed in the City since 1988. The total acreage of the tax lots, which these units have been constructed total 6.61 acres. A total of four (4) triplexes have been constructed since 1988, which totals 1.14 acres for these four units. Two fourplexes have been constructed in the city since 1988 and the total acreage for these units is .61 acres. There have been eleven (11) apartment complexes built in the City since 1988; and the total acreage is 21.78 acres. There has been a significant amount of subdivision activity in the past 10 years. There were 273 lots created on 97.36 acres for an average lot size of 15,535 square feet. The majority of the subdivisions were created to meet the 7500 square footage minimum in the residential zones.

Page 41
There have been 35 partitions creating 87 parcels or lots out of 214.77 net acres. The average lot size is 2.47 acres per parcel. There are 4 mobile home parks in the City that have existed since the 1950s. Some of the older parks contain predominantly older single-wide units and are at full occupancy. Individual mobile home units within the parks are upgraded from time-to-time. The current housing market in the City is considered very active with numerous listings and sales. There are a number of conclusions, which could be drawn and perhaps what is most clear, is the average housing (middle income) is about $85,000. The low end if $70,000 and anything above $100,000 is considered high end. Low and lower middle-income groups, estimated at 62%, would account for approximately 56% of the new housing stock. Middle and upper income groups, estimated at 31% would account for 34% of the new housing stock and the upper incomes estimated at 7%, account for about 10% of the new housing stock. Multi-family housing has been the most significant type of housing constructed in the Madras area over the last 10 years with 360 new units, not counting duplexes, triplexes, and fourplexes. It is important to note that prior to 1988 and where multi-family housing currently stands in comparison with the total housing stock in the City and its Urban Growth Boundary. Prior to 1988, there were only 114 apartment units available. This was less than 10% of the housing stock at that time. Currently, apartments account for approximately 23% of the housing stock. Thus the percentage of multi-family units has risen significantly when compared to the total housing stock. It is important to also note on a national and statewide scale, multi-family dwelling units normally account for less than 20% of the housing stock. The 1990 Census data indicates, nationwide, in units and structures, that approximately 18% of the housing stock is multi-family (defined as 5 or more units). Therefore, it would appear that Madras currently exceeds the national averages and greatly exceeds the state averages for multi-family housing. It would further appear, that at the City’s current level housing stock is near over saturated with multi-family dwelling units. However, the State requires the City to continue to provide sufficient number of lower income housing units to serve a specific segment of the population including poverty level households, young married couples, and older retired couples. It would be reasonable to assume, based on affordability of a range of housing types in this community and a substantial increase in the multi-family units developed in Madras over the past 10 years that the projected need for multi-family units could be expected to decrease to as low as 28%. This would be equivalent to 664 new units for the planning period and would result in multi-family housing holding a 25% share of the housing stock in the year 2018.

Page 42
• Duplexes, Triplexes, Fourplexes and Mobile Home Parks An additional 7% of land area should be set aside to complete land needs for the low-income groups. Types of developments envisioned this income group would be duplexes, triplexes, fourplexes, and mobile home parks. • Lower End Manufactured and Site Built Dwellings Approximately 27% of the income groups fall into the lower end manufactured and site built dwellings. A smaller lot size of 6,000 square feet for residential development could be utilized. • Middle Income Groups Approximately 20% of the population is considered middle income and which would use middle and upper middle manufactured dwellings and site built homes on 7,500 square feet lot size. • Upper Middle and Higher Middle Income Groups Approximately 10% of the population would fall in this category. Minimum lot size would also be 7,500 square feet. • High End Income Groups Approximately 8% fall out at the income levels at high end following the development pattern established over the last 10 years. Most of the houses are built on larger lots in the Urban Growth Boundary. However, there has been established a need for a small percentage of larger lots to serve a portion of the projected Madras population. It is not reasonable to assume that development will occur with full urban services at greater than ½ acre due to lot development costs and returns per lot to the developer. PUBLIC FACILITIES: The City of Madras has prepared a Public Facilities Plan pursuant to Oregon Administrative Rule 660-011. This Public Facilities Plan is therefore incorporated into the City's Comprehensive Plan by this reference.

Page 43
The City of Madras provides basic public services to its residents. The City maintains the following departments to serve the city: Administration (Finance, Utility Billing, City Clerk), Community Development Department, Police, and Public Works (streets, wastewater treatment facilities, parks, and golf course. The City of Madras fire protection is provided by Jefferson County Fire District. The City's domestic water is supplied by Deschutes Valley Water District. The existing three (3) wells is utilized only for summer lawn irrigation. Wells No.1 and No. 2 are located North of the City and are approximately 250 feet apart. Well No. 1 was redrilled adjacent to the existing well house. The existing Well No. 1 was drilled in 1912; static water level in the well is 330 feet below the surface and drawdown is to approximately 380 feet when pumping at a rate of 150 gpm. Well No. 2 was drilled in 1966 to a depth of 450 feet, and produces 400 gpm, is 16" and 12" diameter cased throughout with perforated casing in the bottom section. The static water level is 330 feet and a 40 foot drawdown. Both wells discharge through a 6" diameter steel pipe to a sandtrap. From the sandtrap the well water is discharged through a 5" diameter pipe directly into an 8" diameter steel transmission pipe main line and hence into the City. A third well to augment the City's supply is located near the City shops. It was drilled in 1972 to a depth of 477 feet, produces 300 gpm, is 16" and 12" steel casing with perforated casing in the bottom section. The water is discharged directly into the City distribution system. The City no longer obtains its water from the North Unit Irrigation District's main canal. Deschutes Valley Water District. Deschutes Valley Water District was formed in 1919 from a private water system, Jefferson Water Company. This private company could not achieve a profitable return, so they chartered the District we have today under Oregon Revised Statutes, Chapter 264. The signatures on the original charter are a “who’s who” of the pioneers of the Culver and Metolius area. The original service area included the City of Culver, the City of Metolius, and the surrounding agricultural areas from south of Juniper Butte to the north end of Metolius. The distribution of water throughout the rural area was not feasible in the 1920's because of the sparse population. Instead, the District installed a wooden mainline to a standpipe in the City of Culver. There, residents from outlying areas could fill tanks to transport home. A single 3" pipeline also served the City of Metolius and its outlying areas. With the formation and completion of the North Unit Irrigation project the Culver/Metolius and Madras areas were broken into 80 to 160 acre parcels and a massive influx of farmers began in the mid 1940's. This sudden population growth required the District to install many new mainlines to distribute domestic water to many of the newly formed farms. During this same period, the area north of Madras, called The Plains, formed a water district to accomplish the same tasks in the area.

Page 44
In 1948, the Plains Water District and Deschutes Valley Water District merged to form the approximate district boundaries that are in existence today. The conveyance of water over such a great distance (23.6 miles), presented many problems which required long District Board meetings to solve. The District has been fortunate to have faithful and responsible Board members over the years. For many years, the District strived and strained within its budget at times, to deliver water to each service with undersized and leaky mainlines. The most important milestone in the District’s history was the purchase of Opal Springs in 1958. In 1985, the District’s hydro-electric plant was completed near Opal “Springs. Since then, revenues from that plant have paid annual principal and interest on two water bonds for a savings of over $4 million in property taxes. Hydro-electric revenues also financed approximately $6 million of new construction. The District levies no taxes and has no plans to levy taxes in the future, thanks to the hydro-electric revenue. The District has not had to issue new bonds, water rates have been raised in nine years, and new service hook-up fees have remained at $600 since 1985, this is largely due to the hydro-electric revenue. Studies are being conducted to determine how much water rates and hook-up fees should be raised. This should be accomplished before the large infusion of new customers in the next couple of years. The new pump house and transmission mainline are expensive projects that would not be necessary if the population did not increase; new customers should bear a reasonable portion of the new development costs. Deschutes Valley Water District revised its “Master Plan” in December, 2000, in an effort to plan for the future growth of the water district for the next 20 years. The District’s first “Master Plan” was completed in May of 1991 and has served as a planning tool. A major change to the District’s source of supply is the addition of three (3) new wells in the vicinity of Opal Springs. The wells range in depth from 513 feet to 750 feet deep. The artesean free flow from the wells is 3750 gpm (gallons per minute), 5360 gpm, and 4000 gpm. Those improvements and extensions as outlined in earlier Master Plans have been developed over the years. New construction is generally done by the water district’s employees. In 2000, a 201,000 gallon reservoir was built near Jaricho Lane. This reservoir doubled the previous storage while replacing an aged and leaking concrete reservoir. The foundation and piping was constructed by district personnel. Deschutes Valley Water District has in its Master Plan a policy, which addresses “cross connection”. The purpose of this policy is to protect the water supply of Deschutes Valley Water District from contamination or pollution due to any existing or potential cross connection. For more information see Page 11 of the District’s revised “Master Plan” year 2000. There is map information within the Master Plan, starting with page 10.

Page 45
SOURCE OF SUPPLY The Opal Springs aquifer is the sole source of supply of domestic water for Deschutes Valley Water District (approximately 3600 services). The District also supplies water to the City of Madras water system, which has about 850 services. The artesian spring and three artesian wells are located 5 miles southwest of Culver at the bottom of the 850 foot deep Crooked River canyon, less than 150 feet from the river. Opal Springs flows approximately 108,000 gallons per minute at 53.8 degrees Fahrenheit with no seasonal variation. There has been no detectable change in flow, temperature, or pH since the spring was first tested in 1925. Beginning in 1997, the District drilled three production wells all within 750 feet of Opal Springs. These wells were the result of an investigation into how to increase flow capture from Opal Springs. Even though there are massive amounts of water erupting from the Opal Springs vicinity, the sheet wall containment system capturing water from the pumphouse was proving marginal at peak pumping demand. Numerous alternatives were investigated by Dave Newton & Associates and weighed by the District Board. An initial 12" test well was drilled at 500 feet, which produced static pressure of 48 psi and a free flow of over 4000 gpm. Since then, two more 16" wells were drilled with comparable artesian pressures and free flows of 5360 gpm and 4000 gpm. The three recently drilled artesian wells have proven to be a highly advantageous venture for the District. The existing pumps have an expanded capacity due to the inlet pressure going from 3 psi to about 43 psi (depending on how many pumps are running). Pumping costs out of the canyon are also reduced by about 10%. Another benefit is the more controlled capture of the water without risk from external contamination. The Oregon Water Resources Department has determined that the well water and Opal Springs water come from the same aquifer. This has been determined geologically, from water quality testing comparisons and flow test results. The quality of Opal Springs water is outstanding. This is especially evident when the Crooked River is flowing at spring run-off. Opal Springs flows into the muddy river as a clear bluish streak. The contrast makes a strong visual impact. No volatile organic or synthetic compounds (herbicides or pesticides) have been detected by water testing. Various healthful inorganic compounds or minerals are found in the water. Excessive amounts of these minerals could be harmful, but they are far below the maximum allowable concentrations. Groundwater Study, the USGS had some water age analysis done. According to “USGS Report 97-197", the water could be as old as 1000 to 4000 years old. However old the Opal Springs aquifer is, it is not a typical aquifer. An analysis for waterborne particulates shows conclusively that Opal Springs is a groundwater source, not influenced by surface water.

Page 46
Currently, there is no infiltration or treatment of Opal Springs of any kind, nor is any needed. The only chlorination being done is on a very limited basis to the District’s reservoirs. The District’s distribution system North of the Metolius Reservoirs has a very low chlorine residual ranging from 0.01 ppm to 0.03 ppm. This is a preventative amount of chlorine that is designed to keep coliforms from building up in the system. There are three bottling plants in Culver bottling Opal Springs water. The taste, clarity, and purity of Opal Springs water makes it a popular bottled product. The initial water-rights to the Opal Springs area were for 3.0 cubic feet per second (cfs) or 1346 gallons per minute (gpm). The initial priority date is September 5, 1918. The current water-rights are not to exceed 25.71 cfs. If all the pumps in the pumphouse and turbine house were activated, 17.269 cfs (7750 gpm) would be withdrawn from the Opal Springs aquifer. This is only 7.2% of the total spring flow. Currently, the District is working on expanding the water-rights by 20 cfs for the next 20 years. The following table (Future Projects and Timing) lists the future projects and the timing of their construction, which have been determined by Deschutes Valley Water District to be needed for the next 20 years. Immediately following this table, is a narrative for each future project, and its general location.
FUTURE PROJECTS AND TIMING TIMING PROJECT 0-5 years 24" Transmission main, and preparation 3,000,000 gallon Reservoir at Round Butte, along with site preparation, and
foundation 2,000,000 gallon Reservoir at Metolius site, along with site preparation 400 feet of 2" Galvanized - Plum Street 4,300 feet of 6" PVC - Lee Street to Jefferson Street; Lee Street along Hwy 26 to
Hoffy's and Juniper Motel 6 - 20 years 16" mainline from Metolius Reservoirs 3,000,000 gallon Reservoir at the main Reservoir Site 24" Discharge mainline from Opal Springs Provided by Deschutes Valley Water District Master Plan, December 2000 • 24"Transmission Mainline This mainline has a direct mitigating effect on the Metolius reservoir inlet pressure and available flow into the reservoirs. This project would allow all pipelines between the Main Reservoirs and the Metolius Reservoirs to have flow velocities within reasonable limits (less than 5 feet per

Page 47
second, even at peak hourly flow). Pressures throughout the District’s pipeline network would also be maintained at sufficient levels until well after 2020. This transmission main is from the main reservoirs to Madras (Green Drive, Feather Drive, and Belmont Lane), which is approximately 16.5 miles in length. The current estimated cost for this project is $7,000,000. Routing this mainline from the Main Tanks to Round Butte and then to Madras gains the District several advantages. A bore of Hwy. 97 is avoided along with avoiding the previous routes of 8", 14" and 20" transmission mainlines. More area is available for storage on Round Butte. The Metolius Tank site will be crowded by the time another 3 MG reservoir is added in 2006. Water would be available along the new route. In general, the reliability of the District’s system is improved if the new storage and the new mainline are away from the traditional corridor. • 3,000,000 Gallon Reservoir at Round Butte This reservoir will be constructed in conjunction with the proposed 24" Transmission Mainline. This reservoir is not to be confused with the pre-existing 110,000 gallon tank on Round Butte. The pre-existing tank has a hydraulic elevation of 3,079 feet and is for a boosted area serving 46 residences. The proposed 3 MG reservoir would have a hydraulic elevation of 2740 feet, which is the same as the Metolius Tanks. The Metolius Tanks and the proposed 3 MG Round Butte Tank would serve the largest population concentration of the District, which is the City of Madras and its outlying areas. The current estimate for construction of this project is $900,000. • 2,000,000 Gallon Reservoir at Metolius Site This storage needs to be added depending on population growth, which will be highly dependent on the new state prison and its progress. The additional land for this reservoir has already been procured. This project has been delayed due to the proposed 3 MG reservoir on Round Butte. Also, the telemetry has been upgraded and in line meters added to the Metolius Tank Site. This has allowed more efficient use of the reservoirs by adjusting the pressure reducing/sustaining valves on the inlet side of the reservoirs. The current estimate for construction of this project is $670,000. • 16" Mainline to East side of Madras This mainline will be dependent on the population growth. This mainline would begin at the new Metolius Tank and continue for 5 miles to the east side of Madras in the vicinity of “J” Street and Grizzly Road. Future growth around Madras will be concentrated on the east side, according to the City and County Comprehensive Land Use Plans. The current estimate for construction of this project is $500,000.
Page 48
• Main Reservoir Additional Storage Another 3 million gallons of storage will be needed at the Main Reservoir site. This project is essentially for pure storage, for the whole district due to projected use by that time period. The current estimate for construction of this project is $1,000,000. • 24" Discharge Mainline from Opal Springs Pumphouse to Canyon Rim This project will be required to increase capacity from the pumping facility to the Main Reservoirs and the distribution system. The capacity of the existing 12" and 20" discharge lines is 10,000 gpm. Based on median population growth, the average daily pumping rate required for 2005 will be 6320 gpm; for 2020, the required rate will be 11,450 gpm. No cost estimate has been calculated for this future project. Wastewater System: The City's wastewater collection and treatment system was completed in 1975. In 1996, a “Wastewater Master Plan” was developed to outline and to provide a long-range plan of the wastewater system improvement needs to meet the growing demand for sewer services. The Master Plan includes an evaluation of the existing wastewater system including collection, pumping and treatment, projects future needs for expansion, develop alternative conceptual layouts of the wastewater collection system improvements, perform screening of treatment alternatives and develop conceptual layout plans, prepare order-of-magnitude costs estimates for alternative comparison, and address effluent and sludge disposal issues. Alternative systems for waste treatment and effluent disposal to provide Madras with wastewater treatment for present flows and to permit continued growth are presented below. Future improvement to the wastewater system are outlined in the following table with a narrative for each phase following.

Page 49
FUTURE PROJECT AND TIMING TIMING PHASE PROJECT PROJECT DEFINED
0-5 years Phase I Alternative 'B' Sewer System
Improvements
'B' Street PS Upgrade Upgrade of Existing NWWTP (Airport) New SWWTP PS at 'B' Street New 0.5 mgd Sequencing Influent Pump Station
SBR units Chlorine Disinfection Aerobic Digestion Sludge Drying Beds
Off-site Level II Effluent Storage Effluent Distrib. Pumps 1 mile 6" Effluent FM 0.5 mgd Off-site Storage Lagoon
Irrigation of privately owned land 6-10 years
Phase II Alternative 'B' Sewer System Improvements
Upgrade SWWTP PS at 'B' Street Add 0.5 mgd Sequencing Batch Reactor
DEQ Influent Pump Station Upgrade 0.5 mgd SBR units 0.5 mgd Chlorine Disinfection Additional Aerobic Digestion Additional Sludge Drying Beds
Off-site Level II Effluent Storage Added Effluent Distrib. Pumps 2nd 1 mi. 6" Effluent Forcemain 2nd 0.5 mgd Off-site Storage Lagoon
Irrigation of privately owned land 11-20 years
Phase III
Alternative 'B' Sewer System Improvements
Upgrade SWWTP PS at 'B' Street Add 0.5 mgd Sequencing Batch Reactor
DEQ Influent Pump Station Upgrade 0.5 mgd SBR units 0.5 mgd Chlorine Disinfection Additional Aerobic Digestion Additional Sludge Drying Beds
Off-site Level II Effluent Storage Added Effluent Distrib. Pumps 3rd 1 mi. 6" Effluent Forcemain 3rd 0.5 mgd Off-site Storage Lagoon
Irrigation of privately owned land Information provided in the City of Madras Wastewater System Master Plan, dated November 15, 1996

Page 50
The components in the above table were sized for incremental construction of a total of 2.0 mgd wastewater treatment and collection system capacity in 0.5 mgd increments as dictated by the growth. Alternative 'B' is the wastewater from the southeast area, which will flow by gravity into the new treatment plant. Flows from the rest of the area will be collected into a new or expanded pump station at the existing "B" Street Pump Station. The collected wastewater will then be pumped separately to the North and South treatment plants. The industrial area flows will be pumped into the existing 10-inch forcemain. Alternative 'B' will require no pump station to be constructed. Flows from the southeast area will be collected by gravity to the South Treatment Plant. The master plan's projected cost for the complete build-out of Phase I, II, and III is $17,400,000.
Phase I North Area Proposed Wastewater Collection System - none noted in the Master Plan for the area labeled as "north area" (figure 5-2A). Central Area Proposed Wastewater Collection System - North end of Kinkade Road where it turns east into 'A' Street, follow 'A' Street until you turn north on Juniper Street; Loucks Road going east crossing over Highway 97 onto Jefferson Street, turn north onto 7th Street off of Jefferson Street and continue north to Polk Street; Highway 97 turn onto Chestnut St and go north onto 10th Street onto Loucks Road. South Area Proposed Wastewater Collection System - going north from the Treatment Plant site to Grizzly Lane, continuing past the intersection of Kinkade Road and Grizzly Lane; from where the line begins from the Treatment Plant Site going north, swings west toward McTaggart Road, crossing over the road to the "ponds" continuing south west for approximately 1200 feet and then west for 1600 feet ending at Adams Street.
Phase II North Area Proposed Wastewater Collection System - none noted in the Master Plan for the area labeled as "north area" (figure 5-2A). Central Area Proposed Wastewater Collection System - Starting at Kinkade Road, where it intersects with Grizzly Road, going north to 'E' Street, continuing east on 'E' Street to Claremont Drive and then north on Claremont Drive to Ashwood Road. Starting at the south end of Bean Drive, on Ashwood Road going east for 1200 feet, and then northwest for 1600 feet, north for 2000 feet, and then northwest for 800 feet, which will connect with a line placed during Phase I. Starting at the intersection of Hwy 97 and Cedar Street going southwest to the intersection of Hwy 26, going south 200 feet, then west for 300 feet, turning south for 500 feet to Pine Street,

Page 51
west on Pine Street for 200 feet and then south for 800 feet to 'B' Street and then west for 700 feet to intersection of 1st Street and 'B' Street. South Area Proposed Wastewater Collection System - Starting at the Treatment Plant Site's northeast corner of new line placed during Phase I for 400 feet and then north for 300 feet, turning northwest for 600 feet. Starting at the above 400 feet going east for 600 feet to Grizzly Road and then north for 800 feet.
Phase III North Area Proposed Wastewater Collection System - Starting at Adams Drive located between Harris Street and "No Name Road" off of Cherry Lane. This area is approximately 4400 feet in length. Central Area Proposed Wastewater Collection System - Starts at the west end of 'B' Street where it intersects with 1st Street, going south for 1200 feet and then southwest for 800 feet. South Area Proposed Wastewater Collection System - Starts on Adams Street 300 feet north of S.E. Dimick Lane, continues on S.E. Dimick Lane for 1300 feet, continuing east for approximately 300 feet, going southwest for 300 feet, turning south for 1300 feet. Starting at Treatment Plant Site going southwest for approximately 4200 feet. Running south on Culver Highway where it intersects with Fairgrounds Road, going east for 400 feet, turning south for 400 feet and then southwest for 500 feet.
Wastewater Treatment and Effluent Disposal Treatment and disposal of wastewater is regulated by the Oregon Department of Environmental Quality (DEQ). Wastewater treatment plants must provide a minimum of secondary treatment in most cases, and higher levels of treatment where required by DEQ in order to protect the environment. Depending on whether the effluent from a wastewater treatment plant is discharged into a receiving water body or is disposed of by reuse, DEQ issues each wastewater treatment plant a National Pollutant Discharge Elimination System permit or a Water Pollution Control Facility permit which establishes the treatment parameters to which the system must be operated. The permits are periodically renewed about every five (5) years. The existing Madras wastewater treatment system treats raw wastewater in facultative lagoons, stores it during the winter “non-irrigation” months, and then polishes stored wastewater together with the current lagoon effluent to Oregon DEQ Level IV quality standards for spray irrigation on a nearby golf course, Desert Peaks Golf Course. Madras currently has more wastewater effluent than the Desert Peaks Golf Course can accommodate. The City has secured additional publicly owned property for the land application of this treated effluent on the east side of Madras. This land is adjacent to both the enlarged treatment and storage ponds which are either recently constructed or under construction at this time. The most efficient

Page 52
methodology for this form of effluent treatment is application on a golf course, which has a high evaporation rate. The City has included this management practice in its effluent management plan filed with and approved by the Oregon Department of Environmental Quality. Irrigating this treated and stored effluent on additional golf course land compliments the millions of dollars invested by the City and is consistent with the City’s waste water management plan and practices. [Paragraph amended by Ordinance No. 781, Passed by Council on December 12, 2006] Treatment Requirements Treatment requirements depend on whether effluent is discharged to a receiving body of water or disposed of by re-use, generally irrigation. The requirements for treatment prior to discharge or re-use determine the type of wastewater treatment plant a community must construct and operate. The City of Madras currently disposes of wastewater effluent by reclaimed water re-use (irrigation) and will likely continue to utilize this form of disposal in the future. Several levels of treatment are established as adequate for re-use depending on what use is made of the reclaimed wastewater and how much human contact is involved in that use. The following table shows the DEQ treatment level classifications for reclaimed water. Category Level I Level II Level III Level IV
Biological Treatment X X X X
Disinfection X X X
Clarification X
Coagulation X
Filtration X
Total Coliform(organisms/ 100ml) Two consecutive samples
N/L 240.00 N/L N/L
7- day Median N/L 23.00 2.20 2.20
Maximum N/L N/L 23.00 23.00
Sampling Frequency N/R 1 per 3 per 1 per day
Turbidy (NTU)
24-hour Mean N/L N/L N/L 2.00
5% of time during 24-hour N/L N/L N/L 5.00
Sampling Frequency Hourly

Page 53
Level I treatment consists of biological treatment where bacterial or biochemical reactions are promoted to produce an oxidized wastewater. The existing lagoon system without the disinfection and sand-float units would qualify as Level I. Level II treatment consists of biological treatment plus disinfection and is equivalent to “secondary” treatment. The existing lagoon system without the Sand-Float unit would qualify as Level II. Level III treatment is the same as Level II except that special disinfection procedures are required to produce additional coliform reductions. The existing plant most likely does not meet the Level III criteria. Level IV treatment consists of Level II treatment plus clarification, coagulation, and filtration. The existing Madras plant produces Level IV effluent when the Sand-Float unit is operated. Madras currently must treat its wastewater effluent to Level IV because it is used to irrigate the golf course. Also evident is that less costly Level II quality effluent can be used as reclaimed water with certain restrictions. GENERAL Level I Level II Level III Level IV
Public access Prevented (fences, gates, locks)
Controlled (signs, rural or non-public lands)
Controlled (signs, rural or non-public lands)
No direct public contact during irrigation
Buffers for Irrigation
Surface: 10 ft. Spray: site
Surface: 10 ft. Spray 70 ft.
10 ft. None required
Agricultural
Food crops N/A N/A N/A Unrestricted
Processed foodcrops N/A 1 1 Unrestricted
Fodder, Fiber, and seed crops
3 1 1 Unrestricted
Pasture for animals
N/A 4 4 Unrestricted
Sod N/A 1 1 Unrestricted
Ornamental Nursery Stock
N/A 1 1 Unrestricted
Parks, play-grounds, school yards
N/A N/A N/A 5,6
Golf courses w/o contiguous
N/A 5,7 5,7 5,6

Page 54
1. OSHD recommends no irrigation for 3 days before harvesting. 2. Surface irrigation where crops do not touch ground. Fruit and nuts shall not be harvested off
the ground. 3. Department may permit spray irrigation if aerosols are not an issue. OSHD recommends no
irrigation for 30 days before harvest. 4. Surface or spray irrigation; no animals shall be on the pasture during irrigation. 5. Warning signs required. 6. Reclaimed water applied so as not to be applied where food is prepared or served. 7. Reclaimed water applied so as not to be applied within 100 feet of where food is prepared or
served. Discharge to Surface Water Madras is located in the Deschutes Basin, and discharge to surface water would be to a tributary of the Deschutes River, a stream, which is highly prized for its fishery and classified as water quality limited. Madras currently has no “waste load allocation” for discharge to the Deschutes or its tributaries, and an action of the Oregon Environmental Quality Commission supported by extensive water quality studies will be required to obtain a “waste load allocation”. According to Oregon Administrative Rule, Chapter 340-41-565, water quality standards may not be exceeded for the Deschutes Basin streams as follows: No wastes shall be discharged and no activities shall be conducted which either alone or in combination with other wastes or activities will cause violation of the following standards in the Deschutes River Basin: 1. Dissolved oxygen concentrations not less than 90% of saturation at the seasonal low or
not less than 95% of saturation in spawning areas during spawning, incubation, hatching, and fry stages of salmon fishes.
2. No measurable increase in temperature outside of the assigned mixing zone, as measured
relative to a control point immediately upstream from a discharge when stream temperatures are 58 degrees F or greater; or more than 0.5 degrees F when receiving waters are 57.5degrees F or less; or more than 2 degrees F when stream temperatures are 56 degrees F or less.

Page 55
3. No more than 10% cumulative increase in natural stream turbidity shall be allowed as measured relative to a control point immediately upstream of the turbidity causing activity.
4. pH values shall not fall outside of the 6.5-8.5 range. 5. Bacteria from fecal sources and enterococci groups: a geometric mean of less than 33
enterococci per 100 ml based on at least 5 samples collected over 30 days. Several additional parameters are also included prohibiting the discharge of wastes causing condition deleterious to fish, aquatic life, or interfering with beneficial use of the streams. Oregon Administrative Rule, Chapter 340-41-575 sets forth “Minimum Design Criteria for Treatment and Control of Wastes” in the Deschutes. The following effluent quality is required, depending where in the river system discharge occurs. Deschutes River Effluent Quality Requirements above Pelton, Deschutes River Basin Bend Diversion Dam to Pelton Re-regulating Dam Apr.-Oct. Low Stream Flow BOD5 - mg/1 SS - mg/1
<= 10 mg/1 <= 10 mg/1
Nov.-Mar. High Stream Flow Secondary Treatment
Dilution BOD mg/1/Dilution Factor<1
CL2 Residual 1 ppm after 60 min. contact time
Bypassing Positive protection from bypass
Deschutes River Effluent Quality Requirements Below Pelton, Deschutes River Basin Below Pelton Re-regulating Dam Apr.-Oct. Low Stream Flow BOD5 - mg/1 SS - mg/1
<= 20 mg/1 <= 20 mg/1
Nov.-Mar. High Streamflow Secondary Treatment
Dilution BOD mg/1/Dilution Factor<1
CL2 Residual 1 ppm after 60 min. contact time
Bypassing Positive protection from bypass

Page 56
Sludge Disposal Requirements In order to continue applying treated sewage sludge to the land, it is necessary to sample the sludge and track the cumulative amounts of the 10 pollutants applied to the site if continued utilization of a sludge disposal site is to be allowed. The pollutant limits presented below shall not be exceeded in applying bulk sewage sludge to the land disposal site subsequent to July 20, 1993. Pollutant Table 1
Ceiling Conc. Mg/kg
Table 2 Cum. Loading total kg/hectare
Table 3 Pollutant Conc. Monthly Ave mg/kg
Table 4 Annual loading rate kg/hectare/yr
Arsenic 75.00 41.00 41.00 2.0
Cadmium 85.00 39.00 39.00 1.9
Chromium 3000.00 3000.00 1200.00 150.00
Copper 4300.00 1500.00 150.00 75.00
Lead 840.00 30.00 300.00 15.00
Mercury 57.00 17.00 17.00 0.85
Molybdenum 75.00 18.00 18.00 0.90
Nickel 420.00 420.00 420.00 21.00
Selenium 100.00 100.00 36.00 5.0
Zinc 7500.00 2800.00 2800.00 140.00
Notice must be given to DEQ prior to applying sludge to the land on or after July 20, 1993. The notice must include: 1. The location of the land application site; 2. The name, address, telephone number, and NPDES permit # of the sludge applicator. The monitoring, reporting, and record keeping requirements of the Standard must be met. Bulk sludge must not be applied to a frozen, snow covered, or flooded site; nor within 10 meters (32.81 feet) from a surface water body. Sludge must be applied at or below the rate to provide nitrogen for the cover crop and limit the amount of nitrogen passing through the root zone to groundwater (Agronomic Rate).

Page 57
The sludge must meet Class A or Class B Pathogen Requirements, and must be treated with additional vector attraction reduction measures prior to being disposed of on the land. If Class B sludge is produced, additional restrictions must be placed on use of and access to the disposal site. In order to reliably be classified as Class B sludge relative to pathogens it must be treated by one of the listed processes in Appendix B of Part 503, which include: 1. Aerobic digestion for 40 days at a temperature of 20 degrees Celsius or 60 days at a
temperature of 15 degrees Celsius. 2. Air drying on drying beds for three (3) months above 0 degrees Celsius. 3. Anaerobic digestion for 15 days at 35 to 55 degrees Celsius or for 60 days at 20 degrees
Celsius. 4. Lime stabilized to raise its pH to 12 after two (2) hours of contact. In order to meet the vector attraction reduction requirements the sludge must also be treated to meet one of the following: 1. Reduce the mass of volatile solids in the sludge by a minimum of 38% by aerobic or
anaerobic digestion. 2. Reduce the specific oxygen uptake rate in an aerobic process to less than or equal to 1.5
mg of Oxygen per hour per gram of total dry solids. 3. Aerobically treat the sludge at a temperature higher than 40 degrees Celsius and
averaging higher than 45 degrees Celsius for 14 days or longer. The revised “Master Plan” was adopted by the Council in 1996, after which they purchased a 75-acre parcel at the proposed treatment plant location south of future ”J” Street, between McTaggart Road and Grizzly Road. The site is divided into east and west sections by Willow Creek, which flows through the middle. The area along the Creek within the floodway can not be infringed on by any structures or fills. In addition, structures of treatment facilities should not be located within the 100-year flood in order to avoid carrying flood insurance and possible flood damage. The proposed treatment plant will be located at the southeast corner of the parcel for ease of access from Grizzly Road and away from the 100-year flood. The remaining area could be used for building effluent storage lagoons to satisfy part of the storage requirements. Additional land will still be needed for effluent storage. The remaining area can be used for the construction of an emergency storage lagoon and wetlands.

Page 58
The approved “wastewater system master plan” is part of the City’s Comprehensive Plan, adopted by reference and is available at City of Madras City Hall. STORM WATER DRAINAGE Management of storm water drainage serves several important purposes. One of the most obvious reasons for controlling storm water is to prevent or minimize localized flooding, which can occur where adequate drainage has not been provided. Another function of storm water control is to minimize the chance of water accumulating in the roadway and creating traffic hazards. Good drainage of streets will greatly increase pavement life. Moisture penetration of pavement is one of the leading causes of premature road surface failures. The “Storm Drainage Capital Improvement Plan” was prepared using the best available information regarding existing conditions and historical events, as well as projections of storm water flows from future construction. An attempt has been made to evaluate the entire City as a whole, since an impact such as a major change in run off characteristics due to development in one area will have significant effects downstream. Existing drainage patterns were used when considering the proposed projects so that water would follow its natural course as much as possible. Both observed drainage flows, as well as interpretations from U.S.G.S. contour maps were included in system design. This plan is not a definitive document but is intended to provide a basic framework for planning and establishing guidelines for future development. The list of projects as well as the estimates of cost should be reviewed and revised as changing conditions and the needs of the City may dictate. Projects and Estimates of Cost Projects as described in this plan were developed in conjunction with the City of Madras Storm Drainage System Map on file at the Madras Public Works Department. Each project listed includes a naturally defined segment of the overall system, which serves a specific area. The estimate of cost for each project reflects the cost of the entire segment. It is not proposed that the eventual construction of the system will exactly follow the order on the list or even the total segment. It may be desirable to construct only a small portion of any given project at any given point in time. What may be of most value is consideration of the system as a whole and where the most critical needs may be. For instance, it may be most effective to concentrate on the downstream end of a drainage when development occurs at the upstream end of the system. Increased flows from the upper end of the drainage will surely arrive at the lower end and may cause problems if adequate allowance has not been provided. Also, when road resurfacing or rehabilitation work

Page 59
is considered, it might well be most cost effective to construct that portion of the drainage facility scheduled for the location even though the rest of the segment may not be scheduled until some future date. Another consideration would be where a road or driveway is to be constructed across a drainage. Careful adherence to the design of the proposed system facilities for such a crossing will assure future facilities will mesh and problems will be minimized. Estimate of costs are in 1991 dollars and reflect total project construction costs including materials, labor, and equipment but do not include engineering or overhead costs, which may apply. The estimates are included as a planning tool for cost benefit analysis and to allow for equitable apportionment of Systems Development Charges based on the affect of any one project on the system as a whole. The storm system as proposed, would serve the needs of existing streets and drainages at projected build-out. New streets and developments would require their own drainage systems, which would then tie into the proposed system. Credits for storm water facilities Systems Development Charges constructed with a project should be allowed only when those facilities constructed have been identified in this plan as it may be amended. Projects The following storm drain projects and their timing, correspond to the City of Madras Storm Drainage System Map on file at the Madras Public Works Department.

Page 60
TIMING PROJECT 0-5 years "I" Street "H" Street 7th Street 7th and Oak Street 7th and 8th Streets North Henry Street Roosevelt Street Marshall and "H" Street Buff Street West 6-20 years 8th Street 1st Street 5th Street "J" Street 6th Street 2nd Street Celilo, Bard and S.E. storm drain Fairgrounds Road and Hwy 97S Marie, Olive and Fairgrounds West 10th Street South including Glen Street "D" Street 16th Street and "A" Street Hwy 97 North Extension Lincoln and Madison Buff Street East Highway 361 - Ruby to Madison
"I" Street Storm Drain proposed to be located approximately 350 feet between Wade and
Turner Streets for an estimated cost of $7,150. "H" Street is proposed to have a storm drain placed approximately 400 feet between
Commerce and Turner Streets for an estimated cost of $7,210. 7th Street storm drain is proposed to be located at the intersection of Buff Street for an
estimated cost of $3,072. 7th and Oak Streets proposed storm drain is at the intersection for an estimated cost of
$10,747. 7th and 8th Streets North between Ebert and Turner Streets for an estimated cost of
$10,080.

Page 61
Henry Street storm drain proposed for placement between 8th and 10th Streets for an
estimated cost of $11,417. Roosevelt proposal is placed at the intersection of "G" Street for an estimated cost of
$4,740. Marshall and "H" Street storm drain placement at intersection for an estimated cost of
$4,940. Buff Street west for an approximate distance of 1100 feet for estimated cost of $10,880.
8th Street improvement at the intersection of Buff Street for an estimated cost of $28,940.
1st Street storm drain at the intersection of Hwy 97 for an estimated cost of $28,253.
5th Street storm drain extension intersects with Buff Street for an estimated cost of
$26,225. "J" Street proposal is between 2nd and 4th Street for approximately 400 feet for an
estimated $11,350. 6th Street proposal is at the intersection of Buff Street for an estimated $24,320.
2nd Street proposal is for an approximate distance of 950 feet south and then extending
another 550 feet to Hwy 97 for an estimated $169,330. Celilo, Bard and S.E. proposal for an approximate 1200 feet for an estimated $62,264.
Fairgrounds Road and Hwy 97 proposal for an approximate 1400 feet for an estimated
$14,220. Marie, Olive and Fairgrounds West proposal for an approximate 400 feet on each street
for an estimated $43,380. 10th Street south including Glen Street for a distance of 550 feet for an estimated $64,317.
"D" Street East for a distance of 850 feet for an estimated $29,758.
16th Street and "A" Street for a distance of approximately 300 feet for an estimated
$38,670. Hwy 97 north extension for an approximate distance of 1100 feet for an estimated
$12,550.

Page 62
Lincoln and Madison proposal for an approximate distance of 525 feet for an estimated $12,550.
Buff Street East for an approximate 575 feet for an estimated $21,365.
Highway 361 - Ruby to Madison for an approximate distance of 100 feet between the
streets for an estimated $67,352. Costs of Drainage Systems and System Development Charges In order to equitably apportion costs to new development, System Development Charges are proposed for all new construction. Since costs will vary with time, and the needs and conditions of the city will change, it is proposed that System Development Charges for drainage be established by resolution to permit more flexible adjustments in charges to coincide with the current conditions reflected in this document as it may be amended. Since the estimate of costs to construct the storm drainage system is $746,745.00, the population figures for the City of Madras in 1991 was 3,443 and the average number of occupants per residence was 2.43, and assuming there were approximately 1,417 single family dwelling units, the cost of the system improvements is divided by the number of single family dwelling units, we arrive at a cost per single family residence for drainage improvements of $526.99. It is reasonable to assume that since the residents of Madras have already constructed houses, parking lots, and other surfaces that increase storm water runoff above that of natural soils, that only future construction of such facilities will have a significant impact in increasing storm water flows above existing conditions. It is therefore proposed that System Development Charges for storm drainage be assessed to new construction to contribute to the financing of the capital improvements required. Using the premise that an average single family dwelling may have a total of 3,000 square feet of impervious surfaces, we can use 3,000 square feet as a basis for estimating residential drainage equivalents or the amount of additional runoff expected from the construction of a house and appurtenant facilities. Since there are some existing drainage problems within the City and there is always the possibility of obtaining grants and low interest loans for construction, it may be reasonable and prudent to set the charges for RDE’s at some point below the maximum charge described. The City will benefit greatly in terms of convenience, safety, and decreased maintenance costs from a well designed and integrated storm water management system. The proposed storm water control system will function to minimize adverse effects from the average storm event, but is not intended to provide for the catastrophic events of major flood occurrences. It would not be cost effective to design and build facilities capable of carrying every conceivable storm water

Page 63
flow. A well designed system will reduce a normally expected storm impact and will help assume rapid recovery from even catastrophic events.
POLICIES These policies are intended to be consistent with state law and existing City policies and practices, for promoting efficient and effective provision of urban services and protecting natural resources. The specific rationale for each policy is described in the table.
1. The City shall assure urban services (water, sewer and storm drainage services and transportation infrastructure) to residential, commercial and industrial lands within the City's Urban Growth Area as these lands are urbanized.
Rationale: Identifies the City's responsibility to provide urban services to developed lands in the City. [UGAMA] [Amended by Ordinance No. 754, Passed by Council on March 14, 2006]
2. To minimize the cost of providing public services and infrastructure, the City shall discourage inefficient development without adequate public services and promote efficient use of urban and urbanizable land within the City's urban growth boundary, including requiring all urban development to be served by full urban services.
Rationale: Protects against inefficient urban growth and also helps the City meet the intent of Goal 14. [UGAMA] [Amended by Ordinance No. 754, Passed by Council on March 14, 2006]
3. The City shall support development that is compatible with the City's ability to provide adequate public facilities and services. Rationale: Allows the City to keep growth from outpacing the City's ability to service the new development. [UGAMA] [Amended by Ordinance No. 754, Passed by Council on March 14, 2006]

Page 64
4. The City shall prioritize development of land serviced by utilities and require the extension of water, sewer and storm drainage facilities for all urban level development within the UGB.
Rationale: Promotes efficient urban growth and reduces the cost of providing services. [UGAMA] [Amended by Ordinance No. 754, Passed by Council on March 14, 2006]
5. The City shall coordinate provision of public services with annexation of land outside the City limits. Rationale: Helps coordinate annexation and public service policies. [UGAMA] [Amended by Ordinance No. 754, Passed by Council on March 14, 2006]
6. The City shall adopt long-range master plans for its water, sewer, storm drainage and transportation systems and review and/or update them periodically. Rationale: Regular review of master plans is important in identifying new infrastructure needs and ensuring adequate provision of urban services concurrent with growth.
7. The City shall adopt and periodically update, as a supporting document to this Plan, a Public Facilities Plan, for development of public services and facilities in conformance with the policies of the comprehensive Plan. Significant changes in projected capacity of public facilities required by proposed new development to be served by the City may necessitate update of the Public Facilities Plan.
Rationale: Links the Comprehensive Plan with the Public Facilities Plan, pursuant to
state law. 8. The City shall comply with state and federal regulations for utility systems. Rationale: Ensures the City complies with all applicable laws.
9. The City shall establish and maintain a range of funding mechanisms for building new water, sewer, storm drainage and transportation infrastructure and maintaining existing infrastructure.

Page 65
Rationale: Helps ensure that there are adequate funds to maintain infrastructure and pay for new extensions.
10. The City shall monitor the condition of water, sewer, storm drainage and transportation infrastructure and finance regular maintenance of these facilities.
Rationale: Helps ensure that infrastructure is monitored and maintained.
11. The City shall utilize its adopted System Development Charges (SDCs) to finance new water and wastewater infrastructure as allowed by state law, and adjust SDCs to keep them up- to-date with current costs.
Rationale: Formalizes use of adopted SDCs for expansion and maintenance of infrastructure (wastewater, domestic water, stormwater drainage and transportation).
12. The City shall establish and maintain utility rates and user fees that equitably allocate costs for operations and maintenance to users.
Rationale: Establishes means of paying for utility infrastructure that is fair and efficient.
13. The City shall maintain a supply of commercial and industrial land that is serviceable by water, sewer, storm drainage and transportation infrastructure.
Rationale: Implements Goal 9, Economic Development, requirements.
14. The City shall periodically amend its Comprehensive Plan (public facility projects) as implementing plans and agreements are updated
Rationale: Implements rule requirements to amend the project list to include significant modifications and helps ensure the project list remains current.
15. The City shall protect its domestic water supply by:
• coordinating with Deschutes Valley Water District (provider of domestic water within the city limits of Madras)
• working with landowners and managers for protection of water sources and

Page 66
adhering to applicable permitting requirements when approving new residential, commercial and industrial development and when constructing new water, sewer, storm drainage transportation infrastructure
Rationale: Protecting the City's water supply is a key component to ensuring adequate water quality and quantity for residents.
16. The City shall continue to dispose wastewater treatment effluent at the Desert Peaks Golf Course, and has secured additional publicly owned property that the City encourages to be developed as a golf course that is suitable for irrigation with treated wastewater effluent.
Rationale: Disposal of treated wastewater effluent on publicly owned property is consistent with state policy encouraging the re-use of treated wastewater effluent. Additionally, it is a beneficial use of a waste product that reduces pressure on the City’s water supply. [Amended by Ordinance No. 781, Passed by Council on December 12, 2006]
17. The City shall take steps to minimize adverse impacts from construction and other sources of erosion and sedimentation on natural drainage ways and storm drainage facilities.
Rationale: Natural drainage ways are a crucial part of a City's overall storm drainage management infrastructure and long-term ecological health.
18. In order to allow for safe, orderly and coordinated development, the City shall adopt utility and transportation design standards and construction specifications as part of its development Code.
Rationale: Provides a link between the Comprehensive Plan, Transportation System
Plan, and the City's Development Code. Schools Madras is a part of Jefferson County School District 509-J. There are four schools in Madras. These are Madras Elementary (grades K-4), Buff Elementary (grades 5-6), Madras Junior High (grades 7-8), and Madras High (grades 9-12). Enrollment figures are as follows:

Page 67
AVERAGE DAILY MEMBERSHIP School 1966-67 1977-78 Kindergarten -- 91 Madras Elementary 480 437 Buff Elementary 229 235 Madras Junior High 362 405 Madras High 604 592 In October, 1977, a Citizens Advisory Committee (509-J) concluded their study with a written report to the school board. Their general comments concluded that all buildings in 509-J District can be serviceable for many years. This committee observation has been collaborated by the district architect. There was no observed crowding in terms of numbers of students per classroom. There is a problem in providing rooms for some classes and programs because of the number of classes offered. If the district enrollment continues to grow, it is likely that within a few years, new construction may be necessary. The committee endorsed the neighborhood school concept of maintaining elementary schools in Simnasho, Metolius, Madras, and Warm Springs. Hospitals, Medical, Health, Mental Health: Mountain View Hospital, a tax supported institution, has 70 licensed beds, 32 acute care and 2 intensive care, and a 36 bed nursing home. Rates are comparable with other hospitals of similar size and considerably lower than St. Charles Medical Center in Bend. Patient care is rated high and the hospital is fully accredited. An expansion of the nursing home wing is now completed. There are five physicians, all engaged in general family practice, with four joined in a clinic operation. Needed specialist care is furnished to the entire Central Oregon area by specialists located in Bend at the St. Charles Medical Center. The community is also served by five dentists and two optometrists. Jefferson County operates public health programs and mental health programs through the County Health Department and Mental Health Department. Both are comprehensive, well planned and operated programs. Churches, Lodges, Farm Organizations: Churches located and holding services in Madras are the Christian, Baptist, Methodist, Episcopal, Church of Christ, Assembly of God, Lutheran, Catholic, Seventh Day Adventist, and others.

Page 68
There are Masonic, Elk, Odd Fellow, Eastern Star, and Rebekah lodges in Madras. There are American Legion and Veterans of Foreign Wars posts in Madras. Jefferson County boasts three active granges and a County Farm Bureau in addition to the Madras-Jefferson County Chamber of Commerce, the Kiwanis Club, the Lions Club, and the Jefferson County Road and Gun Club. TRANSPORTATION: Regional Setting: The City of Madras lies in the approximate geographic center of Jefferson County. The City is served by several modes of transportation, including private auto, motor freight, rail, air, and commercial bus service. The City lies on the major North/South transportation corridor through Central Oregon. Highways: Two major federal highway routes form the framework of Madras' thoroughfare system. Highways U.S. 97 and 25 join at Madras and traverse through the heart of the County in a broad X-shaped pattern. U.S. 26, locally known as the Warm Springs and Madras-Prineville Highways, is the main East-West highway serving Jefferson County. Most regional traffic in Jefferson County is routed into and through the City of Madras on Highways U.S. 97 and 26. In 1966, the Oregon State Highway Department introduced a one--way couplet in Madras (northbound on Fifth Street and southbound on Fourth Street). Traffic on U.S. 97 North of Madras ranges from 1,100 vehicles per day at the Jefferson-Wasco County line to 8,800 vehicles at its junction with the Culver Highway in Madras. The traffic on U.S. 97 is heavier South of Madras, ranging from 6,600 vehicles per day at the South city limits of Madras to 3,000 vehicles per day at the Jefferson-Deschutes County line. Other relatively high traffic counts were reported by the highway department on the Warm Springs and Madras-Prineville sections of U.S. 26. Average daily traffic on the Warm Springs Highway ranged between 1,700 vehicles per day at the Jefferson-Wasco County line, 2,900 vehicles at Warm Springs, and 5,300 vehicles at its junction with U.S. 97 North of Madras. The Madras-Prineville highway carried an average of about 650 vehicles per day over most of its length, although the count at its junction with U.S. 97 South of Madras amounted to 810 vehicles. The other major federal-aid secondary highway, Culver Highway, was reported to have carried about 2,150 vehicles per day in Madras.

Page 69
Railroads: The Oregon Trunk Railroad, utilized by Burlington-Northern and Union Pacific Railroad Companies, provides daily freight service to Madras. A spur line of the Oregon Trunk line serves the Madras Industrial Park. The more frequent operation of trains in Jefferson County occurs within the Madras area. The Madras railroad station is the main depot and industrial switching yard in the County. The railroads now offer freight service only; passenger service was discontinued in the early 1970's. Three groups of commodities dominate rail cargo movements through Jefferson County. They include commodities of agriculture (potatoes, wheat, and barley), forest commodities (plywood, lumber and studs), and energy sources (petroleum, fuel oil, and petroleum derivatives). Agricultural and forest commodities are chiefly outbound while energy sources are all inbound. Other major cargo movements include inbound farm machinery, commercial fertilizers, and feed. Much of the rail traffic in the County is highly seasonal in nature. There is virtually no movement of potatoes from the first of June until late September. Commercial fertilizer is shipped into the County during the Spring and Fall months only. Although rail freight moves in all directions from Madras shipping points, the greater share is destined for points east. It is estimated that about 90 percent of the plywood and lumber traffic is eastbound, and the Union Pacific carried nearly 98 percent of its potato shipments to eastern points. Conversely, the Burlington-Northern ships about 75 percent of its potatoes to California and the remainder to transcontinental points. Almost all of the Jefferson County grains (wheat and barley) are shipped to the Ports of Portland and Vancouver for export. Approximate rail freight transit times from Madras to select cities are shown in the following tabulation. From Madras to: Portland 2nd morning delivery San Francisco 3rd morning delivery Seattle 3rd morning delivery Kansas City 4th morning delivery Los Angeles 5th morning delivery Chicago 5th morning delivery Air Transportation: The major air transportation facility in Jefferson County is the Madras City-County Airport, located in the Madras Industrial area about three miles northwest of the city center. This field was first used by the U. S. Army during World War II as a training center for the B-17. The airport has four surfaced runways: two 8,000 foot runways, one 10,000 foot runway, and a 3,800
Page 70
foot lighted runway. In addition, there are hangar and tie-down facilities for storage of light planes and a shop hangar for major aircraft repairs. At the present time, Oregon Air Service (a commercial carrier) provides scheduled passenger service daily at the Madras City/County Airport. The airline provides direct connections with Eugene. A fixed base operator at the field offers charter flight service for air express, freight, and passenger transportation. Air service for light private planes, flight instruction, crop dusting, fertilizing, fire fighting and aircraft maintenance are also provided at this facility. Bus Service: Madras is the only City in the County with scheduled bus service. An agency station of Pacific Trailways Bus System operates in a café depot at the corner of Sixth and "D" Streets. From this station, Trailways buses make a total of ten departures daily--four each to Portland and Bend, and two to The Dalles. In addition to regular passenger and charter services, Pacific Trailways also offers shipment of express freight from its station in Madras. The approximate bus transit times from Madras to selected centers is shown in the following tabulation. From Madras to: Bend 1 hour Portland 2 hours, 55 minutes The Dalles 2 hours, 15 minutes Klamath Falls 4 hours, 10 minutes Salt Lake City 17 hours, 30 minutes Motor Freight: Trans-western Express, Cascade Transport, and Madras Freight Lines are the three main common carriers with offices in Jefferson County. The Trans-western terminal is located on the Warm Springs Highway about one and one-half miles north of Madras. This firm maintains regular truck service from Madras to Portland and from Madras to Bend and points south. Trans-western is also the local agent for the Mayflower Moving and Storage Company. Cascade Transport, whose main offices are in Bend, maintains a branch office and terminal in Madras. Cascade Transport is authorized as an unscheduled intra-state carrier. The Madras Fright Lines terminal is located on the Dalles-California Highway one mile south of the Madras city limits. This carrier specializes in hauling livestock, feed, fertilizer, and building materials, and is generally considered to be one of the largest motor freight concerns of its kind in the Pacific Northwest. It is authorized as an interstate and intra-state irregular common carrier, operating to or from points in Eastern Oregon to or from points in Oregon, California, Washington, Idaho, and Nevada. Its authority to and from Nevada points is limited to the

Page 71
transport of livestock. Madras Freight Lines is also authorized to carry general freight within, to and from Jefferson-Crook-Deschutes County area, although this authority is seldom utilized. Approximate motor freight transit lines from Madras and other Central Oregon shipping points to selected areas are as follows: From Madras to: Portland metropolitan area 1st morning Seattle-Tacoma 2nd morning San Francisco Bay area 2nd morning Southern California 3rd morning Lake states 8th morning East Coast 11th morning Local Transportation: The City of Madras is developed in a grid pattern with the streets lying in almost true north-south, east-west directions. Street rights-of-way vary from 80 feet to 60 feet and improved residential street widths are quite wide with some up to 54 feet curb-to-curb. Present city standards require new streets to have 60 feet of dedicated right-of-way with 44 feet of improved surface. Improvement standards are Oregon State Highway Department standards for an 0-9 oil mat. Sidewalks are not now required in new subdivisions but are available in most residential areas of the City through the formation of local improvement districts at property owner requests. There is a taxi service available in the City; however, most intra-city transportation is via private automobile. The one way north-south couplet, established in 1966, has relieved severe congestion problems in the core area of the City. The Central Oregon Council on aging has established a Dial-a-Ride service for senior citizens. There are several corrective measures, which the City will undertake to improve the traffic circulation in the area. These include: A. Construction of a bridge over Willow Creek to complete 10th Street. This will provide better
access to and from a growing residential area to the north of the City. B. The intersection of northbound U.S. 97 and Adams Drive needs to be improved. The present
"Y" situation creates a serious traffic hazard and can be easily corrected by turning Adams Drive sharply to a 90� intersection.
C. Buff Street needs to be extended to Grizzly Road to provide better east-west circulation. D. Although the following needs are out of the City's jurisdiction, the City urges and fully
supports:

Page 72
1. The placement of additional directional signs in the northbound lanes of 5th Street to announce the junction of Highways U.S. 26 and 97.
2. The short "U" turn at the south end of the one-way couple is too short and creates
a traffic hazard. The construction of traffic island and slight relocation to the north of the east-west lanes would greatly enhance the situation.
3. The addition of a stoplight on one intersection of both north and south bound
lanes of the one-way couplet would be of tremendous benefit by slowing through traffic and easing east-west traffic movement. A suggested location to be considered is 5th and "D" Streets and 4th and "D" Streets. This should be done when traffic volumes reach sufficient numbers to meet state standards for traffic light installation.
During the formulation of this plan, serious consideration was given to the establishment of a highway bypass around the City. It is the City's official position to oppose any relocation of the existing highway through the City at the present time. ENERGY: There are no energy resources within the planning area. Electrical power is provided by Pacific Power and Light Company. Power is generated at Round Butte and Pelton Dams. Energy conservation can be accomplished in a variety of ways. Other elements of this plan indicate several methods by which the City is responding to the need to conserve energy. Some of these methods include the establishment of an Urban Growth Boundary to prevent urban sprawl and the inherent waste of energy resources associated with sprawl. Strict adherence to the Uniform Building Code to maintain proper insulation of homes is also effective in the conservation of energy. The use of vacant lots within the existing city limits prior to developing raw land will also save energy by reducing costs of constructing and maintaining additional public services. The development of alternative energy sources, such as solar energy will be supported by the City. Further, the City supports the development of a waste recycling center within the planning area. URBANIZATION: The City, in cooperation with Jefferson County, shall establish an Urban Growth Boundary. The purpose of the Urban Growth Boundary is to separate urbanizable land from rural agricultural land. Urban lands are defined as those lands within the Urban Growth Boundary which (1) are determined to be necessary and suitable for future urban areas; (2) can be served by urban services and facilities; and (3) are needed for the expansion of an urban area.

Page 73
Agricultural lands are defined as those lands having soil types in Class I through VI in Eastern Oregon as classified by the Soil Capability Classification system of the United States Soil Conservation Service. At the outset of the planning process, both the City and the County Planning Commission began determinations for the establishment of an Interim Urban Growth Boundary. It became apparent after a series of public meetings that the concept of an Urban Growth Boundary would be difficult for the residents of the area to accept. In reviewing the existing situation, it was noted the County zoned a large area around the City of Madras to A-3 "Limited Agriculture" in 1973. This was done with the assistance of an Area Advisory Committee and has been in effect for approximately five years. At each public meeting the subject of the Urban Growth Boundary was discussed and the members of the public audience pointed to the 1973 "A-3" zoning and insisted this constituted an Urban Growth Boundary. Because of the large public sentiment regarding the Urban Growth Boundary, the process to establish it has been a long and difficult task. What follows is a discussion and analysis of the present County zoning and the established Urban Growth Boundary. Jefferson County "A-3" Zoning Area: The Limited Agricultural "A-3" area contains 8,524 acres. That area includes the existing city limits of Madras, which contains some 750 acres, and the proposed Urban Growth Boundary area which contains an additional 1,400 acres, leaving a total of 6,474 acres presently zoned "A-3", Limited Agriculture. This area was considered by many residents to be urbanizable without the provision of sanitary sewer service. An analysis of the 6,474 acres was conducted and the following findings were determined. A. The entire area is served by the Deschutes Valley Water, a public water district, which is both
federally and state approved, with the capabilities of providing adequate domestic water for intensive development throughout the entire area.
B. There are several existing subdivisions within the area as well as dozens of individual home
sites. A survey of existing land use indicated approximately 150 homes within this area. C. The North Unit Irrigation District maps indicate that of the 6,474 acres, approximately 3,300
have the right to receive irrigation water for agricultural purposes. However, not all of these lands are currently being utilized for agricultural production.
D. The soils maps of the County indicate suitable soils for agricultural production to the east of
the A-3 designated area. However, these areas need water to be utilized for agricultural purposes.
E. The North Unit Irrigation District would be able to transfer water rights to land lying to the
east. However, a new distribution system would be required.

Page 74
F. Nonbuildable lands were inventoried and it was found that approximately 1,500 acres were
considered nonbuildable due to established flood plains, steep slopes, and road and irrigation rights-of-way.
G. It is considered improbable that sanitary sewer service would ever be extended to this area
by the City of Madras. H. Jefferson County Court has indicated that it will not allow residential development on
irrigated agricultural lands within this area. Based on the above findings, it was decided by the Planning Commission and governing bodies of the two jurisdictions involved to develop an Urban Growth Boundary inside the boundary established by the A-3 agricultural zoning in 1973. This decision was made after several public hearings at which heated debate took place. A proposal to include all the A-3 area in the Urban Growth Boundary was submitted to the LCDC field representative for review. The field Representative determined that the proposal would not meet the statewide planning goals. Therefore, over the strenuous objections of the members of the Area Advisory Committee, the governing bodies' decision was that the inclusion of the entire A-3 "Limited Agricultural" area would not meet the statewide planning goal for urbanization and would not meet the statewide planning goals for agricultural lands. Therefore, the smaller Urban Growth Boundary as described below was established. Urban Growth Boundary Description: The Urban Growth Boundary as indicated on the Comprehensive Plan Map contained an area of approximately 1,400 acres outside the existing city limits of Madras. The expansion of the Urban Growth Boundary (through the City’s Periodic Review) will add an additional 643 acres, which will provide the city with the required acreage necessary for expanding its commercial, industrial, residential and public facilities zones. The original and revised urban growth boundary were determined after review of existing land use, growth projections, and potential development sites. The Urban Growth area is a modified area of the boundary proposed in the facilities plan developed for the City by CH2M Hill in 1976. The outlying areas within the Urban Growth Boundary have been noted by the Oregon State Department of Environmental Quality as having unsuitable soils for septic tank and drywell utilization and existing sites have been put on notice by the Department to phase out the use of drywells by 1980. The existing acreage within the current Urban Growth Boundary and the acreage proposed for inclusion in the Urban Growth Boundary, total the below acreage figures:

Page 75
Land Use Category Gross Acreage Residential 1232.94 Commercial 253.60 Industrial 384.91 Open Space/Public Facilities 289.06 Total: 2,169.51 The original acreage figures were derived by physically scaling (with an engineer's scale) each tract of ground within the Urban Growth Boundary from a 1" = 400' map of the area. An analysis of the developed and buildable lands was conducted. The additional acreage for inclusion into the existing Urban Growth Boundary was provided by Kittleson and Associates study. The original study noted that the R-1 developed lands data was derived by calculation of those lands committed to residential use within the Urban Growth Boundary. This includes platted subdivisions and metes and bounds lots of less than 10 acres. Thus the two buildable lands inventories indicate a total of 223.16 acres in the Urban Growth Boundary and 120.58 acres within the City limits, to total 343.74 acres of buildable land within the planning area. The 24 percent public facilities factor is now applied to estimate the net residential buildable land within the planning area at 261.24 acres (343.74 x 24% = 261.24). General Discussion: The intent of the Comprehensive Plan is to provide an Urban Growth Boundary that will indicate the logical and probable areas in which the City of Madras can anticipate providing urban services within 20 year projection periods. The establishment of this boundary does not mean the City will immediately annex or begin construction and providing urban services to the area. COMPREHENSIVE PLAN ADDENDUM NO. 1 ADOPTED BY ORDINANCE NO. 382, NOVEMBER 13, 1979 The following information to justify the Urban Growth Boundary was adopted by the City Council and subsequently acknowledged by LCDC on January 30, 1988. Housing mix, housing projections, population projections, and justification of the Urban Growth Boundary as adopted. The City has made the following assumptions in developing the analysis. A. The present housing mix in the planning area will continue at the same ratio. 1. Double wide mobile homes are now allowed in the City within the Modular
Home subdivisions.

Page 76
2. The multi-family development will continue in or near the City center. B. Down zoning of approximately 6,700 acres of surrounding A-3 lands will cause a greater
concentration of development within the Urban Growth Boundary. C. The Madras Industrial Site will continue to develop at its present jobs per acre ratio. D. Present percentage of public facilities, 24% in the City, will continue to be provided at the
same rate the Urban Growth Boundary area develops. E. The existing net single-family dwelling density of the City will continue at the same rate. F. There will be little, if any, in-filling of existing developed areas within the Urban Growth
Boundary.
EXISTING HOUSING MIX CITY OF MADRAS
Type Number Percentage Single-family dwellings 439 66% Multiple-family dwellings 178 27% Mobile homes 47 7% Totals: 664 100% ====== ======= Existing Housing Within Urban Growth Boundary: The existing housing stock within the Urban Growth Boundary has been tabulated by using a 1978 aerial photo and field checking the photo on a quadrant by quadrant basis within the Urban Growth Boundary. Findings are as follows: Type Number Single-family dwellings 301 Mobile homes 221 Total: 522 ========

Page 77
Based on the 905 acres provided for residential use within the Urban Growth Boundary, the existing housing density within the Urban Growth Boundary is 0.58 units per acre when computed on a statistical basis. It should be pointed out that approximately 130 mobile homes are contained within three existing mobile home parks and residential densities vary from 4,000 square foot lot size up to 2 acres within the Urban Growth Boundary. POPULATION PROJECTION: In re-evaluating the Comprehensive Plan, the City has reconsidered the population projection developed in June, 1977. At the time, there were no economic indicators of additional employment opportunities within the Madras area. The prime economic objective of the adopted Comprehensive Plan is to develop an adequate water system to the Madras Industrial Site to provide for additional industrial growth in the area. Since the adoption of the Comprehensive Plan in June, 1979, the City, in cooperation with Jefferson County, has undertaken a $12,000 study for the provision of water service to the Industrial Site. The study is now nearly completed and the findings are that water can be provided to the site by the Deschutes Valley Water District. The City is actively seeking funds for this project. At the present time, approximately 120 acres of the Industrial Site area developed. The 120 acres provide 385 jobs or 3.21 jobs per acre. Based on the continued development of the Industrial Site at the present jobs per acre rate, the City may expect 580 new jobs to be provided at the Madras Industrial Site over the next 20 years. With an estimate of 1 job per household, this yields a total population increase of 1,740. This, added to the anticipated 1 percent, yields a total population that the City may expect within the urbanizable area and the City of 3,340. This would result in an annual growth rate of 2.75 percent. Additional factors to be considered are the continued expansion of the Warm Springs Indian Reservation productivity. The Reservation is currently undergoing a 5.5 million dollar expansion of the existing lumber plant, is considering developing hydro-electric power sources, may consider developing a winter recreation area, and as range resources on the Reservation are utilized, may develop food processing plants. Of the 1,529 full time jobs provided on the Reservation at the present time, approximately 900 live in the Madras area. As the Warm Springs Indian Reservation continues to expand, the Madras urbanizable area can expect additional impact from this expansion. Growth is also occurring to the south of Madras. The Cities of Redmond and Bend are experiencing rapid growth rate due to industrial and tourist related activities. The City of Madras, coupled with the abundant water supply from the Deschutes Valley Water District, can readily anticipate spill-over growth impacts from these areas over the next 20 years. Housing Mix Assumptions: The present housing mix in the Madras area is as follows:

Page 78
Type Number Percentage Single-Family Dwellings 740 62% Multiple-Family Dwellings 178 15% Mobile Homes 268 23% Totals: 1,186 100% Based upon a total population projection of 3,340 additional people, at an average household size of 3 persons per household, the City and the Urban Growth Boundary may expect an additional 1,113 homes. Based upon the current housing mix, the unit needs by type break down as follows: Type Number Percentage Single-Family Dwellings 690 62% Multiple-Family Dwellings 167 15% Mobile Homes 256 23% Totals: 1,113 100% Multiple Family Needs: As provided in the Comprehensive Plan and the Zoning Ordinance, there 52.42 acres planned and zoned for multiple family residential development. The Zoning Ordinance allows a maximum density of 14 units per acre. Current density, however, of multiple family units within the City per acre is 3.7 units. This is determined by dividing the number of units (178) by the number of developed multiple family acres (48.62). Based upon the existing density and projecting 167 additional multiple family units, the City would need to designate 45.01 acres of multiple family within the City. The City has designated 52.42 acres of multiple family lands within the City. At maximum density of 14 units per acre, the City would need only to designate 12.64 acres for multiple family development. Therefore, the City has designated adequate amount of land sufficient to meet the projected need of multiple family residential housing. The City will continue to monitor development of multiple family housing in the City to insure the need for multiple family development is constantly met. There is no R-2 "Multiple Family" designated within the Urban Growth Boundary at the present time because of the present lack of sanitary sewer in the area.

Page 79
URBAN GROWTH BOUNDARY ANALYSIS: As indicated in this Comprehensive Plan, there are 905.16 gross acres of land zoned for residential development in the Madras Urban Growth Boundary. By utilizing the public facilities factor as provided in the Housing Division's housing manual, ad as demonstrated within the existing city limits, the Madras Urban Growth Boundary area must be prepared to provide 24 percent of that area for additional public facilities. This amounts to 217.24 acres, leaving a total of 687.92 buildable acres. In the City of Madras, current platting procedures and street width requirements take 24 percent of the gross land area for streets and public rights-of-way. Twenty-four percent of 687.92 acres equals 165.10 acres, which will be developed as streets. This leaves a total of 522.82 net buildable acres within the Urban Growth Boundary. 905.16 Gross Acreage - 217.24 Public Facilities (24%) 687.92 Buildable Acres - 165.10 Streets & Public Rights-of-Way (24%) 522.82 Net Acres within the UGB ANALYSIS OF EXISTING DEVELOPMENT IN URBAN GROWTH BOUNDARY: The Urban Growth Boundary presently contains 522 housing units. The amount of net acreage required to support the existing development has been calculated utilizing the following method. 1. 1978 aerial photo was utilized determining the location of the existing development. 2. The County Assessor's records were reviewed and all lots less than two acres were
tabulated. The amount of net acreage presently utilized for residential development within the Urban Growth Boundary has been determined to be 249.24 acres. This amounts to 2.34 housing units per acre. There are 522.82 net acres available for residential land use within the Urban Growth Boundary. As indicated in the above analysis, there are 249.24 net acres developed within that 522 acres, leaving a total of 273.58 acres buildable within the Urban Growth Boundary. The R-1 residential acreage available within the city limits must now be added to the total. As indicated on Page 61 of the Comprehensive, there are 68.16 gross acres buildable within the R-1 classification inside the corporate limits of the City of Madras. Utilizing the 24 percent street and public right-of-way factor, there will be 16.36 acres required for streets, leaving a total of 51.8 net

Page 80
acres available in the City. The public facilities factor is not utilized in this part of the analysis because the public facilities already exist within the City. Therefore, adding the 273.58 net acres buildable within the Urban Growth Boundary and the 51.8 net acres buildable within the City gives a total of 325.38 net acres available for residential use within the Madras planning area. The City has a net density of 2.96 housing units per acre within the R-1 area. This is derived by taking the total developed R-1 lands within the City, 195.04 acres, and factoring out the streets (24% of 195.04). This equals 46.81 acres currently provided as streets and public rights-of-way within the R-1 area of the City, leaving a total of 148.23 net acres currently utilized for single family residential development. Dividing that figure into the 439 existing single family dwellings, the City is able to determine there are 2.96 units per acre. While the Zoning Ordinance may allow 4.4 units per acre, the historical perspective in terms of existing developed lands in the R-1 designation in the Madras planning area is 325.38 times 2.96 units per acre, equaling 963.12 housing units. The revised projection for single family dwelling units, including mobile homes, totals 946 units or within 17 units of the carrying capacity of the net buildable acres designated R-1 in the City and the Urban Growth Boundary. A statistical analysis in tabular form is provided as Exhibits 1 and 2. It must be noted that the existing wastewater treatment plant was designed to carry a population of 6,000 persons. However, the City owns the land on which the plant is placed and there is ample acreage available for expansion of the treatment plant as required. The City will closely monitor the operation of the treatment plant to insure proper steps are taken when expansion is needed.

Page 81
Exhibit 1
STATISTICAL ANALYSIS MADRAS HOUSING NEEDS
EXISTING
City of Madras Number Percentage Single Family Dwellings 439 66 Multiple Family Dwellings 178 27 Mobile Homes 47 7 664 100% Urban Growth Boundary Single Family Dwellings 301 58 Multiple Family Dwellings 0 0 Mobile Homes 221 42 522 100% Total Madras Planning Area Single Family Dwellings 740 62 Multiple Family Dwellings 178 15 Mobile Homes 268 23 1,186 100% PROJECTED Projected Population 3,340 Population Per Household = 3 = 1,113 Households Projected Household Types, Current Housing Mix Single Family Dwellings 690 62 Multiple Family Dwellings 167 15 Mobile Homes 256 23 1,113 100% Net Land Area Needs Based Upon Existing Density Single Family Dwellings: 690 - 2.96 units/acre 233.11 acres Multiple Family Dwellings: 167 - 3.71 units/acre 45.01 acres Mobile Homes: 256 - 2.96 units/acre 86.49 acres Net 364.61 acres

Page 82
Multiple family needs are presently met within the Madras city limits; therefore, that area requirement is subtracted from the total.
364.61 acres 45.01 acres NET R-1 ACRES REQUIRED 319.60 acres
Exhibit 2
STATISTICAL ANALYSIS
R-1 LAND AREA PROVIDED IN MADRAS PLANNING AREA
Gross R-1 Acreage in Urban Growth Boundary 905.16 Less Future Public Facilities (24%) - 217.24 Buildable Lands 687.92 Future Streets (24%) - 165.10 NET BUILDABLE R-1 LANDS 522.82 acres EXISTING DEVELOPMENT - 249.24 net acres THEREFORE: Net Buildable Acres 522.82 Less Net Developed Acres - 249.24 Net R-1 Acreage in Urban Growth Boundary 273.58 Plus Net City R-1 51.80 Total Net R-1 Acreage Provided 325.38 Less Total Net Projected - 319.60 TOTAL R-1 MARGIN 5.78 acres

Page 83
COMPREHENSIVE PLAN AMENDMENT ADDENDUM #2
PERIODIC REVIEW WORK TASK #1 A & B ADOPTED BY ORDINANCE #703, JANUARY 14, 2003

Page 84
SECTION III
GOALS AND POLICIES GOAL 1 - To develop a Citizen Involvement program that insures the opportunity for all
citizens to be involved in all phases of the planning process. POLICY - The City shall insure an adequate citizen involvement in all phases of the
planning process. To that end, the citizen involvement program is spelled out on Page 5 of this plan.
GOAL 2 - To establish a land use planning process and policy framework as a basis for all
decisions and actions related to the use of the land and to insure an adequate factual base for such decisions and actions.
POLICIES - A. The City shall insure that the Comprehensive Plan serves as a basis
for future land use decision. B. The City shall be responsive to the changes in needs and conditions
over time and amend the plan accordingly. The amendment process is discussed in the Land Use element.
GOAL 3 - To preserve and maintain agricultural lands. POLICIES - A. To establish an Urban Growth Boundary to separate rural lands
from urbanizable lands. B. Encourage establishment of exclusive farm use zoning outside the
established Urban Growth Boundary. GOAL 4 - To conserve forest lands for forest uses. Due to the absence of any forest lands
within the planning area, the City finds this Statewide Planning Goal inappropriate for the City.
GOAL 5 - To conserve open space and protect natural resources. POLICIES - The City shall:

Page 85
A. Preserve the scenic vistas afforded by the Cascade Mountain Range. B. The City will limit conflicting uses of identified historic structures and
establish a Zoning Ordinance procedure to review applications for proposed changes.
C. Continue to support and cooperate with the Jefferson County Museum
Association. D. The City shall appoint the Jefferson County Museum Association as an
advisory body to review historic sites, including any that should be identified at a later date.
1) If a potential historic structure is proposed to be demolished, the City
may, on recommendation from the Museum Association, hold in abeyance the demolition permit for up to sixty (60) days to allow the Museum Association to seek funds to preserve the potential historic structure or recommend other ways of preserving the structure.
E. Locatable structures and definable sites should be listed in the
Comprehensive Plan and shown on a map in the Jefferson County Museum. These sites and buildings should be protected by plan policies and ordinance provisions. They should, over time, become identified at the site to increase their historic value to the public.
[Added by Ordinance No. 780, Passed by Council on December 12, 2006] F. A special effort will be undertaken by the society and the City Planning
Department to locate and document all historic cemeteries and family burial plots in the county. These sites are of particular interest to relatives of early settlers.
[Added by Ordinance No. 780, Passed by Council on December 12, 2006] G. Locations which cannot be well defined, or for which no visible remains
exist, shall be marked on a map in the museum, along with an explanation of the events or structures which were on the location.
[Added by Ordinance No. 780, Passed by Council on December 12, 2006]

Page 86

Page 87

Page 88
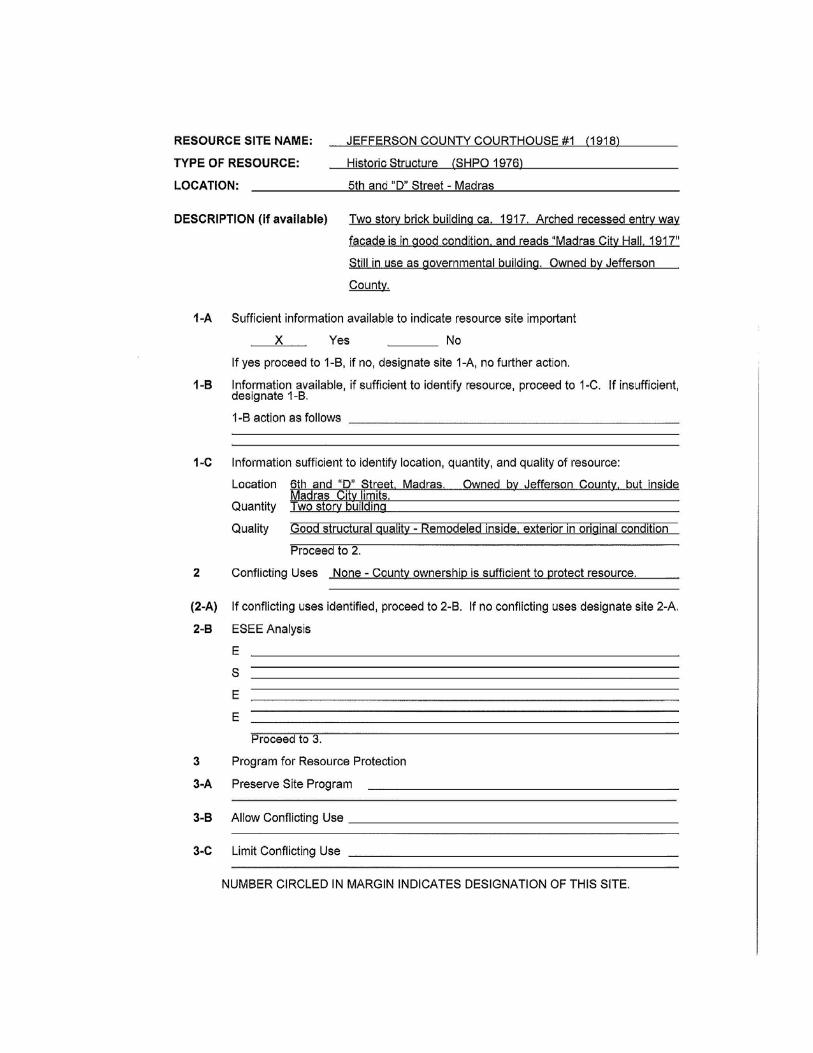
Page 89

Page 90

Page 91
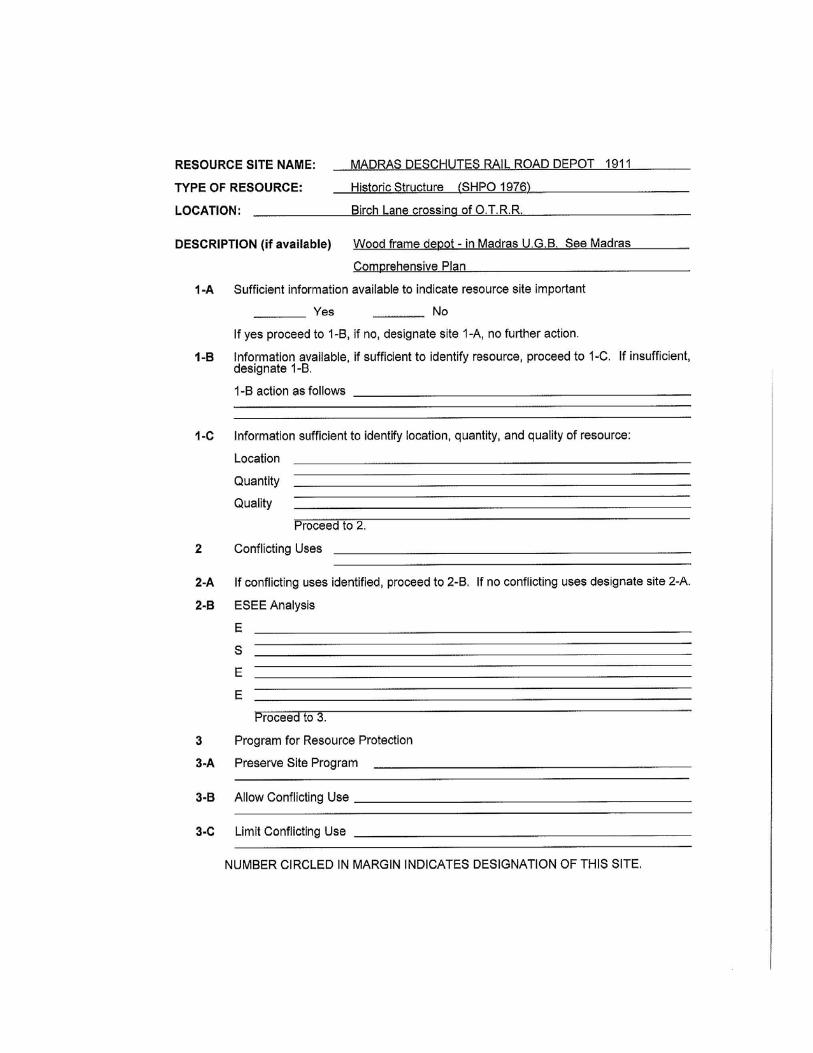
Page 92

Page 93

Page 94
[List of Historical Resources added by Ordinance No. 780, Passed by Council on December 12, 2006] GOAL 6 - To maintain and improve the quality of the air, water, and land resources of the
City. POLICIES - A. All new construction within the City shall be connected to the
City's municipal sewer system. B. The City shall strive to maintain state and federal standards for
water quality. C. That the City shall require all development to comply with all
applicable state and federal environmental rules, regulations, and standards.
GOAL 7 - To protect life and property from natural disasters and hazards. POLICY - The City shall insure compliance with the City's Flood Plain Ordinance. GOAL 8 - To satisfy the recreational needs of the citizens of the City and its visitors. POLICIES - The City shall: A. Seek opportunities to develop the following recreational opportunities. 1) Tennis Courts 2) Handball and Racquet Courts 3) Swimming Pool 4) Bike Paths 5) Publicly Owned 18-Hole Golf Course 6) Hiking trails, public parks, play areas, and passive natural open
spaces. [5 and 6 added by Ordinance No. 781, Passed by Council on December 12,
2006] B. Improve and maintain a bike/hiking path along Willow Creek. C. Develop new neighborhood playground parks as the need occurs.

Page 95
GOAL 9 - To diversify and improve the economy of the City. An overall Economic
Development Plan was developed by residents of Madras and Jefferson County and adopted on June 29, 1977. Portions of the Plan were reproduced in the inventory section of the Comprehensive Plan. Not all goals and objectives of the OEDP are applicable to the City of Madras; therefore, only those, which are applicable to the City are reprinted here. However, the City of Madras does recognize the importance of the OEDP to the entire Jefferson County area. The City incorporates by reference the 1977 OEDP.
POLICIES - The City shall seek opportunities to: A. Develop a source of water supply for fire protection of the Madras
industrial site. B. Develop and construct a multi-purpose civic auditorium. C. Identify types of industries, which could be suitably located in the Madras
area and promote the advantage of the Madras industrial site to those types of industries.
D. Expand wholesale and retail trade industries. E. Expand tourism and recreation industries. F. Expand airport facilities. IMPLEMENTATION MEASURES - The City shall: A. Seek opportunities for funding to finance water system for the industrial
site. B. Concentrate commercial activity in or near the Madras Central Business
District. C. Continue to coordinate economic development efforts with Jefferson
County and the Central Oregon Intergovernmental Council. GOAL 10 - To provide for the housing needs of the citizens of the City. POLICIES - The City shall:
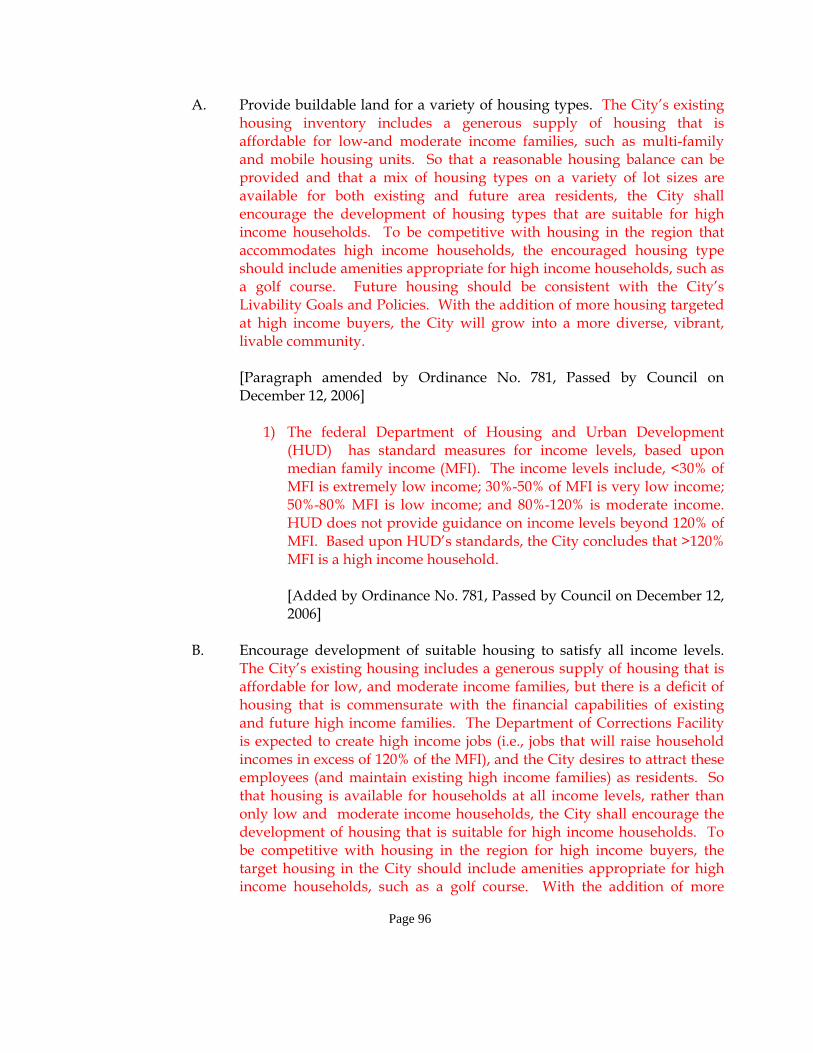
Page 96
A. Provide buildable land for a variety of housing types. The City’s existing housing inventory includes a generous supply of housing that is affordable for low-and moderate income families, such as multi-family and mobile housing units. So that a reasonable housing balance can be provided and that a mix of housing types on a variety of lot sizes are available for both existing and future area residents, the City shall encourage the development of housing types that are suitable for high income households. To be competitive with housing in the region that accommodates high income households, the encouraged housing type should include amenities appropriate for high income households, such as a golf course. Future housing should be consistent with the City’s Livability Goals and Policies. With the addition of more housing targeted at high income buyers, the City will grow into a more diverse, vibrant, livable community.
[Paragraph amended by Ordinance No. 781, Passed by Council on
December 12, 2006] 1) The federal Department of Housing and Urban Development
(HUD) has standard measures for income levels, based upon median family income (MFI). The income levels include, <30% of MFI is extremely low income; 30%-50% of MFI is very low income; 50%-80% MFI is low income; and 80%-120% is moderate income. HUD does not provide guidance on income levels beyond 120% of MFI. Based upon HUD’s standards, the City concludes that >120% MFI is a high income household.
[Added by Ordinance No. 781, Passed by Council on December 12,
2006] B. Encourage development of suitable housing to satisfy all income levels.
The City’s existing housing includes a generous supply of housing that is affordable for low, and moderate income families, but there is a deficit of housing that is commensurate with the financial capabilities of existing and future high income families. The Department of Corrections Facility is expected to create high income jobs (i.e., jobs that will raise household incomes in excess of 120% of the MFI), and the City desires to attract these employees (and maintain existing high income families) as residents. So that housing is available for households at all income levels, rather than only low and moderate income households, the City shall encourage the development of housing that is suitable for high income households. To be competitive with housing in the region for high income buyers, the target housing in the City should include amenities appropriate for high income households, such as a golf course. With the addition of more

Page 97
livable and housing suitable for high income households, the City will grow into a more diverse, vibrant community.
[Paragraph amended by Ordinance No. 781, Passed by Council on
December 12, 2006] IMPLEMENTATION MEASURE -
The City will continue to support the affirmative fair housing marketing plan as adopted by the City. The City will also encourage the home-building industry to provide a variety of housing opportunities in sufficient quantities at affordable prices to meet the housing needs of existing and future residents. In order to provide the necessary variety of housing required by Statewide Planning Goal 10, the City’s Goal 10 and related Policies, the City also establishes as a priority the provision of sufficient housing opportunities, with appropriate amenities, suitable for high income households. The City encourages this housing to be developed in accordance with the Master Planned Community Overlay zone, which requires generous open space and amenities, and encourages efficient use of land and public facilities and services, a variety of housing types, innovative designs and complete pedestrian-friendly communities.
[Paragraph amended by Ordinance No. 781, Passed by Council on December 12, 2006] GOAL 11 - To plan and develop a timely, orderly and efficient arrangement of public
facilities and services to serve as a framework for urban and rural development. POLICIES - The City shall: A. Continue to support the school district in providing adequate educational facilities. B. Provide urban services as required to the urbanizing areas of the City. C. Insure the provision of urban services--streets, water and sewer--as new
developments occurs. D. The City shall continue coordinating the existing agreement between the
City and Deschutes Valley Water District. E. The City shall coordinate with ODOT in implementing its improvement
program.

Page 98
F. The City shall continue to dispose wastewater treatment effluent at the Desert Peaks Golf Course. The City has secured additional publicly owned property for the land application of this treated effluent on the east side of Madras. This land is adjacent to both the enlarged treatment and storage ponds which are either recently constructed or under construction at this time. The most efficient methodology for this form of effluent treatment is application on a golf course, which has a high evaporation rate. Therefore, the City encourages the development of the publicly owned land on the east side of Madras as a golf course that is suitable for irrigation with treated wastewater effluent.
[Added by Ordinance No. 781, Passed by Council on December 12, 2006] GOAL 12 - To provide and encourage a safe, convenient, and economical transportation
system. POLICIES - The City shall maintain and improve the City's street network policies.
The City shall undertake to resolve the following problems as noted in the inventories section of the Comprehensive Plan. These include:
A. Construction of a bridge over Willow Creek to connect 10th Street. This
will provide better access to and from a growing residential area to the North of the City.
B. The intersection of northbound U.S. 97 and Adams Drive needs to be
improved. The present "Y" situation creates a serious traffic hazard and can be easily corrected by turning Adams Drive sharply to form a 90 degree intersection.
C. Buff Street needs to be extended to Grizzly Road to provide better East-
West circulation. D. Although the following needs are out of the City's jurisdiction, the City
urges and fully supports:
1) The placement of additional directional signs in the northbound lanes of 5th Street to announce the junction of Highways U.S. 26 and 97.
2) The short "U" turn at the South end of the one-way couplet is too
short and creates a traffic hazard. The construction of a traffic island and slight relocation to the North of the East-West lanes would enhance the situation greatly.
Page 99
3) The addition of a stoplight on one intersection of both North and
South bound lanes of the one-way couplet would be of tremendous benefit by slowing through traffic and easing East-West traffic movement. A suggested location to be considered is 5th and "D" Streets and 4th and "D" Streets, when traffic reaches sufficient levels to meet state standards.
E. During the formulation of this plan, serious consideration was given to the establishment of a highway bypass around the City. It is the City's official position to oppose any relocation of the existing highway through the City at the present time. GOAL 13 - To conserve energy. POLICIES - The City shall: A. Encourage more efficient use of utilities. B. Conserve energy in the cost of construction and operation of utilities. C. Encourage the development of alternative energy sources, including solar energy. GOAL 14 - To provide for an orderly and efficient transition from rural to urban land, and to
provide for livable communities. [Paragraph amended by Ordinance No. 781, Passed by Council on December 12,
2006] POLICIES - A. The City, in cooperation with Jefferson County, shall establish an
Urban Growth Boundary. B. The City, in cooperation with Jefferson County, shall mutually
agree to a management plan for the Urban Growth Boundary area. C. The City, in cooperation with Jefferson County, shall establish an
Urban Growth Boundary revision process to be utilized in a proposed change of the Urban Growth Boundary.
D. The City shall encourage the development of complete, livable
communities that include characteristics such as: a variety of lot

Page 100
sizes, dwelling unit types and ownership types, open spaces and other recreational amenities, a mix of land uses, school and community facilities, connected streets, proximity to downtown and other employment centers, and development that is scaled to the pedestrian and creates a sense of place. New growth areas should be developed in accordance with the Master Planned Community Overlay zone, which requires generous open space and amenities, and encourages efficient use of land and public facilities and services, a variety of housing types, innovative designs and complete pedestrian-friendly communities. Physical barriers, such as highways, tend to disrupt complete communities and livability because they disconnect areas from downtown and result in an auto-oriented environment of sprawl along highway corridors.
[Added by Ordinance No. 781, Passed by Council on December 12,
2006]

Page 101
SECTION IV
LAND USE ELEMENT The Land Use Element of the Comprehensive Plan is perhaps the most important portion of the Plan. This element allocates the uses of the land resources within the planning area and describes uses allowed within each designation. These are formal policy statements intended to assist in achieving the goals, objectives, and other policies of the Plan. GENERAL DISCUSSION The City of Madras is responsible for planning the area inside the city limits. Planning designations for the area within the Urban Growth Boundary is a mutual and cooperative agreement between the City and Jefferson County. Jefferson County is responsible for planning and implementing their ordinance in areas outside the city limits. Specifically, for areas outside the city limits but inside the designated Urban Growth Boundary, the County is expected to administer the Plan as adopted by the City. The Land Use element designates ten basic land use categories and four overlay designations. The intent is to simplify administration and implementation of the Plan. The land use categories are: R-1 Single-Family Residential R-2 Multi-Family Residential R-3 Planned Residential Development C-1 Corridor Commercial C-2 Downtown Commercial C-3 Community Commercial NC Neighborhood Commercial I Industrial O/S Open Space A/D Airport Development FH Floodplain Overlay MO Medical Overlay AO Airport Overlay MPC Master Planned Community Overlay [The second paragraph and zoning designations were amended by Ordinance No. 770, Passed by Council on July 25, 2006 and by Ordinance No. 781, Passed by Council on December 12, 2006]

Page 102
BACKGROUND FOR LAND USE CATEGORY DECISIONS The City of Madras first implemented a zoning ordinance in 1947 and revised it in 1964, designating six land use zones including two commercial and two industrial. The concept of this Plan is to ease administration and implementation. The land use categories were derived by first reviewing the existing land use patterns of the City in the planning area and inventory of the buildable lands within the City. Then areas of special hazards such as floodplain and areas of natural resources, which the City desired to preserve and maintain were reviewed. Finally, the planning area residents discussed alternative future growth patterns. The Land Use Plan Map was then developed by first designating the special hazard areas. The next step involved designating open space areas for parks and areas, which the City wishes to preserve. Commercial land use area was then considered and future needs for commercial activity were projected. It was noted that there is very little commercial land yet undeveloped within the existing city limits and therefore additional commercial lands were designated within the Urban Growth Boundary. Industrial lands surrounding the City were reviewed and it was noted the industrial park is inside the Urban Growth Boundary with suitable lands available for significant development. The existing light industrial area within the City also allows for substantial development, therefore, no further industrial lands were designated. Existing residential uses were then reviewed and it was noted in reviewing the existing Land Use Map of the City that there are approximately 480 lots still vacant within the City. Therefore, there is room for substantial growth within the City as well as within the Urban Growth Boundary. The Plan designates two residential categories-- R-1 "Single-Family Residential" and R-2 "Multi-Family Residential". Minimum lot size requirements for R-1 "Single-Family Residential" shall be 7,500 square feet when the owner contemplates using both community water and sewer systems. Minimum lot size in the R-2 "Multi-Family Residential" zone shall be as outlined in the Zoning Ordinance. After experiencing a period of rapid growth in the late 1990s and early 2000s, the City of Madras began to explore the possibility of expanding its Urban Growth Boundary (UGB) to accommodate planned growth. Expansion to the east is being considered based on the availability of public facilities (water, sewer collection and treatment, schools, recreation, roads) with sufficient capacity. At the same time, the City wanted to enhance the existing downtown and existing and emerging commercial areas, and to ensure that future development and redevelopment in those areas will contribute to a vibrant and successful commercial district. In order to help accomplish this goal, the Madras Redevelopment Commission (MRC) hired a land use consultant to assist in the preparation of a Comprehensive Plan and Zoning Ordinance Audit for Commercial Area within the Urban Renewal District (Audit). [This paragraph added by Ordinance No. 770, Passed by Council on July 25, 2006]

Page 103
The Audit focused on commercial areas within the Urban Renewal District. Working with the underlying premise that commercial development along the corridor should not detract from a vibrant downtown commercial district, the Audit recorded the fact that there were three distinct types of commercial areas each with unique characteristics. Completed in 2005, the final Audit recommendation included changes to the comprehensive plan, land use map, and zoning ordinance that define three distinct commercial districts; Corridor Commercial, Downtown Commercial, and Community Commercial. [This paragraph added by Ordinance No. 770, Passed by Council on July 25, 2006]
A. A general requirement for all residential land use categories is that any lot created after
adoption of this Plan shall be served by a dedicated right-of-way. The Subdivision Ordinance shall establish minimum width and improvement standards of required rights-of-way. In order to provide a correlation between the Comprehensive Plan Text and the Comprehensive Plan Map, the following information regarding the establishment of land use categories is provided.
1. R-1 "Single-Family Residential"
Single-Family Residential areas were designated in areas surrounding existing commercial and multi-family areas of the City. Primarily, these single-family residential lands are the outer edges of the city limits and into the Urban Growth Boundary. Minimum lot size for single-family residential shall be 7,500 square feet requirement. Modular home subdivisions utilizing dwelling units at least 20 feet wide, shall be allowed in the R-1 area. Duplexes shall also be allowed in the R-1 zone.
2. R-2 "Multi-Family Residential" The Multi-Family Residential areas of the City were designated to serve as
a buffer between commercial and single-family residential land uses. It is the intent to provide multi-family dwellings in close proximity of existing commercial use to provide for easier commuting to goods and services for residents of these types of housing units. Neighborhood commercial facilities and mobile home parks shall be allowed after Planning Commission review. The Zoning Ordinance shall specify standards for lot size requirements for housing units locating within the boundaries of the R-2 area.

Page 104
3. R-3 “Planned Residential Development”
Planned Residential Development land use areas, as designated on the Comprehensive Plan Map, are intended to recognize and enhance areas of scenic quality and view amenities by allowing for flexibility in project design while providing for essential development standards. Within these areas development, which is sensitive to the natural topography of the site, minimizes alterations to the land, and maintains, enhances significant natural resources and is compatible with the surrounding development is encouraged.
[Added by Ordinance No. 770, Passed by Council on July 25, 2006] 4. C-1 " Corridor Commercial"
Corridor Commercial land use areas as designated on the Comprehensive Plan Map are provided for the stability and growth of the City’s economic base. The Plan provides for Corridor Commercial land to supplement the existing commercial activities elsewhere in the City and to provide appropriate locations for auto-oriented uses. C-1 commercial lands are located to the North and South of the City’s core commercial area, extending to the city limits. Within the Corridor Commercial areas, the City is committed to providing for auto-dependent and oriented uses while requiring reasonable development standards that will result in better urban design. Major commercial developments, shall be reviewed by the City for compatibility and consistency with the goals and objections of this Plan. No minimum lot size is established, however, all future commercial land uses shall conform to the standards set forth in the Zoning Ordinance, including site plan review.
[Amended by Ordinance No. 770, Passed by Council on July 25, 2006] 5. C-2 “Downtown Commercial”
The City has a strong commitment to foster a vibrant downtown. The C-2 Downtown Commercial designation is intended for commercial areas in and near the historic city center. New development in this district must be appropriate in scale and design to the existing downtown area. Private development and redevelopment and public improvements in the downtown district should enhance the pedestrian environment and provide a mix of uses and services. Uses that are predominantly auto-dependent do

Page 105
not support these goals and are, therefore, restricted in Downtown Commercial areas.
[Added by Ordinance No. 770, Passed by Council on July 25, 2006] 6. C-3 “Community Commercial”
This designation is suitable for areas that contain existing commercial businesses that are auto-oriented, but at a scale that is similar to businesses in the historic city center. Such areas include, but may not be limited to, the commercial area south of downtown. To recognize existing uses, areas designated as Community Commercial are intended to provide for a range of businesses and services that are consistent with the present urban scale of the area. The scale of future development should reflect the transition between downtown uses and Corridor Commercial. Auto-oriented uses are permitted in this district, but on smaller lots with limited parking.
[Added by Ordinance No. 770, Passed by Council on July 25, 2006] 7. NC “Neighborhood Commercial”
Neighborhood Commercial areas within a community provide logical locations for people to gather and create a local business center among residential areas. This provides for efficient use of land and urban services, encourages walking as an alternative to driving, provides more employment and housing options, and provides both formal and informal community gathering places.
8. I “Industrial”
Industrial land is provided in an area of existing industrial use within the City limits of Madras and within the Madras Industrial Park. Future industrial development shall be reviewed by both the City and County to establish compatibility and consistency with the goals and objectives of this Plan. [Amended by Ordinance No. 770, Passed by Council on July 25, 2006. Replaces the M-1 “Light Industrial “and M-2 “Heavy Industrial Zone Designations]

Page 106
9. O/S "Open Space"
The Open Space/Public Facilities land use category is designed to show lands within the planning area that are established parks or lands that are under public ownership with established public uses taking place. [Title Changed to Coincide With Paragraph two, General Discussion, Amended by Ordinance No. 770, Passed by Council on July 25, 2006]
10. A/D “Airport Development”
Airport Development land use areas, as designated on the Comprehensive Plan Map, are intended to provide land adjacent to the airport facilities for future commercial and industrial uses, which may be dependent on air transportation.
[Added by Ordinance No. 770, Passed by Council on July 25, 2006] 11. MPC “Master Planned Community” Overlay
The purpose of the Master Planned Community Overlay is to foster the creation of complete communities with a range of land uses and housing types, permit the application of innovative designs, and to allow greater freedom in land development and flexibility in development standards than may be possible under the strict application of the applicable zoning provisions of this code. In permitting such design and development freedom, the intent is to encourage more efficient uses of land and public facilities and services, to address the community’s need for a variety of housing, commercial and recreational opportunities (particularly public recreational amenities) and to maintain the highest reasonable quality living environment. An approved Master Planned Community Development Plan guides future development of the subject site. All future land use approvals and development (i.e., subdivision approval) for the subject site shall be in accordance with the guidelines established in the approved Master Planned Community Development Plan.
[Added by Ordinance No. 781, Passed by Council on December 12, 2006]

Page 107
12. FH “Floodplain”
The Willow Creek Floodplain, as established by the Federal Insurance Administration, is shown on the Comprehensive Plan Map as an overlay. The underlying land use categories shall control types of land uses that take place. The Floodplain designation is to indicate the special construction techniques to be utilized in this area. The City's Floodplain Ordinance shall be consulted before specific building permits are issued for construction in the area. [Title Changed to Coincide With Paragraph two, General Discussion, Amended by Ordinance No. 770, Passed by Council on July 25, 2006]
13. MO “Medical Overlay”
To provide for the growth and development of hospitals, clinics, or related health care facilities or complexes within a committed community service area. This overlay encourages the development of the facilities in a controlled development framework; provides for a variety of uses that may co-depend and/or support hospitals, clinics, or related health care facilities; protect such areas from encroachment of incompatible land uses that may have an adverse impact on the operation and future expansion of hospitals, clinics, or related health care facilities; and allows existing uses within the overlay boundary to remain conforming to the underlying zoning district.
14. AO “Airport Overlay
This overlay designation is intended to prevent the establishment of air space obstructions in airport approaches and surrounding areas through height restrictions and other land use controls as deemed essential to protect the health, safety and welfare of the people of the City of Madras and Jefferson County. [Added by Ordinance No. 770, Passed by Council on July 25, 2006]
ESTABLISHMENT OF URBAN GROWTH BOUNDARY AND URBANIZATION One of the concepts of the Land Conservation and Development Commission's adopted goals and guidelines is the development of an Urban Growth Boundary. An Urban Growth Boundary is a line around the perimeters of the City, which is a boundary line for the future growth of City

Page 108
and to separate urbanizable land from rural lands. The Urban Growth Boundary must be mutually adopted by both the City and the Jefferson County. Once adopted, the Urban Growth Boundary is difficult to amend. Therefore, establishment of this boundary line was carefully considered. Development of the Urban Growth Boundary for the City of Madras took approximately eighteen months to reach a tentative agreement between the two governing bodies. The boundary is shown on the Comprehensive Plan Map and contains approximately 1,400 acres of additional lands over and above the incorporated limits of the City of Madras. URBAN GROWTH MANAGEMENT PLAN A. Area inside the Urban Growth Boundary shall be zoned to meet City standards for
single-family dwellings. Additional land use designations may also be indicated to be outside of the existing city limits. Jefferson County will utilize the substantive portions of the City's Zoning Ordinance in the administration of this area.
B. Within the Urban Growth area, the City shall retain jurisdiction for the land use
decisions. Subdivision and partitioning developments will be required to meet the City's improvement standards as outlined in the City's Subdivision Ordinance.
[Amended by Ordinance No. 754, Passed by Council on March 14, 2006] C. City policy requires annexation in order to receive sanitary sewer service. Therefore,
developments intending to utilize the minimum lot size standards will be required to locate in close proximity to the existing city limits to receive sewer service.
D. Developments proposed away from sanitary sewer service will be required to meet
region State Department of Environmental Quality standards for subsurface sewage disposal. Further, because sanitary sewer service may be anticipated in the future, proposed developments will be required to submit a redevelopment plan along with the preliminary plat, which provides for an orderly redevelopment of the subdivision in the event sewer service is provided. The development plan will allow a homeowner to reduce an oversized lot, which may not be economical once annexed to the City. Potential buyers must be notified of this option at the time of purchase.
E. The City has determined, in the development of the plan, that the City may not be able
to provide community water service to areas both inside and outside the existing city limits. Therefore, it is understood that within these areas, as of the date of adoption of this plan, the Deschutes Valley Water District may be requested to provide domestic water service to these urbanizing areas.

Page 109
F. The City shall be responsible for the preparation and adoption of the Public Facilities Plan.
AREAS OUTSIDE THE URBAN GROWTH BOUNDARY The City may enter into an agreement with the County that authorizes the City to have land use planning jurisdiction for areas outside of the Urban Growth Boundary. The purpose of such an agreement would be to provide flexibility to approve large, long range development projects, such as a Master Planned Community, even if portions of the property are outside of the UGB at the time of approval. Any such agreement, and approvals there under, would expressly state that no level of urban development or services could be developed until the property was included in the UGB, annexed to the City and zoned for urban development. [Amended by Ordinance No. 781, Passed by Council on December 12, 2006] ADMINISTRATIVE PROCEDURES This Comprehensive Plan shall be reviewed by the Planning Commission every two years in order to provide a working document that is kept up to date as conditions and needs change in the community. When such changes are required, the following processes are established for that purpose. REVISIONS There are two types of revision processes for the Comprehensive Plan. The Plan may be changed by either (1) legislative or (2) quasi-judicial action. Types of revision and processes are outlined below. In determining which process to follow, the City's administrative staff shall review the application and recommend the proper course of action. The administrative decision may be appealed to the Planning Commission. MAJOR REVISIONS (LEGISLATIVE) A major revision to this Plan is defined as a policy making change in the text or plan map that will have widespread and significant impact through the planning area. The proposed change will be considered as a legislative action and will require the following procedure: A. The City Council or Planning Commission may initiate the proposed change. B. The adopted citizen and agency involvement programs shall be utilized to stimulate the
public interest and participation in the amendment process.

Page 110
C. A public hearing shall be conducted by the Planning Commission. D. At least 21 days notice to the public of the hearing shall be published in a local
newspaper of general circulation. E. In order to submit a favorable recommendation for the proposed change to the City
Council, the Planning Commission shall establish the compelling reasons and make a finding of fact for the proposed change. These include:
1. The proposed change will be in conformance with statewide planning
goals. 2. There is a demonstrated need for the proposed change. F. The City Council, upon receipt of the Planning Commission recommendation, may
adopt, reject, or modify the recommendations or may conduct a second public hearing on the proposed change.
G. In all proposed amendment actions, the City Council must make the final decision to
adopt or deny the proposed change. QUASI-JUDICIAL REVISIONS A quasi-judicial revision is defined as an amendment to the Comprehensive Plan Map, which consists of an application of the policies of the Plan to a particular piece of property with no widespread significance and having no general applicability to areas of similar use. A. Private individuals, property owners, or governmental agencies may initiate the
proposed change. Cost for notification and advertising shall be borne by the applicant. B. The adopted citizen and agency involvement programs shall be utilized to stimulate the
public interest and participation in the amendment process. C. A public hearing shall be conducted by the Planning Commission. D. At least 21 days notice to the public of the public hearing shall be provided. The notice
shall be published in a local newspaper of general circulation. E. Individual notices shall be mailed to property owners within 250 feet of the area subject
to the proposed change. These notices shall be mailed at least 21 days prior to the scheduled public hearing.

Page 111
F. In order to submit a favorable recommendation for the proposed change to the City Council, the Planning Commission shall establish the compelling reasons and make the following finding of fact for the proposed change:
1. The proposed change will be in conformance with the statewide planning
goals. 2. There is a demonstrated public need for the proposed change. G. The City Council, upon receipt of the Planning Commission recommendations, may
adopt, reject, or modify the recommendation or may conduct a second public hearing on the proposed change.
H. In all proposed amendment actions, the City Council must make the final decision to
adopt or deny the proposed action. URBAN GROWTH BOUNDARY REVISIONS The Urban Growth Boundary as shown on the Comprehensive Plan Map has been mutually agreed upon and adopted by both the City of Madras and Jefferson County. From time to time, it may be necessary to amend the Urban Growth Boundary. Because two separate jurisdictions are involved, the Urban Growth Boundary amendment process can be quite complicated. In order to provide the most direct approach and hopefully simplify the process, the following steps shall be taken: A. The proposed amendment to the Urban Growth Boundary may be initiated by the City
of Madras or Jefferson County, or other governmental agencies or private individuals. Cost for notification and advertising shall be borne by the applicant.
B. The Madras City Planning Commission shall conduct a public hearing concerning the
proposed boundary amendment. Notice of public hearing requirements shall be the same as those outlined in the quasi-judicial process of the Comprehensive Plan.
C. Citizen and Agency Involvement Programs shall be utilized to stimulate public interest
and participation in the amendment process. D. In order to make a favorable recommendation on the boundary revision, the Planning
Commission shall make its recommendation based upon the consideration of the following factors:
1. Demonstrated need to accommodate long-range urban population growth
requirements consistent with Statewide Planning Goals.
Page 112
2. Need for housing, employment opportunities, and livability. 3. Orderly and economic provision for the public facilities and services. 4. Maximum efficiency of land uses within and on the fringe of the existing
urban area. 5. Environmental, energy, economic, and social consequences. 6. Retention of agricultural land as defined, with Class I being the highest
priority for retention and Class VI the lowest priority. 7. Compatibility of the proposed urban uses with nearby agricultural
activities. E. The City of Madras Planning Commission recommendations and findings shall be
forwarded to the Jefferson County Planning Commission for review and consideration. The Jefferson County Planning Commission may adopt, reject, or modify the recommendation, or may conduct a second public hearing (procedural requirements of which will be in conformance with the adopted hearing process of Jefferson County) to consider the proposed amendment.
F. The two Planning Commission recommendations and findings shall then be transmitted
to the Madras City Council for review and consideration. The City Council may adopt, reject, or modify the recommendations of the Planning Commission, or may conduct another public hearing to receive public input on the proposed amendment.
G. The City Council upon acting on the proposed amendment to the Urban Growth
Boundary, shall then forward its findings to the Jefferson County Board of Commissioners for review and consideration. The Jefferson County Board of Commissioners must conduct a public hearing on the proposed amendment. If, for any reason, the County Board of Commissioners in its findings should determine the boundary line as adopted by the Madras City Council is in appropriate, such findings shall be returned to the Madras City Council for review prior to the formal adoption by the County.
H. A joint work session of the two governing bodies may be required to develop mutual
understanding of the issues involved. I. In the event the matter cannot be mutually agreed upon, the Land Conservation and
Development Commission may be requested to assist in resolving the matter.