retail feasibility study - madras, oregon
TRANSCRIPT

Prepared forCity of MadrasJanuary 2018
RETAIL FEASIBILITY STUDYMadras, Oregon

2
EXISTING RETAILMadras, Oregon
City of Madras | 125 Southwest E Street | Madras, Oregon 97741 | [email protected] | www.ci.madras.or.us
NICHOLAS S. SNEAD, AICP, COMMUNITY DEVELOPMENT DIRECTORCONTACT

3
TRAFFIC COUNTSMadras, Oregon
City of Madras | 125 Southwest E Street | Madras, Oregon 97741 | [email protected] | www.ci.madras.or.us
NICHOLAS S. SNEAD, AICP, COMMUNITY DEVELOPMENT DIRECTORCONTACT
All Counts AADT Source: 2016 ODOT

4
RETAIL TRADE AREAMadras, Oregon
City of Madras | 125 Southwest E Street | Madras, Oregon 97741 | [email protected] | www.ci.madras.or.us
NICHOLAS S. SNEAD, AICP, COMMUNITY DEVELOPMENT DIRECTORCONTACT

5
SECTOR DESCRIPTION POTENTIAL SALES ACTUAL SALES LEAKAGE/SURPLUS SURPLUS %
Total Retail Sales Incl Eating and Drinking Places 270,731,941 122,132,107 (148,599,834) -55%
441 Motor Vehicle and Parts Dealers 57,169,804 16,810,846 (40,358,958) -71%
4411 Automotive Dealers 47,118,099 13,613,205 (33,504,894) -71%
4412 Other Motor Vehicle Dealers 6,036,103 0 (6,036,103) -100%
4413 Automotive Parts/Accsrs, Tire Stores 4,015,603 3,197,641 (817,962) -20%
442 Furniture and Home Furnishings Stores 4,903,143 2,691,685 (2,211,458) -45%
4421 Furniture Stores 2,624,136 426,632 (2,197,504) -84%
4422 Home Furnishing Stores 2,279,006 2,265,053 (13,953) -1%
443 Electronics and Appliance Stores 4,448,406 4,253,620 (194,786) -4%
44311 Appliances, TVs, Electronics Stores 4,448,406 4,253,620 (194,786) -4%
443111 Household Appliances Stores 615,530 3,190,365 2,574,835 418%
443112 Electronics Stores 3,832,876 1,063,255 (2,769,621) -72%
444 Building Material, Garden Equip Stores 27,956,622 4,507,402 (23,449,220) -84%
4441 Building Material and Supply Dealers 23,669,325 2,505,726 (21,163,599) -89%
44411 Home Centers 9,532,429 0 (9,532,429) -100%
44412 Paint and Wallpaper Stores 374,995 29,471 (345,524) -92%
44413 Hardware Stores 2,532,240 2,206,738 (325,502) -13%
44419 Other Building Materials Dealers 11,229,662 269,517 (10,960,145) -98%
444191 Building Materials, Lumberyards 4,178,218 7,100,707 2,922,489 70%
4442 Lawn, Garden Equipment, Supplies Stores 4,287,297 2,001,676 (2,285,621) -53%
44421 Outdoor Power Equipment Stores 1,250,772 0 (1,250,772) -100%
44422 Nursery and Garden Centers 3,036,525 2,001,676 (1,034,849) -34%
RETAIL TRADE AREA • GAP/OPPORTUNITY ANALYSISMadras, Oregon

6
SECTOR DESCRIPTION POTENTIAL SALES ACTUAL SALES LEAKAGE/SURPLUS SURPLUS %
445 Food and Beverage Stores 36,480,234 28,904,170 (7,576,064) -21%
4451 Grocery Stores 24,192,637 24,404,576 211,939 1%
44511 Supermarkets, Grocery (Ex Conv) Stores 22,589,790 22,270,943 (318,847) -1%
44512 Convenience Stores 1,602,847 2,133,633 530,786 33%
4452 Specialty Food Stores 3,051,699 101,512 (2,950,187) -97%
4453 Beer, Wine and Liquor Stores 9,235,898 4,398,082 (4,837,816) -52%
446 Health and Personal Care Stores 14,553,298 8,394,555 (6,158,743) -42%
44611 Pharmacies and Drug Stores 11,618,804 7,353,490 (4,265,314) -37%
44612 Cosmetics, Beauty Supplies, Perfume Stores 1,010,523 0 (1,010,523) -100%
44613 Optical Goods Stores 631,635 70,991 (560,644) -89%
44619 Other Health and Personal Care Stores 1,292,337 970,074 (322,263) -25%
447 Gasoline Stations 20,442,293 12,625,014 (7,817,279) -38%
44711 Gasoline Stations With Conv Stores 14,968,276 9,067,244 (5,901,032) -39%
44719 Other Gasoline Stations 5,474,017 3,557,770 (1,916,247) -35%
448 Clothing and Clothing Accessories Stores 11,834,850 4,760,531 (7,074,319) -60%
4481 Clothing Stores 6,566,061 1,181,686 (5,384,375) -82%
44811 Men’s Clothing Stores 353,567 0 (353,567) -100%
44812 Women’s Clothing Stores 1,505,128 0 (1,505,128) -100%
44813 Childrens, Infants Clothing Stores 470,966 0 (470,966) -100%
44814 Family Clothing Stores 3,419,699 1,122,000 (2,297,699) -67%
44815 Clothing Accessories Stores 269,027 59,686 (209,341) -78%
44819 Other Clothing Stores 547,674 0 (547,674) -100%
4482 Shoe Stores 1,080,021 519,026 (560,995) -52%
4483 Jewelry, Luggage, Leather Goods Stores 4,188,768 3,059,819 (1,128,949) -27%
44831 Jewelry Stores 3,723,492 3,059,819 (663,673) -18%
44832 Luggage and Leather Goods Stores 465,276 0 (465,276) -100%
RETAIL TRADE AREA • GAP/OPPORTUNITY ANALYSISMadras, Oregon

7
RETAIL TRADE AREA • GAP/OPPORTUNITY ANALYSISMadras, Oregon
SECTOR DESCRIPTION POTENTIAL SALES ACTUAL SALES LEAKAGE/SURPLUS SURPLUS %
451 Sporting Goods, Hobby, Book, Music Stores 4,758,331 3,150,290 (1,608,041) -34%
4511 Sportng Goods, Hobby, Musical Inst Stores 4,158,587 3,032,544 (1,126,043) -27%
45111 Sporting Goods Stores 2,280,802 3,025,060 744,258 33%
45112 Hobby, Toys and Games Stores 1,133,534 7,484 (1,126,050) -99%
45113 Sew/Needlework/Piece Goods Stores 419,551 0 (419,551) -100%
45114 Musical Instrument and Supplies Stores 324,700 0 (324,700) -100%
4512 Book, Periodical and Music Stores 599,744 117,746 (481,998) -80%
45121 Book Stores and News Dealers 510,702 117,746 (392,956) -77%
451211 Book Stores 440,614 76,325 (364,289) -83%
451212 News Dealers and Newsstands 70,089 41,421 (28,668) -41%
45122 Prerecorded Tapes, CDs, Record Stores 89,041 0 (89,041) -100%
452 General Merchandise Stores 31,656,656 15,860,121 (15,796,535) -50%
4521 Department Stores Excl Leased Depts 13,209,833 553,301 (12,656,532) -96%
4529 Other General Merchandise Stores 18,446,823 15,306,820 (3,140,003) -17%
453 Miscellaneous Store Retailers 7,535,333 813,100 (6,722,233) -89%
4531 Florists 271,112 411,757 140,645 52%
4532 Office Supplies, Stationery, Gift Stores 3,375,077 158,500 (3,216,577) -95%
45321 Office Supplies and Stationery Stores 1,535,311 158,500 (1,376,811) -90%
45322 Gift, Novelty and Souvenir Stores 1,839,766 0 (1,839,766) -100%
4533 Used Merchandise Stores 531,024 30,822 (500,202) -94%
4539 Other Miscellaneous Store Retailers 3,358,120 212,021 (3,146,099) -94%
454 Non-Store Retailers 23,425,129 1,253,620 (22,171,509) -95%
722 Foodservice and Drinking Places 25,567,840 18,107,153 (7,460,687) -29%
7221 Full-Service Restaurants 11,332,498 7,131,622 (4,200,876) -37%
7222 Limited-Service Eating Places 10,445,289 10,509,054 63,765 1%
7223 Special Foodservices 2,892,249 0 (2,892,249) -100%
7224 Drinking Places -Alcoholic Beverages 897,803 466,477 (431,326) -48%

8
DESCRIPTION DATA %
Population
2022 Projection 20,602
2017 Estimate 19,698
2010 Census 18,706
2000 Census 16,282
Growth 2017 - 2022 4.6%
Growth 2010 - 2017 5.3%
Growth 2000 - 2010 14.9%
2017 Est. Population by Single-Classification Race 19,698
White Alone 11,596 58.9%
Black or African American Alone 180 0.9%
Amer. Indian and Alaska Native Alone 4,605 23.4%
Asian Alone 195 1.0%
Native Hawaiian and Other Pac. Isl. Alone 49 0.2%
Some Other Race Alone 2,113 10.7%
Two or More Races 959 4.9%
2017 Est. Population by Hispanic or Latino Origin 19,698
Not Hispanic or Latino 15,146 76.9%
Hispanic or Latino 4,553 23.1%
Mexican 3,935 86.4%
Puerto Rican 35 0.8%
Cuban 3 0.1%
All Other Hispanic or Latino 580 12.7%
DESCRIPTION DATA %
2017 Est. Hisp. or Latino Pop by Single-Class. Race 4,553
White Alone 1,659 36.4%
Black or African American Alone 23 0.5%
American Indian and Alaska Native Alone 401 8.8%
Asian Alone 10 0.2%
Native Hawaiian and Other Pacific Islander Alone 2 0.0%
Some Other Race Alone 2,080 45.7%
Two or More Races 378 8.3%
2017 Est. Pop by Race, Asian Alone, by Category 195
Chinese, except Taiwanese 1 0.5%
Filipino 27 13.8%
Japanese 22 11.3%
Asian Indian 142 72.8%
Korean 0 0.0%
Vietnamese 1 0.5%
Cambodian 0 0.0%
Hmong 0 0.0%
Laotian 0 0.0%
Thai 1 0.5%
All Other Asian Races Including 2+ Category 1 0.5%
RETAIL TRADE AREA • DEMOGRAPHIC PROFILEMadras, Oregon

9
DESCRIPTION DATA %
2017 Est. Population by Ancestry 19,698
Arab 17 0.1%
Czech 118 0.6%
Danish 76 0.4%
Dutch 273 1.4%
English 704 3.6%
French (except Basque) 145 0.7%
French Canadian 45 0.2%
German 1,868 9.5%
Greek 1 0.0%
Hungarian 32 0.2%
Irish 1,264 6.4%
Italian 236 1.2%
Lithuanian 7 0.0%
United States or American 903 4.6%
Norwegian 388 2.0%
Polish 125 0.6%
Portuguese 32 0.2%
Russian 7 0.0%
Scottish 309 1.6%
Scotch-Irish 75 0.4%
Slovak 0 0.0%
Subsaharan African 9 0.0%
Swedish 292 1.5%
Swiss 74 0.4%
Ukrainian 4 0.0%
Welsh 40 0.2%
West Indian (except Hisp. groups) 35 0.2%
Other ancestries 9,555 48.5%
Ancestry Unclassified 3,066 15.6%
DESCRIPTION DATA %
2017 Est. Pop Age 5+ by Language Spoken At Home 0
Speak Only English at Home 14,400 79.2%
Speak Asian/Pac. Isl. Lang. at Home 147 0.8%
Speak IndoEuropean Language at Home 78 0.4%
Speak Spanish at Home 3,049 16.8%
Speak Other Language at Home 516 2.8%
2017 Est. Population by Age 19,698
Age 0 - 4 1,507 7.7%
Age 5 - 9 1,487 7.5%
Age 10 - 14 1,440 7.3%
Age 15 - 17 819 4.2%
Age 18 - 20 769 3.9%
Age 21 - 24 1,079 5.5%
Age 25 - 34 2,597 13.2%
Age 35 - 44 2,340 11.9%
Age 45 - 54 2,303 11.7%
Age 55 - 64 2,375 12.1%
Age 65 - 74 1,864 9.5%
Age 75 - 84 838 4.3%
Age 85 and over 278 1.4%
Age 16 and over 14,996 76.1%
Age 18 and over 14,444 73.3%
Age 21 and over 13,675 69.4%
Age 65 and over 2,981 15.1%
2017 Est. Median Age 35.62
2017 Est. Average Age 37.40
RETAIL TRADE AREA • DEMOGRAPHIC PROFILEMadras, Oregon

10
DESCRIPTION DATA %
2017 Est. Population by Sex 19,698
Male 10,272 5215%
Female 9,426 4785%
2017 Est. Male Population by Age 10,272
Age 0 - 4 783 7.6%
Age 5 - 9 789 7.7%
Age 10 - 14 741 7.2%
Age 15 - 17 411 4.0%
Age 18 - 20 405 3.9%
Age 21 - 24 592 5.8%
Age 25 - 34 1,403 13.7%
Age 35 - 44 1,261 12.3%
Age 45 - 54 1,216 11.8%
Age 55 - 64 1,226 11.9%
Age 65 - 74 934 9.1%
Age 75 - 84 398 3.9%
Age 85 and over 114 1.1%
2017 Est. Median Age, Male 35.10
2017 Est. Average Age, Male 36.70
RETAIL TRADE AREA • DEMOGRAPHIC PROFILEMadras, Oregon
DESCRIPTION DATA %
2017 Est. Female Population by Age 9,426
Age 0 - 4 724 7.7%
Age 5 - 9 698 7.4%
Age 10 - 14 699 7.4%
Age 15 - 17 408 4.3%
Age 18 - 20 365 3.9%
Age 21 - 24 487 5.2%
Age 25 - 34 1,195 12.7%
Age 35 - 44 1,079 11.4%
Age 45 - 54 1,087 11.5%
Age 55 - 64 1,150 12.2%
Age 65 - 74 930 9.9%
Age 75 - 84 440 4.7%
Age 85 and over 164 1.7%
2017 Est. Median Age, Female 36.23
2017 Est. Average Age, Female 38.20
2017 Est. Pop Age 15+ by Marital Status 0
Total, Never Married 4,874 31.9%
Males, Never Married 2,732 17.9%
Females, Never Married 2,142 14.0%
Married, Spouse present 5,974 39.1%
Married, Spouse absent 977 6.4%
Widowed 757 5.0%
Males Widowed 173 1.1%
Females Widowed 584 3.8%
Divorced 2,682 17.6%
Males Divorced 1,497 9.8%
Females Divorced 1,185 7.8%

11
DESCRIPTION DATA %
2017 Est. Pop Age 25+ by Edu. Attainment 0
Less than 9th grade 805 6.4%
Some High School, no diploma 1,527 12.1%
High School Graduate (or GED) 3,920 31.1%
Some College, no degree 3,526 28.0%
Associate Degree 998 7.9%
Bachelor's Degree 1,159 9.2%
Master's Degree 553 4.4%
Professional School Degree 60 0.5%
Doctorate Degree 47 0.4%
2017 Est. Pop Age 25+ by Edu. Attain., Hisp./Lat. 0
No High School Diploma 1,001 49.0%
High School Graduate 661 32.4%
Some College or Associate's Degree 211 10.3%
Bachelor's Degree or Higher 169 8.3%
Households
2022 Projection 7,094
2017 Estimate 6,740
2010 Census 6,316
2000 Census 5,512
Growth 2017 - 2022 5.3%
Growth 2010 - 2017 6.7%
Growth 2000 - 2010 14.6%
RETAIL TRADE AREA • DEMOGRAPHIC PROFILEMadras, Oregon
DESCRIPTION DATA %
2017 Est. Households by Household Type 6,740
Family Households 4,896 72.6%
Nonfamily Households 1,844 27.4%
2017 Est. Group Quarters Population 922
2017 HHs by Ethnicity, Hispanic/Latino 1,104
2017 Est. Households by HH Income 6,740
Income < $15,000 792 11.8%
Income $15,000 - $24,999 769 11.4%
Income $25,000 - $34,999 798 11.8%
Income $35,000 - $49,999 1,116 16.6%
Income $50,000 - $74,999 1,508 22.4%
Income $75,000 - $99,999 782 11.6%
Income $100,000 - $124,999 452 6.7%
Income $125,000 - $149,999 252 3.7%
Income $150,000 - $199,999 161 2.4%
Income $200,000 - $249,999 53 0.8%
Income $250,000 - $499,999 45 0.7%
Income $500,000+ 12 0.2%
2017 Est. Average Household Income $59,726
2017 Est. Median Household Income $48,503

12
DESCRIPTION DATA %
2017 Median HH Inc. by Single-Class. Race or Eth.
White Alone $517
Black or African American Alone $513
American Indian and Alaska Native Alone $487
Asian Alone $346
Native Hawaiian and Other Pacific Islander Alone $629
Some Other Race Alone $330
Two or More Races $376
Hispanic or Latino $409
Not Hispanic or Latino $514
2017 Est. Family HH Type by Presence of Own Child. 4,896
Married-Couple Family, own children 1,298 26.5%
Married-Couple Family, no own children 2,085 42.6%
Male Householder, own children 274 5.6%
Male Householder, no own children 236 4.8%
Female Householder, own children 612 12.5%
Female Householder, no own children 392 8.0%
2017 Est. Households by Household Size 6,740
1-person 1,566 23.2%
2-person 2,279 33.8%
3-person 975 14.5%
4-person 863 12.8%
5-person 541 8.0%
6-person 275 4.1%
7-or-more-person 242 3.6%
2017 Est. Average Household Size 2.79
DESCRIPTION DATA %
2017 Est. Households by Presence of People Under 18 6,740
Households with 1 or More People under Age 18: 2,618 38.8%
Married-Couple Family 1,484 56.7%
Other Family, Male Householder 353 13.5%
Other Family, Female Householder 754 28.8%
Nonfamily, Male Householder 20 0.8%
Nonfamily, Female Householder 8 0.3%
Households with No People under Age 18: 4,122 61.2%
Married-Couple Family 1,899 46.1%
Other Family, Male Householder 157 3.8%
Other Family, Female Householder 253 6.1%
Nonfamily, Male Householder 977 23.7%
Nonfamily, Female Householder 837 20.3%
2017 Est. Households by Number of Vehicles 6,740
No Vehicles 383 5.7%
1 Vehicle 1,914 28.4%
2 Vehicles 2,583 38.3%
3 Vehicles 1,296 19.2%
4 Vehicles 411 6.1%
5 or more Vehicles 153 2.3%
2017 Est. Average Number of Vehicles 2
RETAIL TRADE AREA • DEMOGRAPHIC PROFILEMadras, Oregon

13
DESCRIPTION DATA %
Family Households
2022 Projection 5,158
2017 Estimate 4,896
2010 Census 4,578
2000 Census 4,204
Growth 2017 - 2022 5.4%
Growth 2010 - 2017 6.9%
Growth 2000 - 2010 8.9%
2017 Est. Families by Poverty Status 4,896
2017 Families at or Above Poverty 4,003 81.8%
2017 Families at or Above Poverty with Children 1,673 34.2%
2017 Families Below Poverty 893 18.2%
2017 Families Below Poverty with Children 760 15.5%
2017 Est. Civ. Employed Pop 16+ by Class of Worker 7,207
For-Profit Private Workers 4,396 61.0%
Non-Profit Private Workers 453 6.3%
Local Government Workers 349 4.8%
State Government Workers 267 3.7%
Federal Government Workers 1,164 16.2%
Self-Employed Workers 576 8.0%
Unpaid Family Workers 3 0.0%
RETAIL TRADE AREA • DEMOGRAPHIC PROFILEMadras, Oregon
DESCRIPTION DATA %
2017 Est. Civ. Employed Pop 16+ by Occupation 7,207
Architect/Engineer 90 1.2%
Arts/Entertainment/Sports 83 1.2%
Building Grounds Maintenance 418 5.8%
Business/Financial Operations 97 1.3%
Community/Social Services 96 1.3%
Computer/Mathematical 6 0.1%
Construction/Extraction 328 4.6%
Education/Training/Library 486 6.7%
Farming/Fishing/Forestry 468 6.5%
Food Prep/Serving 387 5.4%
Health Practitioner/Technician 180 2.5%
Healthcare Support 233 3.2%
Maintenance Repair 230 3.2%
Legal 61 0.8%
Life/Physical/Social Science 70 1.0%
Management 591 8.2%
Office/Admin. Support 941 13.1%
Production 611 8.5%
Protective Services 264 3.7%
Sales/Related 539 7.5%
Personal Care/Service 323 4.5%
Transportation/Moving 704 9.8%
2017 Est. Pop 16+ by Occupation Classification 7,207
Blue Collar 3,240 45.0%
White Collar 1,873 26.0%
Service and Farm 2,094 29.1%
14
DESCRIPTION DATA %
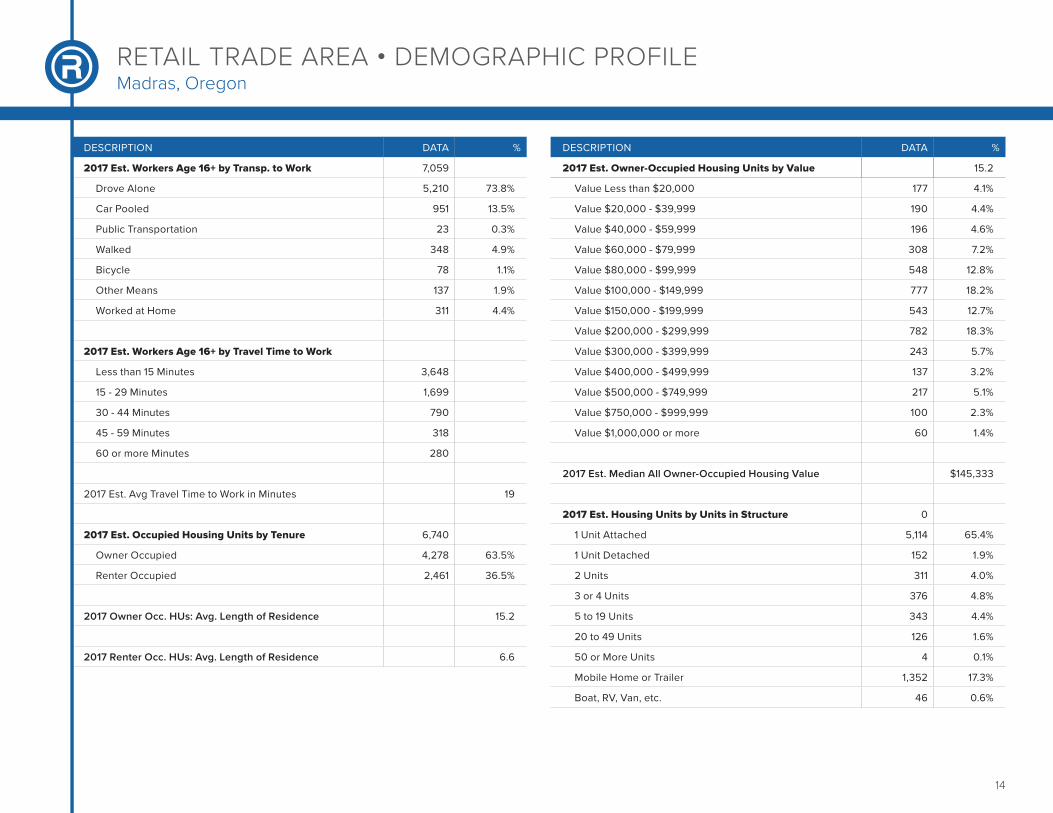
2017 Est. Workers Age 16+ by Transp. to Work 7,059
Drove Alone 5,210 73.8%
Car Pooled 951 13.5%
Public Transportation 23 0.3%
Walked 348 4.9%
Bicycle 78 1.1%
Other Means 137 1.9%
Worked at Home 311 4.4%
2017 Est. Workers Age 16+ by Travel Time to Work
Less than 15 Minutes 3,648
15 - 29 Minutes 1,699
30 - 44 Minutes 790
45 - 59 Minutes 318
60 or more Minutes 280
2017 Est. Avg Travel Time to Work in Minutes 19
2017 Est. Occupied Housing Units by Tenure 6,740
Owner Occupied 4,278 63.5%
Renter Occupied 2,461 36.5%
2017 Owner Occ. HUs: Avg. Length of Residence 15.2
2017 Renter Occ. HUs: Avg. Length of Residence 6.6
RETAIL TRADE AREA • DEMOGRAPHIC PROFILEMadras, Oregon
DESCRIPTION DATA %
2017 Est. Owner-Occupied Housing Units by Value 15.2
Value Less than $20,000 177 4.1%
Value $20,000 - $39,999 190 4.4%
Value $40,000 - $59,999 196 4.6%
Value $60,000 - $79,999 308 7.2%
Value $80,000 - $99,999 548 12.8%
Value $100,000 - $149,999 777 18.2%
Value $150,000 - $199,999 543 12.7%
Value $200,000 - $299,999 782 18.3%
Value $300,000 - $399,999 243 5.7%
Value $400,000 - $499,999 137 3.2%
Value $500,000 - $749,999 217 5.1%
Value $750,000 - $999,999 100 2.3%
Value $1,000,000 or more 60 1.4%
2017 Est. Median All Owner-Occupied Housing Value $145,333
2017 Est. Housing Units by Units in Structure 0
1 Unit Attached 5,114 65.4%
1 Unit Detached 152 1.9%
2 Units 311 4.0%
3 or 4 Units 376 4.8%
5 to 19 Units 343 4.4%
20 to 49 Units 126 1.6%
50 or More Units 4 0.1%
Mobile Home or Trailer 1,352 17.3%
Boat, RV, Van, etc. 46 0.6%

15
RETAIL TRADE AREA • DEMOGRAPHIC PROFILEMadras, Oregon
DESCRIPTION DATA %
2017 Est. Housing Units by Year Structure Built 0
Housing Units Built 2010 or later 493 6.3%
Housing Units Built 2000 to 2009 1,273 16.3%
Housing Units Built 1990 to 1999 1,585 20.3%
Housing Units Built 1980 to 1989 984 12.6%
Housing Units Built 1970 to 1979 1,351 17.3%
Housing Units Built 1960 to 1969 723 9.2%
Housing Units Built 1950 to 1959 730 9.3%
Housing Units Built 1940 to 1949 357 4.6%
Housing Unit Built 1939 or Earlier 327 4.2%
2017 Est. Median Year Structure Built 1984
16
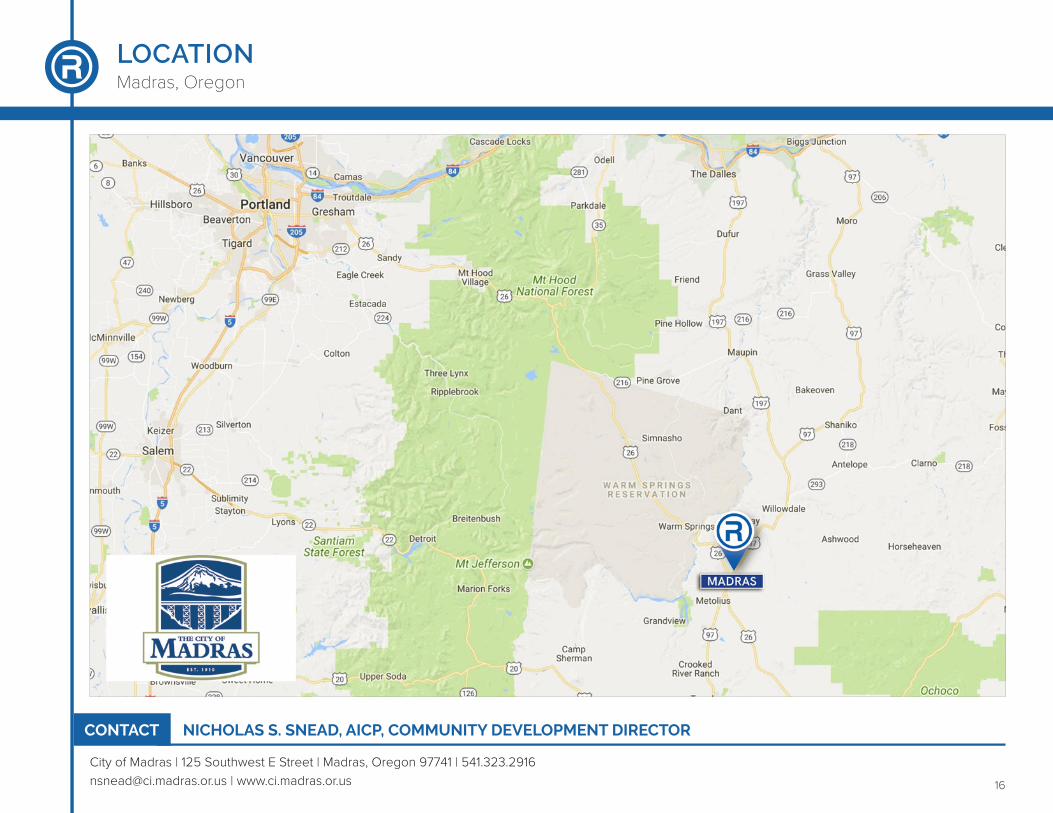
LOCATIONMadras, Oregon
City of Madras | 125 Southwest E Street | Madras, Oregon 97741 | [email protected] | www.ci.madras.or.us
NICHOLAS S. SNEAD, AICP, COMMUNITY DEVELOPMENT DIRECTORCONTACT

17
DESCRIPTION DATA %
Population
2022 Projection 6,848
2017 Estimate 6,591
2010 Census 6,046
2000 Census 5,353
Growth 2017 - 2022 3.9%
Growth 2010 - 2017 9.0%
Growth 2000 - 2010 12.9%
2017 Est. Population by Single-Classification Race 6,591
White Alone 4,389 66.6%
Black or African American Alone 63 1.0%
Amer. Indian and Alaska Native Alone 455 6.9%
Asian Alone 84 1.3%
Native Hawaiian and Other Pac. Isl. Alone 26 0.4%
Some Other Race Alone 1,195 18.1%
Two or More Races 379 5.8%
2017 Est. Population by Hispanic or Latino Origin 6,591
Not Hispanic or Latino 4,243 64.4%
Hispanic or Latino 2,348 35.6%
Mexican 1,982 84.4%
Puerto Rican 17 0.7%
Cuban 1 0.0%
All Other Hispanic or Latino 348 14.8%
DESCRIPTION DATA %
2017 Est. Hisp. or Latino Pop by Single-Class. Race 2,348
White Alone 904 38.5%
Black or African American Alone 18 0.8%
American Indian and Alaska Native Alone 85 3.6%
Asian Alone 9 0.4%
Native Hawaiian and Other Pacific Islander Alone 0 0.0%
Some Other Race Alone 1,178 50.2%
Two or More Races 154 6.6%
2017 Est. Pop by Race, Asian Alone, by Category 84
Chinese, except Taiwanese 0 0.0%
Filipino 0 0.0%
Japanese 10 11.9%
Asian Indian 74 88.1%
Korean 0 0.0%
Vietnamese 0 0.0%
Cambodian 0 0.0%
Hmong 0 0.0%
Laotian 0 0.0%
Thai 0 0.0%
All Other Asian Races Including 2+ Category 0 0.0%
COMMUNITY • DEMOGRAPHIC PROFILEMadras, Oregon

18
DESCRIPTION DATA %
2017 Est. Population by Ancestry 6,591
Arab 1 0.0%
Czech 13 0.2%
Danish 38 0.6%
Dutch 95 1.4%
English 219 3.3%
French (except Basque) 57 0.9%
French Canadian 10 0.2%
German 602 9.1%
Greek 0 0.0%
Hungarian 2 0.0%
Irish 491 7.5%
Italian 30 0.5%
Lithuanian 0 0.0%
United States or American 301 4.6%
Norwegian 152 2.3%
Polish 79 1.2%
Portuguese 10 0.2%
Russian 0 0.0%
Scottish 134 2.0%
Scotch-Irish 10 0.2%
Slovak 0 0.0%
Subsaharan African 1 0.0%
Swedish 78 1.2%
Swiss 5 0.1%
Ukrainian 0 0.0%
Welsh 11 0.2%
West Indian (except Hisp. groups) 0 0.0%
Other ancestries 2,986 45.3%
Ancestry Unclassified 1,266 19.2%
DESCRIPTION DATA %
2017 Est. Pop Age 5+ by Language Spoken At Home 0
Speak Only English at Home 4,342 72.0%
Speak Asian/Pac. Isl. Lang. at Home 56 0.9%
Speak IndoEuropean Language at Home 5 0.1%
Speak Spanish at Home 1,563 25.9%
Speak Other Language at Home 68 1.1%
2017 Est. Population by Age 6,591
Age 0 - 4 557 8.5%
Age 5 - 9 540 8.2%
Age 10 - 14 508 7.7%
Age 15 - 17 272 4.1%
Age 18 - 20 250 3.8%
Age 21 - 24 339 5.1%
Age 25 - 34 833 12.6%
Age 35 - 44 762 11.6%
Age 45 - 54 770 11.7%
Age 55 - 64 740 11.2%
Age 65 - 74 605 9.2%
Age 75 - 84 306 4.6%
Age 85 and over 109 1.7%
Age 16 and over 4,896 74.3%
Age 18 and over 4,714 71.5%
Age 21 and over 4,464 67.7%
Age 65 and over 1,020 15.5%
2017 Est. Median Age 34.96
2017 Est. Average Age 36.90
COMMUNITY • DEMOGRAPHIC PROFILEMadras, Oregon

19
DESCRIPTION DATA %
2017 Est. Population by Sex 6,591
Male 3,251 4933%
Female 3,340 5068%
2017 Est. Male Population by Age 3,251
Age 0 - 4 290 8.9%
Age 5 - 9 283 8.7%
Age 10 - 14 251 7.7%
Age 15 - 17 133 4.1%
Age 18 - 20 125 3.8%
Age 21 - 24 175 5.4%
Age 25 - 34 398 12.2%
Age 35 - 44 375 11.5%
Age 45 - 54 382 11.8%
Age 55 - 64 373 11.5%
Age 65 - 74 291 9.0%
Age 75 - 84 132 4.1%
Age 85 and over 43 1.3%
2017 Est. Median Age, Male 34.23
2017 Est. Average Age, Male 36.20
COMMUNITY • DEMOGRAPHIC PROFILEMadras, Oregon
DESCRIPTION DATA %
2017 Est. Female Population by Age 3,340
Age 0 - 4 267 8.0%
Age 5 - 9 257 7.7%
Age 10 - 14 257 7.7%
Age 15 - 17 139 4.2%
Age 18 - 20 125 3.7%
Age 21 - 24 164 4.9%
Age 25 - 34 435 13.0%
Age 35 - 44 387 11.6%
Age 45 - 54 388 11.6%
Age 55 - 64 367 11.0%
Age 65 - 74 314 9.4%
Age 75 - 84 174 5.2%
Age 85 and over 66 2.0%
2017 Est. Median Age, Female 35.65
2017 Est. Average Age, Female 37.70
2017 Est. Pop Age 15+ by Marital Status 0
Total, Never Married 1,592 31.9%
Males, Never Married 769 15.4%
Females, Never Married 823 16.5%
Married, Spouse present 1,949 39.1%
Married, Spouse absent 305 6.1%
Widowed 263 5.3%
Males Widowed 71 1.4%
Females Widowed 192 3.9%
Divorced 877 17.6%
Males Divorced 456 9.1%
Females Divorced 421 8.4%

20
DESCRIPTION DATA %
2017 Est. Pop Age 25+ by Edu. Attainment 0
Less than 9th grade 343 8.3%
Some High School, no diploma 481 11.7%
High School Graduate (or GED) 1,268 30.7%
Some College, no degree 975 23.6%
Associate Degree 387 9.4%
Bachelor's Degree 419 10.2%
Master's Degree 231 5.6%
Professional School Degree 11 0.3%
Doctorate Degree 10 0.2%
2017 Est. Pop Age 25+ by Edu. Attain., Hisp./Lat. 0
No High School Diploma 505 46.3%
High School Graduate 400 36.7%
Some College or Associate's Degree 88 8.1%
Bachelor's Degree or Higher 98 9.0%
Households
2022 Projection 2,568
2017 Estimate 2,463
2010 Census 2,238
2000 Census 1,917
Growth 2017 - 2022 4.3%
Growth 2010 - 2017 10.1%
Growth 2000 - 2010 16.7%
COMMUNITY • DEMOGRAPHIC PROFILEMadras, Oregon
DESCRIPTION DATA %
2017 Est. Households by Household Type 2,463
Family Households 1,707 69.3%
Nonfamily Households 756 30.7%
2017 Est. Group Quarters Population 56
2017 HHs by Ethnicity, Hispanic/Latino 600
2017 Est. Households by HH Income 2,463
Income < $15,000 310 12.6%
Income $15,000 - $24,999 312 12.7%
Income $25,000 - $34,999 274 11.1%
Income $35,000 - $49,999 458 18.6%
Income $50,000 - $74,999 539 21.9%
Income $75,000 - $99,999 275 11.2%
Income $100,000 - $124,999 118 4.8%
Income $125,000 - $149,999 75 3.0%
Income $150,000 - $199,999 59 2.4%
Income $200,000 - $249,999 15 0.6%
Income $250,000 - $499,999 22 0.9%
Income $500,000+ 6 0.2%
2017 Est. Average Household Income $57,757
2017 Est. Median Household Income $45,828

21
DESCRIPTION DATA %
2017 Median HH Inc. by Single-Class. Race or Eth.
White Alone $501
Black or African American Alone $510
American Indian and Alaska Native Alone $422
Asian Alone $280
Native Hawaiian and Other Pacific Islander Alone $629
Some Other Race Alone $303
Two or More Races $197
Hispanic or Latino $421
Not Hispanic or Latino $486
2017 Est. Family HH Type by Presence of Own Child. 1,707
Married-Couple Family, own children 501 29.4%
Married-Couple Family, no own children 713 41.8%
Male Householder, own children 90 5.3%
Male Householder, no own children 63 3.7%
Female Householder, own children 228 13.4%
Female Householder, no own children 112 6.6%
2017 Est. Households by Household Size 2,463
1-person 627 25.5%
2-person 826 33.5%
3-person 351 14.3%
4-person 327 13.3%
5-person 192 7.8%
6-person 86 3.5%
7-or-more-person 54 2.2%
2017 Est. Average Household Size 2.65
DESCRIPTION DATA %
2017 Est. Households by Presence of People Under 18 2,463
Households with 1 or More People under Age 18: 925 37.6%
Married-Couple Family 553 59.8%
Other Family, Male Householder 107 11.6%
Other Family, Female Householder 255 27.6%
Nonfamily, Male Householder 9 1.0%
Nonfamily, Female Householder 1 0.1%
Households with No People under Age 18: 1,538 62.4%
Married-Couple Family 660 42.9%
Other Family, Male Householder 46 3.0%
Other Family, Female Householder 86 5.6%
Nonfamily, Male Householder 371 24.1%
Nonfamily, Female Householder 375 24.4%
2017 Est. Households by Number of Vehicles 2,463
No Vehicles 187 7.6%
1 Vehicle 803 32.6%
2 Vehicles 846 34.3%
3 Vehicles 441 17.9%
4 Vehicles 136 5.5%
5 or more Vehicles 50 2.0%
2017 Est. Average Number of Vehicles 1.9
COMMUNITY • DEMOGRAPHIC PROFILEMadras, Oregon

22
DESCRIPTION DATA %
Family Households
2022 Projection 1,779
2017 Estimate 1,707
2010 Census 1,549
2000 Census 1,390
Growth 2017 - 2022 4.2%
Growth 2010 - 2017 10.2%
Growth 2000 - 2010 11.4%
2017 Est. Families by Poverty Status 1,707
2017 Families at or Above Poverty 1,340 78.5%
2017 Families at or Above Poverty with Children 569 33.3%
2017 Families Below Poverty 367 21.5%
2017 Families Below Poverty with Children 322 18.9%
2017 Est. Civ. Employed Pop 16+ by Class of Worker 2,576
For-Profit Private Workers 1,764 68.5%
Non-Profit Private Workers 140 5.4%
Local Government Workers 122 4.7%
State Government Workers 56 2.2%
Federal Government Workers 312 12.1%
Self-Employed Workers 181 7.0%
Unpaid Family Workers 1 0.0%
COMMUNITY • DEMOGRAPHIC PROFILEMadras, Oregon
DESCRIPTION DATA %
2017 Est. Civ. Employed Pop 16+ by Occupation 2,576
Architect/Engineer 43 1.7%
Arts/Entertainment/Sports 35 1.4%
Building Grounds Maintenance 149 5.8%
Business/Financial Operations 12 0.5%
Community/Social Services 6 0.2%
Computer/Mathematical 1 0.0%
Construction/Extraction 145 5.6%
Education/Training/Library 150 5.8%
Farming/Fishing/Forestry 164 6.4%
Food Prep/Serving 174 6.8%
Health Practitioner/Technician 47 1.8%
Healthcare Support 97 3.8%
Maintenance Repair 94 3.6%
Legal 21 0.8%
Life/Physical/Social Science 14 0.5%
Management 167 6.5%
Office/Admin. Support 346 13.4%
Production 272 10.6%
Protective Services 80 3.1%
Sales/Related 201 7.8%
Personal Care/Service 79 3.1%
Transportation/Moving 279 10.8%
2017 Est. Pop 16+ by Occupation Classification 2,576
Blue Collar 1,043 40.5%
White Collar 790 30.7%
Service and Farm 743 28.8%

23
DESCRIPTION DATA %
2017 Est. Workers Age 16+ by Transp. to Work 2,519
Drove Alone 1,855 73.6%
Car Pooled 348 13.8%
Public Transportation 10 0.4%
Walked 128 5.1%
Bicycle 55 2.2%
Other Means 51 2.0%
Worked at Home 72 2.9%
2017 Est. Workers Age 16+ by Travel Time to Work
Less than 15 Minutes 1,433
15 - 29 Minutes 546
30 - 44 Minutes 274
45 - 59 Minutes 115
60 or more Minutes 77
2017 Est. Avg Travel Time to Work in Minutes 19
2017 Est. Occupied Housing Units by Tenure 2,463
Owner Occupied 1,410 57.2%
Renter Occupied 1,053 42.8%
2017 Owner Occ. HUs: Avg. Length of Residence 14.9
2017 Renter Occ. HUs: Avg. Length of Residence 6.4
COMMUNITY • DEMOGRAPHIC PROFILEMadras, Oregon
DESCRIPTION DATA %
2017 Est. Owner-Occupied Housing Units by Value 14.9
Value Less than $20,000 56 4.0%
Value $20,000 - $39,999 66 4.7%
Value $40,000 - $59,999 88 6.2%
Value $60,000 - $79,999 96 6.8%
Value $80,000 - $99,999 212 15.0%
Value $100,000 - $149,999 245 17.4%
Value $150,000 - $199,999 169 12.0%
Value $200,000 - $299,999 281 19.9%
Value $300,000 - $399,999 57 4.0%
Value $400,000 - $499,999 39 2.8%
Value $500,000 - $749,999 67 4.8%
Value $750,000 - $999,999 16 1.1%
Value $1,000,000 or more 18 1.3%
2017 Est. Median All Owner-Occupied Housing Value $134,505
2017 Est. Housing Units by Units in Structure 0
1 Unit Attached 1,632 58.1%
1 Unit Detached 52 1.9%
2 Units 137 4.9%
3 or 4 Units 186 6.6%
5 to 19 Units 227 8.1%
20 to 49 Units 92 3.3%
50 or More Units 0 0.0%
Mobile Home or Trailer 459 16.3%
Boat, RV, Van, etc. 25 0.9%
24
COMMUNITY • DEMOGRAPHIC PROFILEMadras, Oregon
DESCRIPTION DATA %
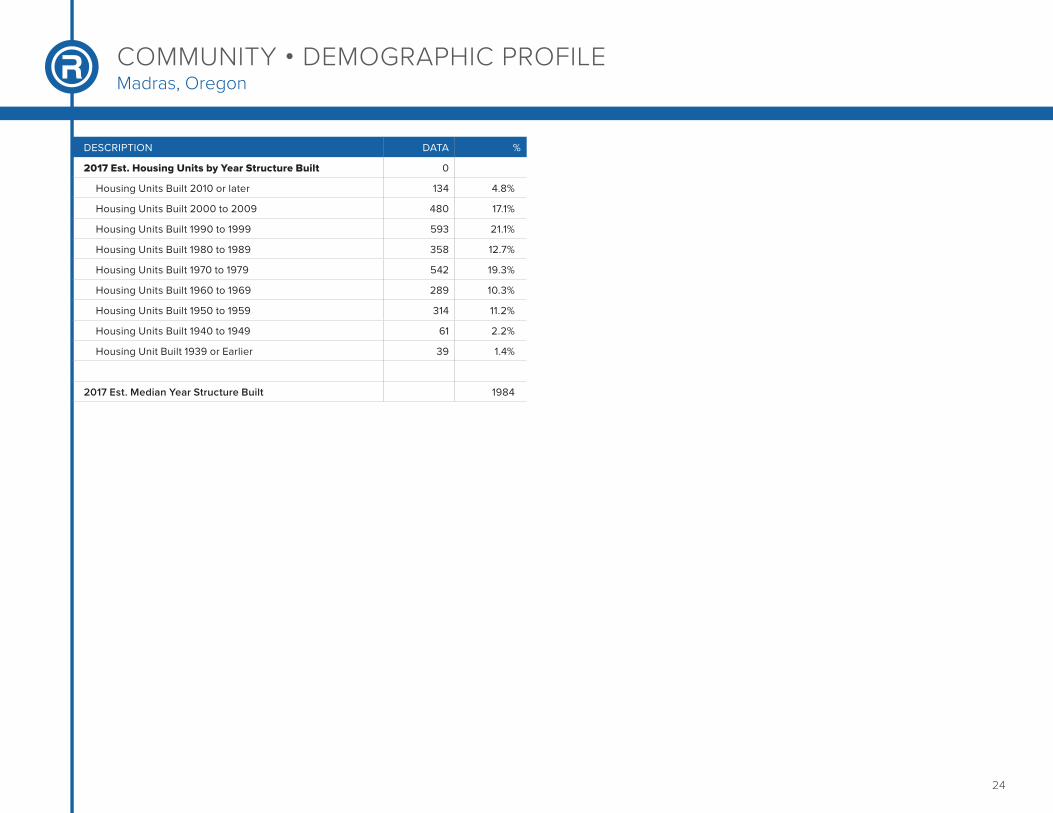
2017 Est. Housing Units by Year Structure Built 0
Housing Units Built 2010 or later 134 4.8%
Housing Units Built 2000 to 2009 480 17.1%
Housing Units Built 1990 to 1999 593 21.1%
Housing Units Built 1980 to 1989 358 12.7%
Housing Units Built 1970 to 1979 542 19.3%
Housing Units Built 1960 to 1969 289 10.3%
Housing Units Built 1950 to 1959 314 11.2%
Housing Units Built 1940 to 1949 61 2.2%
Housing Unit Built 1939 or Earlier 39 1.4%
2017 Est. Median Year Structure Built 1984

25
Providing more than simple data reports of psychographic and demographic trends, The Retail Coach goes well beyond other retail consulting and market research firms’ offerings by combining current national and statewide demographics and trend data with real-world, “on-the-ground” data gathered through extensive visits within our clients’ communities.
Every community is different, and there is no “one size fits all” retail recruitment solution. Compiling the gathered data into client-tailored information packets that are uniquely designed for, and targeted to, specific retailers and restaurants who meet the community’s needs helps assure our clients that they are receiving the latest and best information for their retail recruitment efforts—all with personal service and coaching guidance that continues beyond the initial project scope and timeline.
Our Retail360SM process assures that communities get timely, accurate and relevant information. Translating that data into the information that retailers need and seek assures our clients even better possibilities for tremendous retail growth and success.
C. Kelly Cofer President & CEO The Retail Coach, LLC
The Retail Coach, LLC, is a national retail analytics and locational intelligence firm that specializes in all aspects of retail market analyses and recruitment, from “macro to micro” trade area assessment to actively recruiting retailers on behalf of our clients.
Through its unique Retail360SM process, The Retail Coach offers a dynamic system of products and services that better enable communities to maximize their retail development potential.
ABOUT THE RETAIL COACH
The Retail Coach –
“ It’s not about data. It’s about your success.”
P.O. Box 7272 | Tupelo, MS 38802 | 800.851.0962 | [email protected] | www.theretailcoach.net

26
ACKNOWLEDGEMENTS
The observations, conclusions and recommendations contained in this study are solely those of The Retail Coach, LLC and should not be construed to represent the opinions of others, including its clients, or any other entity prior to such entity’s express approval of this study.
All information furnished is from sources deemed reliable and is submitted subject to errors, omissions, change of terms and/or conditions.
Sources used in completing this study include: infoUSA™, Applied Geographic Solutions, Nielsen 2016/2017, ESRI 2016/2017, U.S. Census Bureau, Economy.com, Spatial Insights Inc., Urban Land Institute, CensusViewer.com, International Council of Shopping Centers, and/or U.S. Bureau of Labor and Statistics.
To better represent current data, where applicable, portions of estimated actual sales may be calculated using an average sales per square foot model.
Mapping data is provided by MapInfo, Nielsen, ESRI and/or Microsoft Corporation.
All information furnished is from sources deemed reliable and is submitted subject to errors, omissions, change of terms and/or conditions.
P.O. Box 7272 | Tupelo, MS 38802 | 800.851.0962 | [email protected] | www.theretailcoach.net