city of edgewater, florida rpts/2016 edgewater.pdf · the city of edgewater was incorporated in...
TRANSCRIPT


CITY OF EDGEWATER,
FLORIDA
COMPREHENSIVE ANNUAL FINANCIAL REPORT
For the fiscal year ended September 30, 2016
Prepared by: The Finance Department

This page intentionally left blank

I
TABLE OF CONTENTS
Page Introductory Section Letter of Transmittal III GFOA Certificate of Achievement VI List of Principal Officials VII Organizational Chart VIII Financial Section Independent Auditor’s Report 1 Management’s Discussion and Analysis 3 Basic Financial Statements Government-Wide Financial Statements: Statement of Net Position 15 Statement of Activities 16 Fund Financial Statements: Balance Sheet - Governmental Funds 18 Reconciliation of the Balance Sheet of Government Funds to the Statement of
Net Position
19 Statement of Revenues, Expenditures and Changes in Fund Balances - Governmental Funds 20 Reconciliation of the Statement of Revenues, Expenditures and Changes in Fund Balances of Governmental Funds to the Statement of
Activities 21 Statement of Revenues, Expenditures and Changes in Fund
Balances - Budget and Actual - General Fund 22 Statement of Revenues, Expenditures and Changes in Fund
Balances - Budget and Actual - CRA Fund 23 Statement of Net Position - Proprietary Funds 24 Statement of Revenues, Expenses and Changes in
Fund Net Position - Proprietary Funds 25 Statement of Cash Flows - Proprietary Funds 26 Statement of Fiduciary Net Position - Fiduciary Funds 27 Statement of Changes in Fiduciary Net Position – Pension Trust Funds 28 Notes to the Financial Statements 29 Required Supplementary Information (Unaudited) Schedules of changes in the City's Net Pension Liability and Related Ratios 58 Schedules of General Employees' Contributions 60 Schedules of Police Officers' Contributions 61 Schedules of Firefighters' Contributions 62 Other Post Employment Benefit Plan 63 Combining and Individual Fund Statements and Schedules Nonmajor Governmental Funds – Fund Descriptions 65 Combining Balance Sheet - Nonmajor Governmental Funds 66 Combining Statement of Revenues, Expenditures and Changes In Fund Balances - Nonmajor Governmental Funds 68 Schedule of Revenues, Expenditures and Changes in Fund
Balances - Budget and Actual – Nonmajor Special Revenue Funds 70 Schedule of Revenues, Expenditures and Changes in Fund
Balances - Budget and Actual – Nonmajor Debt Service Funds 74 Schedule of Revenues, Expenditures and Changes in Fund
Balances - Budget and Actual – Major Capital Projects Funds 75 Internal Service Funds – Fund Descriptions 77 Combining Statement of Net Position 78 Combining Statement of Revenues, Expenses, and Changes in Fund
Net Position – Internal Service Funds
79 Combining Statement of Cash Flows – Internal Service Funds 80

II
Page
Financial Section - Continued Other Supplemental Schedules – Fiduciary Funds – Fund Descriptions 81 Combining Statement of Fiduciary Net Position – Pension Trust Funds 82 Combining Statement of Changes in Fiduciary Net Position – Pension
Trust Funds
83 Statistical Section (Unaudited) Table of Contents 85 Financial Trends Net Position by Component 86 Changes in Net Position 87 Fund Balances of Governmental Funds 89 Changes in Fund Balances of Governmental Funds 90 Revenue Capacity: Tax Revenues by Source of Governmental Funds 91 Assessed Value and Actual Value of Taxable Property 92 Property Tax Rates - Direct and Overlapping Governments 93 Principal Taxpayers 94 Property Tax Levies and Collections 95 Debt Capacity: Ratios of Outstanding Debt by Type 96 Ratios of General Obligation Bonded Debt Outstanding 98 Direct and Overlapping Debt 99 Legal Debt Margin Information 100 Pledged-Revenue Coverage 101 Demographic and Economic Information: Demographic and Economic Statistics 102 Principal Employers 103 Operating Information Full-time Equivalent City Government Employees by Function/Program 104 Operating Indicator by Function/Program 105 Capital Asset Statistics by Function/Program 106 Other Reports: Independent Auditors’ Report on Internal Control over Financial Reporting and on
Compliance and Other Matters Based on an Audit of Financial Statements
Performed In Accordance with Government Auditing Standards 107 Independent Auditors’ Management Letter 109 Independent Accountants’ Examination Report 112 Reply to the Independent Auditor’s Report 113 Affidavit of Impact Fee Compliance 114
III
March 8, 2017 To the Honorable Mayor, and Members of the City Council, and Citizens of the City of Edgewater City Charter and State law requires that all general-purpose local governments publish a complete set of financial statements presented in conformity with the generally accepted accounting principles in the United States of America (GAAP) and that they be audited in accordance with generally accepted auditing standards in the United States of America by a firm of licensed certified public accountants. Pursuant to the requirement, it is with great pleasure that we present to the City of Edgewater, the Comprehensive Annual Financial Report (CAFR) for the fiscal year ended September 30th, 2016. This report consists of management’s representations concerning the finances of the City of Edgewater. Consequently, management assumes full responsibility for the completeness and reliability of all the information presented in this report. To provide a reasonable basis for making these representations, management of the City of Edgewater has established a comprehensive internal control framework that is designed both to protect the government’s assets from loss, theft, or misuse and to compile sufficient reliable information for the preparation of the City of Edgewater’s financial statements in conformity with GAAP. Because the cost of internal controls should not outweigh their benefits, the City of Edgewater’s comprehensive framework of internal controls has been designed to provide reasonable rather than absolute assurance that the financial statements will be free from material misstatements. As management, we assert that, to the best of our knowledge and belief, this financial report is complete and reliable in all material respects. James Moore & Co., P.L. a firm of licensed certified public accountants, has issued an unmodified (“clean”) opinion on the City of Edgewater’s financial statements for the fiscal year ended September 30, 2016. The independent auditor’s report is located at the front of the financial section of this report. Management’s discussion and analysis (MD&A) immediately follows the independent auditor’s report. GAAP requires that management provide a narrative introduction, overview, and analysis to accompany the basic financial statements in the form of Management’s Discussion and Analysis (MD&A). This letter of transmittal is designated to complement the MD&A and should be read in conjunction with it. Profile of the Government The City of Edgewater was incorporated in 1951 and has operated under the Council-Manager form of government since 1981. Primary responsibilities of the City Manager are to implement the policies of the elected officials. The City Manager assumes responsibilities of the day-to-day operations of the City, annual budget preparation, appointing/removing officers and employees. In addition to supervising the daily operations, the City Manager works with elected officials, committees and citizens to plan for the future of the community. The City of Edgewater is located in southeast Volusia County, primarily east of I-95 south of New Smyrna Beach, two miles west of the Atlantic Ocean and runs along 10.5 miles of the Indian River coastline. The City is within the economic zone of Central Florida, which roughly follows Interstate 4 from Tampa through Orlando to Daytona Beach and the communities along the Atlantic Coast in Volusia County. There are approximately 14,550 acres of land within the City with an estimated population of 21,280.

IV
The City of Edgewater offers a full range of services to its citizens through multiple funds. The City uses funds to separate resources and assure that the City adheres to restrictions placed upon it by legislators, grantors, donors, and other outside parties (e.g. GASB, GAAP). The following is a list of services provided by each fund:
• General Fund - provides planning and zoning, economic development, building (e.g. permits, inspections, etc), police, fire, fire rescue, animal control, parks, recreation, streets (new and maintained), code enforcement, and general administrative services.
• Water and Sewer Fund - provides water and sewer services. • Refuse Fund - uses a combination of City personnel and assets along with private contracted
companies to provide solid waste collection. • Stormwater Fund – provides and ensures proper water drainage from all properties. • Internal Service Funds – account for fleet management services, management information
systems, general liability insurance, health insurance, and workers compensation insurance. • CRA Fund - account for the ad valorem proceeds for the redevelopment of our US1 and Park
Avenue Corridor.
Whenever possible the City seeks alternative sources of revenue to provide services, enhance services, and supplement the existing expenses in the budget. The most prominent example of alternative revenue is grants through the federal, state, and local levels. Local Economy Long established businesses such as Boston Whaler, Everglades Boats, Edgewater Power Boats, R.J. Dougherty Associates, Inc, Publix and Winn Dixie Supermarkets, as well as new businesses provide employment opportunities within the City. NASA and related supporting enterprises at Cape Canaveral as well as the cruise industry located at Port Canaveral provide further employment opportunities. The City of Edgewater currently has a 5.1 percent unemployment rate (in line with the state average of 5.0 percent). During the last year, taxable assessment values of property in Edgewater increased 7.27 percent. The City continues exploring several options to increase economic growth within the City and improve economic development within southeast Volusia County. The Community Redevelopment Agency was created to encourage redevelopment along our US. 1 and Park Ave. corridor. The City continues to develop many partnerships between various economic development agencies and local businesses. The City of Edgewater’s outlook for fiscal year 2017 is for modest gains in economic growth as the recovery and expansion from the financial crisis and national and international recessions gain a small degree of traction in the local economy. With the modest gains, the City of Edgewater continues to apply for Federal and State grants to fund sidewalks, bicycle trails along our major corridors. Without these funds, this project would not have been completed within the foreseeable future. Financial Planning and Budgeting The City continued to stress expenditure control in preparing the FY2017 General Fund budget. The City ad valorem millage rate for FY2017 was 6.70, which was 5.79% more than the rolled-back rate. The millage rate of 6.70, resulted in property tax collections increase of 5.5% due to an increase in property assessments an annexations. The City adopts a five-year capital improvement plan that identifies future funding needs to maintain, repair and upgrade capital assets and infrastructure including road resurfacing, water line upgrades and vehicle and technology replacement programs within the funding constraints. It should be noted; however, that the CIP is not a fixed document but a flexible, evolutionary document that may change to reflect changing priorities, opportunities, costs, or different financing approaches.

V
Relevant Financial Policies The City Council recognizes the need to meet seasonal shortfalls in cash flows, its susceptibility to emergency or unanticipated expenditures or the possibility of revenue shortfalls during any fiscal year. To address these issues, the City Council included in its Charter a requirement to maintain reserves at a minimum of 15 percent to a maximum of 25 percent of the general fund appropriations (excluding operating transfers). The unassigned fund balance at September 30, 2016 was 17.37% which is within the range of 15-25% per the charter. For Fiscal Year 2017 operating expenditures budget show modest increases to allow for increasing operating cost while still maintaining our capital improvements. Budgeting Controls The annual budget serves as the foundation for the City of Edgewater’s financial planning and control. All departments of the City of Edgewater are required to submit requests for appropriation to the City Manager. The City Manager then uses these requests as the starting point for developing a proposed budget. The City Manager then presents this proposed budget to the City Council for review. The City Council is required to hold public hearings on the proposed budget and to adopt a final budget by no later than September 30, the close of the City of Edgewater’s fiscal year. The appropriated budget is prepared by fund (i.e., General Fund), department (i.e., Fire Department) and division (i.e., Fire Operations). The City Manager may make transfers of appropriations within and between divisions and departments; however, any revisions that alter the total appropriations of any funds must be approved by City Council. Original and final amended budget-to-actual comparisons are provided in this report for each individual governmental fund. Certificate of Achievement Award The Government Finance Officers Association of the United States and Canada (GFOA) awarded a Certificate of Achievement for Excellence in Financial Reporting to the City of Edgewater for its comprehensive annual financial report for the fiscal year ended September 30, 2015. This was the thirty-second consecutive year that the City of Edgewater has achieved this prestigious award. In order to be awarded a Certificate of Achievement, a government must publish an easily readable and efficiently organized comprehensive annual financial report. This report must satisfy both generally accepted accounting principles and applicable legal requirements. A Certificate of Achievement is valid for a period of one year only. We believe that our current comprehensive annual financial report continues to meet the Certificate of Achievement Program’s requirements and we are submitting it to the GFOA to determine its eligibility of another certificate. Acknowledgements The preparation of this report would not have been possible without the efficient and dedicated commitment of the entire Finance Department. The City departments, although not extensively involved in year-end audit activities, contributed significantly by ensuring the accuracy and integrity of the accounting information and statistics compiled throughout the year. Without their diligence, the work of the Finance Department would have been considerably more difficult. Appreciation must also be expressed to the City’s external auditor whose suggestions and attention to detail enhanced the quality of this report. In closing, special thanks to the Mayor and City Council for their support and commitment to maintaining the financial integrity and sustainability of the City. Respectfully submitted,
Tracey T. Barlow Jonathan C. McKinney City Manager Finance Director

VI

VII
CITY OF EDGEWATER FLORIDA
List of Elected and Appointed Officials
September 30, 2016
CITY COUNCIL
MAYOR
Michael Ignasiak
DISTRICT 1 Christine Power
DISTRICT 3
Dan Blazi
DISTRICT 2 Gigi Bennington
DISTRICT 4 Gary Conroy
ADMINISTRATION
CITY MANAGER
CITY ATTORNEY
Tracey T. Barlow
Aaron R. Wolfe
ASSISTANT CITY MANAGER / FINANCE DIRECTOR
CITY CLERK / PARALEGAL
Jonathan McKinney
Robin L. Matusick
FIRE CHIEF
POLICE CHIEF
Stephen Cousins
David J. Arcieri
HUMAN RESOURCES DIRECTOR
DEVELOPMENT SERVICES DIRECTOR
Julie A. Christine
Darren Lear
ENVIRONMENTAL SERVICES
PARKS & RECREATION
DIRECTOR
ACTING DIRECTOR Brenda Dewees
Jonathan McKinney

VIII
CITY OF EDGEWATER FLORIDA City Organization Chart
September 30, 2016

INDEPENDENT AUDITORS’ REPORT
To the Honorable Mayor, City Council, and City Manager City of Edgewater, Florida:
Report on the Financial Statements
We have audited the accompanying financial statements of the governmental activities, business-type activities, each major fund, and the aggregate remaining fund information of the City of Edgewater, Florida (the City), as of and for the year ended September 30, 2016, and the related notes to the financialstatements, which collectively comprise the City’s basic financial statements as listed in the table of contents.
Management’s Responsibility for the Financial Statements
The City’s management is responsible for the preparation and fair presentation of these financial statements in accordance with accounting principles generally accepted in the United States of America; this includes the design, implementation, and maintenance of internal control relevant to the preparation and fair presentation of financial statements that are free from material misstatement, whether due to fraud or error.
Auditors’ Responsibility
Our responsibility is to express opinions on these financial statements based on our audit. We conducted our audit in accordance with auditing standards generally accepted in the United States of America and the standards applicable to financial audits contained in Government Auditing Standards, issued by the Comptroller General of the United States. Those standards require that we plan and perform the audit to obtain reasonable assurance about whether the financial statements are free from material misstatement.
An audit involves performing procedures to obtain audit evidence about the amounts and disclosures in the financial statements. The procedures selected depend on the auditors’ judgment, including the assessment of the risks of material misstatement of the financial statements, whether due to fraud or error. In making those risk assessments, the auditor considers internal control relevant to the City’s preparation and fair presentation of the financial statements in order to design audit procedures that are appropriate in the circumstances, but not for the purpose of expressing an opinion on the effectiveness of the City’s internal control. Accordingly, we express no such opinion. An audit also includes evaluating the appropriateness of accounting policies used and the reasonableness of significant accounting estimates made by management, as well as evaluating the overall presentation of the financial statements.
We believe that the audit evidence we have obtained is sufficient and appropriate to provide a basis for our audit opinions.
Opinions
In our opinion, the financial statements referred to above present fairly, in all material respects, the respective financial position of the governmental activities, the business-type activities, each major fund,and the aggregate remaining fund information of the City as of September 30, 2016, and the respective changes in financial position and, where applicable, cash flows thereof and the respective budgetary comparison for the general fund and CRA fund for the year then ended in accordance with accounting principles generally accepted in the United States of America.
1

Other Matters
Required Supplementary Information
Accounting principles generally accepted in the United States of America require that the management’s discussion and analysis and other required supplementary information, as listed in the table of contents,be presented to supplement the basic financial statements. Such information, although not a part of the basic financial statements, is required by the Governmental Accounting Standards Board who considers it to be an essential part of financial reporting for placing the basic financial statements in an appropriate operational, economic, or historical context. We have applied certain limited procedures to the required supplementary information in accordance with auditing standards generally accepted in the United States of America, which consisted of inquiries of management about the methods of preparing the information and comparing the information for consistency with management’s responses to our inquiries, the basic financial statements, and other knowledge we obtained during our audit of the basic financial statements. We do not express an opinion or provide any assurance on the information because the limited procedures do not provide us with sufficient evidence to express an opinion or provide any assurance.
Other Information
Our audit was conducted for the purpose of forming opinions on the financial statements that collectively comprise the City’s basic financial statements. The introductory section, combining and individual nonmajor fund financial statements, budgetary comparison schedules, and statistical section and are presented for purposes of additional analysis and are not a required part of the basic financial statements.
The combining and individual nonmajor fund financial statements, and budgetary comparison schedulesare the responsibility of management and were derived from and relate directly to the underlying accounting and other records used to prepare the basic financial statements. Such information has been subjected to the auditing procedures applied in the audit of the basic financial statements and certain additional procedures, including comparing and reconciling such information directly to the underlying accounting and other records used to prepare the basic financial statements or to the basic financial statements themselves, and other additional procedures in accordance with auditing standards generally accepted in the United States of America. In our opinion, the information is fairly stated, in all material respects in relation to the basic financial statements as a whole.
The introductory section and statistical section have not been subjected to the auditing procedures applied in the audit of the basic financial statements, and accordingly, we do not express an opinion or provide any assurance on them.
Other Reporting Required by Government Auditing Standards
In accordance with Government Auditing Standards, we have also issued our report dated March 4, 2017, on our consideration of the City’s internal control over financial reporting and on our tests of its compliance with certain provisions of laws, regulations, contracts, and grant agreements and other matters. The purpose of that report is to describe the scope of our testing of internal control over financial reporting and compliance and the results of that testing, and not to provide an opinion on internal control over financial reporting or on compliance. That report is an integral part of an audit performed in accordance with Government Auditing Standards in considering the City’s internal control over financial reporting and compliance.
Daytona Beach, FloridaMarch 4, 2017
2

Management’s Discussion and Analysis
As management of the City of Edgewater, Florida we offer readers of the City of Edgewater’s financial statements this narrative overview and analysis of the financial activities of the City of Edgewater for the fiscal year ended September 30, 2016. We encourage readers to consider the information presented here in conjunction with additional information that we have furnished in our letter of transmittal. Financial Highlights
• Net Position - The assets of the City exceeded its liabilities at the close of FY 2015-16 by $74,331,779, which represents an increase in net position of $1,118,548 or 1.53% from the prior fiscal year.
• The City’s governmental funds reported combined ending fund balance of $4,283,009, a
decrease of $430,392 from the prior fiscal year.
• At the end of FY 2015-16, the General Fund unassigned fund balance was $2,376,555 or 17.37% of the budgeted FY 2017 General Fund expenditures, excluding transfers. This represents a decrease of $432,420 from the prior fiscal year.
• During the fiscal year, the City’s total debt decreased by $2,858,704. Governmental debt
decreased by $385,183 and business-type debt reflected a decrease of $2,473,521. Overview of the Financial Statements This discussion and analysis are intended to serve as an introduction to the City of Edgewater’s (the City) basic financial statements. The City’s basic financial statements comprise three components: 1) government-wide financial statements, 2) fund financial statements, and 3) notes to the financial statements. This report also contains other supplementary information in addition to the basic financial statements themselves. Government-Wide Financial Statements The government-wide financial statements are designed to provide readers with a broad overview of the City of Edgewater’s finances, in a manner similar to a private-sector business. The statement of net assets presents information on all of the City’s assets and liabilities, with the difference between the two reported as net position. Over time, increases or decreases in net position may serve as a useful indicator of whether the financial position of the City is improving or deteriorating. The statement of activities presents information showing how the government’s net position changed during the most recent fiscal year. All changes in net position are reported as soon as the underlying event giving rise to the change occurs, regardless of the timing of related cash flows. Thus, revenues and expenses are reported in this statement for some items that will only result in cash flows in future fiscal periods (e.g., uncollected taxes and earned but unused vacation leave).
3
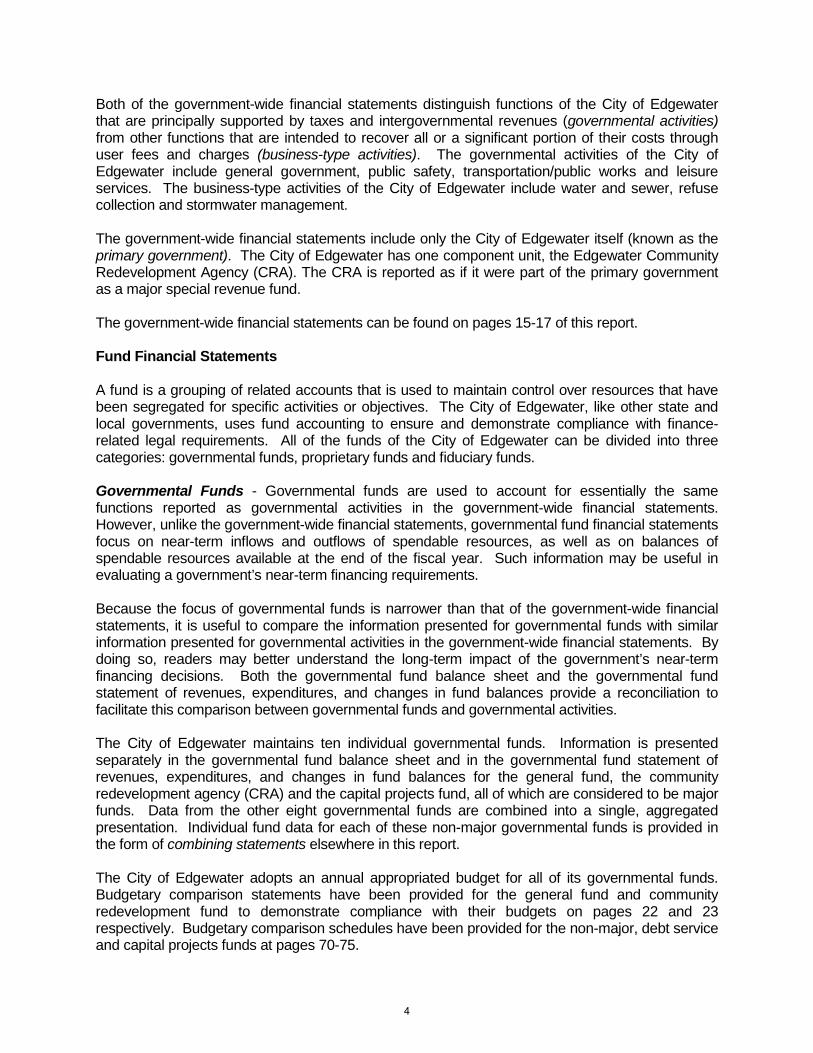
Both of the government-wide financial statements distinguish functions of the City of Edgewater that are principally supported by taxes and intergovernmental revenues (governmental activities) from other functions that are intended to recover all or a significant portion of their costs through user fees and charges (business-type activities). The governmental activities of the City of Edgewater include general government, public safety, transportation/public works and leisure services. The business-type activities of the City of Edgewater include water and sewer, refuse collection and stormwater management. The government-wide financial statements include only the City of Edgewater itself (known as the primary government). The City of Edgewater has one component unit, the Edgewater Community Redevelopment Agency (CRA). The CRA is reported as if it were part of the primary government as a major special revenue fund. The government-wide financial statements can be found on pages 15-17 of this report. Fund Financial Statements A fund is a grouping of related accounts that is used to maintain control over resources that have been segregated for specific activities or objectives. The City of Edgewater, like other state and local governments, uses fund accounting to ensure and demonstrate compliance with finance-related legal requirements. All of the funds of the City of Edgewater can be divided into three categories: governmental funds, proprietary funds and fiduciary funds. Governmental Funds - Governmental funds are used to account for essentially the same functions reported as governmental activities in the government-wide financial statements. However, unlike the government-wide financial statements, governmental fund financial statements focus on near-term inflows and outflows of spendable resources, as well as on balances of spendable resources available at the end of the fiscal year. Such information may be useful in evaluating a government’s near-term financing requirements. Because the focus of governmental funds is narrower than that of the government-wide financial statements, it is useful to compare the information presented for governmental funds with similar information presented for governmental activities in the government-wide financial statements. By doing so, readers may better understand the long-term impact of the government’s near-term financing decisions. Both the governmental fund balance sheet and the governmental fund statement of revenues, expenditures, and changes in fund balances provide a reconciliation to facilitate this comparison between governmental funds and governmental activities. The City of Edgewater maintains ten individual governmental funds. Information is presented separately in the governmental fund balance sheet and in the governmental fund statement of revenues, expenditures, and changes in fund balances for the general fund, the community redevelopment agency (CRA) and the capital projects fund, all of which are considered to be major funds. Data from the other eight governmental funds are combined into a single, aggregated presentation. Individual fund data for each of these non-major governmental funds is provided in the form of combining statements elsewhere in this report. The City of Edgewater adopts an annual appropriated budget for all of its governmental funds. Budgetary comparison statements have been provided for the general fund and community redevelopment fund to demonstrate compliance with their budgets on pages 22 and 23 respectively. Budgetary comparison schedules have been provided for the non-major, debt service and capital projects funds at pages 70-75.
4

The basic governmental fund financial statements can be found on pages 18-23 of this report. Proprietary Funds - The City of Edgewater maintains two types of proprietary funds, enterprise funds and internal service funds. Both enterprise and internal service funds are used to report the same functions presented as business-type activities in the government-wide financial statements. The City of Edgewater uses enterprise funds to account for water and sewer, refuse collection and stormwater management. Internal service funds are used to account for management information systems, fleet servicing, and property and casualty, health, dental, life, and workers compensation insurances. Proprietary funds provide the same type of information as the government-wide financial statements, only in more detail. The proprietary fund financial statements provide separate information for water and sewer, refuse collection and stormwater management which are all considered to be major funds. The basic proprietary fund financial statements can be found on pages 24-26 of this report. Internal Services Funds – Internal Service funds are used to account for the financing of centralized services to the City departments on a cost-reimbursement basis. The basic internal services fund financial statements can be found on pages 77-80 of this report. Fiduciary Funds - Fiduciary funds are used to account for resources held for the benefit of parties outside the government. Fiduciary funds are not reflected in the government-wide financial statements because the resources of those funds are not available to support the City of Edgewater’s own programs. The accounting used for fiduciary funds is much like that used for the proprietary funds. The basic fiduciary fund financial statements can be found on pages 81-83 of this report. Notes to the Financial Statements The notes provide additional information that is essential to a full understanding of the data provided in the government-wide and fund financial statements. The notes to financial statements can be found on pages 29-57 of this report. Other Information In addition to the basic financial statements and accompanying notes, this report also presents certain required supplementary information concerning the City’s progress in its obligation to provide pension benefits to its employees which can be found on pages 58-63. The combining statements referred to earlier in connection with non-major governmental funds are presented immediately following the notes to financial statements and required supplementary information. Combining and individual fund statements and schedules can be found on pages 65-69 of this report. Government-Wide Financial Analysis As noted earlier, net position may serve over time as a useful indicator of a government’s financial position. In the case of the City of Edgewater, assets exceeded liabilities by $74,331,779 at the
5

close of the most recent fiscal year. The following table reflects the condensed statement of net position for the current and prior years. For more detail see the Statement of Net Position on page 15.
At the end of the current fiscal year, the government’s liabilities decreased by $1,911,493 which is mainly attributed to the reduction of Water & Sewer system debt by $2,473,521. The City’s net pension liability increased by $1,353,487 during the current year. Accounts payable decreased $297,751 mainly from major capital improvement projects being completed. Ninety-five percent (95%) of the City’s net position reflect its investment in capital assets (e.g., land, buildings, improvements, infrastructure and equipment) less any related debt used to acquire those assets that is still outstanding. The City uses these capital assets to provide services to citizens; consequently, these assets are not available for future spending. Although the City of Edgewater’s investment in its capital assets is reported net of related debt, it should be noted that the resources needed to repay this debt must be provided from other sources, since the capital assets themselves cannot be used to liquidate these liabilities. An additional portion of the City of Edgewater’s net position (3%) represents resources that are subject to external restrictions on how they may be used. The remaining balance of Net Position is unrestricted and may be used to meet the government’s ongoing obligations to citizens and creditors. At the end of the current fiscal year, the City of Edgewater is able to report positive balances in all categories of net position except for Governmental unrestricted which is due to the City’s net pension liability being reflected on the statements.
Assets: 2016 2015 2016 2015 2016 2015
Current and other assets $4,976,732 $6,598,006 $10,052,781 $9,872,715 $15,029,513 $16,470,721
Capital Assets 42,877,980 43,323,485 49,151,473 50,681,937 92,029,453 94,005,422
Total Assets 47,854,712 49,921,491 59,204,254 60,554,652 107,058,966 110,476,143
2,769,798 1,574,814 748,066 448,151 3,517,864 448,151
Liabilities:
Long term liabilities 10,219,712 9,811,830 23,517,742 25,461,895 33,737,454 35,273,725
Other liabilities 740,986 1,079,457 1,436,624 1,473,375 2,177,610 2,552,832
Total Liabilities 10,960,698 10,891,287 24,954,366 26,935,270 35,915,064 37,826,557
329,987 1,138,286 - 321,034 329,987 321,034
Net Position:
Net investment in capital assets 41,225,542 41,696,833 29,634,955 29,142,964 70,860,497 70,839,797
Restricted 783,398 1,325,008 1,302,217 1,900,301 2,085,615 3,225,309
Unrestricted (2,675,115) (3,555,109) 4,060,782 2,703,234 1,385,667 (851,875)
Total Net Position $39,333,825 $39,466,732 $34,997,954 $33,746,499 $74,331,779 $73,213,231
City of Edgewater’s Statement of Net Position (in whole dollars)
Governmental Activities Business-Type Activities Total Primary Government
Total deferred outflows of resources
Total deferred intflows of resources
6

The government’s net position increased $1,118,548 in the current fiscal year. The government’s restricted net position decreased by $1,139,694 in the current fiscal year. This was mainly attributed to a decrease of $701,041 in net position being restricted for debt service as well as a decrease of $569,614 in net position being restricted for public safety related to the firefighter net pension asset. Further explanations of the decrease are detailed below. The following table reflects the condensed Statement of Activities for the current and prior years. For more detail see the Statement of Activities on page 16-17.
7

The remainder of this page intentionally left blank. Statement of Activities Governmental Activities - Governmental activities decreased the City of Edgewater’s net position by $132,907 which is a $1,382,054 decline from the previous year’s increase of $1,249,147. Key elements of this decrease are as follows:
• Capital grants decreased by $986,529 due to decreased sidewalk construction activity. • Expenses increased in total by $1,182,787, the majority of which relates to an increase in
Public Safety expenses of $797,027 due to increased staffing levels during the year.
• General Administrative expenses increased $498,652 from the prior year due to grant expenditures in the current year and increased internal service funds expenditures.
Business-Type Activities - Business-type activities increased the City of Edgewater’s net position by $1,251,455 as compared to a decrease of $253,452 in the prior year. Key elements of this increase are as follows:
• Charges for services reflect an overall 8.00% increase this year as compared to a 2.58% increase last year. Charge for services increased by $1,015,865 over the previous year. All of the rates are adjusted per continuing professional rate study analyses. Refuse and Stormwater rates were adjusted for the first time in several years in FY 2016.
• Miscellaneous revenues increased $279,025 primarily due to an insurance recovery for
damages to the wastewater treatment plant electricity feed line. The damage was done by a private utility contractor servicing a private utility line.
• Water and Sewer and Refuse operations expenses decreased by $280,553. This decrease
was due to savings throughout various operational lines.
The remainder of this page intentionally left blank.
8

9

10

Financial Analysis of the Government’s Funds As noted earlier, the City of Edgewater used fund accounting to ensure and demonstrate compliance with finance-related requirements. Governmental Funds - The focus of the City’s governmental funds is to provide information on near-term inflows, outflows, and balances of spendable resources. Such information is useful in assessing the City of Edgewater’s financing requirements. In particular, unassigned fund balance may serve as a useful measure of a government’s net resources available for spending at the end of the fiscal year. As of the end of the current fiscal year, the City of Edgewater’s governmental funds reported combined ending fund balances of $4,283,009, a decrease of $430,392 in comparison with the prior year. Approximately 55% of this amount or $2,376,555 constitutes unassigned fund balance, which is available for spending at the City’s discretion. The City has assigned fund balance for the replacement of City Hall in the amount of $707,749, and $376,235 for the subsequent year’s budget appropriation. Restricted fund balance of $792,429 is for scholarships, public safety, debt service, community redevelopment and capital projects. Nonspendable fund balance of $30,041 is held for inventories and prepaids. The General Fund is the chief operating fund of the City of Edgewater. At the end of the current fiscal year, unassigned fund balance of the General Fund was $2,376,555, while total fund balance was $3,536,118. As a measure of the General Fund’s liquidity, it may be useful to compare both unassigned fund balance and total fund balance to total fund expenditures. Unassigned fund balance represents 16% of the total General Fund expenditures, while total fund balance represents 24% of that same amount. During the current fiscal year, the fund balance of the General Fund decreased by $511,187. This decrease was attributed to increased staffing in Public Safety, increased debt service, and capital lease proceeds (in the previous year). During the current fiscal year, the Capital projects fund has continued to add or improve various sidewalks in the City, and to increase or improve recreational facilities. Fiscal Year 2016 is the first year of activity for the City’s recently established Community Redevelopment Agency Fund (CRA). This agency is established for the purpose of making improvements to core downtown properties to enhance economic activity in the City. During the year revenues were collected from the County and City. Expenditures are budgeted for the Northern Gateway Park and pond project. Proprietary Funds - The City of Edgewater’s proprietary funds provide the same type of information found in the government-wide financial statements, but in more detail. Unrestricted net position of the proprietary funds (including enterprise and internal service funds) at the year-end amounted to $3,942,624. The total increase in net position for these funds was $1,131,556. Other factors concerning the finances of the enterprise funds have already been addressed in the discussion of the City of Edgewater’s business-type activities.
11

General Fund Budgetary Highlights During the year, actual revenues were $375,812 less than budgeted revenues primarily due to a residential construction mitigation grant not commencing yet. Actual expenditures were $569,019 less than budgeted expenditures primarily due to expenditures related to residential construction mitigation grant not yet occurring and unfilled Culture and Recreation positions. The final revenue budget was increased from the original budget by $478,387 primarily due to a discontinued joint venture payout ($163K), increased intergovernmental revenues ($143K), retirement plan forfeitures ($18K), and increased utility and franchise taxes ($68). The expenditures budget was increased by $1,164,151 primarily for five new vehicles ($491K), a debt payoff of a 2010 rescue vehicle ($163K), and various other expenditures ($272K) that included two additional police officers, and necessary repairs to City Hall. Capital Asset and Debt Administration Capital Assets - The City of Edgewater’s investment in capital assets for its governmental and business-type activities as of September 30, 2016, amounts to $92,029,453 net of accumulated depreciation. This investment in capital assets includes land, buildings, improvements, machinery and equipment and infrastructure. The total decrease in the City’s investment in capital assets for the current fiscal year was 2.1%.
Additional information on the City of Edgewater’s capital assets can be found in Note IV E of the notes to the financial statements on pages 41-42 of this report. Long-Term Debt At the end of the current fiscal year, the City of Edgewater had total debt outstanding of $21,211,302. This debt includes notes payable, state revolving loan and capital leases. In FY 2016, the City refinanced the Water and Wastewater Refunding Revenue Bond, Series 2009 and Water and Wastewater System Refunding Revenue Bond, Series 2012 with a single Utility System Refunding Revenue Note, Series 2016. The City is current on all required debt service obligations.
2016 2015 2016 2015 2016 2015
Land $ 23,171,411 $ 23,164,264 $ 2,172,370 $ 2,455,915 $ 25,343,781 $ 25,620,179
Buildings 4,422,090 4,649,274 7,169,607 8,010,646 11,591,697 12,659,920
Improvements 7,079,491 7,652,314 35,605,954 36,189,338 42,685,445 43,841,652
Machinery and equipment 1,933,834 1,517,452 3,852,149 3,832,436 5,785,983 5,349,888
Infrastructure 5,827,415 3,422,467 - - 5,827,415 3,422,467
Construction in progress 443,739 2,917,714 351,393 193,602 795,132 3,111,316
Total $ 42,877,980 $ 43,323,485 $ 49,151,473 $ 50,681,937 $ 92,029,453 $ 94,005,422
Governmental Activities Business-Type Activities Total Primary Government
City of Edgewater’s Capital Assets(net of depreciation)(in whole dollars)
12

During the current fiscal year, the City’s total debt decreased by $2,858,704 (12%). Additional information on the City of Edgewater’s long-term debt can be found in Note IV G of the notes to the financial statements on pages 43-46 of this report. Reserve Policy The City Council has approved a Reserve Policy, which was adopted within the City Charter. The policy addresses that the City is required to maintain reserves at a minimum of 15 percent with a maximum of 25 percent of the general fund. The reserve range is established based on a percentage of current years’ budget. Reserve levels above the top of the range are deemed to be available for capital or other lawful purposes. The Reserve amount per Charter is currently set at $2,258,197 (15%) of the FY2016 – 2017 General Fund Budget. The City Council has designated $707,749 towards the future replacement of City Hall and $376,235 for subsequent year’s budget appropriation. The nonspendable balance is $30,041 with restricted balances of $45,538. The amount available for capital or other lawful purposes less any reserves or set asides is $2,376,555 at September 30, 2016. In November 2016, voter’s approved a charter amendment requiring the City to maintain reserves at a minimum of 15 percent of all operating funds (General, Water & Sewer, Refuse and Stormwater). This will affect future year’s reserves. Next Year’s Budget and Rates The City Council adopted a conservative budget for Fiscal Year 2017. The proposed budget contains many ambitious work plan objectives that are intended to address the highest priorities in the community and the goals of the City Council. This budget also sets the financial foundation to establish an accurate and understandable assessment and tracking of the uses and sources of all funds. The 2017 budget presents a number of opportunities and challenges to improve overall service to the community while dealing with the slow recovery as a result of the severe economic downturn. By any standard this is a very aggressive program of work that will challenge the capacity of staff and the City Council to accomplish under the slow recovery. The proposed General Fund budget for Fiscal Year 2017 includes the following assumptions:
• Realization of increased revenues as a result of the current economic conditions. • Modest increases in operating expenditures consistent with the revenue forecasts. • Maintenance of service levels and program to the extent possible and minimal
reductions in service levels where appropriate. • The Issuance of the March 15, 2016 voter approved GO Bond for parks improvements.
2016 2015 2016 2015 2016 2015
Bonds payable $ - $ - $ - $ 11,439,000 $ - $ 11,439,000 Notes payable 1,358,288 1,462,674 13,692,712 4,454,327 15,051,000 5,917,001 g loan - - 5,866,152 6,139,058 5,866,152 6,139,058 Capital leases 294,150 574,947 - - 294,150 574,947
$ 1,652,438 $ 2,037,621 $ 19,558,864 $ 22,032,385 $ 21,211,302 $ 24,070,006
Governmental Activities Business-Type Activities Total Primary Government
City of Edgewater’s Outstanding Debt(in whole dollars)
13

• Hurricane Matthew impacted our area on October 6, 2016 creating the need to makeamendments to our approved budget in the amount of $1,729,464 that effected ourCapital Outlay and held all open positions.
Requests for Information
This financial report is designed to provide a general overview of the City of Edgewater’s finances for those with an interest in the government’s finances. Questions concerning any of the information should be addressed to the office of the Finance Director, City of Edgewater, P.O. Box 100, Edgewater, Florida 32132-0100.
14

CITY OF EDGEWATER, FLORIDAStatement of Net PositionSeptember 30, 2016
Governmental -type Activities
Business-type Activities Total
ASSETS
Cash and cash equivalents 1,412,599$ 6,712,758$ 8,125,357$
Investments 2,333,531 - 2,333,531
Receivables, net 391,791 1,730,092 2,121,883
Special assessment receivable, net - 52,023 52,023
Due from other governments 762,807 87,340 850,147 Inventories and prepaids 76,004 17,333 93,337
Restricted assets:
Cash and cash equivalents - 1,453,235 1,453,235 Capital Assets
Nondepreciable assets 23,615,150 2,523,763 26,138,913 Depreciable assets, net 19,262,830 46,627,710 65,890,540
Total assets 47,854,712$ 59,204,254$ 107,058,966$
DEFERRED OUTFLOWS OF RESOURCESDeferred outflows related to pensions 2,769,798$ 705,720$ 3,475,518$ Deferred Loss on Refunding - 42,346 42,346
Total deferred outflows of resources 2,769,798$ 748,066$ 3,517,864$
LIABILITIES
Accounts payable and other current liabilities 660,112$ 423,199$ 1,083,311$
Accrued interest payable 16,890 153,708 170,598
Unearned revenue 62,270 - 62,270
Due to other governments 1,714 - 1,714
Customer deposits - 859,717 859,717
Noncurrent liabilities
Due within one year
Bonds, notes, and capital leases payable 202,249 1,587,302 1,789,551
Compensated absences 913,311 444,549 1,357,860
Due in more than one year
Bonds, notes, and capital leases payable 1,450,189 17,971,562 19,421,751
Compensated absences 678,230 201,025 879,255
OPEB obligation 585,316 292,516 877,832
Net pension liability 6,390,417 3,020,788 9,411,205
Total liabilities 10,960,698$ 24,954,366$ 35,915,064$
DEFERRED INFLOWS OF RESOURCESDeferred inflows related to pensions 329,987$ -$ 329,987$
NET POSITION
Net investment in capital assets 41,225,542$ 29,634,955$ 70,860,497$
Restricted for:
Debt service 38,781 588,971 627,752
Public safety 73,286 - 73,286
Capital projects 660,075 713,246 1,373,321
Community redevelopment 9,398 - 9,398
Scholarships 1,858 - 1,858
Unrestricted (2,675,115) 4,060,782 1,385,667
Total net position 39,333,825$ 34,997,954$ 74,331,779$
The notes to the financial statements are an integral part of this statement.
15

CITY OF EDGEWATER, FLORIDAStatement of ActivitiesFor the Fiscal Year Ended September 30, 2016
Functions / Programs ExpensesCharges for
Services
Operating Grants and
Contributions
Capital Grants and
Contributions Governmental activities:
General administrative 3,112,845$ 193,140$ -$ 346,749$ Public works 1,914,982 382,989 641,231 217,564 Public safety 7,164,944 773,067 191,145 30,822 Culture and recreation 1,534,765 51,991 - 107,509 Community Redevelopment 4,955 - - - Interest on long-term debt 56,794 - - -
Total governmental activities 13,789,285 1,401,187 832,376 702,644
Business-type activities: Water / Sewer 8,697,283 9,284,327 - 334,843 Refuse 2,427,299 2,962,543 - - Stormwater 1,336,821 1,466,495 - -
Total business-type activities 12,461,403 13,713,365 - 334,843
Total primary government 26,250,688$ 15,114,552$ 832,376$ 1,037,487$
General revenues: Property taxesUtility and franchise taxesIntergovernmental shared revenue - non-programInvestment earningsMiscellaneous revenue
TransfersTotal general revenues and transfers
Change in net position
Net position - beginningNet position - ending
The notes to the financial statements are an integral part of this statement.
Program Revenues
16

Governmental Activities
Business-type Activities Total
(2,572,956)$ -$ (2,572,956)$ (673,198) - (673,198)
(6,169,910) - (6,169,910) (1,375,265) - (1,375,265)
(4,955) - (4,955)(56,794) - (56,794)
(10,853,078) - (10,853,078)
- 921,887 921,887- 535,244 535,244- 129,674 129,674- 1,586,805 1,586,805
(10,853,078) 1,586,805 (9,266,273)
4,572,959 - 4,572,959 3,222,232 - 3,222,232 2,028,373 - 2,028,373
38,006 5,704 43,710106,099 411,448 517,547752,502 (752,502) -
10,720,171 (335,350) 10,384,821 (132,907) 1,251,455 1,118,548
39,466,732 33,746,499 73,213,231 39,333,825$ 34,997,954$ 74,331,779$
Changes in Net PositionNet (Expense) Revenue and
17

CITY OF EDGEWATER, FLORIDABalance Sheet
Governmental Funds
September 30, 2016
General FundCapital Projects
Fund CRA Fund
Other Governmental
Funds
Total Governmental
FundsASSETS Cash 562,367$ 378,709$ 9,398$ 326,057$ 1,276,531$ Investments 2,333,531 - - - 2,333,531
Receivables--net of allowance for uncollectibles 391,732 - - 39 391,771 Due from other governments 542,095 174,800 - 45,912 762,807 Inventories and prepaids 30,041 - - - 30,041
Total assets 3,859,766$ 553,509$ 9,398$ 372,008$ 4,794,681$
LIABILITIES Accounts payable 98,935$ 188,024$ -$ -$ 286,959$ Accrued liabilities 160,729 - - - 160,729 Due to other governments 1,714 - - - 1,714 Unearned revenues 62,270 - - - 62,270
Total liabilities 323,648 188,024 - - 511,672
FUND BALANCESNonspendable:
Inventories and prepaids 30,041 - - - 30,041 Restricted for:
Scholarships 1,858 - - - 1,858 Public safety - - - 73,286 73,286 Debt service 43,680 - - 4,132 47,812 Community redevelopment - - 9,398 - 9,398 Capital projects - 365,485 - 294,590 660,075
Assigned to:Subsequent year's budget appropriation of fund balance 376,235 - - - 376,235 City Hall 707,749 - - - 707,749
Unassigned 2,376,555 - - - 2,376,555
Total fund balances 3,536,118 365,485 9,398 372,008 4,283,009
Total liabilities and fund balances 3,859,766$ 553,509$ 9,398$ 372,008$ 4,794,681$
The notes to the financial statements are an integral part of this statement.
18

CITY OF EDGEWATER, FLORIDAReconciliation of the Balance Sheet of Governmental FundsTo the Statement of Net PositionSeptember 30, 2016
Total governmental funds fund balance 4,283,009$
Amounts reported for governmental activities in the statement of net position are different because:
in the funds - total less accumulated depreciation.
Land and land rights 23,171,411Buildings and improvements 26,998,428Infrastructure 59,237,749Furniture and equipment 4,971,749Construction in progress 443,739Accumulated depreciation (72,075,417)
42,747,659
(72,217)
On the governmental fund statements, a net pension liability/asset is not recorded until an
amount is due and payable and the pension plan’s fiduciary net position is not sufficient
for payment of those benefits (no such liability exists at the end of the current fiscal
year). On the Statement of Net Position, the City's net pension liability/asset of the defined
benefit pension plans is reported as a noncurrent liability. Additionally, deferred
outflows and deferred inflows related to pensions are also reported.
Net pension liability (6,390,417)
Deferred outflows related to pensions 2,769,798
Deferred inflows related to pensions (329,987) (3,950,606)
Compensated absences 1,526,660 OPEB 562,580Long-term debt 1,568,058
(3,657,298)
(16,722)
Net position of governmental activities 39,333,825$
The notes to the financial statements are an integral part of this statement.
Capital assets used in governmental activities are not financial resources and, therefore, are not reported
Long-term liabilities are not due and payable in the current period and, therefore, are not reported in the funds.
Accrued interest payable on bonds that is not recognized on the fund statements.
Internal service funds are used by management to charge the costs of fleet, management information systems
and insurance activities to individual funds. The assets and liabilities of the internal service funds are included in governmental activities in the statement of net position.
19

CITY OF EDGEWATER, FLORIDAStatement of Revenues, Expenditures, and Changes in Fund BalancesGovernmental FundsFor the Fiscal Year Ended September 30, 2016
General FundCapital Projects
Fund CRA Fund
Other Governmental
Funds
Total Governmental
FundsREVENUES Taxes: Property 4,530,693$ -$ 9,394$ 32,872$ 4,572,959$ Utility and franchise taxes 3,222,232 - - - 3,222,232 Intergovernmental 3,013,844 489,957 - 2,731 3,506,532 Licenses and permits 398,346 - - - 398,346Charges for services 1,736,070 - - - 1,736,070 Fines and forfeitures 210,387 - - 56,477 266,864Investment earnings 37,652 - 4 177 37,833Impact fees - - - 160,103 160,103Miscellaneous revenue 265,625 - - - 265,625
Total revenues 13,414,849 489,957 9,398 252,360 14,166,564
EXPENDITURES Current: Legislative 99,820 - - - 99,820 Executive 619,910 - - - 619,910 Legal counsel 158,443 - - - 158,443 Community development 983,354 - - - 983,354 Public works 757,743 293,332 - - 1,051,075 Public safety: Law enforcement 3,521,013 - - 3,231 3,524,244 Fire and emergency services 3,460,655 - - - 3,460,655 Code enforcement 125,334 - - - 125,334 Animal services 109,865 - - - 109,865 Culture and recreation 1,265,641 - - - 1,265,641 General administrative services 2,234,076 - - - 2,234,076 Debt Service: Principal 355,675 - - 20,000 375,675 Interest 37,736 - - 12,112 49,848Capital outlay 761,027 488,911 - - 1,249,938
Total expenditures 14,490,292 782,243 - 35,343 15,307,878 Excess (deficiency) of revenues over (under) expenditures (1,075,443) (292,286) 9,398 217,017 (1,141,314)
OTHER FINANCING SOURCES (USES) Transfers in 764,611 254,385 - - 1,018,996 Transfers out (206,865) - - (107,719) (314,584) Sale of capital assets 6,510 - - - 6,510 Total other financing sources (uses) 564,256 254,385 - (107,719) 710,922
Net change in fund balances (511,187) (37,901) 9,398 109,298 (430,392)
Beginning fund balances 4,047,305 403,386 - 262,710 4,713,401
Ending fund balances 3,536,118$ 365,485$ 9,398$ 372,008$ 4,283,009$
The notes to the financial statements are an integral part of this statement.
20

CITY OF EDGEWATER, FLORIDAReconciliation of the Statement of Revenues,
Expenditures, and Changes in Fund Balances of Governmental Funds
To the Statement of Activities
For the Fiscal Year Ended September 30, 2016
Net change in fund balances - total governmental funds (430,392)$
Expenditure for capital assets 1,249,938
Current year depreciation (1,629,923)
(379,985)
(3,325)
(163,210)
Changes in compensated absences 116,756
Changes in OPEB obligation (71,828)
Changes in interest payable 548
45,476
(119,899)
However, in the Statement of Activities, the amount contributed to defined benefit pension plans
reduces future the net pension liability/asset. Also included in pension expense in the Statement of Activities
are deferred inflow and deferred outflow amounts required to be amortized.
Change in net pension liability/asset and deferred inflows/outflows related to pensions 542,753
The issuance of long-term debt (I.e., bonds and leases ) provides current financial resources to governmental
funds, while the repayment of the principal long-term debt consumes the current financial resources of
governmental funds. Neither transaction has any effect on net position. Also, governmental funds report the
effect of premiums, discounts, and deferred amount on refunding, when debt is first issued, whereas these
amounts are deferred and amortized in the Statement of Activities.
Principal payments 375,675
Change in net position of governmental activities (132,907)$
The notes to the financial statements are an integral part of this statement.
Amounts recorded for governmental activities in the statement of activities are different because:
Governmental funds report capital outlays as expenditures. However, in the statement of activities the cost of those assets is allocated over their estimated useful lives and reported as depreciation expense. This is the amount by which capital outlays exceeded depreciation in the current period.
The net revenue of certain activities of internal service funds is reported with governmental activities.
Governmental funds report contributions to defined benefit pension plans as expenditures.
Some expenses reported in the statement of activities do not require the use of current financial resources and, therefore, are not reported as expenditures in the governmental funds.
The net effect of various miscellaneous transactions involving capital assets (i.e. sales, trade-ins,
donations, CIP project abandoned) is to decrease net position.
Investment in joint venture was not a financial asset and therefore was not reported in the funds.
Because of this, the amount of gain recorded on the sale differs for the governmental funds.
21

CITY OF EDGEWATER, FLORIDAStatement of Revenues, Expenditures, and
Changes in Fund Balances--Budget and ActualGeneral Fund
For the Fiscal Year Ended September 30, 2016
Variance with Final Budget-
Original Final Actual
Amounts Positive
(Negative)
REVENUES
Taxes:
Property 4,520,903$ 4,530,693$ 4,530,693$ -$
Utility and franchise taxes 3,210,830 3,279,169 3,222,232 (56,937)
Intergovernmental 3,124,856 3,267,600 3,013,844 (253,756)
Licenses and permits 360,900 401,259 398,346 (2,913)
Charges for services 1,785,735 1,779,832 1,736,070 (43,762)
Fines and forfeitures 206,300 207,375 210,387 3,012
Investment earnings 42,750 42,750 37,652 (5,098)
Miscellaneous revenue 60,000 281,983 265,625 (16,358)
Total revenues 13,312,274 13,790,661 13,414,849 (375,812)
EXPENDITURES
Current:
Legislative 113,847 113,847 99,820 14,027
Executive 654,460 628,960 619,910 9,050
Legal counsel 90,000 158,443 158,443 -
Community development 1,194,973 1,181,753 983,354 198,399
Public works 792,132 832,132 757,743 74,389
Public safety:
Law enforcement 3,457,093 3,520,713 3,521,013 (300)
Fire and emergency services 3,346,942 3,485,483 3,460,655 24,828
Code enforcement 133,560 133,560 125,334 8,226
Animal services 118,369 118,369 109,865 8,504
Culture and recreation 1,361,735 1,361,811 1,265,641 96,170
General administrative services 2,142,880 2,286,316 2,234,076 52,240
Debt service:
Principal 196,625 357,423 355,675 1,748
Interest 35,303 37,736 37,736 -
Capital outlay 257,241 842,765 761,027 81,738
Total expenditures 13,895,160 15,059,311 14,490,292 569,019
Excess (deficiency) of revenues over
(under) expenditures (582,886) (1,268,650) (1,075,443) 193,207
OTHER FINANCING SOURCES (USES)
Transfers in 763,866 763,866 764,611 745
Transfers out (440,980) (206,865) (206,865) -
Sale of capital assets 10,000 10,000 6,510 (3,490)
Total other financing sources (uses) 332,886 567,001 564,256 (2,745)
Net change in fund balances (250,000) (701,649) (511,187) 190,462
Beginning fund balances 4,047,305 4,047,305 4,047,305 -
Ending fund balances 3,797,305$ 3,345,656$ 3,536,118$ 190,462$
The notes to the financial statements are an integral part of this statement.
Budgeted Amounts
22

CITY OF EDGEWATER, FLORIDAStatement of Revenues, Expenditures, andChanges in Fund Balances--Budget and ActualCRA FundFor the Fiscal Year Ended September 30, 2016
Variance with Final Budget-
Original Final Actual
Amounts Positive
(Negative) REVENUES Property tax 11,387$ 11,387$ 9,394$ (1,993)$ Investment earnings - - 4 4 Total revenues 11,387 11,387 9,398 (1,989)
EXPENDITURES
Other Services & Charges 11,387 11,387 - 11,387 Total expenditures 11,387 11,387 - 11,387 Excess (deficiency) of revenues over (under) expenditures - - 9,398 9,398
Beginning fund balances - - - -
Ending fund balances -$ -$ 9,398$ 9,398$
Budgeted Amounts
23
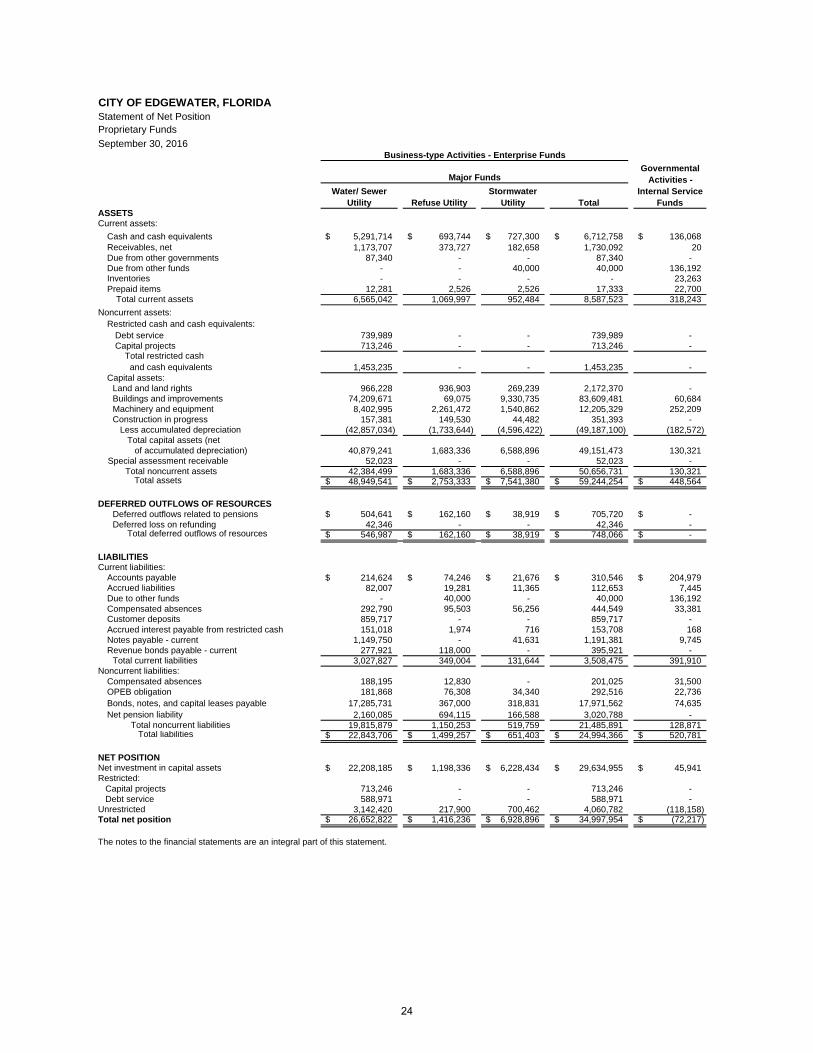
CITY OF EDGEWATER, FLORIDAStatement of Net PositionProprietary Funds
September 30, 2016
Water/ Sewer Utility Refuse Utility
Stormwater Utility Total
ASSETS Current assets:
Cash and cash equivalents 5,291,714$ 693,744$ 727,300$ 6,712,758$ 136,068$ Receivables, net 1,173,707 373,727 182,658 1,730,092 20Due from other governments 87,340 - - 87,340 -Due from other funds - - 40,000 40,000 136,192 Inventories - - - - 23,263Prepaid items 12,281 2,526 2,526 17,333 22,700
Total current assets 6,565,042 1,069,997 952,484 8,587,523 318,243
Noncurrent assets:Restricted cash and cash equivalents:
Debt service 739,989 - - 739,989 - Capital projects 713,246 - - 713,246 - Total restricted cash and cash equivalents 1,453,235 - - 1,453,235 -
Capital assets: Land and land rights 966,228 936,903 269,239 2,172,370 - Buildings and improvements 74,209,671 69,075 9,330,735 83,609,481 60,684 Machinery and equipment 8,402,995 2,261,472 1,540,862 12,205,329 252,209 Construction in progress 157,381 149,530 44,482 351,393 - Less accumulated depreciation (42,857,034) (1,733,644) (4,596,422) (49,187,100) (182,572) Total capital assets (net
of accumulated depreciation) 40,879,241 1,683,336 6,588,896 49,151,473 130,321 Special assessment receivable 52,023 - - 52,023 -
Total noncurrent assets 42,384,499 1,683,336 6,588,896 50,656,731 130,321Total assets 48,949,541$ 2,753,333$ 7,541,380$ 59,244,254$ 448,564$
DEFERRED OUTFLOWS OF RESOURCES Deferred outflows related to pensions 504,641$ 162,160$ 38,919$ 705,720$ -$ Deferred loss on refunding 42,346 - - 42,346 - Total deferred outflows of resources 546,987$ 162,160$ 38,919$ 748,066$ -$
LIABILITIES Current liabilities:
Accounts payable 214,624$ 74,246$ 21,676$ 310,546$ 204,979$ Accrued liabilities 82,007 19,281 11,365 112,653 7,445Due to other funds - 40,000 - 40,000 136,192 Compensated absences 292,790 95,503 56,256 444,549 33,381Customer deposits 859,717 - - 859,717 -Accrued interest payable from restricted cash 151,018 1,974 716 153,708 168Notes payable - current 1,149,750 - 41,631 1,191,381 9,745Revenue bonds payable - current 277,921 118,000 - 395,921 -
Total current liabilities 3,027,827 349,004 131,644 3,508,475 391,910 Noncurrent liabilities:
Compensated absences 188,195 12,830 - 201,025 31,500OPEB obligation 181,868 76,308 34,340 292,516 22,736Bonds, notes, and capital leases payable 17,285,731 367,000 318,831 17,971,562 74,635 Net pension liability 2,160,085 694,115 166,588 3,020,788 -
Total noncurrent liabilities 19,815,879 1,150,253 519,759 21,485,891 128,871 Total liabilities 22,843,706$ 1,499,257$ 651,403$ 24,994,366$ 520,781$
NET POSITIONNet investment in capital assets 22,208,185$ 1,198,336$ 6,228,434$ 29,634,955$ 45,941$ Restricted: Capital projects 713,246 - - 713,246 - Debt service 588,971 - - 588,971 -Unrestricted 3,142,420 217,900 700,462 4,060,782 (118,158) Total net position 26,652,822$ 1,416,236$ 6,928,896$ 34,997,954$ (72,217)$
The notes to the financial statements are an integral part of this statement.
Business-type Activities - Enterprise Funds
Major FundsGovernmental
Activities - Internal Service
Funds
24
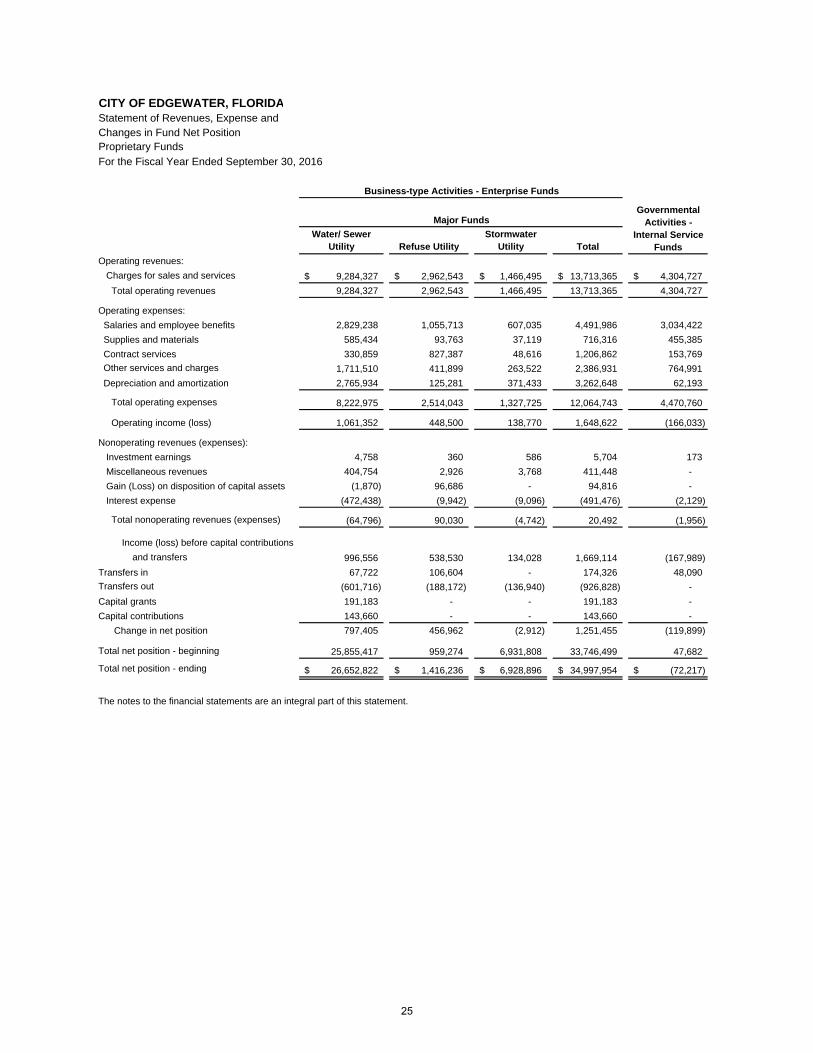
CITY OF EDGEWATER, FLORIDAStatement of Revenues, Expense andChanges in Fund Net PositionProprietary Funds
For the Fiscal Year Ended September 30, 2016
Water/ Sewer Utility Refuse Utility
Stormwater Utility Total
Operating revenues:
Charges for sales and services 9,284,327$ 2,962,543$ 1,466,495$ 13,713,365$ 4,304,727$
Total operating revenues 9,284,327 2,962,543 1,466,495 13,713,365 4,304,727
Operating expenses:
Salaries and employee benefits 2,829,238 1,055,713 607,035 4,491,986 3,034,422
Supplies and materials 585,434 93,763 37,119 716,316 455,385
Contract services 330,859 827,387 48,616 1,206,862 153,769
Other services and charges 1,711,510 411,899 263,522 2,386,931 764,991
Depreciation and amortization 2,765,934 125,281 371,433 3,262,648 62,193
Total operating expenses 8,222,975 2,514,043 1,327,725 12,064,743 4,470,760
Operating income (loss) 1,061,352 448,500 138,770 1,648,622 (166,033)
Nonoperating revenues (expenses):
Investment earnings 4,758 360 586 5,704 173
Miscellaneous revenues 404,754 2,926 3,768 411,448 -
Gain (Loss) on disposition of capital assets (1,870) 96,686 - 94,816 -
Interest expense (472,438) (9,942) (9,096) (491,476) (2,129)
Total nonoperating revenues (expenses) (64,796) 90,030 (4,742) 20,492 (1,956)
Income (loss) before capital contributions
and transfers 996,556 538,530 134,028 1,669,114 (167,989)
Transfers in 67,722 106,604 - 174,326 48,090
Transfers out (601,716) (188,172) (136,940) (926,828) -
Capital grants 191,183 - - 191,183 -
Capital contributions 143,660 - - 143,660 -
Change in net position 797,405 456,962 (2,912) 1,251,455 (119,899)
Total net position - beginning 25,855,417 959,274 6,931,808 33,746,499 47,682
Total net position - ending 26,652,822$ 1,416,236$ 6,928,896$ 34,997,954$ (72,217)$
The notes to the financial statements are an integral part of this statement.
Business-type Activities - Enterprise Funds
Major FundsGovernmental
Activities - Internal Service
Funds
25

CITY OF EDGEWATER, FLORIDAStatement of Cash FlowsProprietary Funds
For the Fiscal Year Ended September 30, 2016
Water/ Sewer Utility Refuse Utility
Stormwater Utility Total
Cash flows from operating activities: Receipts-customers and users 9,232,472$ 2,945,167$ 1,453,800$ 13,631,439$ 4,310,505$ Payments-suppliers (2,508,712) (1,335,917) (463,527) (4,308,156) (4,029,698) Payments-employees (2,866,430) (1,087,850) (629,287) (4,583,567) (398,787)
Net cash provided (used) by operating activities 3,857,330 521,400 360,986 4,739,716 (117,980)
Cash flows from noncapital financing activities: Cash paid to other funds (601,716) (188,172) (136,940) (926,828) - Cash received from other funds (net) 174,218 108 - 174,326 48,090
Net cash provided (used) by noncapital financing activities (427,498) (188,064) (136,940) (752,502) 48,090
Cash flows from capital and related financing activities: Acquisition and construction of capital assets (1,057,263) (29,040) (929,426) (2,015,729) - Proceeds from sale of capital assets - 380,231 - 380,231 - Grant revenue 108,166 - - 108,166 - Interest payments on debt (515,252) (10,410) (9,177) (534,839) (2,147) Capital contributions and fees 546,544 2,926 3,768 553,238 - Proceeds from issuance of debt 10,000,000 - - 10,000,000 - Principal paid on debt (12,317,906) (115,000) (40,615) (12,473,521) (9,509)
Net cash provided (used) by capital and related financing activities (3,235,711) 228,707 (975,450) (3,982,454) (11,656)
Cash flows from investing activities: Interest on investments 4,758 360 586 5,704 173 Sale of investment securities 1,649 - - 1,649 -
Net cash provided by investing activities 6,407 360 586 7,353 173
Net increase (decrease) in cash and cash equivalents 200,528 562,403 (750,818) 12,113 (81,373) Beginning cash and cash equivalents 6,544,421 131,341 1,478,118 8,153,880 217,441 Ending cash and cash equivalents 6,744,949$ 693,744$ 727,300$ 8,165,993$ 136,068$
Reconciliation of operating income (loss) to net cash provided by(used) by operating activities:
Operating income 1,061,352$ 448,500$ 138,770$ 1,648,622$ (166,033)$
Adjustments to reconcile operating income (loss) to net cash provided (used) by operating activities:
Depreciation and amortization 2,765,934 125,281 371,433 3,262,648 62,194 (Increase) decrease in assets:
Accounts receivable (51,855) (17,376) (12,695) (81,926) 5,778 Inventories - - - - 4,195 Prepaid items (4,607) (26) (26) (4,659) 514
Increase (decrease) in liabilities:Accounts payable and accrued expenses 156,500 (2,842) (114,244) 39,414 (27,698) Compensated absences 8,306 (11,974) (20,119) (23,787) (355) Net pension liability (67,526) (28,112) (6,747) (102,385) - OPEB obligation 22,028 7,949 4,614 34,591 3,425 Customer deposits (32,802) - - (32,802) -
Total adjustments 2,795,978 72,900 222,216 3,091,094 48,053
Net cash provided (used) by operating activities 3,857,330$ 521,400$ 360,986$ 4,739,716$ (117,980)$
Classified As:Cash and cash equivalents 5,291,714$ 693,744$ 727,300$ 6,712,758$ 136,068$ Restricted cash and cash equivalents 1,453,235 - - 1,453,235 -
Total 6,744,949$ 693,744$ 727,300$ 8,165,993$ 136,068$
The notes to the financial statements are an integral part of this statement.
Business-type Activities - Enterprise Funds
Major FundsGovernmental
Activities - Internal Service
Funds
26

CITY OF EDGEWATER, FLORIDAStatement of Fiduciary Net PositionFiduciary FundsSeptember 30, 2016
Pension
Trust Funds
ASSETS
Accrued interest 96,338$
Money market funds 1,237,453
Bonds
US Treasury notes 982,059
GNMA/FMNA 2,300,813
Municipal bonds 317,534
Corporate bonds 7,824,533
Equities 8,073,264
Mutual fund - equities 11,143,695
Total assets 31,975,689
LIABILITIES
Accounts payable 27,471
Unearned contributions 33,575
Total liabilities 61,046
NET POSITION
Held in trust for pension benefits 31,914,643$
The notes to the financial statements are an integral part of this statement.
27

CITY OF EDGEWATER, FLORIDAStatement of Changes in Fiduciary Net PositionPension Trust FundsFor the Fiscal Year Ended September 30, 2016
Pension Trust
Funds
ADDITIONS
Contributions:
Employer 1,896,397$ Employee 247,526
State of Florida 277,771
Total contributions 2,421,694
Investment earnings: Interest and dividends 1,020,252 Net increase in the fair value of investments 1,797,081
Total investment earnings 2,817,333
Less investment expenses (157,945) Net investment earnings 2,659,388
Total Additions 5,081,082
DEDUCTIONS
Pension benefits 2,650,643
Administrative expenses 168,311 Total deductions 2,818,954 Change in net position 2,262,128
Net position - beginning of year 29,652,515
Net position - end of year 31,914,643$
The notes to the financial statements are an integral part of this statement.
28

City of Edgewater, Florida Notes to the Financial Statements September 30, 2016
I. Summary of Significant Accounting Policies The accompanying financial statements present the financial position, changes in financial position and cash flows of the applicable fund types governed by the City Council of the City of Edgewater, Florida ("the City") and have been prepared in conformity with accounting principles generally accepted in the United States of America (GAAP) as applied to governmental units. The Governmental Accounting Standards Board (GASB) is the accepted standard-setting body for establishing governmental accounting and financial reporting principles. The most significant of the City's accounting policies are described below.
A. Reporting Entity: The City of Edgewater was originally incorporated under general law on October 20, 1924. The City became the City of Edgewater and incorporated in 1951 as a political subdivision of the State of Florida and a municipal corporation with a five-member Council, including a Mayor and Vice-Mayor. The registered voters of the City of Edgewater elect the Mayor and Council. The Council appoints the City Manager, who in turn performs as the administrator of the everyday operations of the City. The City provides a full range of municipal services as directed by the City Charter including general government, public safety, public improvements, planning and zoning, water and sewer service, refuse collection, a recycling program, a stormwater management utility program, and related general and administrative services to 21,280 residents. In evaluating how to define the government, for financial reporting purposes, the City has considered all potential component units. The definition of the reporting entity is based primarily on the notion of financial accountability. A primary government is financially accountable for the organizations that make up its legal entity. It is also financially accountable for legally separate organizations if its officials appoint a voting majority of an organization’s governing body, and either it is able to impose its will on that organization or there is a potential for the organization to provide specific financial benefits to, or to impose specific financial burdens on, the primary government. A primary government may also be financially accountable for governmental organizations that are fiscally dependent on it. A primary government has the ability to impose its will on an organization if it can significantly influence the programs, projects or activities of, or the level of services performed or provided by, the organization. A financial benefit or burden relationship exists if the primary government (a) is entitled to the organizations’ resources; (b) is legally obligated or has otherwise assumed the obligation to finance the deficits of, or provide financial support to, the organization; or (c) is obligated in some manner for the debt of the organization. In applying the above criteria, management has determined there is one component unit to be included within the reporting entity. The City of Edgewater, Florida, Edgewater Community Redevelopment Agency (CRA) was created by Ordinance No. 2015-O-04 to account for the receipt and expenditure of property tax revenues from the tax increment financing district to support City redevelopment in the designated community redevelopment area. The CRA's focus is mitigation or correction of infrastructure and utilities deficiencies, revitalization of the Ridgewood Avenue (US-1) corridor, various transportation and urban design improvements, and pedestrian safety issues. Although legally separate the City Council declared itself to be the CRA Board, and provided for the appointment of two additional members. Since the City is financially accountable for the activities of the CRA, its governing board is the same, and its relationship to the City is significant, its financial activities are reported on a blended basis as if it were part of the primary government as a major special revenue fund. Activity began in the CRA Fund during the fiscal year ended September 30, 2016.
29

City of Edgewater, Florida Notes to the Financial Statements September 30, 2016
B. Government-wide and Fund Financial Statements: The government-wide financial statements (i.e., the statement of net position and the statement of activities) report information on all of the non-fiduciary activities of the City. For the most part the effect of inter-fund activity has been removed from these statements. Governmental activities, which normally are supported by taxes and intergovernmental revenues, are reported separately from business-type activities, which rely to a significant extent, on fees and charges for support. The statement of activities demonstrates the degree to which the direct expenses of a given function or segment are offset by program revenues. Direct expenses are those that are clearly identifiable with a specific function or segment. Certain indirect expenses are included in the program expense reported for individual functions and segments. Program revenues include 1) charges to customers or applicants who purchase, use, or directly benefit from goods, services, or privileges provided by a given function or segment and 2) grants and contributions that are restricted to meeting the operational or capital requirements of a particular function or segment. Taxes and other items not properly included among program revenues are reported as general revenues. Separate fund financial statements are provided for governmental funds, proprietary funds, and fiduciary funds, even though the latter are excluded from the government-wide financial statements. Major individual governmental funds and major individual enterprise funds are reported as separate columns in the fund financial statements. C. Measurement Focus, Basis of Accounting, and Financial Statement Presentation: The government-wide financial statements are reported using the economic resources measurement focus and the full accrual basis of accounting, as are the proprietary fund and fiduciary fund financial statements. Revenues are recorded when earned and expenses are recorded when a liability is incurred, regardless of the timing of related cash flows. Property taxes are recognized as revenues in the year for which they are levied. Grants and similar items are recognized as revenue as soon as all eligibility requirements imposed by the provider have been met. Grant funds received prior to the incurrence of eligible expenditures are reported as deferred revenues in the fund financial statements and are included in accounts payable and other current liabilities on the government-wide financial statements. Governmental fund financial statements are reported using the current financial resources measurement focus and the modified accrual basis of accounting. Revenues are recognized as soon as they are both measurable and available. Revenues are considered to be available when they are collectible within the current period or soon enough thereafter to pay liabilities of the current period. For this purpose, the City considers revenues to be available if they are collected within 60 days of the end of the current fiscal period. Expenditures generally are recorded when a liability is incurred, as under accrual accounting. However, debt service expenditures, as well as expenditures related to compensated absences and claims and judgments, are recorded when payment is due. Property taxes, franchise taxes, certain other tax revenues, intergovernmental revenues, licenses, and interest associated with the current fiscal period are all considered to be susceptible to accrual and so have been recognized as revenues of the current fiscal period. All other revenue items are considered to be measurable and available only when the City receives cash.
30
City of Edgewater, Florida Notes to the Financial Statements September 30, 2016
The City reports the following major governmental funds:
The General Fund is the City’s primary operating fund. It accounts for all financial resources of the general government, except those required to be accounted for in another fund.
The Capital Projects Fund is used to account for the financial resources to be used for the acquisition or construction of major capital facilities (other than those financed by proprietary and trust funds).
The Community Redevelopment Agency (CRA) Fund is used to account for the receipt and expenditure of property tax revenues from the tax increment financing district to support City redevelopment in the designated community redevelopment area.
The City reports the following major proprietary funds:
The Water and Sewer Utility Fund is used to account for the activities of the City’s water and
wastewater systems, which are financed similar to private business enterprises, where the costs, including depreciation, of providing services to the general public on an ongoing basis are financed through user charges.
The Refuse Utility Fund accounts for the activities of the City’s refuse collection and recycling
services.
The Stormwater Management Utility Fund accounts for the activities of the City’s stormwater management, conservation, protection, control, use and enhancement of stormwater.
Additionally, the City reports the following fund types:
Special Revenue Funds account for specific revenue resources that are restricted by law or administrative action to expenditures for specific purposes.
Pension Trust Funds account for the activities of the Police Officers Pension Fund, the Firefighters Pension Fund and the General Employees’ Pension Fund, which accumulate resources for pension benefit payments to qualified employees.
Internal Services Funds account for fleet management services, management information
systems, general liability insurance, health insurance, and workers’ compensation insurance. As a rule the effect of inter-fund activity has been eliminated from the government-wide financial statements. Exceptions to the rule are payments-in-lieu of taxes and other charges between the government’s water, sewer, and stormwater functions and various other functions of the government. Elimination of these charges would distort the direct costs and program revenues reported for the various functions concerned. Amounts reported as program revenues include:
1. Charges to customers or applicants for goods, services, or privileges provided, 2. Operating grants and contributions, and 3. Capital grants and contributions.
Internal, dedicated resources are reported as general revenues rather than as program revenues. Likewise, general revenues include all taxes.
31

City of Edgewater, Florida Notes to the Financial Statements September 30, 2016
Proprietary funds distinguish operating revenues and expenses from non-operating items. Operating revenues and expenses generally result from providing services and producing and delivering goods in connection with a proprietary fund’s principal ongoing operations. The principal operating revenues of the Water and Sewer Utility Fund, the Refuse Fund, and the Stormwater Management Utility Fund are charges to customers for sales and services. The Water and Sewer Utility fund also recognizes as operating revenue the portion of impact fees intended to recover the cost of connecting new customers to the system. Operating expenses for the enterprise and internal service funds include the cost of sales and services, administrative expenses, and depreciation on capital assets. All revenues and expenses not meeting this definition are reported as non-operating revenues and expenses. Sometimes the government will fund outlays for a particular purpose from both restricted (e.g., restricted bond or grant proceeds) and unrestricted resources. In order to calculate the amounts to report as restricted – net position and unrestricted – net position in the government-wide and proprietary fund financial statements, a flow assumption must be made about the order in which the resources are considered to be applied. It is the government’s policy to consider restricted – net position to have been depleted before unrestricted – net position is applied. The preparation of financial statements in conformity with accounting principles generally accepted in the United States of America requires management to make use of estimates that affect reported amounts in the basic financial statements. Actual results could differ from estimates. D. Assets, Liabilities, Deferred Outflows/Inflows of Resources, and Net Position or Equity 1. Deposits and investments The City’s cash consists of cash on hand, demand deposits, and equity in pooled cash. The equity in pooled cash represents a fund’s share of a cash pool maintained by the City for the use of all funds except the pension trust funds and funds that require separate bank accounts. Florida Statutes and/or the City’s investment policy authorize the City to invest in the Local Government Surplus Funds Trust Fund Investment Pool, United States Government Securities, United States Government Agencies, Federal Instrumentalities, Interest Bearing Time Deposit or Saving Accounts, Repurchase Agreements, Commercial Paper, High Grade Corporate Notes, Bankers' Acceptances, State and/or Local Government Taxable and/or Tax-Exempt Debt, Registered Investment Companies (Money Market Mutual Funds), and Intergovernmental Investment Pools. Florida Statutes and/or the pension plans’ investment policies allow the City’s retirement plans’ trustees to invest in time deposits, savings and money market deposit accounts of a national bank, a state bank insured by the Bank Insurance Fund, a savings/building and loan association insured by the Savings Association Insurance Fund, a state or federal chartered credit union whose share accounts are insured by the National Credit Union Share Insurance Fund; Obligations issued by the United States Government or obligations guaranteed as to principal and interest by the United States Government or by an agency of the United States Government; stocks, bonds or other evidences of indebtedness issued or guaranteed by a corporation organized under the laws of the United States or the District of Columbia; foreign stocks, bonds or other evidences of indebtedness; and real estate investments made through participation in diversified commingled funds of real properties. Investments are recorded at fair value in accordance with GASB Statement No. 72, Fair Value Measurement and Application (generally based on quoted market prices). Accordingly, the change in fair value of investments is recognized as an increase or decrease to investment assets and investment income. Securities traded on a national or international exchange are valued at the last reported sales price at current exchange rates. FLCLASS securities are valued at the amortized cost of investments, which approximates fair value. Real estate assets are reported at fair value utilizing an income approach to valuation. Changes in the fair value during the year are included in investment income. The Local
32

City of Edgewater, Florida Notes to the Financial Statements September 30, 2016
Governmental Surplus Funds Trust Fund (LGSF) is governed by Chapter 19-7 of the Florida Administrative Code which identifies the Rules of the State Board of Administration (SBA). These rules provide guidance and establish the general operating procedures for the administration of the LGSF. The LGSF is not a registrant with the Securities and Exchange Commission; however, the Board has adopted operating procedures consistent with the requirements for a 2a-7-like fund. The LGSF Pool’s investments are recorded at amortized cost. 2. Receivables and payables Activity between funds that are representative of lending/borrowing arrangements outstanding at the end of the fiscal year are referred to as either “due to/due from other funds” (i.e., the current portion of inter-fund loans) or “advances to/from other funds” (i.e., the non-current portion of inter-fund loans). All other outstanding balances between funds are reported as “due to/due from other funds”. Any residual balances outstanding between governmental activities and business-type activities are reported in the government-wide financial statements as “internal balances”. Accounts receivable balances are shown net of the allowance for uncollectibles. The allowances are determined based on management estimates of uncollectible amounts. Advances between funds, as reported in the fund financial statements, are offset by nonspendable fund balance in applicable governmental funds to indicate that they are not available for appropriation and are not expendable available financial resources. 3. Inventories and prepaid items Inventories are valued at cost, using the first-in/first-out (FIFO) method. The costs of governmental fund-type inventories are recorded as expenditures when consumed rather than when purchased. Payments made to vendors for services that will benefit periods beyond the current fiscal year are recorded as prepaid items. Costs are recorded as expenditures when consumed rather than when purchased. 4. Restricted assets Certain proceeds of revenue bonds, as well as certain resources set aside for their repayment, are classified as restricted assets on the balance sheet and statement of net position and their use is limited by applicable bond covenants. Restricted cash and investments in the enterprise funds represent debt issuance proceeds that are restricted assets for purchase of assets, construction and repayment of bonded debt respectively. In the enterprise fund statement of net position, bond issuance proceeds as well as other assets are set aside for their repayment and itemized in the restricted cash and investments. 5. Capital assets In the Government Wide and Proprietary Fund financial statements, capital assets purchased or acquired are carried at historical cost or estimated historical cost. Contributed assets are recorded at fair market value as of the date received. The City defines capital assets as assets with an initial, individual cost of more than $5,000 and an estimated useful life in excess of one year. The costs of normal maintenance and repairs that do not add to the value of the assets or materially extend asset lives are not capitalized. The City has implemented the provisions of GASB Statement No. 34. In this process, infrastructure assets are being accounted for using different methods. For governmental activities, the cost or estimated cost of roads and sidewalks are presented. The City compiled this information and recorded all roads and sidewalks acquired after June 30, 1980 during the fiscal year ending September 30, 2007. For business type activities, infrastructure assets have been capitalized at cost. Water and sewer utility improvements are being depreciated over their useful lives. The City has recorded all drainage infrastructure acquired including pre-GASB 34 assets.
33

City of Edgewater, Florida Notes to the Financial Statements September 30, 2016
Major outlays for capital assets and improvements are capitalized as projects are constructed. Interest incurred during the construction phase of capital assets of business-type activities is included as part of the capitalized value of the assets constructed, net of any interest earnings on specific project debt issued. In Governmental funds capital outlay (capital assets) are reported as expenditures and no depreciation expense is reported. Buildings and improvements, improvements other than buildings, and machinery and equipment (including assets amortized under lease purchase contracts) are amortized using the straight-line method over the following estimated useful lives:
Infrastructure 20-30 Years Buildings and improvements 10-50 Years Improvements other than buildings 5-65 Years Machinery and equipment 3-35 Years
6. Deferred outflows of resources In addition to assets, the statement of financial position will sometimes report a separate section for deferred outflows of resources. This separate financial statement element, deferred outflows of resources, represents a consumption of net position that applies to future period(s) and so will not be recognized as an outflow of resources (expense/expenditure) until then. 7. Compensated absences The City records the vested portion of accumulated unused compensated absences at year-end based on each employee’s unused hours and rate of pay, including the City’s share of Social Security and Medicare taxes and pension costs. All compensated absences are accrued when earned in the government-wide and proprietary fund financial statements as accrued liabilities. A liability for these amounts is reported in the governmental funds only if they have matured, for example, as a result of employee resignations and retirements. The liability for compensated absences in the Proprietary Fund Types is liquidated in the Proprietary Fund in which the liability originally incurred. 8. Long-term obligations In the government-wide financial statements, and proprietary fund types in the fund financial statements, long-term debt and other long-term obligations are reported as liabilities in the applicable governmental activities, business-type activities, or proprietary fund type statement of net position. Bond premiums and discounts are deferred and amortized over the life of the bonds using the effective interest method. Bonds payable are reported net of the applicable bond premium or discount. Bond issuance costs are expenses when paid. In the fund financial statements, governmental fund types recognize bond premiums and discounts, as well as bond issuance costs, during the current period. The face amount of debt issued is reported as other financing sources. Premiums received on debt issuances are reported as other financing sources while discounts on debt issuances are reported as other financing uses. Issuances costs, whether or not withheld from the actual debt proceeds received, are reported as debt service expenditures. 9. Deferred inflows of resources In addition to liabilities, the statement of financial position will sometimes report a separate section for deferred inflows of resources. This separate financial statement element, deferred inflows of resources, represents an acquisition of net position that applies to future period(s) and so will not be recognized as an inflow of resources (revenue) until that time.
34

City of Edgewater, Florida Notes to the Financial Statements September 30, 2016
10. Fund balance Beginning with fiscal year 2011, the City implemented GASB Statement No. 54, "Fund Balance Reporting and Governmental Fund Type Definitions." This Statement provides more clearly defined fund balance categories to make the nature and extent of the constraints placed on a government's fund balance more transparent. The following classifications describe the relative strength of the spending constraints: Nonspendable fund balance - amounts that are not in spendable form (such as prepaid expenses and advances due from other funds) or are required to be maintained intact. Restricted fund balance - amounts constrained to specific purposes by their providers (such as grantors, bondholders, and higher levels of government), through constitutional provisions or by enabling legislation. Committed fund balance - amounts constrained to specific purposes by the City itself, using its highest level of decision-making authority (City Council). To be reported as committed, amounts cannot be used for any other purpose unless the City takes the same highest level action to remove or change the constraint. City Council establishes (and modifies or rescinds) fund balance commitments by passage of a resolution. Assigned fund balance - amounts the City intends to use for a specific purpose. Intent can be expressed by the City Council or as delegated to the City Manager. The City Council has by resolution authorized City management to assign fund balance. The council may also assign fund balance as it does when appropriating fund balance to cover a gap between estimated revenue and appropriations in the subsequent year’s appropriated budget. Unlike commitments, assignments generally only exist temporarily. In other words, an additional action does not normally have to be taken for the removal of an assignment. Conversely, as discussed above, an additional action is essential to either remove or revise a commitment. Unassigned fund balance - amounts that are available for any purpose. Positive amounts are reported only in the general fund. Disbursements of fund balances will first be made from restricted amounts when both restricted and unrestricted fund balance is available. Additionally, the City will first use committed fund balance, followed by assigned fund balance, and then unassigned fund balance when expenditures are incurred for purposes which amounts in any of the unrestricted fund balance classifications could be used. 11. Pensions For purposes of measuring the net pension liability, deferred outflows of resources and deferred inflows of resources related to pensions, and pension expense, information about the fiduciary net position of the City’s defined benefit retirement plans, as described in Note C of the Other Matters section, and additions to / deductions from the pension plans’ fiduciary net position have been determined on the same basis as they are reported by the pension plans. For this purpose, benefit payments (including refunds of employee contributions) are recognized when due and payable in accordance with benefit terms. Investments are reported at fair value.
35

City of Edgewater, Florida Notes to the Financial Statements September 30, 2016
II. Reconciliation of Government-wide and Fund Financial Statements A. Explanation of Certain Differences Between the Governmental Fund Balance Sheet and the Government-wide Statement of Net Position: The governmental fund balance sheet includes reconciliation between fund balance – total governmental funds and net position – governmental activities as reported in the government-wide statement of net position. B. Explanation of Certain Differences Between the Governmental Fund Statement of Revenues, Expenditures, and Changes in Fund Balances and the Government-wide Statement of Activities: The governmental fund statement of revenues, expenditures, and changes in fund balance includes reconciliation between net change in fund balance – total governmental funds and change in net position of governmental activities as reported in the government-wide statement of activities. III. Stewardship, Compliance and Accountability A. Budgetary Information:
The annual operating budgets are adopted by City Council using the following procedures: Annual budgets are adopted for all funds of the City except for the Pension Trust funds that are
effectively controlled through governing agreements and related City ordinances. The annual operating budgets are prepared on a basis consistent with accounting principles generally accepted in the United States of America. Annual budget appropriations lapse at the end of each fiscal year, except for unexpended appropriations on open grant programs and capital projects, which are carried forward in subsequent annual budgets.
Encumbrance accounting is employed in governmental funds. Encumbrances represent open
purchase orders and other commitments for goods/services that are not yet received and are recorded to reserve that portion of the applicable appropriation. Encumbrances are recognized as expenditures in the period in which the actual goods/services are received and a liability is incurred. Encumbrances outstanding at year-end are canceled and re-appropriated in the succeeding year's budget; such amounts, if material, are disclosed in the notes as commitments.
Prior to the first day of August of each year, the City Manager prepares a recommended budget
for the next succeeding fiscal year and submits it to the City Council. The recommended budget includes proposed expenditures and the source of receipts to finance them.
City Council holds a series of budget workshops in addition to a minimum of two public hearings
on the proposed budget and adopts the official annual budget of the City, by ordinance, prior to September 30.
The budget, as adopted, may only be amended through formal approval by City Council.
Budgetary integration is established in the accounting records for control purposes at the object of expenditure level; however, the City Charter establishes the level at which expenditures may not legally exceed budget at the fund level. Therefore, the City Manager may transfer budgeted amounts within and between departments of the City without formal approval by City Council.
B. Deficit Net Position: At September 30, 2016, the Fully Insured internal service fund reported a $255,025 deficit net position and the Workers comp fund reported an $81,975 deficit net position.
36

City of Edgewater, Florida Notes to the Financial Statements September 30, 2016
C. Ad Valorem Property Taxes: Under Florida law, the assessment of all properties and the collections of all county, municipal, and school board property taxes are consolidated in the offices of the County Property Appraiser and the County Tax Collector. Florida Statutes regulating tax assessment are also designed to assure a consistent property valuation method statewide. State Statutes permit cities to levy property taxes at a rate of up to ten (10) mills. For the fiscal year ended September 30, 2016, the millage rate in effect was $6.7000 and the Edgewater I&S 2005 voted debt millage was $.0480 for a total millage of $6.7480. The tax levy of the City is established by the City Council prior to October 1 of each year and the Volusia County Property Appraiser incorporates the millage into the total tax levy, which includes the municipalities, independent districts and the County School Board tax requirements. Property taxes are levied in November and attached as a lien on property as of January 1 of each year. All unpaid taxes become delinquent on April 1 following the year in which they are assessed. Discounts are allowed for early payment at the rate of 4% for payments received in the month of November, 3% for payments received in the month of December, 2% for payments received in the month of January and 1% for payments received in the month of February. The taxes paid in March are not subject to discount. Tax certificates on all property for which taxes are delinquent are sold on or about June 1 of each year. D. Connection Fees and Impact Fees: Water and sewer connection fees represent reimbursement of the costs incurred to perform the connection of the respective utilities. These fees are recorded as non-operating revenue at the time of service. Impact fees, which are not considered connection fees since they substantially exceed the cost of connection, are recorded as non-operating revenue in the period earned in the appropriate Enterprise Fund. E. Reserve Policy The City Council has approved a reserve policy, which was adopted within the City Charter. The policy addresses that the City is required to maintain reserves at a minimum of 15 percent with a maximum of 25 percent of the General Fund. The reserve range is established based on a percentage of current years’ budgeted operating expenditures and transfers out. Reserve levels above the top of the range are deemed to be available for capital or other lawful purposes. IV. Detailed Notes on All Funds A. Deposits: At September 30, 2016, the carrying amount of the City's bank deposits was $9,551,122. The bank balance at September 30, 2016 was $9,722,736, all of which is held by a bank that qualifies as a public depository, as required by Chapter 280 of the Florida Statutes. All of the deposits were covered by the FDIC or collateralized in accordance with the “Florida Security for Public Deposits Act”. (Under the Act, every qualified public depository shall deposit with the Treasurer eligible collateral having a market value equal to 50% of the average daily balance for each month that all public deposits are in excess of any applicable deposit insurance. If the public deposits exceed the total amount of the regulatory capital accounts of a bank or the regulatory net worth of a savings association, the required collateral shall have a market value equal to 125% of the deposits). Of the bank balance, no amount was uninsured and uncollateralized in banks or savings and loans not qualifying under the Act at September 30, 2016. B. Investments: The City Council formally adopted a comprehensive investment policy pursuant to Section 218.415, Florida Statutes that established permitted investments, asset allocation limits and issuer limits, credit ratings requirements and maturity limits to protect the City's cash and investment assets. The City maintains a cash and investment pool for the use of all funds except the pension trust funds and funds that require separate bank accounts.
37
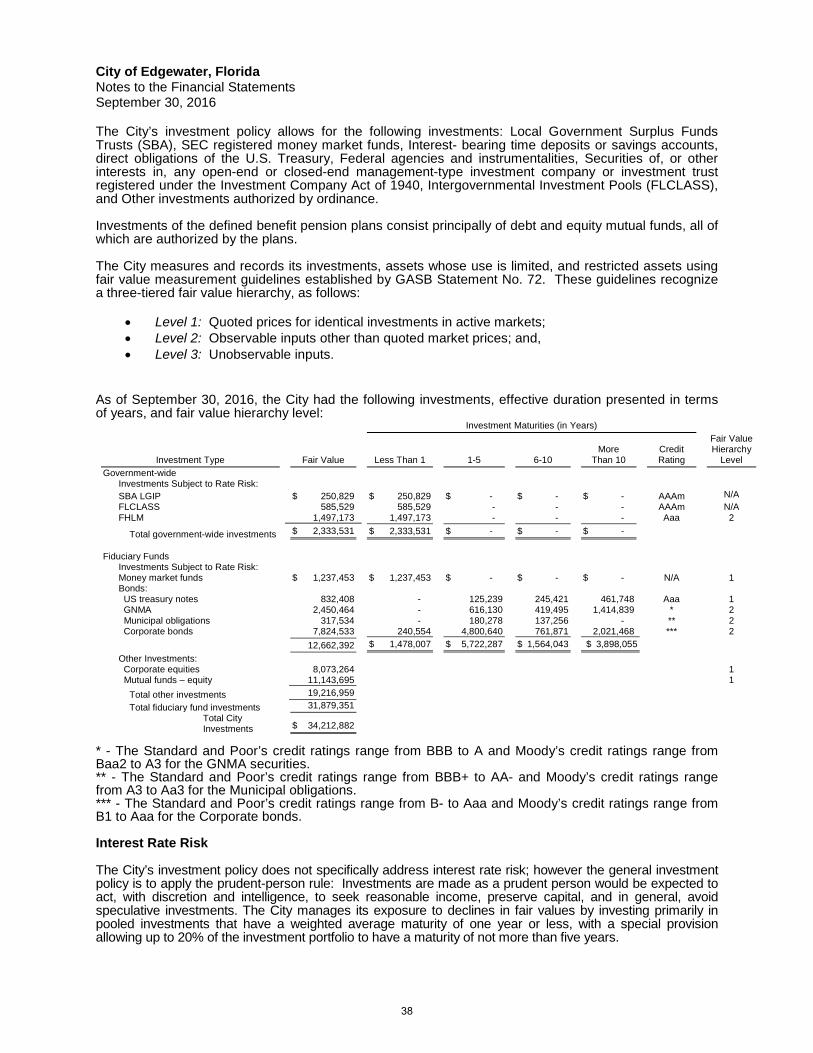
City of Edgewater, Florida Notes to the Financial Statements September 30, 2016
The City’s investment policy allows for the following investments: Local Government Surplus Funds Trusts (SBA), SEC registered money market funds, Interest- bearing time deposits or savings accounts, direct obligations of the U.S. Treasury, Federal agencies and instrumentalities, Securities of, or other interests in, any open-end or closed-end management-type investment company or investment trust registered under the Investment Company Act of 1940, Intergovernmental Investment Pools (FLCLASS), and Other investments authorized by ordinance. Investments of the defined benefit pension plans consist principally of debt and equity mutual funds, all of which are authorized by the plans. The City measures and records its investments, assets whose use is limited, and restricted assets using fair value measurement guidelines established by GASB Statement No. 72. These guidelines recognize a three-tiered fair value hierarchy, as follows:
• Level 1: Quoted prices for identical investments in active markets; • Level 2: Observable inputs other than quoted market prices; and, • Level 3: Unobservable inputs.
As of September 30, 2016, the City had the following investments, effective duration presented in terms of years, and fair value hierarchy level:
Investment Maturities (in Years)
Investment Type Fair Value Less Than 1 1-5 6-10 More
Than 10 Credit Rating
Fair Value Hierarchy
Level
Government-wide Investments Subject to Rate Risk: SBA LGIP $ 250,829 $ 250,829 $ - $ - $ - AAAm N/A FLCLASS 585,529 585,529 - - - AAAm N/A FHLM 1,497,173 1,497,173 - - - Aaa 2
Total government-wide investments $ 2,333,531 $ 2,333,531 $ - $ - $ -
Fiduciary Funds Investments Subject to Rate Risk: Money market funds $ 1,237,453 $ 1,237,453 $ - $ - $ - N/A 1 Bonds: US treasury notes 832,408 - 125,239 245,421 461,748 Aaa 1 GNMA 2,450,464 - 616,130 419,495 1,414,839 * 2 Municipal obligations 317,534 - 180,278 137,256 - ** 2 Corporate bonds 7,824,533 240,554 4,800,640 761,871 2,021,468 *** 2
12,662,392 $ 1,478,007 $ 5,722,287 $ 1,564,043 $ 3,898,055
Other Investments: Corporate equities 8,073,264 1 Mutual funds – equity 11,143,695 1
Total other investments 19,216,959
Total fiduciary fund investments 31,879,351
Total City Investments $ 34,212,882
* - The Standard and Poor’s credit ratings range from BBB to A and Moody’s credit ratings range from Baa2 to A3 for the GNMA securities. ** - The Standard and Poor’s credit ratings range from BBB+ to AA- and Moody’s credit ratings range from A3 to Aa3 for the Municipal obligations. *** - The Standard and Poor’s credit ratings range from B- to Aaa and Moody’s credit ratings range from B1 to Aaa for the Corporate bonds. Interest Rate Risk The City’s investment policy does not specifically address interest rate risk; however the general investment policy is to apply the prudent-person rule: Investments are made as a prudent person would be expected to act, with discretion and intelligence, to seek reasonable income, preserve capital, and in general, avoid speculative investments. The City manages its exposure to declines in fair values by investing primarily in pooled investments that have a weighted average maturity of one year or less, with a special provision allowing up to 20% of the investment portfolio to have a maturity of not more than five years.
38

City of Edgewater, Florida Notes to the Financial Statements September 30, 2016
Credit Risk The City’s investment policy limits credit risk by restricting authorized investments to those described above. Also the policy requires that investments held are to be diversified to the extent practicable to control the risk of loss resulting from over concentration of assets in a specific maturity, issue, instrument, dealer or bank through which financial instruments are bought and sold. Custodial Credit Risk The City's investment policy pursuant to Section 218.415(18), Florida Statutes requires securities, with the exception of certificates of deposits, shall be held with a third party custodian; and all securities purchased by, and all collateral obtained by the City should be properly designated as an asset of the City. The securities must be held in an account separate and apart from the assets of the financial institution. A third party custodian is defined as any bank depository chartered by the Federal Government, the State of Florida, or any other state or territory of the United States which has a branch or principal place of business in the State of Florida, or by a national association organized and existing under the laws of the United States which is authorized to accept and execute trusts and which is doing business in the State of Florida. Certificates of deposits will be placed in the provider's safekeeping department for the term of the deposit. As of September 30, 2016, the City's investment portfolio was held with a third-party custodian as required by the City's investment policy. The City’s investment policy requires that time deposit investments be made only with banking institutions that are members of the State of Florida collateral pool. Florida Statutes authorize, and the state administers, a collateral pool that ensures no loss of public funds. Concentration of Credit Risk The City’s investment policy requires diversification, but does not specify limits on types of investments. C. Receivables: Receivables as of year-end including the applicable allowances for uncollectible accounts are as follows:
Governmental Funds General Capital Projects
Nonmajor
Funds Total
Receivables:
Accounts $ 409,251 $ - $ 39 $ 409,290
Intergovernmental 542,095 174,800 45,912 762,807
Gross receivables 951,346 174,800 45,951 1,172,097
Less: allowance for uncollectible (17,519) - - (17,519)
Net total receivables $ 933,827 $ 174,800 $ 45,951 $ 1,154,578
Proprietary Funds Water/
Sewer Utility
Refuse Utility Stormwater
Utility Internal Service Total
Receivables: Accounts $ 1,515,992 $ 467,983 $ 246,644 $ 20 $ 2,230,639
Intergovernmental 87,340 - - - 87,340
Special Assessments 52,023
-
- - 52,023
Gross receivables 1,655,355 467,983 246,644 20 2,370,002
Less: allowance for uncollectible (342,285)
(94,256)) (63,986) -
(500,527)
Net total receivables $ 1,313,070
$ 373,727 $ 182,658 $ 20 $ 1,869,475
39

City of Edgewater, Florida Notes to the Financial Statements September 30, 2016
Governmental funds report deferred inflows in connection with receivables for revenues that are not considered to be available to liquidate liabilities in the current period. No deferred inflows are reported as of September 30, 2016. Governmental funds also defer revenue recognition and report unearned revenue in connection with resources that have been received, but not yet earned. At the end of the fiscal year, unearned revenue, in the amount of $62,270, reported in the major and non-major governmental funds was unearned business tax receipts. Such amounts have also been included as current liabilities on the government-wide financial statements. D. Interfund Receivables, Payables, and Transfers: The composition of Interfund balances as of September 30, 2016, is as follows: Due from / to other funds:
Receivable Funds Payable Funds Amount
MIS Workers Comp $ 72,478
MIS Fully Insured 63,714
Stormwater Utility Refuse Utility 40,000
Total $ 176,192
The composition of Interfund transfers for the year ended September 30, 2016, is as follows: Transfers In
General Fund Capital Projects
Water Sewer
Refuse
Internal Service MIS Total
Transfers Out:
General Fund $ - $ 146,666 $ 22,574 $ 37,625 $ - $ 206,865
Transportation Impact - 107,719 - - - 107,719
Enterprise:
Water Sewer 522,459 - - 50,167 29,090 601,716
Refuse 156,098 - 22,574 - 9,500 188,172
Stormwater 86,054 - 22,574 18,812 9,500 136,940
Total $ 764,611 $ 254,385 $ 67,722 $ 106,604 $ 48,090 $ 1,241,412
Transfers are used to 1) move revenues from the fund with collection authorization to the fund that statute or budget requires expending them and, 2) move unrestricted fund revenues to finance various programs that the government must account for in other funds in accordance with budgetary authorizations. Transfers from the enterprise funds to the general fund are in lieu of franchisee fees.
40

City of Edgewater, Florida Notes to the Financial Statements September 30, 2016
E. Capital Assets:
Capital asset activity for the year ended September 30, 2016, was as follows: Governmental activities: Beginning Balance Increases Decreases Ending Balance
Capital assets not being depreciated: Land $ 23,164,264 $ 7,147 $ - $ 23,171,411 Construction in progress 2,917,714 489,538 (2,963,513) 443,739
Total assets not being depreciated 26,081,978 496,685 (2,963,513) 23,615,150
Capital assets being depreciated:
Buildings 7,787,534 38,690 - 7,826,224 Improvement other than buildings 19,218,056 56,837 (42,005) 19,232,888 Machinery and equipment 4,522,147 814,689 (112,878) 5,223,958 Infrastructure 56,434,524 2,803,225 - 59,237,749
Total assets being depreciated 87,962,261 3,713,441 (154,883) 91,520,819
Less accumulated depreciation for: Buildings (3,138,260) (265,874) - (3,404,134) Improvement other than buildings (11,565,742) (629,660) 42,005 (12,153,397) Machinery and equipment (3,004,695) (398,305) 112,876 (3,290,124)
Infrastructure (53,012,057) (398,277) - (53,410,334) Total accumulated depreciation (70,720,754) (1,692,116) 154,881 (72,257,989)
Total capital assets, being depreciated, net 17,241,507 2,021,325 (2) 19,262,830 Governmental activities capital assets, net $ 43,323,485 $ 2,518,010 $ (2,963,515) $ 42,877,980
Business-type activities: Beginning Balance Increases Decreases Ending Balance
Capital assets not being depreciated: Land $ 2,455,915 $ - $ (283,545) $ 2,172,370 Construction in progress 193,602 1,346,504 (1,188,713) 351,393
Total assets not being depreciated 2,649,517 1,346,504 (1,472,258) 2,523,763
Capital assets being depreciated:
Buildings 24,498,958 -
(20,474) 24,478,484 Improvement other than buildings 58,067,698 1,078,296 (14,997) 59,130,997 Machinery and equipment 11,784,881 781,515 (361,067) 12,205,329
Total assets being depreciated 94,351,537 1,859,811 (396,538) 95,814,810
Less accumulated depreciation for: Buildings (16,488,312) (841,038) 20,473 (17,308,877) Improvement other than buildings (21,878,360) (1,661,039) 14,356 (23,525,043) Machinery and equipment (7,952,445) (760,571) 359,836 (8,353,180)
Total accumulated depreciation (46,319,117) (3,262,648) 394,665 (49,187,100)
Total capital assets, being depreciated, net 48,032,420 (1,402,837) (1,873) 46,627,710 Business-type activities capital assets, net $ 50,681,937 $ (56,333) $ (1,474,131) $ 49,151,473
Depreciation expense was charged to functions/programs of the primary government as follows:
Governmental activities: General government $ 105,178 Public safety 376,421
Transportation / public works 864,724 Leisure services
283,600 Capital assets held by the City’s internal service funds are charged to the various functions based on their usage of the assets
62,193
Total depreciation expense - governmental activities $ 1,692,116
41

City of Edgewater, Florida Notes to the Financial Statements September 30, 2016
Business-type activities: Water Sewer Utility $ 2,765,934
Refuse collection 125,281
Stormwater System 371,433 Total depreciation expense - business-type activities $ 3,262,648
F. Leases: Operating Leases – On March 3, 2014, the City entered into an operating lease agreement with the Volusia/Flagler Family Young Men’s Christian Association, Inc. (the “YMCA”) for the leasing and reimbursement for the expansion of, certain buildings and facilities located at Hawks Park Recreational Complex, which may be renegotiated and renewed at the request of the City Council or the YMCA Board at any time, provided any amendments are in writing and executed by both parties. Based on the terms of the agreement, the initial ten year lease began on April 1, 2014 and is scheduled to expire on March 31, 2024, with an option to renew for two additional ten year periods provided the parties mutually agree on the terms at the time of renewal. Annual rentals under the lease agreement include minimum monthly payments of $3,779. During the year ended September 30, 2016, amounts received totaled $41,571. Capital Leases - The City has lease agreements for financing the acquisition of rescue vehicles, other vehicles, and equipment. These lease agreements qualify as capital leases for accounting purposes and, therefore, have been recorded at the present value of their future minimum lease payments as of the inception date. The assets acquired through capital leases are as follows:
Governmental
Activities Assets - Machinery and equipment $ 614,379 Less: accumulated depreciation (290,014)
Total $ 324,365
The future minimum lease obligations and the net present value of these minimum lease payments as of September 30, 2016 were as follows:
Year Ending Governmental
September 30 Activities
2017 $ 98,620
2018 98,620
2019 38,406
2020 25,722
2021 25,723
2022-2026 25,723
Total minimum lease payments 312,814
Less: amount representing interest (18,664)
$ 294,150
42

City of Edgewater, Florida Notes to the Financial Statements September 30, 2016
G. Long-term Debt: Notes Payable
The Utility System Refunding Revenue Note, Series 2016, was issued on February 29, 2016, in the amount of $10,000,000 to refund the City’s outstanding Water and Sewer Revenue Bonds, Series 2009 and Water and Sewer Revenue Refunding Bonds, Series 2012. The note will have semi-annual payments due on April 1 and October 1. The interest rate on the refunding revenue note is 2.30% and maturity is on October 1, 2026. The new issue will increase debt service payments for the City by $212,304 with an economic loss of $14,727 or 1.41%.The original amount of the note issued and outstanding at year-end is as follows:
Business-Type Activities
Interest Rates and Dates Maturity Original Amount
Balance September 30,
2016 Water and Sewer Revenue Refunding Note- Series 2016
2.30%
(4/1 & 10/1) 10/1/2026 $10,000,000 $10,000,000
Total Outstanding $10,000,000
The Utility System Refunding Revenue Note is secured by a first lien on and pledge of the net revenues of the City’s water, wastewater and stormwater utility systems and a first lien on and pledge of allowable impact fees imposed on new users of the systems.
The Utility System Refunding Revenue Note resolution provides for:
(1) Establishment and maintenance of various funds and accounts (2) Restrictions on the use of cash from operations in order of priority
(a) Deposits are made to the operations and maintenance fund each month in an amount which will pay the costs of operation and maintenance for the next month;
(b) Deposits to the sinking fund are made monthly in an amount equal to one-sixth (1/6) of
the interest coming due on the next semi-annual interest payment date and one-twelfth (1/12) of the bond amortization installment coming due during the next year;
(c) Deposits to the reserve fund are required to make up any deficiency in its balance as
compared to the reserve equipment;
(d) Deposits to the Renewal and Replacement Fund are required each month in an amount equal to one-twelfth (1/12) of five per centum (5%) of the gross revenues of the system for the previous fiscal year; provided, however, that so long as there shall be on deposit in the renewal and replacement fund a balance of at least five per centum (5%) of the value of the fixed assets of the system, no additional deposits shall be required;
(e) Deposits will next be made into the rate stabilization fund for the amount budgeted for
the then current period; and
(f) Thereafter for any lawful purposes. Annual requirements to amortize the Utility System Refunding Revenue Note outstanding as of September 30, 2016, are as follows:
43

City of Edgewater, Florida Notes to the Financial Statements September 30, 2016
Year Ending Business -Type Activities
September 30 Principal Interest
2017 $ 497,000 $ 224,285
2018 856,000 208,725
2019 876,000 188,807
2020 896,000 168,429
2021 916,000 147,591
2022-2026 4,909,000 408,147
2027 1,050,000 12,075
Total $ 10,000,000 $ 1,358,059
The City issued the following revenue note in a prior year:
Guaranteed Entitlement Revenue Note, Series 2010
Original amount issued $750,000 Issue date November 23, 2010 Final maturity October 1, 2030 Interest due April 1 and Oct 1 Interest rate Fixed – 2.77%
The note is pledged by State Revenue Sharing monies received by the City and the proceeds were used to construct fire station number 55.
Debt service requirements for this revenue note using interest rate of 2.77% at September 30, 2016 are:
Year Ending
Governmental Activities September 30 Principal Interest
2017 $ 35,000 $ 16,829
2018 35,000 15,860
2019 35,000 14,890
2020 35,000 13,957
2021 40,000 12,882
2022-2026 165,000 40,404
2027-2031 280,000 23,844
Total $ 625,000 $ 138,666
During the year ended September 30, 2006, the City signed a limited general obligation note payable for $500,000 to fund the construction of a new animal shelter. The note is secured by a limited pledge of ad valorem taxes. While the note is outstanding, the City will levy ad valorem taxes, not to exceed .06 mills to pay principal and interest on the note. Annual debt service requirements are as follows:
Year Ending Governmental Activities
September 30 Principal Interest
2017 $ 25,000 $ 11,343
2018 25,000 10,381
2019 25,000 9,420
2020 25,000 8,459
2021 30,000 7,498
2022-2026 165,000 19,610
Total $ 295,000 $ 66,711
44

City of Edgewater, Florida Notes to the Financial Statements September 30, 2016
During the year ended September 30, 2013, the City executed an agreement with the Florida Department of Environmental Protection to borrow up to $6,438,083 at an interest rate of 1.72-1.84% through the State Revolving Fund loan program, for the purpose of wastewater treatment replacement and renewal. Capitalized interest added to the loan was $89,773. Repayment commenced on December 15, 2014, and is due semiannually thereafter on June 15 and December 15, each year until all amounts due under the agreement have been fully paid. Current debt service requirements are as follows:
Year Ending Business-Type Activities
September 30 Principal Interest
2017 $ 277,921 $ 106,048
2018 283,029 100,941
2019 288,230 95,740
2020 293,526 90,443
2021 298,920 85,049
2022-2026 1,579,046 340,800
2027-2031 1,729,570 190,275
2032-2034 1,115,910 35,997
Total $ 5,866,152 $ 1,045,293
During the year ended September 30, 2013, the City executed an agreement with a financial institution to borrow $4,507,000 at an interest rate of 1.79%, for the purpose of refinancing the capital lease with Johnson Controls, Inc. for water meters. Principal and interest payments are due quarterly on December 1, March 1, June 1 and September 1. The note is secured by non-ad valorem revenues of the City. Debt service requirements are as follows:
Year Ending Business-Type Activities
September 30 Principal Interest
2017 $ 622,000 $ 42,265
2018 657,000 30,832
2019 674,000 18,878
2020 513,000 7,458
2021 115,000 517
Total $ 2,581,000 $ 99,950
During the year ended September 30, 2014, the City executed an agreement with a financial institution to borrow $1,300,000 at an interest rate of 2.41%, for the purpose of capital improvements. Interest only payments are due on September 1st, while interest and principal payments are due on March 1st. Debt service requirements are as follows:
Year Ending Business-Type Activities Governmental Activities
September 30 Principal Interest Principal Interest
2017 $ 72,381 $ 14,232 $ 50,619 $ 9,953
2018 72,969 12,480 51,031 8,728
2019 74,735 10,700 52,265 7,483
2020 77,677 8,864 54,323 6,199
2021 80,031 6,963 55,969 4,870
2022-2024 248,919 9,083 174,081 6,352
Total $ 626,712 $ 62,322 $ 438,288 $ 43,585
45

City of Edgewater, Florida Notes to the Financial Statements September 30, 2016
During the year ended September 30, 2015, the City executed an agreement with a financial institution to borrow $600,000 at an interest rate of 1.920%, for the purpose of capital improvements. Interest only payments are due on July 15th, while interest and principal payments are due on January 15th. Debt service requirements are as follows:
Year Ending Business-Type Activities
September 30 Principal Interest
2017 $ 118,000 $ 8,179
2018 120,000 5,894
2019 122,000 3,571
2020 125,000 1,200
Total $ 485,000 $ 18,844
Changes in Long-Term Liabilities
Long-term liability activity for the year ended September 30, 2016 was as follows: Beginning Ending Due Within
Balance Additions Reductions Balance One Year
Governmental Activities: Notes payable
Guaranteed Entitlement Note, Series 2010 $ 660,000 $ - $ (35,000) $ 625,000 $ 35,000
General Obligation note 315,000 - (20,000) 295,000 25,000
Capital Improvement Revenue Note 487,674 - (49,386) 438,288 50,619
Capital leases
Ambulance 66,282 - (66,282) - -
Vehicles 97,771 - (32,109) 65,662 32,588
Rescue 248,310 - (160,942) 87,368 37,016
AEBI 162,584 - (21,464) 141,120 22,026
Other post-employment benefits 510,063 75,253 - 585,316 -
Compensated absences 1,708,652 929,451 (1,046,562) 1,591,541 913,311 Total governmental activities long term liabilities $ 4,256,336 $1,004,704 $ (1,431,745) $ 3,829,295 $ 1,115,560
Business-type Activities Bonds payable Revenue Bonds $11,439,000 $ - $(11,439,000) $ - $ -
Notes payable
State revolving loan 6,139,058 -
(272,906) 5,866,152 277,921
Lease refunding note 3,157,000 - (576,000) 2,581,000 622,000
Capital Improvement note 2014 697,327 - (70,615) 626,712 72,381
Capital Improvement note 2015 600,000 - (115,000) 485,000 118,000
Refunding Revenue note 2016 - 10,000,000 - 10,000,000 497,000
Other post-employment benefits
257,925 34,591 - 292,516 -
Compensated absences
669,361 447,236 (471,023) 645,574 444,549 Total business-type activities long term debt $22,959,671 $ 10,481,827 $ (12,944,544) $ 20,496,954 $ 2,031,851 Internal service funds predominately serve the governmental funds. Accordingly, $64,881 of compensated absences and $22,736 of Net OPEB liability are included in the above governmental activities amounts. Also, for the governmental activities, compensated absences are generally liquidated by the General Fund.
46

City of Edgewater, Florida Notes to the Financial Statements September 30, 2016
H. Other Commitments and Contingencies The City has entered into several agreements that are outstanding at September 30, 2016, which will result in future financial obligation as follows:
Description Amount General Fund commitments $ 419,825 Police Impact Fee Fund commitments 64,412 Capital Projects Fund commitments 966,980 Water and Sewer Utility Fund commitments 361,267 Stormwater Utility Fund commitments 45,364 Refuse Fund commitments 5,400 MIS Fund commitments 73,859
$ 1,937,107
V. Other Matters A. Risk Management: The City is exposed to various risks of loss related to torts; theft of, damage to and destruction of assets; errors and omissions; and natural disasters for which the City carries commercial insurance. During 2016, there were no significant reductions in insurance coverage from the previous year or any settlements in excess of insurance coverage in the current year or the prior three years. B. Other Postemployment Benefits: Plan Description and Summary of Benefits - The City provides retirees with the option to purchase health insurance from the City’s single employer, experience rated health insurance plan (Plan) that provides medical benefits to active and eligible retirees at the City’s group rate as mandated by Florida Statute 112.0801. This requirement creates an implicit rate subsidy benefit for the retirees’ participation. Retirees are required to pay the full amount of the health insurance premium during their eligibility period. As of the valuation dated October 1, 2015, the Plan had approximately 164 active participants, 1 spouse, and 3 retirees receiving benefits. The plan does not issue a separate publicly available financial report. Transition Year - GASB Statement No. 45 was implemented prospectively resulting in a zero net OPEB obligation at transition, which was October 1, 2008. There was neither an OPEB asset nor liability at transition. Funding Policy - The City has followed the pay-as-you-go funding policy, contributing only those amounts necessary to provide for its portion of current year benefit costs and expenses plus any addition to the reserve for accrued costs incurred but not yet reported, as determined as part of the insurance contract. The contribution requirements of Plan members are established annually by the City. The City pays any remaining required amounts after contributions of plan members are taken into account. Currently, retired members pay the full premium associated with the coverage elected; no direct City subsidy is applicable; however there is an implicit cost outlined below. Spouses and other dependents are also eligible for coverage, and the member is responsible for payment of the applicable premiums. State of Florida law prohibits the City from separately rating retirees and active employees. The City therefore assigns both groups equal, blended-rate premiums. Although both groups are assigned the same blended rate premiums, GAAP requires actuarial liabilities to be calculated using age-adjusted premiums approximating claim costs for retirees separate from active members. The use of age-adjusted premiums results in the full expected retiree obligation recognized in this disclosure.
47

City of Edgewater, Florida Notes to the Financial Statements September 30, 2016
Annual OPEB Cost and Net OPEB Obligation - The City’s annual other postemployment benefit cost (expense) is calculated based on the annual required contribution of the employer (ARC). The City has elected to calculate the ARC and related information using the Entry Age Normal actuarial cost method. The ARC represents a level of funding that, if paid on an ongoing basis, is projected to cover normal costs each year and to amortize any unfunded actuarial liability (or funding excess) using a level percentage of payroll method and closed amortization over a period not to exceed 30 years. Annual requirements include a 4.0% discount rate, compounded annually, and based on assumptions that the plan will be unfunded. The annual health care cost trend rate was assumed to decline gradually over the next several years from 7.25% in 2016 to an ultimate rate of 4.50% on and after 2020. The economic rates are based on an assumed inflation rate of 3% per annum. The actuarial accrued liability (AAL) was determined as of September 30, 2016, based on the above assumptions and cost method, and applied to member data current at October 1, 2014. Liabilities were developed based on age adjusted costs for retirees currently receiving plan benefits as of October 1, 2014, with an AAL calculated to be $1,403,933, which is unfunded (or 0% funded). The annual covered payroll is $7.3 million, resulting in a ratio of unfunded AAL to covered payroll of 19.1%. The actuarial calculations reflect a long-term perspective using methods and assumptions that are designed to reduce short-term volatility in AAL and actuarial value of assets. The Plan provisions affecting the valuation were those in effect on October 1, 2014. OPEB GASB No. 45 results are not based on the assumption that all members terminate services as of the valuation date, but rather on assumptions of future mortality, retirement, and termination.
2016 Fiscal Year
Valuation as of 10/1/2014
Annual Required Contribution (ARC) $ 205,761 Interest on Net OPEB Obligation 30,720
Adjustment to ARC (41,805) Annual OPEB Cost (Expense) 194,676
Less: Employer Contributions Made (84,832) Increase in Net OPEB Obligation 109,844
Net OPEB Obligation at beginning of year 767,988 Net OPEB Obligation at end of year $ 877,832
In the Statement of Net Position, as of September 30, 2016, the City reports a Net OPEB obligation of $585,316 in governmental activities and $292,516 in business-type activities. The schedule of funding progress, presented as required supplementary information following the notes to the financial statements, presents multi-year trend information about whether the actuarial value of plan assets is increasing or decreasing over time relative to the actuarial accrued liability for benefits. The City’s annual OPEB cost, the percentage of annual OPEB cost contributed to the plan, and the net OPEB obligation for the past three years was as follows:
Year Ended September 30,
Annual OPEB Cost
City Contributions
Percentage of Annual OPEB
Cost Contributed
Net OPEB
Obligation 2016 $ 194,676 $ 84,832 43.6% $ 877,832 2015 $ 185,575 $ 78,584 42.3% $ 767,988 2014 $ 226,804 $ 126,896 55.9% $ 660,998
48

City of Edgewater, Florida Notes to the Financial Statements September 30, 2016
C. Employee Defined Benefit Retirement Pension Plans: Plan Description and Administration The City maintains three separate single-employer, defined benefit pension plans for full-time general employees, police officers and firefighters, which are administered by and maintained as the respective Pension Trust Funds and included as part of the City’s reporting entity. The General Employees Retirement Trust Fund was established by Chapter 13 of the City’s Code of Ordinances. The Police Officers’ Retirement Trust Fund was established pursuant with Chapter 185, Florida Statutes. The Firefighters’ Pension Fund was established pursuant with Chapter 175, Florida Statutes. The applicable Ordinances or Statutes grant the authority to establish and amend the benefit terms to the Boards of Trustees. Separate boards of trustees independently govern each system. The General Employees’ Pension Fund’s Board of Trustees is comprised of two legal residents of the City, who are appointed by the City Council; two members of the Plan employed by the City and elected by the plan members; one member as a union representative, as appointed by the union. Both the Police Officers’ Retirement Trust Fund and the Firefighters’ Pension Fund are comprised of two Council appointees; two members of the department elected by the membership; one member elected by the other four members and appointed by the Council. The funding methods and determination of benefits payable are provided in the various acts of the Florida Legislature, the respective board of trustees and the City Council. Benefits Provided Each system provides retirement, disability and death benefits. All employees vest for full benefits after five years of service. Retirement benefits for general employees are based on the three consecutive years which give the highest average out of the last ten years. General employees will receive a benefit amount equal to 2% of that average multiplied by years of accrued service. Retirement benefits for police officers are based on the three years which give the highest average out of the last five years. Police officers will receive a benefit amount equal to 2% of that average multiplied by years of accrued service up to October 1, 1987, and 3% of that average multiplied by years of accrued service after October 1, 1987. Retirement benefits for firefighters are based on the five years, which give the highest average out of the last ten years. Firefighters will receive a benefit amount equal to 3% of that average multiplied by years of accrued service. All employees with 5 years of accrued service are eligible to retire at age 55. General employees may retire at any age after 25 years of service. Police officers and Firefighters may retire at any age after 20 years of service. All employees are eligible for non-service disability benefits after 5 years of service and for service-related disability benefits upon hire. Disability retirement benefits are determined in the same manner as retirement benefits but are payable immediately without an actuarial reduction. Death benefits for vested general employees prior to retirement and with a 50% qualified joint survivor annuity will be paid monthly. Death benefits are paid for vested police officers, prior to retirement and with a 100% qualified joint survivor annuity. Death benefits for firefighters are paid for 10 years. All nonvested employees do not receive a death benefit and the Plan refunds accumulated contributions without interest. An employee, that leaves the City prior to reaching 5 years of service, may withdraw his or her contributions, without interest. After 5 years, the employee may elect to receive the accrued benefit payable at retirement age. There are no annual cost of living adjustments.
49
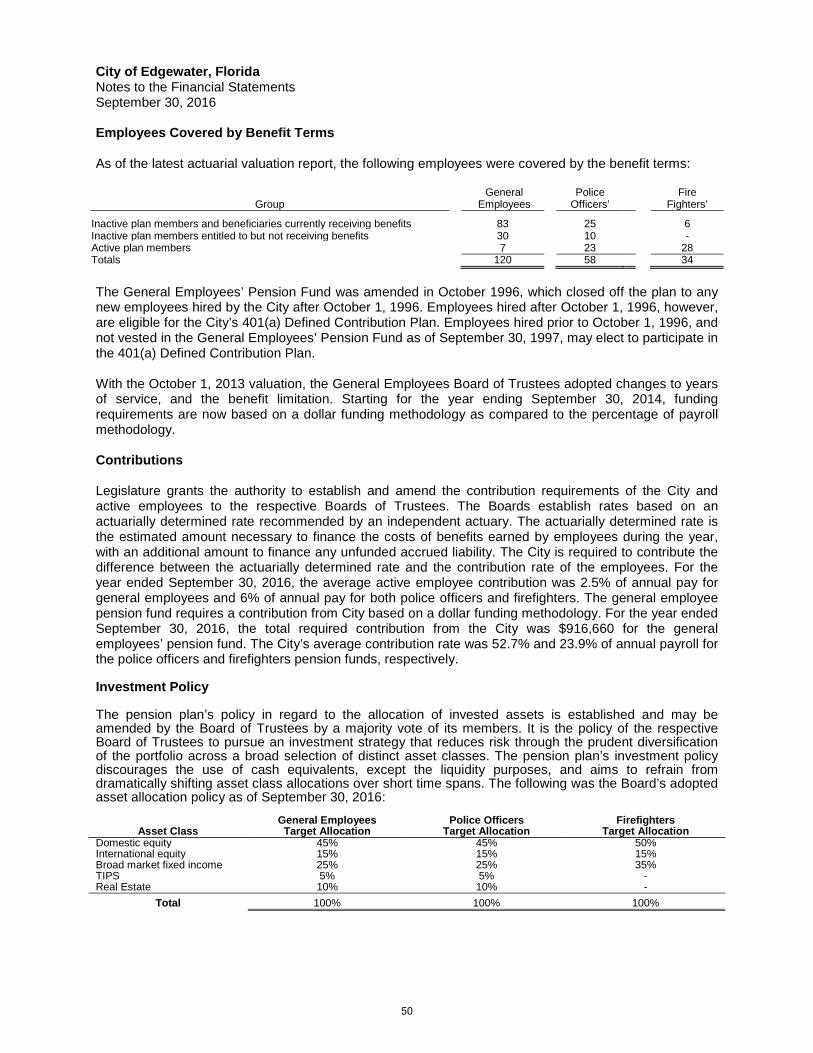
City of Edgewater, Florida Notes to the Financial Statements September 30, 2016
Employees Covered by Benefit Terms As of the latest actuarial valuation report, the following employees were covered by the benefit terms:
General Police Fire Group Employees Officers’ Fighters’
Inactive plan members and beneficiaries currently receiving benefits 83 25
6 Inactive plan members entitled to but not receiving benefits 30 10 - Active plan members 7 23 28 Totals 120 58 34
The General Employees’ Pension Fund was amended in October 1996, which closed off the plan to any new employees hired by the City after October 1, 1996. Employees hired after October 1, 1996, however, are eligible for the City’s 401(a) Defined Contribution Plan. Employees hired prior to October 1, 1996, and not vested in the General Employees’ Pension Fund as of September 30, 1997, may elect to participate in the 401(a) Defined Contribution Plan. With the October 1, 2013 valuation, the General Employees Board of Trustees adopted changes to years of service, and the benefit limitation. Starting for the year ending September 30, 2014, funding requirements are now based on a dollar funding methodology as compared to the percentage of payroll methodology. Contributions Legislature grants the authority to establish and amend the contribution requirements of the City and active employees to the respective Boards of Trustees. The Boards establish rates based on an actuarially determined rate recommended by an independent actuary. The actuarially determined rate is the estimated amount necessary to finance the costs of benefits earned by employees during the year, with an additional amount to finance any unfunded accrued liability. The City is required to contribute the difference between the actuarially determined rate and the contribution rate of the employees. For the year ended September 30, 2016, the average active employee contribution was 2.5% of annual pay for general employees and 6% of annual pay for both police officers and firefighters. The general employee pension fund requires a contribution from City based on a dollar funding methodology. For the year ended September 30, 2016, the total required contribution from the City was $916,660 for the general employees’ pension fund. The City’s average contribution rate was 52.7% and 23.9% of annual payroll for the police officers and firefighters pension funds, respectively. Investment Policy The pension plan’s policy in regard to the allocation of invested assets is established and may be amended by the Board of Trustees by a majority vote of its members. It is the policy of the respective Board of Trustees to pursue an investment strategy that reduces risk through the prudent diversification of the portfolio across a broad selection of distinct asset classes. The pension plan’s investment policy discourages the use of cash equivalents, except the liquidity purposes, and aims to refrain from dramatically shifting asset class allocations over short time spans. The following was the Board’s adopted asset allocation policy as of September 30, 2016:
Asset Class
General Employees Target Allocation
Police Officers
Target Allocation
Firefighters
Target Allocation Domestic equity 45% 45% 50% International equity 15% 15% 15% Broad market fixed income 25% 25% 35% TIPS 5% 5% - Real Estate 10% 10% -
Total 100% 100% 100%
50

City of Edgewater, Florida Notes to the Financial Statements September 30, 2016
Concentrations The plans did not hold investments in any one organization that represent 5% or more of the Pension Plan’s fiduciary net position. Reserves As of September 30, 2016, there are no amounts legally required to be reserved for the general, police and firefighter pension funds, respectively. Funding Standard Account At September 30, 2016 the Police Officers plan has $272,870 of accumulated funding in the Funding Standard Account, as determined by the actuary. The Funding Standard Account balance can be utilized in future years to reduce the City’s contributions into the Police Officers Retirement Trust Fund. In addition, for the year ended September 30, 2016 the City did not utilize the Funding Standard Account to meet the Annual Required Contribution. Financial Statements The financial statements of the Employee Retirement plans are prepared using the accrual basis of accounting. Plan member contributions are recognized in the period in which the contributions are due. The government’s contributions are recognized when due and a formal commitment to provide the contributions has been made. Benefits and refunds are recognized when due and payable in accordance with the terms of the plan. All plan investments are reported at fair value. These plans do not issue stand-alone financial reports.
Individual Fiduciary Fund Statements Individual statements of net position for the three plans included in the City of Edgewater fiduciary funds are as follows: Combining Statement of Fiduciary Net Position
Pension Trust Funds
September 30, 2016
General
Police Officers
Firefighters Employees
ASSETS
Investments, at fair value:
Accrued income $ 45,077 $ 30,504 $ 20,757
Investments, at fair value
Money market funds 787,130 245,535 204,788
Bonds 5,436,085 3,138,862 2,849,992
Equities - - 8,073,264
Mutual fund – equities 6,007,566 5,136,129 -
Total assets 12,275,858 8,551,030 11,148,801
LIABILITIES
Accounts payable 11,098 10,402 5,971
Unearned Contributions - 12,113 21,462
NET POSITION
Held in trust for pension benefits $ 12,264,760 $ 8,528,515 $ 11,121,368
51

City of Edgewater, Florida Notes to the Financial Statements September 30, 2016
Combining Statement of Changes in Fiduciary Net Position
Pension Trust Funds
For the fiscal year ended September 30, 2016
General
Police Officers
Firefighters Employees ADDITIONS
Contributions:
Employer $ 916,660 $ 609,357 $ 370,380
Employee 44,900 84,939 117,687
State of Florida - 138,244 139,527
Total contributions 961,560 832,540 627,594
Investment earnings:
Interest and dividends 590,801 248,424 181,027
Net increase/ (decrease) in the fair value of investments 393,252 369,671 1,034,158
Less investment expenses (32,962) (53,385) (71,598)
Net investment earnings 951,091 564,710 1,143,587
Total Additions 1,912,651 1,397,250 1,771,181
DEDUCTIONS
Pension benefits 1,388,119 950,417 312,107
Administrative expenses 42,336 66,323 59,652
Total deductions 1,430,455 1,016,740 371,759
Change in net position 482,196 380,510 1,399,422
Net position - beginning of year 11,782,564 8,148,005 9,721,946
Net position - end of Year $ 12,264,760 $ 8,528,515 $ 11,121,368
Net Pension Liability Actuarial Assumptions: The total pension liability was determined with a measurement date of September 30, 2015 and an actuarial valuation as of October 1, 2014 updated to September 30, 2015, using the following actuarial assumptions to all measurement periods.
General Employees Police Officers Firefighters
Inflation 3.00% 3.00% 3.00% Salary increases 4.00% 4.20% - 7.50% 5.00% - 6.50% Investment rate of return 7.50% 7.50% 7.50%
Mortality rates for the General Employee’s Pension were based on the RP-2000 Combined Healthy projected to the valuation date with schedule AA–Sex Distinct. The significant assumptions are based upon the most recent actuarial experience study dated June 13th, 2013 for the period 2003-2012.
Mortality rates for the Police Officers were based on the RP-2000 Combined Healthy Mortality, projected to 2005 using scale AA. This assumption sufficiently accommodates future mortality improvements. The actuarial assumptions used in the October 1, 2014 Police valuation are based upon the most recent actuarial experience study dated September 13th, 2013 for the period 2003-2012.
Mortality rates for the Firefighters were based on the RP-2000 Combined Healthy Mortality Table, Sex Distinct. Disabled lives are set forward five years. This sufficiently accounts for future mortality improvements. The actuarial assumptions used in the October 1, 2014 Fire valuation are based upon the most recent actuarial experience study dated June 11th, 2013 for the period 1990-2012.
52
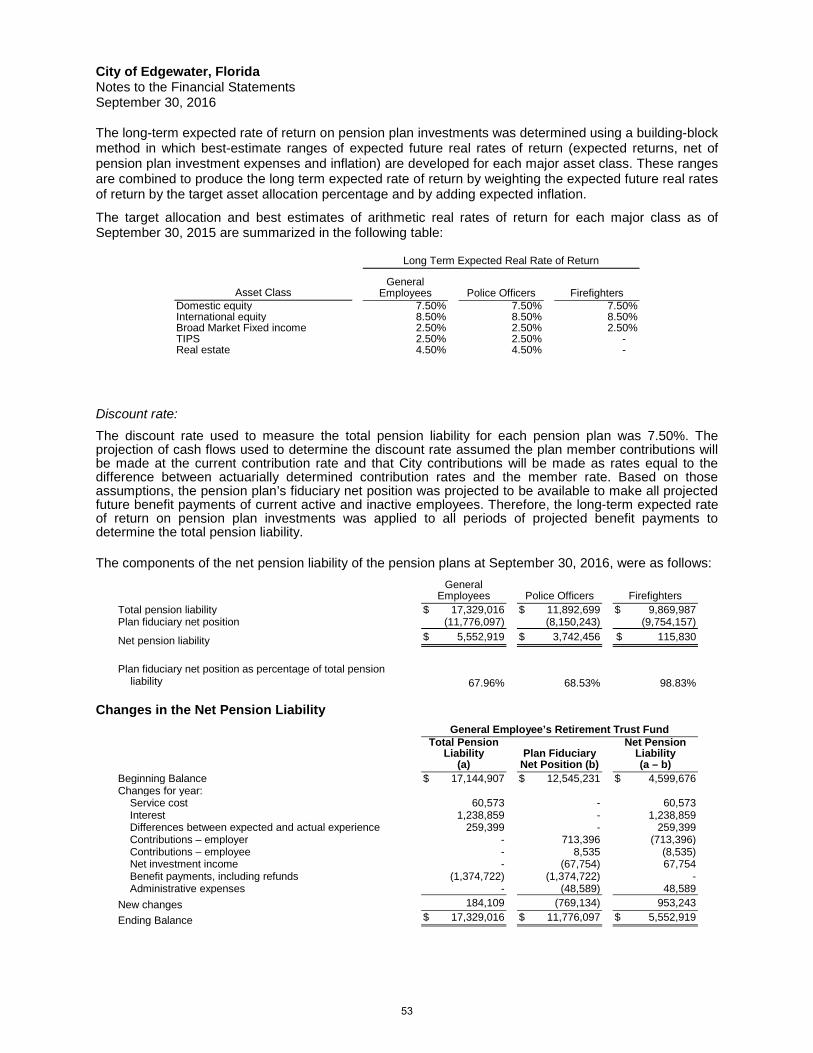
City of Edgewater, Florida Notes to the Financial Statements September 30, 2016
The long-term expected rate of return on pension plan investments was determined using a building-block method in which best-estimate ranges of expected future real rates of return (expected returns, net of pension plan investment expenses and inflation) are developed for each major asset class. These ranges are combined to produce the long term expected rate of return by weighting the expected future real rates of return by the target asset allocation percentage and by adding expected inflation.
The target allocation and best estimates of arithmetic real rates of return for each major class as of September 30, 2015 are summarized in the following table:
Long Term Expected Real Rate of Return
Asset Class General
Employees Police Officers Firefighters Domestic equity 7.50% 7.50% 7.50% International equity 8.50% 8.50% 8.50% Broad Market Fixed income 2.50% 2.50% 2.50% TIPS 2.50% 2.50% - Real estate 4.50% 4.50% -
Discount rate: The discount rate used to measure the total pension liability for each pension plan was 7.50%. The projection of cash flows used to determine the discount rate assumed the plan member contributions will be made at the current contribution rate and that City contributions will be made as rates equal to the difference between actuarially determined contribution rates and the member rate. Based on those assumptions, the pension plan’s fiduciary net position was projected to be available to make all projected future benefit payments of current active and inactive employees. Therefore, the long-term expected rate of return on pension plan investments was applied to all periods of projected benefit payments to determine the total pension liability.
The components of the net pension liability of the pension plans at September 30, 2016, were as follows:
General Employees Police Officers Firefighters
Total pension liability $ 17,329,016 $ 11,892,699 $ 9,869,987 Plan fiduciary net position (11,776,097) (8,150,243) (9,754,157)
Net pension liability $ 5,552,919 $ 3,742,456 $ 115,830
Plan fiduciary net position as percentage of total pension liability 67.96% 68.53% 98.83%
Changes in the Net Pension Liability
General Employee’s Retirement Trust Fund
Total Pension Liability
(a) Plan Fiduciary
Net Position (b)
Net Pension Liability (a – b)
Beginning Balance $ 17,144,907 $ 12,545,231 $ 4,599,676 Changes for year: Service cost 60,573 - 60,573 Interest 1,238,859 - 1,238,859 Differences between expected and actual experience 259,399 - 259,399 Contributions – employer - 713,396 (713,396) Contributions – employee - 8,535 (8,535) Net investment income - (67,754) 67,754 Benefit payments, including refunds (1,374,722) (1,374,722) - Administrative expenses - (48,589) 48,589
New changes 184,109 (769,134) 953,243
Ending Balance $ 17,329,016 $ 11,776,097 $ 5,552,919
53

City of Edgewater, Florida Notes to the Financial Statements September 30, 2016
Police Officer’s Retirement Trust Fund
Total Pension Liability
(a) Plan Fiduciary
Net Position (b)
Net Pension Liability (a – b)
Beginning Balance $ 11,544,809 $ 8,086,767 $ 3,458,042 Changes for year: Service cost 209,572 - 209,572 Interest 855,433 - 855,433 Differences between expected and actual experience (19,907) - (19,907) Contributions – employer - 618,054 (618,054) Contributions – State - 127,668 (127,668) Contributions – employee - 79,610 (79,610) Net investment income - (15,324) 15,324 Benefit payments, including refunds (697,208) (697,208) - Administrative expenses - (49,324) 49,324
New changes 347,890 63,476 284,414
Ending Balance $ 11,892,699 $ 8,150,243 $ 3,742,456
Firefighter’s Retirement Trust Fund
Total Pension Liability
(a) Plan Fiduciary
Net Position (b)
Net Pension Liability (a – b)
Beginning Balance $ 9,324,244 $ 9,949,850 $ (625,606) Changes for year: Service cost 317,342 - 317,342 Interest 715,242 - 715,242 Share Plan Allocation 90,777 - 90,777 Differences between expected and actual experience (367,566) - (367,566) Contributions – employer - 354,899 (354,899) Contributions – State - 150,763 (150,763) Contributions – employee - 93,950 (93,950) Net investment income - (536,507) 536,507 Benefit payments, including refunds (210,052) (210,052) - Administrative expenses - (48,746) 48,746
New changes 545,743 (195,693) 741,436
Ending Balance $ 9,869,987 $ 9,754,157 $ 115,830
Sensitivity of the net pension liability to changes in the discount rate:
The following presents the net pension liability of the City calculated using the discount rate of 7.50%, as well as what the City’s net pension liability would be if it were calculated using a discount rate that is 1% lower (6.50%) or 1% higher (8.50%) than the current rate:
City’s Net Pension Liability (Asset) 1% Decrease
6.50%
Current Discount Rate
7.50% 1% Increase
8.50%
General Employees Retirement Trust Fund $ 7,199,607 $ 5,552,919 $ 4,145,776 Police Officers Retirement Trust Fund 5,111,924 3,742,456 2,599,080 Firefighters Retirement Trust Fund 1,301,179 115,830 (868,691)
For the year ended September 30, 2015, the annual-money weighted rate of return on each pension plan investments, net of pension plan investment expense was as follows:
General Employees Retirement Trust Fund
Police Officers Retirement Trust Fund
Firefighters Retirement Trust Fund
Annual money-weighted rate of return (0.56)% (0.19)% (5.33)% The money-weighted rate of return expresses investment performance, net of investment expense, adjusted for the changing amounts actually invested.
54

City of Edgewater, Florida Notes to the Financial Statements September 30, 2016
Pension Expense and Deferred Outflows of Resources and Deferred Inflows of Resources Related to Pensions For the year ended September 30, 2016, the City recognized pension expense of $695,886, $381,318, and $448,098 in the General Employees, Police Officers, and Firefighters pension plans, respectively. At September 30, 2016, the City reported deferred outflows of resources and deferred inflows of resources related to pensions from the following sources:
General Employees’ Retirement Trust Fund
Police Officers’ Retirement Trust Fund
Firefighters’ Retirement Trust Fund
Deferred Outflows of Resources
Deferred Inflows of Resources
Deferred Outflows of Resources
Deferred Inflows of Resources
Deferred Outflows of Resources
Deferred Inflows of Resources
Differences between expected and actual experience $ - $ - $ - $ 14,931 $ - $ 315,056
Net difference between projected and actual investment earnings 380,618 - 264,128 - 644,491 -
Contributions made subsequent to measurement date 916,660 - 747,601 - 509,907 -
$ 1,297,278 $ - $1,011,729 $ 14,931 $ 1,154,398 $ 315,056
Amounts reported as deferred outflows of resources and deferred inflows of resources related to pensions will be recognized in pension expense as follows:
Year Ended September 30:
General Employees
Police Officers
Firefighters
2017 $ 11,592 $ 22,842 $ 62,179 2018 11,592 22,841 62,179 2019 160,965 78,557 103,499 2020 196,469 124,957 206,596 2021 - - (52,509) 2022 - - (52,509)
D. Employee Defined Contribution Retirement Pension Plans: General Employees - The City adopted a defined contribution plan effective October 1, 1996. The plan is a money purchase plan administered for the City by the Salem Trust. Eligible employees are employees hired effective October 1, 1996, or thereafter that would otherwise qualify for the General Employees’ Pension Plan. Employees hired prior to October 1, 1996, and not vested in the General Employees’ Pension Plan may also elect, instead, to participate in the defined contribution plan. Employee participation is immediate upon hiring and are 100% vested after five years of employment. Employees direct the investment of funds contributed to the plan on their behalf. Employer contributions made during the year amounted to $624,357. The City Council has the authority to amend the Plan’s provisions including amending contribution requirements. E. Deferred Compensation Plans: The City offers its employees a choice of two deferred compensation plans created in accordance with Internal Revenue Code Section 457; i.e., International City/County Management Association (ICMA). The plans are available to all City employees and permit employees to defer a portion of their salary until future years. Participation in either of the plans is optional. Deferred compensation withdrawals are not available to employees until termination, retirement, death, or an unforeseeable emergency. In accordance with current professional pronouncements, the City has not included such funds in its financial statements.
55

City of Edgewater, Florida Notes to the Financial Statements September 30, 2016
F. Joint Venture Communications Interlocal Agency. On January 11, 2002, the cities of New Smyrna Beach, Port Orange and Edgewater entered into an interlocal agreement to provide a consolidated dispatch communications and records system servicing law enforcement, fire, rescue and emergency communications for each of the cities. This entity, known as the Communications Interlocal Agency (CIA), was established pursuant to Florida Statutes, Section 163.01(7). Effective September 30, 2011, the CIA was dissolved as the County of Volusia, Florida voted to go to a centralized dispatch service for the entire County. The CIA assets were distributed to the three entities and the City received a final payout of $163,231 on March 22, 2016, which is recorded as miscellaneous income in the general fund. G. Contingencies: The City has been involved in miscellaneous collections, lot cleaning, stormwater, and other liens. In addition, the City has numerous pending/threatened claims against it. In the opinion of City management the loss if any, resulting from these actions will not have a material adverse effect on the financial condition of the City. Amounts received or receivable from grant agencies are subject to audit and adjustment by grantor agencies, principally the federal and state government. Any disallowed claims, including amounts already collected, may constitute a liability of the applicable funds. The amount, if any, of expenditures which may be disallowed by the grantor cannot be determined at this time although the City expects such amounts, if any, to be immaterial. H. Subsequent Events: On January 6, 2017, the City was awarded a State Revolving Fund loan in the amount of $336,500 for construction of the City’s reuse transmission maintenance project. On October 13, 2016, the City entered into a capital lease with American Capital in the amount of $495,511. The lease is for police personnel and equipment transport, parks and utility personnel and equipment transport, fire personnel and equipment transport, and admin personnel transport vehicles. In October 2016, the City was affected by Hurricane Matthew. This hurricane was primarily a wind event, causing significant debris and power outages. City facilities received only minimal damage from the storm. Debris removal and cleanup costs are estimated at $5 million. Expected reimbursements of approximately 89% are expected from FEMA, state, and insurance proceeds. I. Recently Issued Pronouncements:
The Governmental Accounting Standards Board (“GASB”) has issued several pronouncements that have effective dates that may impact future financial statements. Listed below are pronouncements with required implementation dates effective for subsequent fiscal years that have not yet been implemented. Management has not currently determined what, if any, impact implementation of the following will have on the City’s financial statements: (a) GASB issued Statement No. 74, Financial Reporting for Postemployment Benefit Plans Other than
Pension Plans, in June 2015, which establishes new accounting and financial reporting requirements for governments whose employees are provided with OPEB. GASB 74 is intended to improve the usefulness of information about postemployment benefits other than pensions included in the general
56

City of Edgewater, Florida Notes to the Financial Statements September 30, 2016
purpose external financial reports of state and local governmental OPEB plans for making decisions and assessing accountability. The requirements of GASB 74 are effective for fiscal years beginning after June 15, 2016.
(b) GASB issued Statement No. 75, Accounting and Financial Reporting for Postemployment Benefits Other Than Pensions, in June 2015, which establishes standards for recognizing and measuring liabilities, deferred outflows or resources, deferred inflows of resources, and expense/expenditures. GASB 75 seeks to improve accounting and financial reporting by state and local governments for postemployment benefits other than pensions. The provisions in GASB 75 are effective for fiscal years beginning after June 15, 2017.
(c) GASB issued Statement No. 77, Tax Abatement Disclosures, in August 2015. GASB 77 requires governments that enter into tax abatement agreements to disclose the following information about the agreements: (1) brief descriptive information, such as the tax being abated, the authority under which tax abatements are provided, eligibility criteria, the mechanism by which taxes are abated, provisions for recapturing abated taxes, and the types of commitments made by tax abatement recipients; (2) the gross dollar amount of taxes abated during the period; and (3) commitments made by a government, other than to abate taxes, as part of a tax abatement agreement. The provisions in GASB 77 are effective for periods beginning after December 15, 2015.
(d) GASB issued Statement No. 80, Blending Requirements for Certain Component Units—An Amendment of GASB Statement No. 14, in January 2016, which amends the blending requirements for the financial statement presentation of component units of all state and local governments. GASB 80 enhances the comparability of financial statements among governments. The provisions in GASB 80 are effective for fiscal years beginning after June 15, 2016.
(e) GASB issued Statement No. 81, Irrevocable Split-Interest Agreements, in March 2016, which requires that a government that receives resources pursuant to an irrevocable split-interest agreement recognize assets, liabilities, and deferred inflows of resources at the inception of the agreement. GASB 81 enhances comparability of financial statements by providing accounting and financial reporting guidance for irrevocable split-interest agreements in which a government is a beneficiary. The provisions in GASB 81 are effective for fiscal years beginning after December 15, 2016.
(f) GASB issued Statement No. 82, Pension Issues—An Amendment of GASB Statements No. 67, No. 68, and No. 73, in March 2016. GASB 82 addresses issues regarding (1) the presentation of payroll-related measures in required supplementary information, (2) the selection of assumptions and the treatment of deviations from the guidance in an Actuarial Standard of Practice for financial reporting purposes, and (3) the classification of payments made by employers to satisfy employee (plan member) contribution requirements. The provisions in GASB 82 are effective for periods beginning after either June 15, 2016 or June 15, 2017, if certain assumptions are met.
(g) GASB issued Statement No. 83, Certain Asset Retirement Obligations, in November 2016. GASB 83 addresses accounting and financial reporting for certain asset retirement obligations (AROs), which are legally enforceable liabilities associated with the retirement of a tangible capital asset. The provisions in GASB 81 are effective for periods beginning after June 15, 2018.
(h) GASB issued Statement No. 84, Fiduciary Activities, in January 2017. GASB 84 improves guidance regarding the identification and reporting of fiduciary activities. The provisions in GASB 84 are effective for periods beginning after December 15, 2018.
57

CITY OF EDGEWATER, FLORIDARequired Supplementary Information (unaudited)Schedules of changes in the City's Net Pension Liability and Related Ratios
Reporting Period Ending 9/30/2016 9/30/2015 9/30/2014
Measurement Date 9/30/2015 9/30/2014 9/30/2013
Total pension liability
Service cost 60,573$ 91,269$ 84,901$
Interest 1,238,859 1,241,107 1,237,145
Change in Funding Standard Account - - -
Share Plan Allocation - - -
Differences between Expected and Actual Experience 259,399 - -
Benefit payments, including refunds of employee
contributions (1,374,722) (1,288,586) (1,262,597)
Net change in total pension liability 184,109 43,790 59,449
Total pension liability, beginning 17,144,907 17,101,117 17,041,668
Total pension liability, ending (a) 17,329,016$ 17,144,907$ 17,101,117$
Plan Fidcuciary net position
Contribtions--employer 713,396$ 772,605$ 475,794$
Contributions – state - - -
Contribtions--employee 8,535 13,178 15,348
Net Investment income (67,754) 1,059,400 1,563,721
Benefit payments, including refunds of employee
contributions (1,374,722) (1,288,586) (1,262,597)
Administrative expense (48,589) (42,302) (76,889)
Net change in plan fiduciary net position (769,134) 514,295 715,377
Plan fiduciary net position, beginning 12,545,231 12,030,936 11,315,559
Plan fiduciary net position, ending (b) 11,776,097$ 12,545,231$ 12,030,936$
Net pension liability – ending (a) - (b) 5,552,919$ 4,599,676$ 5,070,181$
Plan fiduciary net position as a percentage of the total
pension liability 67.96% 73.17% 70.35%
Covered employee payroll 341,408$ 567,030$ 613,927$
Net pension liability as a percentage of covered
employee payroll 1626.48% 811.19% 825.86%
Annual Money-Weighted Rate of Return -0.56% 8.94% 13.50%
Note - Additional years' information will be displayed as it becomes available to present 10 years.
General Employees' Retirement Trust
58

9/30/2016 9/30/2015 9/30/2014 9/30/2016 9/30/2015 9/30/2014
9/30/2015 9/30/2014 9/30/2013 9/30/2015 9/30/2014 9/30/2013
209,572$ 206,976$ 192,536$ 317,342$ 323,511$ 300,940$
855,433 859,397 836,080 715,242 652,070 601,821
- (386,259) - - - -
- - - 90,777 88,962 -
(19,907) - - (367,566) - -
(697,208) (773,904) (690,444) (210,052) (222,096) (288,611)
347,890 (93,790) 338,172 545,743 842,447 614,150
11,544,809 11,638,599 11,300,427 9,324,244 8,481,797 7,867,647
11,892,699$ 11,544,809$ 11,638,599$ 9,869,987$ 9,324,244$ 8,481,797$
618,054$ 534,795$ 768,448$ 354,899$ 392,863$ 469,302$
127,668 125,387 121,375 150,763 155,382 129,103
79,610 76,054 70,431 93,950 88,869 87,309
(15,324) 759,444 769,004 (536,507) 1,160,776 766,338
(697,208) (773,904) (690,444) (210,052) (222,096) (288,611)
(49,324) (36,404) (82,988) (48,746) (44,645) (18,869)
63,476 685,372 955,826 (195,693) 1,531,149 1,144,572
8,086,766 7,401,394 6,445,568 9,949,850 8,418,701 7,274,129
8,150,242$ 8,086,766$ 7,401,394$ 9,754,157$ 9,949,850$ 8,418,701$
3,742,457$ 3,458,043$ 4,237,205$ 115,830$ (625,606)$ 63,096$
68.53% 70.05% 63.59% 98.83% 106.71% 99.26%
1,396,624$ 1,267,568$ 1,173,844$ 1,579,650$ 1,467,330$ 1,455,154$
267.96% 272.81% 360.97% 7.33% -42.64% 4.34%
-0.19% 10.40% 10.40% -5.33% 13.59% 10.25%
Police Officers' Pension Trust Firefighters' Pension Trust
59

CITY OF EDGEWATER, FLORIDARequired Supplementary Information (unaudited)Schedules of General Employees' Contributions
Reporting Period Ending September 30, 2016 September 30, 2015 September 30, 2014Measurement Date September 30, 2015 September 30, 2014 September 30, 2013Actuarially Determined Contribution (ADC) 719,822$ 766,179$ 475,794$ Contributions in Relation to ADC 713,396 772,605 475,794 Contribution Deficiency (Excess) 6,426$ (6,426)$ -$
Covered Employee Payroll 341,408$ 567,030$ 613,927$ Contributions as a Percentage ofCovered Employee Payroll 208.96% 136.25% 77.50%
Notes to Schedule:Valuation Date: 10/01/2013
Additional years' information will be displayed as it becomes available to present 10 years.
Methods and assumptions used to determine contribution rates:Funding Method: Entry Age Normal Actuarial Cost Method
Interest - A half year, based on the current 7.5% assumption.Salary - A full year, based on the current average assumption of 4.0%.
Mortality:
Inflation: 3.0% per year.Interest Rate: 7.5% per year compounded annually, net of investment related expenses.Normal Retirement: Age Retirement Probability
55 50%56-59 0%60 and older 100%
Salary Increases: 4% per year. Termination Rates: None assumed.Early Retirement: None assumed.Actuarial Asset Method:
Disability Rates: 0.30% - 1.55%
In addition to the above table, 100% Retirement is assumed upon the completion of 25 years of Credited Service.
All assets are valued at market value with an adjustment made to uniformly spread actuarial investment gains and losses (as measured by actual market value investment return against expected market value investment return) over a four-year period.
RP2000 Combined Healthy projected to the valuation date with schedule AA - Sex Distinct.
Actuarially determined contribution rates are calculated as of October 1, two years prior to the end of the fiscal year in which contributions are reported.
60

CITY OF EDGEWATER, FLORIDARequired Supplementary Information (unaudited)Schedules of Police Officers' Contributions
Reporting Period Ending September 30, 2016 September 30, 2015 September 30, 2014Measurement Date September 30, 2015 September 30, 2014 September 30, 2013Actuarially Determined Contribution (ADC) 768,235$ 766,878$ 874,513$ Contributions in Relation to ADC 745,722 660,182 768,448 Contribution Deficiency (Excess) 22,513$ 106,696$ 106,065$
Covered Employee Payroll 1,396,624$ 1,267,568$ 1,173,844$ Contributions as a Percentage ofCovered Employee Payroll 53.39% 52.08% 65.46%
Notes to Schedule:Valuation Date: 10/01/2013
Additional years' information will be displayed as it becomes available to present 10 years.
Methods and assumptions used to determine contribution rates:Funding Method: Entry Age Normal Actuarial Cost Method.Amortization Method: Level dollar.Remaining Amortization Period: 20 Years (as of 10/01/2013).Mortality:
Interest Rate: 7.5% per year compounded annually, net of investment related expenses.Retirement Age: Years Eligible for Normal Retirement Retirement Probability
0 50%1 0%2 33%
3-5 60%6 and greater 100%
Early Retirement: None assumed.Inflation: 3.0% per year.Salary Increases: 7.5% for less than 10 years credited service.
4.2% for 10 years or greater of credited service.Actuarial Asset Method:
Termination Rates: 18% for less than 5 years credited service.14% for 5-9 years credited service.0% for 10 years or greater of credited service.
Disability Rates: 0.30% - 1.55%
RP-2000 Combined Healthy Mortality, projected to 2005 using scale AA. Based on a study of over 650 public safety funds, the RP-2000 table (with no projection) reflects a 10% margin for future mortality improvements.
All assets are valued at market value with an adjustment made to uniformly spread actuarial investment gains and losses (as measured by actual market value investment return against expected market value investment return) over a four-year period.
Actuarially determined contribution rates are calculated as of October 1, two years prior to the end of the fiscal year in which contributions are reported.
61

CITY OF EDGEWATER, FLORIDARequired Supplementary Information (unaudited)Schedules of Firefighters' Contributions
Reporting Period Ending September 30, 2016 September 30, 2015 September 30, 2014Measurement Date September 30, 2015 September 30, 2014 September 30, 2013Actuarially Determined Contribution (ADC) 407,550$ 432,862$ 534,041$ Contributions in Relation to ADC 414,885 459,283 534,041 Contribution Deficiency (Excess) (7,335)$ (26,421)$ -$
Covered Employee Payroll 1,579,650$ 1,467,330$ 1,455,154$ Contributions as a Percentage ofCovered Employee Payroll 26.26% 31.30% 36.70%
Notes to Schedule:Valuation Date: 10/01/2013 (AIS 8/22/2014)
Additional years' information will be displayed as it becomes available to present 10 years.
Methods and assumptions used to determine contribution rates:Funding Method: Entry Age Normal Actuarial Cost Method.Amortization Method: Level Percentage of Pay, Closed.Remaining Amortization Period: 30 Years (as of 10/01/2013).Mortality:
Interest Rate: 7.5% per year compounded annually, net of investment related expenses.Normal Retirement: Years Eligible for Normal Retirement Retirement Probability
0 60%1-4 0%
5 and greater 100%In addition to the above, 100% Retirement is assumed upon the attainment of age 55 with 5 years of Credited Service.
Disability Rates: 0.06% - .36% Payroll Growth: 3.5% (previously 4.4%) per year.Asset Smoothing Methodology:
Inflation: 3.0% per year.Salary Increases: 6.5% for less than 10 years credited service.
6.0% for 10-15 years credited service.5.0% for 15 years or greater of credited service.
Final Salary Load: No load for 0 years of credited service.10.0% for less than 10 years of credited service.20.0% for 10 or more years of credited service.A flat 20% load was utilized for valuations prior to October 1, 2014.
Termination Rates: 7.5% for less than 5 years credited service.4.0% for 5 years or greater of credited service.Commencing at eligibility for Early Retirement, Members are assumed to retire with an immediate benefit at the rate of 5% per year.
RP-2000 Combined Healthy Mortality Table, Sex District. Disabled lives are set forward 5 years. Based on a study of over 650 public safety funds, this table reflects a 10% margin for future mortality improvements.
The Actuarial Value of Assets is brought forward using the historical four-year geometric average of Market Value Returns (net-of-fees). Over time, this may result in a de minis bias that is above or below the Market Value of Assets.
Actuarially determined contribution rates are calculated as of October 1, two years prior to the end of the fiscal year in which contributions are reported.
62

CITY OF EDGEWATER, FLORIDARequired Supplementary Information (unaudited)Other Post Employment Benefit Plan
Year Ended Percentage
Sept 30, Contribution
2016 205,761$ 84,832$ 41.2%
2015 194,628 78,584 40.4%
2014 226,496 126,896 56.0%
2013 217,079 117,354 54.1%
2012 194,676 80,788 41.5%
2011 187,837 72,926 38.8%
Unfunded or Unfunded or
Actuarial Actuarial Actuarial (Assets in (Assets in Excess of)
Valuation Value of Accrued Liability Excess of) Funded Covered AAL as a Percentage
Date Assets (AAL)--Entry Age AAL Ratio Payroll of Covered Payroll
(a) (b) (b-a) (a/b) (c) ((b-a)/c)
10/1/2014 -$ 1,403,933$ 1,403,933$ 0.00% 7,349,769$ 19.1%
10/1/2012 - 1,849,238 1,849,238 0.00% 7,177,127 25.8%
10/2/2010 - 1,676,652 1,676,652 0.00% 5,765,693 29.1%
Schedule of Funding Progress
Schedules of Contributions from the EmployerAnnual
Required City Contribution City Contribution
63

This page intentionally left blank
64

CITY OF EDGEWATER, FLORIDA Nonmajor Governmental Funds September 30, 2016 SPECIAL REVENUE FUNDS are used to account for revenue derived from specific taxes or other earmarked revenue sources (other than for major capital projects) that are restricted by law or administrative action to expenditures for specified purposes.
Justice Assistance Grant Fund – This fund was established to receive revenues derived from money received from the Department of Justice for various grants such as JAG.
Special Law Enforcement Trust Fund – This fund was established to receive revenues derived from confiscated property obtained during the enforcement purposes, exclusive of salaries and vehicles. Such purposes may include drug education programs such as DARE.
Transportation Impact Fees Fund – This fund was established to account for road impact fees collected from new developments constructed in the City.
Police Impact fees Fund – This fund was established to account for police impact fees collected from new developments constructed in the City.
Fire Impact Fees Fund – This fund was established to account for fire impact fees collected from new developments constructed in the City.
Recreation Impact Fees Fund – This fund was established to account for recreation impact fees collected from new developments constructed in the City.
DEBT SERVICE FUNDS are established to account for the accumulation of resources for, and the payment of, general long-term debt principal and interest.
Debt Service Fund – This fund was established to account for the payment of general long-term debt principal and interest for the Animal Shelter.
CAPITAL PROJECTS FUNDS are established to account for resources used for the acquisition and construction of capital facilities by the City, except for those financed by proprietary funds.
Capital Projects Fund – This fund was established to account for the acquisition of fixed assets or construction of major capital projects not being financed by proprietary funds.
65
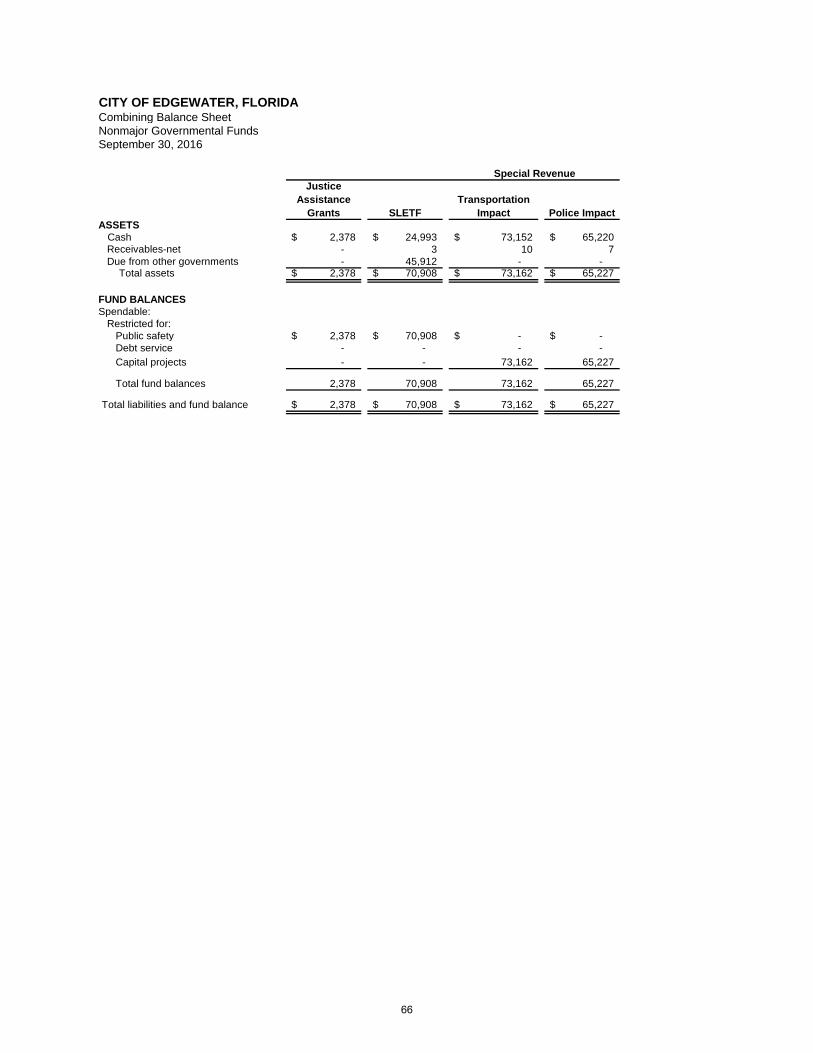
CITY OF EDGEWATER, FLORIDACombining Balance Sheet Nonmajor Governmental FundsSeptember 30, 2016
Justice Assistance
Grants SLETFTransportation
Impact Police ImpactASSETS Cash 2,378$ 24,993$ 73,152$ 65,220$
Receivables-net - 3 10 7 Due from other governments - 45,912 - - Total assets 2,378$ 70,908$ 73,162$ 65,227$
FUND BALANCESSpendable: Restricted for: Public safety 2,378$ 70,908$ -$ -$ Debt service - - - - Capital projects - - 73,162 65,227
Total fund balances 2,378 70,908 73,162 65,227
Total liabilities and fund balance 2,378$ 70,908$ 73,162$ 65,227$
Special Revenue
66

Fire ImpactRecreation
Impact Debt Service
Total Nonmajor Governmental
Funds
67,824$ 88,358$ 4,132$ 326,057$ 8 11 - 39
- - - 45,912 67,832$ 88,369$ 4,132$ 372,008$
-$ -$ -$ 73,286$ - - 4,132 4,132
67,832 88,369 - 294,590
67,832 88,369 4,132 372,008
67,832$ 88,369$ 4,132$ 372,008$
67
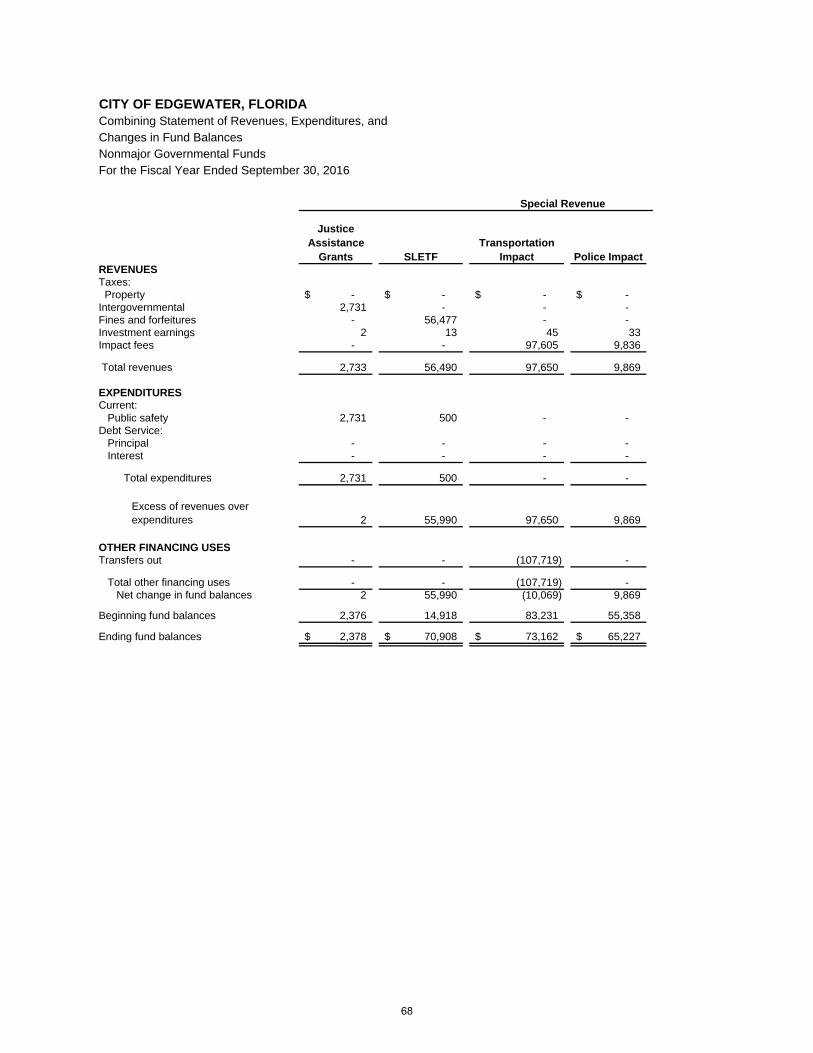
CITY OF EDGEWATER, FLORIDACombining Statement of Revenues, Expenditures, andChanges in Fund BalancesNonmajor Governmental FundsFor the Fiscal Year Ended September 30, 2016
Justice Assistance
Grants SLETFTransportation
Impact Police ImpactREVENUES Taxes: Property -$ -$ -$ -$ Intergovernmental 2,731 - - - Fines and forfeitures - 56,477 - - Investment earnings 2 13 45 33 Impact fees - - 97,605 9,836
Total revenues 2,733 56,490 97,650 9,869
EXPENDITURES Current: Public safety 2,731 500 - - Debt Service: Principal - - - - Interest - - - -
Total expenditures 2,731 500 - -
Excess of revenues over expenditures 2 55,990 97,650 9,869
OTHER FINANCING USESTransfers out - - (107,719) -
Total other financing uses - - (107,719) - Net change in fund balances 2 55,990 (10,069) 9,869
Beginning fund balances 2,376 14,918 83,231 55,358
Ending fund balances 2,378$ 70,908$ 73,162$ 65,227$
Special Revenue
68

Fire ImpactRecreation
Impact Debt Service
Total Nonmajor Governmental
Funds
-$ -$ 32,872$ 32,872$ - - - 2,731 - - - 56,477 35 45 4 177
18,255 34,407 - 160,103
18,290 34,452 32,876 252,360
- - - 3,231
- - 20,000 20,000 - - 12,112 12,112
- - 32,112 35,343
18,290 34,452 764 217,017
- - - (107,719)
- - - (107,719) 18,290 34,452 764 109,298
49,542 53,917 3,368 262,710
67,832$ 88,369$ 4,132$ 372,008$
69

CITY OF EDGEWATER, FLORIDASchedule of Revenues, Expenditures, andChanges in Fund Balances--Budget and ActualAnnually - Budgeted Nonmajor Special Revenue FundsFor the Fiscal Year Ended September 30, 2016
Original FinalActual
Amounts Original FinalActual
Amounts
REVENUES
Intergovernmental 5,000$ 5,000$ 2,731$ (2,269)$ -$ -$ -$ -$ Fines and forfeitures - - - - 3,000 56,000 56,477 477 Investment earnings - - 2 2 - - 13 13 Impact fees - - - - - - - - Total revenues 5,000 5,000 2,733 (2,267) 3,000 56,000 56,490 490
EXPENDITURES Current: Public Safety 5,000 5,000 2,731 2,269 5,000 57,000 500 56,500 Capital outlay - - - - - - - - Total expenditures 5,000 5,000 2,731 2,269 5,000 57,000 500 56,500 Excess (deficiency) of revenues over (under) expenditures - - 2 2 (2,000) (1,000) 55,990 56,990
OTHER FINANCING SOURCES (USES)Transfers out - - - - - - - -
Total other financing sources (uses) - - - - - - - -
Net change in fund balances - - 2 2 (2,000) (1,000) 55,990 56,990
Beginning fund balances 2,376 2,376 2,376 - 14,918 14,918 14,918 -
Ending fund balances (deficit) 2,376$ 2,376$ 2,378$ 2$ 12,918$ 13,918$ 70,908$ 56,990$
Budgeted Amounts Variance with Final Budget-Positive
(Negative)
SLETFJustice Assistance Grants
Budgeted Amounts Variance with Final Budget-Positive
(Negative)
Special Revenue
70

CITY OF EDGEWATER, FLORIDASchedule of Revenues, Expenditures, andChanges in Fund Balances--Budget and Actual--Annually-Budgeted Nonmajor Special Revenue Funds (continued)For the Fiscal Year Ended September 30, 2016
Original FinalActual
Amounts Original FinalActual
Amounts
REVENUES
Intergovernmental -$ -$ -$ -$ -$ -$ -$ -$ Fines and forfeitures - - - - - - - - Investment earnings - - 45 45 - - 33 33 Impact fees 110,000 110,000 97,605 (12,395) 4,000 4,000 9,836 5,836 Total revenues 110,000 110,000 97,650 (12,350) 4,000 4,000 9,869 5,869
EXPENDITURES Current: Public Safety - - - - - - - - Capital outlay - - - - - 64,412 - 64,412 Total expenditures - - - - - 64,412 - 64,412 Excess (deficiency) of revenues over (under) expenditures 110,000 110,000 97,650 (12,350) 4,000 (60,412) 9,869 70,281
OTHER FINANCING SOURCES (USES)Transfers out (205,000) (107,719) (107,719) - - - - -
Total other financing sources (uses) (205,000) (107,719) (107,719) - - - - -
Net change in fund balances (95,000) 2,281 (10,069) (12,350) 4,000 (60,412) 9,869 70,281
Beginning fund balances 83,231 83,231 83,231 - 55,358 55,358 55,358 -
Ending fund balances (deficit) (11,769)$ 85,512$ 73,162$ (12,350)$ 59,358$ (5,054)$ 65,227$ 70,281$
Special Revenue
Budgeted AmountsVariance with Final Budget-Positive
(Negative)
Variance with Final Budget-Positive
(Negative)
Transportation Impact Police Impact
Budgeted Amounts
71

CITY OF EDGEWATER, FLORIDASchedule of Revenues, Expenditures, andChanges in Fund Balances--Budget and Actual--Annually-Budgeted Nonmajor Special Revenue Funds (continued)For the Fiscal Year Ended September 30, 2016
Original FinalActual
Amounts Original FinalActual
Amounts
REVENUES
Intergovernmental -$ -$ -$ -$ -$ -$ -$ -$ Fines and forfeitures - - - - - - - - Investment earnings - - 35 35 - - 45 45 Impact fees 5,000 23,000 18,255 (4,745) 10,000 48,000 34,407 (13,593) Total revenues 5,000 23,000 18,290 (4,710) 10,000 48,000 34,452 (13,548)
EXPENDITURES Current: Public Safety 13,220 13,220 - 13,220 - - - - Capital outlay - - - - - - - - Total expenditures 13,220 13,220 - 13,220 - - - - Excess (deficiency) of revenues over (under) expenditures (8,220) 9,780 18,290 8,510 10,000 48,000 34,452 (13,548)
OTHER FINANCING SOURCES (USES)Transfers out - - - - - - - -
Total other financing sources (uses) - - - - - - - -
Net change in fund balances (8,220) 9,780 18,290 8,510 10,000 48,000 34,452 (13,548)
Beginning fund balances 49,542 49,542 49,542 - 53,917 53,917 53,917 -
Ending fund balances (deficit) 41,322$ 59,322$ 67,832$ 8,510$ 63,917$ 101,917$ 88,369$ (13,548)$
Special Revenue
Variance with Final Budget-Positive
(Negative)
Budgeted Amounts Variance with Final Budget-Positive
(Negative)
Fire Impact Recreation Impact
Budgeted Amounts
72

CITY OF EDGEWATER, FLORIDASchedule of Revenues, Expenditures, andChanges in Fund Balances--Budget and Actual--Annually-Budgeted Nonmajor Special Revenue Funds (continued)For the Fiscal Year Ended September 30, 2016
Original FinalActual
Amounts
REVENUES
Intergovernmental 5,000$ 5,000$ 2,731$ (2,269)$ Fines and forfeitures 3,000 56,000 56,477 477 Investment earnings - - 173 173 Impact fees 129,000 185,000 160,103 (24,897) Total revenues 137,000 246,000 219,484 (26,516)
EXPENDITURES Current: Public Safety 23,220 75,220 3,231 71,989 Capital outlay - 64,412 - 64,412 Total expenditures 23,220 139,632 3,231 136,401 Excess (deficiency) of revenues over (under) expenditures 113,780 106,368 216,253 109,885
OTHER FINANCING SOURCES (USES)Transfers out (205,000) (107,719) (107,719) -
Total other financing sources (uses) (205,000) (107,719) (107,719) -
Net change in fund balances (91,220) (1,351) 108,534 109,885
Beginning fund balances 259,342 259,342 259,342 -
Ending fund balances (deficit) 168,122$ 257,991$ 367,876$ 109,885$
Budgeted Amounts Variance with Final Budget-
Positive (Negative)
Total
73

CITY OF EDGEWATER, FLORIDASchedule of Revenues, Expenditures, and
Changes in Fund Balances--Budget and ActualAnnually - Budgeted Nonmajor Debt Service FundFor the Fiscal Year Ended September 30, 2016
Variance with Final Budget-
Original Final Actual
Amounts Positive
(Negative)
REVENUES
Taxes:
Property 32,256$ 32,256$ 32,872$ 616$
Investment earnings - - 4 4
Total revenues 32,256 32,256 32,876 620
EXPENDITURES
Debt Service:
Principal 20,000 20,000 20,000 -
Interest 12,112 12,112 12,112 -
Total expenditures 32,112 32,112 32,112 -
Excess (deficiency) of revenues over (under)
expenditures 144 144 764 620
Beginning fund balances 3,368 3,368 3,368 -
Ending fund balances 3,512$ 3,512$ 4,132$ 620$
-
Budgeted Amounts
74

CITY OF EDGEWATER, FLORIDASchedule of Revenues, Expenditures, andChanges in Fund Balances--Budget and ActualAnnually - Budgeted Major Capital Projects FundFor the Fiscal Year Ended September 30, 2016
Original FinalActual
Amounts
REVENUES Intergovernmental 1,100,830$ 431,926$ 489,957$ 58,031$ Total revenues 1,100,830 431,926 489,957 58,031
EXPENDITURES
Capital outlay 1,520,609 514,739 488,911 25,828 Other Services & Charges 400,000 400,000 293,332 106,668 Total expenditures 1,920,609 914,739 782,243 132,496 Excess (deficiency) of revenues over (under) expenditures (819,779) (482,813) (292,286) 190,527
OTHER FINANCING SOURCES (USES)Transfers in 808,355 254,385 254,385 -
Total other financing sources (uses) 808,355 254,385 254,385 -
Net change in fund balance (11,424) (228,428) (37,901) 190,527
Beginning fund balances 403,386 403,386 403,386 -
Ending fund balances 391,962$ 174,958$ 365,485$ 190,527$
Budgeted Amounts Variance with Final Budget-
Positive (Negative)
General Construction
75

This page intentionally left blank
76

CITY OF EDGEWATER, FLORIDA Internal Service Funds September 30, 2016
INTERNAL SERVICE FUNDS are used to account for the financing of centralized services to City departments on a cost-reimbursement basis (including depreciation).
Management Information Systems (MIS) – To account for data processing operations and the cost of computer services used by other City departments.
Fleet – To account for the cost of operating a maintenance facility for automotive equipment used by other City departments / divisions.
Loss Fund – To account for the general liability and property insurances of the City.
Fully Insured – To account for the health, dental and life insurance of the City’s employees andretirees.
Workers Comp – To account for the workers compensation insurance of the City.
77

CITY OF EDGEWATER, FLORIDACombining Statement of Net PositionInternal Service FundsSeptember 30, 2016
Loss Fully Workers
MIS FLEET Fund Insured Comp Total
ASSETS
Current assets:
Cash 52,481$ 77,832$ 5,755$ -$ -$ 136,068$
Due from other funds 136,192 - - - - 136,192
Receivables--net 20 - - - - 20
Inventories - 23,263 - - - 23,263
Prepaid items 12,582 7,335 2,783 - - 22,700
Total current assets 201,275 108,430 8,538 - - 318,243
Noncurrent assets:
Capital assets:
Buildings and improvements 60,684 - - - - 60,684
Machinery and equipment 194,011 58,198 - - - 252,209
Less accumulated depreciation (142,487) (40,085) - - - (182,572)
Total capital assets (net of accumulated depreciation) 112,208 18,113 - - - 130,321
Total noncurrent assets 112,208 18,113 - - - 130,321
Total assets 313,483 126,543 8,538 - - 448,564
LIABILITIES
Current liabilities:
Accounts payable 993 3,178 - 191,311 9,497 204,979
Due to other funds - - - 63,714 72,478 136,192
Accrued liabilities 4,183 3,262 - - - 7,445
Compensated absences 18,673 14,708 - - - 33,381
Accrued interest payable 168 - - - - 168
Notes payable - current 9,745 - - - - 9,745
Total current liabilities 33,762 21,148 - 255,025 81,975 391,910
Noncurrent liabilities:
Compensated absences 12,162 19,338 - - - 31,500
OPEB obligation 11,880 10,856 - - - 22,736
Long-term debt payable after one year 74,635 - - - - 74,635
Total noncurrent liabilities 98,677 30,194 - - - 128,871
Total liabilities 132,439 51,342 - 255,025 81,975 520,781
NET POSITION
Net investment in capital assets 27,828 18,113 - - - 45,941
Unrestricted 153,216 57,088 8,538 (255,025) (81,975) (118,158)
Total net position 181,044$ 75,201$ 8,538$ (255,025)$ (81,975)$ (72,217)$
78

CITY OF EDGEWATER, FLORIDACombining Statement of Revenues, Expenses, andChanges in Fund Net PositionInternal Service FundsFor the Fiscal Year Ended September 30, 2016
Loss Fully Workers
MIS FLEET Fund Insured Comp Total
Operating revenues:
Billings to City departments 661,370$ 868,566$ 305,202$ 2,223,465$ 246,124$ 4,304,727$
Operating expenses:
Salaries and employee benefits 230,387 171,470 - 2,345,001 287,564 3,034,422
Supplies and materials 139,275 316,110 - - - 455,385
Contract services 153,591 178 - - - 153,769
Other services and charges 87,448 372,028 305,515 - - 764,991
Depreciation 57,485 4,708 - - - 62,193
Total operating expenses 668,186 864,494 305,515 2,345,001 287,564 4,470,760
Operating income (loss) (6,816) 4,072 (313) (121,536) (41,440) (166,033)
Nonoperating revenues (expenses)
Investment earnings 129 34 3 7 - 173
Interest expense (2,129) - - - - (2,129)
Total nonoperating revenues (2,000) 34 3 7 - (1,956)
Income (loss) before
contributions and transfers (8,816) 4,106 (310) (121,529) (41,440) (167,989)
Transfers in 48,090 - - - - 48,090
Change in net position 39,274 4,106 (310) (121,529) (41,440) (119,899)
Total net position - beginning 141,770 71,095 8,848 (133,496) (40,535) 47,682
Total net position - ending 181,044$ 75,201$ 8,538$ (255,025)$ (81,975)$ (72,217)$
79

CITY OF EDGEWATER, FLORIDACombining Statement of Cash FlowsInternal Service FundsFor the Fiscal Year Ended September 30, 2016
Loss Fully Workers
MIS FLEET Fund Insured Comp Total
Cash flows from operating activities:
Receipts-customers and users 661,350$ 874,364$ 305,202$ 2,223,465$ 246,124$ 4,310,505$
Payments-suppliers (382,086) (690,607) (305,515) (2,332,888) (318,602) (4,029,698)
Payments-employees (229,173) (169,614) - - - (398,787)
Net cash provided (used) by operating activities 50,091 14,143 (313) (109,423) (72,478) (117,980)
Cash flows from noncapital financing activities:
Cash received from (paid to) other funds (88,102) - - 63,714 72,478 48,090
Cash flows from capital and related financing activities:
Interest payments on debt (2,147) - - - - (2,147)
Principal paid on debt (9,509) - - - - (9,509)
Net cash used in capital and related financing activities (11,656) - - - - (11,656)
Cash flows from investing activities:
Interest on investments 129 34 3 7 - 173
Net cash provided (used) by investing activities 129 34 3 7 - 173
Net increase (decrease) in cash and cash equivalents (49,538) 14,177 (310) (45,702) - (81,373)
Beginning cash and cash equivalents 102,019 63,655 6,065 45,702 - 217,441 Ending cash and cash equivalents 52,481$ 77,832$ 5,755$ -$ -$ 136,068$
Reconciliation of operating income (loss) to net cash provided
(used) by operating activities:
Operating income (loss) (6,816)$ 4,072$ (313)$ (121,536)$ (41,440)$ (166,033)$ Adjustments to reconcile operating income (loss) to net cash provided (used) by operating activities:
Depreciation and amortization 57,486 4,708 - - - 62,194
(Increase) decrease in assets:
Receivables - net (20) 5,798 - - - 5,778
Inventories - 4,195 - - - 4,195
Prepaid Items 319 (7,335) - 7,530 - 514
Increase (decrease) in liabilities:
Accounts payable (4,143) (910) - 4,583 (31,038) (31,508)
Accrued liabilities 2,051 1,759 - - - 3,810
OPEB obligation 2,014 1,411 - - - 3,425
Compensated absences (800) 445 - - - (355)
Total adjustments 56,907 10,071 - 12,113 (31,038) 48,053 Net cash provided (used) by operating activities 50,091$ 14,143$ (313)$ (109,423)$ (72,478)$ (117,980)$
80

CITY OF EDGEWATER, FLORIDA Other Supplemental Schedules September 30, 2016
Fiduciary Funds – Pension trust Funds
Police, Firefighter and General Employees’ Pension Funds – These funds are used to account for the accumulation of resources to be used for retirement annuity payments at the appropriate amounts and times in the future. Resources are contributed by employees at a rate fixed by law and by the City and the State at amounts determined by an annual actuarial study.
81

CITY OF EDGEWATER, FLORIDACombining Statement of Fiduciary Net PositionPension Trust FundsSeptember 30, 2016
General
Employees Total
ASSETS
Accrued income 45,077$ 30,504$ 20,757$ 96,338$
Investments, at fair value:
Money market funds 787,130 245,535 204,788 1,237,453
Bonds
US Treasury notes 565,649 172,638 243,772 982,059
GNMA 1,363,915 799,397 137,501 2,300,813
Municipal bonds 58,762 53,560 205,212 317,534
Corporate bonds 3,447,759 2,113,267 2,263,507 7,824,533
Equities - - 8,073,264 8,073,264
Mutual fund - equities 6,007,566 5,136,129 - 11,143,695
Total assets 12,275,858 8,551,030 11,148,801 31,975,689
LIABILITIES
Accounts payable 11,098 10,402 5,971 27,471
Unearned contributions - 12,113 21,462 33,575
Total liabilities 11,098 22,515 27,433 61,046
NET POSITION
Held in trust for pension benefits 12,264,760$ 8,528,515$ 11,121,368$ 31,914,643$
Police Officers Firefighters
82

CITY OF EDGEWATER, FLORIDACombining Statement of Changes in Fiduciary Net PositionPension Trust FundsFor the Fiscal Year Ended September 30, 2016
General Police
Employees Officers Firefighters Total
ADDITIONS
Contributions:
Employer 916,660$ 609,357$ 370,380$ 1,896,397$
Employee 44,900 84,939 117,687 247,526
State of Florida - 138,244 139,527 277,771
Total contributions 961,560 832,540 627,594 2,421,694
Investment earnings: Interest and dividends 590,801 248,424 181,027 1,020,252 Net increase in the fair value of investments 393,252 369,671 1,034,158 1,797,081 Total investment earnings 984,053 618,095 1,215,185 2,817,333 Less investment expenses (32,962) (53,385) (71,598) (157,945) Net investment earnings 951,091 564,710 1,143,587 2,659,388
Total Additions 1,912,651 1,397,250 1,771,181 5,081,082
DEDUCTIONS Pension benefits 1,388,119 950,417 312,107 2,650,643
Administrative expenses 42,336 66,323 59,652 168,311 Total deductions 1,430,455 1,016,740 371,759 2,818,954 Change in net position 482,196 380,510 1,399,422 2,262,128
Net position - beginning 11,782,564 8,148,005 9,721,946 29,652,515
Net position - ending 12,264,760$ 8,528,515$ 11,121,368$ 31,914,643$
83

This page intentionally left blank
84

CITY OF EDGEWATER, FLORIDAStatistical Secton
Contents
Financial TrendsThese schedules contain trend information to help the reader understand how the City'sfinancial performance and well-being have changed over time.
Revenue CapacityThese schedules contain information to help the reader assess the City's mostsignificant local revenue source, the property tax, and the municipal sales tax.
Debt CapacityThese schedules present information to help the reader assess the affordability of theCity's current levels of outstanding debt and the City's ability to issue additional debt inthe future.
Demographic and Economic InformationThese schedules offer economic and demographic indicators to help the readerunderstand the environment within which the City's financial activities take place.
Operating InformationThese schedules contain service and infrastructure data to help the reader understandhow the information in the City's financial report relates to the services the City providesand the activities it performs.
Sources: Unless otherwise noted, the information in these schedules is derived from theComprehensive Annual Financial Report for the relevant fiscal year.
This part of the City of Edgewater, Florida's Comprehensive Annual Financial Report presents detailed
information as a context for understanding what the information in the financial statements, note
disclosures, and required supplementary information says about the City's overall financial health and is
unaudited.
104-106
Page(s)
86-90
91-95
96-101
102-103
85

2016
2015
2014
2013
2012
2011
2010
2009
2008
2007
Gov
ernm
enta
l Act
iviti
esN
et I
nves
tmen
t in
Cap
ital A
sset
s41
,225
,542
$
41
,696
,833
$
40
,480
,601
$
43
,278
,270
$
45
,488
,481
$
45
,286
,948
$
47
,510
,167
$
48
,282
,223
$
49
,083
,883
$
47
,677
,631
$
R
estr
icte
d 78
3,39
8
1,
325,
008
1,25
5,66
4
1,
000,
424
1,06
3,32
3
1,
867,
693
1,56
8,64
5
2,
224,
684
1,57
5,18
6
3,
204,
310
Unr
estr
icte
d(2
,675
,115
)
(3
,555
,109
)
2,
163,
549
1,51
1,49
6
2,
939,
453
4,69
6,62
1
5,
310,
937
5,71
8,96
4
6,
126,
300
8,89
6,93
4
Tota
l Gov
ernm
enta
l Act
iviti
es N
et P
ositi
on39
,333
,825
$
39
,466
,732
$
43
,899
,814
$
45
,790
,190
$
49
,491
,257
$
51
,851
,262
$
54
,389
,749
$
56
,225
,871
$
56
,785
,369
$
59
,778
,875
$
Bus
ines
s-T
ype
Act
iviti
esN
et I
nves
tmen
t in
Cap
ital A
sset
s29
,634
,955
$
29
,142
,964
$
27
,962
,252
$
30
,199
,966
$
29
,330
,978
$
29
,408
,827
$
28
,325
,668
$
25
,052
,445
$
24
,260
,590
$
23
,558
,802
$
R
estr
icte
d 1,
302,
217
1,90
0,30
1
1,
694,
339
1,86
0,45
8
2,
250,
279
1,87
9,88
8
89
2,78
4
2,
078,
126
3,61
4,79
4
4,
787,
027
Unr
estr
icte
d4,
060,
782
2,70
3,23
4
7,
006,
277
5,23
9,34
8
5,
314,
263
5,58
6,07
0
6,
303,
962
6,40
8,07
7
6,
398,
470
5,32
2,50
5
Tota
l Bus
ines
s-Ty
pe A
ctiv
ities
Net
Pos
ition
34,9
97,9
54$
33,7
46,4
99$
36,6
62,8
68$
37,2
99,7
72$
36,8
95,5
20$
36,8
74,7
85$
35,5
22,4
14$
33,5
38,6
48$
34,2
73,8
54$
33,6
68,3
34$
Tot
al Net
Inv
estm
ent
in C
apita
l Ass
ets
70,8
60,4
97$
70,8
39,7
97$
68,4
42,8
53$
73,4
78,2
36$
74,8
19,4
59$
74,6
95,7
75$
75,8
35,8
35$
73,3
34,6
68$
73,3
44,4
73$
71,2
36,4
33$
Res
tric
ted
2,08
5,61
5
3,
225,
309
2,95
0,00
3
2,
860,
882
3,31
3,60
2
3,
747,
581
2,46
1,42
9
4,
302,
810
5,18
9,98
0
7,
991,
337
Unr
estr
icte
d1,
385,
667
(851
,875
)
9,16
9,82
6
6,
750,
844
8,25
3,71
6
10
,282
,691
11,6
14,8
99
12
,127
,041
12,5
24,7
70
14
,219
,439
Tota
l Net
Pos
ition
74,3
31,7
79$
73,2
13,2
31$
80,5
62,6
82$
83,0
89,9
62$
86,3
86,7
77$
88,7
26,0
47$
89,9
12,1
63$
89,7
64,5
19$
91,0
59,2
23$
93,4
47,2
09$
CIT
Y O
F E
DG
EW
AT
ER
, F
LO
RID
AN
et P
ositi
on b
y C
ompo
nent
Last
Ten
Fis
cal Y
ears
(a
ccru
al b
asis
of a
ccou
ntin
g)
Fis
cal Y
ear
86

2016
2015
2014
2013
2012
2011
2010
2009
2008
2007
Pro
gra
m R
even
ues
Gov
ernm
enta
l Act
iviti
es:
Cha
rges
for
Ser
vice
s:G
ener
al A
dmin
istr
ativ
e19
3,14
0$
20
8,76
9$
17
8,89
0$
16
5,47
9$
14
1,72
4$
18
5,51
1$
32
6,86
3$
28
8,18
0$
24
8,11
3$
26
8,54
6$
Pub
lic S
afet
y77
3,06
7
59
1,64
2
50
7,27
9
43
9,68
0
27
7,80
6
50
2,89
3
47
8,00
1
42
9,23
2
45
7,79
1
46
1,11
6
Pub
lic W
orks
382,
989
306,
981
248,
531
169,
864
147,
040
156,
857
173,
895
200,
101
317,
602
408,
345
C
ultu
re a
nd r
ecre
atio
n51
,991
-
14
,896
13
,162
12
,520
-
6,
245
12,7
85
11,8
14
25,9
82
Ope
ratin
g G
rant
s an
d C
ontr
ibut
ions
832,
376
643,
363
442,
201
586,
345
591,
002
594,
849
634,
000
593,
635
384,
417
485,
854
C
apita
l Gra
nts
and
Con
trib
utio
ns70
2,64
4
1,
689,
173
33
3,28
4
51
5,77
5
1,
466,
668
1,
187,
088
26
6,77
9
42
4,99
7
12
7,03
0
26
0,88
4
Tota
l Gov
ernm
enta
l Act
iviti
es P
rogr
am R
even
ues
2,93
6,20
7$
3,43
9,92
8$
1,72
5,08
1$
1,89
0,30
5$
2,63
6,76
0$
2,62
7,19
8$
1,88
5,78
3$
1,94
8,93
0$
1,54
6,76
7$
1,91
0,72
7$
Bus
ines
s-T
ype
Act
iviti
es:
Cha
rges
for
Ser
vice
s:W
ater
/ S
ewer
Util
ity9,
284,
327
$
8,
651,
318
$
8,
383,
806
$
8,
238,
099
$
7,
634,
056
$
7,
474,
168
$
7,
085,
984
$
6,
907,
413
$
6,
914,
844
$
6,
743,
708
$
Ref
use
colle
ctio
n2,
962,
543
2,
732,
961
2,
693,
938
2,
673,
005
2,
638,
024
2,
661,
778
2,
670,
316
2,
704,
541
2,
538,
797
2,
393,
425
Sto
rmw
ater
Util
ity1,
466,
495
1,
313,
221
1,
300,
575
1,
287,
833
1,
271,
620
1,
291,
687
1,
288,
132
1,
164,
331
95
7,34
8
1,
042,
592
Ope
ratin
g G
rant
s an
d C
ontr
ibut
ions
-
-
-
-
-
-
-
-
55,8
23
130,
400
C
apita
l Gra
nts
and
Con
trib
utio
ns33
4,84
3
28
1,52
7
11
1,29
5
83
,417
86
,937
1,
300,
823
2,
222,
112
22
1,10
8
57
0,20
8
30
0,10
7
Tota
l Bus
ines
s-Ty
pe A
ctiv
ities
Pro
gram
Rev
enue
s14
,048
,208
$
12
,979
,027
$
12
,489
,614
$
12
,282
,354
$
11
,630
,637
$
12
,728
,456
$
13
,266
,544
$
10
,997
,393
$
11
,037
,020
$
10
,610
,232
$
Tota
l G
over
nmen
t Pro
gram
Rev
enue
s16
,984
,415
$
16
,418
,955
$
14
,214
,695
$
14
,172
,659
$
14
,267
,397
$
15
,355
,654
$
15
,152
,327
$
12
,946
,323
$
12
,583
,787
$
12
,520
,959
$
Exp
ense
sG
over
nmen
tal A
ctiv
ities
:G
ener
al a
dmin
istr
ativ
e3,
112,
845
$
2,
345,
704
$
2,
060,
966
$
2,
098,
288
$
1,
869,
872
$
2,
030,
426
$
2,
120,
727
$
2,
437,
060
$
3,
368,
997
$
3,
268,
496
$
Cul
ture
and
rec
reat
ion
1,53
4,76
5
1,55
2,48
9
1,46
4,16
4
1,49
0,50
5
1,38
8,24
1
1,41
5,19
7
1,39
2,04
7
1,40
0,66
9
1,41
7,08
0
1,49
5,20
9
P
ublic
Wor
ks1,
914,
982
2,
022,
008
3,
514,
532
3,
719,
716
3,
542,
650
3,
847,
458
3,
315,
340
3,
207,
832
3,
182,
898
3,
418,
018
Pub
lic S
afet
y7,
164,
944
6,
636,
406
6,
767,
861
7,
094,
211
6,
587,
921
7,
141,
391
6,
676,
065
6,
455,
618
5,
893,
950
6,
522,
598
Com
mun
ity R
edev
elop
men
t4,
955
-
-
-
-
-
-
-
-
-
Inte
rest
on
long
-ter
m d
ebt
56,7
94
49,8
91
60,2
82
45,0
94
36,3
97
61,5
54
77,8
45
211,
630
315,
637
196,
466
To
tal G
over
nmen
tal A
ctiv
ities
Exp
ense
s13
,789
,285
$
12
,606
,498
$
13
,867
,805
$
14
,447
,814
$
13
,425
,081
$
14
,496
,026
$
13
,582
,024
$
13
,712
,809
$
14
,178
,562
$
14
,900
,787
$
Bus
ines
s-T
ype
Act
iviti
es:
Wat
er /
Sew
er U
tility
8,69
7,28
3$
8,81
6,55
4$
8,45
9,43
2$
8,08
6,38
8$
8,02
0,59
7$
7,93
1,99
6$
8,24
6,44
8$
8,68
4,97
2$
8,46
3,43
9$
8,47
9,76
6$
R
efus
e co
llect
ion
2,42
7,29
9
2,58
8,58
1
2,69
7,84
3
2,55
8,75
3
2,60
4,68
3
2,62
8,22
7
2,49
7,36
2
2,40
5,87
0
2,44
7,63
1
2,22
6,06
8
S
torm
wat
er U
tility
1,33
6,82
1
1,23
9,07
2
1,26
6,67
5
1,15
7,25
6
1,02
5,94
3
1,02
7,60
5
808,
413
926,
393
1,01
6,94
8
1,00
3,14
3
To
tal B
usin
ess-
Type
Act
iviti
es E
xpen
ses
12,4
61,4
03$
12,6
44,2
07$
12,4
23,9
50$
11,8
02,3
97$
11,6
51,2
23$
11,5
87,8
28$
11,5
52,2
23$
12,0
17,2
35$
11,9
28,0
18$
11,7
08,9
77$
Tota
l G
over
nmen
t Exp
ense
s26
,250
,688
$
25
,250
,705
$
26
,291
,755
$
26
,250
,211
$
25
,076
,304
$
26
,083
,854
$
25
,134
,247
$
25
,730
,044
$
26
,106
,580
$
26
,609
,764
$
CIT
Y O
F E
DG
EW
AT
ER
, FL
OR
IDA
Cha
nges
in N
et P
ositi
onLa
st T
en F
isca
l Yea
rs(a
ccru
al b
asis
of a
ccou
ntin
g)
Fis
cal Y
ear
87

2016
2015
2014
2013
2012
2011
2010
2009
2008
2007
Net
(E
xpen
se)/
Rev
enu
eG
over
nmen
tal A
ctiv
ities
(10,
853,
078)
$
(9,1
66,5
70)
$
(1
2,14
2,72
4)$
(1
2,55
7,50
9)$
(1
0,78
8,32
1)$
(1
1,86
8,82
8)$
(1
1,69
6,24
1)$
(1
1,76
3,87
9)$
(1
2,63
1,79
5)$
(1
2,99
0,06
0)$
Bus
ines
s-T
ype
Act
iviti
es1,
586,
805
33
4,82
0
65
,664
47
9,95
7
(2
0,58
6)
1,14
0,62
8
1,71
4,32
1
(1,0
19,8
42)
(8
90,9
98)
(1,0
98,7
45)
Tota
l G
over
nmen
t Net
Exp
ense
(9,2
66,2
73)
$
(8
,831
,750
)$
(12,
077,
060)
$
(12,
077,
552)
$
(10,
808,
907)
$
(10,
728,
200)
$
(9,9
81,9
20)
$
(1
2,78
3,72
1)$
(1
3,52
2,79
3)$
(1
4,08
8,80
5)$
Gen
eral
Rev
enu
es a
nd
Oth
er C
han
ges
in N
et P
osi
tio
nG
over
nmen
tal A
ctiv
ities
:P
rope
rty
taxe
s4,
572,
959
$
4,
282,
331
$
4,
120,
260
$
3,
763,
456
$
3,
669,
228
$
4,
459,
591
$
5,
083,
616
$
5,
638,
194
$
6,
053,
965
$
5,
983,
622
$
Util
ity a
nd fr
anch
ise
taxe
s3,
222,
232
3,
249,
749
3,
182,
716
3,
051,
649
2,
947,
266
3,
047,
731
3,
051,
595
3,
164,
803
2,
822,
644
3,
134,
569
Inte
rgov
ernm
enta
l sha
red
reve
nue
2,02
8,37
3
1,96
7,34
8
2,03
0,52
2
1,81
4,68
9
1,68
0,89
6
1,61
8,53
0
1,57
4,09
1
1,67
3,52
2
1,84
2,21
5
1,95
6,46
3
In
vest
men
t ear
ning
s38
,006
48
,705
52
,399
25
,339
36
,148
32
,274
79
,230
6,
019
173,
233
173,
234
G
ain
on s
ale
of a
sset
s-
-
14
,500
11
,855
11
,029
8,
008
7,30
8
9,
533
9,22
8
4,
767,
674
Mis
cella
neou
s re
venu
e10
6,09
9
14
0,09
3
13
4,30
4
38
,888
43
,699
42
,117
64
,279
55
,163
53
,686
11
6,25
5
Tra
nsfe
rs75
2,50
2
72
7,49
1
71
7,64
7
15
0,56
6
40
,050
12
2,09
0
-
(215
,517
)
(1
,316
,682
)
-
Tota
l Gov
ernm
enta
l Act
iviti
es10
,720
,171
$
10
,415
,717
$
10
,252
,348
$
8,
856,
442
$
8,
428,
316
$
9,
330,
341
$
9,
860,
119
$
10
,331
,717
$
9,
638,
289
$
16
,131
,817
$
Bus
ines
s-T
ype
Act
iviti
es:
Inve
stm
ent e
arni
ngs
5,70
4$
6,
796
$
6,51
7$
3,
879
$
37,5
10$
92,2
43$
161,
505
$
(3,4
50)
$
10
8,93
5$
50
1,09
8$
Mis
cella
neou
s re
venu
e41
1,44
8
13
2,42
3
99
,023
70
,982
43
,861
24
1,59
0
10
7,94
0
89
,522
70
,901
60
3
Tra
nsfe
rs(7
52,5
02)
(727
,491
)
(7
17,6
47)
(150
,566
)
(4
0,05
0)
(122
,090
)
-
215,
517
1,31
6,68
2
-
Tota
l Bus
ines
s-Ty
pe A
ctiv
ities
(335
,350
)$
(5
88,2
72)
$
(612
,107
)$
(7
5,70
5)$
41,3
21$
211,
743
$
269,
445
$
301,
589
$
1,49
6,51
8$
501,
701
$
Tota
l G
over
nmen
t10
,384
,821
$
9,
827,
445
$
9,
640,
241
$
8,
780,
737
$
8,
469,
637
$
9,
542,
084
$
10
,129
,564
$
10
,633
,306
$
11
,134
,807
$
16
,633
,518
$
Ch
ang
e in
Net
Po
siti
on
Gov
ernm
enta
l Act
iviti
es(1
32,9
07)
$
1,24
9,14
7$
(1,8
90,3
76)
$
(3
,701
,067
)$
(2,3
60,0
05)
$
(2
,538
,487
)$
(1,8
36,1
22)
$
(1
,432
,162
)$
(2,9
93,5
06)
$
3,
141,
757
$
Bus
ines
s-T
ype
Act
iviti
es1,
251,
455
(2
53,4
52)
(546
,443
)
40
4,25
2
20
,735
1,
352,
371
1,
983,
766
(7
18,2
53)
605,
520
(597
,044
)
Tota
l G
over
nmen
t Cha
nge
in N
et P
ositi
on1,
118,
548
$
99
5,69
5$
(2
,436
,819
)$
(3,2
96,8
15)
$
(2
,339
,270
)$
(1,1
86,1
16)
$
14
7,64
4$
(2
,150
,415
)$
(2,3
87,9
86)
$
2,
544,
713
$
(acc
rual
bas
is o
f acc
ount
ing)
Cit
y o
f E
dg
ewat
er, F
lori
da
Cha
nges
in N
et P
ositi
on (
cont
inue
d)La
st T
en F
isca
l Yea
rs
Fis
cal Y
ear
88

2016
2015
2014
2013
2012
2011
2010
2009
2008
2007
Gen
eral
Fun
dR
eser
ved
-$
-$
-$
-$
-$
-$
245,
131
$
23
4,08
4$
135,
287
$
1,
387,
418
$
Unr
eser
ved
-
-
-
-
-
-
5,97
4,50
0
5,
826,
394
3,22
3,16
9
1,
990,
994
Non
spen
dabl
e30
,041
1,19
8
42
2,12
0
22,1
70
43
6
138,
459
-
-
-
-
R
estr
icte
d45
,538
456,
809
2,
990
4,02
8
3,
408
448
-
-
-
-
Ass
igne
d1,
083,
984
780,
323
75
0,74
9
500,
000
1,
872,
129
1,56
5,63
9
-
-
-
-
U
nass
igne
d2,
376,
555
2,80
8,97
5
2,
770,
632
2,74
4,60
8
2,
452,
923
3,70
2,41
7
-
-
-
-
To
tal G
ener
al F
und
3,53
6,11
8$
4,
047,
305
$
3,94
6,49
1$
3,
270,
806
$
4,32
8,89
6$
5,
406,
963
$
6,21
9,63
1$
6,
060,
478
$
3,35
8,45
6$
3,
378,
412
$
All
Oth
er G
over
nmen
tal F
unds
Res
erve
d-
$
-
$
-
$
-
$
-
$
-
$
-
$
83
6,59
6$
352,
214
$
35
1,46
2$
Unr
eser
ved,
Rep
orte
d in
:D
ebt s
ervi
ce fu
nds
-
-
-
-
-
-
(176
,200
)
-
-
-
Spe
cial
rev
enue
fund
s-
-
-
-
-
-
90
8,33
9
879,
195
93
6,77
2
1,67
1,24
1
C
apita
l pro
ject
s fu
nds
-
-
-
-
-
-
422,
132
33
5,09
3
1,20
9,19
3
2,
852,
848
Res
tric
ted
746,
891
66
6,09
6
898,
969
64
9,23
1
712,
080
1,
221,
758
-
-
-
-
Com
mitt
ed-
-
-
-
-
54
2,51
0
-
-
-
-
Una
ssig
ned
-
-
-
-
-
(2,1
19)
-
-
-
-
Tot
al A
ll O
ther
Gov
ernm
enta
l Fun
ds74
6,89
1$
666,
096
$
89
8,96
9$
649,
231
$
71
2,08
0$
1,76
2,14
9$
1,
154,
271
$
2,05
0,88
4$
2,
498,
179
$
4,87
5,55
1$
Tota
l Gov
ernm
enta
l Fun
ds4,
283,
009
$
4,71
3,40
1$
4,
845,
460
$
3,92
0,03
7$
5,
040,
976
$
7,16
9,11
2$
7,
373,
902
$
8,11
1,36
2$
5,
856,
635
$
8,25
3,96
3$
Not
e: I
n 20
11 G
AS
B 5
4 w
as im
plem
ente
d ch
angi
ng th
e cl
assi
ficat
ion
of G
over
nmen
tal F
und
Bal
ance
s. P
rior
year
s w
ere
not r
esta
ted.
(mod
ified
acc
rual
bas
is o
f acc
ount
ing)
CIT
Y O
F E
DG
EW
AT
ER
, FL
OR
IDA
Fun
d B
alan
ces
of G
over
nmen
tal F
unds
Last
Ten
Fis
cal Y
ears
Fis
cal Y
ear
89
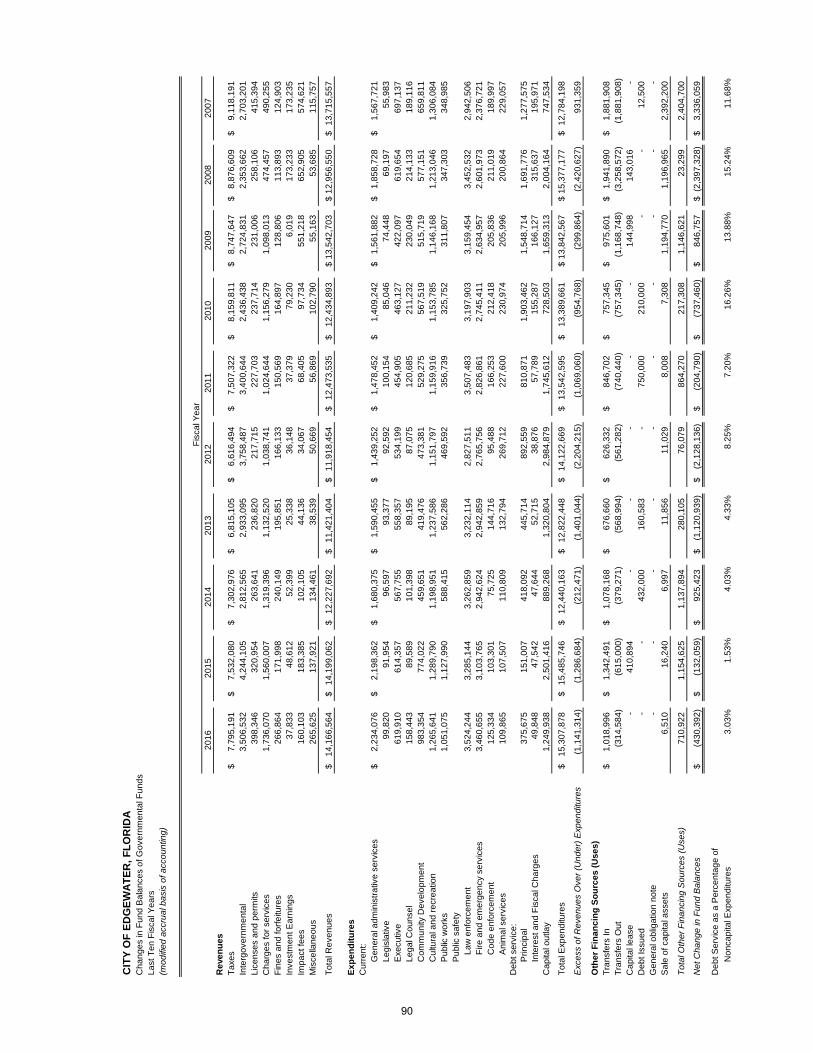
20
16
20
15
20
14
20
13
20
12
20
11
20
10
20
09
20
08
20
07
Re
ven
ue
sT
axe
s7
,79
5,1
91
$
7
,53
2,0
80
$
7
,30
2,9
76
$
6
,81
5,1
05
$
6
,61
6,4
94
$
7
,50
7,3
22
$
8
,15
9,8
11
$
8
,74
7,6
47
$
8
,87
6,6
09
$
9
,11
8,1
91
$
In
terg
ove
rnm
en
tal
3,5
06
,53
2
4,2
44
,10
5
2,8
12
,56
5
2,9
33
,09
5
3,7
58
,48
7
3,4
00
,64
4
2,4
36
,43
8
2,7
24
,83
1
2
,35
3,6
62
2,7
03
,20
1
Lic
en
ses
an
d p
erm
its3
98
,34
6
3
20
,95
4
2
63
,64
1
2
36
,82
0
2
17
,71
5
2
27
,70
3
2
37
,71
4
2
31
,00
6
25
8,1
06
4
15
,39
4
C
ha
rge
s fo
r se
rvic
es
1,7
36
,07
0
1,5
60
,00
7
1,3
19
,39
6
1,1
32
,52
0
1,0
38
,74
1
1,0
24
,64
4
1,1
56
,27
9
1,0
98
,01
3
4
74
,45
7
49
0,2
55
Fin
es
an
d fo
rfe
iture
s2
66
,86
4
1
71
,99
8
2
40
,14
9
1
95
,85
1
1
66
,13
3
1
50
,56
9
1
64
,89
7
1
28
,80
6
11
3,8
93
1
24
,90
3
In
vest
me
nt E
arn
ing
s3
7,8
33
4
8,6
12
5
2,3
99
2
5,3
38
3
6,1
48
3
7,3
79
7
9,2
30
6
,01
9
17
3,2
33
1
73
,23
5
Im
pa
ct fe
es
16
0,1
03
18
3,3
85
10
2,1
05
44
,13
6
34
,06
7
68
,40
5
97
,73
4
55
1,2
18
6
52
,90
5
57
4,6
21
Mis
cella
ne
ou
s2
65
,62
5
1
37
,92
1
1
34
,46
1
3
8,5
39
5
0,6
69
5
6,8
69
1
02
,79
0
5
5,1
63
53
,68
5
1
15
,75
7
To
tal R
eve
nu
es
14
,16
6,5
64
$
1
4,1
99
,06
2$
1
2,2
27
,69
2$
1
1,4
21
,40
4$
1
1,9
18
,45
4$
1
2,4
73
,53
5$
1
2,4
34
,89
3$
13
,54
2,7
03
$
12
,95
6,5
50
$
13
,71
5,5
57
$
Ex
pe
nd
itu
res
Cu
rre
nt:
Ge
ne
r al a
dm
inis
tra
tive
se
rvic
es
2,2
34
,07
6$
2,1
98
,36
2$
1,6
80
,37
5$
1,5
90
,45
5$
1,4
39
,25
2$
1,4
78
,45
2$
1, 4
09
,24
2$
1,5
61
,88
2$
1,8
58
,72
8$
1,5
67
,72
1$
Le
gis
lativ
e9
9,8
20
9
1,9
54
9
6,5
97
9
3,3
77
9
2,5
92
1
00
,15
4
8
5,0
46
7
4,4
48
69
,19
7
5
5,9
83
Exe
cutiv
e6
19
,91
0
6
14
,35
7
5
67
,75
5
5
58
,35
7
5
34
,19
9
4
54
,90
5
4
63
,12
7
4
22
,09
7
61
9,6
54
6
97
,13
7
L
eg
al C
ou
nse
l1
58
,44
3
8
9,5
89
1
01
,39
8
8
9,1
95
8
7,0
75
1
20
,68
5
2
11
,23
2
2
30
,04
9
21
4,1
33
1
89
,11
6
C
om
mu
nity
De
velo
pm
en
t9
83
,35
4
7
74
,02
2
4
59
,65
1
4
19
,47
6
4
73
,38
1
5
29
,27
5
5
67
,51
9
5
15
,71
9
57
7,1
51
6
59
,81
1
C
ultu
ral a
nd
re
cre
atio
n1
,26
5,6
41
1
,28
9,7
90
1
,19
8,9
51
1
,23
7,5
86
1
,15
1,7
97
1
,15
9,9
16
1
,15
3,7
85
1
,14
6,1
68
1,2
13
,04
6
1
,30
6,0
84
P
ub
lic w
ork
s 1
,05
1,0
75
1
,12
7,9
90
5
88
,41
5
5
62
,28
6
4
69
,59
2
3
56
,73
9
3
25
,75
2
3
11
,80
7
34
7,3
03
3
48
,98
5
P
ub
lic s
afe
ty
La
w e
nfo
rce
me
nt
3,5
24
,24
4
3,2
85
,14
4
3,2
62
,85
9
3,2
32
,11
4
2,8
27
,51
1
3,5
07
,48
3
3,1
97
,90
3
3,1
59
,45
4
3
,45
2,5
32
2,9
42
,50
6
F
ire a
nd
em
erg
en
cy s
erv
ice
s3
,46
0,6
55
3
,10
3,7
65
2
,94
2,6
24
2
,94
2,8
59
2
,76
5,7
56
2
,82
6,8
61
2
,74
5,4
11
2
,63
4,9
57
2,6
01
,97
3
2
,37
6,7
21
Co
de
en
forc
em
en
t1
25
,33
4
1
03
,30
1
7
5,7
25
1
44
,71
6
9
5,4
88
1
66
,25
3
2
12
,41
8
2
05
,83
6
21
1,0
19
1
89
,99
7
An
ima
l se
rvic
es
10
9,8
65
10
7,5
07
11
0,8
09
13
2,7
94
26
9,7
12
22
7,6
00
23
0,9
74
20
5,9
96
2
00
,86
4
22
9,0
57
De
bt s
erv
ice
:P
rinci
pa
l 3
75
,67
5
1
51
,00
7
41
8,0
92
4
45
,71
4
89
2,5
59
8
10
,87
1
1
,90
3,4
62
1,5
48
,71
4
1
,69
1,7
76
1,2
77
,57
5
In
tere
st a
nd
Fis
cal C
ha
r ge
s4
9,8
48
4
7,5
42
47
,64
4
5
2,7
15
38
,87
6
5
7,7
89
15
5,2
87
1
66
,12
7
31
5,6
37
1
95
,97
1
Ca
pita
l ou
tlay
1,2
49
,93
8
2,5
01
,41
6
88
9,2
68
1,3
20
,80
4
2,9
84
,87
9
1,7
45
,61
2
72
8,5
03
1,6
59
,31
3
2
,00
4,1
64
74
7,5
34
To
tal E
xpe
nd
iture
s1
5,3
07
,87
8$
15
,48
5,7
46
$
12
,44
0,1
63
$
12
,82
2,4
48
$
14
,12
2,6
69
$
13
,54
2,5
95
$
13
,38
9,6
61
$
1
3,8
42
,56
7$
1
5,3
77
,17
7$
1
2,7
84
,19
8$
Exc
ess
of R
even
ues
Ove
r (U
nder
) Exp
endi
ture
s(1
,14
1,3
14
)
(1,2
86
,68
4)
(21
2,4
71
)
(1,4
01
,04
4)
(2,2
04
,21
5)
(1,0
69
,06
0)
(95
4,7
68
)
(2
99
,86
4)
(2
,42
0,6
27
)
9
31
,35
9
Oth
er
Fin
an
cin
g S
ou
rce
s (
Us
es
)T
ran
sfe
rs In
1,0
18
,99
6$
1,3
42
,49
1$
1,0
78
,16
8$
67
6,6
60
$
62
6,3
32
$
84
6,7
02
$
75
7,3
45
$
97
5,6
01
$
1,9
41
,89
0$
1,8
81
,90
8$
Tra
nsf
ers
Ou
t(3
14
,58
4)
(61
5,0
00
)
(37
9,2
71
)
(56
8,9
94
)
(56
1,2
82
)
(74
0,4
40
)
(75
7,3
45
)
(1
,16
8,7
48
)
(3
,25
8,5
72
)
(1
,88
1,9
08
)
C
ap
ital l
ea
se-
41
0,8
94
-
-
-
-
-
1
44
,99
8
14
3,0
16
-
De
bt I
ssu
ed
-
-
43
2,0
00
16
0,5
83
-
7
50
,00
0
2
10
,00
0
-
-
1
2,5
00
Ge
ne
ral o
blig
atio
n n
ote
-
-
-
-
-
-
-
-
-
-
Sa
l e o
f ca
pita
l ass
ets
6,5
10
1
6,2
40
6
,99
7
11
,85
6
11
,02
9
8,0
08
7
,30
8
1,1
94
,77
0
1
,19
6,9
65
2,3
92
,20
0
Tota
l Oth
er F
inan
cing
Sou
rces
(Use
s)7
10
,92
2
1
,15
4,6
25
1
,13
7,8
94
2
80
,10
5
7
6,0
79
8
64
,27
0
2
17
,30
8
1
,14
6,6
21
23
,29
9
2
,40
4,7
00
Net
Cha
nge
in F
und
Bal
ance
s(4
30
,39
2)
$
(13
2,0
59
)$
9
25
,42
3$
(1
,12
0,9
39
)$
(2,1
28
,13
6)
$
(2
04
,79
0)
$
(73
7,4
60
)$
8
46
,75
7$
(2
,39
7,3
28
)$
3
,33
6,0
59
$
De
bt S
erv
ice
as
a P
erc
en
tag
e o
f
No
nca
pita
l Exp
en
ditu
res
3.0
3%
1.5
3%
4.0
3%
4.3
3%
8.2
5%
7.2
0%
16
.26
%1
3.8
8%
15
.24
%1
1.6
8%
CIT
Y O
F E
DG
EW
AT
ER
, FL
OR
IDA
Ch
an
ge
s in
Fu
nd
Ba
lan
ces
of G
ove
rnm
en
tal F
un
ds
La
st T
en
Fis
cal Y
ea
rs(m
odifi
ed a
ccru
al b
asis
of a
ccou
ntin
g)
Fis
cal Y
ea
r
90

Fiscal Year Ended September 30 Property Taxes
Utility and franchise taxes
Intergovernmental Revenue Total
2007 5,983,622$ 3,134,569$ 2,703,201$ 11,821,392$
2008 6,053,935 2,822,644 2,353,662 11,230,241
2009 5,638,194 3,109,453 2,724,831 11,472,478
2010 5,083,616 3,076,195 2,436,438 10,596,249
2011 4,459,591 3,047,731 3,400,644 10,907,966
2012 3,669,228 2,947,266 3,758,487 10,374,981
2013 3,763,456 3,051,649 2,933,095 9,748,200
2014 4,120,260 3,182,716 2,812,565 10,115,541
2015 4,282,331 3,249,749 4,244,105 11,776,185
2016 4,572,959 3,222,232 3,506,532 11,301,723
CITY OF EDGEWATER, FLORIDATax Revenues by Source of Governmental FundsLast Ten Fiscal Years(modified accrual basis of accounting)
91

Fis
cal
Yea
rC
entr
ally
E
xem
ptio
nsT
otal
Tax
able
Tot
alE
nded
Rea
lP
erso
nal
Ass
esse
dE
stim
ated
Rea
lA
sses
sed
Dire
ct
Sep
t. 30
,P
rope
rty
Pro
pert
yP
rope
rty
Act
ual V
alue
Pro
pert
yV
alue
Tax
Rat
e
2007
1,71
5,79
7,87
2
42
,021
,446
2,
506,
641
1,
760,
325,
959
670,
906,
020
1,08
9,41
9,93
9
5.
7317
2008
1,81
6,48
4,28
4
44
,912
,803
1,
824,
075
1,
863,
221,
162
667,
246,
620
1,19
5,97
4,54
2
5.
2271
2009
1,56
7,72
8,01
8
46
,686
,002
3,
852,
385
1,
618,
266,
405
636,
648,
753
981,
617,
652
5.
9330
2010
1,23
9,41
3,07
1
47
,937
,851
2,
789,
838
1,
290,
140,
760
467,
797,
506
822,
343,
254
6.
3982
2011
1,01
4,90
2,14
7
46
,368
,404
2,
452,
717
1,
063,
723,
268
374,
884,
311
688,
838,
957
6.
6385
2012
859,
937,
271
44
,818
,406
2,
847,
810
90
7,60
3,48
7
327,
571,
414
580,
032,
073
6.
5304
2013
869,
698,
616
44
,709
,946
2,
419,
118
91
6,82
7,68
0
326,
361,
580
590,
466,
100
6.
5612
2014
893,
847,
254
46
,863
,494
2,
615,
633
94
3,32
6,38
1
330,
091,
016
613,
235,
365
6.
9340
2015
934,
739,
055
49
,197
,000
3,
085,
203
98
7,02
1,25
8
334,
889,
928
652,
131,
330
6.
7530
2016
985,
904,
666
53
,797
,067
3,
590,
304
1,
043,
292,
037
343,
753,
169
699,
538,
868
6.
7486
Sou
rce:
Vol
usia
Cou
nty
Pro
pert
y A
ppra
iser
's O
ffice
& C
ity o
f Edg
ewat
er C
AF
Rs
CIT
Y O
F E
DG
EW
AT
ER
, FL
OR
IDA
Ass
esse
d V
alue
and
Act
ual V
alue
of T
axab
le P
rope
rty
Last
Ten
Fis
cal Y
ears
92

City of Debt Total Volusia
Fiscal Edgewater Service Direct County(1) School District GrandYear Operating Millage Millage Rate Millage Millage Other(2) Total
2007 5.7000 0.0317 5.7317 5.3235 7.6850 2.7886 21.5288
2008 5.2000 0.0271 5.2271 4.8819 7.4670 2.6866 20.2626
2009 5.9000 0.0330 5.9330 5.4037 7.4590 3.5865 22.3823
2010 6.3600 0.0382 6.3982 6.4233 8.2370 3.7932 24.8517
2011 6.5910 0.0475 6.6385 6.3025 8.2370 4.0012 25.1792
2012 6.4700 0.0604 6.5304 6.7791 8.0630 3.9682 25.3407
2013 6.5000 0.0612 6.5612 6.8809 7.8880 3.6967 25.0268
2014 6.8760 0.0580 6.9340 7.2709 7.3580 3.6028 25.1657
2015 6.7000 0.0530 6.7530 7.2709 7.3360 3.4160 24.7759
2016 6.7000 0.0486 6.7486 7.2709 7.1970 3.2492 24.4657
(1) Millage includes General Fund and Voter Approved Debt service
(2) Inlet and Port Authority, Florida Inland Navigation District and St. Johns River Water Management District, Mosquito Control, and Hospital Operating
CITY OF EDGEWATER, FLORIDAProperty Tax RatesDirect and Overlapping GovernmentsLast Ten Fiscal Years
93

Real Percentage Real PercentageProperty of Total Property of Total
Assessed Assessed Assessed AssessedTaxpayer Valuation Rank Valuation Valuation Rank Valuation
Florida Power & Light Company 17,697,347$ 1 2.53% 12,106,829$ 1 1.11%RJ Doughtery Associates Inc. 6,813,496$ 2 0.97%3050 Holdings, LLC 4,102,096$ 3 0.59% 6,000,000$ 5 0.55%Florida East Coast Railway Company 3,738,747$ 4 0.53%Revenue Properties Florida 3,727,444$ 5 0.53%Bright House Networks 3,321,255$ 6 0.47% 5,700,000$ 6 0.52%Carder, James C TR 3,189,737$ 7 0.46% 5,022,810$ 9 0.46%Edgewater Power Boats, LLC 3,072,392$ 8 0.44%Holly Investments, LTD 2,878,392$ 9 0.41%Transcaptial Bank 2,736,218$ 10 0.39%Worthington Creek Invest, LLC - - 12,048,790$ 2 1.11%Edgewater Harbor, LLC - - 10,764,720$ 3 0.99%Adams Homes of NW FL Inc. - - 8,094,300$ 4 0.74%Spishores, LLC - - 5,400,000$ 7 0.50%308 Realty, LLC - - 5,159,870$ 8 0.47%GDP Development - - 4,632,040$ 10 0.43%
51,277,124$ 7.32% 74,929,359$ 6.88%
Total Assessed Valuation 699,538,868$ 1,089,419,000$
Source: Volusia County Property Appraiser's Office & 2007 City of Edgewater CAFR
CITY OF EDGEWATER, FLORIDAPrincipal TaxpayersCurrent year and ten years ago
2016 2007
94

Total Current Delinquent TotalFiscal Tax Tax Tax TaxYear Levy Collections Collections Collections
2007 6,209,694$ 5,933,287$ 95.55 % 218,300$ 6,151,587$ 99.06 %
2008 6,219,068 5,835,665 93.84 % - 5,835,665 93.84 %
2009 5,822,971 5,611,299 96.36 % 26,895 5,638,194 96.83 %
2010 5,230,103 5,035,560 96.28 % 17,704 5,053,264 96.62 %
2011 4,515,489 4,343,936 96.20 % 83,812 4,427,748 98.06 %
2012 3,752,808 3,625,224 96.60 % 10,100 3,635,324 96.87 %
2013 3,836,165 3,558,179 92.75 % 170,189 3,728,368 97.19 %
2014 4,216,606 4,072,002 96.57 % 13,726 4,085,728 96.90 %
2015 4,365,036 4,219,641 96.67 % 29,065 4,248,706 97.33 %
2016 4,686,910 4,387,633 93.61 % 143,061 4,530,694 96.67 %
Source: Volusia County Property Appraiser and Tax Collector
CITY OF EDGEWATER, FLORIDAProperty Tax Levies And CollectionsLast Ten Fiscal Years
Percent of
CollectionsTo Tax Levy
Percent ofTotal Tax
CollectionsTo Tax Levy
Current Tax
95

Special General Fiscal Notes Assessment Obligation Capital Line NotesYear Payable Notes Note Leases of Credit Payable
2007 4,052,282$ 2,874,549$ 455,000$ 224,579$ 12,500$ 4,472,504$
2008 3,292,112 2,106,625 440,000 181,415 50,000 3,541,000
2009 2,701,092 1,297,442 425,000 225,466 - 2,592,437
2010 2,110,073 - 410,000 388,424 - 1,542,000
2011 2,269,055 - 395,000 183,569 - 1,028,000
2012 1,424,037 - 375,000 156,029 - -
2013 1,027,019 - 355,000 287,916 - 4,142,717
2014 1,225,000 - 335,000 226,843 - 4,455,000
2015 1,147,674 - 315,000 574,947 - 4,454,327
2016 1,063,288 - 295,000 294,150 - 13,692,712
Note-1: Details regarding the City's outstanding debt can be found in the notes to the financial statements.
Note-2: Net of deferred amount refunding for FY2013 and prior years.
(1) See Demographic and Economic Statistics for personal income and population data.
CITY OF EDGEWATER, FLORIDARatios of Outstanding Debt by TypeLast Ten Fiscal Years
Governmental Activities
96

State Percentage Capital Revolving Revenue Line of Personal PerLeases Loan Bonds of Credit Total Income (1) Capita (1)
6,391,335$ 10,604,143$ 10,215,000$ 37,500$ 39,339,392$ 6.00% 1,825
5,971,878 9,182,304 10,146,086 - 34,911,420 5.04% 1,604
5,548,388 8,137,963 9,679,987 - 30,607,775 5.70% 1,431
5,258,430 8,388,828 7,814,973 - 25,912,728 4.72% 1,233
4,881,594 8,582,920 7,331,611 - 24,671,749 5.70% 1,181
4,527,471 - 15,077,524 - 21,560,061 5.10% 1,038
- 4,403,042 13,946,595 - 24,162,289 5.45% 1,165
- 6,290,915 12,753,000 - 25,285,758 5.53% 1,219
- 6,139,058 11,439,000 - 24,070,006 4.69% 1,148
- 5,866,152 - - 21,211,302 4.25% 997
Business-Type Activities
97

Percentage of NetEstimated General Actual Taxable Bonded
Fiscal Actual Obligation Value of Debt PerYear Population (1) Taxable Value Bonded Debt Property Capita
2007 21,558 1,089,419,939$ 455,000$ 0.042% 21.11
2008 21,770 1,195,974,542 440,000 0.037% 20.21
2009 21,394 981,617,652 425,000 0.043% 19.87
2010 21,017 822,343,254 410,000 0.050% 19.51
2011 20,885 688,838,957 395,000 0.057% 18.91
2012 20,775 580,032,073 375,000 0.065% 18.05
2013 20,737 590,466,100 355,000 0.060% 17.12
2014 20,748 613,235,365 335,000 0.055% 16.15
2015 20,958 652,131,330 315,000 0.048% 15.03
2016 21,280 699,538,868 295,000 0.042% 13.86
(1) See Demographic and Economic Statistics for population data.Source: Volusia County Property Appraiser and Tax Collector
General Bonded Debt Outstanding
CITY OF EDGEWATER, FLORIDARatios of General Bonded Debt OutstandingLast Ten Fiscal Years
98

Net General Percentage City ofObligation Applicable to Edgewater
Debt the City of Share of Governmental Unit Outstanding Edgewater Debt
Volusia County 15,510,000$ 2.58% 400,158$
Volusia County School District - 0% -
Subtotal Overlapping Debt 15,510,000 2.58% 400,158
City Direct Debt 1,652,438 100% 1,652,438
Total Direct and Overlapping Debt 17,162,438$ 2,052,596$
Note: The county-wide debt amount is comprised of $15,510,000 of the County of Volusia'sLimited Tax general obligation bonds.
Source: Volusia County
CITY OF EDGEWATER, FLORIDADirect and Overlapping Debt
The County's debt is overlapping to the City's in relation to its taxable property value compared to the County's as a whole. The City's general obligation debt is listed above andis direct debt to the City and underlapping to the County.
99

Ass
esse
d V
alua
tion
2016
2015
2014
2013
2012
2011
2010
2009
2008
2007
Ass
esse
d ta
xabl
e re
al p
rope
rty
valu
e64
9,38
4,83
0$
60
7,56
2,75
4$
571,
414,
914
$
55
0,69
5,41
3$
540,
185,
717
$
64
0,01
7,83
6$
771,
615,
565
$
93
1,07
9,26
5$
1,14
9,23
7,66
4$
1,
044,
891,
852
$
Add
bac
k: e
xem
pt r
eal p
rope
rty
336,
519,
836
327,
176,
301
32
2,43
2,34
0
319,
003,
203
31
9,75
1,55
4
374,
884,
311
46
7,79
7,50
6
636,
648,
753
66
7,24
6,62
0
670,
906,
020
T
otal
ass
esse
d va
lue
of r
eal p
rope
rty
985,
904,
666
$
934,
739,
055
$
89
3,84
7,25
4$
869,
698,
616
$
85
9,93
7,27
1$
1,01
4,90
2,14
7$
1,
239,
413,
071
$
1,56
7,72
8,01
8$
1,
816,
484,
284
$
1,71
5,79
7,87
2$
Lega
l deb
t mar
gin:
Deb
t lim
it7,
394,
285
$
7,01
0,54
3$
6,
703,
854
$
6,52
2,74
0$
6,
449,
530
$
7,61
1,76
6$
9,
295,
598
$
11,7
57,9
60$
13,6
23,6
32$
12,8
68,4
84$
Tot
al n
et d
ebt a
pplic
able
to li
mit
1,35
7,43
8
1,
722,
621
1,45
1,84
3
1,
314,
935
1,58
0,06
6
2,
452,
624
2,49
8,49
7
4,
224,
000
5,63
0,15
2
7,
163,
910
Lega
l deb
t mar
gin
6,03
6,84
7$
5,
287,
922
$
5,25
2,01
1$
5,
207,
805
$
4,86
9,46
4$
5,
159,
142
$
6,79
7,10
1$
7,
533,
960
$
7,99
3,48
0$
5,
704,
574
$
Tot
al n
et d
ebt a
pplic
able
to th
e lim
it
as
a pe
rcen
tage
of d
ebt l
imit
18.3
6%24
.57%
21.6
6%20
.16%
24.5
0%32
.22%
26.8
8%35
.92%
41.3
3%55
.67%
Not
e 1:
Per
City
of E
dgew
ater
City
Cha
rter,
the
City
's o
utst
andi
ng le
gal d
ebt s
houl
d no
t
exc
eed
.75
% o
f tot
al a
sses
sed
prop
erty
val
ue.
Not
e 2:
Tot
al n
et d
ebt a
pplic
able
to li
mit
incl
udes
gov
ernm
enta
l act
iviti
es n
otes
pay
able
, spe
cial
ass
essm
ent n
otes
, cap
ital l
ease
s, a
nd li
ne o
f cre
dit.
CIT
Y O
F E
DG
EW
AT
ER
, FL
OR
IDA
Lega
l Deb
t Mar
gin
Info
rmat
ion
Last
Ten
Fis
cal Y
ears
Lega
l Deb
t Mar
gin
Cal
cula
tion
for
Fis
cal Y
ears
100

Less: Available NetFiscal Gross Operating Impact Revenue &
Year Revenues(2) Expenses (3) Fees Impact Fees Principal Interest Total Coverage
2010 7,085,984$ 4,863,198$ 226,897$ 2,449,683$ -$ 95,296$ 95,296$ 25.71
2011 7,474,168 4,372,447 70,550 3,172,271 505,000 261,545 766,545 4.14
2012 7,634,056 4,849,002 42,979 2,828,033 570,000 243,378 813,378 3.48
2013 8,238,099 5,140,343 61,907 3,159,663 1,154,000 378,526 1,532,526 2.06
2014 8,383,806 5,348,671 80,102 3,115,237 1,273,000 368,499 1,641,499 1.90
2015 8,651,318 5,288,285 220,056 3,583,089 1,314,000 325,392 1,639,392 2.19
2016 9,284,327 5,457,041 102,899 3,930,185 1,473,500 260,024 1,733,524 2.27
Note: Detail regarding the City's outstanding debt can be found in the notes to the financial statements.(1)
(2) According to the Resolution, Gross Revenues should exclude interest earnings on theRenewal and Replacement Fund and Construction Fund.
(3) Total direct operating expenses excludes depreciation, amortization and overheadcharges.
The two Water and Wastewater Refunding Revenue Bond Series (2009 and 2012) have been retroactively combined as of 9/30/2015 through a refinancing that occurred on 2/25/2016.
CITY OF EDGEWATER, FLORIDAPledged-Revenue CoverageLast Ten Fiscal Years(dollars in thousands)
Water and Wastewater Refunding Revenue Bond, Series 2016(1)
Debt Service
101

Total Per Capita CountyCalendar Personal Personal Median Unemployment School
Year Population(1) Income Income (2) Age (3) Rate (4) Enrollment (5)2007 21,558 535,586,952$ 24,844$ 45.4 3.4% 2,166
2008 21,997 561,319,446 25,518 46.0 7.2% 2,180
2009 21,394 536,989,400 25,100 46.3 11.8% 2,188
2010 21,017 549,153,193 26,129 46.1 12.6% 2,144
2011 20,885 432,528,350 20,710 46.4 10.3% 1,900
2012 20,775 423,020,550 20,362 47.5 8.8% 1,895
2013 20,737 443,418,346 21,765 47.9 6.8% 1,933
2014 20,748 457,057,692 22,029 46.6 5.9% 1,388
2015 20,958 513,471,000 24,500 49.1 5.8% 1,361
2016 21,280 499,079,840 23,453 49.8 5.1% 1,369
2016 Sources: (1) Source: University of Florida, Bureau of Economic and Business Research, 2016 Estimate(2) US Census Bureau, 2011 - 2015 American Community Survey 5-Year Estimates(3) US Census Bureau, 2011 - 2015 American Community Survey 5-Year Estimates(4) Volusia County Economic Development Q3 Quarterly Report 2016(5) Received from Schools Directly as of 9-30-16 (Includes Discovery Academy, Indian River Elementary, and Edgewater Public Elementary)
Footnote:
NSB High School Total Enrollment = 1,862 Total Staff= 160
Indian River Elementary Total Enrollment = 625 / staff = 75Edgewater Public Elementary Total Enrollment= 620 / Staff = 101
Discovery Academy Total Enrollment = 124 / Staff = 12
NSB Middle School Total Enrollment = 1,168 Total Staff 96
CITY OF EDGEWATER, FLORIDADemographic and Economic StatisticsLast Ten Fiscal Years
Daytona State College South Campus Total Enrollment = 936 DSC total staff 23
102
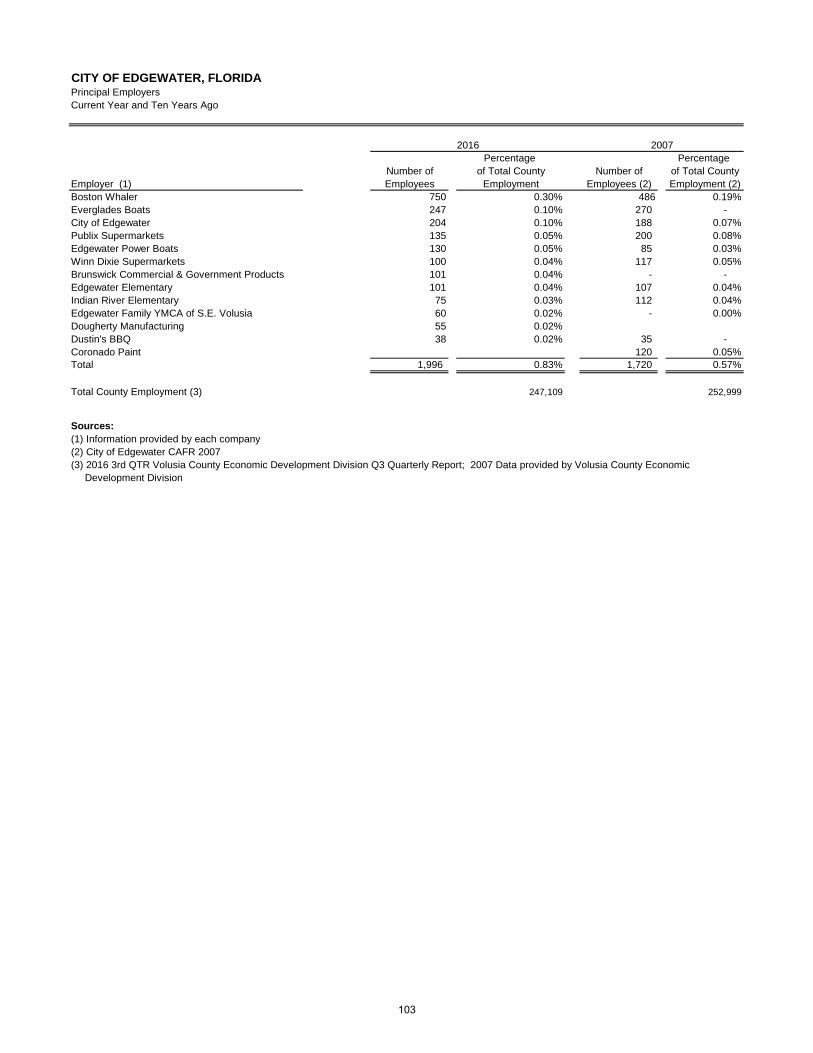
Percentage Percentage Number of of Total County Number of of Total County
Employer (1) Employees Employment Employees (2) Employment (2)Boston Whaler 750 0.30% 486 0.19%Everglades Boats 247 0.10% 270 - City of Edgewater 204 0.10% 188 0.07%Publix Supermarkets 135 0.05% 200 0.08%Edgewater Power Boats 130 0.05% 85 0.03%Winn Dixie Supermarkets 100 0.04% 117 0.05%Brunswick Commercial & Government Products 101 0.04% - - Edgewater Elementary 101 0.04% 107 0.04%Indian River Elementary 75 0.03% 112 0.04%Edgewater Family YMCA of S.E. Volusia 60 0.02% - 0.00%Dougherty Manufacturing 55 0.02%Dustin's BBQ 38 0.02% 35 - Coronado Paint 120 0.05%Total 1,996 0.83% 1,720 0.57%
Total County Employment (3) 247,109 252,999
Sources: (1) Information provided by each company(2) City of Edgewater CAFR 2007(3) 2016 3rd QTR Volusia County Economic Development Division Q3 Quarterly Report; 2007 Data provided by Volusia County Economic
Development Division
CITY OF EDGEWATER, FLORIDAPrincipal Employers Current Year and Ten Years Ago
2016 2007
103

Function/program 2016 2015 2014 2013 2012 2011 2010 2009 2008 2007
General Government:Mayor and Commission 5.0 5.0 5.0 5.0 5.0 5.0 5.0 5.0 5.0 5.0City Manager 3.0 2.0 2.0 2.0 2.0 2.0 2.0 2.0 1.0 2.0City Clerk 2.0 2.0 2.0 2.0 2.0 2.0 2.0 2.0 2.0 2.0
Finance 10.0 11.0 10.5 9.5 9.5 6.5 6.5 7.0 8.0 9.0IT/MIS/GIS 3.0 3.0 3.0 2.0 2.0 2.0 2.0 2.0 2.0 0.0Economic Development 1.0 1.0 1.0Human Resources 2.0 2.0 2.0 2.0 2.0 2.0 2.0 2.0 2.0 2.0
Community DevelopmentPlanning and Zoning 2.0 2.0 2.0 2.0 2.0 3.0 3.0 3.0 3.0 4.0Building 4.0 4.0 4.0 3.5 3.5 3.5 3.5 3.5 4.0 4.0
Public Safety:Police Department 33.5 34.0 34.5 35.0 33.5 33.0 34.0 33.5 36.0 33.0Fire Department 33.5 30.5 29.5 29.5 29.0 30.0 30.0 31.0 32.0 35.0Animal Control/Shelter 1.0 1.0 1.0 2.0 2.0 5.0 4.0 4.0 5.0 2.0Code Enforcement 1.0 2.0 2.0 2.0 2.0 1.0 3.0 3.0 3.0 2.0
Water ResourcesWater Utility 15.0 14.0 11.0 11.0 9.0 10.0 10.0 10.0 10.0 9.0Wastewater Utility 15.0 15.0 16.0 15.0 14.0 15.0 15.0 15.0 15.0 16.0Field Operations 11.0 11.0 11.0 11.0 10.0 9.0 10.0 10.0 9.0 10.0
Stormwater 11.0 10.0 9.5 9.5 9.0 8.0 7.0 6.0 8.0 9.0Refuse 24.0 23.5 26.0 26.0 24.0 23.0 23.0 23.0 24.0 27.0Parks and Recreation 15.0 15.0 15.0 15.0 15.0 15.0 16.0 16.0 16.0 12.0Fleet 3.0 3.0 3.0 3.0 3.0 3.0 2.0 2.0 3.0 0.0Public Works 9.0 7.0 8.5 9.0 7.0 7.0 7.0 8.0 0.0 0.0
Totals: 204.0 198.0 198.5 196.0 185.5 185.0 187.0 188.0 188.0 183.0
CITY OF EDGEWATER, FLORIDAFull-Time Equivalent City Government Employees by Function/ProgramLast Ten Fiscal Years
Support Departments
Fiscal Year
104
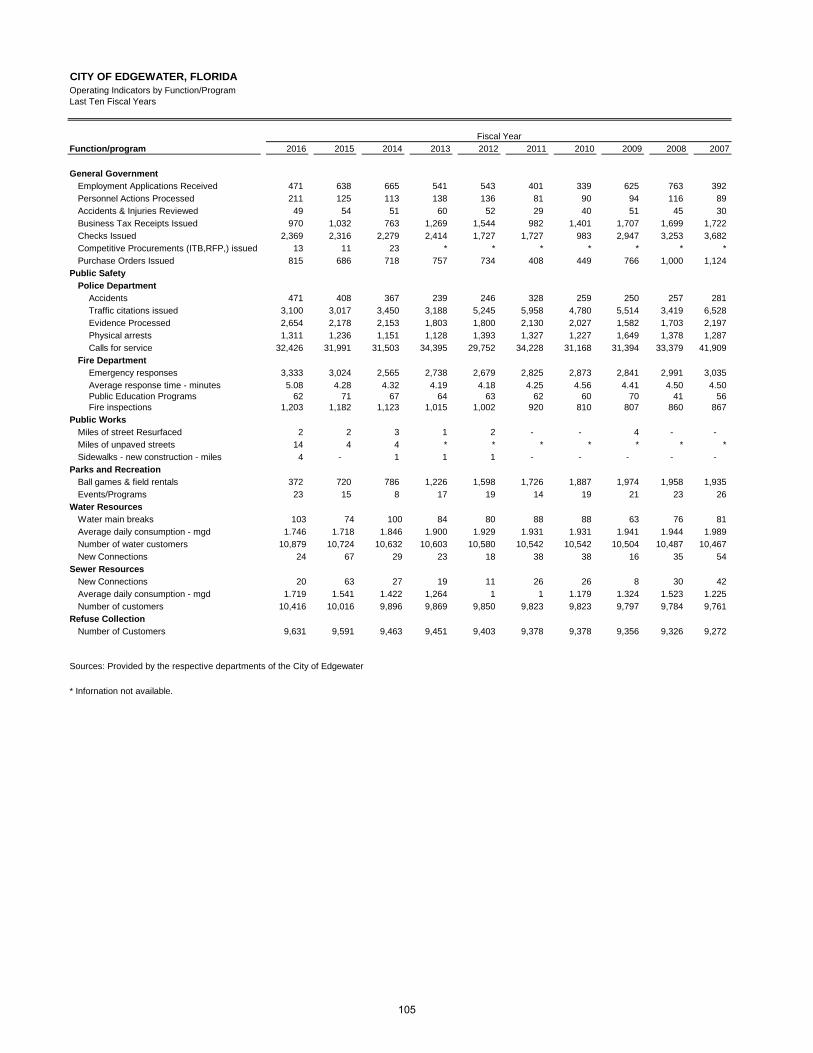
Function/program 2016 2015 2014 2013 2012 2011 2010 2009 2008 2007
General GovernmentEmployment Applications Received 471 638 665 541 543 401 339 625 763 392 Personnel Actions Processed 211 125 113 138 136 81 90 94 116 89 Accidents & Injuries Reviewed 49 54 51 60 52 29 40 51 45 30 Business Tax Receipts Issued 970 1,032 763 1,269 1,544 982 1,401 1,707 1,699 1,722 Checks Issued 2,369 2,316 2,279 2,414 1,727 1,727 983 2,947 3,253 3,682 Competitive Procurements (ITB,RFP,) issued 13 11 23 * * * * * * *Purchase Orders Issued 815 686 718 757 734 408 449 766 1,000 1,124
Public SafetyPolice Department
Accidents 471 408 367 239 246 328 259 250 257 281 Traffic citations issued 3,100 3,017 3,450 3,188 5,245 5,958 4,780 5,514 3,419 6,528 Evidence Processed 2,654 2,178 2,153 1,803 1,800 2,130 2,027 1,582 1,703 2,197 Physical arrests 1,311 1,236 1,151 1,128 1,393 1,327 1,227 1,649 1,378 1,287 Calls for service 32,426 31,991 31,503 34,395 29,752 34,228 31,168 31,394 33,379 41,909
Fire DepartmentEmergency responses 3,333 3,024 2,565 2,738 2,679 2,825 2,873 2,841 2,991 3,035 Average response time - minutes 5.08 4.28 4.32 4.19 4.18 4.25 4.56 4.41 4.50 4.50
62 71 67 64 63 62 60 70 41 56 1,203 1,182 1,123 1,015 1,002 920 810 807 860 867
Public WorksMiles of street Resurfaced 2 2 3 1 2 - - 4 - - Miles of unpaved streets 14 4 4 * * * * * * *Sidewalks - new construction - miles 4 - 1 1 1 - - - - -
Parks and RecreationBall games & field rentals 372 720 786 1,226 1,598 1,726 1,887 1,974 1,958 1,935 Events/Programs 23 15 8 17 19 14 19 21 23 26
Water ResourcesWater main breaks 103 74 100 84 80 88 88 63 76 81 Average daily consumption - mgd 1.746 1.718 1.846 1.900 1.929 1.931 1.931 1.941 1.944 1.989Number of water customers 10,879 10,724 10,632 10,603 10,580 10,542 10,542 10,504 10,487 10,467 New Connections 24 67 29 23 18 38 38 16 35 54
Sewer ResourcesNew Connections 20 63 27 19 11 26 26 8 30 42 Average daily consumption - mgd 1.719 1.541 1.422 1,264 1 1 1.179 1.324 1.523 1.225Number of customers 10,416 10,016 9,896 9,869 9,850 9,823 9,823 9,797 9,784 9,761
Refuse CollectionNumber of Customers 9,631 9,591 9,463 9,451 9,403 9,378 9,378 9,356 9,326 9,272
Sources: Provided by the respective departments of the City of Edgewater
* Infornation not available.
CITY OF EDGEWATER, FLORIDAOperating Indicators by Function/ProgramLast Ten Fiscal Years
Public Education ProgramsFire inspections
Fiscal Year
105

Function/program 2016 2015 2014 2013 2012 2011 2010 2009 2008 2007
PolicePolice Stations 1 1 1 1 1 1 1 1 1 1 Police Vehicles 30 30 29 27 28 30 30 30 24 26 Patrol Zones 2 2 2 2 2 2 2 2 2 2
FireFire Stations 2 2 2 2 2 2 2 2 2 2 Fire Vehicles 19 18 17 17 17 18 15 15 13 13
Public WorksStreets (miles) 126 124 124 124 124 124 124 124 124 124Number of street lights 1,057 1,080 1,071 1,068 1,068 1,068 1,068 1,068 1,068 1,068Number of traffic signals 4 3 3 3 3 3 3 3 3 3Vehicles 11 8 8 9 8 5 5 5 5 5
Parks and RecreationVehicles 15 15 11 12 12 12 12 12 9 9Parks Acreage 151 151 151 151 151 151 151 151 151 151Parks 28 28 28 28 28 28 28 28 28 28Baseball Fields 5 5 7 7 7 7 7 7 7 7Tennis Courts 4 4 4 4 4 4 4 4 4 4Basketball Courts 3 3 3 2 2 2 2 2 2 2Racquetball Courts 4 4 4 4 4 4 4 4 4 4Shuffleboard Courts - - 2 2 2 2 2 2 2 2Boat Ramps 5 5 5 5 5 5 5 5 5 5Paddling Trails 6 6 Awaiting Designation - - - - - - Gymnasiums (YMCA) 1 1 1 1 1 1 1 1 1 1
Water ResourcesWater mains (miles) 165 275 275 275 275 274 274 274 274 274Fire hydrants 720 720 718 701 700 700 700 695 694 694Vehicles 724 26 26 24 24 23 23 23 23 23Sewer mains (miles) 189 189 189 189 189 189 189 189 189 189Reclaim Water (miles) 79 72 72 72 71 71 71 71 71 71
Stormwater UtilityStorm Sewers (miles) 36 36 36 36 36 35 35 35 35 35Vehicles 18 17 17 16 15 7 7 10 10 10
Solid WasteGarbage Trucks 9 10 10 10 9 7 7 8 7 10Other Vehicles 11 13 13 13 13 12 12 14 14 15
Sources: Provided by the respective departments of the City of Edgewater
CITY OF EDGEWATER, FLORIDACapital Asset Statistics by Function/ProgramLast Ten Fiscal Years
Fiscal Year
106

INDEPENDENT AUDITORS’ REPORT ON INTERNAL CONTROL OVER FINANCIAL REPORTING AND ON COMPLIANCE AND OTHER MATTERS BASED ON AN AUDIT OF
FINANCIAL STATEMENTS PERFORMED IN ACCORDANCE WITH GOVERNMENT AUDITING STANDARDS
To the Honorable Mayor, City Council, and City Manager, City of Edgewater, Florida:
We have audited, in accordance with auditing standards generally accepted in the United States of America and the standards applicable to the financial audits contained in Government Auditing Standardsissued by the Comptroller General of the United States, the financial statements of the governmental activities, the business-type activities, each major fund, and the aggregate remaining fund information of the City of Edgewater, Florida, (the City) as of and for the year ended September 30, 2016, and the related notes to the financial statements, which collectively comprise the City’s basic financial statements, and have issued our report thereon dated March 4, 2017.
Internal Control over Financial Reporting
In planning and performing our audit of the financial statements, we considered the City's internal control over financial reporting (internal control) to determine the audit procedures that are appropriate in the circumstances for the purpose of expressing our opinions on the financial statements, but not for the purpose of expressing an opinion on the effectiveness of the City’s internal control. Accordingly, we do not express an opinion on the effectiveness of the City’s internal control.
A deficiency in internal control exists when the design or operation of a control does not allow management or employees in the normal course of performing their assigned functions, to prevent, or detect and correct misstatements on a timely basis. A material weakness is a deficiency, or a combination of deficiencies, in internal control, such that there is a reasonable possibility that a material misstatement of the entity's financial statements will not be prevented, or detected and corrected on a timely basis. A significant deficiency is a deficiency, or a combination of deficiencies, in internal control that is less severe than a material weakness, yet important enough to merit attention by those charged with governance.
Our consideration of internal control over financial reporting was for the limited purpose described in the first paragraph of this section and was not designed to identify all deficiencies in internal control over financial reporting that might be material weaknesses or significant deficiencies and therefore, material weaknesses or significant deficiencies may exist that were not identified. Given these limitations, during our audit we did not identify any deficiencies in internal control over financial reporting that we consider to be material weaknesses. However, material weaknesses may exist that have not been identified. We did identify a certain deficiency in internal control, as outlined below, that we consider to be a significant deficiency:
2016-003 Sale of Land
We noted a sale of land in the refuse fund for a material amount (approximately $380,000). The City originally recorded this transaction as revenue in the refuse fund. Since there was a carryingvalue of about $283,000 for the land, the proper accounting treatment is to record a gain of approximately $97,000 and remove the land recorded on the balance sheet. We proposed an
107

adjusting journal entry and management has recorded it. We recommend the City implement controls to ensure all such non-routine transactions are properly recorded.
Compliance and Other Matters
As part of obtaining reasonable assurance about whether the City's financial statements are free from material misstatement, we performed tests of its compliance with certain provisions of laws, regulations, contracts, and grant agreements, noncompliance with which could have a direct and material effect on the determination of financial statement amounts. However, providing an opinion on compliance with those provisions was not an objective of our audit and, accordingly, we do not express such an opinion. The results of our tests disclosed no instances of noncompliance or other matters that are required to be reported under Government Auditing Standards.
We noted certain matters that we reported to the City Commission and management of the City in a separate letter dated March 4, 2017.
City of Edgewater, Florida’s Response to Findings
The City’s responses to the findings identified in our audit are described starting on page 113. The City’s response was not subjected to the auditing procedures applied in the audit of the financial statements and, accordingly, we express no opinion on it.
Purpose of this Report
The purpose of this report is solely to describe the scope of our testing of internal control and compliance and the results of that testing, and not to provide an opinion on the effectiveness of the entity’s internal control or on compliance. This report is an integral part of an audit performed in accordance with Government Auditing Standards in considering the entity’s internal control and compliance. Accordingly, this communication is not suitable for any other purpose.
Daytona Beach, FloridaMarch 4, 2017
108

INDEPENDENT AUDITORS’ MANAGEMENT LETTER REQUIRED BY CHAPTER 10.550, RULES OF THE STATE OF FLORIDA OFFICE OF THE AUDITOR GENERAL
To the Honorable Mayor, City Council, and City Manager, City of Edgewater, Florida:
Report on the Financial Statements
We have audited the financial statements of City of Edgewater, Florida (the City), as of and for the fiscal year ended September 30, 2016, and have issued our report thereon dated March 4, 2017.
Auditors’ Responsibility
We conducted our audit in accordance with auditing standards generally accepted in the United States of America; the standards applicable to financial audits contained in Government Auditing Standards, issued by the Comptroller General of the United States; and Chapter 10.550, Rules of the Auditor General.
Other Reports
We have issued our Independent Auditor’s Report on Internal Control over Financial Reporting and Compliance and Other Matters Based on an Audit of the Financial Statements Performed in Accordance with Government Auditing Standards; and Independent Accountants’ Examination Report on an examination conducted in accordance with AICPA Professional Standards, Section 601, regarding compliance requirements in accordance with Chapter 10.550, Rules of the Auditor General. Disclosures in those reports, which are dated March 4, 2017, should be considered in conjunction with this management letter.
Prior Audit Findings
Section 10.554(1)(i)1., Rules of the Auditor General, requires that we determine whether or not corrective actions have been taken to address findings and recommendations made in the preceding annual financial audit report. Findings and recommendations made in the preceding annual financial audit and their status is summarized below:
2015-001 Fully Insured and Workers Compensation Deficit Net Position: Corrective action not taken. See repeat comment 2016-001.
2015-002 City’s General Pension Plan Discrepancies: Corrective action taken.
2015-003 Pension Benefit Payments: Corrective action taken.
All findings included in the second preceding fiscal year financial audit report under the same paragraph headings were corrected.
109

Official Title and Legal Authority
Section 10.554(1)(i)4., Rules of the Auditor General, requires that the name or official title and legal authority for the primary government and each component unit of the reporting entity be disclosed in this management letter, unless disclosed in the notes to the financial statements. The official title and legal authority for the primary government are discussed in Note 1 to the financial statements.
Financial Condition
Sections 10.554(1)(i)5.a. and 10.556(7), Rules of the Auditor General, require that we apply appropriate procedures and report the results of our determination as to whether or not the City has met one or more of the conditions described in Section 218.503(1), Florida Statutes, and identification of the specific condition(s) met. In connection with our audit, we determined that the City did not meet any of the conditions described in Section 218.503(1), Florida Statutes.
Pursuant to Sections 10.554(1)(i)5.c. and 10.556(8), Rules of the Auditor General, we applied financial condition assessment procedures. It is management’s responsibility to monitor the City’s financial condition, and our financial condition assessment was based in part on representations made by management and the review of financial information provided by same.
Annual Financial Report
Sections 10.554(1)(i)5.b. and 10.556(7), Rules of the Auditor General, require that we apply appropriate procedures and report the results of our determination as to whether the annual financial report for the City for the fiscal year ended September 30, 2016, filed with the Florida Department of Financial Services pursuant to Section 218.32(1)(a), Florida Statutes, is in agreement with the annual financial audit report for the fiscal year ended September 30, 2016. In connection with our audit, we determined that these two reports were in agreement.
Other Matters
Section 10.554(1)(i)2., Rules of the Auditor General, requires that we address in the management letter any recommendations to improve financial management. In connection with our audit, we have the following recommendations:
2016-001 Fully Insured and Workers Compensation Deficit Net Position – At September 30, 2016, the Fully Insured and Workers Compensation internal service funds had a deficit net position of $255,025 and $81,975, respectively. We recommend the City develop a plan to eliminate these deficits in net position
2016-002 Funding Standard Account – At September 30, 2016, the Police Officers’ Retirement Plan has accumulated a credit balance of $272,870 in the Funding Standard Account, as determined by the actuary. We recommend the City utilize the Funding Standard Account balance in future years to reduce the City’s required contributions into the Police Officers Retirement Trust Fund.
Section 10.554(1)(i)3., Rules of the Auditor General, requires that we address noncompliance with provisions of contracts or grant agreements, or abuse, that have occurred, or are likely to have occurred, that have an effect on the financial statements that is less than material but which warrants the attention of those charged with governance. In connection with our audit, we did not have any such findings.
110

City of Edgewater, Florida’s Response to Findings
The City’s responses to the findings identified in our audit are described starting on page 113. The City’s responses were not subjected to the auditing procedures applied in the audit of the financial statements and, accordingly, we express no opinion on it.
Purpose of this Letter
Our management letter is intended solely for the information and use of the Legislative Auditing Committee, members of the Florida Senate and the Florida House of Representatives, the Florida Auditor General, Federal and other granting agencies, Honorable Mayor, City Council, and applicable management, and is not intended to be and should not be used by anyone other than these specified parties.
Daytona Beach, FloridaMarch 4, 2017
111

INDEPENDENT ACCOUNTANTS’ EXAMINATION REPORT
To the Honorable Mayor, City Council, and City Manager, City of Edgewater, Florida:
We have examined the City of Edgewater, Florida’s (the City) compliance with Section 218.415, Florida Statutes, Local Government Investment Policies, for the year ended September 30, 2016. Management is responsible for the City’s compliance with those requirements. Our responsibility is to express an opinion on the City’s compliance based on our examination.
Our examination was conducted in accordance with attestation standards established by the American Institute of Certified Public Accountants and, accordingly, included examining, on a test basis, evidence about the City’s compliance with those requirements and performing such other procedures as we considered necessary in the circumstances. We believe that our examination provides a reasonable basis for our opinion. Our examination does not provide a legal determination on the City’s compliance with specified requirements.
In our opinion, the City complied, in all material respects, with the aforementioned requirements for the year ended September 30, 2016.
Daytona Beach, FloridaMarch 4, 2017
112

MEMO TO: The Honorable Mayor and City Council The State Auditor General
THRU: Tracey T. Barlow, City Manager
FROM: Jonathan C. McKinney, Finance Director DATE: March 8, 2017 SUBJECT: Reply to the Independent Auditor’s Report on Internal Control and Management Letter Comments for Fiscal Year Ended September 30, 2016
FINANCIAL STATEMENT FINDINGS
Sale of Land
Management concurs with this comment and recommendation to review more carefully non-routine transactions are properly recorded.
Fully Insured and Workers Compensation Deficit Net Position
Management concurs with this comment and recommendation to develop plan to eliminate deficits at year-end.
Funding Standard Account
Management concurs with this comment and recommendation to utilize the Funding Standard Account balance to reduce the City’s required contributions to the Police Officer’s Retirement Trust Fund.
113

AFFIDAVIT OF IMPACT FEE COMPLIANCE
The City of Edgewater, Florida has complied with Section 163.31801 of Florida Statues regarding accounting and reporting of impact fee collections and expenditures.
Tracey T. Barlow Jonathan C. McKinney City Manager Finance Director
STATE OF FLORIDA COUNTY OF VOLUSIA
I HEREBY CERTIFY that on this day, before me, an officer duly authorized in the State and County aforesaid to take acknowledgments, personally appeared Tracey T. Barlow and Jonathan C. McKinney, whom I know personally and whom executed the foregoing instrument and acknowledged before me that he executed the same.
WITNESS my hand and official seal in the County and State last aforesaid this 8th day of March 2016.
(Seal/Stamp) Notary Public (Commission Expiration Date) State of Florida at Large
114