city of berkeley california comprehensive annual financial ... · city of berkeley california...
TRANSCRIPT
CITY OF BERKELEYCALIFORNIA
Comprehensive Annual Financial Report
For the fiscal year endedJune 30, 2010
Prepared by Finance DepartmentRobert HicksDirector of Finance

CITY OF BERKELEYComprehensive Annual Financial ReportFor the Fiscal Year Ended June 30. 2010
TABLE OF CONTENTS
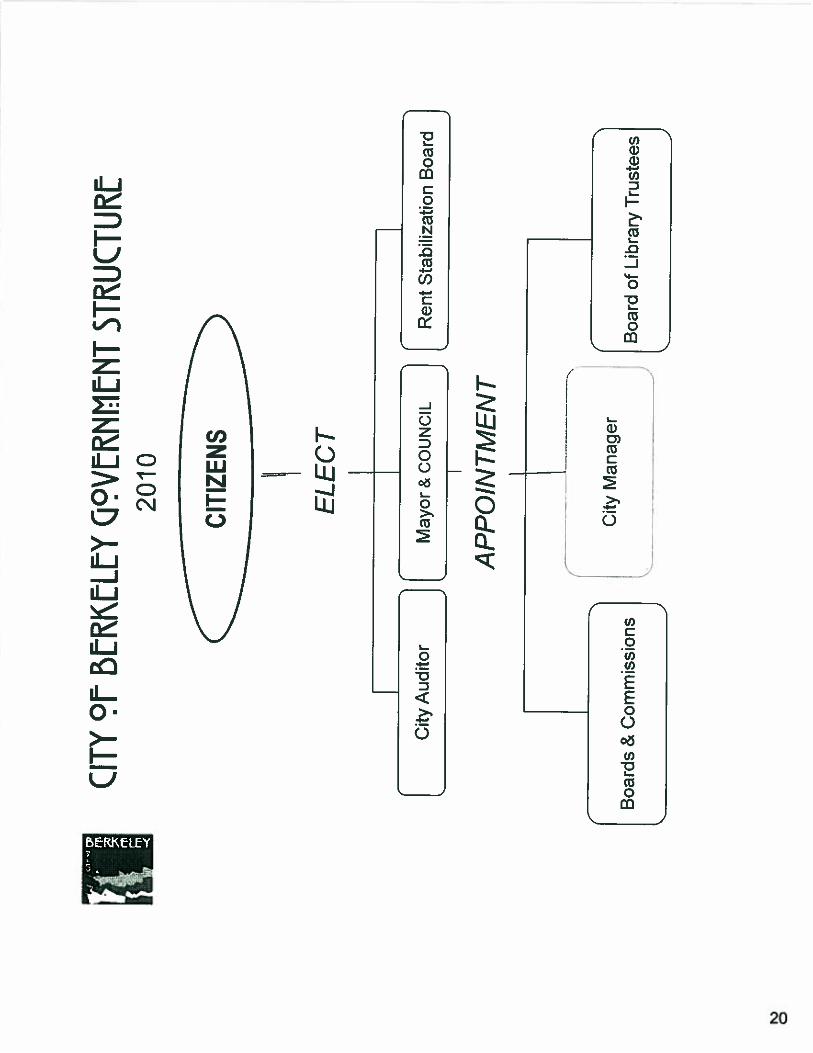
INTRODUCTORY SECTIONLetter of Transmittal I - ISGFOA Certificate of AchievementGovernment Structure 20List of Elected and Appointed Officials 21Organizational Chart 22
FINANCIAL SECTIONIndependent Auditors Report 23-21
Majnaeements Discussion and Analysis 25-44
Basic Financial Statements 45Government—wide Financial Statements:
Statement of Nct Assets 46Statement of Activities 47
Fund Financial StatementsGovernmental Funds:
Balance Shed 48-49Reconciliation of the Governmental Funds Balance Sheet
to the Government—wide Statement of Net Assets - Govertimental Activities 50Statement of Revenues. Expenditures. and Changes in Fund Balances 51-52Reconciliation of the Statetneint of Revenues. Expenditures and Chatiges in
Fund Balances of Governmental Funds to the Statement of Activities - Govertitnental Acti’ ties 53
Proprietary Funds:Statement of Net Assets 54Statement of Revenues. Expenses and Chittiges iti Fund Net Assets 55Statement of Cash Flows 56-57
Fiduciary Funds:Statement of Fiduciary Net Assets 58Statement of Changes in Fiduciary Net Assets 59
Notes to the Financial Statements 60-130
Required Supplementary Information: 131Schedule of Revenues. Expenditures and Changes in Fttnd Balances - General Fund - Budgetary Basis 132Schedule of Revenues. Expenditures and Chauges in Fund Balances
- Other Major Special Revenue Funds - Budgetary Basis 133-136Schedule of Funding Progress - CALPERS. Safety Members Pension Fund (SMPF).Police Retirement Income Benefit Plan, and OPEB Plans 137-139Note to Required Supplementary Informaiton 140
Other Supplementan Information:Combining and Individual Fund Statements and Schedules: 141
Schedule of Revenues. Expenditures. and Changes in Fund Balances -
Budget and Actual - Major Capital Project Fund - Bttdgetarv Basis 42-143
Fund legend for Nonmajor Governmental Funds 144-151
Combining Balance Sheet 152-160Combining Statement of Revenues. Expenditures and Changes in Fund Balances 161-168
CITY OF BERKELEYComprehensive Annual Financial ReportFor the Fiscal Year Ended June 30. 2010
TABLE OF CONTENTS
Schedule of Revenues. Expenditures. and Changes in Fund Balances -
Budget and Acujal - Budget1iry Basis 169-186
Fund legend for Internal Service Funds 187
Combining Statement of Net Assets - Internal Service Funds 188Combining Statement of Re enucs. Expenses and Changes in Fund Net
Assess - Internal Service Funds 189Combining Statement nf Cash Flows — Internal Service Fttnds 190—191
Fund legend for Fiduciary Funds 192
Combining Statement of Fiduciary Net Assets - Pensions andOther Employee Benefit Trust Funds 193
Combining Statement of Changes in Fiduciary Net Assets — Pension andOther Employee Benefit Trnst Funds 194
Ftind legend for Agency Funds 195
Combining Statement of Fiduciary Net Assets — Agency Funds 196Siaiement of Changes in Assets and Liabilities - Agency Funds 197
STATISTICAL SECTIONIndex to Statistical Sectiun 198Financial Trends:
Net Assets by Component 199Chatsees in Net Asscts 200-202Fund Balance. Govemtuental Funds 203Chanees in Fund Balances. Governmental Funds 204-205
Revenue Capacity:Assess Value and Estimated Actual Values of Taxable Property 206Direct and Overlapping Property Tax Rates 207Principle Propert Tax Payers 208Property Tax levies and Collections 209
Debt Capacity:Ratios of Outstanding Debt by Type 210Ratios of General Bonded Debt Outstanding 211Direct and Overlapping Governmental Activities Debt 212Legal Debt Margin Information 213Pledged Revenue Coverage 214
Demographic and Economic Information:Demographic and Economic Statistics 215Principal Emplocrs 216Full-Time-Equivalent City Government Employees by Funciio&Program 217
Operating Information:Operating Indicators 218-220Capital Asset Statistics by Function/Program 221
INDEPENDENT AUDITORS’ REPORT ON INTERNAL CONTROL AND ON COMPLIANCEAND OTHER MATTERS BASED ON AX AUDIT OF FINANCIAL STATEMENTSPERFORMED IN ACCORDANCE WITH GOVERAMFNTAUDITINGST,4NDARDS 222-223
Summary Schedule of Prior Audit Findings 224Schedule of Findings and Responses 225-228

MEMORANDUM
DATE: December 28, 2010
TO: Honorable Mayor and Members of the City Council, City Manager, and Citizensof the City of Berkeley
FROM: Robert Hicks. Director of Finance
RE: Presentation of the Comprehensive Annual Financial Report
Attached is the Comprehensive Annual Financial Report (CAFR) of the City of Berkeley for thefiscal year ended June 30. 2010. The CAFR has been prepared by the Finance Department inconformance with the principles and standards for financial reporting set forth by theGovernmental Accounting Standards Board (GASB). Responsibility for the accuracy,comprehensiveness and fairness of the presented data, including all disclosures, rests with theCity’s management. The report has been compiled in a manner designed to fairly set forth thefinancial position and results of operations of the City as measured by the financial activity of itsvarious funds. All disclosures necessary to enable the reader to gain an understanding of theCity’s financial affairs have been included.
The City prepared the CAFR in accordance with generally accepted accounting principles, whichincluded using the financial reporting requirements prescribed by GASB Statement No. 34. BasicFinancial Statements and Management’s Discussion and Analysis for State and LocalGovernments (GASB 34). This statement requires that management provide a narrative overviewand analysis to introduce the basic financial statements in the form of Management’s Discussionand Analysis (MD&A). This letter of transmittal is designed to complement the MD&A andshould be read in conjunction with it. The MD&A can be found immediately folLowing theindependent auditor’s report.
THE REPORTING ENTITY
This report combines the financial statements of the City, the Berkeley Redevelopment Agency(BRA), the Berkeley Housing Authority (BHA), and the Rent Stabilization Board (RSB) inaccordance with principles defining the governmental reporting entity adopted by theGovernmental Accounting Standards Board (GASB). The Rent Stabilization Board is adiscretely presented component unit because the citizens elect its nine-member Board ofCommissioners. The Berkeley Housing Authority is a discretely presented component unitbecause HUD required the City to appoint an independent board responsible for oversight ofBI-TA, and the City provides significant financial support to BHA. The financial operations of theBRA, though legally separate from the City, are closely related to the City. In fact, in separatesessions, the City Council members serve as the governing board of the BRA. As a result, the
Depariment of FinanceOfflce of the Director
1
December 28, 2010Presentation of the Comprehensive Annual Financial ReportPage 2
BRA is presented as a blended component unit in the financial statements. The financialactivities of the BRA are included with the capital project and debt service fund types.
PROFILE OF THE CITY
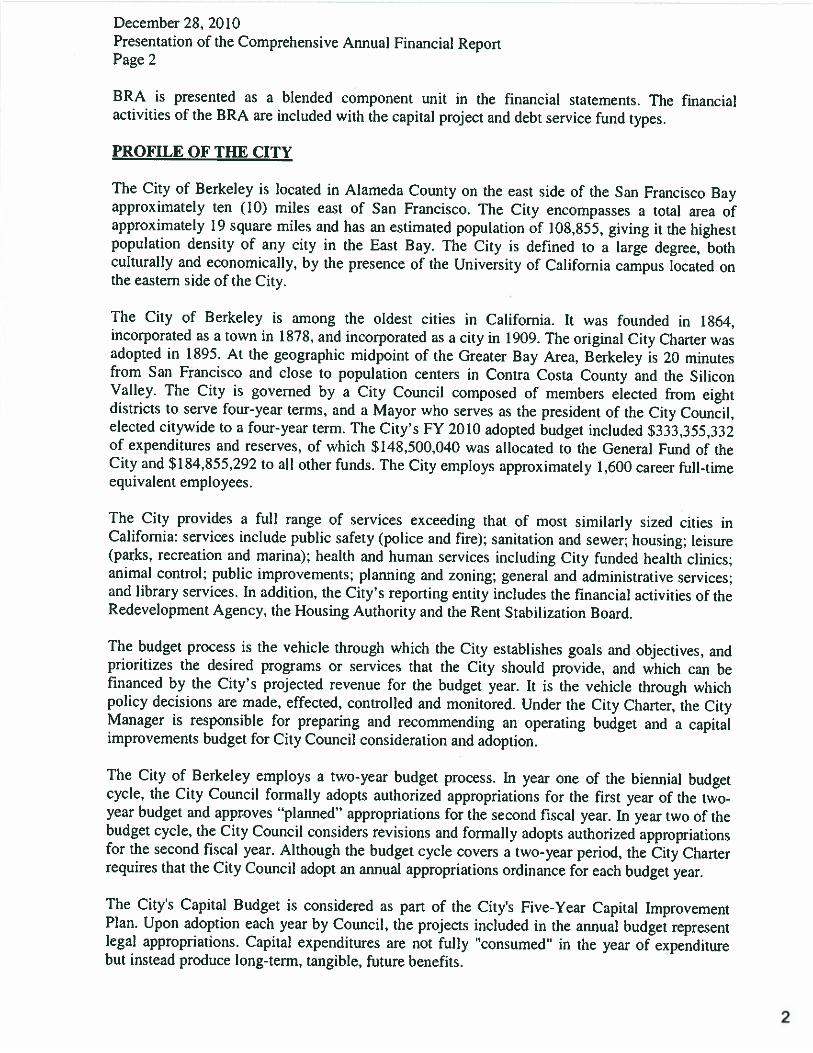
The City of Berkeley is located in Alameda County on the east side of the San Francisco Bayapproximately ten (10) miles east of San Francisco. The City encompasses a total area ofapproximately 19 square miles and has an estimated population of 108,855. giving it the highestpopulation density of any city in the East Bay. The City is defined to a large degree, bothculturally and economically, by the presence of the University of Ca]ifornia campus located onthe eastern side of the City.
The City of Berkeley is among the oldest cities in California. It was founded in 1864,incorporated as a town in 1878, and incorporated as a city in 1909. The original City Char er wasadopted in 1895. At the geographic midpoint of the Greater Bay Area, Berkeley is 20 minutesfrom San Francisco and close to population centers in Contra Costa County and the SiliconValley. The City is governed by a City Council composed of members elected from eightdistricts to serve four-year terms, and a Mayor who serves as the president of the City Council.elected citywide to a four-year term. The City’s FY 2010 adopted budget included $333,355,332of expenditures and reserves, of which S 148.500,040 was allocated to the General Fund of theCity and S 184.855.292 to all other funds. The City employs approximately 1.600 career full-timeequivalent employees.
The City provides a full range of services exceeding that of most similarly sized cities inCalifornia: services include public safety (police and fire); sanitation and sewer; housing; leisure(pai:ks. recreation and marina); health and human services including City funded health clinics;animal control; public improvements: planning and zoning; general and administrative services;and library services. In addition, the City’s reporting entity includes the financial activities of theRedevelopment Agency, the Housing Authority and the Rent Stabilization Board.
The budget process is the vehicle through which the City establishes goals and objectives, andprioritizes the desired programs or services that the City should provide, and which can befinanced by the City’s projected revenue for the budget year. It is the vehicle through whichpolicy decisions are made, effected, controlled and monitored. Under the City Charter, the CityManager is responsible for preparing and recommending an operating budget and a capitalimprovements budget for City Council consideration and adoption.
The City of Berkeley employs a two-year budget process. In year one of the biennial budgetcycle, the City Council formally adopts authorized appropriations for the first year of the two-year budget and approves “planned” appropriations for the second fiscal year. In year two of thebudget cycle, the City Council considers revisions and formally adopts authorized appropriationsfor the second fiscal year. Although the budget cycle covers a two-year period, the City Charterrequires that the City Council adopt an annual appropriations ordinance for each budget year.
The City’s Capital Budget is considered as part of the City’s Five-Year Capital ImprovementPlan. Upon adoption each year by Council. the projects included in the annual budget representlegal appropriations. Capital expenditures are not fully “consumed” in the year of expenditurebut instead produce long-term, tangible, future benefits.
2
December28, 2010Presentation of the Comprehensive Annual Financial ReportPage 3
In addition to this budget planning process, the City maintains budgetary controls. The City’sobjective in maintaining budgetary control is to ensure compliance with legal provisionsembodied in the annual appropriated budget approved by the City Council. The City Manager isauthorized to transfer budgeted amounts within funds as deemed necessary in order to meet theCity’s needs. However, revisions that alter the total budget or move amounts from one fund toanother must be approved by the City Council. Activities of the General Fund, Special RevenueFunds, Debt Service Funds. Capital Project Funds, and Proprietary Funds are included in theannual appropriated budget.
The City maintains an encumbrance accounting system as one technique of accomplishingbudgetary control. Purchase orders, contracts, and other commitments for the expenditure ofmoney are secured in order to reserve that portion of the applicable appropriation. Encumbrancesoutstanding at year-end are reported as reservations of fund balance. Unencumbered amountslapse at year-end and may be appropriated as part of the following year’s budget.
Moving Toward an Integrated Budget Process. The City is continually improving its budgetprocess and service delivery to align policy goals, program objectives and resources, and servicedelivery — including establishing useful performance goals and integrating them with sustainableperformance goals. The two-year budget allows time to effectively integrate goal-setting andpolicy-making processes, with the establishment of performance targets and the allocation ofresources. Short-term program and service objectives can be developed, and resources to meetthese objectives can be appropriately allocated through the budget process. To complete thecycle, performance measures will be used to evaluate if services were effective and policy goalsmet. This information can feed the subsequent assessment of community conditions and trendsfor the next budget and performance cycle.
• Developing a Service-Based Outcomes Budget. Over the next few budget cycles, theCity will continue to design a budget process, which focuses on services and includesperformance and benchmark information to assist in evaluating program outcomes and howeffectively resources are used. Full implementation and benefits of a performance-basedbudget cannot be achieved without organizational changes in other areas.
LOCAL ECONOMY
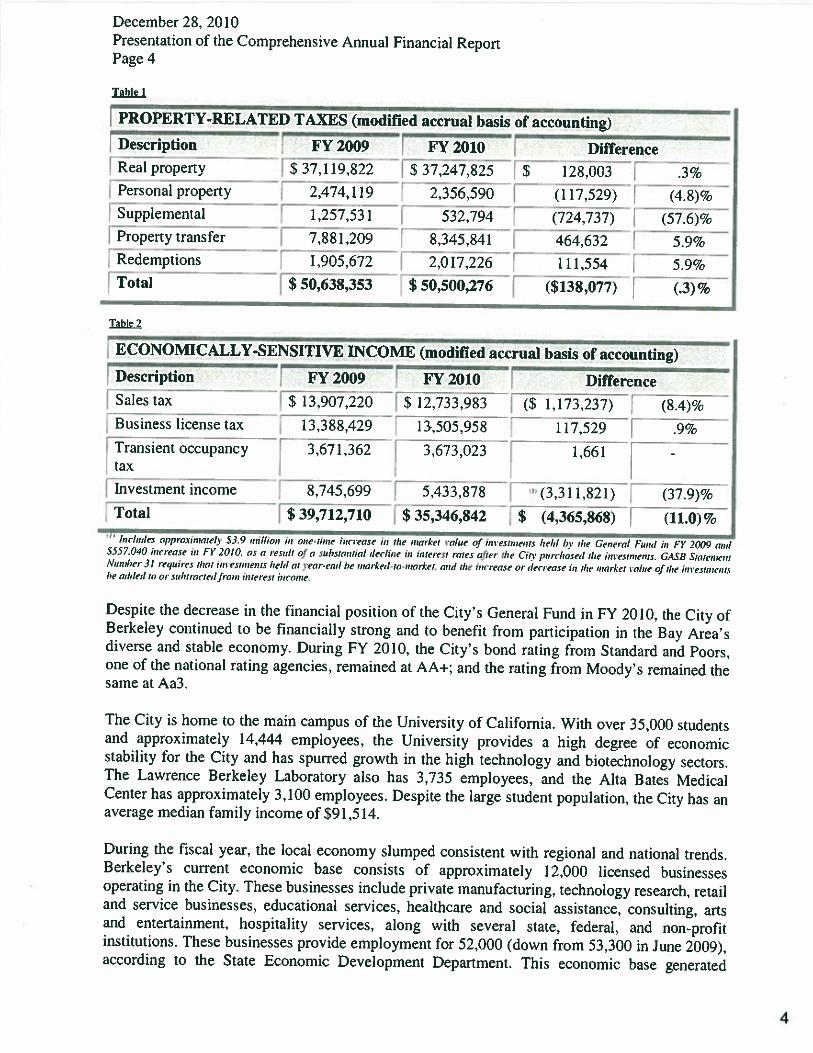
FY2OIO was a period of significant economic turmoil in the country, the State, the Bay area andthe City. It was dominated by a loss of jobs, low consumer confidence, tighter credit standards,less willingness on the part of banks to lend, and lower levels of consumer and businessspending. The economic conditions resulted in declines in nearly all economically-sensitiverevenue sources, and most property-related revenue sources and charges for services. There wasa slight decrease of $138,077 in property-related revenues and a $4,137,264 decrease ineconomically-sensitive income.
3
December 28. 2010Presentation of the Comprehensive Annual Financial ReportPage 4
Table 1
PROPERTY-RELATED TAXES (modified accrual basis of accounting)I Description FY 2009 FY_2010 Difference
Real property $ 37,119,822 $ 37.247,825 $ 128,003 .3%Personal property fl747115 2,356,590 (117,529) E (4.8)%Supplemental flJ57,531 532.794 (724.737) (57.6)%
; Property transfer 7,881,209 8,345,841 464.632 5.9%i Redemptions 1,905.672 2.017.226 1 11,554 5.9%Total [Tö,638,353 $ 50,500,276 ($138,077)
Table 2
I ECONOMICALLY-SENSITIVE INCOME (modified accrual basis of accounting)
Description FY 2009 FY 2010 DifferenceT13,9o7,ñW Es 12333,983 ThA73237) fl78.4)%
Business license tax 13,388.429 13,505,958Transient occupancy
r
3.671,362 3,673,023
117,529 .9%
1.661tax
__________ _______________________ ________________________
IInvestment income r 8,745,699 fl 5,433,878 “(3,311,821) (37.9)%
Es 39,712,716 E35,346$42r$(4365$68) (11.0)% -
!,ie/uiles appraxiniotelv 53.0 ,,,iIIion in o,,e—iinie increase in the ,i,orket value of ui resn,lenis lie/ti b, the General Fund in FY 2009 and5557.040 increase ,,, IV 2010. a c a result ala 5uhstal,tiai decline in interest ‘vies after the City puirhased the iuvesto,enis. GASB Siaie,ne,,ijVu,n/,er 3? requires that iniesu, cii’s held ‘it year—cud he n,arked- ra—,na,ket. and the ‘unease or decrease in the ma ,ket a/ne of the 11,1 rsune,, isbe added it’ a, subt roe, edfro;n interest income.
Despite the decrease in the financial position of the City’s General Fund in FY 2010. the City ofBerkeley continued to be financially strong and to benefit from par icipation in the Bay Area’sdiverse and stable economy. During FY 2010. the City’s bond rating from Standard and Poors,one of the national rating agencies, remained at AA+; and the rating from Moody’s remained thesame at Aa3.
The City is home to the main campus of the University of California. With over 35,000 studentsand approximately 14,444 employees, the University provides a high degree of economicstability for the City and has spurred growth in the high technology and biotechnology sectors.The Lawrence Berkeley Laboratory also has 3,735 employees, and the Alta Bates MedicalCenter has approximately 3,100 employees. Despite the large student population, the City has anaverage median family income of S91,514.
During the fiscal year, the local economy slumped consistent with regional and national trends.Berkeley’s current economic base consists of approximately 12,000 licensed businessesoperating in the City. These businesses include private manufacturing, technology research, retailand service businesses, educational services, healthcare and social assistance, consulting, artsand entertainment, hospitality services, along with several state, federal, and non-profitinstitutions. These businesses provide employment for 52,000 (down from 53,300 in June 2009),according to the State Economic Development Department. This economic base generated
4
December 28, 2010Presentation of the Comprehensive Annual Financial ReportPage 5
slightly over $5.1 billion in gross business receipts in the 2009 calendar year, up approximately$760 million or 17.5% from $4.34 billion in 2008. Also, the City had over $1.28 billion intaxable sales during the fiscal year, down sharply from the $1.42 billion in FY 2009. In addition,the City’s unemployment rate (as reported by the State of California Employment DevelopmentDepartment) rose from 10.8% in June 2009 to 11.3% in June 2010, compared to 11.5% for theCounty, 12.2% for the state and 9.5% for the U.S.
After increasing from $8.7 billion to $11.9 billion or an average of 6.5%, over the last five years,growth in assessed valuation on secured property slipped significantly in FY 2010, to 1.4% inFY 2010. Despite the slip, assessed value is at a strong level of $105,316 per capita. The tax baseis diverse, with the top ten property taxpayers accounting for slightly more than 5.0% of totalassessed valuation. Residential construction weakened significantly with the estimated value ofpermits totaling S44.137,040 (down from SI 13.415.612 in FY 2009), but commercialconstruction remained at the FY 2009 level with the estimated value of permits issued totaling$40,512,824, versus $40,785,465 in FY2009.
The City takes an active role in guiding economic development to serve the business andresidential community. The City manages a number of programs intended to assist in localbusiness expansion and retention efforts, provides permit assistance to new businesses, seeksappropriate sites, and works directly with Local businesses and merchant organizations toimprove the local business climate. Major implementation programs have also been initiated andare funded, in part, by a grant from the Metropolitan Transportation Commission (MTC),including development of financing programs to pay for street and open space improvements.managing parking for greater efficiency, and the construction of new shared parking facilities asnew development occurs.
Since 1994, the City CoLmcil has resolved to promote environmentally sustainable businesses inBerkeley and formally adopted the Precautionary Principle based on the outcomes of the KyotoAccord.
Community Planning -- City Work Plan. One of the major components of the City’ s efforts todevelop an integrated budget process is the establishment of policy priorities by the CityCouncil. One outcome of this process is an attempt. through the budget, to align City Counciland community expectations with resources available to the City to deliver desired results.
The City Council approves a composite of Citywide Critical Initiatives and Special Projects forthe upcoming fiscal year and reviews its top priorities. Establishment of clear City Councilpriorities helps ensure that certain programs and initiatives receive the management andresources needed to deliver timely results. Council confers with the City Manager and staffregarding priorities and maintenance of the work plan projects.
5
December 28, 2010Presentation of the Comprehensive Annual Financial ReportPage 6
A]JDRESSING LONG-TERM UNCERTAINTIES
The City will be facing higher retirement costs in FY 2012 that may create a General Funddeficit, if steps aren’t taken to address the problem. One of the adopted Council fiscal policies islong-term planning. Staff will continue to review the budget in the context of a 5-year plan.Since staff anticipates significant cost increases in FY 2012, staff will continue to updateprojections for FY 2012 and beyond. The budget development policies frame staff’s approach:
• Multi-year forecasting• Looking for long-term budget balancing strategies-not short-term fixes• Engaging and informing Council early and often• Harvesting good ideas throughout the organization• Streamlining overhead through a flatter organization• Managing unfunded liabilities
In order to address the forecasted $9.6 million deficit in FY 2012, all proposed balancingmeasures for FY 2011 must be implemented on a recurring basis, and additional balancingmeasures totaling at least $4 million must be implemented.
The current proposal is to address this projected shortfall through S2 million in new revenue and$2 million in new recurring expenditure cuts. Increased costs would result in the need for moreexpenditure reductions. Setting aside funds in the Reserve account helps to address economicuncertainties and smooth out sudden and dramatic program reductions.
LONG-TERM DEBT RATINGS
Standard& Poor’s Corporation and Moody’s Investors Service assigned the General ObligationBonds ratings of AA+ and Aa3, respectively, upon their issuance. The City was able to maintainthese ratings in the face of challenges to the local economy and the City’s budgets, due to aproven record of sound fiscal management by the Mayor, City Council and City staff.
SPENDING LIMITATION
Article XIIIB of the California Constitution, also kiown as the GANN spending limit, restrictsthe amount of “proceeds of taxes” California governments may spend. As of June 30, 2010, theCity was $24.1 million or 14.4% under the total Article XIHB (Gann) spending limitation. TheCity was not impacted by the spending limitation in FY 2010 or FY 2011.
MAJOR IMPACTS AND INITIATIVES
1. 311 CALL CENTER
The City has established a centralized 311 Customer Service Call Center to provide first-callresolution for 80% of all routine requests for service and information. Instead of having to figureout which of the City’s 390 published telephone numbers to call, members of the public are ableto simply dial 311 within Berkeley (from outside Berkeley, customers dial 981-CITY to accessthe 3 11 Call Center). Using Community Relationship Management software, trained CustomerService Representatives answer questions, process business transactions, and track service
6
December 28, 2010Presentation of the Comprehensive Annual Financial ReportPage 7
requests and follow-up for all City Departments. This helps free up departmental staff to work onmore complicated, non-routine customer service issues. The 311 Call Center is working toincrease the number of online services accessible via the City’s website, expand the use ofCommunity Relationship Management (CRM) software throughout all City departments, andaugment services provided through the City’s Interactive Voice Response (IVR) system;
2. MAJOR CAPITAL PROJECTS
a. Marina Plati and Waterfront Oven’iew The Parks Recreation & Waterfront Departmentcontinues to work with the Waterfront Commission to refine the Marina Fund financial forecasts.making recommendations to increase fees and reviewing critical Capital Projects. The basis forthese recommendations comes from the Marina Plan, which was adopted by Council on July 8,2003 and continues to guide the division.
The Marina Plan identifies major capital costs associated with maintaining and enhancing theBerkeley Marina and associated parkiands. Since the Marina is funded through an enterprisefund, 100% of the costs associated with its operation and maintenance are funded throughrevenues generated from Marina operations, berth rentals, leases or alternative sources such asgrants or loans. Financial forecasts indicate that shortfalls will occur and that new revenuesources are needed. Without infrastructure improvements, docks will be removed from serviceand the Marina basin may eventually fill with silt.
b. Parks Funding for parks and recreation facilities infrastructure improvements is limited andthe City has developed a greater reliance on outside grant funding. The passage of Measure AA,which is an extension of Measure WW provides funding for major capital projects. In 2008, theCity of Berkeley was allocated $4,876,584 in funding, and in FY 2010, the department hasdeveloped a list of projects to be undertaken.
c. Camps The Parks, Recreation and Waterfront Department is continuously working with theDepartment of Forestry on their recommendations to make the camps compliant. TheDepartment is in the process of completing the Tuolumne Master Plan. which identifies all thenecessary capital improvement. All costs for the operation and maintenance as well as Ihe capitalimprovements come from the Playground Camp Fund, which is directly funded by camp fees. Arecently approved fee increase by the City Council should help alleviate the fund’s projectedfunding shortfall.
L Animal Shelter The City’s Animal Services operations are currently housed at 2013 2nd Street,in a facility that was built in 1940. It is in poor condition, seismically unsafe, suboptimal for themaintaining of healthy animals, and is not conducive for promoting animal adoptions orattracting members of the public to visit. In 2002, Measure I was passed and authorized aGeneral Obligation Bond for $7.2 million for land acquisition and construction of a newmunicipal animal shelter. The City Council appointed a subcommittee composed of members ofthe City Council and the Citizens’ Humane Commission to explore possible locations for a newanimal shelter. Recently, widespread agreement was reached among all stakeholders that thelocation at 1 Bolivar Drive is an ideal location for a new animal shelter facility. It is adjacent toAquatic Park. affords easy access to areas for exercising and socializing animals and is not inclose proximity to any residential uses. The General Obligation Bonds in the amount of $7.2million were issued on January 9, 2008, and the City has bought the property at 1 Bolivar Drive.
7
December 28, 2010Presentation of the Comprehensive Annual Financial ReportPage 8
On April 20, 2010 the City Council authorized the execution and delivery of Certificates ofParticipation in the aggregate principal amount not to exceed $5,750,000 to finance the project,and those Certificates of Participation were issued in May 2010. Construction is expected to becompleted by June 2011.
e. Branch LibrariesAt an election held on November 4, 2008. two-thirds of the voters passed Measure FF,authorizing an amount of $26,000,000 of General Obligation Bonds to provide funds to financerenovations, construction, seismic and access improvements, and expansion of program areas atfour neighborhood branch libraries in the City. The library system provides more than 500,000books, videos, DVDs, cassettes, CDs, books on tape, and microfilm for children and adults.However, the branches are old and out-of-date, and must be improved in order to support theover 800.000 visits made during the year. Most branches have not been renovated in more thanthree decades. The buildings have crowded spaces, suffer from structural and infrastructuraldamage, need to be ADA-accessible, and lack the infrastructure to meet current and futuretechnology needs. The funding will bring the library buildings up to current code standards, meetseismic requirements, make all of the branches fully accessible to Berkeley’s diverse population,provide environmentally sustainable “green” operations. and create adequate space for the ToolLibrary and Berkeley Reads, the adult literacy programs.
3. COMMUNITY EMERGENCY PREPARATION
The following overview describes the City’s comprehensive efforts to reduce risk, to betterprepare for disasters and safety actions taken last year to ensure community safety andpreparedness. Other City efforts include staff training, response preparations, exercises,community preparedness initiatives, local and regional coordination and other preventiveprograms that are underway or are in development.
a. Pre-Disaster Mitigation Efforts The community has the highest per capita investment in riskreduction in California. Since 1989, Berkeley has invested in community sustainability on manyfronts. The City Council established an Office of Emergency Services in July 1989 and convenedthe commission that later became the Disaster Fire and Safety Commission. This leadershipcontinued and acted to make risk reduction and community sustainability a priority.
Thus far, the City’s mitigation efforts include addressing soft-story and masonry earthquakeretrofits, pandemic flu response, global warming, disaster preparedness and response, andvegetation management. The City is also working with multiple departments in updating itsMitigation Plan to mitigate potential risks for all hazards in Berkeley. Hazards includeearthquakes, wildfires. landslides, floods, hazardous materials accidents, terror attacks and othermulti-hazard events.
b. Employee Disasrer Response Train mR Training for City staff is required to meet the mandatesof California Code of Regulations Title 19 Section 2401, 2930 and 2935, and the HomelandSecurity Presidential Directive 5 that requires workers to use the Standardized EmergencyManagement system and the National Incident Management System. All local government staffare designated Disaster Service Workers, according to State law. Consequently, it is critical thatthe City provide adequate training for staff to know their disaster response responsibilities andhave learning opportunities to deepen that knowledge. Keeping training and disaster exercises on
8

December 28, 2010Presentation of the Comprehensive Annual Financial ReportPage 9
the organization’s larger schedule is a challenge when months of advance planning and practicemust be maintained. In FY 2010, the City’s training programs included National IncidentManagement (NIMS) and Incident Command System (ICS) 300 and 400 courses.
c. Community Disaster Preparedness The City has always been a leader in engaging communityand neighborhood groups to be disaster ready. The City offered training classes, madepresentations to the public, updated the City’s website information, and engaged in otheroutreach activities to strengthen disaster preparedness for the Berkeley community. The freeyear-round Community Emergency Response Training (CERT) classes are offered to anyoneliving or working in the Berkeley community and cover basic preparedness. disaster mentalhealth, disaster first aid, fire suppression. light search and rescue, shelter operations. and radiocommunication/incident command system. A consistent number of individuals, about 700.attended at least one CERT class every year.
Berkeley voters approved Measure GG in November of 2008, providing critical resources toensure minimum staffing of all fire suppression companies; enhance the City’s EmergencyOperations Center: and to continue to focus on community preparedness, including resources forCommunity Emergency Response Training (CERT) and community caches. In 2009. the City ofBerkeley opened another application period for disaster cache supplies to be awarded in 2010.These disaster caches will supplement the forty-one already distributed caches throughout theCity and help to bolster the community’s resilience in a disaster.
ci. Response The City uses an emergency notification system to keep people informed duringdisasters. The Berkeley Emergency Notification System (BENS) is a telephone notificationsystem that can contact residents and businesses through an automatic message service center inthe event of an emergency. Berkeley’s emergency radio station is 1610 AM. Over the years, theCity has activated its Emergency Operations Center (EOC) and responded to a number ofdisasters. The most recent disaster was the Oil Spill in November 2007.
e. Recoi’en’ The City’s Finance Department has established procedures and protocols todocument expenditures incurred during disaster operations. These procedures were very effectivefor submitting documentation for FEMA approval for all disaster reimbursements.
.1 Health and Human Service ProRranis The Public Health Division (PH) receives CDC andstate health dept grants (Total: $266,998 in FY 2010) to develop plans for large PH emergenciessuch as bioterrorism or pandemic influenza, to plan for needs of special needs and vulnerablepopulations, and coordinate with health care providers, clinics and hospitals on emergency surgecapacity. Additionally. PH received a total of 55 16,376 in Public Health Emergency Responsefunds from the CDC (a one-time provision) to respond to the HIN1 pandemic. In FY 2010. P1-Icoordinated its response to the H1NI pandemic by activating its PH Departmental OperationsCenter (DOC) in April 09. The DOC remained fully activated for more than 2 weeks, and thenpartially activated from then until February 2010. During the activation, PH planned andconducted two simultaneously-run exercises — a Full Scale Flu Vaccination Exercise for thecommunity and a First Responder Flu Vaccination Exercise (Oct 09). PH has also planned andconducted several mobile H1N1 vaccination clinics in the community (Feb-June 10). and isworking with the Aging Services Division to develop a mass prophylaxis agreement (MOU) inwhich the Meals on Wheels program would be part of the distribution of medication/vaccinations
9
December 28, 2010Presentation of the Comprehensive Annual Financial ReportPage 10
in a public health emergency event. PH has continued collaborating with the Office ofEmergency Services in providing disaster preparedness education and resources to all Berkeleyresidents, particularly in South and West Berkeley.
g. Disaster Fire Protection In the November 2000 election, Berkeley voters approved MeasureQ. which provided $8,000,000 in funding for an Above Ground Portable Water System. Thissystem is designed to provide water for firefighting independent of the domestic water systemprovided by the local water district. The engineering studies of the domestic water systeminfrastructure determined that after a major earthquake or in event of high fire flow demands thatcan occur during wild land/urban firestorms, the system may not be usable or able to supportfirefighting operations. The City has contracted \vith Hydrants Systems located in Holland for apump and hose system that will allow use of salt or fresh water sources like the San FranciscoBay or lakes to provide water for firefighting.
The system includes two 6,000-gpm pumps (HS 900) and six containers each with one mile of12 inch ultra large diameter hose. The pumps and containers can be moved and deployed bytrucks using a lift arm loading system. For more information on the system go to the Hydrantswebsite at Hytrans.com.
Due to unforeseen delays, construction on the 8.000 square foot warehouse will begin in 2010- and both the water system and warehouse should both be operational by the end of 2010.
h. Other Disaster MillRation Efforts The City’s Corporation Yard facility plays a crucial role inthe City’s overall operations and serves as a center for emergency response and disaster recoveryoperations. The building is seismically unsafe. In July 2006, the City was awarded a FEMA PreDisaster Grant for $2.8 million to reconstruct the building to be seismically safe. City matchingfunds of $962.633 is required by FEMA. The project design has been completed andconstruction began in August of 2010.
4. ECONOMIC DEVELOP’WNT
Berkeley’s economic development strategy seeks to build on existing strengths to accomplishgoals that have been identified by the City Council and citizen planning processes:
a Revitc,lfte Down town Berkeley mid strcn!hen its role in the local and rekional econonn’.Despite the nation’s recent economic challenges, the Downtown Arts District continues to buildon its success in attracting regional nighttime attendance. In 2009, the Berkeley RepertoryTheatre bucked national trends by increasing subscriber numbers and total attendance (180,000).Also in the 2010 fiscal year, the new $12 million, 440 seat “Freight and Salvage” musicalperformance venue opened in the Arts District across from the Berkeley Repertory Theatre.New quality restaurants have been attracted to the Downtown, including “Gather” in the newDavid Brower nonprofit office building and Revival Restaurant and Bar, just one block from theBerkeley Repertory and Aurora Theaters. Additions to the housing stock in the Downtowninclude 143 new condo units at the Arpeggio project on Center Street that are scheduled to becomplete by the autumn of 2010 and 148 units of rental housing on the NW corner of Universityand Martin Luther King Jr. Way that opened in June 2010. That project also included a new
10
December 28, 2010Presentation of the Comprehensive Annual Financial ReportPage 11
Trader Joe’s grocery store to meet the shopping needs of existing and future residents of the area.The City and the University recently completed a Downtown planning process that will allow theUniversity to build 800,000 square feet of new office, research and public service space on thewest side of the campus. The first such project, Helios West, a 112,800 square foot building thatwill house the Energy Biosciences Institute, is now under construction on a site bounded byOxford, Berkeley Way, Shattuck and Hearst. The City and the University are also continuingto work together to build a new hotel and conference center and relocate the Berkeley ArtMuseum/Pacific Film Archive to a new facility in the Downtown that will cost in excess of $60million. The historic Shattuck Hotel underwent a complete $20 million renovation of its 200hotel rooms and reopened in June 2009.
I,. Strengthen neiQhborhood commercial districts such as Solano. Ehnwood. Telegraph. FourthStreet. San Pablo. North Shattuck and University Avenue. The City seeks to encourage shoppingopportunities close to residential neighborhoods, which reduces the need to drive. Efforts areunderway to support expansion of district-based niche marketing campaigns that recognize localstrengths and “district identity”. The City facilitates four business improvement districts (BIDs)in the Downtown. Telegraph. Elmwood, and North Shattuck commercial districts that generatefunds through a self assessment to help promote and maintain their districts.
The Office of Economic Development also contracts with a community-led “Buy LocalBerkeley” initiative which is currently also fiscally supported by the Downtown BerkeleyAssociation. The effort uses multiple communication channels to encourage residents to shop atlocal, independent businesses to retain money and tax revenues in the community. Buy LocalBerkeley has over 400 affiliated businesses and over 5,000 subscribers to its electronicnewsletter.
c. Suppart creation of good fobs for local residents. While about 25% percent of the jobs inBerkeley are in the public sector (14,444 at UC Berkeley. 3.735 at LBL. 1.600 City of Berkeley.1,200 Berkeley Unified School District. 300 Berkeley City College). about 39,836 are in theprivate sector (l quarter 2009). Large private sector employers include Alta Bates SummitMedical Center (Alta Bates and Herrick campuses) with 3,100, the Bayer Corporation with1,659, Kaiser Permanente with 700 and Pacific Steel Casting with 600. However, more than 85%of Berkeley’s 3300 private employers have fewer than 20 employees, Berkeley’s strong sectorsinclude biomedical! biopharmaceutical, computer systems design services, printing andpublishing, environmental consulting services, and arts and entertainment. More than 300“Green” businesses (i.e., businesses that either help the environment or enterprises that haveinstituted environment-friendly practices) have located in Berkeley. The City’s Work Sourceemployment program requires certain new and expanding businesses to consider Berkeleyresidents first in their hiring. In December 2009, the City’s local hiring efforts werestrengthened when the State of California extended its Enterprise Zone program to WestBerkeley, the area bounded by San Pablo Avenue on the east, the 1-80 Freeway on the west,Oakland on the south and Albany to the north. The 800 employers in this area are eligible forState tax credits for new hires of eligible workers and for qualified purchases of new equipment.
d. Increase technology transfer from UC Berkeley and Lawrence Berkeley National Laboratonand encourage startups in the Downtown and West Berkeley. During the last two fiscal years,federal, state and private sources have provided more than a billion dollars in new funding forresearch at UC Berkeley and Lawrence Berkeley National Laboratory in areas that are national
11
December 28. 2010Presentation of the Comprehensive Annual Financial ReportPage 12
priorities such as biofuels, energy conservation,, advanced telecommunications and biomedicalengineering. Even more than in the past, Berkeley has the opportunity to attract local startupsthat are commercializing new technology as well as attract national companies to set up researchcenters in Berkeley. These companies benefit from the City’s entrepreneurial climate and frominteraction with UC faculty and graduate students. The City is working with developers to makecertain that appropriate workspace will be available for the startups that will result from newresearch initiatives in growing sectors such as biofuels.
e. Generate GIS-based economic data to inoizitor and analyze local business trends and help fillconlnjercja( vacancies. Economic Development staff has completed a complete GIS groundfloor space inventory in all the City’s commercial districts. This effort has proven very valuableas an analytic tool and the results have enabled staff to generate reports that outline and assesssectoral and sub-secroral trends within specific commercial neighborhoods. Staff have alsocompleted a GIS-based inventory and contact listing of all commercial spaces within 5 blocks ofthe U.C. Berkeley Campus in order to attract and incubate new companies emerging from theUniversity and Lawrence Berkeley National Lab. In coordination with the Telegraph andDowntown BIDs, staff is now sponsoring a website that will show all vacant commercial spacein the City. Staff is also exploring ways to generate similar data for the West Berkeley industrialarea.
f Market Berkeley’s visitor appeal and support Berkeley’s Hotel/Motel Industn’. The Cityprovides annual support to the Berkeley Convention and Visitors’ Bureau for its comprehensivemarketing efforts aimed at promoting local tourism and hospitality services. The BerkeleyConvention and Visitors’ Bureau also runs the Berkeley Film Office that markets the City to thefilm and television industry
g. Build on Berkeley’s strength as a regional hub of arts and culture. More than 130 arts andcultural organizations comprise an arts community that collectively is among the largestemployment sectors in Berkeley. The arts provide some 3.400 jobs. reach an annual audience of1.7 million people, and have a combined budget of 570 million. Arts, culture, entertainment andrestaurants help drive the City’s economic engine. In addition, the City promotes the arts and hashelped established the Downtown as a regional center for the arts, culture and entertainment. TheAddison Street Ails District is now a major venue for theatre perfonnances and includes the 160-seat Aurora Theatre, the original Berkeley Repertory’s 400-seat theatre, the BerkeleyRepertory’s 600-seat Roda Theatre, the Jazz school (a nationally recognized school for jazzperformance and study) and the completion of a new 400 + seat venue for the Freight & Salvage.The Berkeley Poetry Walk was installed in the sidewalks on Addison Street, and pubhc artprojects continue to appear in the Downtown and adjacent areas of Berkeley. Berkeley’seconomic development strategy seeks to build on existing strengths to accomplish goals thathave been identified by the City Council and citizen planning processes.
5. CLIMATE ACTION PLAN
In November 2006, 81 percent of Berkeley voters endorsed Measure G, which set the goal ofreducing the community’s greenhouse gas emissions by 80 percent by 2050. The Measure alsodirected the Mayor to develop a Climate Action Plan to reach that target.
12
December 28. 2010Presentation of the Comprehensive Annual Financial ReportPage 13
The Berkeley Climate Action Plan was adopted by City Council on June 2, 2009. The Planguides the development, enhancement, and ultimately the implementation of actions thataggressively cut Berkeley’s greenhouse gas emissions. The Plan includes the following:
6. An inventory of Berkeley’s main greenhouse gas emissions sources7. A forecast of how those emissions are expected to change over time8. Recommendations for actions the City government and community can implement to achieve
greenhouse gas reductions and other community benefits such as increased green jobopportunities and improved public health
9. A tirneline for the Plan’s impletnentation. including identifying existing and potential costsand funding sources
Initial implementation of the Plan during the first year after adoption has taken three main forms:(1) Establishing several progress indicators that better enable staff to transparently monitor
and report progress toward achieving the Plan’s goals. These metrics are available onlineat www.citvofberkeley.info/climate
(2) Specific program and policy development and launch, such as the Money for EnergyEfficiency rebate program for Berkeley residents and businesses
(3) Securing grant funds to suppor CAP implementation. The City has secured over $6million in Climate Action Plan-related grant funding between 2009 and the present.
Using the Climate Action Plan as a guide, the City will continue to advance efforts to reducelocal greenhouse gas emissions and achieve other associated benefits.
6. BERKELEY REDEVELOPMENT AGENCY
The Berkeley Redevelopment Agency adopted new Five-Year Implementation Plan for WestBerkeley and Savo Island on December 8. 2009, authorizing completion of the expenditure of theremaining bond proceeds and net available tax increment funding to complete capital projectsincluding the Aquatic Park Connection (APC) and a list of 15 West Berkeley CirculationImprovement projects identified in the West Berkeley Circulation Master Plan Report andprioritized by the APC for Agency action.
Refinancing of Agency debt triggered new pass through payments in FY 2006 of tax incrementto other taxing entities. The highest supplemental Educational Revenue Augmentation Fund(SERAF) payments were demanded in FY 2010 and upheld by the Courts, though now subject toan appeal. Additional ERAF payments required by the state in FY 2009 were refunded after asuccessful court challenge by local redevelopment agencies. As such, the Fiscal Year 2010-2014Implementation Plans accounted for limited funding. assuming the projected takes in FY 2010and FY 2011, as well as the alternatives should the SERAF take be invalidated by the Courts.
As pail of the bond refinancing actions, the Agency Board passed resolutions to extend theability of the Agency to collect tax increment revenue in West Berkeley through December 31,2015. Savo Island Project Area extends to 2026.
13
December 28. 2010Presentation of the Comprehensive Annual Financial ReportPage 14
U Active Projects — West Berkeley
The FY 2010-2014 West Berkeley Implementation Plan proposes tax increment and bondproceeds to implement the following projects in FY 2010 and FY 2011:
Aquatic Park Connection The Aquatic Park Connection is a set of pedestrianand bike enhancements within the public right of way between the West BerkeleyRedevelopment Project Area and the new 1-80 Bicycle and Pedestrian Overpassthat joins Aquatic Park to the Marina. Although this proposed project extendsoutside of the West Berkeley Project Area, the Agency has identified it as adevelopment project that will enhance the overall Redevelopment Area, as well asthe immediate Rail Stop and Transit Plaza area. The total estimated project cost is$4 million, with the Agency initially allocating $989,000 for the design andconstruction of priority elements. With the revised Implementation Plan in FY2006. the Agency allocated S1.4M to APC design and construction of priorityimprovements, adding undergrounding to the preliminary components for FY2010 Agency construction. Wayfinding signage included in this project wasdesigned in FY 2007, manufactured at the end of FY 2009 and installed in FY2010. A construction crew was contracted and undergrounding specifications(revised to including the now adjacent Berkeley Animal Shelter) were completedin FY 2010. and construction is expected to begin in FY 2010 and completed inFY 2011.
Agency-sponsored construction of streetscape improvements and undergroundingis targeted to the west end of Addison at Aquatic Park’s north entrance and therail crossing on Addison. Adjacent proposed development is responsible foradjacent streetscape development, compliant with the Master Plan’s design. Thiswill significantly reduce the gap in funding for the Agency, leaving pockets ofunimproved areas that may be fundable with grant sources. The first compliantproject was completed in FY 2009 including all the APC streelscape elements andmanufacturing of unique design elements such as bike rack/tree guards, seat wallswith Ohlone weaving design elements, and skate stoppers. Two additional blocksare finalizing construction at the end of FY 2010 with the completion of privatedevelopment at the corner of Addison and Fourth Streets.
• West Berkeley Circulation Master Plan Report, Oulet Zone and Seed MoneyPrioritization - In FY 2008, the Agency contracted with Wilbur Smith andAssociates to complete a comprehensive multimode West Berkeley CirculationMaster Plan (WBCMP) Report for West Berkeley with City support forgeography extending beyond the Project Area. The WBCMP Report’s area isbounded by San Pablo Avenue to West Frontage Road and Albany andEmeryville borders. The WBCMP Report included a description of existing andfuture conditions, a ranked capital improvements list, Implementation PlanReport, Transportation Demand Management Report, Financing Strategy andImprovement Plan. The City also received a simulation model to be used inanalyzing development in the Project Area and in areas proximate to the ProjectArea. A Feasibility Study for a Quiet Zone (QZ), in which trains do not blowhorns at vehicle crossings. was also commissioned. The WBCMP Report and QZ
14
December 28, 2010Presentation of the Comprehensive Annual Financial ReportPage 15
Study identified prioritized needs for $55M and up to $10.5M in their respectivereports.
The FY 2010-2014 Implementation Plan included $200,000 for the transportationanalysis of an Environmental Impact Report (EIR) of the West Berkeley Project(a separate land use project of the City’s Planning and Development Department)that requires updating of the land use assumptions of the WBCMP Report for it toremain a current analytic tool. Further, the Agency supported use of $8,500 of theseed money for a Nexus Study for a West Berkeley Transportation Services Fee.Finally, the PAC recommended and the Agency adopted recommendations forcapital projects to be prioritized for the remainder of the seed funds ($271,500).
• WB Circulation Improvement Projects - The FY 2010-2014 ImplementationPlan identified up to $659,500 for circuthtion improvements in West Berk&eyprioritized in the WBCMP Report and directly affecting multi-modal access to theProject Area. The projects recommended for implementation include:
Truck/Auto• Addlupdate truck routing signage to existing truck routes inside and
outside the Project Area on Ashby, Oilman. University, San Pablo, andadd 2nd St and 6thl7th St to the truck route network with signageincluded in implementation
• Implement a leading protected left phase for NB traffic at San Pablo andDwight
• Create additional NB/SB left turn lane along 6th at Channing• Create additional EB/WB lane along Allston Way at• Add EB right turn pocket (—100’) at Hearst and 6th
Pedestrian Enhancements
• Improve pedestrian crossings along University (6th to 10th) - to addsidewalk bulbs. ADA compliant pedestrian refuges, directional curbramps, truncated domes, signal countdown heads, audible crosswalks andimproved crossing times on University Avenue between 6th and 10thStreets.
• Pave sidewalks in Northwest Berkeley residential areas lacking existingsidewalks including:
o adjacent to James Kenney Park on 7th and 8th (between Virginiaand Delaware),
o 9th Street between Cedar and Page,o west side of 8th between Camelia and Oilman.o along east side of 7th between Camelia and Harrison, ando along Harrison between 7th and 8th
• Improve pedestrian crossings including directional pedestrian curb rampsand installation of audible signals along San Pablo at Oilman. Cedar,University, Dwight and Ashby
• Install additional audible signals along San Pablo at Delaware, Allston,and Grayson as well as at 6th and Hearst
15
December 28. 2010Presentation of the Comprehensive Airnual Financial ReportPage 16
Remove pedestrian actuation from controller at University and San Pabloand make pedestrian walk phase with audiMe signal automatic on all legs(staff note night phasing may need to be varied from day light hours)
• Improve pedestrian crossings along Oilman between 5th and 10th toinclude pavement striping, perpendicular curb ramps and truncated domeswhere appropriate and needed
Bicycle Enhancements
• Apply bike intersection treatment 1 (signage and striping) to key arterialscrossing the 9th Street Bike Boulevard at Cedar, Dwight and Heinz
• Connect Virginia and Channing bike boulevards to bike bridge bydesignating 4th Street (between Hearst and Channing), 5th Street (betweenVirginia and Hearst), and Hearst (between 5th and 4th Streets) as bikeboulevards
Transit Enhancements
• Improve the Transit Stops on University from 6th to 10th Streets based onSan Pablo Corridor bus stop guidelines (Type A, C. D. and E stops).
• Improve lighting and shelters at San Pablo bus stops at Cedar and Virginia
These projects were funded with $271,500 in FY 2010, as discussed above.camed forward for expenditure with an additional 5388,000 (allocated in FY2011) for implementation in FY 20 11 and funds were transferred from theAgency to the City of Berkeley. In FY 2011, Public Works will implement thoseprojects among these that are feasible with the available funding.
L Active Projects — Savo Island
The FY 2010-2014 Savo Island Implementation Plan proposes tax increment revenue raised inFY 2010-2014 be used to accelerate debt repayment. as the tax increment financing limitapproaches, and with the remainder, continue support of the Savo Island Housing Cooperative.The Coop was loaned $130,000 by the Agency for pre-development costs associated with amajor rehabilitation effort funded by HUD in FY 2010.
7. LEGISLATIVE IMPACTS
• Passage of the State’s FY 2011 Budget: Through the State budget process, the Statecan enact legislation that significantly impacts the source, amount and timing of thereceipt of revenues by local agencies, including the City. After taking major hits torevenue and cash flow from the passage of the State’s FY 2010 budget on July 28,2009, staff expects more pain from the State’s FY 2011 budget. The Governor issuedthe FY 2011 “May Revise” on May l4tN That addressed a projected $17.9 billion gapwith $19.1 billion in solutions, including a $1.2 billion reserve. The budget drasticallycuts critical social programs, including eliminating CaIWORKS and state-fundedchildcare. reducing and changing MediCAL benefits, and slicing Mental Healthrealignment by 60%, which would be a $1.2 million hit to Berkeley programs based
16
December 28, 2010Presentation of the Comprehensive Annual Financial ReportPage 17
on current revenues. In addition, the Senate and Assembly have adopted a new $3surcharge on parking violations as a part of the FY 2011 State budget. The surcharge.which will be included in a pertinent budget trailer bill, would go into effect onOctober 1. 2010. The delayed implementation is intended to provide localgovernment entities with sufficient time to retool their computer systems toaccommodate the surcharge. Staff is reviewing the impact to Berkeley and whetherthe City has the ability to further increase its parking fines to cover this additionalState burden on parking fine revenue. A loss of $3 per citation would result in a lossof revenue to the General Fund of $850,000-S 1,000,000. This will either result in anincrease in the parking fines to cover the loss of funds or additional General Fundbudget reductions to absorb the $3 per citation surcharge.
AWARDS
The Government Finance Officers Association (GFOA) awarded a Certificate of Achievementfor Excellence in Financial Reporting to the City for its Comprehensive Annual Financial Reportfor the fiscal year ended June 30, 2009. In order to receive this prestigious award of theCertificate of Achievement, the government must publish and submit such report to the GFOAfor their evaluation. This report satisfied both generally accepted accounting principles andapplicable legal requirements. A Certificate of Achievement is valid for a period of one yearonly. We believe that our current comprehensive annual financial report continues to fulfill theCertificate of Achievement Program’s requirements and we are submitting it to the GFOA todetermine its eligibility for another certificate.
The City also received the GFOAs award for Distinguished Budget Presentation for thebiennium (two-year period) beginning July 1, 2009. We believe that our cunent budget continuesto conform to program requirements and we have submitted it to the GFOA to determine itseligibility for another award.
17
December 28. 2010Presentation of the Comprehensive Annual Financial ReportPage 18
ACKNOWLEDGMENTS
The preparation of this report could not be accomplished without the efforts of the followingindividuals: The Accounting Manager, Marvin Tam, the Project Lead, Victor Lo and the entireAccounting Division of the Finance Department; the accounting firm of Caporicci & Larson,Inc., and the continued support of sound financial management by Mayor Torn Bates and theCity Council, the City Manager, Phil Kamlarz, and his staff particularly the Budget Manager,Tracy Vesely.
Due to the efforts of the entire City staff, the City’s accounting and financial reporting systemscontinue to improved along with the quality of the information being reported to our citizens, theCity Council, Department heads and managers, bond-holders, Federal, State and countyagencies, and to other users of the City’s financial reports.
Respect,M-l mitted,
/2½Robert HicksDirector of Finance
18
Certificate ofAchievementfor Excellence
in FinancialReporting
Presented to
City of Berkeley
CaliforniaFor its Comprehensive Annual
Financial Report
for the Fiscal Year Ended
June 30, 2009
A Certificate of Achievement for Excellence in FinancialReporting is presented by the Government Finance Officers
Association of the United States and Canada togovernment units and public employee retirement
systems whose comprehensive annual financialreports (CAFRs) achieve the higheststandards in government accounting
and financial reporting.
President
Executive Director
__
CITY
9bR
KE
LY
Q9V
rRM
[IEtIT
STRU
CTUR
t1
_
2010
CITI
ZEN
S
‘IE
LE
CT
C
AP
PO
INT
ME
NT
City
Man
ager
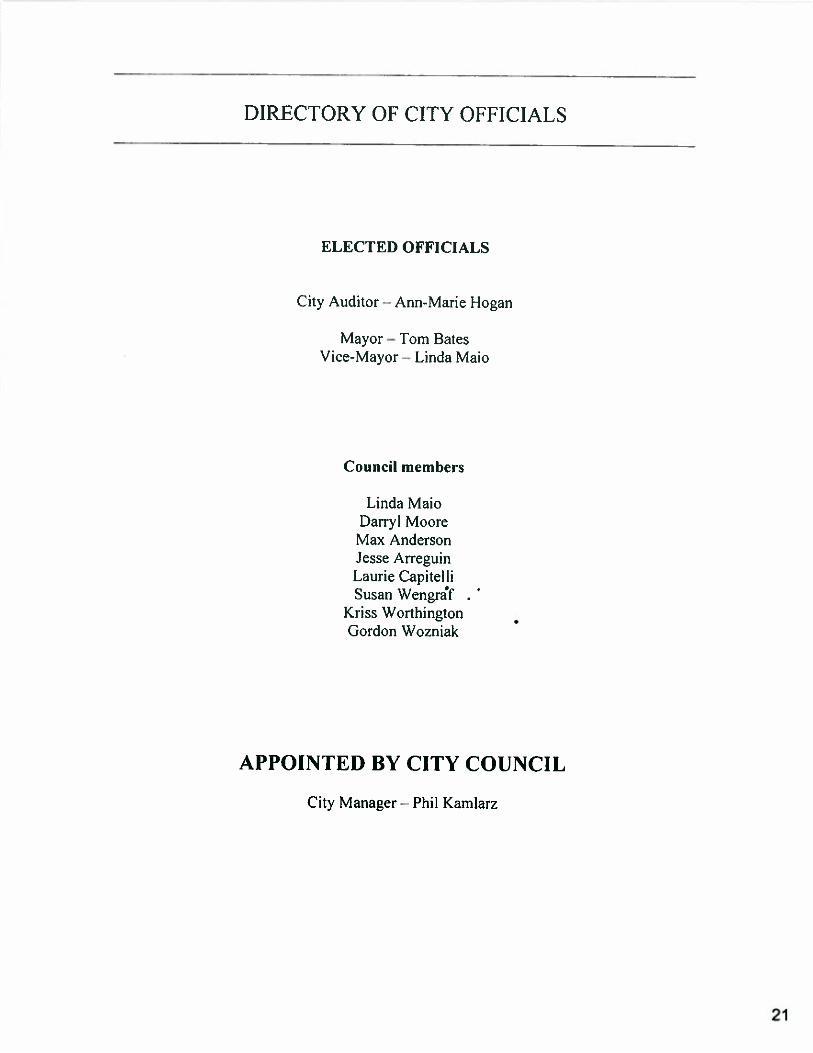
DIRECTORY OF CITY OFFICIALS
ELECTED OFFICIALS
City Auditor — Ann-Marie Hogan
Mayor — Tom BatesVice-Mayor-- Linda Maio
Council members
Linda MaioDarryl MooreMax AndersonJesse ArreguinLaurie CapitelliSusan Wengrf
Kriss WorthingtonGordon Wozniak
APPOINTED BY CITY COUNCIL
City Manager— Phil Kamlarz
21
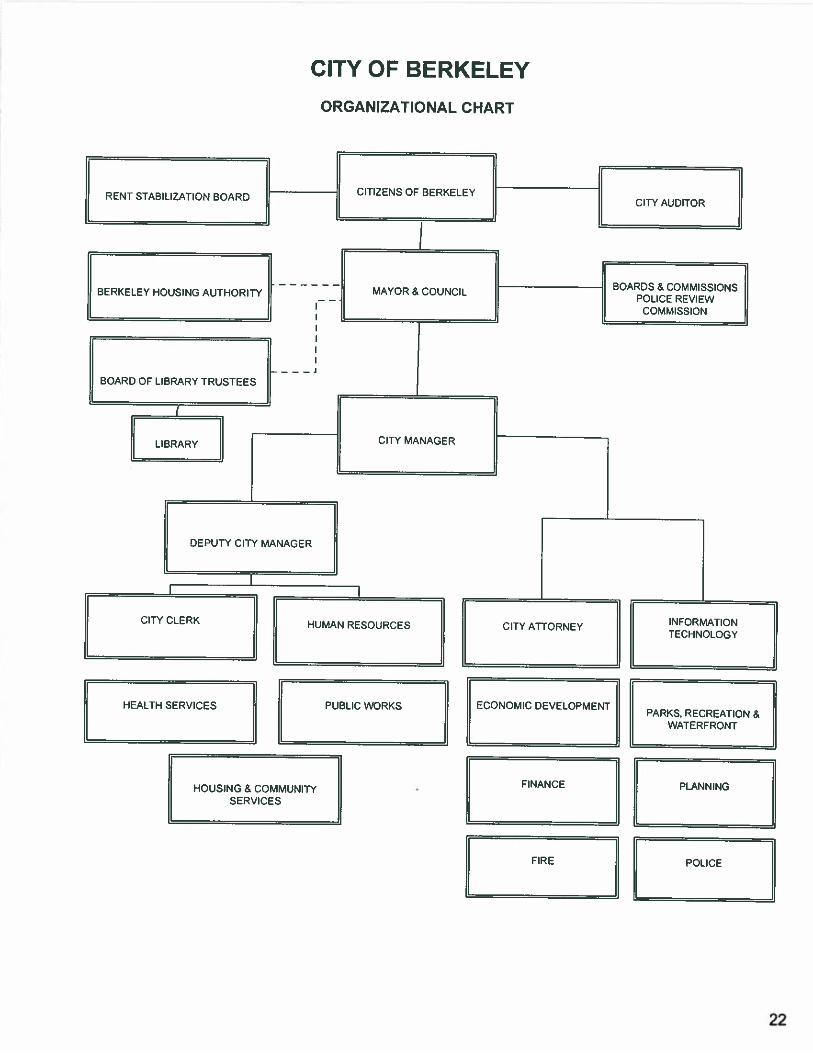
CITY OF BERKELEY
ORGANIZATIONAL CHART
PUBLIC WORKS ECONOMIC DEVELOPMENTPARKS, RECREATION &
WATERFRONT
FINANCE
FIRE
BERKELEY HOUSING AUTHORITY
BOARD OF LIBRARY TRUSTEES—J
LIBARY j
HEALTH SERVICES
HOUSING & COMMUNITYSERVICES
PLANNING
22
01Caporicci & Larson. Inc.A Subsidiary ofMarcuni LLPCertified Public Accountants
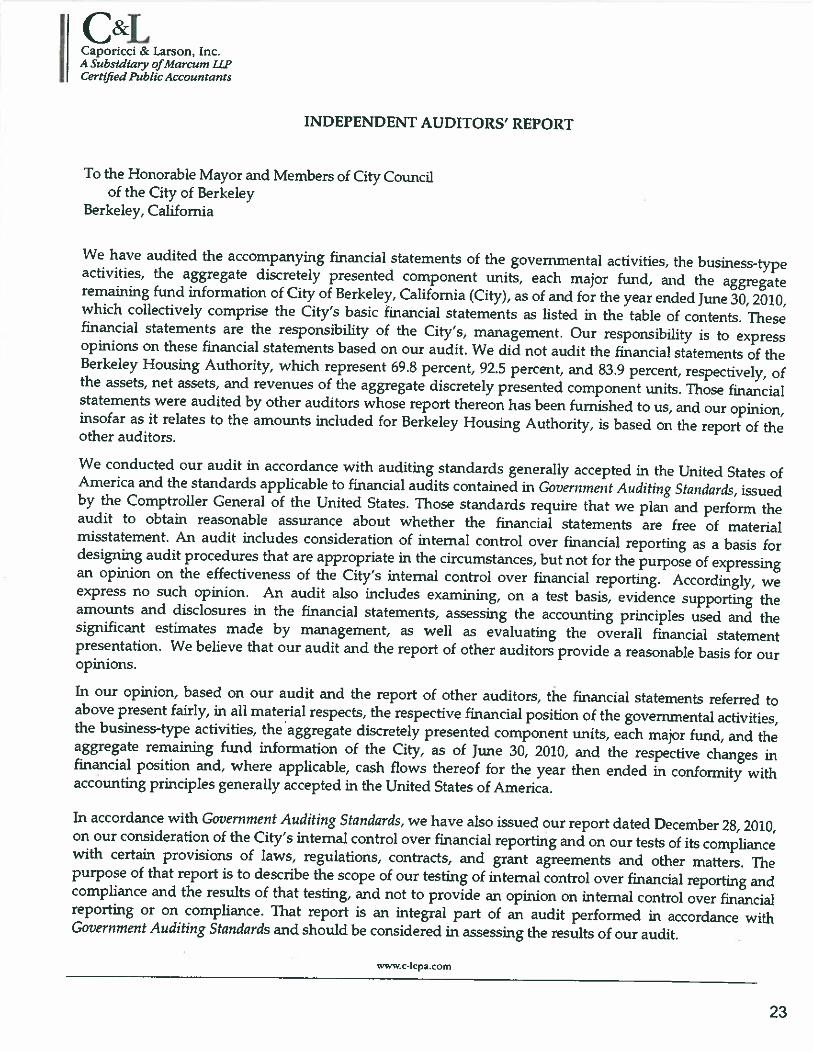
INDEPENDENT AUDITORS’ REPORT
To the Honorable Mayor and Members of City Councilof the City of Berkeley
Berkeley, California
We have audited the accompanying financial statements of the governmental activities, the business-typeactivities, the aggregate discretely presented component units, each major fund, and the aggregateremaining fund information of City of Berkeley, California (City), as of and for the year ended June 30, 2010,which collectively comprise the City’s basic financial statements as listed in the table of contents. Thesefinancial statements are the responsibility of the City’s, management. Our responsibility is to expressopinions on these financial statements based on our audit. We did not audit the financial statements of theBerkeley Housing Authority, which represent 69.8 percent, 92.5 percent, and 83.9 percent, respectively, ofthe assets, net assets, and revenues of the aggregate discretely presented component units. Those financialstatements were audited by other auditors whose report thereon has been furnished to us, and our opinion,insofar as it relates to the amounts included for Berkeley Housing Authority, is based on the report of theother auditors.
We conducted our audit in accordance with auditing standards generally accepted in the United States ofAmerica and the standards applicable to financial audits contained in Government Auditing Standards, issuedby the Comptroller General of the United States, Those standards require that we plan and perform theaudit to obtain reasonable assurance about whether the financial statements are free of materialmisstatement. An audit includes consideration of internal control over financial reporting as a basis fordesigning audit procedures that are appropriate in the circumstances, but not for the purpose of expressingan opinion on the effectiveness of the City’s internal control over financial reporting. Accordingly, weexpress no such opinion. An audit also includes examining, on a test basis, evidence supporting theamounts and disclosures in the financial statements, assessing the accounting principles used and thesignificant estimates made by management, as well as evaluating the overall financial statementpresentation. We believe that our audit and the report of other auditors provide a reasonable basis for ouropinions.
In our opinion, based on our audit and the report of other auditors, the financial statements referred toabove present fairly, in all material respects, the respective financial position of the governmental activities,the business-type activities, the ‘aggregate discretely presented component units, each major fund, and theaggregate remaining fund information of the City, as of June 30, 2010, and the respective changes infinancial position and, where applicable, cash flows thereof for the year then ended in conformity withaccounting principles generally accepted in the United States of America.
In accordance with Government Auditing Standards, we have also issued our report dated December 28, 2010,on our consideration of the City’s internal control over financial reporting and on our tests of its compliancewith certain provisions of laws, regulations, contracts, and grant agreements and other matters. Thepurpose of that report is to describe the scope of our testing of internal control over financial reporting andcompliance and the results of that testing, and not to provide an opinion on internal control over financialreporting or on compliance. That report is an integral part of an audit performed in accordance withGovermnent Auditing Standards and should be considered in assessing the results of our audit.
wwwc’Icpa .com
23
To the Honorable Mayor and Members of City Councilof the City of Berkeley
Berkeley, CaliforniaPage Two
The Management Discussion and Analysis and the Required Supplementary Information on pages 25 to 44and pages 131 to 140, are not a required part of the basic financial statements, but are supplementaryinformation required by accounting principles generally accepted in the United States of America. We andthe other auditors have applied certain limited procedures, which consisted principally of inquiries ofmanagement regarding the methods of measurement and presentation of the required supplementaryinformation. However, we did not audit the information and express no opinion on it.
Our audit was conducted for the purpose of forming opinions on the financial statements that collectivelycomprise the City’s basic financial statements. The introductory section, combining and individual fundstatements and schedules and the statistical tables are presented for purposes of additional analysis and arenot a required part of the basic financial statements. The combining and individual fund statements andschedules have been subjected to the auditing procedures applied by us and the other auditors in the auditof the basic financial statements and, in our opinion, based on our audit and the report of other auditors, arefairly presented in all material respects in relation to the basic financial statements taken as a whole. Theinformation identified in the table of contents as the introductory and statistical sections have not beensubjected to the auditing procedures applied in the audit of the basic financial statements, and, accordingly,we express no opinion on them.
ówia, .
Caporicci & Larson, Inc.San Francisco, CaliforniaDecember 28, 2010
24
MANAGEMENT’S DISCUSSION AND ANALYSIS
As management of the City of Berkeley, we offer readers of the City of Berkeley’s financialstatements this narrative overview and analysis of the financial activities of the City of Berkeley forthe fiscal year ended June 30, 2010. We encourage readers to consider the information presentedhere in conjunction with additional information that we have furnished in our letter of transmittal,which can be found on pages 1-18 of this report. All amounts, unless otherwise indicated, areexpressed in millions of dollars.
Financial Highlights
• The City’s assets exceeded its liabilities (net assets) by $406.2 million at the close of the fiscalyear ended June 30, 2010. Included in this amount was a balance of $40.5 million inunrestricted net assets. Unrestricted net assets are net assets that may be used to meet the City songoing obligations to citizens and creditors.
• During the year, the City’s total net assets increased by $0.7 million from $405.5 million to$406.2 million. Governmental activities revenues increased by $5.5 million while governmentalactivities expenses increased $5.4 million. Business-type activities revenues decreased by $0.3million, while business activities expenses decreased by $1.2 million.
• As of June 30, 2010 the City’s governmental funds repor ed a combined ending fund balance of$156.9 million, an increase of $9.5 million. Approximately 45.8% percent of this total amount($71.8 million) is available for spending at the government’s discretion unresen’ecl fundbalance).
• The total cost of all City programs increased by $4.2 million from $288.6 to $292.8 million.This was accounted for primarily by increases (decreases) of $0.3 million in GeneralGovernment, $1.2 million in Public Safety, $0.7 million in Highways and Streets. ($6.0) millionin Health and Welfare, $4.5 million in Community Development/Housing, $2.0 million inCulture and Recreation, $1.8 million in Economic Development, $0.9 million in Interest onlong-term debt, ($0.6) million in Refuse Service, ($0.2) million in Parking-related, $0.4 millionin Marina operations and maintenance, $0.2 million in Sewer services. $0.1 million in Cleanstorm water, and ($1.1) million in Permit Service Center.
• At June 30. 2010 unreserved fund balance for the General fund was $37.2 million or 27.1% ofFY20 10 total General fund expenditures and transfer out.
• The City’s total long-term debt increased by $14.1 million during the current fiscal year. Thisincrease was accounted for by the following: (1) Proceeds and premium from the AnimalShelter Certificates of Participation issue of $5,750,000 and $402,855 respectively; (2) principalpayments of ($5,462,011); (3) increase in claims and judgments payable of $493,320: (4)increase in workers compensation payable of $2,196,000; (5) increase in compensated absencespayable of $665,812; (6) increase in loan proceeds of $6,000,000 for HUD Section 108 loan forEd Roberts Campus and 52.359.801 for Harbor Construction ; (7) Decrease in capital leaseobligations of ($362,015) (8) increase in other postemployment benefit obligation of $204,077,and (9) increase in net pension obligation of Police Retirement Income Benefit Plan of51,849.063.
Overview of the Financial Statements
This discussion and analysis is intended to serve as an introduction to the City of Berkeley’s basicfinancial statements. The City’s basic financial statements are comprised of three components: I)government-wide financial statements, 2) fund financial statements. and 3) notes to financialstatements. This report also contains other supplementary information in addition to the basicfinancial statements themselves.
25

Government-wide financial statements. The govennneni-uide financial statements are designedto provide readers with a broad overview of the City’s finances, in a manner similar to a privatesector business.
The statement of net assets presents information on all of the City’s assets and liabilities, with thedifference between the two reported as net assets. Over time, increases or decreases in net assetsmay serve as a useful indicator of whether the financial position is improving or deteriorating. Youwill need to consider other nonfinancial factors, such as changes in the City’s property tax base andthe condition of the City’s roads, to assess the overall health of the City.The statement of activities presents information showing how the government’s net assets changedduring the fiscal year. All changes in net assets are reported as soon as the underlying event givingrise to the change occurs, regardless of the timing of related cash flows. Thus, revenues andexpenses are reported in this statement for some items that will only result in cash flows in futurefiscal periods (e.g., uncollected taxes and earned but unused vacation leave).Both of the government-wide financial statements distinguish functions of the City that areprincipally supported by taxes and intergovernmental revenues from other functions that areintended to recover all or a significant portion of their costs through user fees and charges(business-tjpe activities). The governmental activities of the City include all of the City’s basicservices that are considered to be governmental activities: general government, public safety.highways and streets, health and welfare, culture-recreation. community development/housing andeconomic development. Property taxes, business license taxes, transient occupancy taxes, salestaxes, utility users’ taxes, ambulance fees and franchise fees finance most of these activities. Thebusiness-type activities of the City include a Parking related operation, a Clean Storm Wateroperation, a Marina. a Sanitary Sewer operation, a Refuse Collection and Disposal operation. aPermit Service Center, and Building Purchases and Management.The government-wide financial statements include not only the City itself (known as the primarygovernmcnt). but also a legally separate Rent Stabilization Board and Housing Authority for whichthe City is financially accountable. Financial information for these component units are reportedseparately from the financial information presented for the primary government itself. The BerkeleyRedevelopment Agency, although also legally separate, function for all practical purposes as adepartment of the City of Berkeley, and therefore has been included as an integral part of theprimary government
The government-wide financial statements can be found on pages 46-47 of this report.
Fund financial statements. A/iendis a grouping of related accounts that is used to maintain controlover resources that have been segregated for specific activities or objectives. The City of Berkeley.like other state and local governments, uses fund accounting to ensure and demonstrate compliancewith finance-related legal requirements. Some funds are required to be established by State law andby bond covenants. However, the City Council establishes many other funds to help it control andmanage money for particular purposes or to show that it is meeting legal responsibilities for usingcertain taxes, grants, and other money. All of the funds of the City of Berkeley can be divided intothree categories: governmental, proprietary, and fiduciary
s Governmental funds—Governmental fiends are used to account for essentially the samefunctions reported as governmental activities in the government-wide financial statements.However, unlike the government-wide financial statements, governmental fund financialstatements focus on near-term inflows and outflows of spendable resources, as well as onbalances of spendable resources available at the end of the fiscal year. Such information may beuseful in evaluating a government’s near-term financing requirements.Because the focus of governmental funds is narrower than that of the government-wide financialstatements, it is useful to compare the information presented for governmental fiends withsimilar information presented for governmental activilie.v in the government-wide financialstatements, By doing so, readers may better understand the long-term impact of thegovernment’s near-term financing decisions. Both the governmental fund balance sheet and thegovernmental fund statement of revenues, expenditures, and changes in fund balances provide a
26
reconciliation to facilitate this comparison between gorerninentcil fiends and governmentalactivities.
The City of Berkeley maintains 83 individual governmental funds. Information is presentedseparately in the governmental fund balance sheet and in the governmental fund statement ofrevenues, expenditures, and changes in fund balances for the General fund, Grant fund. Libraryfund, CDBG hind, Park Tax fund, Measure FF Branch Renovation, and Capital Improvementsfund, all of which are considered to be major funds. Data from the other 76 governmental hindsare combined into a single, aggregated presentation.
The City of Berkeley adopts an annual appropriated budget for its General fund, special revenuehinds (except CA Housing Finance Agency fund; Gilman Sport Field hind; Special Gas Taxfund; Special Gas Tax hind; Fire Assessment District hind; Solano Avenue Bid fund;Underground District fund; Lillie B. Wall Memorial fund; East bay Public Utility hind; Fund forImpounded and Unneutered). capital project hinds (except Public EducationlGovt Access Fac.Fund; Measure G Fire Seismic Project; Capital Improvement Administration: StreetImprovement: 97 GO Bonds Measure 5; Savo Island Project; 2010 COP Animal Shelter fund),and debt service funds (except 2010 COP Animal Shelter fund). The budgetary comparisonschedules have been provided for the General Fund and major Special Revenue Funds todemonstrate compliance with this budget under “Required Supplementary Information otherthan MD&A section”. The basic governmental fund financial statements can be found on pages48-53 of this report.
Proprietary fluids—The City of Berkeley maintains two different types of proprietary funds.Enterprise funds are used to report the same functions presented as business-type activities inthe government-wide financial statements. The City of Berkeley uses enterprise funds toaccount for its, Refuse Collection/Disposal, Marina Operation/Maintenance, Sanitary Sewer,Clean Storm Water. Permit Service Center, Off-Street Parking, Parking Meter, and BuildingPurchase and Management operations, which are all considered to be major funds of the City ofBerkeley. Internal service funds are an accounting device used to accumulate and allocate costsinternally among the City of Berkeley’s various functions. The City of Berkeley uses internalservice funds to account for its equipment maintenance, building maintenance, supplywarehouse, computer replacement, workers’ compensation program, sick leave and vacationpayout, public liabilities, and catastrophic loss reserves. Because these services predominantlybenefit governmental rather than business-type functions, they have been included withingovermnental activities in the government—wide financial statements.Proprietary hinds provide the same type of information as the government-wide financialstatements, only in more details. The eight internal service funds are combined into a single,aggregated presentation in the proprietary fund financial statements. Individual fund data for theinternal service funds is provided in the form of combining statements elsewhere in this report.The basic proprietary fund statements can be found on pages 54-57 of this report.Fiduciacy funds. Fiduciary funds are used to account for resources held for the benefit of partiesoutside the government. Fiduciary funds are not reflected in the government-wide financialstatement because the resources of those hinds are not available to support the City ofBerkeley’s own programs. The accounting used for fiduciary funds is much like that forproprietary funds.
The basic fiduciary fund financial statements can be found on pages 58-59 of this report.
Notes to the financial statements. The notes provide additional information that is essential to afull understanding of the data provided in the government-wide and fund financial statements. Thenotes to the financial statements can be found on pages 60-130 of this report.
Other information. In addition to the basic financial statements and accompanying notes, thisreport also presents certain required supplementary information concerning the City of Berkeley’sprogress in funding its obligation to provide pension benefits and other postemployment benefits toits employees. Required supplementary information can be found on pages 131-140 of this report.
27
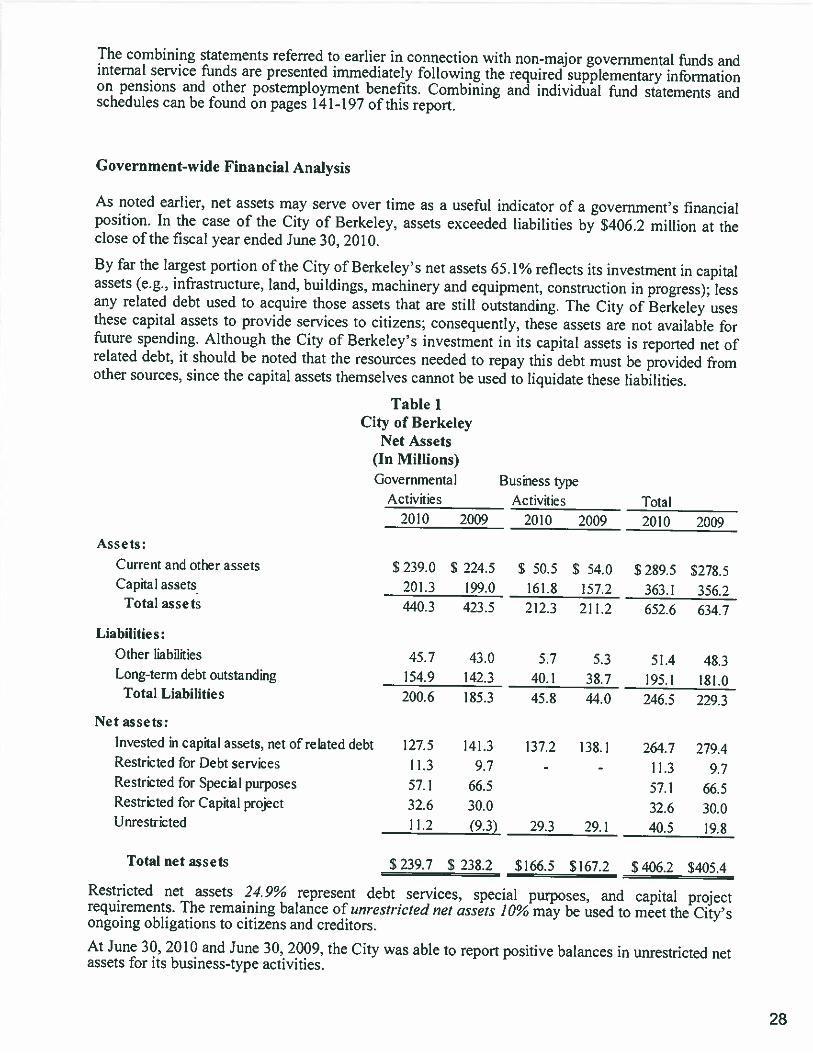
The combining statements referred to earlier in connection with non-major governmental funds andinternal service funds are presented immediately following the required supplementary informationon pensions and other postemployment benefits. Combining and individual fund statements andschedules can be found on pages 141-197 of this report.
Government-wide Financial Analysis
As noted earlier, net assets may serve over time as a useful indicator of a government’s financialposition. In the case of the City of Berkeley, assets exceeded liabilities by $406.2 million at theclose of the fiscal year ended June 30, 2010.
By far the largest portion of the City of Berkeley’s net assets 65.1% reflects its investment in capitalassets (e.g., infrastructure, land, buildings, machinery and equipment. construction in progress): lessany related debt used to acquire those assets that are still outstanding. The City of Berkeley usesthese capital assets to provide services to citizens; consequently, these assets are not available forfuture spending. Although the City of Berkeley’s investment in its capital assets is reported net ofrelated debt, it should be noted that the resources needed to repay this debt must be provided fromother sources, since the capital assets themselves cannot be used to liquidate these liabilities.
Table 1City of Berkeley
Net Assets(Jn Millions)Governmental Business type
Assets:Current and other assetsCapital assets
Total assets
Liabilities:Other liabilitiesLong-term debt outstanding
Total Liabilities
Net assets:Invested in capital assets, net of related debtRestricted for Debt servicesRestricted for Special purposesRestricted for Capital projectUnrestricted
Total net assets
Activities2009 2010 2009 2009
$ 239.0 $ 224.5 $ 50.5 $ 54.0 $ 289.5 $278.5201.3 199.0 161.8 157.2 363.! 356.2140.3 423.5 212.3 211.2 652.6 634.7
45.7 43.0 5.7 5.3 51.4 48.3154.9 142.3 40.1 38.7 195.1 181.0200.6 185.3 45.8 44.0 246.5 229.3
127.5 141.3 137.2 138.1 264.7 279.411.3 9.7 - - 11.3 9.757.! 66.5 57.1 66.532.6 30.0 32.6 30.011.2 (9.3) 29.3 29.1 40.5 19.8
S 239.7 S 238.2 5166.5 $167.2 S 406.2 5405.4
Restricted net assets 24.9% represent debt services, special purposes. and capital projectrequirements. The remaining balance of unrestricted net assets 10% may be used to meet the City’songoing obligations to citizens and creditors.At June 30. 2010 and June 30, 2009. the City was able to report positive balances in unrestricted netassets for its business-type activities.
Activities2010
Total2010
28
The City’s net assets from governmental activities increased 0.63% from $238.2 million to $239.7million. This increase represents the degree to which increases in ongoing revenues have exceededsimilar increases in ongoing expenses and transfers.
Governmental activities. Governmental activities increased the City’s net assets by $1.5 million.Business-type activities decreased the City’s net assets by SO.7 million. Key elements of thesechanges are as follows:
29
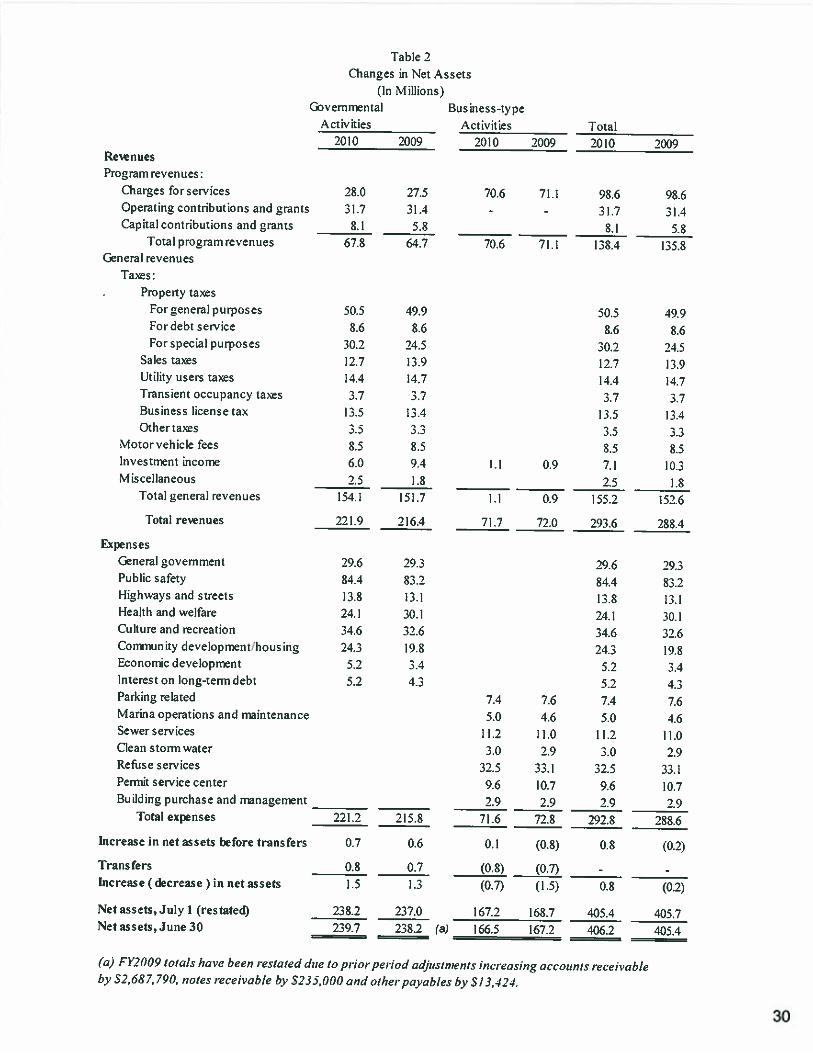
ReenuesProgram revenues:
Charges forservicesOperating contributions and grantsCapital contributions and grants
Total program revenuesneral revenues
Taxes:
Property taxesFor general purposesFor debt serviceFor special purposes
Sales taxesUtility users taxesTransient occupancy taxesBusiness license taxOther taxes
Motor vehicle feesInvestment incomeMiscellaneous
Total general revenues
Total reenL1es
ExpensesEneral govemnientPublic safetyHighways and streetsHealth and welfareCulture and recreationCommunity developmenChousingEconomic developmentInterest on long-tenn debtParking related
Marina operations and maintenanceSewer servicesClean storm waterRefuse servicesPermit service center
Building purchase and managementTotal epenses
Increase in net assets lrt’ore transfers
Trans fers
Increase (decrease) in net assets
Table 2Changes in Net Assets
(In Millions)ven,mental
Activities
2010 2009
50.5 49.98.6 8.6
30.2 24.512.7 13.914.4 14.73.7 3.7
13.5 13.43.5 3.38.5 8.56.0 9.42.5 1.8
154.1 151.7
3.58.5
1.1 0.9 7.1
50.5
8.6
30.2 24.512.7 13.914.4 14.73.7 3.7
[3.5 13.4
_________ ________
2.5 1.81.1 0.9 155.2 152.6
221.9 216.4 71.7 72.0
32.5
9.6
_________ ________
2.9221.2 215.8 71.6
0.7 0.6
0.8 0.71.5 1.3
293.6 288.4
7.4 7.6 7.45.0 4.6 5.0
11.2 11.0 11.23.0 2.9 3.0
0.1 (0.8)
5.2 3.45.2 4.3
7.64.6
11.0
2.9
0.8 (0.2)
(0.8) (0.7) - -
(0.7) (1.5) 0.8 (0.2)
Net assets, July 1 (restated)
__________ __________ _____________________ __________
Net assets, June 30
(a) FY2 (109 totals have bee,, restated due to prior period adjustments increasing accounts receivableby 52,687,790, notes receivable bj’ 5235,000 and other payahles by S 13,424.
Business-typeActivities Total
2010 2009 2010 2009
28.0 27.531.7
8.]
67.8
31.45.8
64.7
70.6 71.1 98.6 98.6-
- 31.7 31.4
_________ ________
8.1 5.870.6 71.! 138.4 135.8
49.9
8.6
j.j
8.510.3
29.6 29.3 29.6 29.384.4 83.2 84.4 83.213.8 13.! 3.8 13.124.] 30.1 2.I 30.134.6 32.6 34.6 32.624.3 19.8 24.3 19.8
5.2 3.45.2 4.3
33.1 32.5 33.]10.7 9.6 10.72.9 2,9 2.9
72.8 292.8 288.6
238.2 237.0 167.2 168.7 405.4 405.7239.7 238.2 (a) 166.5 167.2 406.2 405.4
30
Total governmental activities revenues increased approximately $5.5 million. Key factors in thatincrease were the following:
Charges for services increased by $0.5 million or 0.23%, which was primarily attributableto:
o A decrease of $608,083 or 8.4% in general governmental fees. For late billing fireinspection ($0.3 million) and residential preferential parking ($0.3 million).
o An increase of $1,100,000 for parking citation collection in Public Safety.
• Operating grants and contributions increased $0.3 million. This was due to some newprojects in FY20 10. For example,
o The University Avenue 6th Avenue and around San Pablo Project: $0.3 million
• Capital grants and contributions increased $2.3 million primarily due to the Ed RobertsCampus project.
• Property taxes for general purposes increased $.6 million or 1.2%. Key components of thatincrease are as follows:
o Real Property Tax revenues increased $764,768 or 2.1 % to $37,400,679 in FY 2010, from$36,635,911 in FY 2009, primarily due to a 1.834% increase in assessed values.
o Supplemental Tax revenues declined S509.866 or 46% to $599,711 in FY 2010, from$1.1 09,577 in FY 2009. Property’ sales activity increased but was dominated by manytransactions whose market values were less than their assessed values.
o Redemptions (i.e., collections on prior years’ real property taxes) increased $386,154 or22.6%.
o Unsecured property taxes decreased $117,617 or 4.8%.
• Property taxes for debt service were unchanged primarily due to (I) a decrease for AnimalShelter General Obligation bonds of $1,617,901 due to an erroneous over-collection in FY2009: an increase for the Special tax of $l%430,743 collected for the Library Measure FFGeneral Obligation bonds issued in FY 2010; (3). The tax rates for Measure S GeneralObligation Bonds declined in FY2O1O due to the refinancing of the bonds at lower interestrates in FY 2007. This resulted in a reduction ofSl35,674 in the taxes collected in FY 2010.
• Property taxes for special purposes increased $5.7 million primarily due to the collection of$5.2 million for Fire Protection and Emergency Response (Measure GG’). passed by votersin November 2008.
• Business License Tax (BLT) revenues increased $117,529 or .9% to $13,505,958 in FY2010, from $13,388,429 in FY 2009. The Finance Department has an aggressive program toincrease revenue, especially Business License Taxes. The BLT increase reported for FY2010 was more than accounted for by the BLT collections of $687,564 generated by FinanceDepartment audits.
• Investment income decreased $3.4 million or 36.0% in FY 2010. Investment income is thetotal interest income earned plus the change in the market value of investments during thefiscal year. GASB Statement No. 3 1 requires governments to mark investments to marketvalue, whether or not the intent is to hold them to maturity. Interest income during FY 200increased, even though the Federal Reserve Board cut short-term rates to nearly zero andkept them there. However. Investment income decreased by $3.3 million due to a $42million increase in the market value of the City’s investments in FY 2009 versus amillion increase in FY 2010. GASB Statement No. 31 requires that this increase be added tothe total interest income, to calculate investment income for the year.
31
• Sales tax revenues declined $1171237 to S12.733.983 in FY 2010 from S13.907.220 in FY2009.The decline was caused by a severe recession that resulted in a significant loss ofjobs and asignificant slowdown in consumer and business spending. Economic categories with significantdeclines include: New car sales; miscellaneous retail; building materials-retail; food markets;apparel stores; frmiture!appliances; and recreation products.
• Utility Users Tax revenues decreased 5246,883 as the sharp decline in gas rates and a slightdecline in gas usage more than offset an increase in electric rates and a slight decline inelectric usage.
• Motor vehicle fees increased 5148.256 or 1.8%, due to the 1.834% growth in assessedvalues of real property. which is used to calculate the increase or decrease in approximately95% of motor vehicle fees.
General Government expenses increased by $0.3 million for the following reasons:
• Miscellaneous professional fees decrease of $150,000
• Other miscellaneous expense decrease of $100,000
• Salaries and wages increased, due to the increase of 2% in COLAs, but that increase wasoffset by the effects of the hiring freeze.
Public Safety expenses increased by $1.2 million in FY2OIO. Contributing factors were asfollows:
• Salaries and wages increased, due to the 2% COLAs and employee benefits increased as aresult of the increase in the Police retiree medical contribution rate from 3.26% to 5.78%.
Highway and Streets expenses increased by $0.7 million as follows:
• Salaries and wages increased, due to the increase of 2% COLAs and employee benefits.such as medical insurance.
Health and Welfare expense decreased by $6.0 million as follows:
• The transfer of Aging Service and Youth Employment division to Housing, which reducedboth salaries and fringe benefits by 53.0 million.
• A reduction in capital project spending due to the completion of the Gilman Sport field inJune 2009, which saved about $0.4 million.
• A reduction in personnel in various divisions of the Department of Health Service.
Community Development/Housing expenses increased S4.5 million primarily due to thefollowing:
• The transfer of Aging Service and Youth Employment division from Department of HealthService, which increased total salaries and fringe benefits by $3.0 million.
32
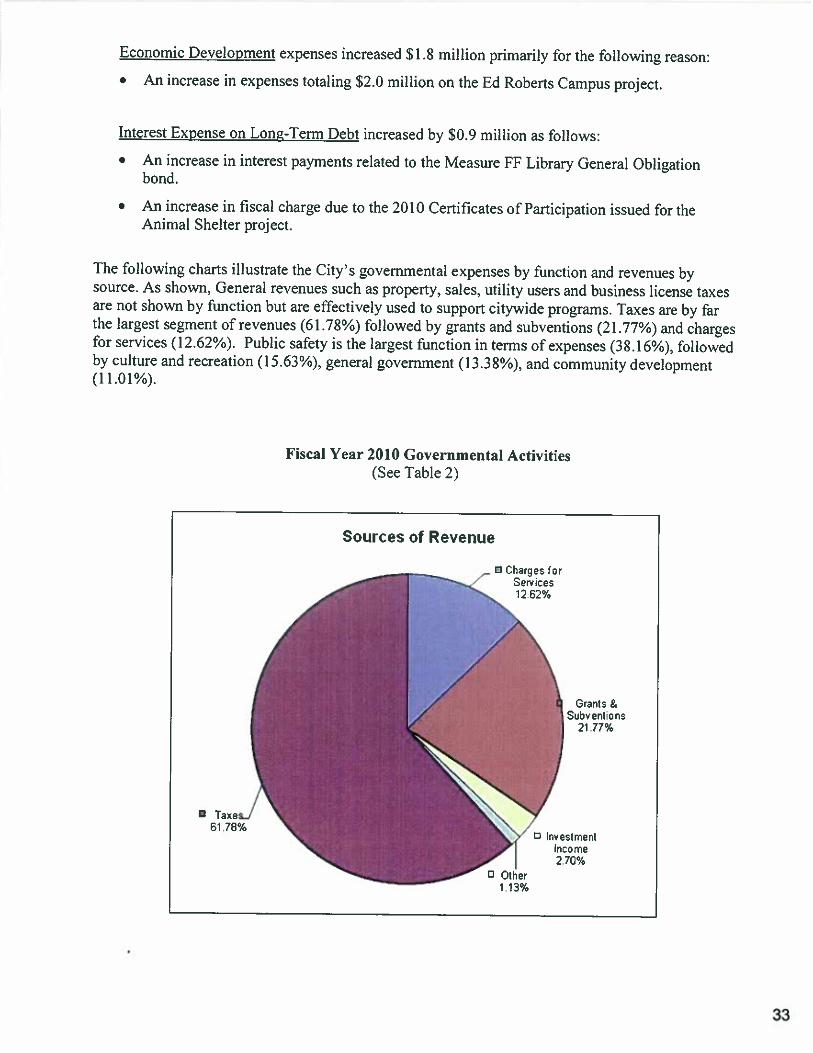
Economic Development expenses increased SI .8 million primarily for the following reason:
• An increase in expenses totaling $2.0 million on the Ed Roberts Campus project.
Interest Expense on Lone-Term Debt increased by $0.9 million as follows:
• An increase in interest payments related to the Measure FE Library General Obligationbond.
• An increase in fiscal charge due to the 2010 Certificates of Participation issued for theAnimal Shelter project.
The following charts illustrate the City’s governmental expenses by function and revenues bysource. As shown, General revenues such as property, sales, utility users and business license taxesare not shown by function but are effectively used to support citywide programs. Taxes are by farthe largest segment of revenues (61.78%) followed by grants and subventions (21.77%) and chargesfor services (12.62%). Public safety is the largest function in terms of expenses (38.16%), followedby culture and recreation (15.63%), general government (13.3 8%). and community development(11.01%).
Fiscal Year 2010 Governmental Activities(See Table 2)
Sources of Revenue
Grants &Subvenfions
21 .77%
• Taxed61 78%
h./ Invesirnern
ncOme2.70%
C Other113%
33

Functional ExpensesEconomfcDeveIopmeo
2.36%
CommunityDevelop me nL_
11.01%
CulturePecreatiorL A
15.63%
• Health & Weltare_%10.89%
HighwaysStreets6.26%
——-——-_____e GeneraGovernment
13 .38%
L Public Saety36.16%
The City’s Business-type activities provide the same type of informationfund financial statements, but in less detail. During FY 2010, Business-typeCity’s net assets by $799,053. Key elements of this decrease are as follows:
found in the proprietaryactivities decreased the
• Charge for services for business-type activities decreased by 0.7 percent. The big declinewas from Marina leases in FY2OIO as a result of a FY2009 ‘ease settlement with theDoubletree Hotel in the amount of $422,663 and two payments for June 2009 of$424,675.60 each that typically would have been received in July 2009 or FY2OIO. Inaddition, less revenue was generated as a result of the poor economy.
• The Marina operations and maintenancewere due to the increase in professional($174,920), as a result of the replacement
expenses increased by 8.7 percent. Such increasesand specialized services ($105,921) and Suppliesof docks A and B.
-—— Interest
2.3 1%
Business-type activities.
34
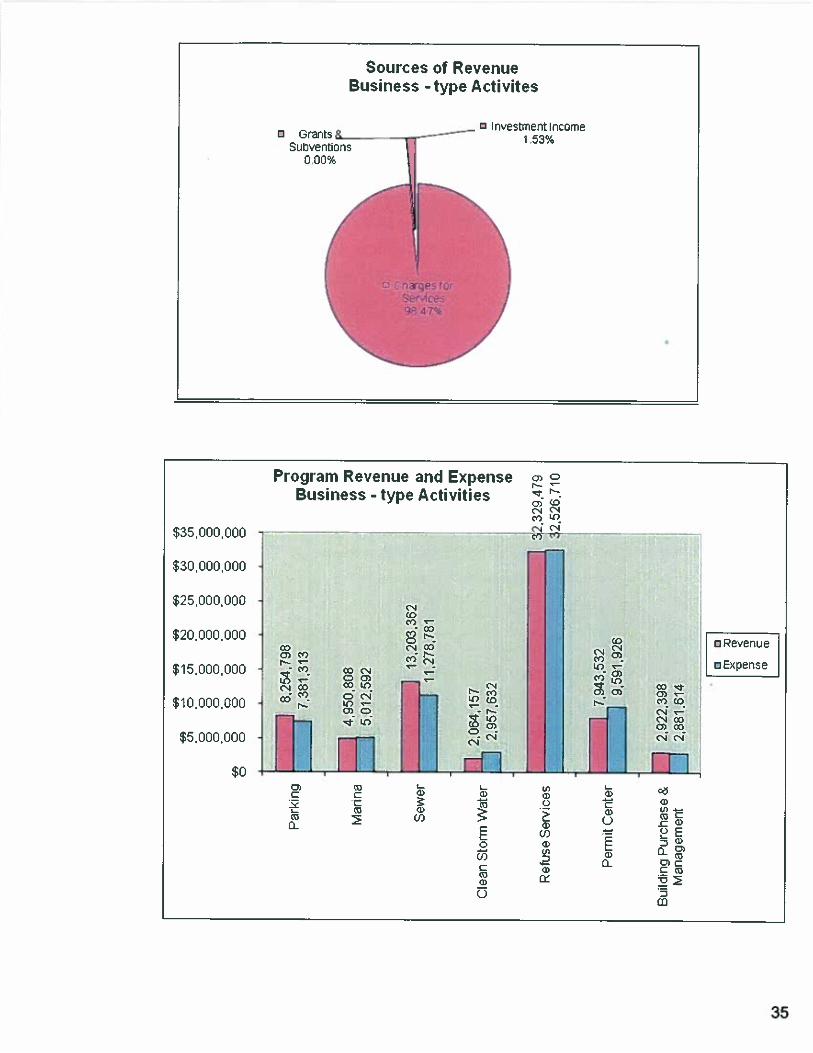
0)0C,——‘;- r,—_
CNCICo CD,
cCN
- a)a)U
I—E
a
zm
Sources of RevenueBusiness -type Activites
— C Investment?nccmeC Grants & - 1 53%
Subventicns N0.00% II
ir
Program Revenue and ExpenseBusiness - type Activities
$35, 000 000
$30,000,000
$25,000,000
$20000000
$16000000
$10, DOD , 000
$5,D00,000
$0
(NCDCO
CO0(N
Co
Co0)C—
CD(N
Co
CO
CoCO
C—
CoC—
CoI—,(N
Co(N00)
0(N
0)
CD(N
In’-C)
Li’)
0)(NCOCD
F’—U)0)
(N
F—Li)
<00
(N
a Revenue
a Expense
C
Caa
CoC
Co
I,
a)
a)CD
GoCCoa)
U
U,a)C)
a)(1)I)(0
a)a
35
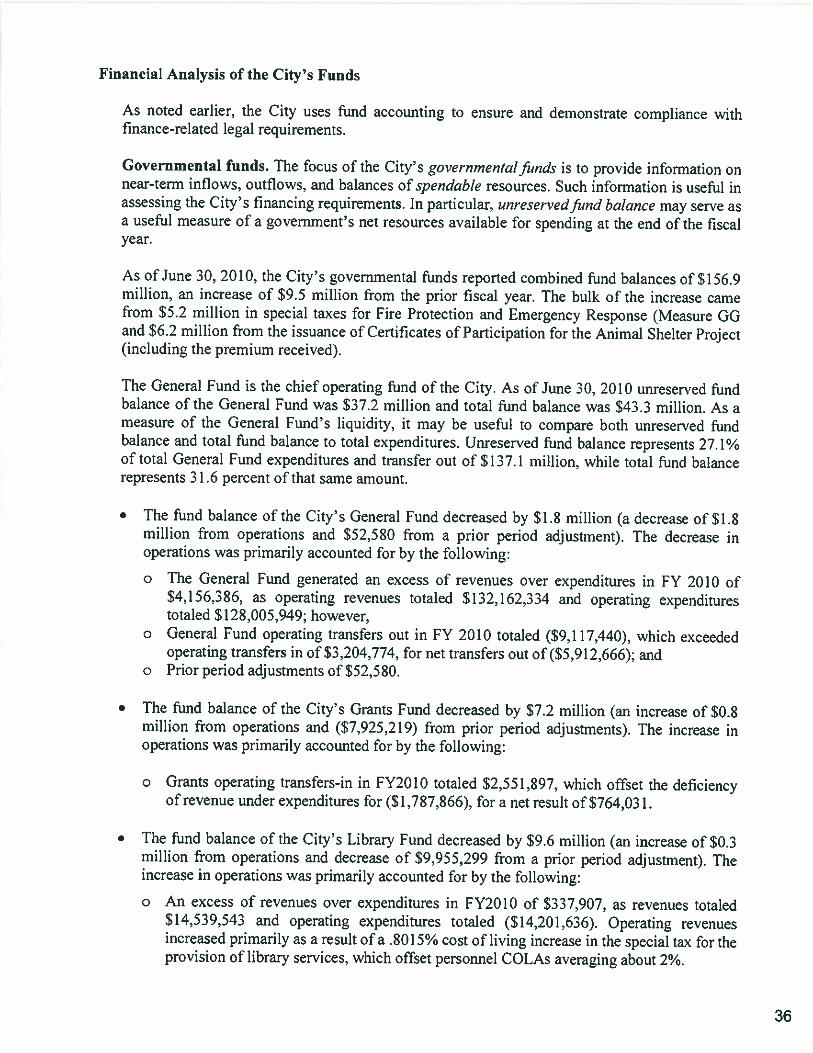
Financial Analysis of the City’s Funds
As noted earlier, the City uses fund accounting to ensure and demonstrate compliance withfinance-related legal requirements.
Governmental funds. The focus of the City’s govei’nmeni’al funds is to provide information onnear-term inflows, outflows, and balances of spendable resources. Such information is useful inassessing the City’s financing requirements. In particular, unreserved fund balance may serve asa useful measure of a government’s net resources available for spending at the end of the fiscalyear.
As of June 30. 2010, the City’s governmental funds reported combined fund balances of $156.9million, an increase of $9.5 million from the prior fiscal year. The bulk of the increase camefrom $5.2 million in special taxes for Fire Protection and Emergency Response (Measure GOand $6.2 million from the issuance of Certificates of Participation for the Animal Shelter Project(including the premium received).
The General Fund is the chief operating hind of the City. As of June 30, 2010 unreserved hindbalance of the General Fund was $37.2 million and total fund balance was $43.3 million. As ameasure of the General Fund’s liquidity, it may be useful to compare both unreserved fundbalance and total fund balance to total expenditures. Unreserved fund balance represents 27.1%of total General Fund expenditures and transfer out of $137.1 million, while total fund balancerepresents 31.6 percent of that same amount.
• The fund balance of the City’s General Fund decreased by $1.8 million (a decrease of $1.8million from operations and $52,580 from a prior period adjustment). The decrease inoperations was primarily accounted for by the following:
o The General Fund generated an excess of revenues over expenditures in FY 2010 ofS4.156.386. as operating revenues totaled 5132.162.334 and operating expenditurestotaled SI 28,005,949; however.
o General Fund operating transfers out in FY 2010 totaled ($9.1 17,440), which exceededoperating transfers in of $3,204,774, for net transfers out of ($5,912,666); and
o Prior period adjustments of $52,580.
• The fund balance of the City’s Grants Fund decreased by $7.2 million (an increase of $0.8million from operations and ($7925,219) from prior period adjustments). The increase inoperations was primarily accounted for by the following:
o Grants operating transfers-in in FY20 10 totaled S2.55 1,897. which offset the deficiencyof revenue under expenditures for ($1,787,866), for a net result of $764,031.
• The fund balance of the City’s Library Fund decreased by $9.6 million (an increase of $0.3million from operations and decrease of $9,955,299 from a prior period adjustment). Theincrease in operations was primarily accounted for by the following:
o An excess of revenues over expenditures in FY20 10 of $337,907, as revenues totaled$14,539,543 and operating expenditures totaled (514.201.636). Operating revenuesincreased primarily as a result of a .8015% cost of living increase in the special tax for theprovision of library services, which offset personnel COLAs averaging about 2%.
36
o Tn FY2009 the proceeds from the measure ff Library Branch Renovations bond issuewere combined with the Library Fund. In Fy2010, a restatement was done to report theMeasure ff Library Branch Renovations bond proceeds activities as a separate majorfund.
• The fund balance of the City’s CDBG Fund decreased by $0.2 million (a decrease of $0.2million from operations). The decrease in operations was primarily accounted for by thefollowing:
o The CDBG Fund generated a deficiency of revenues under expenditures in FY 2010 of($157,550). as operating revenues totaled S3,297,107 and operating expenditures totaled($1454.65?).
During FY2O1O, the City received $527,357 in American Recovery and ReinvestmentAct (ARRA) of 2009 grant funds versus $0 received during FY2009. However, thespending in ARRA projects also increased by $631,412 in FY2O1O. As a result, adeficiency of revenues under expenditures inculTed.
• The fund balance of the City’s Park Tax Fund decreased by $0.3 million. The decrease inoperations was primarily accounted for by the following:
o A deficiency of revenues under expenditures in FY 2010 of (S338.986), as operatingrevenues totaled $8.842.877 and operating expenditures totaled ($9,135,620); and
o Park Tax Fund operating transfers out in FY 2010 totaled ($46,243).
The Park Tax revenue in FY2O1O had an increase of .8015%. which accounted for anincrease in revenue of $69,974 more than the total received in FY2009. However, suchincrease was offset by the decrease of miscellaneous revenues and private contributions.As a result, the total revenues in FY2O1O had a decrease of ($186,577) from FY2009. Inaddition, the total expenditures in FY2OIO for recreation and culture had an increase of$7 14.259.
• The fund balance of the City’s Measure FF Branch renovation Fund increased by $8.5million (a decrease of $1.4 million from operations and increase of $9,955,299 from a priorperiod adjustment). The decrease in operations was primarily accounted for by thefollowing:
o A deficiency of revenues under expenditures in FY 2010 of ($1,444,340), as operatingrevenues totaled $13,641 and operating expenditures totaled ($1,457,981).
o In FY2009 the proceeds from the measure ff Library Branch Renovations bond issuewere combined with the Library Fund. In Fy20 10, a restatement was done to report theMeasure ff Library Branch Renovations bond proceeds activities as a separate majorfund.
• The fund balance of the City’s Capital Improvement Fund decreased by $1.1 million (adecrease of $1.3 million from operations and an increase of $225,000 from a prior periodadjustment). The decrease in operations was primarily accounted for by the following:
o The Capital Improvement Fund generated a deficiency of revenues over expenditures inFY 2010 of ($4,029,223), as operating revenues totaled S15.857 and operatingexpenditures totaled ($4,045,080);
37
o General Fund operating transfers-in in FY 2010 totaled 53.300,000, which exceededoperating transfers out of ($552,207). for net transfers out of $2,747,793 and
o Prior period adjustments of $225,000.
The decline of 51.3 million in operations was a result of no excess transfer tax revenuesbeing available in FY2O1O to fund street maintenance projects. The City established apolicy of funding one time street maintenance projects with the total of the transfer taxrevenue that exceeded $10.5 million in the following year. Transfer tax revenues totaled$12.6 million in FY2008, so $2.1 million was available for FY2009 projects. Transfertax revenues in FY2009 totaled 58 million, so no funds were available to fund FY2OIOstreet maintenance projects.
• The fund balance of the Other Governmental Funds increased by $13.1 million (an increaseof $13.3 million from operations and a decrease of 5243.351 from a prior periodadjustment). The increase in operations was primarily accounted for by the following:
o The Other Governmental Funds generated an excess of revenues over expenditures in FY2010 of $2,305,557, as operating revenues totaled $34,7J3,885 and operatingexpenditures totaled ($32,408,329); However,
o General Fund operating transfers-in in FY 2010 totaled $5,495,592. but the totaloperating transfers out of (S6.620,630). for net transfers out of (51.125.038): However.
o There were issuance of notes and loans of 56.000.000, issuance of certificate ofparticipation for 55,750.000 and premium on certificates of participation for 5403.977and
o Prior period adjustments of 5243.351.
General Fund Budgetary Highlights:
The City Council approved an original annual appropriation ordinance of 5148.500.040.including transfers out for FY 2010. and made supplementary budget appropriations totaling$5,801,258 during the year. The supplementary budget appropriations consisted of thefollowing: (1) FY 2009 outstanding encumbrances of $2,553,297; (2) unencumbered carryoversof $1,198,718, which were re-appropriated; (3) other budget adjustments of $2,049,243. Atyear-end, the FY 2010 General fund budget was reduced by the total of the FY 2010 outstandingencumbrances (52,762,840) and related budget, which were rolled over to FY 2011, andincreased by other adjustments of 543.699, for a final budget of 5151,807.263.
General fund expenditures were $7.1 million less than the approved budget, and the followingfunctions accounted for most of this total:
• General government - 53.6 million under budget: The balance is due to personnel savingsdue to a hiring freeze and unspent non-personnel funds.
• Public Safety- 51.2 under budget: This was primarily due to shifting eligible Fire overtimecosts to the voter approved Measure GG Fund and savings from vacant positions.
• Highways & Streets- 5.4 million under budget: This balance was due to personnel savingsdue to vacant positions.
38
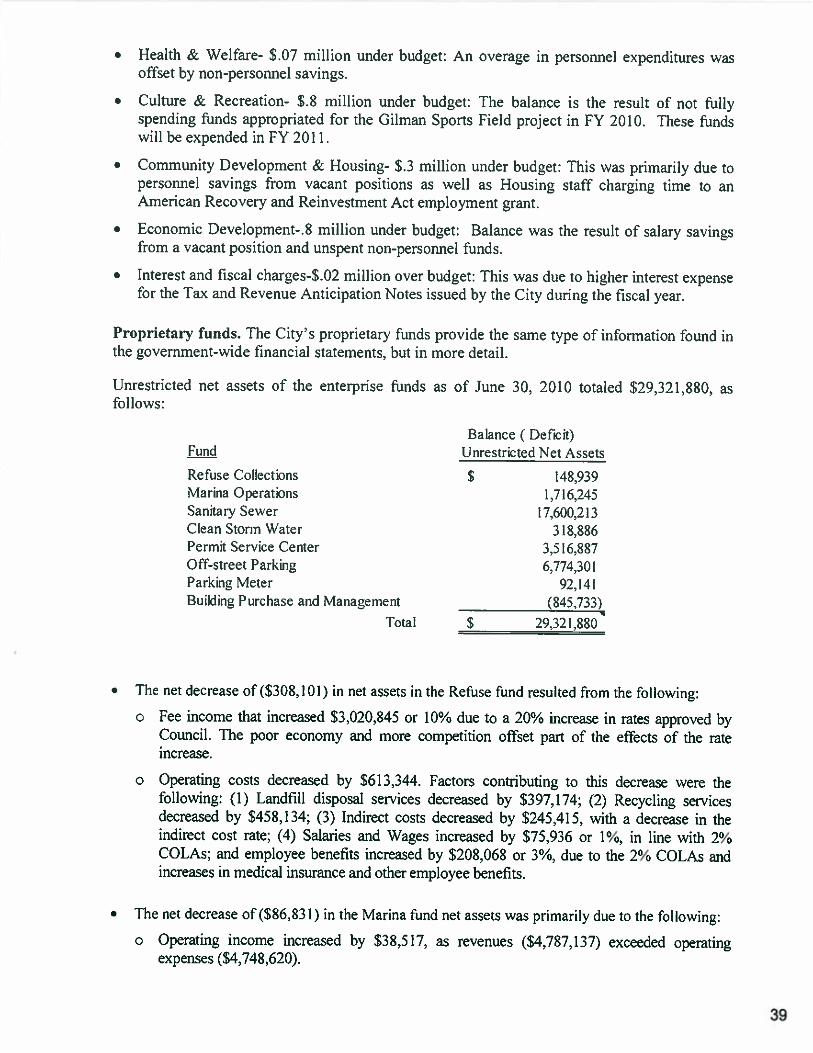
• HeaLth & Welfare- $.07 million under budget: An overage in personnel expenditures wasoffset by non-personnel savings.
• Culture & Recreation- $.8 million under budget: The balance is the result of not fullyspending funds appropriated for the Oilman Sports Field project in FY 2010. These fundswill be expended in FY 2011.
• Community Development & Housing- $.3 million under budget: Thispersonnel savings from vacant positions as well as Housing staffAmerican Recovery and Reinvestment Act employment grant.
• Economic Development- .8 million under budget: Balance was the result of salary savingsfrom a vacant position and unspent non-personnel ftinds.
• Interest and fiscal charges-$.02 million over budget: This was due to higher interest expensefor the Tax and Revenue Anticipation Notes issued by the City during the fiscal year.
Proprietary funds. The City’s proprietary funds provide the same type of information found inthe government-wide financial statements, but in more detail.
Unrestricted net assets of the enterprise funds as of June 30, 2010 totaled $29,321,880, asfollows:
Balance ( Deficit)Fund Unrestricted Net Assets
Refuse CollectionsMarhia OperationsSanitary SewerClean Storm WaterPermit Service CenterOff-street ParkingParking MeterBuilding Purchase and Management
Total
S 148.9391.716,245
17,600.2133 18.886
3.5 16,8876.774,301
92,141(845.733)
S 29.321.880
• The net decrease of (S308,101) in net assets in the Refuse fund resulted from the following:
o Fee income that increased S3.020.845 or 10% due to a 20% increase in rates approved byCouncil. The poor economy and more competition offset part of the effects of the rateincrease.
o Operating costs decreased by $613,344. Factors contributing to this decrease were thefollowing: (1) Landfill disposal services decreased by $397,174; (2) Recycling servicesdecreased by $458,134; (3) Indirect costs decreased by $245,415, with a decrease in theindirect cost rate; (4) Salaries mid Wages increased by $75,936 or 1%, in line with 2%COLAs; and employee benefits increased by $208,068 or 3%. due to the 2% COLAs andincreases in medical insurance and other employee benefits.
• The net decrease of(S86.83l) in the Marina fund net assets was primarily due to the following:
o Operating income increased by $38,517. as revenues ($4,787,137) exceeded operatingexpenses ($4,748,620).
was primarily due tocharging time to an
39
o Operating revenues decreased by $556,714 or 10%. Factors causing the decrease in FY 2010were as follows: (1) A $422,663 lease settlement recorded as revenue in FY 2009; and (2) A$316,349 performance bond payment from a contractor, after the first contractor withdrewfrom the Nature Center project.
o Operating expenses increased by $384,567 or 8.8%. Factors causing the increase were asfollows: Increase in professional and specialized services ($105,921) and Supplies(SI 74,920), as a result of the replacement of docks A and B.
• The net increase of $1,822,059 in the Sanitary Sewer Fund was primarily due to thefollowing:
o Operating income increased by $1,073,624, as revenues ($12,352,405) exceededoperating expenses ($11,278,781).
o An increase of investment earnings of $263,028 to $850,349 from $587,321 in prior yearto $850,349 this year.
• The net decrease of 51.648,394 in the Permit Service Center Fund net assets was primarily dueto the following:
o There was an operating loss of (S 1.683.318), as operating revenues ($7.908.608) wereexceeded by operating expenses ($9,591,926).
o Operating revenues decreased by ($2,228,927) or 21.9%, primarily due to a big decrease inBuilding Permits (S1.5l&685). Plan Check Fees (Sl63.467) and Other Fees ($470,908) inFY 2010 as a result of the poor economy (especially the real estate market) and the difficultyof developers to get bank financing for projects. The estimated value of residential permitsdeclined from $113.4 million in FY 2009 to $44.1 million in FY 2010,
o Operating expenses decreased by $1,132,059 or 10.6%. Factors causing the decrease were thefollowing: (1) Salaries and wages decreased by $393,338 and employee benefits decreased by$178,182, despite COLAs of about 2%, as a result of a reduction in personnel related to citywide budget cuts and a decline in demand for services; (2) Specialized and ProfessionalServices decreased by $32 1.537 due to the decline of $120,717 in a contract for expeditedland use permitting services and a decrease in a plan check service contract and anengineering services contract; and (3) thdirect costs decreased by $225,860 due to thedecrease in staff positions.
• The net increase in the net assets of $256,915 for the Parking-related Operation consisted of a$52,157 increase for Off-Street Parking Operations and an increase of $204,758 in net assets forParking Meter operations. This was compared to a decrease in net assets of ($486,624) in FY2009: $77,787 for the Off-Street Parking Fund and ($564,411) for the Parking Meter Fund).o Key factors for the Off-Street Parking Operations were: Operating revenues ($2,891,700)
exceeded operating expenses ($2,681,039) by $210,661.
o Key factors for the increase in Parking Meter Operations: Operating revenues ($5,339,501)exceeded operating expenses ($4,527,829) by $8 11.672. While revenues in FY 2010increased by $571,249 or 11.9% over those in FY 2009, operating expenses decreased by$396,184 or 8%. In addition, the Transfer Out to the General Fund in FY 2010 ($608,650)was $200,000 more than the Transfer Out in FY 2009 ($408,650). These factors lead to theincrease in net assets of $204,758 during the fiscal year.. factor causing an increase in theOff-Street Parking Operations was that the Oxford Garage revenues increased $245,877because it was only open five months in FY 2009. and 12 months in FY 2010. This increase
40
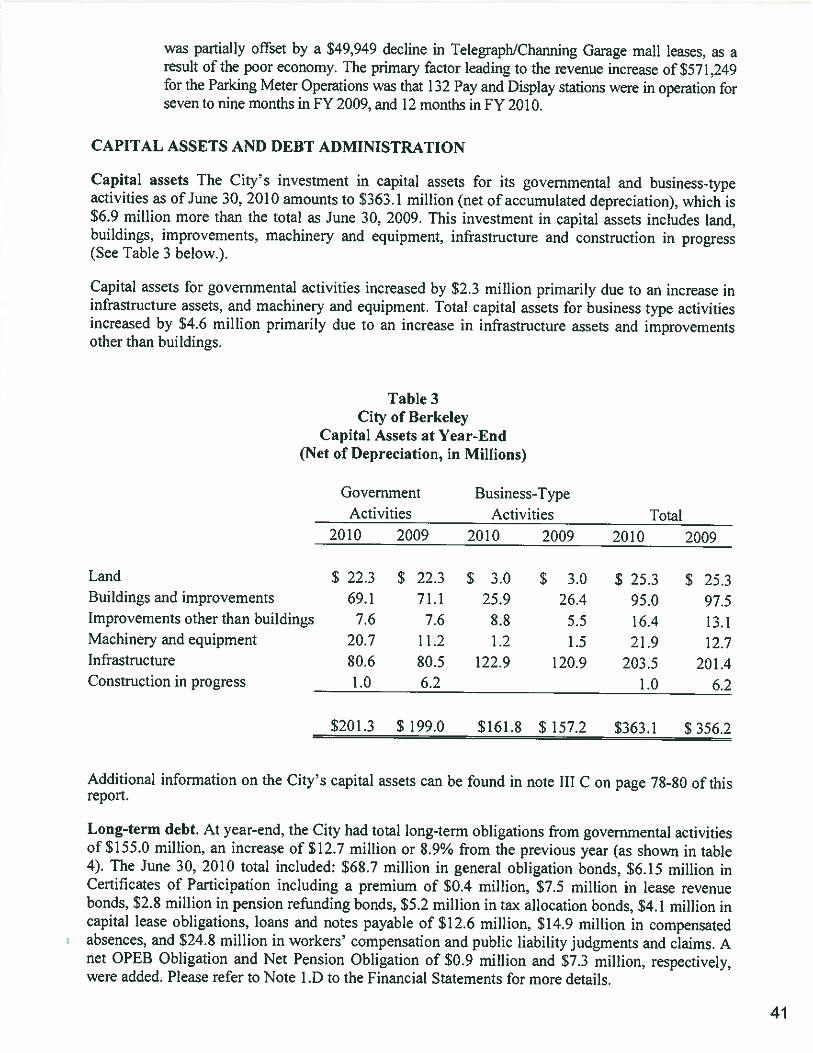
was partially offset by a $49,949 decline in TelegraphlChanning Garage mall leases, as aresult of the poor economy. The primary factor leading to the revenue increase of $571,249for the Parking Meter Operations was that 132 Pay and Display stations were in operation forseven to nine months in FY 2009, and 12 months in FY 2010.
CAPITAL ASSETS AND DEBT ADMINISTRATION
Capital assets The City’s investment in capital assets for its governmental and business-typeactivities as of June 30. 2010 amounts to $363.1 million (net of accumulated depreciation), which is$6.9 million more than the total as June 30. 2009. This investment in capital assets includes land,buildings, improvements, machinery and equipment. infrastructure and construction in progress(See Table 3 below.).
Capital assets for governmental activities increased by $2.3 million primarily due toinfrastructure assets. and machinery and equipment. Total capital assets for businessincreased by $4.6 million primarily due to an increase in infrastructure assets andother than buildings.
Table 3
an increase intype activitiesimprovements
City of BerkeleyCapital Assets at Year-End
(Net of Depreciation, in Millions)
GovernmentActivities
Business-TypeActivities Total
Additional information on the City’sreport.
2010 2009 2010 2009 2010 2009
Long-term debt. At year-end, the City had total long-term obligations from governmental activitiesof $155.0 million, an increase of $12.7 million or 8.9% from the previous year (as shown in table4). The June 30, 2010 total included: $68.7 million in general obligation bonds, $6.15 million inCertificates of Participation including a premium of $0.4 million, $7.5 million in lease revenuebonds, $2.8 million in pension refunding bonds, $5.2 million in tax allocation bonds, $4.1 million incapital lease obligations, loans and notes payable of $12.6 million, S 14.9 million in compensatedabsences, and $24.8 million in workers’ compensation and public liability judgments and claims. Anet OPEB Obligation and Net Pension Obligation of $0.9 million and $7.3 million, respectively,were added. Please refer to Note 1 .D to the Financial Statements for more details.
Land $ 22.3 $ 22.3 $ 3.0 $ 3.0 $ 25.3 $ 25.3Buildings and improvements 69.1 71.1 25.9 26.4 95.0 97.5Improvements other than buildings 7.6 7.6 8.8 5.5 16.4 13.1Machinery and equipment 20.7 11.2 1.2 1.5 21.9 12.7Infrastructure 80.6 80.5 122.9 120.9 203.5 201.4Construction in progress 1.0 6.2 1.0 6.2
$201.3 $ 199.0 $161.8 $ 157.2 5363.1 $ 356.2
capital assets can be found in note Ill C on page 78-80 of this
41
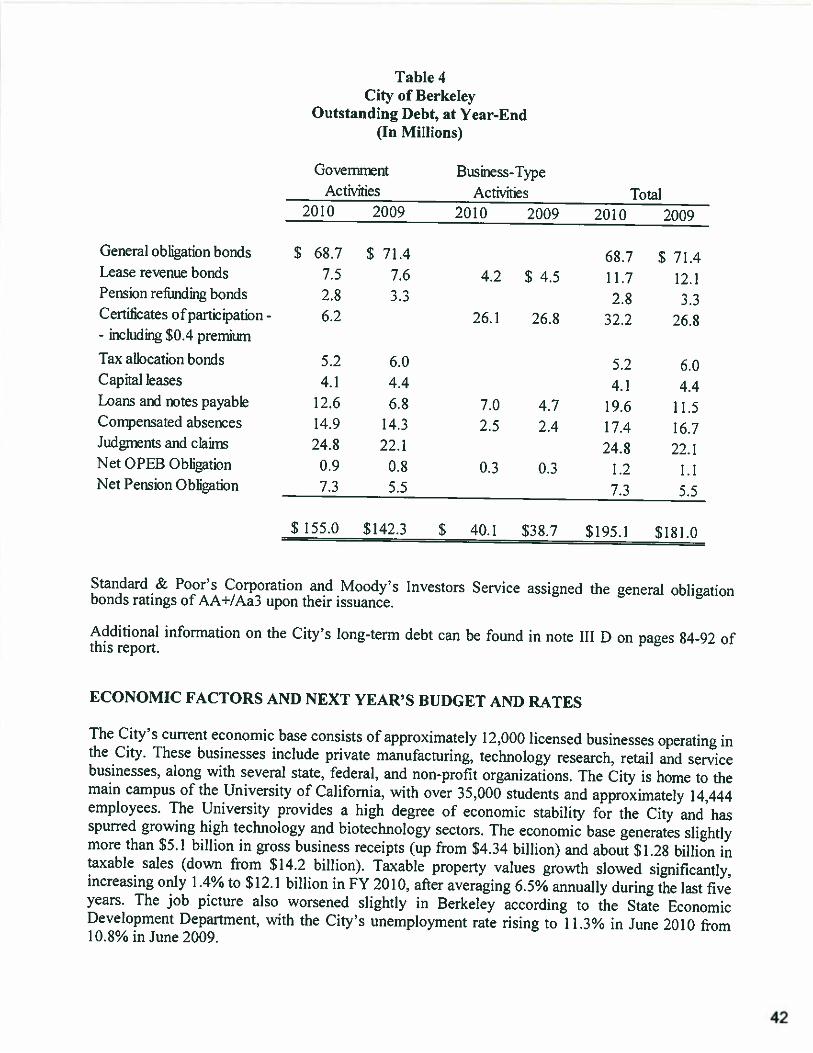
General obligation bondsLease revenue bondsPension rethnding bondsCertificates of participation -
- including $0.4 premium
Tax allocation bondsCapital leasesLoans and notes payableCompensated absencesJudents and claimsNet OPEB ObligationNet Pension Obligation
Table 4City of Berkeley
Outstanding Debt, at Year-End(Jn Millions)
Business-TypeGovernmentActivities
2010 2009Activities
2010 2009
Additional information on the City’s long-term debt can be found in note III D on pages 84-92 ofthis report.
ECONOMIC FACTORS AND NEXT YEAR’S BUDGET AND RATES
The City’s current economic base consists of approximately 12,000 licensed businesses operating inthe City. These businesses include private manufacturing, technology research, retail and servicebusinesses, along with several state, federal, and non-profit organizations. The City is home to themain campus of the University of California, with over 35,000 students and approximately 14,444employees. The University provides a high degree of economic stability for the City and hasspurred growing high technology and biotechnology sectors. The economic base generates slightlymore than $5.1 billion in gross business receipts (up from $4.34 billion) and about $1.28 billion intaxable sales (down from S 14.2 billion). Taxable property values growth slowed significantly,increasing only 1.4% to S 12.1 billion in FY 2010, after averaging 6.5% annually during the last fiveyears. The job picture also worsened slightly in Berkeley according to the State EconomicDevelopment Department. with the City’s unemployment rate rising to 11.3% in June 2010 from10.8% in June 2009.
Total2010 2009
S 68.7 $ 71.4 68.7 $ 71.47.5 7.6 4.2 $ 4.5 11.7 12.12.8 3.3 2.8 3.36.2 26.1 26.8 32.2 26.8
5.2 6.0 5.2 6.04.1 4.4 4.1 4A
12.6 6.8 7.0 4.7 19.6 lL514.9 14.3 2.5 2.4 17.4 16.724.8 22.1 24.8 22.1
0.9 0.8 0.3 0.3 1.2 1.17.3 5.5 7.3 5.5
$ 155.0 $142.3 $ 40.1 $38.7 $195.1 $181.0
Standard & Poor’s Corporation and Moody’s Investorsbonds ratings of AA+/Aa3 upon their issuance.
Service assigned the general obligation
42
The City’s two-year budget (2010-11) balances the forecasted two-year General Fund deficit of$6.5 million through a combination of recurring cuts (about 2% of the General Fund budget). whilemanaging the City’s unfunded liabilities. The budget provides a plan to control costs, maximizeCity resources and fund priority services. The budget plan is primarily based on expenditurereductions, as well as program reorganizations, and limited new revenue. Staff continues to focusefforts on maximizing revenues through a number of special revenue-focused projects, such asauditing business license tax, hotels and parking lot operators and increasing sales/use taxes.Several of the underlying budget assumptions are very sensitive to economic changes and assume amild economic recovery in FY 2011. While modest growths in property-related revenues areprojected, these growth rates are lower than in previous years. This includes assuming that PropertyTransfer Tax revenue rebounds from the $8 million level to back up to $9 million a yeam Thebudget also forecasts an increase in parking fines, utility users’ taxes and transient occupancy taxes:and it assumes stable sales tax and business license tax revenue. The City expects General Fundrevenues in FY 2011 to increase by 3.7% to approximately $144.8 million, from $139.7 million inFY 2010. The budget reduces General Fund expenditures by $5.3 million. Expenditures areprojected to total $146.0 million for FY 2011. down SI .7 million from the $147.7 million in FY2010. Revenues do not include fund balance, which is used to balance with expenditureappropriations.
REQUESTS FOR INFORMATION
This financial report is designed to provide our citizens. taxpayers. customers. investors, andcreditors with a general overview of the City’s finances and to show the City’s accountability forthe money it receives. If you have questions about this report or need additional financialinformation, contact the City’s Finance Department. at the City of Berkeley, 2180 Milvia Street,Third Floor. California 94704.
43

THIS PAGE LEFT INTENTIONALLY BLANK
44
BASIC FINANCIAL STATEMENTS
45
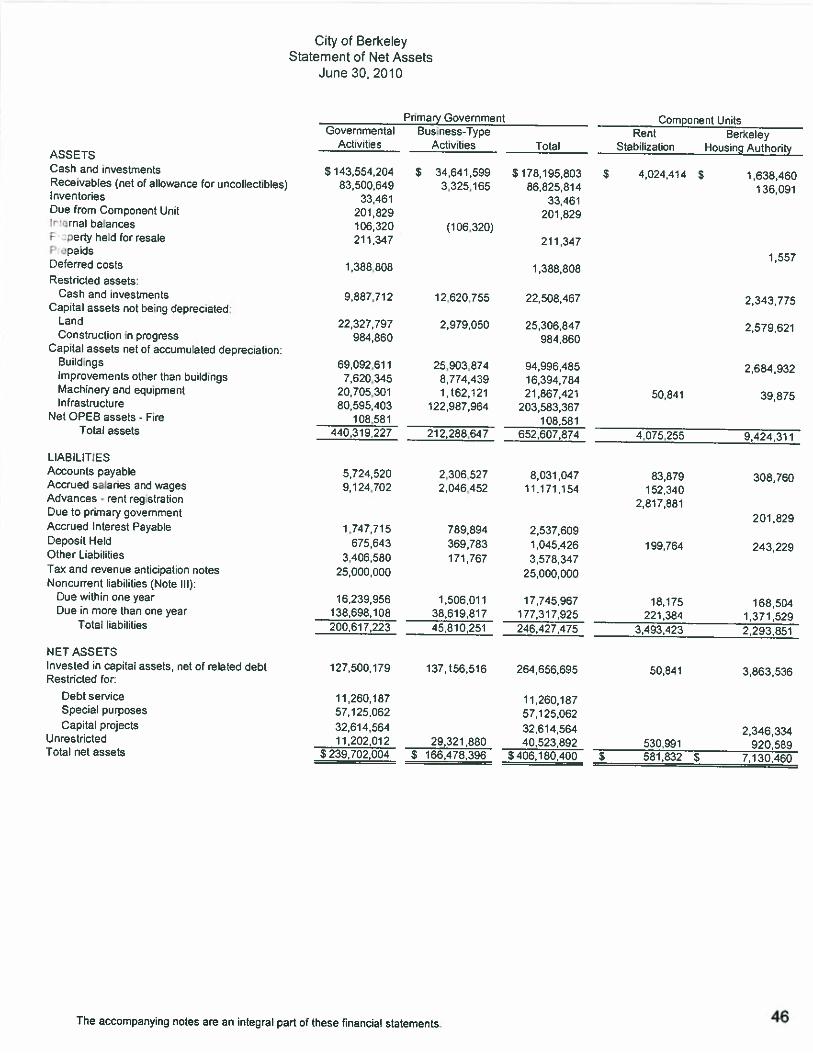
City of BerkeleyStatement of Net Assets
June 30, 2010
ASSETSCash and investmentsReceivables (net of allowance for uncollectibles)InventoriesDue from Component unit
•nal batancesperty h&d for resale
P rpaidsDeferred costsRestricted assets:
Cash and investmentsCapital assets not being deprecated:
LardConstruction in progress
Capital assets net of accumulated decreciatior.:BuildingsImprovements other than buildingsMachinery and equipmentInfrastructure
Net OPEB assets - FireTotal assets
LIABILIT;ESAccounts payableAccrued salaries and wagesAdvances - rent registrationDue to primary governmentAccrued Interest PayableDeposit HeldOther LiabilitiesTax and revenue anticLpation notesNoncurrent liabilities (Note III):
Due within one yearDue in more than one year
Total liabilities
NET ASSETSInvested In capital assets, net of related debtRestricted for:
Debt serviceSpecial purposesCapital projects
UnrestrictedTotal net assets
Primary Government Component UnitsGovernmental Bus ness-Type Rent Berkeley
Activities Activities Total Stabilization Housing Authority
$ 143554204 $ 34,641,599 S 178,195,803 $ 4024,414 $ 1638,46083,500,649 3,325,165 86,825814 1 36,091
33,461 33461201629 201829106320 (106,320)211347 211347
1,5571,388,808 1388808
9,887,712 1 2,620,755 22,508467 2,343775
22.327,797 2,979,050 25,306,847 2,579,621984.860 984,860
69092,611 25,903,874 94,996,485 2,684,9327,620,345 8,774,439 16,394,784
20,705,301 1,162,121 21,867,421 50,841 39,87580,595,403 122,987,964 203,583,367
108,531 108,581440.319 227 212,288647 652,607,874 4,075,255 9,424.311
5,724,520 2,306,527 8,031,047 83,879 308,7609,124,702 2,046,452 11,171,154 1 52,340
2,817,881201 .829
1,747,715 769,894 2,537,609675,643 369,783 1,045,426 199,764 243 229
3406,580 171,767 3,578,34725,000,000 25,000,000
16,239,956 1,506,011 17,745,967 18,175 168,504138,698,108 35.619.817 177,317,925 221.384 1,371.529200.617,223 45810.251 246,427.475 3,493,423 2,293,851
127,500,179 137,156516 264,656,695 50,841 3,863,536
11260,187 11,260,18757,125,062 57.125,06232,614,564 32,514,564 2,346,33411.202,012 29,321,880 40.523.892 533.991 920.589
$239,702,004 $ 166,478,396 $406,180,400 $ 581,832 S 7,130,460
The accompanying notes are an integral part of these financial statements 46
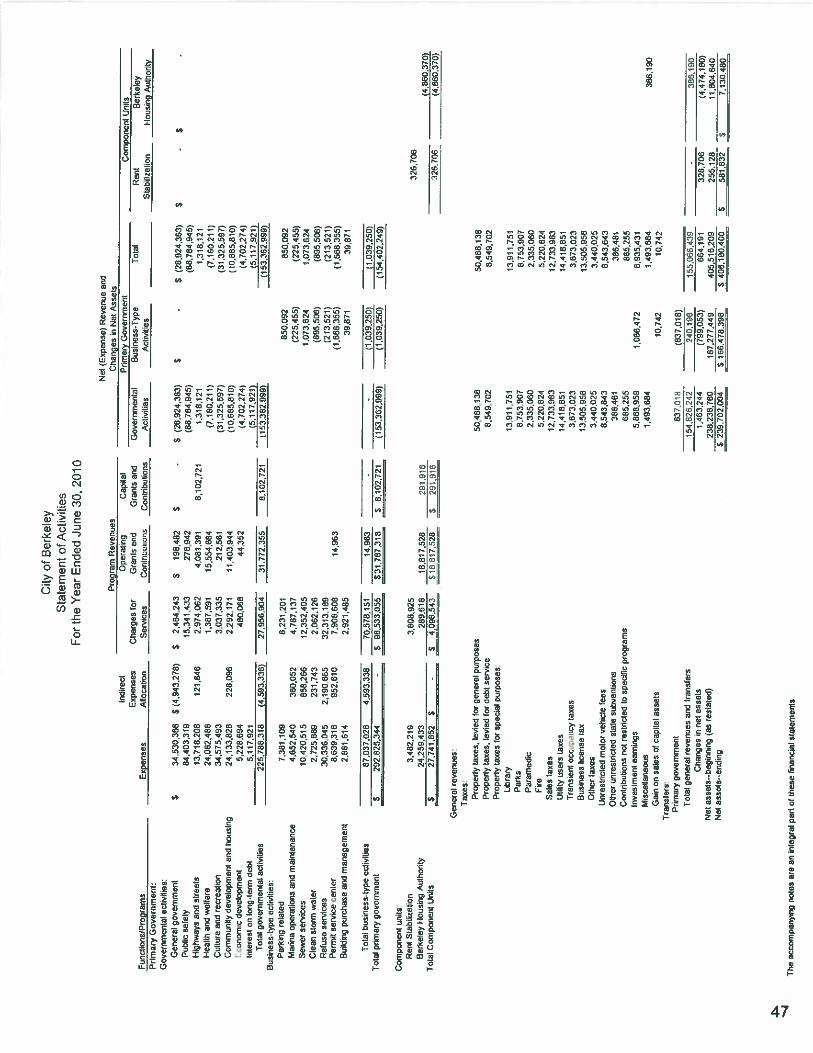
City
ofB
erke
ley
Sta
tem
ent
ofA
ctiv
ities
For
the
Yea
rE
nded
June
30,
2010
Funct
ionsi
Pro
gra
ms
Pri
mar
yG
ov
ern
men
t:G
ov
ern
men
tal
acti
vit
ies:
Gen
eral
gover
nm
ent
Pub
lic
sale
ly
Hig
hw
ays
and
stre
ets
Hea
lth
and
wel
fare
Cul
ture
ar.d
reoeali
06
0om
mn’t
ydev
elopm
ent
ard
hous
inr,
cunofl
iLc
dev
oln
pm
enl
mm
mcl
onlo
ng
-ter
mdo
biT
otal
go
vo
rnm
enla
tac
tivi
lios
Busi
nes
s-ty
po
acti
vit
ies:
Par
kin
gre
late
d
Mar
ina
op
erat
ion
san
dm
ainte
nan
ceS
ewer
serv
ices
Cle
anal
arm
wat
erR
elusn
serv
ices
Per
mit
serv
ece
nte
rO
utlo
ing
pu
rch
ase
and
man
agem
ent
34.5
30,3
66
84
,40
33
19
13.7
18.2
C8
24.0
02
.48
6
34.5
75,4
93
24.1
33.8
28
5,2
26
,69
45
,11
7,9
21
225,
788
.316
7,3
81,1
09
4.6
52,5
40
10,4
20,5
15
2.7
25
.889
33
,33
634
58
,63
9316
2,8
81
,61
4
Pro
gra
mR
even
ues
Oper
alin
g
$2.
464,
243
15
,34
1,4
33
2,9
74
.06
21,3
67,5
91
3,0
37,3
35
228.0
96
2,2
92,1
71
460,0
58
8,23
1,20
14
,78
7,1
31
12.3
52.4
05
2.06
2.12
632.3
13.1
59
7,90
8,50
82.
921,
485
Net
(Ex
pen
se)
Rev
enu
ean
dC
han
ges
inN
dA
sset
sPr
imar
yG
over
nmen
tG
over
nmen
tal
Bus
ines
s.T
ype
Acl
ivit
ins
Act
ivil
ies
S(2
6.92
4,36
3)(6
8,78
4,94
5)8,1
02,7
21
1.3
18,1
21
(7,1
60
,21
1)
(31
.325
,597
)(1
0,6
65,6
10)
(4.7
02.2
74)
____________
(5,1
17
,92
1)
(15
3,3
62
,99
9)
850,
092
(225
,455
)1,
073,
624
(695,5
06)
(213
, 52
1)(1
,668355)
39.8
71
S(2
6,92
4,36
3)(6
8.7
84
,94
5)
1,3
18,1
21
(7,1
60,2
11)
(31,3
25,5
91)
(10,6
65,8
10)
(4.1
02.2
74)
(5,1
17,9
21)
(153
.362
.999
)
050.
092
(225
,455
)1
.073,8
24
(895
,506
)(2
13,5
21)
(1.8
68.3
55)
39.8
71
Tote
busi
ness
.ype
acti
vit
ies
‘Tot
alpri
mar
ygo
vern
mne
nl
Co
mp
on
ent
unit
s:
Ren
tSt
abili
zatio
nB
erk
eley
lousi
ng
Auth
onty
Tot
alC
ompo
nent
Uni
ts
32
6.7
06
__
__
__
__
__
__
__
__
(4,8
60,3
70)
2.6.b
06
,,
(4.8
60,3
70)
Gen
eral
reven
ues
’T
axes
.
Pro
per
tyta
xes
,le
vied
for
ger
ere!
purp
ose
sP
rop
erty
(ax
es,
levi
edfo
r0081
serv
ice
Pro
per
tyta
xes
for
spec
ial
purp
ose
sL
ifra
ryP
arks
Par
amed
icFi
reS
ales
taxe
sU
ti1y
user
sta
xes
Tra
nsie
ntoc
omilu
mic
yta
xes
Bus
ines
slic
ense
tax
Oth
erta
xes
Un’
eslr
cied
mot
orve
tlid
efe
esO
ther
urr
estr
icte
dst
ate
sLJb
venl
ions
Co
ntr
ibu
tio
ns
not
rest
rict
edto
spec
ific
pro
gra
ms
Inves
tmen
tea
rn-r
igs
Mis
cel’
ar.e
cL.’
sG
ain
onsa
les
otca
pit
alass
ets
Tra
nst
ers
pri
mar
ygo
vern
men
tT
otal
gene
ral
reve
nues
and
tran
sfer
sC
hang
esin
net
asse
tsN
etas
sots
..beg
inni
ng(a
sre
stat
ed)
Not
asse
ts”e
ndin
g
50,4
88.1
38
6,5
49. 1
02
12,9
11,7
51
0.7
5390
12,
335.0
60
5,22
0,82
412
, 133
. 983
14,4
10,8
51
3.6
73,0
2313
,505
, 958
3.44
002
58
,54
3,0
43
386,
461
665,
255
5.8
58,95
‘3l.
’93
684
50
,48
8.1
30
8,5
49. 7
02
13,9
11,7
5I8,1
53,9
07
2,33
5,06
05,2
20,8
24
12,7
33,9
8314
,410
,851
3,6
73
,02
3
13.
505
,‘7
583,
440.
025
8,5
43
.64
3386,4
61
665,
255
6,9
35,4
31
,493
584
10,1
42
155,0
66
439
664,
191
405,
516,
209
$4
06
,10
0.4
00
Indi
rect
Exp
ense
sE
xp
ense
sA
lloc
atio
n
Cap
ital
Cha
rges
for
Gra
nts
and
Gra
nts
and
Serv
ices
Can
tri,u
[iui
sC
ontr
ibut
ions
$(4
.943
.2/8
)
121,
846
SS
190,
482
276,
942
4,0
01
,39
1
15.5
54.6
8421
2.5
61II
403.
944
44.3
52
31.7
72,3
55
$
__________
Com
pone
ntU
nits
Tot
alR
ent
Ber
kele
y
_________________
Stab
iliza
tion
Hou
sing
Aut
hori
ty
S
(4,5
93
,33
6)
27,9
56,0
04
8,1
02
.72
1—
360,
052
858,
266
231
.743
2,19
0.66
595
2,61
014
,963
67
,03
/.0
28
4,5
93,3
35
70,5
76,1
51
14
,96
3-
-
292,8
25,3
44
$08
.533
.055
531,
/87,
318
_s,,g
.102
.721
(153
,362
.999
)S
3.4
82219
3,8
06,9
25
24,2
59,4
33—
289,
610
18.8
17,
528
291,
016
527.1
41,6
52
$‘
$4,0
98,5
43
$18,8
17,5
26
$29
1,91
6
(1,0
39,2
50)
(I,0
39.2
50)
(1,0
39,2
50)
(154.4
02,2
49)
1.3
56.4
72
10,1
42
(837,0
18)
240,
196
(799
,053
)15
1,27
7.4
49
$165,4
/6,3
96
83/o
il15
4.62
6,24
21,
463,
244
238,
238,
760
$239,7
02,0
04
386.
190
________________
386,
190
32
6.7
06
(4.4
14,1
80)
255,
126
11.6
04,6
40$
581.
832
$7,
130,
460
The
acco
mpa
nyin
gno
tes
are
anin
tegr
alpa
ntot
loos
et’i
nanc
iai
stat
emen
ts
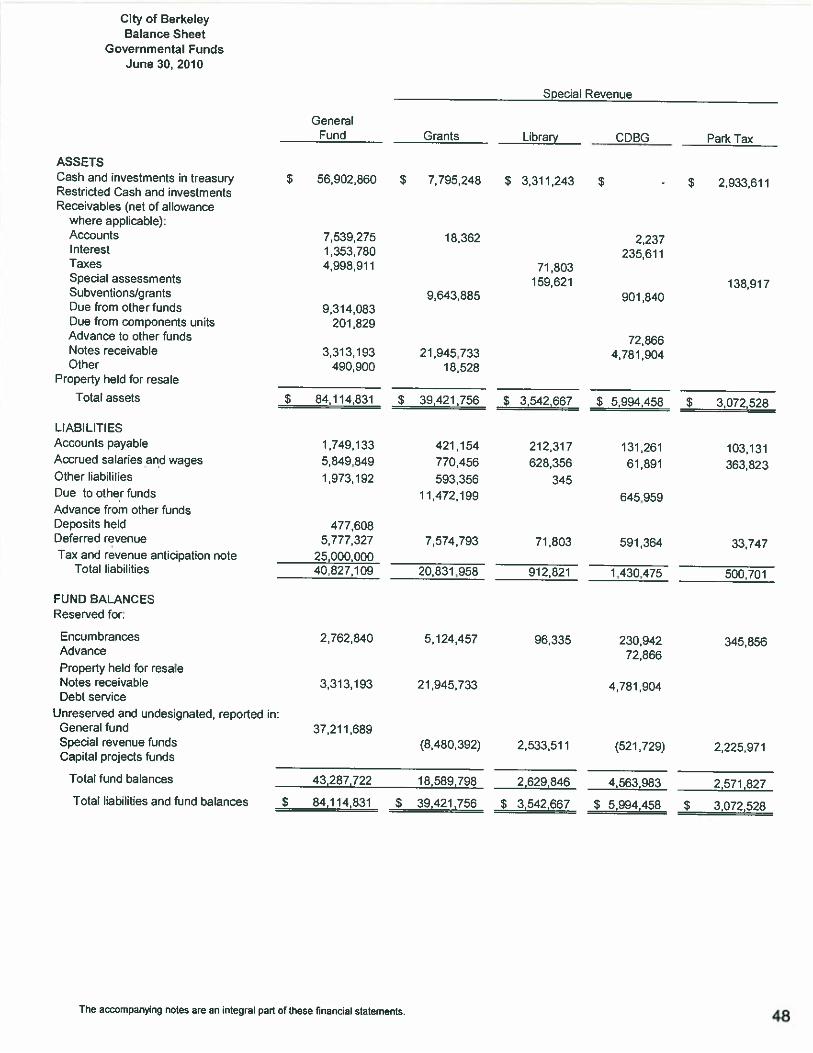
City of BerkeleyBalance Sheet
Governmental FundsJune 30, 2010
GeneralFund
Special Revenue
Grants Library CDBG Park Tax
ax and revenue anticipation noteTotal liabilities
EncumbrancesAdvanceProperty held for resaleNotes receivableDebt service
7,5392751,353,7804,998,911
9,314,083201,829
3,313,193490,900
477,6085,777,327
25,000,00040.827,109
2,762,840
313, 193
37,211,689
18,362
9,643,885
21,945.73318.528
71,803159,621
2,237235,611
901,840
72,8664,781,904
S 56,902,860 $ 7.795,248 $ 3,311,243 $
ASSETSCash and investments in treasuryRestricted Cash and investmentsReceivables (net of allowance
where applicable):AccountsInterestTaxesSpecial assessmentsS ubve nti o ns)g rantsDue from other fundsDue from components unitsAdvance to other fundsNotes receivableOther
Property held for resale
Total assets
LIABILITIESAccounts payableAccrued salaries and wagesOther liabilitiesDue to other fundsAdvance from other fundsDeposits heldDeferred revenueT
S 2,933,611
138,917
S 84,114,831 $ 39,421,756 $ 3,542,667 $ 5,994,458
FUND BALANCESReserved for:
1,749,133 421,154 212,3175:849,849 770,456 628.3561,973,192 593,356 345
11,472.199
7,574,793 71,803
20831,958 912,821
5,124,457 96,335
21.945,733
(8,480,392) 2,533,511
5 3,072,528
131,261 103,13161,891 363,823
645,959
591,364 33,747
1 430.475 500,701
230,942 345,85672,866
4,781,904
(521,729) 2,225,971
4,563,983 2,571,827
S 5.994,458 $ 3,072.528
Unreserved and undesignated, reported in:General fundSpecial revenue fundsCapital projects funds
Total fund balances
Total liabilities and fund ba!arces
43,287,722 18,589,798 2,629,846
$ 84,114,831 S 39,421.756 $ 3,542,667
The accompanying noles are an integral part of these financial slalernen’.s 48

City of BerkeleyBalance Sheet
Governmental FundsJune 30, 2010
Capital Project
Cash and investments in treasuryRestricted Cash and investmentsReceivables (net of allowance
where appilcable):AccountsInterestTaxesSpecial assessmentsSubventions/g rantsDue from other fundsDue from components unitsAdvance to other fundsNotes receivableOther
Property held for resale
________________ _______________
LIABILITIESAccounts payableAccrued salaries and wagesOther liabilitiesDue to other fundsAdvance from other fundsDeposits heldDeferred revenueTax and revenue anticipation note
_________________ ________________
Total liabilities
_________________ ________________
FUND BALANCESReserved for:
EncumbrancesAdvance
Property held for resaleNotes receivableDebt service
Unreserved and undesignated, reported inGeneral fundSpecial revenue fundsCapital projects funds
Total fund balances
________________ _______________
Total liabilities and fund balances $ 8.635342 S 19879.908
ASSETS
OtherMeasure FF Capital Governmental Governmental
Branch Renov Improvement Funds
—-
Funds
Total
S 8,635,342 $ 6,886,530 $ 34,605,0419,887,712
1 000,000501,303
3,551,799
7,940,276
Total assets
919,045399,791400,764
1,069,814
15,645,601
$ 121,069,8779,887,712
9478,9192,490.4855,471,478
298,53811,615,53812,865,881
201,82972,866
53,626706509,428211,347
_______________
211,347S 8,635,342 $ 19.879,908 S 63,139,115 $ 227.800.503
123,921 349,909 1,713,921 4,804,746462 48,509 832,620 8,555,966
452,448 3,019,341641,403 12,759,561
72,866 72,86612,942 185,093 675,643
502,303 1,509,325 16,060,66125,000.000
124,383 913,663 5,407,675 70,948,783
2,801,514 1,272,792 7,358,285 1 9,993,02072,866
211,347 211,3477,940,276 15,645,601 53,626,706
11,125,069 11,125,069
37,211,68913,037,921 8,795,283
5,709,445 9,753177 10,353,219 25,815,840
8.510,959 18,965,245 57,731,440 155,851820
$ 63,139,115 S 227.800.603
The accompanying notes are an integral part of these rinancia: statemar.ts. 49
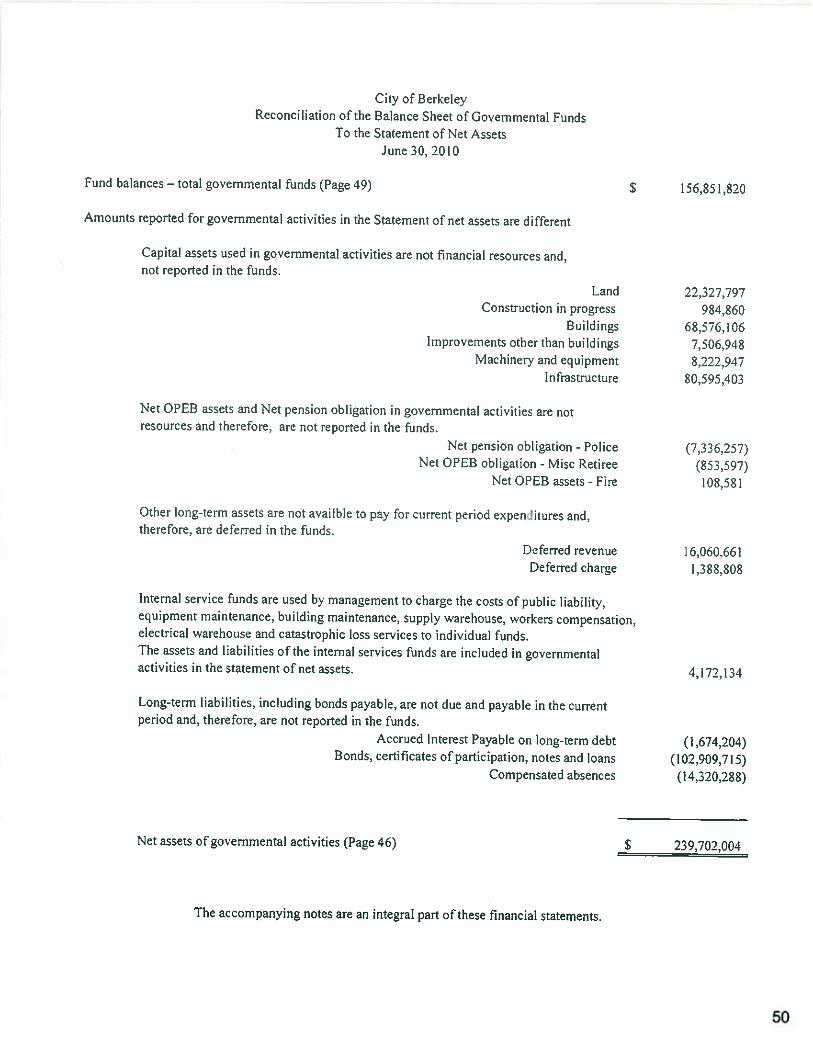
City of BerkeleyReconciliation of the Balance Sheet of Governmental Funds
To the Statement of Net AssetsJune 30. 2010
Fund balances — total governmental funds (Page 49)
Amounts reported for governmental activities in the Statement of net assets are different
Capital assets used in governmental activities are not financial resources and,not reported in the funds.
Net OPEB assets and Net pension obligatinn in governmental activities are notresources and therefore, are not reported in the uds.
Other long-term assets are not availble to pay for current period expenWtures and.therefore, are deferred in the funds.
Internal service funds are used by management to charge the costs of public liability,equipment maintenance, building maintenance. suppy warehouse, workers compensation.electrical warehouse and catastrophic loss services to individual funds.The assets and liabilities of the internal services funds are included in governmentalactivities in the statement of net assets.
$ 156,851,820
Long-term liabilities. including bonds payable. are not due and payable in the currentperiod and, therefore, are not reported in the funds.
Acciued Interest Payable on long-term debtBonds, certificates of participation, notes and loans
Compensated absences
Net assets of governmental activities (Page 46)
The accompanying notes are an integral pan of these financial statements.
(1,674.204)(102,909,7] 5)(14,320,288)
S 239.702.004
LandConstruction in progress
BuildingsImprovements other than buildings
Machinery and equipmentIi irastruciure
Net pension obligation - PoliceNet OPEB obligation - Misc Retiree
Net OPEB assets - Fire
22,327,797984,860
68.576.1067.506 .94 88 .222,947
80,595,403
(7.336.257)(853,597)
10 8,58 I
16.060.6611,388,808
4,172,134
L.ferred revenueDefened charge
50
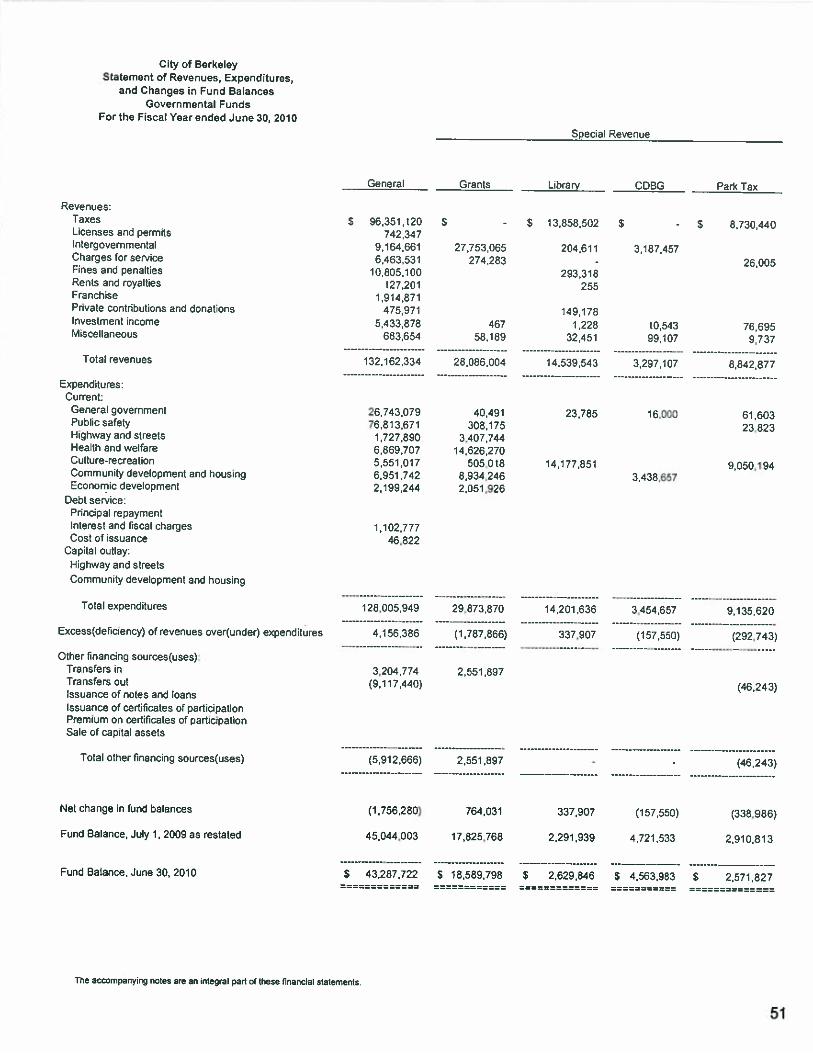
City of BerkeleyStatement of Revenues, Expenditures,
and Changes in Fund BalancesGovernmental Funds
For the Fiscal Year ended June 30, 2010
Special Revenue
General Grants Library CDBG Park Tax
Revenues:Taxes $ 96.351120 S - $ 13,858502 S - $ 8,730.440Licenses and permits 742.347Intergovernmental 9.164.661 27,753065 204,511 3,187.457Charges for service 6463,531 274,283
- 26,005Fines and penalties 10:805,100 293.318Rents and royalties 127,201 255Franchise 1,914,871Private contributions and donations 475,971 149,178Investment income 5,433.878 467 1,228 10,543 76.695Miscellaneous 683,654 58,189 32,451 99,107 9,737
Total revenues 132,162,334 28,086,304 14,539,543 3,297,107 8.8d2.877
Expenditures:Current:
General government 26,743,079 40,491 23,785 16,000 61,603Public safety 76,813,671 308,175 23,823Highway and streets 1,727,890 3,407,744Hearth and welfare 6,869,707 14,626,270Culture-recreation 5,551,017 505018 14,177,851 9,050,194Community development and housing 6,951,742 8,934.246 3,436.657Economic development 2,199,244 2,051,926
Debt service:Frincipal repaymentInterest and fiscal charges .l02,777Cost of issuance 45,822
Capital outlay:Highway and streetsCommunity development and housing
Total expenditures 128,005.949 29,873,870 14,201,636 3,454,557 9,135,620
Excess(deficiency) of revenues over(under) expendIures 4,156,386 (1,787,866) 337,907 (157,550) (292.743)
Other financing sources(uses):Transfers in 3,204,774 2,551,897Transfers out (9,117,440) (46,243)Issuance of notes and loansIssuance of certificates of participationPremium on certificates of participationSale of caplai assets
Total other financing sources(uses) (5,912,666) 2,551.897 -- (46.243)
Net change in fund balances (1,756,280) 764,031 337,907 (157,550) (338,986)
Fund Balance, July 1,2009 as restated 45,044,003 17,825,768 2,291,939 4,721,533 2,910,813
Fund Balance, June 30, 2010 $ 43.287,722 S 18,589.798 $ 2.629,848 S 4,563,983 $ 2,571,827
The acccn-pary:rg notes are en inegrai part cii these frraciai staiemer.s.
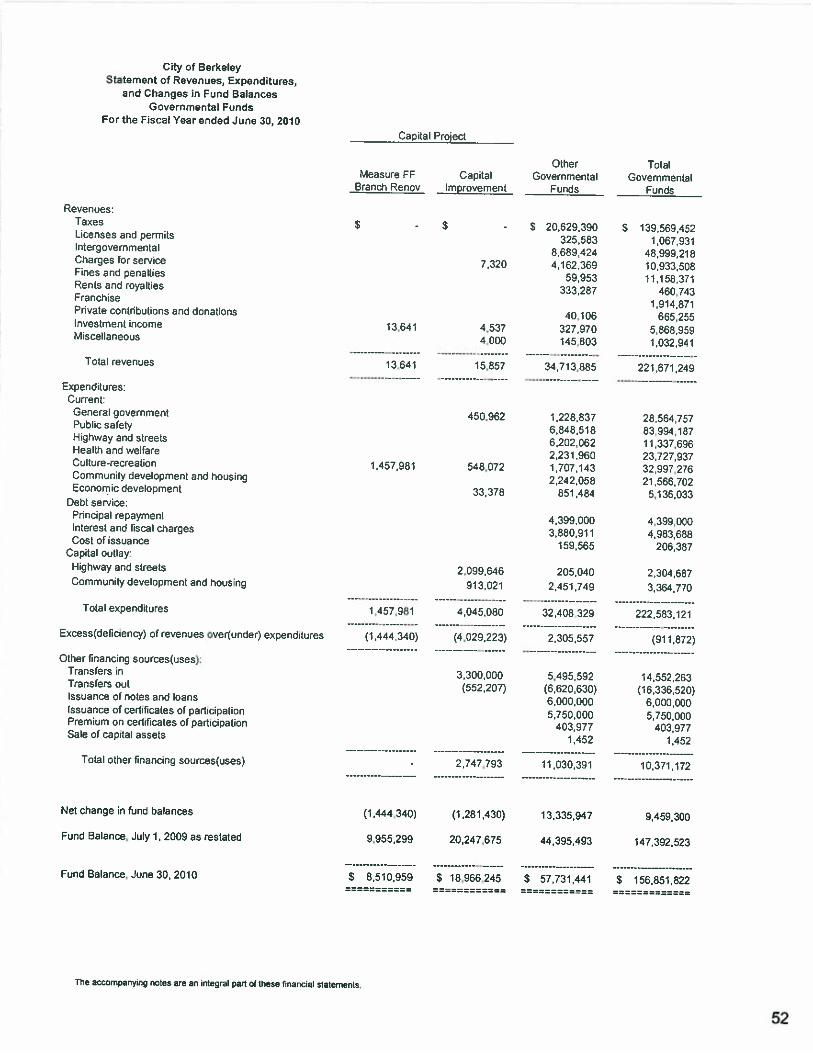
City of BerkeleyStatement of Revenues, Expenditures,
and Changes in Fund BalancesGovernmental Funds
For the Fiscal Year ended June 30, 2010Capital Prolect
Other TotalMeasure FF Capital Governmental Governmental
Branch Rencv Improvement Funds Funds
Revenues:Taxes $ - $
- $ 20,629,390 $ 139,569,452Licenses and permits 325,583 1,067,931Intergovernmental 8,689,424 48,999,218Charges for service 7,320 4,162,369 10,933,508Fines and penalUes 59.953 ii.56,371Rents and royalties 333.287 460743Frar,cnise 1,914,871Private contributions and donations 40,106 665,255Investment income 13,641 4,537 327,970 5,868,959Miscellaneous 4,000 145,803 1,032,941
Total revenues 13.641 15,857 34,713,885 221,671,249
Expendilures:Current.General governmenl 450,962 1,228,837 28,564,757Public safety 6,848,518 s3:99a.1e7Highway and streets 6.202.062 11,337,696Health and welfare 2.231.960 23,727,937Culture-recreation 1.457981 548,072 1,707,143 32,997,276Community development and housing 2,242,058 21,566,702Economic development 33,378 851,484 5,136,033
Debt service:Principal repayment 4,399.000 4.399.0CC’Interest and fiscal charges 3,880,911 4.983,688Cost of issuance 159,565 206,367Capital outlay:Highway and streets 2,099,646 205,040 2,304,687Community development and housing 913,021 2,451,749 3,364,770
Total expendilures 1,457,981 4.045.080 32.498.329 222,583,121
Excess(deficiency) of revenues over(under) expenditures (1,444,340) (4,029,223) 2,305,557 (911,872)
Other financing sources(uses):Transfers in 3,300,000 5,495.592 14.552,253Transfers out (552,207) (6,620,630) (16,336,520)Issuance of notes and loans 6.000.000 6.000,CCOIssuance of certificates of participation 5,750,000 5,750,000Premium on certificates of participation 403,977 403,977Sale of capital assets 1,452 1,452
Total other fnancing sources(uses)- 2,747.793 1:030.391 10,37’,172
Net change in fund balances (1,444,340) (1,281,430) 13,335,947 9,459,300
Fund Balance, July 1,2009 as restated 9.955,299 20,247.675 44,395.493 147.392,523
Fund Balance, June 30, 2010 $ 8,510,959 $ 18,966,245 $ 57.731,441 $ 156,851,822
The accompany,ng notes are an inlegral part of Ihese financial statements.
52
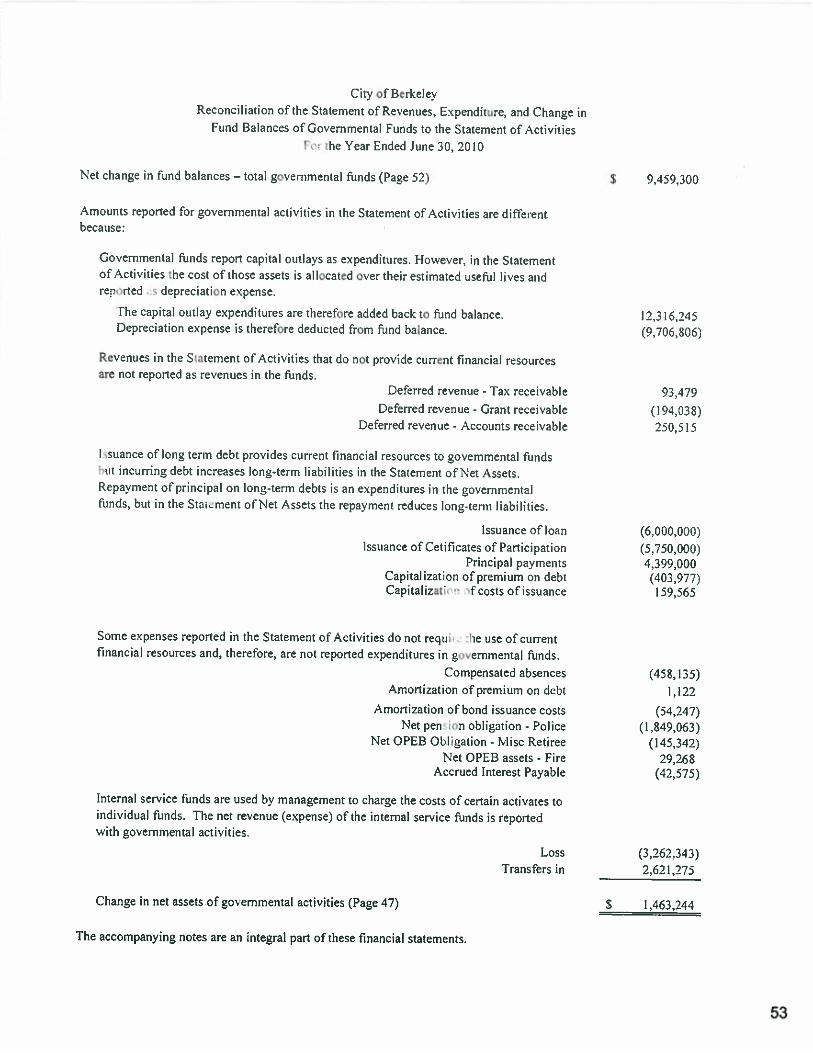
City of BerkeleyReconciliation of the Statement of Revenues, Expenditure, and Change in
Fund Balances of Governmental Funds to the Statement of ActivitiesPer the Year Ended June 30, 2010
Net change in fund balances — total governmental funds (Page 52) S 9.459,300
Amounts reported for governmental activities in the Statement of Activities are differentbecause:
Governmental funds report capital outlays as expenditures. However, in the Statementof Activities the cost of those assets is al!ocated over their estimated useful lives andreterted .5 depreciation expense.
The capital outlay expenditures are therefore added back to fund balance. 12,316,245Depreciation expense is therefore deducted from fund balance. (9.706,806)
Revenues in the Statement of Activities that do not provide current financial resourcesare not reported as revenues in the funds.
Deferred revenue - Tax receivable 93.479Deferred revenue - Grant receivable (194.038)
Deferred revenue - Accounts receivable 250,515
lcsuance of long term debt provides current financial resources to governmental fundsbut incurring debt increases long-term liabilities in the Statement of Net Assets.Repayment of principal on long-term debts is an expenditures in the governmentalfunds, but in the Statment of Net Assets the repayment reduces long-term liabilities.
Issuance of loan (6,000,000)Issuance of Cetificates of Participation (5.750.000)
Principal pay:nents 4599.000Capitalization of premium on debt (-103.977)Capitalizati “ fcosts of issuance 159,565
Some expenses reported iii the Statement of Activities do not requir. he use of currentfinancial resources and, therefore, are not repcrted expenditures in ge’ ernniental funds.
Compensated absences (458.i35)Amortization ofpreniium on dcbt 1.122
Amortization of bond issuance costs (54,247)Net pen on obligation - Police (1,849,063)
Net OPEB Oblication - Misc Retiree (145,342)Net OPEB assets - Fire 29,268
Accrued Interest Payable (42,575)
Internal service funds are used by management to charge the costs of certain activates toindividual funds. The net revenue (expense) of the internal service funds is reportedwith governmental activities.
Loss (3,262,343)Transfers in 2,621,275
Change in net assets of governmental activities (Page 47)
The accompanying notes are an integral part of these financial statements.
S 1.463.244
53
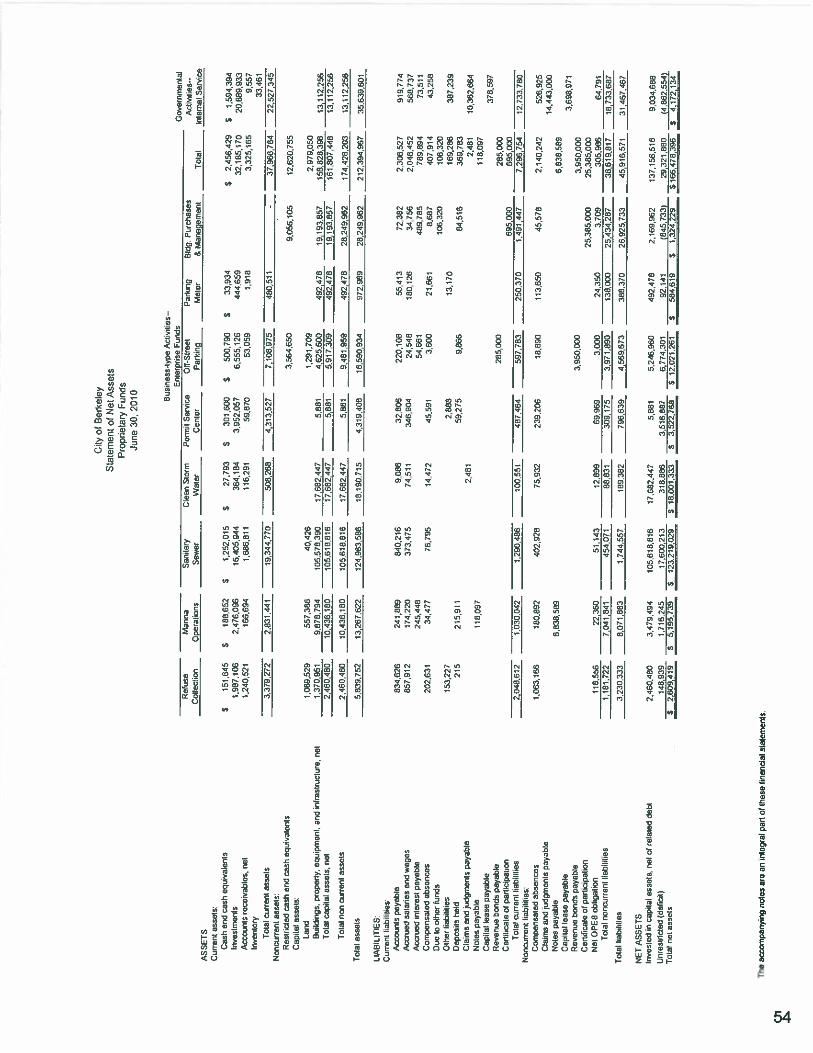
Ctty
ofB
erke
ley
Sla
:em
ent
ofS
etA
sset
sP
roor
ieta
ryF
cr.
sJu
ne
30,
2010 B
usi
nes
s-ty
pe
Act
ivit
Ies—
ASS
ETS
Curr
ent
ass
ets
:C
ash
and
cash
equiv
alen
tsIn
ves
tmen
tsA
ccou
nts
rece
ivab
les,
net
Inven
tory
Tot
alca
xree
tas
sets
Nonaj
nre
nl
ass
ets
:R
esI
ded
cash
arid
cash
equ
ival
ents
Cap
ital
ssse
sL
and
flu
ikti
nçs
.pr
oper
ty.
equix
lenl.
and
Lta
skru
ch
re.
net
Tot
alca
pita
las
sets
,net
To
tsl
non
ojn
nl
ass
ets
Tot
alas
sets
LIA
BIL
ITIE
S:C
urre
ntli
abil
itie
s:A
ccou
nts
pay
able
Acc
rued
sala
ries
and
wag
esA
ccru
edin
tere
stp
ayab
leC
om
pen
sate
dab
sen
ces
Cue
tooth
erfu
nds
Oth
erli
abil
itie
sD
epo
sits
hel
dC
ts:m
san
cpd90le
nls
pay
able
Not
esp
ayab
leC
ao’t
atea
sepay
able
Rev
r’u
eco
no
sp
ayab
leC
erti
fica
teci
pen
iwp
atio
nT
otat
curr
ent
tisb
itit
-es
Ncn
c.rr
ront
liab
ilit
ies
Co
nio
a,sa
ted
azse
rce3
Cla
ims
and
jud
gm
ents
pay
able
Not
esp
ayab
leC
apit
alle
ase
pay
able
Rev
enu
eb
on
ds
pay
able
Cer
tifi
cate
ofpa
rtic
ipat
ion
Net
OP
EB
obli
gati
onT
otal
no
ncu
rren
tli
abil
itie
s
Tot
alli
sbil
itie
s
NE
TA
SS
ET
SIn
ves
ted
Inca
pit
alass
ets
,n
etat
rela
ted
deb
t
Unre
stri
cted
(def
idi)
Tot
alre
tass
ets
10
69
.52
955
7,38
640.4
26
1.37
095
19,8
18,7
94
105.5
78390
2.4
63.4
80
10.4
36,1
83
105
61
6.8
’s
2.9
19.0
50
156
626,3
98
13.1
12,2
56
161
807,4
48
13.1
12,2
56
Ente
rpri
seF
unds
Gover
nm
enta
lR
efuse
Mer
ina
Ssn
ilar
yC
lean
Sto
rmP
erm
itS
ervi
ceO
lt-S
lree
lP
arki
ngB
ldg
Pu
rch
ases
Act
ivit
ies.
.C
olle
ctio
nO
per
atio
ns
Sew
erW
ater
Cen
ter
Met
er&
Man
agem
ent
Tot
alIn
tern
alS
ervic
e
$15
1,54
5S
188,
652
$1,2
52.0
15
$27
,793
$30
1,60
0$
500.
790
$33
,934
1987106
2.4
76,0
96
16,4
05.9
44364,1
84
3,9
52,0
57
6,5
55,1
26
444,6
59
1.24
0,52
116
6,69
41.
686,
811
116.
291
59,8
7053
.059
1.91
6
3.3
79.2
72
2,8
3’,
441
19.3
44.7
70
566,
268
4,3
’3,5
27
7.10
597
548
0,51
1
$2,
456,
429
$1,
594,
394
32.1
85.1
70
20,8
89.9
33
3.3
25.1
65
9,55
733
.461
7.68
2.44
75.
881
7.68
244
75,
881
3564.6
50
1,2
91,7
09
4,6
25,6
00
5,91
7,30
9
-37.9
66
764
22
.52
7.3
’5
9,0
56,1
05
12,6
70,7
55
492.
478
19,’
93857
492.
278
19‘9
385
7
2.4
63,4
50
10
,43
61
83
105.6
18.8
16
17.6
82.4
475,
861
9,4
51959
492478
28
,24
99
62
174,4
28,2
03
13,1
12,2
56
5,8
39.1
5?
13,2
67.6
22124,9
63,5
86
18.1
90.7
154,3
19.4
08
16.5
90,9
34972,9
59
28.2
49.9
62
212394,9
67
35,6
39,6
01
834,6
26
241,8
89
840,
216
9,08
632
,806
220,1
08
55,4
13
72,3
822,3
06,5
21
919,
774
857,
912
114.
220
373.
475
14,5
1134
6,90
424.5
48
160,
126
34,7
562,0
46,4
52
568.
737
245,4
48
54.6
6148
9.78
5789,e
94
73,5
1120
2,63
134
,477
76,7
9514
,472
45.5
913,
600
21.6
618687
401,
914
43.2
58
106,
320
106,
320
I53,
227
2,88
813
.170
169.
286
387,2
39
215
215,9
159.2
75
9,6
66
84,5
16
369,7
63
2,4
82,
48’
10.3
62,6
64
118.
091
110,
097
378,
597
285,3
00
285,3
00
695,0
00
695,0
00
2.0
48.6
12
1.0
3-3
042
1,2
90
,48
6190,5
51
487
454
59
7,7
83
250,3
73
1491,4
47
7,2
96
,75
412133.7
%
1,0
63,1
66
180,
292
4C2
928
5,9
32
239,
206
8,89
3113650
45,5
76
2.1
40,2
42
528,
925
14,4
43,0
00
6,8
38,5
89
6,5
38,5
89
3,69
8,97
13,9
50.0
00
3,9
50,0
00
25,3
65,0
00
25,3
85,0
30
118,
556
22,3
6051,1
43
12,8
9969,9
69
3.00
024,3
50
3,70
9305,9
86
64,7
911,1
81,7
22
7,04
1,84
145
4,07
188
,831
309,
115
3,9
71,8
90
138,
000
25,4
34,2
87
38,6
19,0
17
18,7
33,6
87
3,2
30,3
33
8,0
71,8
83
1,7
44,5
5/
189,
382
796,
639
4569673
385,
370
26,9
25,7
33
45,9
16,5
7131,4
67,4
67
2,4
60,4
50
3.4
79,4
94
10
5.6
18
,86
11,6
82,4
41
5,88
15
.246,9
60
492.4
78
2,1
69,9
62
137.1
56,5
16
9,0
34,6
88
148.
939
111
6.24
5‘7
.62
021
33’8
,886
3.51
588
76,
774.
301
9214
10
45
,73
3)
29,3
21.8
80
(4.8
63,5
54,1
S2,
609
419
S5,1
95,7
39
S12
32
19
.02
9S
18
.C3
1.3
33
S3
52
2.7
68
12,0
2126
S584.6
19
51,
324,
225
51
66
,41
039
65
4,1
72,1
34
the
acco
mpan
yin
gnote
sar
ean
inte
gral
part
otth
ese
fina
ncia
lst
atem
ents
.
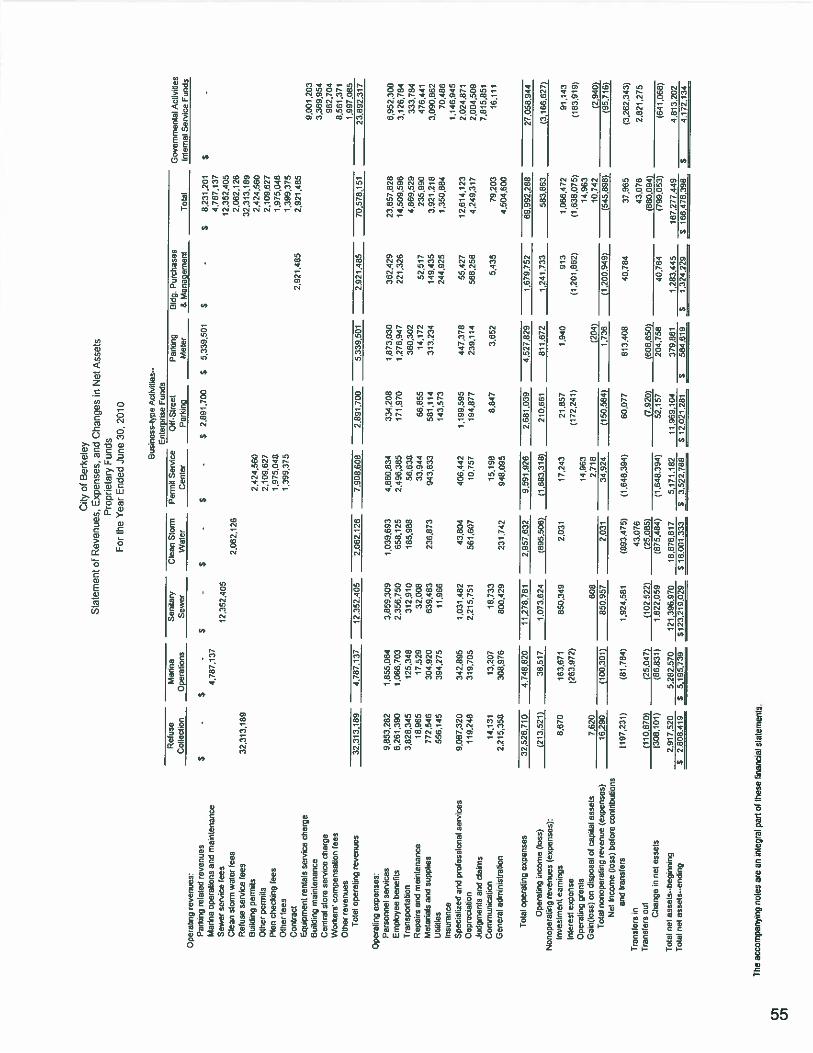
City
ofB
erke
ley
Sta
tem
ent
ofR
even
ues,
Exp
ense
s,an
dC
hang
esin
Net
Ass
ets
Pro
pri
eta
Fun
dsF
crth
eY
ear
End
edJu
ne30
,20
10
Bu
sin
ess-
typ
eA
ctiv
itie
s..
__
__
__
__
__
__
______________
______________
__
__
__
__
__
__
__
__
__
__
__
__
__
Ente
rpri
seF
unds
Ref
use
Mar
ina
San
itar
yC
lean
Sto
rmP
erm
itS
erv
ice
Off
-Str
eet
Par
king
Bld
g.P
urc
has
esG
over
nm
enta
lA
ctiv
itie
sC
olle
ctio
nO
per
atio
ns
Sew
erW
ater
Can
ter
Par
king
Mcr
er&
Man
agem
ent
Tot
alIn
lem
atS
ervic
eF
unds
Op
erat
ing
reven
ues
:P
arki
ngre
late
dre
ven
ues
$-
$-
$-
$-
$-
$2891
.700
$5,3
39.5
01
$-
$8,
231
.201
$-
Mar
ina
op
erat
ions
and
mai
nte
nan
ce4
,78
7,1
37
4.7
87.1
37
Sew
erse
rvic
efe
es1
2,3
52
.40
512,3
52,4
05
Cle
anst
orm
wat
erfe
es2
.06
2.1
26
2.0
62.1
26
Ref
use
serv
ice
fees
32
.31
31
89
32,3
13,1
89
Sui
ldin
gper
mit
s2
.42
4.5
60
2,4
24.5
60
Oth
erper
nit
s2
.10
9.6
21
2.1
09.6
27
Pla
ncte
ck
irg
tees
1.9
75
.04
61,9
75,0
46
Oth
erfe
es1
399,3
75
1,3
99,3
75
Contr
act
2.9
21.4
85
2,0
21,4
65
Eguin
rnen
tre
nts
’sse
rvic
ech
arge
9,00
1.2
03B
uitd
:ng
rrai
nre
nan
ce3,3
69,9
54
Cen
tral
store
sei’
vice
dam
e962,7
04
wort
iers
’co
rrss
sens
atio
rfo
ss8,5
61,3
71
Other
rev
en
ues
__
__
__
__
__
__
______________
__
__
__
__
__
__
__
_____________
_____________
__
__
__
__
__
__
_
i.9
97,0
65
Tot
alo
per
atin
gre
ven
uos
32
.31
3.1
89
4.7
87
.13
71
2,3
52
,40
52
.06
2,1
26
7,9
08
.60
52
.89
1.7
00
5.3
39,5
01
2.9
21.4
85
70,5
76,1
51
23,8
92,3
17
Op
erat
ing
expen
ses:
Per
sonnel
serv
ices
9.8
53
,26
21,8
55,0
64
3,8
59
,30
91
.03
9,6
93
4,6
60
,83
4334.2
08
1,8
73.0
30
362,4
29
23857,8
26
6,9
52,3
00
Em
plo
yee
ben
efit
s6
,26
1,3
90
1,0
66
,70
32
,35
6,1
50
658,1
25
2,4
96
.38
5171,9
70
1.2
76,9
47
221,3
26
14.5
09,5
96
3,1
26,7
84
Tra
nsp
orl
atio
n3
.62
8,3
45
125,3
46
312.9
10
185,9
88
56
.63
83
60
,30
24669,5
29
333,7
84
Rep
airs
and
mai
nte
nan
ce18
,965
17.5
29
32
,00
833,9
44
66,8
55
14.1
7252,5
17
23
5,9
90
476,
441
Mat
eria
lsan
dsu
pp
lies
77
2.5
46
304920
639,4
63
236,8
73
943,6
33
561.1
14
313.2
34
149,4
35
3.9
21,2
18
3,0
90,6
62
util
itie
s5
56
,14
5394.2
75
11.9
66143.5
73
24
4,9
25
1.3
50.8
84
70,4
86
Insu
rance
1.1
46,9
45
Spec
iali
zedar
pro
tess
ional
serv
ces
9,0
87
,32
03’2
.695
1,0
31
.26
243,6
04
426.4
42
1.1
99
,59
54
47
,37
855.4
27
12.6
12.1
23
2.0
24,8
71
Do
pre
ciah
on
11
9,2
48
319.1
05
2,2
15.7
51
561,
6-07
1C.1
57192,8
77
239,1
14
558,2
58
4,2
49,3
17
2,C
04,5
09
Jusg
men
tsan
dd
awn
s7
,8’5
,85
1C
cmm
urs
icat
icn
14,1
3113
,207
18.7
33
15,1
98
8,8
47
3.6
52
5.4
35
79,2
03
16,1
11G
ener
alad
m,n
istr
alio
n2
.21
5.3
58
308,9
76
800,4
29
231.7
42
948,0
95
4,5
04,6
00
Tot
alo
per
atin
gex
pen
ses
32526.7
04
.74
8.5
20
11.2
78.7
81
2.9
57
.63
29
.59
1.9
26
2,6
81
,03
94.5
27.8
29
1,6
75,7
52
69
.99
2.2
88
27,0
58,9
44
0p
era
’ig
inco
me
(toss
)(2
13
,52
1)
38
,51
11
07
3,6
24
(895,5
06)
11.6
83.3
15)
20
,66
l811.6
72
1.2
41,7
33
583,8
63
(3,1
66,6
27)
No
no
per
atin
gre
ven
ues
expen
ses)
’In
ves
tmo
nt
eam
irig
s3
,67
016
3,67
1850,3
49
2,03
117,2
43
21,6
57
1,94
0913
1,0
66.4
72
91,1
43
Inte
rest
expen
se(2
63,9
72)
(172,2
41)
(1,2
01,8
62)
(1,6
38,0
75)
(183.9
19)
Oper
atin
gg
ran
ts14,9
63
14,9
63
Gai
n(to
aa)
ondis
po
sal
ofca
pit
alass
ets
7,6
20
__
__
__
__
__
__
_
608
_____________
2.7
18
_____________
(204
)
__
__
__
__
__
__
__
__
_
10,7
42(2
,940
)T
otal
nonopar
atin
gre
ven
ue
(expen
ses)
16.2
90
(100.3
01)
850.9
57
2,03
134,9
24
(150,5
84)
____
__
_
1,73
6(1
,200,9
49)
(545.8
98)
(95,7
16)
Net
Inco
me
(los
s)b
efo
reco
ntri
buti
ons
and
tran
sfar
s(1
97,2
31)
(61,7
84)
1,9
24,5
81
(093,4
75)
(1,6
48,3
94)
60
,07
7853,4
08
40,7
84
37,9
65
(3,2
62,3
43)
Tra
nst
ers
in43,0
76
43,0
76
2,6
21,2
75
Tra
nsf
ers
out
(11
0.0
70
)(2
5.04
7)(1
02.5
22)
(25.0
65)
_____________
(7,9
20)
,,_Jq50)
__
__
__
__
__
__
__
__
_
(880,0
94)
____________________
Chan
ge
inne
tass
ets
(30
8.1
01
)(8
6.8
31)
1,6
22
,05
9(8
75,4
64)
(1.6
46.3
541
52.1
57204.7
58
40,7
84
(799.0
53)
(641.0
58)
Tot
alnet
asso
ls--
bs9
innin
g2
.91
7,5
20
5.2
82
,51
0121.3
95.9
70
18.8
1681
75
,17
1,1
52
11.9
59,1
04
379.
861
1.2
83.4
45
167,2
77449
4,8
13
2C2
Tot
alnet
ass
ers
..erd
ing
$2
60
9,4
19
S5.1
95739
5123.2
s9029
S1
8.0
01
.33
3S
3.5
22
.76
8$
12
,02
12
61
S58
4619
S1.3
24.2
29
S‘6
6.4
78
396
$4172.1
34
The
acco
mpan
yin
gn
ote
sar
ean
inte
gral
par
tof
thes
etn
anci
atst
atem
ents
.
01 01
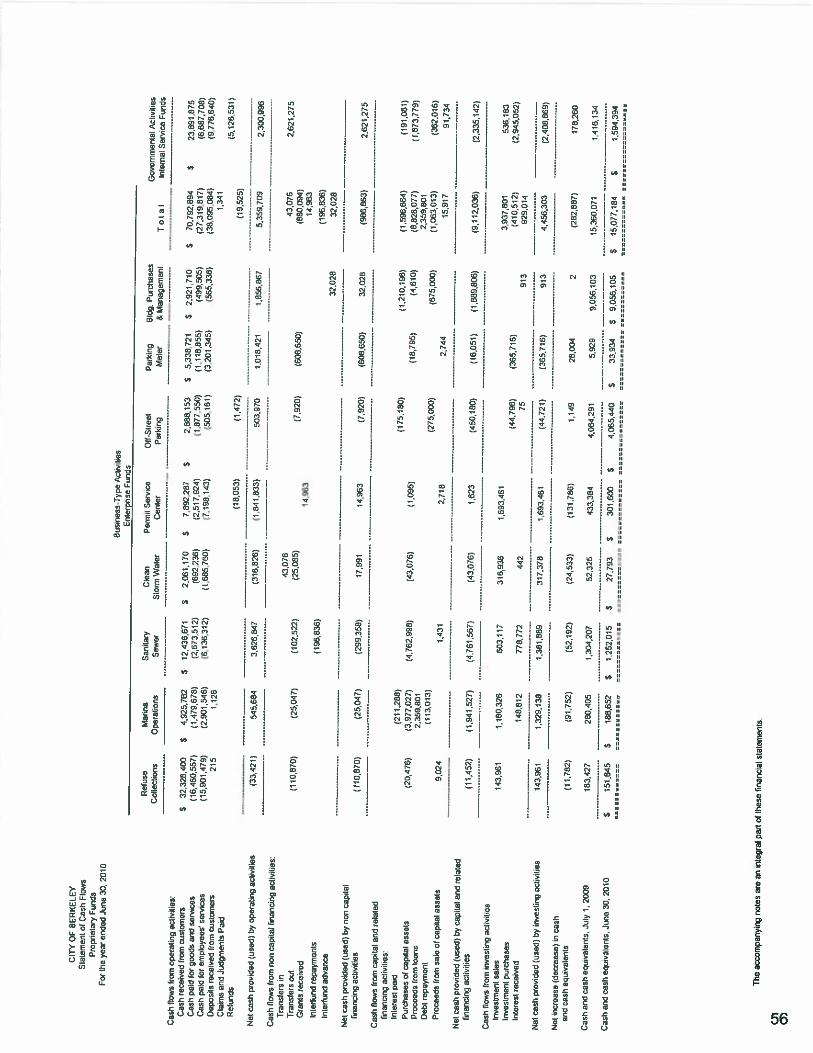
CIT
YO
F0E
RK
EL
FY
Sla
lem
ent
ofC
ash
Flo
ws
Pro
pri
etar
yF
unds
For
lila
yea
ren
ded
JL
Iie
30,
201
Susi
ress
-lype
Act
ivrt
ies
Ent
e-c
SeF
unds
Cas
hfl
ows
from
open
alin
gac
tivi
ties
:C
ash
rece
ived
from
cust
om
ers
Cas
hpa
idfo
rg
oo
ds
and
serv
ices
Cas
hpa
idfo
rem
ploy
ees’
sere
,ces
Dep
cs’t
sre
ceiv
edfr
omcu
sto
mer
sC
laim
san
dJu
dgrn
enii
sP
aid
Rel
unds
Net
cash
prov
ided
(use
d)
byoper
atin
gac
livi
lies
Cas
hfl
ows
from
rn
capi
ta’
finan
c:sg
acli
viti
es:
Tra
nsf
ers
inT
ransf
e’s
carl
Gra
nis
rece
ived
Inte
riun
dre
pay
men
tsln
lerf
und
advan
ce
Net
cash
p’o
vid
ed(u
sed
)by
non
capit
alf’
nan
dng
acli
vili
es
Cas
hfl
ows
from
carv
tal
arId
rela
ted
fina
ncin
gac
livi
ties
Inie
resi
paid
Pu
rch
ases
ofca
pila
las
sois
Pro
ceed
sfr
omlo
ans
Deb
ire
pay
men
i
Ptc
oed
sfr
omsa
leof
capi
lal
ass
ets
Net
cash
prov
’.de
d(u
sed
)by
capi
tal
anc
reta
ced
fina
nCin
gac
tivi
ties
Cas
hllo
’vs
from
inve
stin
gac
tivi
ties
Inve
stm
ent
sale
sln
ves
tmen
lp
urc
has
esIn
fere
sire
cu;v
ed
Net
cash
prov
ided
(use
di
byin
vest
ing
acti
viti
es
Nel
incr
ease
(dec
reas
e)in
cash
and
cash
equiv
aien
ls
110.
810)
(211
,288
)(2
0,41
6)(3
,971,0
27)
2ss
geO
l(1
13,0
131
9,02
1
(11,
452)
(1,9
41,5
27)
Par
king
Bld
g.P
urc
has
esM
eter
&M
anag
emen
l
2,8
68,1
53
$5.
338.
721
S2.9
21.7
10
(1,8
77,5
50)
(1,1
15,9
55)
(499
,505
)(5
05,1
61)
(3.2
01,3
45)
(565
.338
)
$7C
.182
,894
(27.
319
917)
(36.0
55,0
04)
1,34
1
(1,5
96,6
64)
(8.8
28,0
77)
2,35
9,60
1(1
06
3,0
13
)
15.9
17
3,93
7,80
114
10.5
12)
913
929,
014
23,8
91.8
75
(6,6
87,1
00)
(9.1
76.6
40)
536.
183
2.9
45.0
52)
52.3
2543
3,38
44
06
4.2
91
S27
.793
$301,6
00
$4.0
65.4
40
Ref
use
Mar
ina
San
ilar
yC
olle
ctio
nsO
per
airo
ns
Sew
er
S3
2,3
26
.40
0(1
6,4
60
,55
7)
(15,9
01,4
19)
215
$4.9
25.7
82
14
79
51
8)
(2.9
01,5
46)
1,12
6
Cle
anP
erm
itS
ervic
eO
ff’S
iree
tS
torm
Wal
erC
enle
rP
arki
ng
112
,435
,571
2.61
351
2)(6
.136
. 312
)
$2,
C61
.170
692
236)
(1585150)
$7,5
92,2
87
(2.5
17.9
24)
(7,1
9514
3)
S
Gov
ernm
enta
lA
ctiv
itie
sT
01
aI
Inte
rnal
Ser
vic
eF
unds
5,1
26,5
31)
(18,
053)
(1,4
72)
(19,
525)
(33,
421)
545.
684
3,6
26,8
47
(316
,826
)(1
,811,8
33)
503,
970
1,01
8,42
11,
856,
867
5,3
59,1
09
2,3
00,9
96
43.0
7643
,076
2,6
21,2
15
(110
,870
)(2
5,04
7)(1
02,5
22)
(25,
055)
(7,9
20)
(608
,650
)(8
00,0
94)
14,9
6314
,963
(196
,836
)(1
96,8
36)
32,0
2832
,028
(25
047)
(299
,358
)11991
14,9
63(1
,920
)(9
86,8
63)
2.6
21.2
75
(175
,180
)(4
,762,9
98)
(43,
076)
(1,0
95)
(608
.650
)32
,028
(18,
795)
(4,7
61.5
61)
(43,
076)
1,62
3(4
50,1
80)
(1,2
10,1
96)
(4,6
10)
)275
,000
)(6
75,0
00)
1.43
12,7
18
2.14
4
(16,
051)
(1,8
89,8
06)
(44,
796)
(365
,736
)
1,3
81889
311,
378
1.69
3.45
144
,721
)(3
55,7
16)
913
(191
,081
)(1
,873,7
/9)
(362
,016
)
91,7
34
Cas
han
dca
sheq
uiv
alen
ts,
July
1,20
091 6
3,42
1280,4
05
1,30
4.20
7
Cas
han
dca
sheq
uiv
atonis
,Ju
ne
30
,20
10
$15
1,54
5$
1811
652
51.
252.
015
143,
961
11803
26
603.
117
316,
936
1.69
3,46
1
148.
812
718.7
72
42
75
143,
961
1329
,138
(11,
782)
(91.
752)
(52,
192)
(24,
533)
(101
,786
)1,
149
28,0
042
(282
,887
)
(9,1
12,0
36)
(2,3
35,1
42)
4,4
56,3
03
(2,4
08,3
69)
5.92
99,
056
103
33,9
34S
9,0
56,1
05
178,
260
15,3
60,0
711,4
16134
$15,0
17,1
84
$1,5
94,3
94
The
accm
psn
yin
gn
ote
sar
es
nie
wal
p1
cIhose
!iri
anc’
alst
atem
ents
.

CIT
YO
FB
ER
KE
LE
YS
tate
men
tof
Cas
hF
low
sP
ropri
etar
yF
unds
For
the
yea
ren
ded
June
30,
2010
Busi
nes
s-T
ype
cti
ait
ies
En:m
ise
FLa’
ids
Ref
use
Mar
ha
San
itar
yC
lean
Per
mit
Ser
vice
Off
-Str
eet
Pal
cing
Bld
g.P
urd
iase
sG
over
rwti
erit
alA
clvit
ies
Coll
ecti
ons
Op
erat
ion
sS
ewer
Sto
rmW
ater
Cen
ter
Pai
lin
gM
eter
&M
anag
emen
tT
0I a
IIn
tern
alS
ervic
eF
unds
Rec
ato;a
Eor,
oo
per
atin
gin
com
e(l
oss
)to
fist
oper
atin
gca
sh.
Inco
me
(Fos
s)fr
omoper
atio
ns
$(2
13521)
$38
,517
$1.
073,
624
$(0
95,5
05)
$(1
,603
.318
)$
210,
661
$811,6
72
$1,2
41.7
33
583,8
62
$(3
,166,6
27)
Adj
ustm
ents
tore
conci
lein
com
o(l
oss)
from
oper
atio
ns
tonet
cash
prov
ided
(use
d)
byoper
atn;
act
vibe
sD
epre
ciat
ion
119,
248
319,7
05
2.21
5,75
155
1,60
710
,757
94571
23
9,1
’4586,2
58
4,2
49,3
11
2.0
04.5
09
Chan
ge
inA
ccounts
rece
ivab
le1
67
92
7,41
946
,574
(955
)(2
1,20
0)(3
.548
)(7
80)
225
44.5
2744
4)In
vent
orie
s-
(16.
175)
Acc
ounts
pay
able
(98,
918)
160,
531
203,
164
5,97
0(8
1,68
4)10
2,43
66.
613
8.23
3300,3
45
517,
802
Acc
rued
sala
ries
and
wag
es37
,133
17,2
4893
.226
(3,4
70)
(12,
498)
334
(20,
165)
8,62
412
0,41
217
4,45
1C
om
pen
sate
dab
sence
s156953
1192
)(1
3,62
5)1
33
72
(18,
771)
(50)
(34.
603)
9,01
811
1,42
296
.259
Cla
iman
dJu
dw
nan
tpayabs
2.6
89.3
20
Net
OP
EO
Ob’.
gati
i19
.086
31
68
8,13
32.
151
‘0,3
4173
13.5
775
48.4
9310
,240
Oth
erli
abil
itie
s(1
0,19
4)(7
14
)(3
9,45
9)(1
,172
)13
,170
(98.
669)
(0.0
39)
Net
cash
prov
ided
(use
d)
byo
per
atin
gac
tivi
ties
S(3
3.42
1)$
545,
684
$3,6
26.8
41
S(3
16,8
26)
$1,
841,
833)
$503,9
70
S1,
010,
421
$1,8
58,8
67
S5,3
59,7
09
S2,3
00,9
96
Nor,
cath
inve
stin
g,ca
pita
l,an
dS
nanc
ing
acti
vit
ies
Incr
ease
)decease
)in
fair
val
ueo
fin
ves
tmen
tsS
8.67
05
14.6
59S
71.5
79S
.589
S17
.243
S21
.562
$1940
S-
S137460
$91143
The
acco
mp
any
ing
note
sar
ean
inte
gral
par
tof
thes
efi
nanc
ial
stat
emen
ts.
01
-J
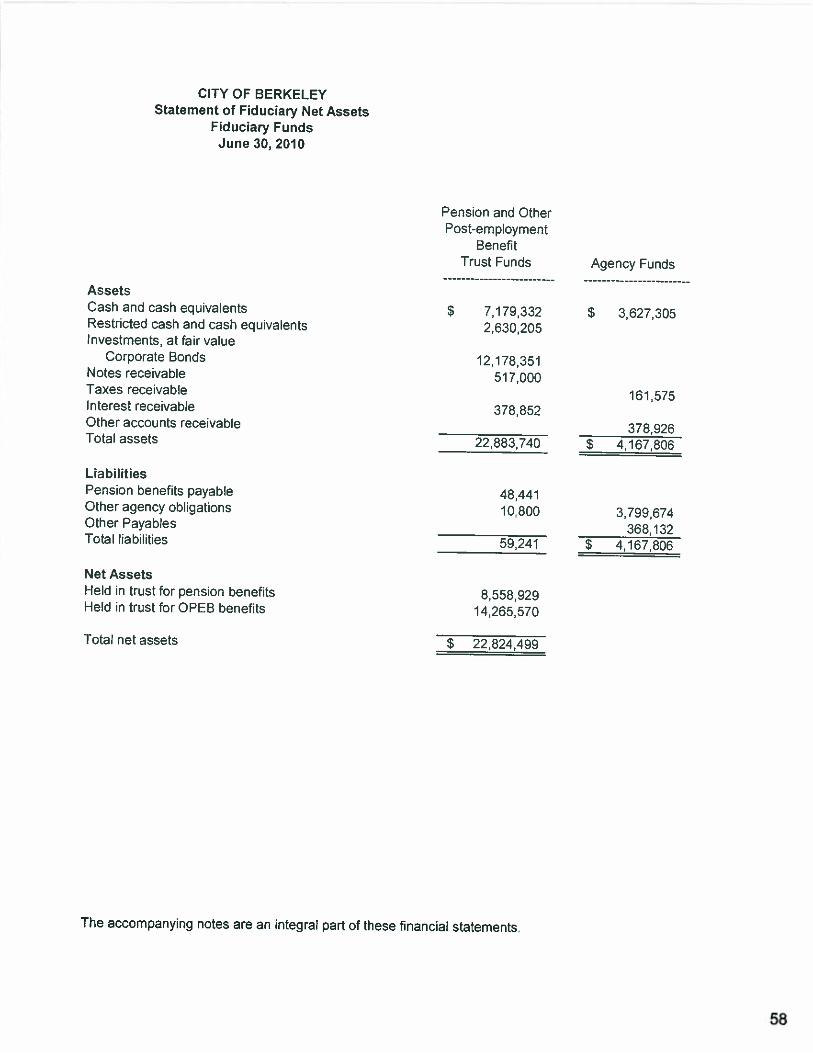
CITY OF BERKELEYStatement of Fiduciary Net Assets
Fiduciary FundsJune 30, 2010
Pension and OtherPost-employment
BenefitTrust Funds Agency Funds
AssetsCash and cash equivalentsRestricted cash and cash equivalentsInvestments, at fair value
Corporate BondsNotes receivableTaxes receivableInterest receivableOther accounts receivableTotal assets
$ 7,179,3322,630,205
12,178,351517.000
378,852
22 883, 740
$ 3:627,305
161,575
378,926$ 4,167,806
LiabilitiesPension benefits payableOther agency obligationsOther PayablesTotal liabilities
3,799,674368,132
$ 4,167,806
Net AssetsHeld in trust for pension benefitsHeld in trust for OPEB benefits
8,558,92914,265,570
Total net assets $ 22,824,499
The accompanying notes are an integral part of these financial statements.
48,44110,800
59,241
58
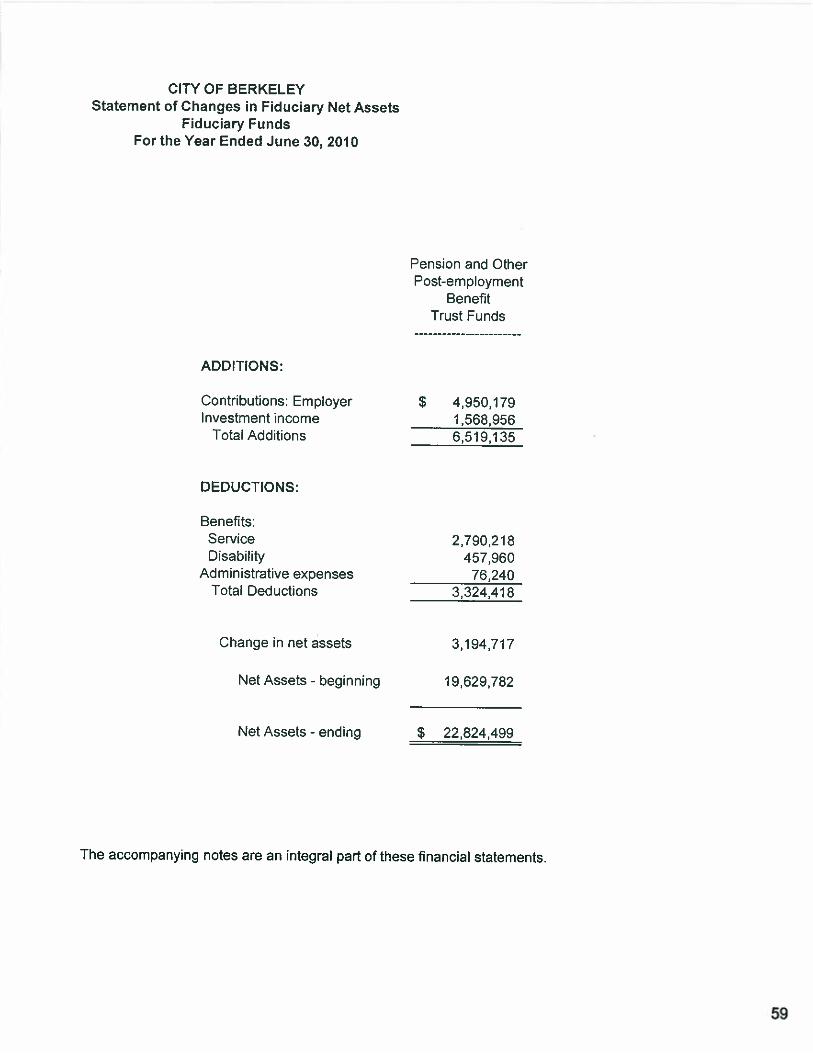
CITY OF BERKELEYStatement of Changes in Fiduciary Net Assets
Fiduciary FundsFor the Year Ended June 30, 2010
ADDITIONS:
Pension and OtherPost-employment
BenefitTrust Funds
Contributions; EmployerInvestment income
Total Additions
$ 4,950,1791568,9566,519135
DEDUCTIONS:
Benefits;ServiceDisability
Administrative expensesTotal Deductions
2,790,218457,960
76,2403.324.418
Change in net assets 3,194,717
Net Assets - beginning
Net Assets - ending
19,629,782
$ 22,824,499
The accompanying notes are an integral part of these financial statements.
59
CITY OF BERKELEY
Notes to the Basic Financial Statements
June 30, 2010
I) Summary of Significant Accounting Policies
A. Description of the Reporting Entity
The City of Berkeley (the City) is a municipal corporation created under the laws of the State ofCalifornia. The City operates under its own charter. The current charter provides for a Council-Managerform of government and the City is governed by an elected mayor and eight-member council. The Cityprovides the following services: public safety (police and fire); sanitation and sewer; housing; leisure(parks, recreation, and marina); health and human services, including City funded health clinics; animalcontrol; public improvements; planning and zoning; libraty services; and general and administrativeservices.
As required by generally accepted accounting principles, these financial statements present the City ofBerkeley- and its component units, entities for which the City is considered to be financially accountable.Blended component units, although legally separate entities, are, in substance, part of the City’soperations. The City is considered to be financially accountable for an organization if the City appoints avoting majority of that organization or there is a potential for that organization to provide specificfinancial benefits to or impose specific financial burdens on the City- The City is also considered to befinancially accountable for an organization if that organization is fiscally dependent (i.e.. it is unable toadopt its budget, levy taxes, set rates or charges, or issue bonded debt without approval from the City). Incertain cases, other organizations are included as component units if the nature and significance of theirrelationship with the City are such that their exclusion would cause the City’s financial statements to bemisleading or incomplete. Each discretely presented component unit is reported in a separate column inthe government-wide financial statements (see note below for description) to emphasize that it is legallyseparate from the City.
Blended Component Units. The Redevelopment Agency (BRA) serves all the citizens of the City and isgoverned by a board comprised of the City of Berkeley’s elected council. Budgeting, accounting andadministrative functions are performed by the City. The BRA is a duly and validly existingredevelopment agency under the Community Development Law (Part I of Division 24, sections 3300 etseq) of the Health and Safety Code of the State of California. The BRA has two active project areas: WestBerkeley and Savo Island. The BRA is reflected as a West Berkeley Improvement Capital Project fundand Debt Service fund, and Savo Island is reflected as a Capital Project fund and Debt Service fund.
Discretely Presented Component Units. The Rent Stabilization Board (Rent Board) is responsible forthe proper administration of programs to regulate residential rents; protecting tenants from unwarrantedrent increases and arbitrary, discriminatory or retaliation evictions; helping maintain the diversity of theBerkeley community; and to ensure compliance with legal obligations relating to the rental of housing.The nine member Board of Commissioners is elected by the citizens. However, the Rent Board is fiscallydependent upon the City because the City Council must approve its annual budgets and authorize anybonded debt.
60
(I) Summary of Significant Accounting Policies (Continued)
The Berkeley Housing Authority (BHA) is a Public Housing Agency as defined in Section 8 of the UnitedStates Housing Act of 1937, and a public body corporate and politic established pursuant to the CaliforniaHousing Authorities Law, Health and Safety code Section 34200 et seq. It was organized in 2007 underthe laws of the State of California and was established to administer rental assistance programs with theobjective of providing affordable, decent, safe, and sanitary housing for low-income residents of the Cm’.The RI-IA has a 7-member Board of Commissioners appointed by the Mayor of the City. Although theBHA is a legally distinct entity operating within the geographical jurisdiction of the City of Berkeley, ithas been determined that the BRA’s financial statements would be presented as a discrete component unitof the City’s financial statements in response to the oversight change and the significant financialassistance provided by the City to the BHA. On June 12, 2007, the City Council adopted ResolutionNumber 63,714-N .S. authorizing the City Manager to enter into a contract with BRA to provide for asubsidy subject to the Council’s future approval of the portion of the subsidy allocated in the budget forFY 2010. The City’s FY 2010 budget includes a General Fund operating subsidy in the amount of$300,000 for the BE-IA. The subsidy will be revocable in the event of BRA’s default in the agreement withthe City. As a condition of providing the subsidy, the City will impose requirements to ensure that BRAis continuing to meet its federal obligations and that the new Board is functioning properly. In addition,because BRA operations are not self-supporting, the City agreed to continue to provide some of theongoing support services to BHA, including human resources, payroll, information technology andfinance. The term of this agreement is one year from the date of the execution of the agreement on May 4,2010 by both parties.
Complete financial statements for each of the individual component units may be obtained at the entity’sadministrative offices:
Rent Stabilization Board Berkeley Housing Authority2125 Milvia Street 1901 Fairview StreetBerkeley, California Berkeley, California
Berkeley Redevelopment Agency2118 Milvia StreetBerkeley, California
B. Government-wide Financial Statements
The government-wide financial statements (i.e.. the statement of net assets and the statement of activities)report information on all of the non-fiduciary activities of the primary government and its componentunits. For the most part, the effect of interfund activity has been rcmoved from these statements except inthe case of interfund services provided and used, which are not eliminated in the consolidation process.Governmental activities, which normally are supported by taxes and intergovernmental revenues, arereported separately from business-type activities, which rely to a significant extent on fees and charges forsupport. Likewise, the primary government is reported separately from certain legally separate componentunits for which the primary government is financially accountable.
The statement of activities demonstrates the degree to which the direct expenses of a given function areoffset by program revenues. Direct expenses are those that are clearly identifiable with a specificfunction. Program revenues include 1) charges to customers or applicants who purchase. use, or directlybenefit from goods, services, or privileges provided by a given function and 2) grants and contributions
61
(I) Summary of Significant Accounting Policies (Continued)
that are restricted to meeting the operational or capital requirements of a particular function. Taxes andother items not properly included among program revenues are reported instead as general revenues.
Separate financial statements are provided for governmental fLinds, proprietary funds, and fiduciary funds,even though the latter are excluded from the government-wide financial statements. Major individualgovernmental funds and major individual enterprise funds are reported as separate columns in the fundfinancial statements.
C Measurement Focus, Basis of Accounting, and Financial StatementPresentation
The government-wide financial statements are reported using the economic resources meas ureineni focusand the accrual basis of accounting, as are the proprietary and fiduciary fund financial statements.Revenues are recorded when earned and expenses are recorded when a liability is incurred, regardless ofthe timing of related cash flows. Property taxes are recognized as revenues in the year for which they arelevied. Grants are recognized as revenues as soon as all eligibility requirements imposed by the grantorhave been met. Governmental fund financial statements are reported using the currentfInancial resourcesineasurenientfoczts and the modified accrual basis of accounting. Revenues are recognized as soon asthey are both measurable and available. Revenues are considered to be available when they are collectiblewithin the current period or soon enough thereafter to pay liabilities of the current period. For thispurpose. the City considers revenues to be available if they are collected within 60 days of the end of thecurrent fiscal year. Expenditures generally are recorded when a liability is incurred, as under accrualaccounting. However, debt service expenditures, as well as expenditures related to compensated absencesand claims and judgments, are recorded only when payment is due.
Property taxes, utility users taxes, transient occupancy taxes, ambulance fees. interest, and sales taxesassociated with the current fiscal year are all considered susceptible to accrual and so have beenrecognized as revenues of the current fiscal year. All other revenue items are considered to be measurableand available only when the City receives cash.
The City reports the following major governmental funds:
The General Fund is the City’s primary operating fund. It accounts for all financial resources of the City,except those required to be accounted for in another fund.
The Grants Fund accounts for grant monies received from other governments and private sources to beused to cover expenditures for providing public services and improving public safety.
The Library Fund accounts for all monies received and expended for the operation of the City’s mainand branch libraries; the major source of revenues are special taxes approved by two thirds of the voters,but the fund also receives gifts, bequests, donations and library fees.
The LDBG Fund accounts for the block grant received from the U.S. Department of Housing and UrbanDevelopment. The grant is to allow the City to revitalize neighborhoods, expand affordable housing andeconomic opportunities, and/or improve community facilities, principally to benefit low and moderate-income persons.
The Park Tax Fund is used to account for the receipt and expenditure of the special tax approved by twothirds of the voters on May 6, 1997 and re-authorized in November 2000 and November 2008. It is used
62
(I) Summary of Significant Accounting Policies (Continued)
for the direct cost of acquisition and maintenance of improvements related to parks and landscape in theCity.
The Measure FF Branch Renovation Fund is used to account for the receipt and expenditures of theproceeds from the General Obligation bonds approved by over two thirds of the voters on November 4,2008, to finance renovations, construction, seismic and access improvements, and expansion of programareas at four neighborhood branch libraries in the City.
The Capital Improvement Fund accounts for expenditures for land, buildings, major reconstructionand renovation of structures, and for major landscaping or park improvements financed by local revenues.
The government reports the following major proprietary funds:
The Refuse Collection/Disposal Fund accounts for the monies received and expended from refusecollection services, including the surcharge to provide for expenses incurred in the collection and disposalof solid waste materials as well as for plans, surveys, engineering expenses. property acquisition andconstruction costs of facilities for finure refuse disposal.
The Marina Operations Fund accounts for the day-to-day operations of the Berkeley Marina.
The Sanitary Sewer Fund accounts for the collection of revenues from sanitary sewer charges, and theexpenses related to the operation. maintenance, replacement, reconstruction, and repair of sanitaryfacilities.
The Clean Storm Water Fund accounts for the fees collected to improve the quality of storm waterdischarged from the City’s storm drainage system.
The Permit Service Center Fund accounts for revenues from customers processing development permitapplication (ie.. building and zoning permits) and the funds expended to operate the permit reviewfunctions of the Permit Service Center.
The Off Street Parking Fund accounts for the operations of the City’s Center Street garage, Sather Gategarage, Sather Gate Mail leases, and Oxford/Fulton parking lot.
The Parking Meter Fund accounts for the collection of coins from the City’s parking meters and for thepurchasing, leasing, installing, repairing, maintaining, operating, removing, and policing of the meters.
The Building Purchases & Management Fund accounts for the purchase and management of thebuilding at 1947 Center Street.
Additionally, the City reports the following fund types:
Internal Service Funds account for equipment maintenance, building maintenance and replacement,supply warehouse. computer replacement, workers’ compensation, sick and vacation payouts, publicliability, and catastrophic loss services to other departments of the City on a cost reimbursement basis.
The Pension Trust Funds accounts for the activities of the Safety Members Pension Fund. PoliceRetirement and Pension Annuity Fund, which provides pension benefits on a pay-as-you-go basis for fireand police employees hired on or before February 28, 1973; and the Police Retirement Income BenefitPlan.
63
(I) Summary of Significant Accounting Policies (Continued)
The Other Post-employment Benefits Trust Funds account for the Retiree Medical Benefit Trust andFire Medical Trust funds and allocated sources to provide medical benefits for retirees.
The Agency Funds account for the Community Facilities District No. 1 Disaster Fire Protection specialassessment tax monies, the Thousand Oaks Heights Applicant Funded Utility Lndergrounding specialassessment tax monies. District 47 Underground/Miller, Sick Leave Entitlement, and Measure H SchoolTax.
Private-sector standards of accounting and financial reporting issued prior to December 1, 1989 generallyare followed in both the government-wide and proprietary fund financial statements to the extent thatthose standards do not conflict with or contradict guidance of the Governmental Accounting StandardsBoard. Governments also have the op/ion of following subsequent private sector guidance for theirbusiness-type activities and enterprise funds, subject to this same limitation. The City has elected not tofollow subsequent private-sector guidance.
The effect of interfund activity has been eliminated from the government-wide financial statements.Amounts reported as program revenues include I) charges to customers or applicants for goods, services,or privileges provided, 2) operating grants and contributions, and 3) capital grants and contributions,including special assessments. General revenues include all taxes.
Proprietary funds distinguish operating revenues and expenses from nonojierating items. Operatingrevenues and expenses generally result from providing services and producing and delivering goods inconnection with a proprietary fund’s principal ongoing operations. The principal operating revenues forall the enterprise funds and internal service funds are charges to customers for sales and services.Operating expenses for enterprise funds and internal service funds include personnel services, employeebenefits, repairs and maintenance, professional services, transportation, materials and supplies, claims andjudgments. rent, insurance, utilities, communications, general administration and depreciation on capitalassets. All revenues and expenses not meeting this definition are reported as non-operating revenues andexpenses.
When both restricted and unrestricted resources are available for use, it is the City’s policy to userestricted resources first, and then unrestricted resources as they are needed.
D. Implementation ofAccounting Principles
During fiscal year 2010, the City adopted the following GASB Statements:
In June 2007. GASB issued Statement No. 51, Accounting and Financial Reporting for Intangible Assets.This Statement requires that all intangible assets not specifically excluded by its scope provisions beclassified as capital assets. Accordingly, existing authoritative guidance related to the accounting andfinancial reporting for capital assets should be applied to these intangible assets, as applicable. ThisStatement also provides authoritative guidance that specifically addresses the nature of these intangibleassets. Such guidance should be applied in addition to the existing authoritative guidance for capitalassets. The adoption of GASB Statement No.51 did not have an impact on the financial position, resultsof operations, or cash flows of the reporting entity.
64

(I) Summary of Significant Accounting Policies (Continued)
E. Assets, Liabilities, c’rndNetAssets or Equity
1. Deposits and InvestmentsThe City’s cash and cash equivalems are considered to be cash on hand, demand deposits, and shortterm investments with original maturities of three months or less from the date of acquisition.
State of California statutes authorize the City to invest in obligations of the U.S. Treasury, itsagencies and instrumentalities, certificates of deposits, commercial paper rated A-I/P-I, medium termcorporate notes rated A or its equivalent or better by Moodys or Standard & Poor’s, asset backedcorporate notes, negotiable certificates of deposits, bankers acceptances, mutual funds, guaranteedinvestment contracts, repurchase agreements. reverse repurchase agreements when authorized by theCity Council, and the State Treasurers investment pool (Local Agency Investment Fund).
The City does not utilize the Local Agency Investment Fund, as this fund is not in compliance withthe City’s nuclear free ordinance.
Investments for the City, as well as for its component units, are reported at fair value. The value isdetermined based upon market closing prices. The fair value of mutual funds is stated at share value.Income from pooled investments is aflocated to the individual funds based on the fund averagemonthly balance in relation to the total pooled investments.
2. Receivables and PayablesTransactions between funds that are representative of long-term lending/borrowing arrangementsoutstanding at the end of the fiscal year are referred to as “advances to/advances from other funds”.All other outstanding balances between funds are reported as “due to/from other funds”. The lattertransactions are typically loans from the General Fund to cover cash shortages in other funds thatresult from the pooled cash arrangement. The loans are short-term in nature and generally result fromthe time lag in receiving grant reimbursements. The amounts are repaid to the General Fund when thegrant reimbursements are made. Any residual balances between the governmental activities andbusiness type activities are reported in the government-wide financial statements as internal balances.
Advances between funds are offset by a fund balance reserve account in applicable City funds toindicate the extent to which they are not available for appropriation and are not expendable availablefinancial resources.
All trade accounts receivable are presented net of allowance for doubtful accounts. No allowances fordoubtful accounts have been provided for taxes or rental registration fees. Property taxes are levied asof July 1 on property assessed on the same date. Alameda County assesses properties, bills for,collects and distributes property taxes as follows:
65
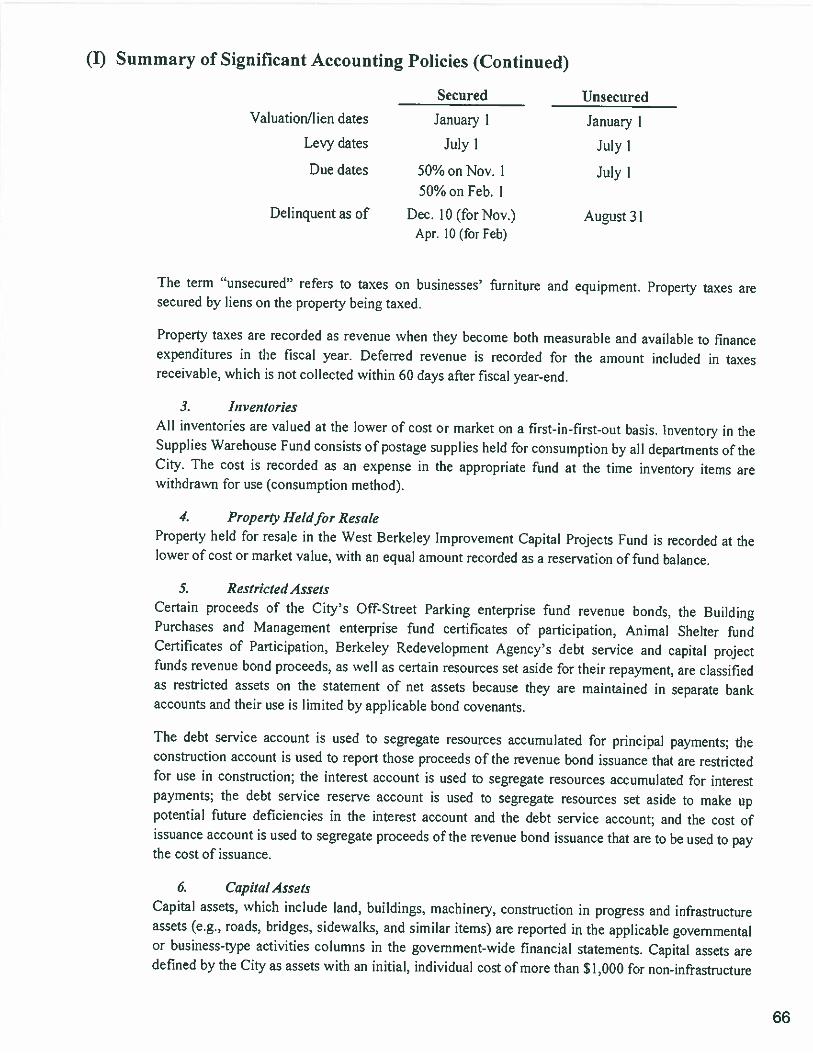
(I) Summary of Significant Accounting Policies (Continued)
Secured UnsecuredValuationulien dates January 1 January 1
Levy dates July 1 July 1Due dates 50% on Nov. I July 1
50% on Feb. I
Delinquent as of Dec. 10 (for Nov.) August31Apr. 10 (for Feb)
The term “unsecured” refers to taxes on businesses’ furniture and equipment. Property taxes aresecured by liens on the property being taxed.
Property taxes are recorded as revenue when they become both measurable and available to financeexpenditures in the fiscal year. Deferred revenue is recorded for the amount included in taxesreceivable, which is not collected within 60 days after fiscal year-end.
3. InventoriesAll inventories are valued at the lower of cost or market on a first-in-first-out basis. inventory in theSupplies Warehouse Fund consists of postage supplies held for consumption by all departments of theCity. The cost is recorded as an expense in the appropriate fund at the time inventory items arewithdrawn for use (consumption method).
4. Property Heldfor ResaleProperty held for resale in the West Berkeley Improvement Capital Projects Fund is recorded at thelower of cost or market value, with an equal amount recorded as a reservation of fund balance.
5. Restricted AssetsCertain proceeds of the City’s Off-Street Parking enterprise fund revenue bonds. thc BuildingPurchases and Management enterprise fund certificates of participation, Animal Shelter fundCertificates of Participation, Berkeley Redevelopment Agency’s debt service and capital projectfunds revenue bond proceeds, as well as certain resources set aside for their repayment, are classifiedas restricted assets on the statement of net assets because they are maintained in separate bankaccounts and their use is limited by applicable bond covenants.
The debt service account is used to segregate resources accumulated for principal payments; theconstruction account is used to report those proceeds of the reventie bond issuance that are restrictedfor use in construction; the interest account is used to segregate resources accumulated for interestpayments; the debt service reserve account is used to segregate resources set aside to make uppotential future deficiencies in the interest account and the debt service accotint; and the cost ofissuance account is used to segregate proceeds of the revenue bond issuance that are to be used to paythe cost of issuance.
6. Gap/ta! AssetsCapital assets, which include land, buildings. machinery, construction in progress and irtrastructureassets (e.g., roads, bridges, sidewalks, and similar items) are reported in the applicable governmentalor business-type activities columns in the government-wide financial statements. Capital assets aredefined by the City as assets with an initial, individual cost of more than S 1,000 for non-infrastructure
66

(I) Summary of Significant Accounting Policies (Continued)
assets and $100,000 for infrastructure assets, and an estimate useful life in excess of two years. Suchassets are recorded at historical cost or estimated historical cost if purchased or constructed. Donatedcapital assets are recorded at estimated fair market value at the date of donation.
The costs of normal maintenance and repairs that do not add to the value of the asset or materiaflyextend assets lives are not capitalized. Major outlays for capital assets and improvements arecapitalized as projects are constructed.
Property, buildings, machinery and equipment. furniture and fixtures, vehicles and infrastructure ofthe priman’ government, as well as the component units, is depreciated using the straight—line methodover the following estimated useful lives:
Assets YearsBuildings 30Building improvements 30Machinery and equipment 4-5Furniture and fixtures 7Infrastructure:
Roadway/Street:Pavement 30Sidewalk, curb and gutter 15Traffic siunals/devices 40Street lights 10Street trees 25Guard rails 50Retaining walls 50Paths (Residentia) 60
Sanitary sewer system:Pipelines 50Structures 50
Storm drain system:Pipelines 50Structures 50
Vehicles 5-10Other 5
7. compensated AbsencesIt is the City’s policy to permit employees to accumulate earned but unused vacation and sick paybenefits. Vacation pay is accrued when incurred in proprietary funds and is reported as a fundliability. In governmental funds, compensated absences are recorded as expenditures in the year paid,as it is the City’s policy to liquidate any unpaid compensated absences at June 30 from futureresources, rather than currently available financial resources. The City has established an InternalService Fund (Sick and Vacation Payout Fund) to pay for compensated absences when a workerleaves the City or retires The City uses the vested method for calculating compensated absences.
The personnel policies of the City do not allow employees to accrue vacation in excess of eight weeks(320 hours). For example, when a miscellaneous employee (Police and Fire sworn employees have
67
(I) Summary of Significant Accounting Policies (Continued)
different formulas) is terminated or retires, with a vested pension with twenty years of service, anemployee is entitled to be paid 38% of the accrued sick leave balance and 62% of the balance can beused for CALPERS credit. Employees with at least twenty-eight (28) years of benefited City serviceor an employee retiring on permanent disability arising out of and incurred in the course and scope oftheir employment with City with at least twenty-eight (28) years of benefited service shall be entitledto receive payment in an amount equal to fifty percent (50%) of their accrued sick leave days up to amaximum of (200) unused sick leave days. The employee has the option of using the payoutentitlement for retiree medical insurance premium payments. The liability for retirees who do notchoose the payout option is paid from the medical sick leave entitlement trust fund.
8. Long-term ObligationsIn the government-wide financial statements, and proprietary fund types in the fund financialstatements, long-term debt and other long-term obligations are reported as liabilities in the applicablegovernmental activities, business-type activities, or proprietary fund type statement of net assets.Bond premiums and discounts, as well as issuance costs, are deferred and amortized over the life ofthe bonds using the effective interest method. Bonds payable are reported net of the applicable bondpremium or discount.
In the fund financial statements, governmental fund types recognize bond premiums and discounts, aswell as bond issuance costs, during the current period. The face amount of debt issued is reported asother financing sources. Premiums received on debt issuances are reported as other financing sourceswhile discounts on debt issuances are reported as other financing uses. Issuance costs, whether or notwithheld from the actual debt proceeds received, are reported as debt service expenditures.
9. Fund EquityIn the fund financial statements, governmental ftinds report reservations of fund balance for amountsthat are not available for appropriation or are legally restricted by outside parties for use for a specificpurpose. Designations of fund balance represent tentative management plans that are subject tochange.
Following is a briefdescription of the nature of certain fund balance reserves as of June 30. 20i0:
Reserved for Encumbrances - Reserves have been established in all funds to account for the portionof purchase orders and contracts awarded for which the goods or services had not yet been received asof June 30, 2010.
Reservedfor Plo/es Receivable - A reserve has been established in the General fund, CDBG, Grants,Citywide Revolving Loan, Capital Improvement, Business and Economic Development. Section 108I-HiD loans. CA Housing Finance agency special revenue funds and other Capital Projects funds andSavo Island Debt Service fund for the amount of loan principal due more than one year from the endof the fiscal year.
Reserved for Property Held for Resale - The fund balance of the capital projects funds has beenreserved for land and improvements held for resale by the Berkeley Redevelopment Agency, toindicate that it does not represent a currently available expendable financial resource.
Rese;-ved for Debt Service -Reserves have been established in the debt service funds to account forcash and investments held by fiscal agents restricted so]ely for paying debt service.
68
(I) Summary of Significant Accounting Policies (Continued)
Reserved for Advances - A reserve has been established in the CDBG fund for amounts due fromBerkeley Redevelopment Agency, which are not expected to be repaid during the fiscal year and, as aresult, are not appropriable.
JO. At AssetsNet assets of the government-wide and proprietary funds are categorized as invested in capital assets,net of related debt; restricted or unrestricted. Invested in capital assets, net of related debt, is thatportion of net assets that relates to the City’s capital assets reduced by accumulated depreciation andby any outstanding debt incurred to acquire, construct or improve those assets, excluding unexpendedproceeds.
Restricted net assets is that portion of net assets that has been restricted for general use by externalparties (creditors. grantors, contributors, or laws or regulations of other governments) or imposed bylaw through consiitutonal provisions or enabling legislation. Unrestricted net assets consist of all netassets do not meet the definition of either of the other two components.
11. Use of EstimatesThe preparation of financial statements in conformity with accounting principles generally acceptedin the United States requires management to make estimates and assumption that affect the reportedamounts of assets and liabilities and disclosure of contingent assets and liabilities at the date of thefinancial statements. Estimates also affect the reported amounts of revenues andexpenditures/expenses during the reporting period. Actual results could differ from those estimates.
69
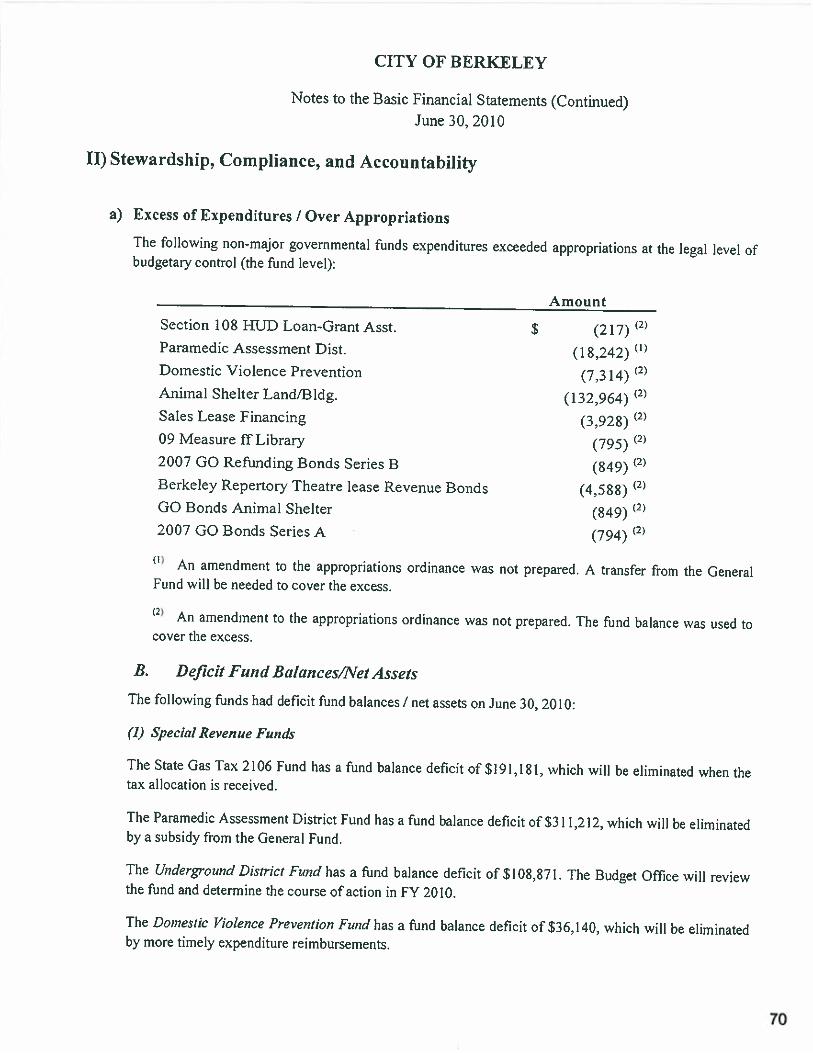
CITY OF BERKELEY
Notes to the Basic Financial Statements (Continued)June 30, 2010
II) Stewardship, Compliance, and Accountability
a) Excess of Expenditures I Over Appropriations
The following non-major governmental funds expenditures exceeded appropriations at the legal level ofbudgetary control (the fund level):
Amount
Section 108 HUD Loan-Grant Asst. S (217) (2)
Paramedic Assessment Dist. (18,242)Domestic Violence Prevention (7,314) (2)
Animal Shelter Land/Bldg. (132,964) (2)
Sales Lease Financing (1928) (2)
09 Measure ff Library (795) (2)
2007 GO Refunding Bonds Series B (849) (2)
Berkeley Repertory Theatre lease Revenue Bonds (4.588) (2)
GO Bonds Animal Shelter (849) (2)
2007 GO Bonds Series A (794) (2)
0) An amendment to the appropriations ordinance was not prepared. A transfer from the GeneralFund will be needed to cover the excess.
(2) An amendment to the appropriations ordinance was not prepared. The fund balance was used tocover the excess.
B. Deficit Fund Balances/Net Assets
The following funds had deficit fund balances I net assets on June 30, 2010:
(1) Special Revenue Funds
The State Gas Tax 2106 Fund has a fund balance deficit of$J91,lSl, which will be eliminated when thetax allocation is received.
The Paramedic Assessment District Fund has a fund balance deficit of $311,212, which will be eliminatedby a subsidy from the General Fund.
The Underground District Fund has a fund balance deficit of $108,871. The Budget Office will reviewthe fund and determine the course of action in FY 2010.
The Domestic Violence Prevention Fund has a fund balance deficit of $36,140, which will be eliminatedby more timely expenditure reimbursements.
70
(II) Stewardship, Compliance, and Accountability (Continued)
The Tobacco Control Fund has a fund balance deficit of $41,691, which will be eliminated by moretimely expenditure reimbursements.
(2) capital Project Funds
The Capital Improvement Administration Fund has a fund balance deficit of $1,611, which will beeliminated by better allocation of project management fees to the appropriate City projects.
Park Acquisition Fund has a fund balance deficit of $1,817, which will be eliminated by the receipt ofrental income.
(3,) Internal Service Funds
The Workers’ Compensation Fund has a deficit in net assets of $12,588,092. Total projected current yearclaims incurred but not paid are recorded as an expense resulting in negative net assets. As a matter ofpolicy, current year claims are paid from current year revenues from all operating departments. For theWorkers’ Compensation Fund, a workers’ compensation actuarial study is being conducted and the ratescharged to departments will be consistent with that study.
71
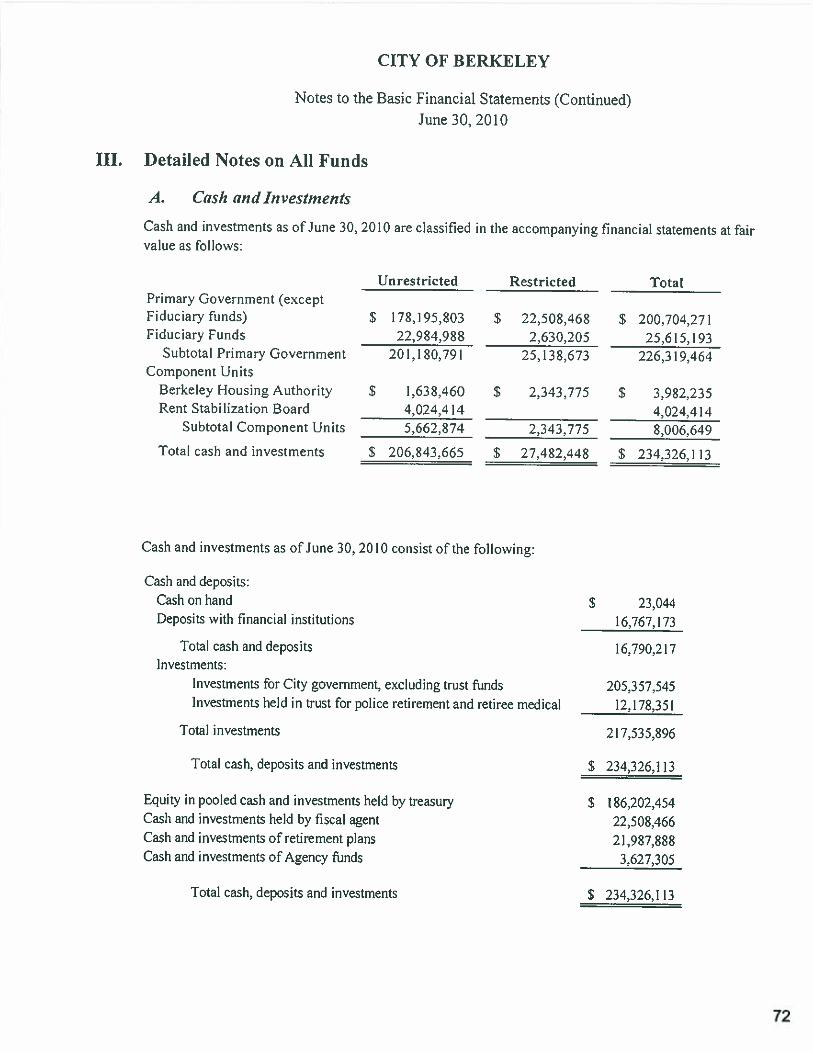
CITY OF BERKELEY
III. Detailed Notes on All Funds
A. Cash and Investments
Cash and investments as of June 30.value as follows:
Primary Government (exceptFiduciary funds)Fiduciary Funds
_________________
Subtotal Primary GovernmentComponent Units
Berkeley Housing AuthorityRent Stabilization Board
Subtotal Component Units —
Total cash and investments =
Cash and investments as of June 30, 2010 consist of the following:
Cash and deposits:Cash on handDeposits with financial institutions
Total cash and depositsInvestments:
Investments for City govemrne:n. excluding trust fundsInvestments held in trust for police retirement and retiree medical
Total investments
Total cash, deposits and investments
$ 23,04416,767,173
16,790,217
205,357,54512,178.351
2 17,535,896
S 234.326.113
Equity in pooled cash and investments held by treasuiyCash and investments held by fiscal agentCash and investments of retirement plansCash and investments of Agency funds
S 186,202,45422,508,46621,987,888
3,627,305
Total cash, deposits and investments S 234,326,113
Notes to the Basic Financial Statements (Continued)June 30, 2010
2010 are classified in the accompanying financial statements at fair
Unrestricted
$ 178.195,80322,984.988
201,180,791
S 1,638.4604,024.4145,662,874
Restricted Total
S 22.508.468 S 200.704.2712,630,205 25,615,193
25,138,673 226.319,464
5 2.343.775 $ 3,982,2354.024.414
2.343,775 8.006.649
S 27.482.448 $ 234326,113S 206,843,665
72
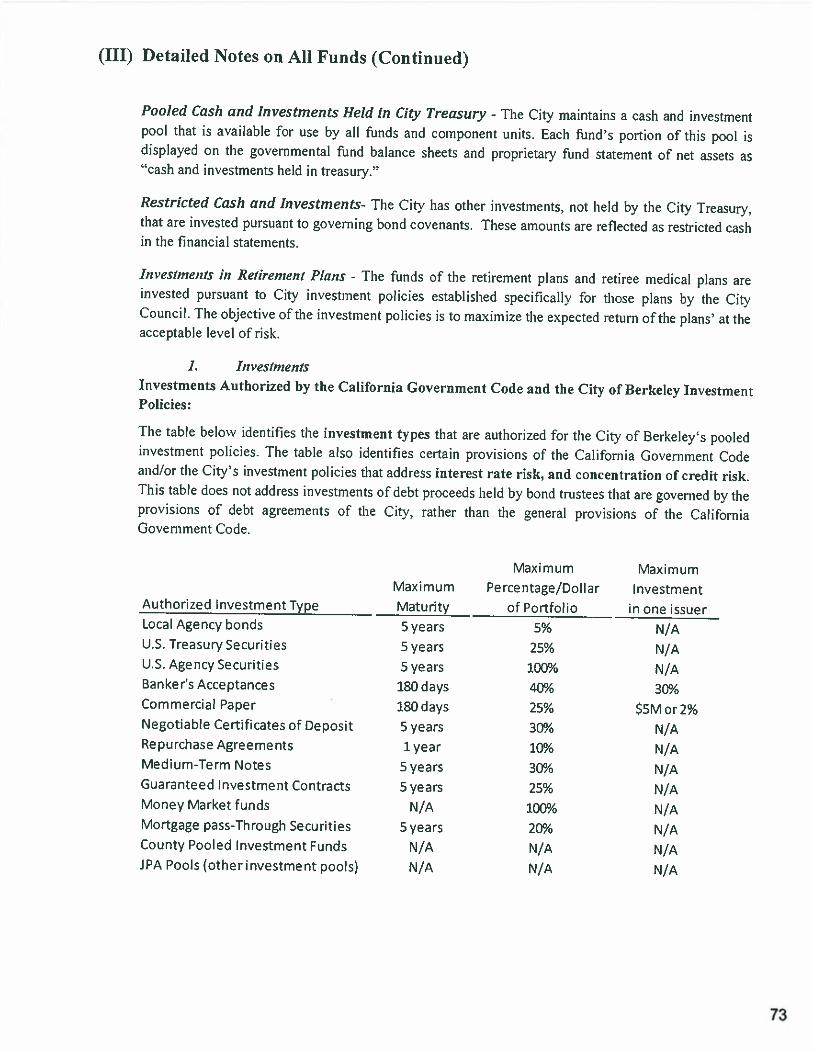
(III) Detailed Notes on All Funds (Continued)
Pooled Cash and Investments Held in City Treasury - The City maintains a cash and investmentpool that is available for use by all funds and component units. Each fund’s portion of this pool isdisplayed on the governmental fund balance sheets and proprietary fund statement of net assets as“cash and investments held in treasury”
Restricted Cash and Investments- The Ci has other investments, not held by the City Treasury.that are invested pursuant to governing bond covenants. These amounts are reflected as restricted cashin the financial statements.
Investments in Retirement Plans - The funds of the retirement plans and retiree medical plans areinvested pursuant to City investment policies established specifically for those plans by the CityCouncil. The objective of the investment policies is to maximize the expected return of the plans’ at theacceptable level of risk.
1. InvestmentsInvestments Authorized by the California Government Code and the City of Berkeley InvestmentPolicies:
The table below identifies the investment types that are authorized for the City of Berkeley’s pooledinvestment policies. The table also identifies certain provisions of the California Government Codeand/or the City’s investment policies that address interest rate risk, and concentration of credit risk.This table does not address investments of debt proceeds held by bond trustees that are governed by theprovisions of debt agreements of the City, rather than the general provisions of the CaliforniaGovernment Code.
Maximum MaximumMaximum Percentage/Dollar Investment
Authorized Investment Type Maturity of Portfolio in one issuerLocalAgencybonds 5years 5% N/AU.S. Treasury Securities 5 years 25% N/AU.S. Agency Securities 5 years 100% N/ABanker’s Acceptances 180 days 40% 30%Commercial Paper 180 days 25% $5M or 2%Negotiable Certificates of Deposit 5 years 30% N/ARepurchase Agreements lyear 10% N/AMedium-Term Notes 5 years 30% N/AGuaranteed Investment Contracts 5 years 25% N/AMoney Market funds N/A 100% N/AMortgage pass-Through Securities 5 years 20% N/ACountyPooled Investment Funds N/A N/A N/AJPA Pools (other investment pools) N/A N/A N/A
73

(III) Detailed Notes on All Funds (Continued)Investments Authorized by Debt Agreements
Investments of debt proceeds held by bond trustees are governed by provisions of the debt agreements,rather than the general provisions of the California Government Code or the City’s investment policies.The table below identifies the investment types that are authorized for investments held by bondtrustees. The table also identifies certain provisions of these debt agreements that address interest raterisk, and concentration of credit risk.
Maximum MaximumMaximum Percentage/Dollar Investment
Authorized Investment Type Maturity Of Portfolio In One IssuerU.S. Treasury Securities 5 years 25% N•AU.S. Agency Securties 5 years 100% N/AMoney Market Mutual Funds N/A 10% in any fund N/AGuaranteed Investment Contracts 5 years 25% N/A
Interest Rate Risk
Interest rate risk is the risk that changes in market interest rates will adversely affect the fair value ofaninvestment. Generally, the longer the maturity of an investment, the greater the sensitivity of its fairvalue to changes in market interest rates. One of the ways that the City manages its exposure to interestrate risk is by purchasing a combination of shorter tenn and longer term investments and by timing cashflows from maturities so that a portion of the portfolio is maturing or coming close to maturity evenlyover time as necessary to provide the cash flow and liquidity needed for operations.
The City has the intention to hold all investments to maturity. The average maturity of theCity’s pooled investments governed by the Investment Policies was approximately 36.9 monthsas of June 30, 2010.
74
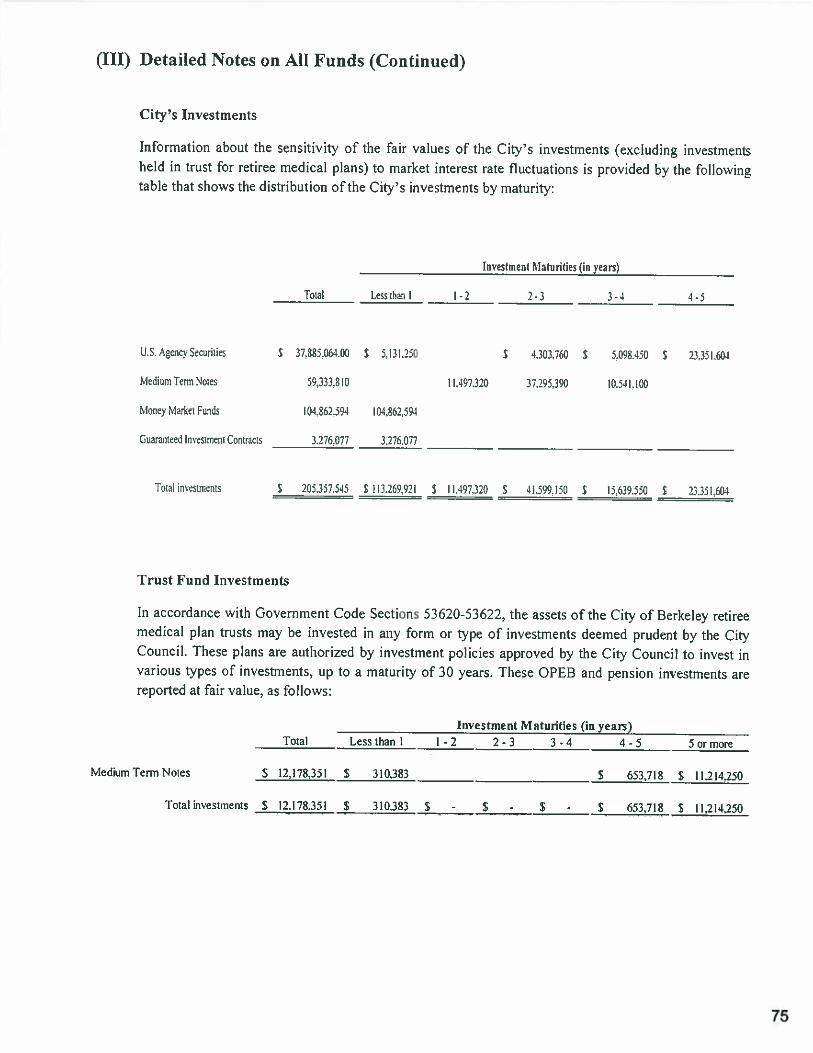
(III) Detailed Notes on All Funds (Continued)
City’s Investments
Information about the sensitivity of the fair values of the City’s investments (excluding investmentsheld in trust for retiree medical plans) to market interest rate fluctuations is provided by the followingtable that shows the distribution of the City’s investments by maturin:
Investment Maturities (in years)
Total [esslha!1 I 1-2 2-3 3-4 4-5
LS.AgencvSecuri:ies S 37.885.061.3 S 5.131.250 S 4.303.760 S 5.098.450523.351.604
MediuinTermNoies 59.333.810 11,497.320 37.295.390 10.541.100
Money Market Funds 104,862,594 104.862.594
Gunnteed Investment Contracts 3.276.077 3.276.077
TotaLnvestnients S 205.357.545 S 113.269.921 $ 11.197.320 S 41.599.150 15.639.550 S 23.351.684
Trust Fund Investments
In accordance with Government Code Sections 53620-53622, the assets of the City of Berkeley retireemedical plan trusts may be invested in any form or type of investments deemed prudent by the CiCouncil. These plans are authorized by investment policies approved by the City Council to invest invarious types of investments, up to a maturity of 30 years. These OPEB and pension investments arereported at fair value, as follows:
Investment Maturities (in years)Total Lessthanl 1-2 2-3 3-4 4-5 5ormore
Medium Term Notes S 12.178.351 S 310.383 $ 653.718 $ 11.214250
Total wesunents $ 12.178.351 S 310.383 S -$ - $ - S 653,718 $ 11.214,250
75
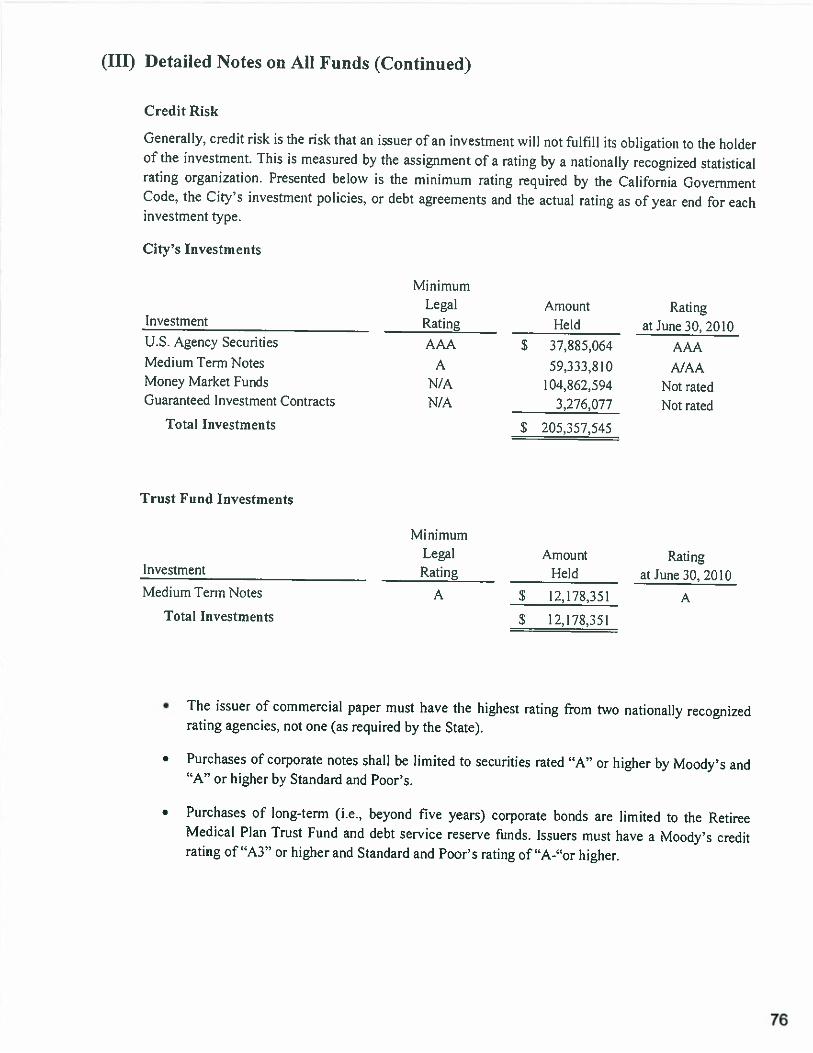
(III) Detailed Notes on All Funds (Continued)
Credit Risk
Generally, credit risk is the risk that an issuer of an investment will not fulfill its obligation to the holderof the investment. This is measured by the assignment of a rating by a nationally recognized statisticalrating organization. Presented below is the minimum rating required by the California GovernmentCode, the City’s investment policies, or debt agreements and the actual rating as of year end for eachinvestment pe.
City’s Investments
MinimumLegal Amount Rating
Investment Rating Held at June 30. 2010U.S. Agency Securities AAA $ 37,885,064 AAAMedium Term Notes A 59,333,810 A’AAMoney Market Funds N/A 104,862,594 Not ratedGuaranteed Investment Contracts N/A 3,276,077 Not rated
Total Investments S 205.357.545
Trust Fund Investments
MinimumLegal Amount Rating
Investment Rating Held at June 30, 2010MediumTermNotes A $ 12.178,351 A
Total Investments S 12.178.351
• The issuer of commercial paper must have the highest rating from two nationally recognizedrating agencies, not one (as required by the State).
• Purchases of corporate notes shall be limited to securities rated “A” or higher by Moody’s and“A” or higher by Standard and Poor’s.
• Purchases of long-term (i.e., beyond five years) corporate bonds are limited to the RetireeMedical Plan Trust Fund and debt service reserve funds. Issuers must have a Moody’s creditrating of”A3” or higher and Standard and Poor’s rating of “A-”or higher.
76
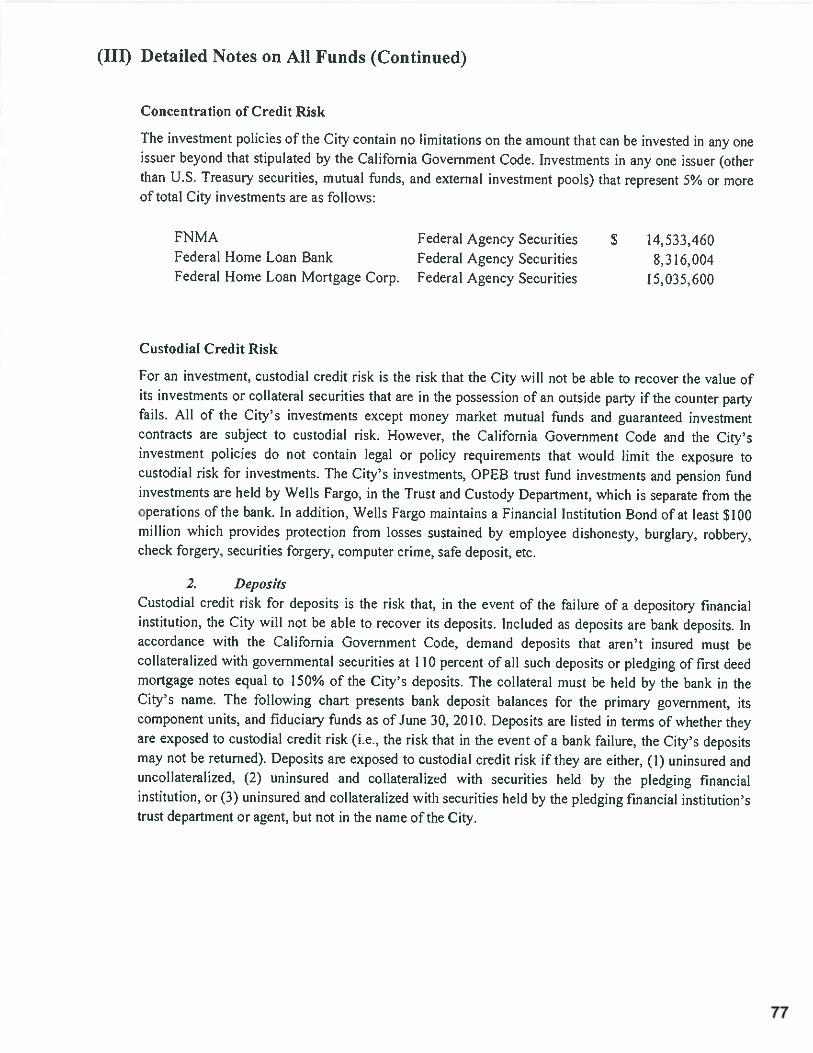
(III) Detailed Notes on All Funds (Continued)
Concentration of Credit Risk
The investment policies of the City contain no limitations on the amount that can be invested in any oneissuer beyond that stipulated by the California Government Code. Investments in any one issuer (otherthan U.S. Treasury securities, mutual funds, and external investment pools) that represent 5% or moreof total City investments are as follows:
FNMA Federal Agency Securities $ 14,533,460Federal Home Loan Bank Federal Agency Securities 8,316,001Federal Home Loan Mortgage Corp. Federal Agency Securities 15,035,600
Custodial Credit Risk
For an investment, custodial credit risk is the risk that the City will not be able to recover the value ofits investments or collateral securities that are in the possession of an outside party if the counter partyfails. All of the City’s investments except money market mutual funds and guaranteed investmentcontracts are subject to custodial risk. However, the California Government Code and the City’sinvestment policies do not contain legal or policy requirements that would limit the exposure tocustodial risk for investments. The City’s investments, OPEB trust fund investments and pension fundinvestments are held by Wells Fargo, in the Trust and Custody Department, which is separate from theoperations of the bank. In addition. Wells Fargo maintains a Financial Institution Bond of at least $100million which provides protection from losses sustained by employee dishonesty. burglary, robbery,check forgery, securities forgery, computer crime, safe deposit, etc.
2. DepositsCustodial credit risk for deposits is the risk that, in the event of the failure of a depository financialinstitution, the City will not be able to recover its deposits. Included as deposits are bank deposits. Inaccordance with the California Government Code, demand deposits that aren’t insured must becollateralized with governmental securities at 110 percent of all such deposits or pledging of first deedmortgage notes equal to 150% of the City’s deposits. The collateral must be held by the bank in theCity’s name. The following chart presents bank deposit balances for the primary government, itscomponent units, and fiduciary funds as of June 30, 2010. Deposits are listed in terms of whether theyare exposed to custodial credit risk (i.e., the risk that in the event of a bank failure, the City’s depositsmay not be returned). Deposits are exposed to custodial credit risk if they are either, (1) uninsured anduncollateralized. (2) uninsured and collateralized with securities held by the pledging financialinstitution, or (3) uninsured and collateralized with securities held by the pledging financial institution’strust department or agent, but not in the name of the City.
77
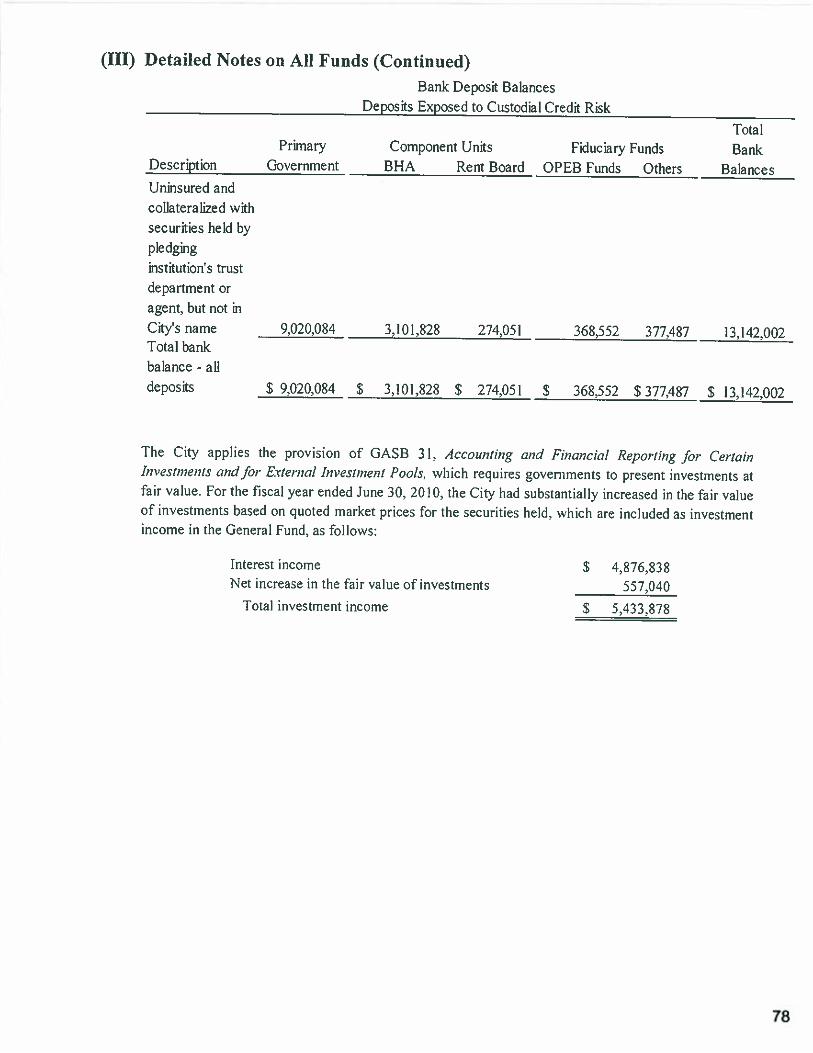
(III) Detailed Notes on All Funds (Continued)Bank Deposit Balances
Deposits Exposed to Custodial Credit Risk
TotalPrimary Component Units Fiduciary Funds Bank
Description Government BRA Rent Board OPEB Funds Others BalancesUninsured andcollateralized withsecurities held bypledginginstitutions trustdepartment or
9,020,084 3,101,828 274,051 368,552 377,487 13,142,002
S 9.020.084 S 3,101,828 S 274,051 S 368.552 $ 377.487 S 13,142.002
of investments based on quoted market prices for the securities held, which are included as investmentincome in the General Fund, as follows:
Interest income S 4,876,838Net increase in the fair value of investments 557.040
Total investment income $ 5,433.878
agent, but not inCity’s nameTotal bankbalance - alldeposits
The City applies the provision of GASB 31, AccountingInvesinienis and for External Investment Fools, which requiresfair value. For the fiscal year ended June 30, 2010, the City had
and Financial Reporting for Certaingovernments to present investments atsubstantially increased in the fair value
78
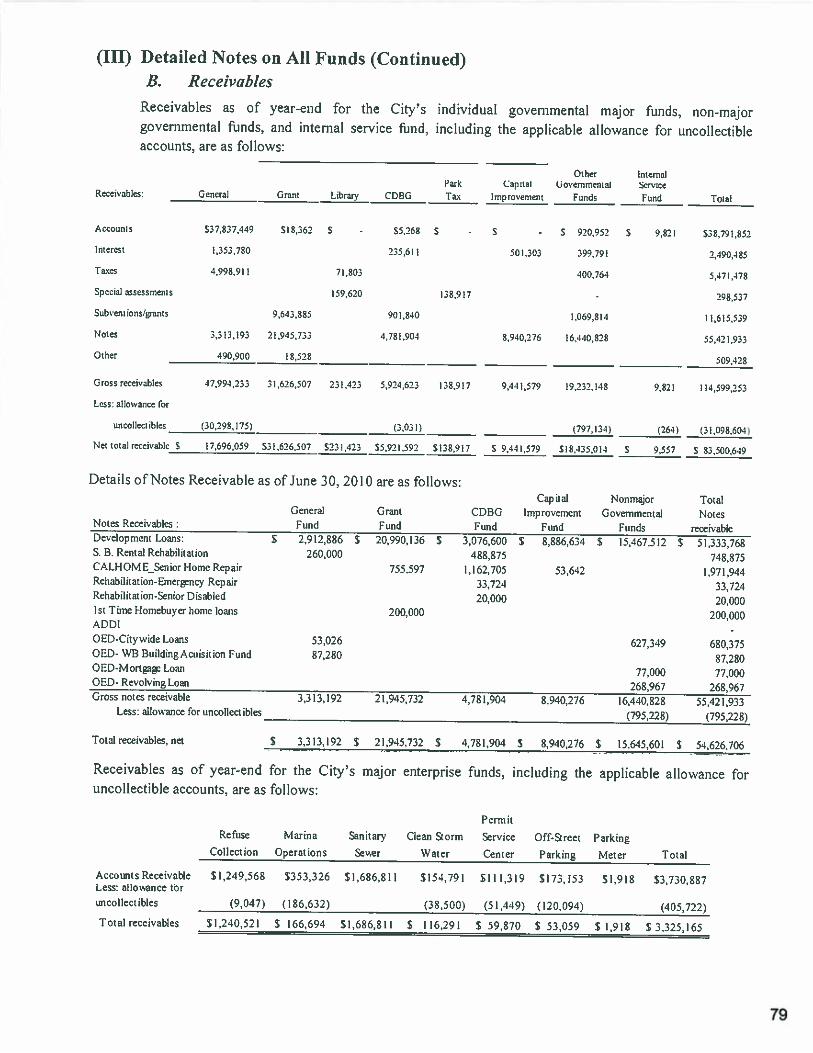
(III) Detailed Notes on All Funds (Continued)B. Receivables
Receivables as of year-end for the City’s individual governmental major funds, non-majorgovernmental funds, and internal service fund, including the applicable allowance for uncollectibieaccounts, are as follows:
Special assessments I 59,620
OtherPast Capital Uovenimental
Improvement Funds
138,917
InternalService
Fund Total
S 920,952 5 9,811
298,537
Sub yen I ions is’ant 9,642,885 901,840 1.069.814 11,615.539
Notes 3,313,193 21,945,733 4.781.904 8,940.216 I 6.440,828 55.421.933
490,900 18,528
Gross receivables 47,994,233 31.626,507 231,423 5,924,623 158,917 9,441,579 19,232,148 9,821 114,599,253
Less: allowance for
Details of Notes Receivable as of June 30, 2010 are as follows:Capital Nonmajor Total
Receivables as of year-end for the City’s major enterprise funds, including the applicable allowance foruncollectible accounts, are as follows:
Permit
Refuse Marina Sanitary Clean Storm Service Off-Street ParkingCollection Operations
Accounts Receivable $1,249,568Less: allowance tor
mscollectiblcs
T ot al receivables
Sever ‘Water Center Parking Meter Total
Receivables:
.4 ccocn;s
:nlerest
Taxes
General Grant Libraty CDBO Tax
537.837,449 518,362 $
353780
4,998.911 71.803
55,268 S
235,ét I
0:0cm
501.303 399.791
400,764
S38 , 79 .8 52
2.490.485
5,471,478
509.428
cncetecthles 50,298.75) 0.031) 797.15:’ (2) (31,098.604)
Net total receivable 5 7,696.059 531.626.507 5231423 S5,92L592 S38.9i? 5 9.441.579 518.455,0:1 S 9,557 S 83,500649
General Grant CDBG Improvement Governmental NotesNotes Receivables Fund Fund Fund Fund Funds receivableDevelopment Loans: $ 2,912,886 S 20.990.136 $ 3,076,600 S 8.886.634 5 15,467.512 $ 51.333,7685. 8. Rental Rehabilitation 260000 488.875 748,875CALHOMESeniorHomeRepair 755.597 1.162.705 53.642 1,971.944RelsabiIitatinn-Fmerncy Repair 33.724 33,724Rehabilitation-Senior Disabled 20.000 20,0001st Time I-Iomebuyer honte lomm 200.000 200,000ADDI
-
OED-Citywtde Loics 53,026 627.349 680,375OED- W13 Building Acuisition Fund 87.280 87.280OFD-Mortgi Loan 77,000 77,000OED- Revolving Loan 268.967 268.967Grass notes receivable 3,313,192 21.945,732 4,781.904 8.940,276 16,410.828 55.421,932
Less: allowance for uncollectibles (795228) (795.228)
Total receivables, net S 5.313.192 S 21,945.732 $ 4.781.904 S 8.940.276 $ 15.645.601 $ 54.626.706
$353,326 $1,686,811 $154,791 $111,319 $173,153 £1,918 $3,730,887
(9.047) (186,632) (38,500) (51.4491 (120,394) (105,722)
S1.240.521 S 166.694 51,686.811 S 116.291 S 59,870 $ 53.059 S 1,918 $ 3.325,165
79
(III) Detailed Notes on All Funds (Continued)
Development Loans-Governmental Activities
This loan program began in 991 and the City awards loans to developers every year. The first year ofmaturity starts in 2046, and most of the loans may be forgiven. Development loans normally are charged 6%simple interest per annum, with a range of 3% to 6%. The agreements require the borrower to pay annualinterest only, at the lesser of 50% of the property’s net cash flow or the amount of interest calculated at 6%.The loans may be forgiven after 55 years from the loan date, if the terms of the agreement are satisfied.
Senior Rehabilitation Loans-Governmental ActivitiesThis loan program began in 1980. The City is unable to predict the maturity dates of the loans because
most of them are only due upon sale of the property. 90% of these loans are deferred with no monthlypayments required. Interest rates range between 0% and 6%.
80
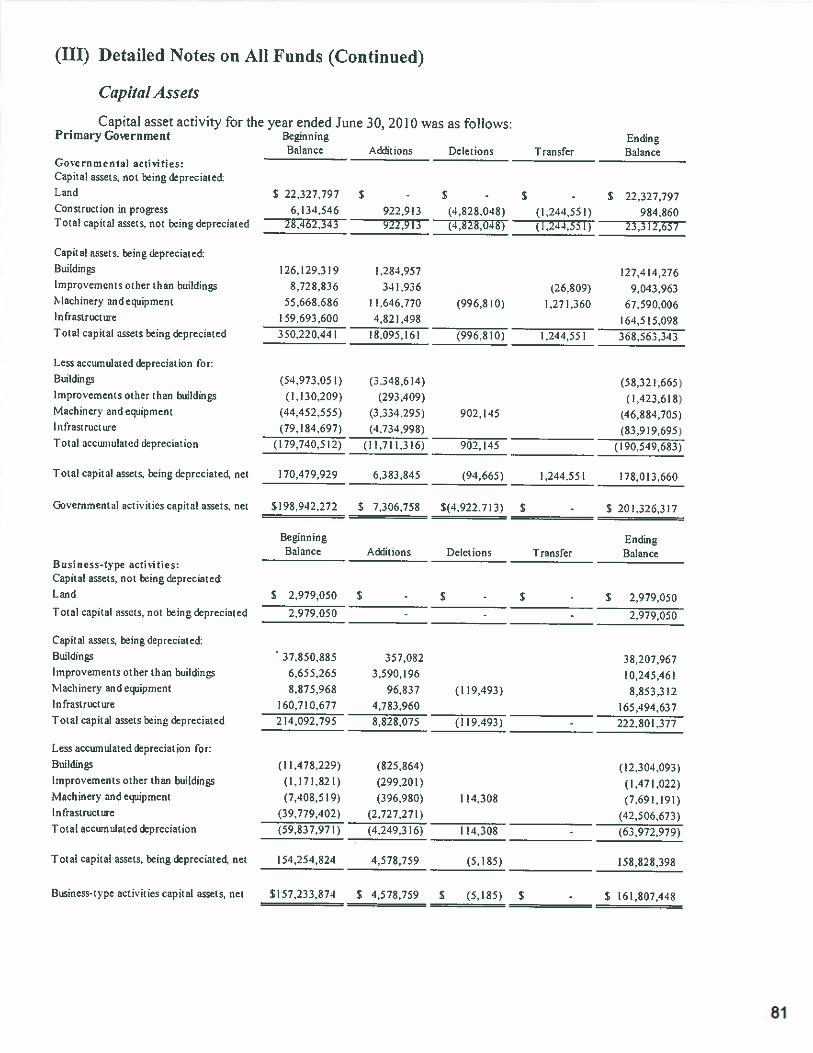
(III) Detailed Notes on All Funds (Continued)
Capital Assets
Capital asset activity for the year ended June 30, 2010 was as follows:Primary Go’.ernment Becinnina Ending
Balance Additior.s Deletions Transfer BaanceCove rn mental activities:Capita! assets, not being depreciated:Land S 22.327,79? 5 - S - S - 5 22.527.797Construction in progsess 6.134,546 922.913 14828.048) (1,241,55]) 984.860Total capital assets, not being depreciated 28,462.343 922,913 14,828.048) (1.241.551) 23.312.657
Capital assets, being depreciated:
Buildings 126.129,319 1.284,957 127.414.276Improvements other than buildings 8,728.836 341.936 (26.809) 9,043,963Machinery and equipment 55.668.685 11.646.770 (996.810) 1.27:350 67,590.005infrastructure 159.693,600 4.821.498 164.515.098Total capital assets being depreciated 350.220.441 18.095.161 (996.810) 1.244.551 368,563.343
1.ess accumulated depreciation for
Buildings (54.973,051) (3.348,614) (58,321,665)improvements other than buildings (1.130,209) (293,409) (1,423.618)Machinery andequipnient (44.452,555) (3.334.295) 902,145 (46,884,705)Infrastructure (79,184,697) (4.734.998) (83,91 9.695)Total accumulated depreciation (179.740,512) (11.711,316) 902,145 (190.549.683)
Total capita;’ assets. beingdepreciated. net 170.479,929 6.383.845 (94.655) 1,244,551 178,013.660
Govern mental activities capita! assets, net 5l98,942.272 S 7,306,758 5(4.922,713) 5 5 201.325,317
Beainning EndingBalance Additions Deletions Transfer Balance
B usia ess-type activities:Capital assets, not being depreciated:
Land S 2.979,050 $ . S $ . $ 2,979.050Total capital assets, not beingdcprec:ated 2,979,050 . - - 2,979,050
Capital assets. be:ng depreciated:
I3uiidines 37.850,885 357,082 38.207.967Improvements other than buildings 6.655,265 3.590.196 0.245.461Machinery and equipment 8.875,968 96,837 (119,493) 8,853,312Infrastrticture 160,710,677 4,783,960 165,494,637Total capital assctsheingdepreciated 214.092,795 8.828,075 (119,493) . 222,801,377
Less accumulated depreciation for:
Buildings (11.478,229) (825,864) (12.304,0931Improvements other than buidins (1.171.821) (299.201) (1,471.022)Machinery and equipment (7.408,519) (396.980) 114.308 (7,691.191)Infrastructure (39.779,402) (2.727,271) 142,506.673)Total acctenulated&preciation (59.837.971) (4.249.316) 114.308 t63.972,979t
Total capital assets, being depreciated. net 154,254,824 4,578.759 (5,185) 158,828,398
Business-type activities capital assets, net $157,233,874 $ 4,578.759 S (5,185) S $ 161,807,448
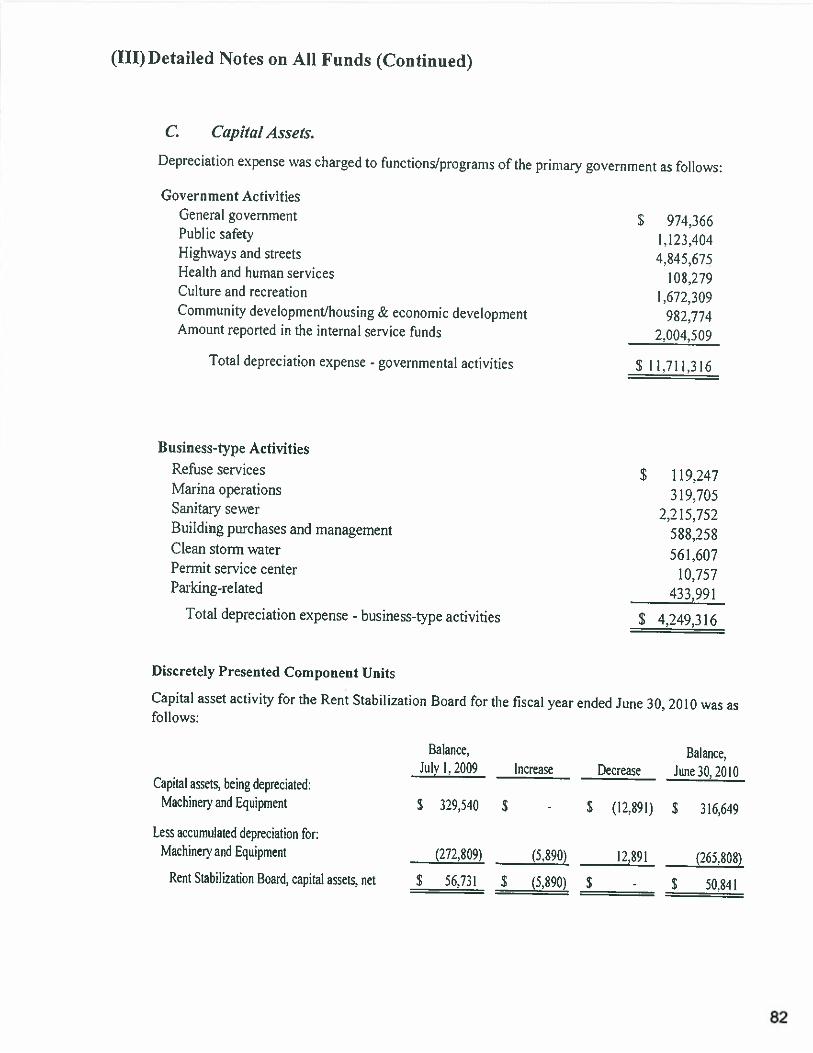
(III) Detailed Notes on All Funds (Continued)
C. CapIto! Assets.
Depreciation expense was charged to functionsiprograms of the primary government as follows:
Government ActivitiesGeneral government $ 974,366Public safety 1,123,404Highways and streets 4,845.675Health and human services 108,279Cukure and recreation 1672.309Community development/housing & economic development 982.774Amount reported in the internal service funds 1004.509
Total depreciation expense - governmental activities $ 11.71 1.316
Business-type ActivitiesRefuse services $ 119,247Marina operations 319,705Sanitary seer 2.215.752Building purchases and management 588,258Clean storm water 561,607Permit service center 10,757Parking-related 433,991
Total depreciation expense - business-type activities $ 4,249,316
Discretely Presented Component Units
Capital asset activity for the Rent Stabilization Board for the fiscal year ended June 30, 2010 was asfollows:
Balance. Balance.July 1. 2009 Increase Decrease June 30, 2010
Capital assets, being depreciated:Machinery and Equipment S 329,540 $ - $ (12,891) S 316,649
Less accumulated depreciation for:Machinery and Equipment (272.809) (5.890) 12.891 (265.808)
Rent StabHization Beard. capitai assets. net S 56.731 S (5.890) S - S 50.841
82
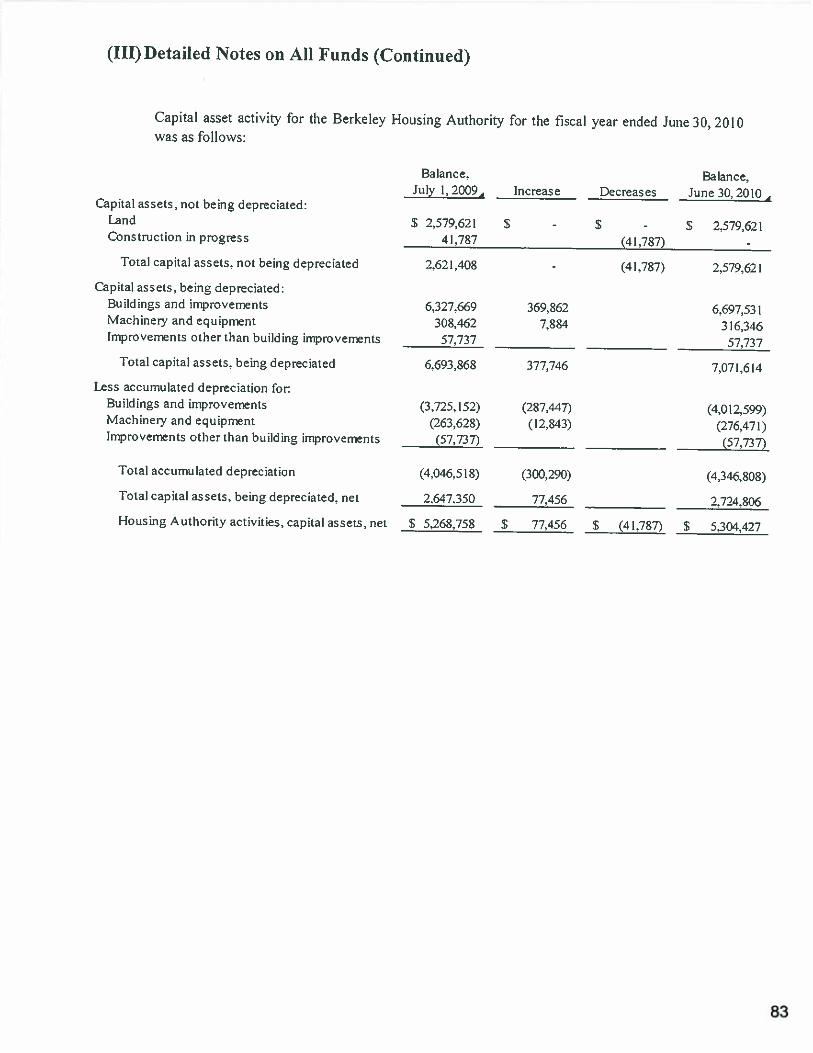
(ITT) Detailed Notes on All Funds (Continued)
Capital asset activity for the Berkeley Housing Authority for the fiscal year ended June 30% 2010was as follows:
Balance. Balance,July 1,20094 Increase Decreases June 30,20104
Capital assets, not being depreciated:Land S 2.579,621 S -
- S 2.579,621Construction in progress 11.787 (41,787) -
Total capital assets, not being depreciated 2.621.408- (41,787) 2,579.621
Capital assets, being depreciated:Buildings and improvements 6.327.669 369,862 6,697,531Machinen and equipment 308.462 7.884 316.346lmprovennts other than building improvements 57.737
_____________
57.737
Total capital assets, being depreciated 6,693,868 377.746 7,071,614
Less accumulated depreciation forBuildings and improvements (3,725,152) (287,447) (4,012,599)Machinery and equipment (263.628) (12.843) (276.471)Improvements other than building improvements (57.737) (57.737)
Total accumulated depreciation (4,046,518) (300,290) (4,346.808)
Total capital assets, being depreciated, net 2.647.350 77.456 2.724.806
Housing Authority activities, capital assets, net $ 5.268.758 S 77.456 S (41.787) S 5.304,427
83
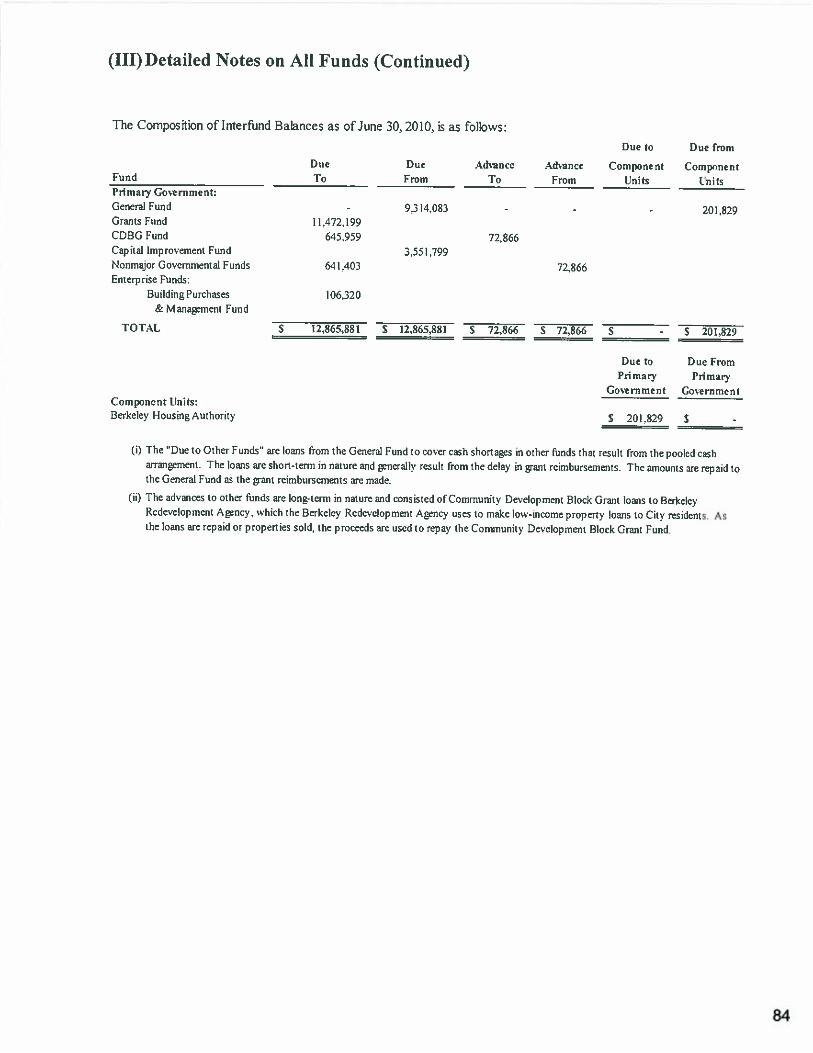
(III) Detailed Notes on All Funds (Continued)
The Composition of Interfund Balances as of June 30, 2010. is as follows:
flue to Due fioni
Due Due Adnance Adance Component Comp”nentFund To From To From Units UnitsPritnarv Go?rnment:Generalfund - 9.314.083 - - - 201829Grants Fund 11.472.199CDBG Fund 645,959 72.866Capital Improvement Fund 3.551.799Nonmajor Governmental Funds 64 1.403 72.866Enterprise Funds:
Bui!ding?urchases 106.320& Manament Fund
TOTAL S 32,865,88! S 12,865,881 S 72,866 S 72,866 S - S 201,829
Due to Due FromPrimary Primary
Government GovernmentComponent Units:Berkeley Housing Authority S 201.829 S
(i) The “Due to Other Funds” arc loans from the General Fund to cover cash shortages in other funds that result from the pooled casharrangement. The loans are shon-tenn in nature and generally result from the delay in anl reimbursements. The amounts are repaid tothe General Fund as tlae gain reimbursements are made.
(ii) The advances to other hinds are lona-tenn in nature and consisted of Community Development Block Grant loans to BerkeleyRedevelopment Agency. which the Berkeley Redevelopmcnt Agency uses to make lo-uicome property loans to City residents Asthe loans are repaid or properties sold, the proceeds are used to repay the Community Development B:ock Gran: Fnnd.
84
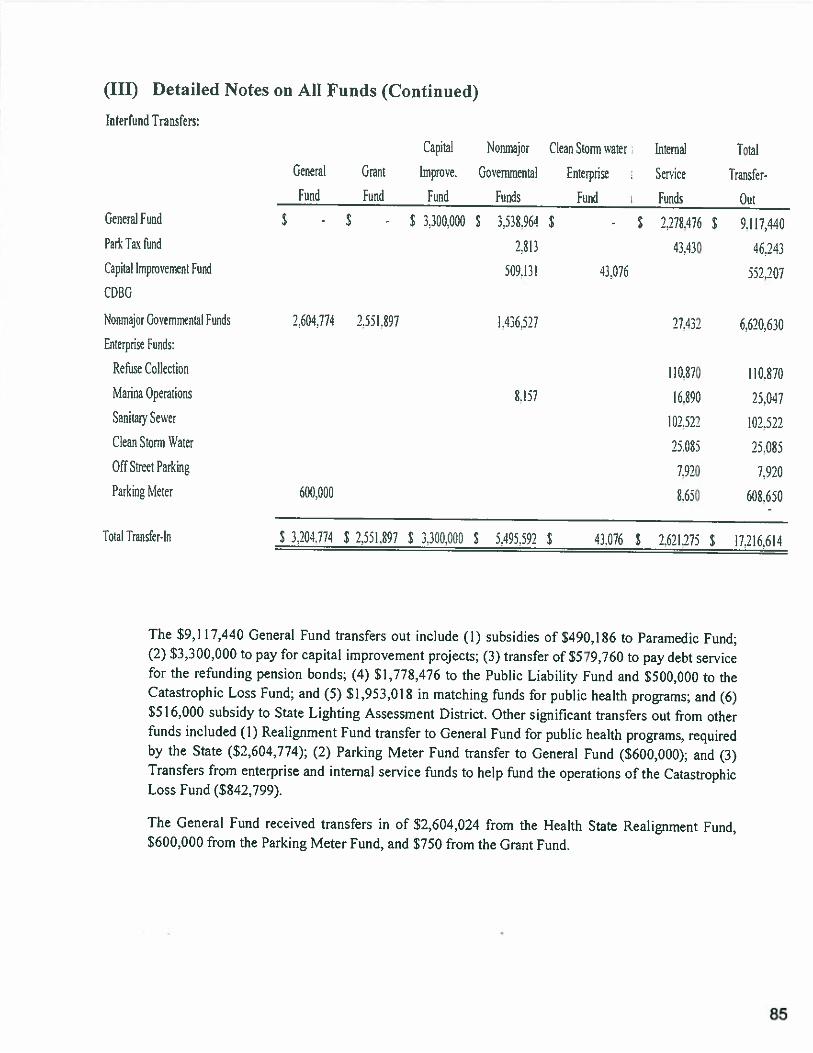
(III) Detailed Notes on All Funds (Continued)
Interfund Transfers:
Nonmajor Governmental Funds 2.604.774 2.551.897 1.43 6,5 2 7 27.432 6.620.630Enterprise Funds:
Off Siree ParknE
Parking Mete: 600000
Total Transfer-In
25.085
7.920 7.920
8.650 608.650
The $9,117,440 General Fund transfers out include (1) subsidies of $490,186 to Paramedic Fund;(2) $3,300,000 to pay for capital improvement projects; (3) transfer of $579,760 to pay debt servicefor the refunding pension bonds; (4) 51,778,476 to the Public Liability Fund and $500,000 to theCatastrophic Loss Fund; and (5) $1,953,018 in matching funds for public health programs; and (6)$516,000 subsidy to State Lighting Assessment District. Other significant transfers out from otherfunds included (1) Realignment Fund transfer to General Fund for public health programs, requiredby the State ($2,604,774); (2) Parking Meter Fund transfer to General Fund ($600,000); and (3)Transfers from enterprise and internal service funds to help fund the operations of the CatastrophicLoss Fund ($842,799).
The General Fund received transfers in of $2,604,024 from the Health State Realignment Fund,5600.000 from the Parking Meter Fund, and $750 from the Grant Fund.
Fund Fund
Capital N’onnaior Cean Storm wa:er In:ernal TotalGeneral Gram Iranrove. Gcvernni.etal b:erDrise Service Transfer-
General Fund
Park Ta fund
Capital Improvement Fund
CDBG
Fund
$ - $ - $3,300,000
Funds Fund
$ 3.538.964 $2.883
509.131
Funds
- $ 2,278.476
12.130
$
Out
9.117,440
J3fl75 552,207
Refuse Cdllecticn II 870 110.870Marina Operats 8.157 16,890 25.017Sanitaiy Sewer 102.522 102,522Clean Storm Water 25.085
S 3,204.774 $ 2.551.897 $ 3.300.000 $ 5.495.592 $ 43,076 $ 2,621.275 $ 17,216,614
85
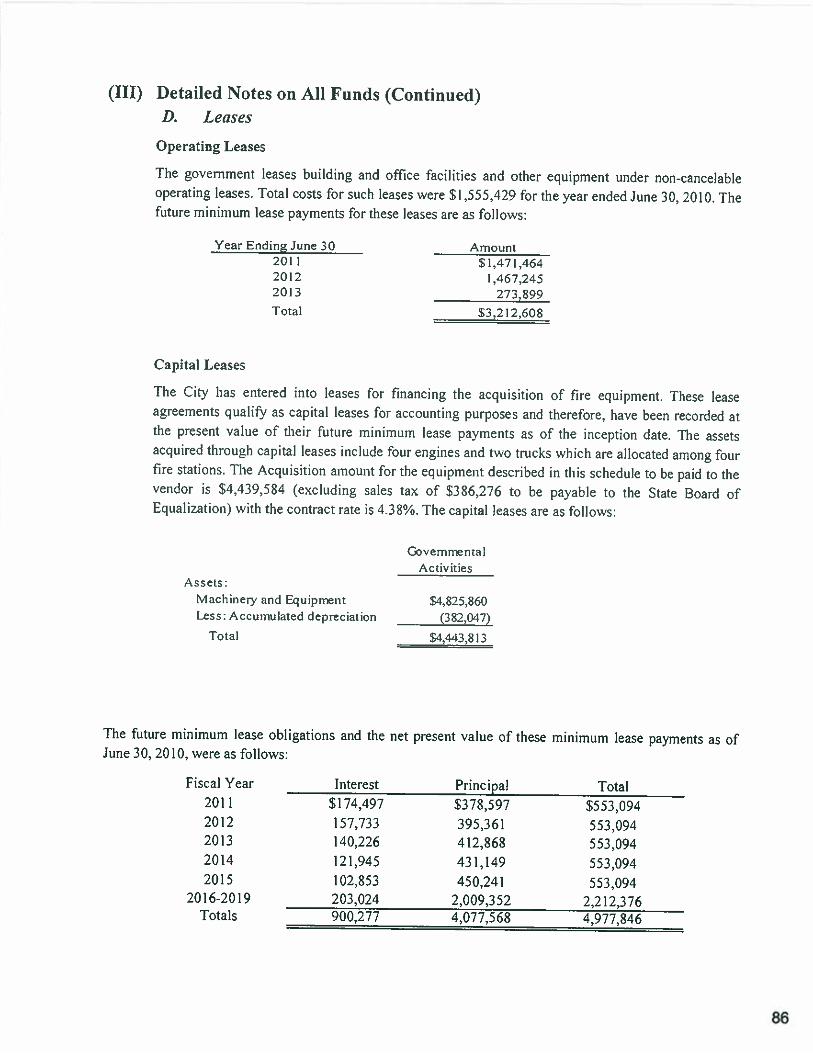
(III) Detailed Notes on All Funds (Continued)D. Leases
Operating Leases
The government leases building and office facilities and other equipment under non-cancelableoperating leases. Total costs for such leases were $1,555,429 for the year ended June 30, 2010. Thefuture rninimLlln lease payments for these leases are as follows:
Year Ending June30 Amount2011 $1,471,4642012 1,467,2452013 273,899Total $3.2 12,608
Capital Leases
The City has entered into leases for financing the acquisition of fire equipment. These leaseagreements quali as capital leases for accounting purposes and therefore, have been recorded atthe present value of their future minimum lease payments as of the inception date. The assetsacquired through capital leases include four engines and two trucks which are allocated among fourfire stations. The Acquisition amount for the equipment described in this schedule to be paid to thevendor is $4,439,584 (excluding sales tax of S386,276 to be payable to the State Board ofEqualization) with the contract rate is 4.38%. The capital leases are as follows:
vemmentalAct iv ties
Assets:Machineiy and Equipment $4,825,860Less: Accumulated depreciation (382.04)
Total $4,443,813
The future minimum lease obligations and the net present value of these minimum lease payments as ofJune 30, 2010. were as follows:
Fiscal Year Interest Principal Total2011 $174,497 $378,597 $553,0942012 157,733 395,361 553.0942013 140.226 412.868 553.0942014 121,945 431,149 553,0942015 102,853 450,241 553,094
2016-2019 203,024 2,009,352 2,212,376Totals 900,277 4,077,568 4,977,846
86
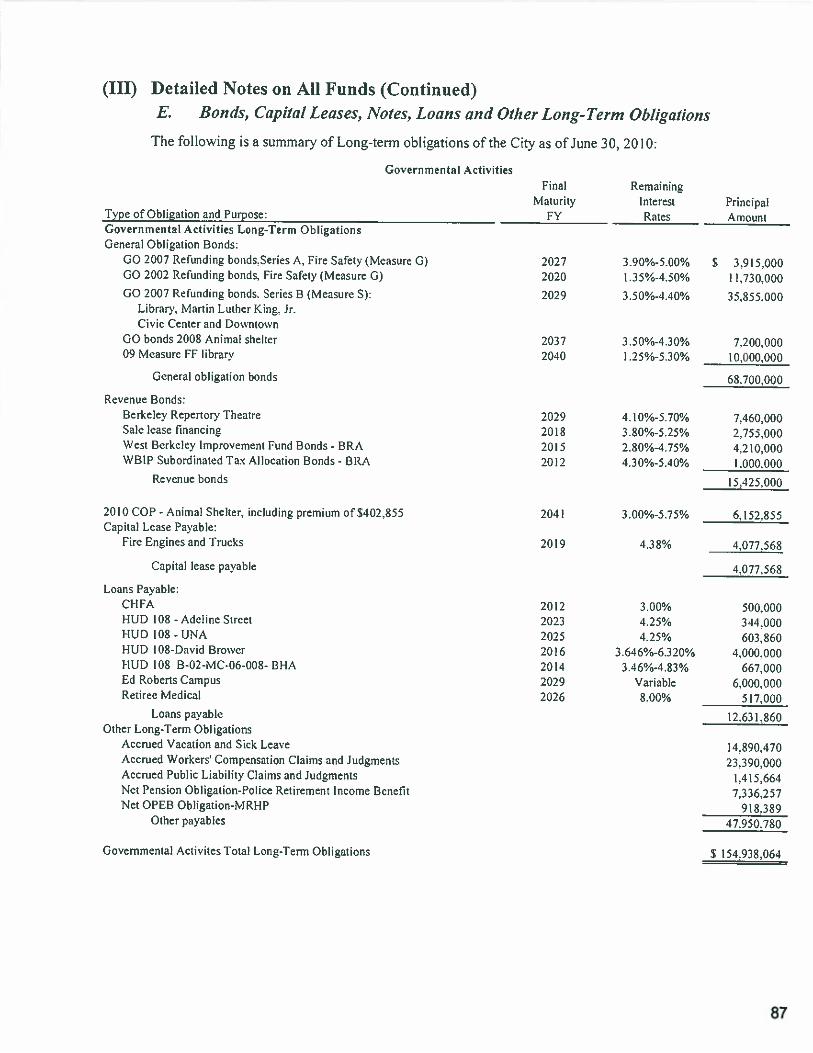
(III) Detailed Notes on All Funds (Continued)E. Bonds, Capita! Leases, NOteS, Loans and Oilier Long-Term Obligations
The following is a summary of Long-term obligations of the City as of June 30, 2010:
Governmental ActivitiesFinal Remaining
Maturity Interest PrincipalType of Obligation and Purpose: FY Rates AmountGovernmental Activities Long-Term ObligntionsGeneral Obligation Bonds:
GO 2007 Refunding hondsSeries A. Fire Safezy (Measure G) 2027 3.90%-5.00% S 3.915000GO 2002 Refunding bonds. Fire Safety (Measure G) 2020 1 .35%-4.50% I 1.730.000GO 2007 Refunding bonds. Series B (Measure 5): 2029 3.50%-4.4Oto 35,855.000
Library. Martin Luther King, Jr.Civic Center and Downtown
GO bonds 2008 Animal shelter 2037 3.50%-4.30% 7,200.00009 Measure FF library 2040 l.25%-5.30% 10.000.000
General obligation bonds 68.700.000
Revenue Bonds:Berkeley Repertory Theatre 2029 4.10%-5.70% 7.460.000Sale lease financing 2018 3.8C%-5.25% 2,755.000West Berkeley improvement Fund Bonds - BRA 2015 2.80%-4.75% 4.210.000WBIP Subordinated Tax Allocation Bonds - BRA 2012 4.30%-5.40% 1,000.000
Revenue bonds 15.125.000
2010 COP -Animal Shelter, including premium of $402855 2011 3.00%-5.75% 6.152.855Capital Lease Pavah!c:
Fire Engines and Trucks 2019 4.38% 4.077.568
Capital lease payable 4.077.568
Loans Payabe:CHFA 2012 3.00% 500.000FIUD 108- Adeline Street 2023 4.25% 344,000HUD 108- UNA 2025 4.25% 603.860HUD 108-David Brower 2016 3.646%-6320% 4.000.000FIUD 108 B-02-MC-06-008- BRA 2014 3.46%-4.83% 667,000Ed Roberts Campus 2029 Variable 6,000.000Retiree Medical 2026 8.00% 517.000
Loans payable 12.631.860Other Long-Term Obligations
Accrued Vacation and Sick Leave 14.890,470Accrued Workers’ Compensation Claims and Judgments 23,390,000Accrued Public Liability Claims and Judgments 1.415,664Net Pension Obligation-Police Retirement Income Benefit 7,336,257Net OPEB Obligation-MRHP 918.389
Other payahles 47.950.780
Governmental Activites Total Long-Term Obligations S 154.938.064
87
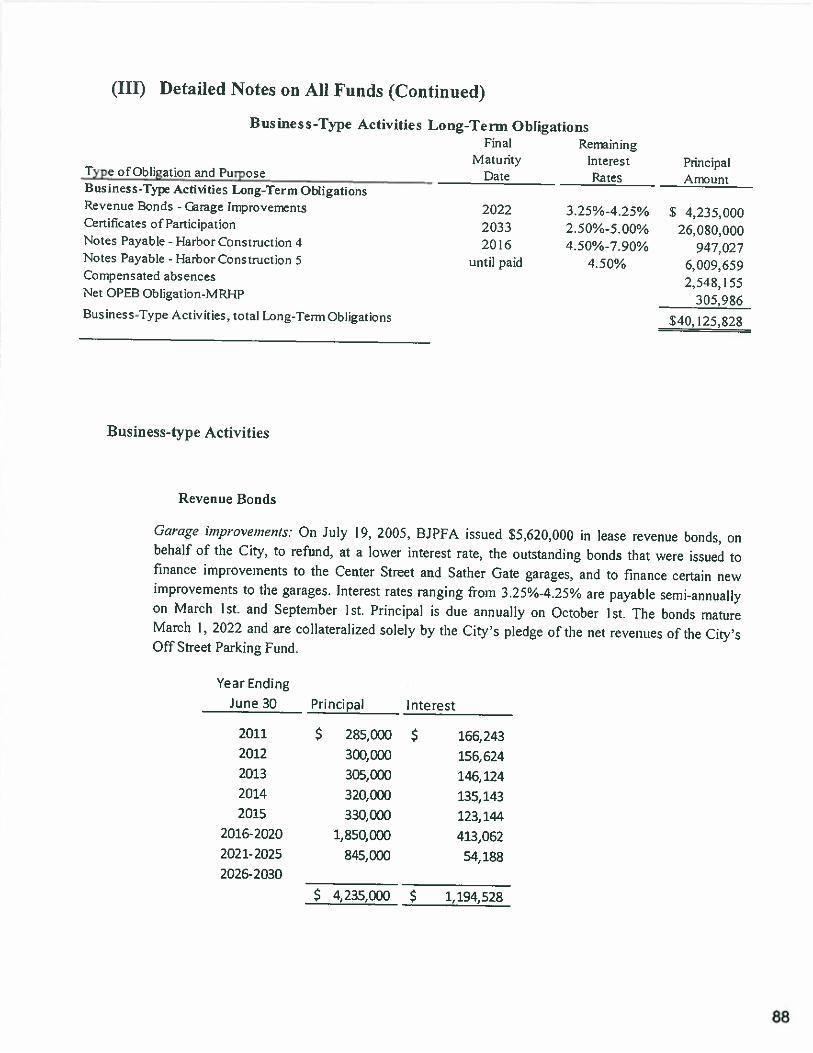
(III) Detailed Notes on All Funds (Continued)
Bus inc s s-Type Activities Long-Term ObligationsFinal Remaining
Maturity Interest PrincipalType of Obligation and Purnose Date Rates AntuntBusiness-Type Acthities Long-Term ObligationsRevenue Bonds - Cerage Improvements 2022 3.25%-4.25% $ 4,235,000Certificates of Participation 2033 2.50%-5.00% 26,080,000Notes Payable - Harbor Construction 4 2016 4. 50%-7.90% 947.027Notes Payable - Harbor Construction S until paid 4.50% 6.009.659Compensated absences 2,548,155Net OPEB Obligation-MRHP 305,986Business-Type Activities, total Long-Term Obligations 540.125.828
Business-type Activities
Revenue Bonds
Garage improvements: On July 19, 2005, BJPFA issued $5,620,000 in lease revenue bonds, onbehalf of the City, to refund, at a lower interest rate. the outstanding bonds that were issued tofinance improvements to the Center Street and Sather Gate garages, and to finance certain newimprovements to the garages. Jnterest rates ranging from 3.25%-4.25% are payable semi-annuallyon March 1st. and September 1st. Principal is due annually on October 1st. The bonds matureMarch 1, 2022 and are collateralized solely by the City’s pledge of the net revenues of the City’sOff Street Parking Fund.
Year Ending
June 30 Principal Interest
2011 $ 285,000 $ 166,2432012 300,000 156,6242013 305,000 146,1242014 320,000 135,1432015 330,000 123,144
2016-2020 1,850,000 413,0622021-2025 845,000 54,1882026-2030
$ 4,235,000 $ 1,194,528
88
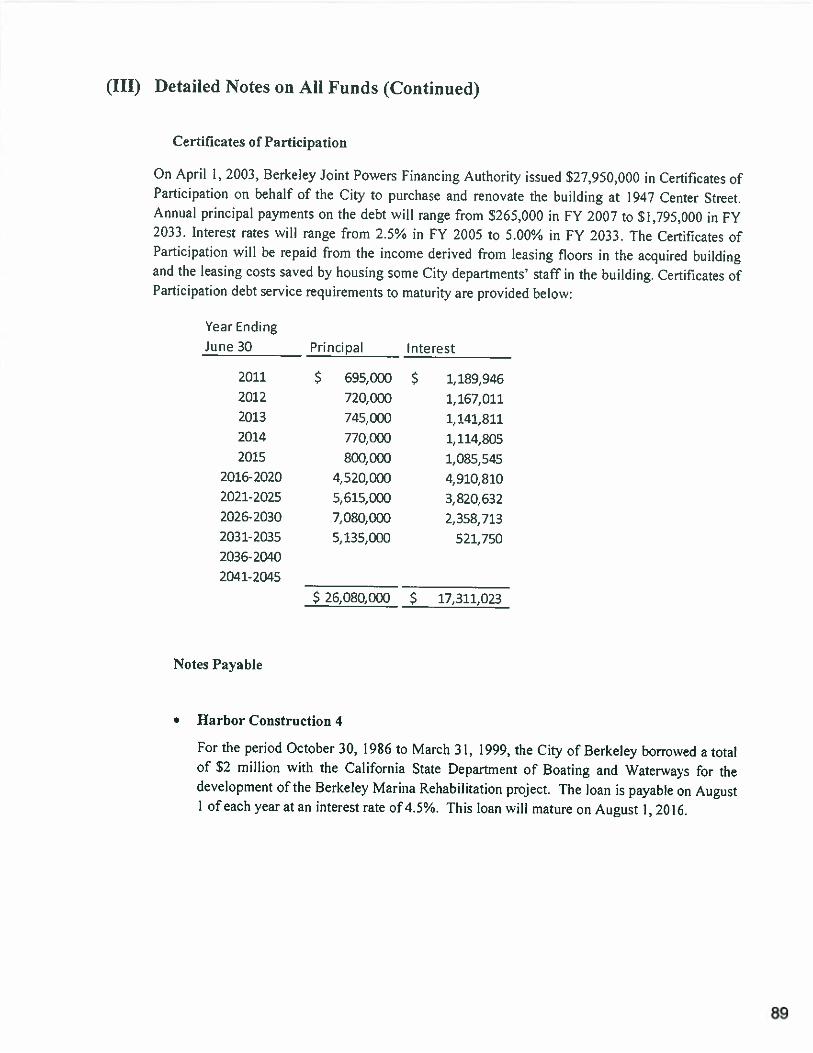
(III) Detailed Notes on All Funds (Continued)
Certificates of Participation
On April 1,2003, Berkeley Joint Powers Financing Authority issued $27,950,000 in Certificates ofParticipation on behalf of the City to purchase and renovate the building at 1947 Center Street.Annual principal payments on the debt will range from $265,000 in FY 2007 to $1,795,000 in FY2033. Interest rates wiN range from 2.5% in FY 2005 to 5.00% in FY 2033. The Certificates ofParticipation will be repaid from the income derived from leasing floors in the acquired buildingand the leasing costs saved by housing some City departments’ staff in the building. Certificates ofParticipation debt service requirements to maturity are provided below:
Year Ending
June 30 Principal Interest
2011 $ 695,000 $ 1,189,9462012 720,000 1,167,0112013 745,000 1,141,8112014 770,000 1,114,805
2015 800,000 1,085,5452016-2020 4,520,000 4,910,8102021-2025 5,615,000 3,820,6322026-2030 7,080,000 2,358,7132031-2035 5,135,000 521,7502036-2040
2041-2045
$ 26,080,000 $ 17,311,023
Notes Payable
• Harbor Construction 4
For the period October 30, 1986 to March 31, 1999, the City of Berkeley borrow d a totalof $2 million with the California State Department of Boating and Waterways for thedevelopment of the Berkeley Marina Rehabilitation project. The loan is payable on AugustI of each year at an interest rate of4.5%. This loan vill mature on August 1,2016.
89

(III) Detailed Notes on All Funds (Continued)Year Ending
June 30
2011.
2012
2013
2014
2015
2016
2017
Total
Principal Interest
$ 118,097 $ 42,616
123,411 37,302
128,965 31,748
134,768 25,945
140,833 25,845
147,170 19,880
153,786 6,920
$ 947,027 $ 190,258
• Harbor Construction S
The City of Berkeley borrowed a total of 56.009,659 of the $9.0 million maximum loanamount from the California State Department of Boating and Waterways. The purpose ofthis loan is financing for the demolition and replacement of wooden docks and wood pilesinto a new marina berthing system and concrete piles. New utilities, including electricalpower and water are to be installed. The new docks and gangways were to be designed andbuilt for barrier-free access. In addition, existing restroom buildings were to be replaced.The loan is payable on August I of each year with an interest of 4.50%. The amortizationschedule will not be available until the final draw down reaches $9.0 million. Currently, theCalifornia State Department of Boating and Waterways provides an annual statement of theamount of interest the City is required to pay.
Governmental-type Activities
General Obligation Bonds
The City issues general obligation bonds to provide funds for the acquisition and construction ofmajor capital facilities. General obligation bonds have been issued for governmental activities. Theoriginal amount of general obligation bonds issued in prior years was $81,500,000. Generalobligation bonds are direct obligations and pledge the full faith and credit of the government. Thesebonds generally are issued as 25-30 year serial bonds with amounts of principal maturing each year.General obligation bonds currently outstanding are as follows:
90
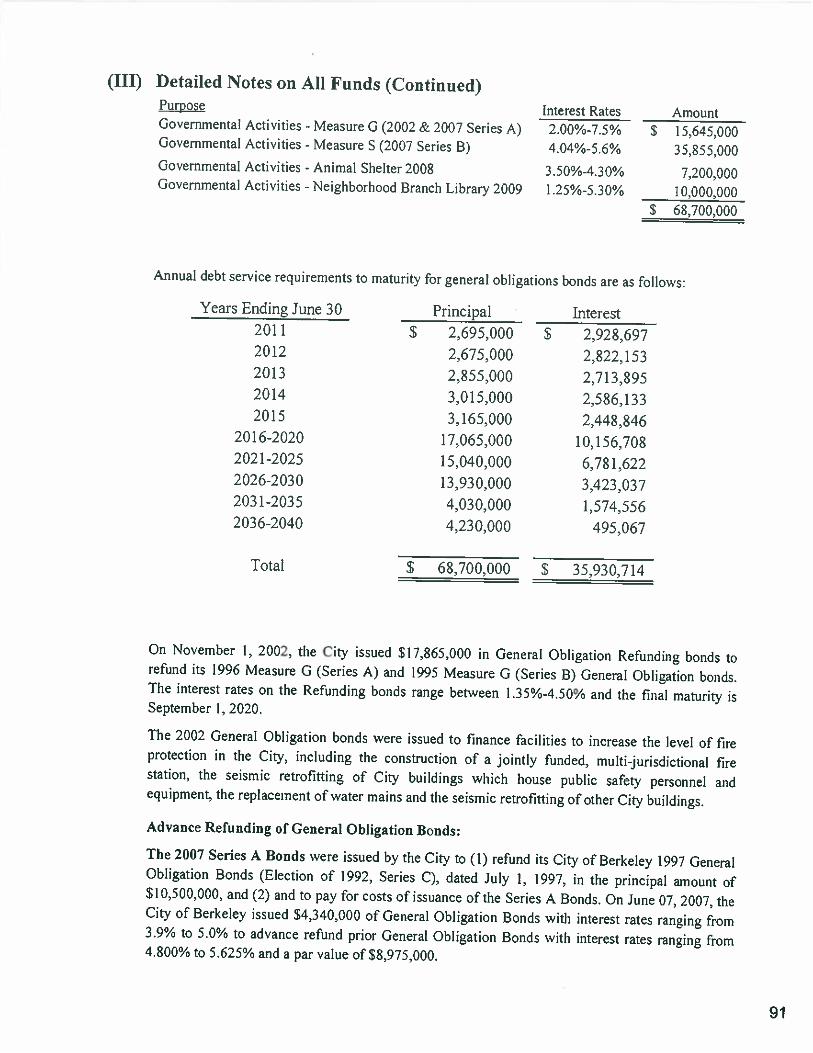
(III) Detailed Notes on All Funds (Continued)PurposeGovernmentalGovernmental
Interest Rates2.00%-7.5%4.01%-5.6%
3.50%-4.30%1.25%-S .30%
Amount$ 15,645,000
35.855.000
7,200,00010.000,000
5 68.700.000
Annual debt service requirements to maturity for general obligations bonds are as follows:
Years Ending June 302011
2012
201320142015
20 16-2020202 1-20252026-203 02031-20352036-2040
Principal
$ 2,695,0002,675,0002,855,0003,015,0003,165,000
17,065,00015,040,00013,930,0004,030,0004,230,000
Interest
$ 2,928,6972,822,1532,713,8952,586,1332.448,846
10,156,7086,781,6223.423,0371,574,556
495,067
Total S 68,700,000 S 35,930,714
On November 1, 2002, the City issued 5 17,865,000 in General Obligation Refunding bonds torefund its 1996 Measure G (Series A) and 1995 Measure G (Series B) General Obligation bonds.The interest rates on the Refunding bonds range between I .35%-4.50% and the final maturity isSeptember 1,2020.
The 2002 General Obligation bonds were issued to finance facilities to increase the level of fireprotection in the City, including the construction of a jointly funded. multi-jurisdictional firestation, the seismic retrofitting of City buildings which house public safety personnel andequipment. the replacement of water mains and the seismic retrofitting of other City buildings.
Advance Refunding of General Obligation Bonds:
The 2007 Series A Bonds were issued by the City to (I) refund its City of Berkeley 1997 GeneralObligation Bonds (Election of 1992, Series C), dated July 1, 1997, in the principal amount ofSl0,500.000, and (2) and to pay for costs of issuance of the Series A Bonds, On June 07, 2007, theCity of Berkeley issued $4,340,000 of General Obligation Bonds with interest rates ranging from3.9% to 5.0% to advance refund prior General Obligation Bonds with interest rates ranging from4.800% to 5.625% and a par value of $8,975,000.
Activities - Measure G (2002 & 2007 Series A)Activities - Measure 5 (2007 Series B)
Governmental Activities - Animal Shelter 2008Governmental Activities - Neighborhood Branch Library 2009
91
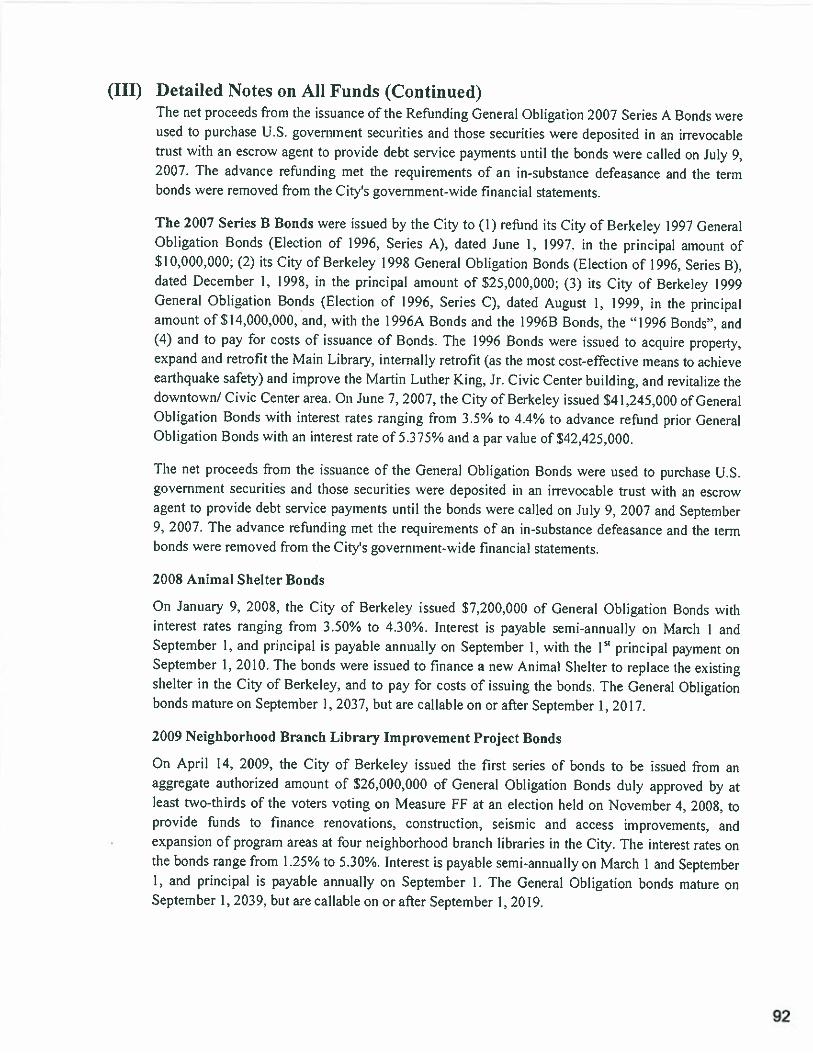
(III) Detailed Notes on All Funds (Continued)The net proceeds from the issuance of the Refunding General Obligation 2007 Series A Bonds wereused to purchase U.S. government securities and those securities were deposited in an irrevocabletrust with an escrow agent to provide debt service payments untiL the bonds were called on July 9.2007. The advance refunding met the requirements of an in-substance defeasance and the termbonds were removed from the City’s government-wide financial statements.
The 2007 Series B Bonds were issued by the City to (I) refund its City of Berkeley 1997 GeneralObligation Bonds (Election of 1996, Series A), dated June 1, 1997, in the principal amount of$10,000,000: (2) its City of Berkeley 1998 General Obligation Bonds (Election of 1996, Series B),dated December 1, 1998. in the principal amount of 525.000,000; (3) its City of Berkeley ]999General Obligation Bonds (Election of 1996, Series C), dated August 1. 1999, in the principalamount ofSl4,000.000. and, with the l996A Bonds and the 1996B Bonds, the “1996 Bonds”, and(4) and to pay for costs of issuance of Bonds. The 1996 Bonds were issued to acquire property,expand and retrofit the Main Library, internally retrofit (as the most cost-effective means to achieveearthquake safety) and improve the Martin Luther King, Jr. Civic Center building, and revitalize thedowntown/Civic Center area. On June 7,2007, the City of Berkeley issued 541.245.000 of GeneralObligation Bonds with interest rates ranging from 3.5% to 4.4% to advance refund prior GeneralObligation Bonds with an interest rate of5.375% and a par value of 542.425.000.
The net proceeds from the issuance of the Genera] Obligation Bonds were used to purchase U.S.government securities and those securities were deposited in an inevocable trust with an escrowagent to provide debt service payments until the bonds were called on July 9, 2007 and September9, 2007. The advance refunding met the requirements of an in-substance defeasance and the termbonds were removed from the City’s government—wide financial statements.
2008 Animal Shelter Bonds
On January 9, 2008, the City of Berkeley issued $7,200,000 of General Obligation Bonds withinterest rates ranging from 3.50% to 4.30%. Interest is payable semi-annually on March 1 andSeptember 1, and principal is payable annually on September 1, with the 1 principal payment onSeptember 1,2010. The bonds were issued to finance a new Animal Shelter to replace the existingshelter in the City of Berkeley, and to pay for costs of issuing the bonds. The General Obligationbonds mature on September 1, 2037, but are callable on or after September 1, 2017.
2009 Neighborhood Branch Library Improvement Project Bonds
On April 14, 2009, the City of Berkeley issued the first series of bonds to be issued from anaggregate authorized amount of 526.000,000 of General Obligation Bonds duly approved by atleast two-thirds of the voters voting on Measure FF at an election held on November 4. 2008. toprovide funds to finance renovations, construction, seismic and access improvements, andexpansion of program areas at four neighborhood branch libraries in the City. The interest rates onthe bonds range from 1.25% to 5.30%. Interest is payable semi-annually on March 1 and September1, and principal is payable annually on September 1. The General Obligation bonds mature onSeptember 1, 2039, but are callable on or afier September 1. 2019.
92
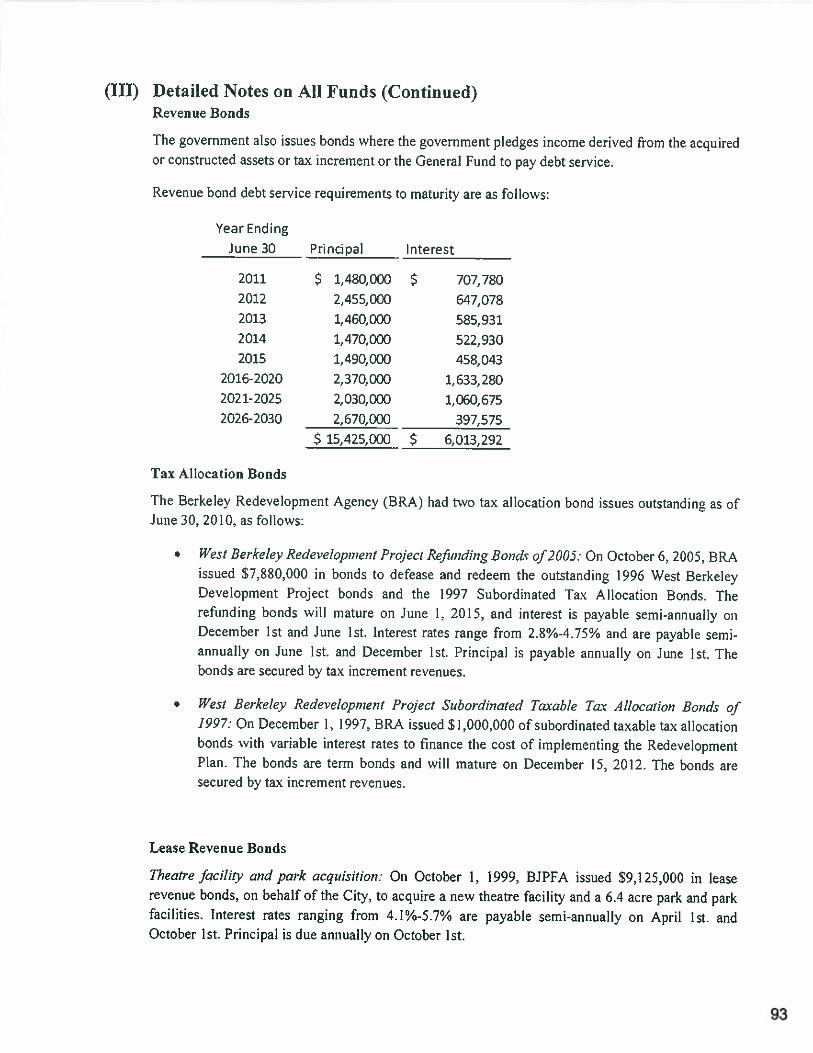
(III) Detailed Notes on All Funds (Continued)Revenue Bonds
The government also issues bonds where the government pledges income derived fitm the acquiredor constructed assets or tax increment or the General Fund to pay debt service.
Revenue bond debt service requirements to maturity are as follows:
Year Ending
June30 Principal Interest
2011
2012
2013
2014
2015
2016-2020
2021-2025
2026-2030
S $
Tax Allocation Bonds
The Berkeley Redevelopment Agency (BRA) had two tax allocation bond issues outstanding as ofJune 30, 2010, as follows:
• West Berkeley Redevelopment Project Refunding Boncic of2005: On October 6. 2005, BRAissued S7,880000 in bonds to defease and redeem the outstanding 1996 West BerkeleyDevelopment Project bonds and the 1997 Subordinated Tax Allocation Bonds. Therefunding bonds will mature on June 1, 2015, and inlerest is payable semi-annually onDecember 1st and June 1st. Interest rates range from2.8%-4.7S% and are payable semiannually on June 1st. and December 1st. Principal is payable annually on June 1st. Thebonds are secured by tax increment revenues.
• West Berkeley Redevelopment Project Subordinated TcLvable Tax Allocation Bonds of1997: On December 1. 1997, BRA issued SI .000.000 of subordinated taxable tax allocationbonds with variable interest rates to finance the cost of implementing the RedevelopmentPlan. The bonds are term bonds and will mature on December 15, 2012. The bonds aresecured by tax increment revenues.
Lease Revenue Bonds
Theatre facility and park acquisition: On October 1. 1999, BJPFA issued 59,125.000 in leaserevenue bonds, on behalf of the City. to acquire a new theatre facility and a 6.4 acre park and parkfacilities. Interest rates ranging from 4.1%-5.7% are payable semi-annually on April 1st. andOctober I st. Principal is due annually on October 1st.
$ 1,480,000
2,455,000
1,460,000
1,470,000
1,490,000
2,370,000
2,030,000
2,670,000
15,425,000
$ 707,780
647,078
585,931
522,930
458,043
1,633,280
1,060, 675
397,575
6,013,292
93
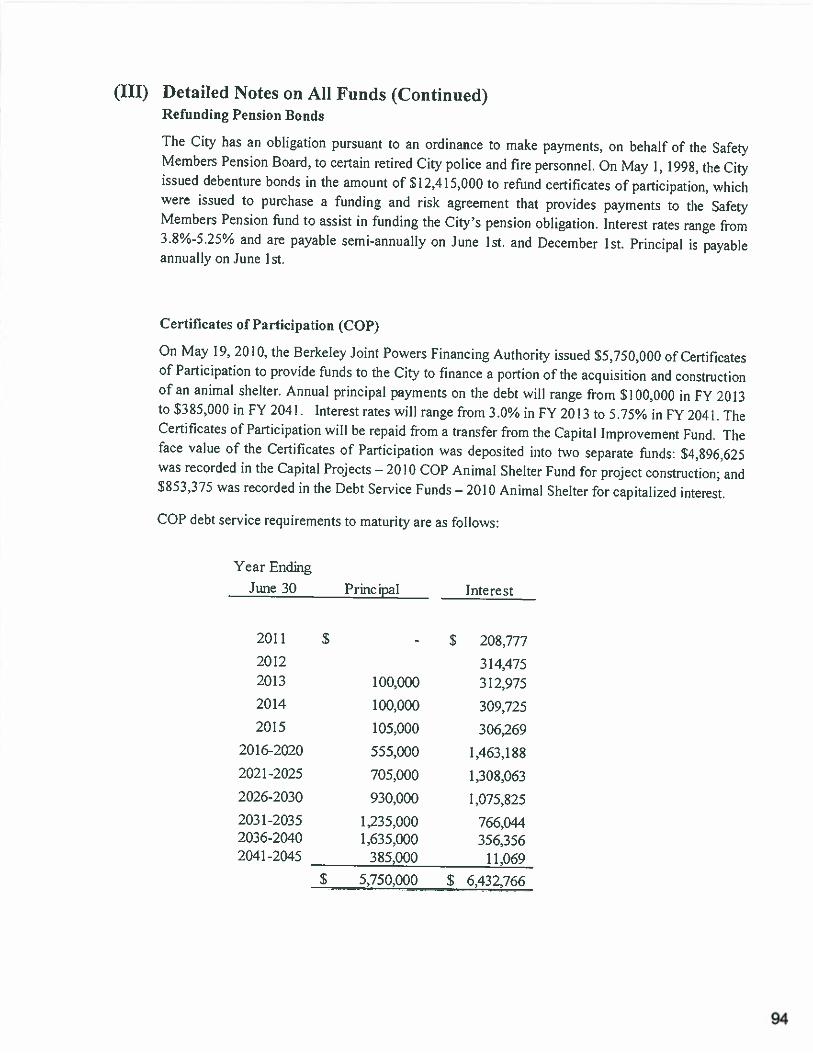
(III) Detailed Notes on All Funds (Continued)Refunding Pension Bonds
The City has an obligation pursuant to an ordinance to make payments, on behalf of the SafetyMembers Pension Board, to certain retired City police and fire personnel. On May 1. 1998, the Cityissued debenture bonds in the amount of $12,415,000 to refund certificates of participation, whichwere issued to purchase a funding and risk agreement that provides payments to the SafetyMembers Pension fund to assist in funding the City’s pension obligation. Interest rates range from3.8%-5.25% and are payable semi-annually on June 1st. and December 1st. Principal is payableannually on June 1st.
Certificates of Participation (COP)
On May 19, 2010, the Berkeley Joint Powers Financing Authority issued $5,750,000 of Certificatesof Participation to provide funds to the City to finance a portion of the acquisition and constructionof an animal shelter. Annual principal payments on the debt will range from $100,000 in FY 2013to $385,000 in FY 2041. Interest rates will range from 3.0% in FY 2013 to 5.75% in FY 2041. TheCertificates of Participation will be repaid from a transfer frnm the Capital Improvement Fund. Theface value of the Certificates of Participation was deposited into two separate funds: 54.896.625was recorded in the Capital Projects —2010 COP Animal Shelter Fund for project construction; and$853,375 was recorded in the Debt Service Funds —2010 Animal Shelter for capitalized interest.
COP debt service requirements to maturity are as follows:
- $ 208,777
314,475312.975
309,725
306,269
1,463,188
1,308,063
1,075.825
766,044356,356
11,069
6,432,766
Year Ending
June 30 Principal Interest
$2011
20122013
2014
2015
2016-2020
2021-2025
2026-2030
2031-20352036-20402041-2045
100.000
100,000
105,000
555,000
705,000
930,000
1,235,0001.635.000
385,000
5,750.000-- $
94
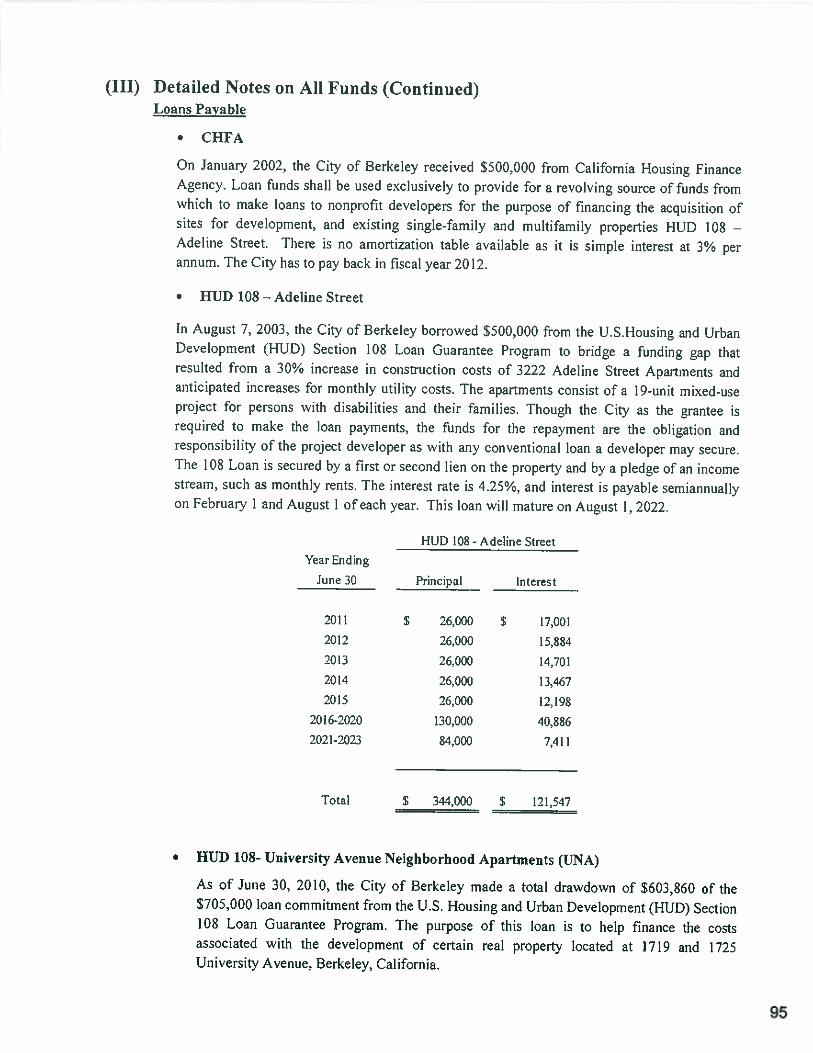
(III) Detailed Notes on All Funds (Continued)Loans Payable
• CHFA
On January 2002, the City of Berkeley received $500,000 from California Housing FinanceAgency. Loan funds shall be used exclusively to provide for a revolving source of funds fromwhich to make loans to nonprofit developers for the purpose of financing the acquisition ofsites for development, and existing single-family and multifamily properties HUD 108 —
Adeline Street. There is no amortization table available as it is simple interest at 3% perannum. The City has to pay back in fiscal year 2012.
• HUD 108— Adeline Street
In August 7, 2003, the City of Berkeley borrowed $500,000 from the U.S.Housing and UrbanDevelopment (HUD) Section 108 Loan Guarantee Program to bridge a ftinding gap thatresulted from a 30% increase in construction costs of 3222 Adeline Street Apartments andanticipated increases for monthly utility costs. The apartments consist of a 19-unit mixed-useproject for persons with disabilities and their families. Though the City as the grantee isrequired to make the loan payments, the funds for the repayment are the obligation andresponsibility of the project developer as with any conventional loan a developer may secure.The 108 Loan is secured by a first or second lien on the property and by a pledge of an incomestream, such as monthly rents. The interest rate is 4.25%. and interest is payable semiannuallyon February I and August 1 of each year. This loan will mature on August 1,2022.
HUD 108- Adeline StreetYear Ending
June30 Principal interest
2011 S 26.000 $ 17,00]20I2 26,000 15,8842013 26.000 14,70]2014 26,000 13,467
2015 26,000 12,198
2016-2020 130,000 40.8862021-2023 84,000 7,411
Total S 344,000 S 121.547
• HUD 108- University Avenue Neighborhood Apartments (UNA)
As of June 30, 2010, the City of Berkeley made a total drawdown of $603,860 of the$705,000 loan commitment from the U.S. Housing and Urban Development (HUD) Section108 Loan Guarantee Program. The purpose of this loan is to help finance the costsassociated with the development of certain real property located at 179 and 725University Avenue. Berkeley, California.
95
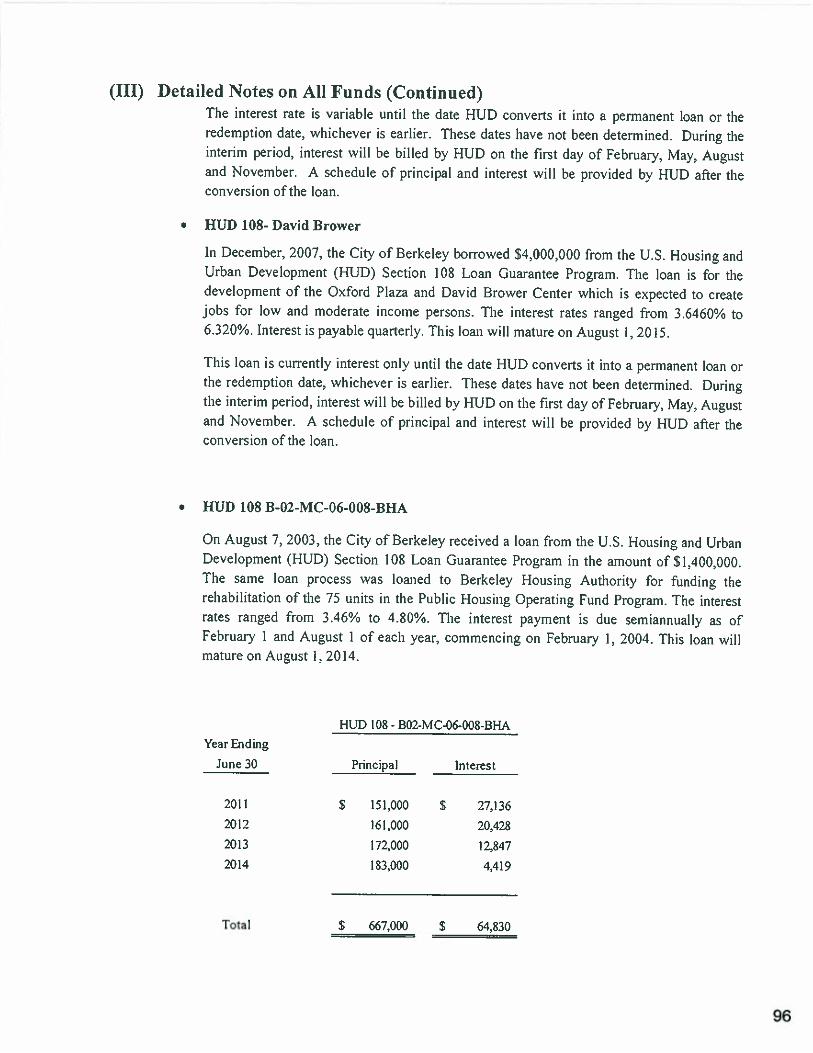
(III) Detailed Notes on All Funds (Continued)The interest rate is variable until the date HUD converts it into a permanent loan or theredemption date, whichever is earlier. These dates have not been determined. During theinterim period, interest will be billed by HUD on the first day of February, May, Augustand November. A schedule of principal and interest will be provided by HUD after theconversion of the loan.
• HUD 108- David Brower
In December, 2007, the City of Berkeley borrowed $4,000,000 from the U.S. Housing andUrban Development (HUD) Section 108 Loan Guarantee Program. The loan is for thedevelopment of the Oxford Plaza and David Brower Center which is expected to createjobs for low and moderate income persons. The interest rates ranged from 3.6460% to6.320%. Interest is payable quarterly. This loan will mature on August 1,2015.
This loan is cunently interest only until the date HUD converts it into a permanent loan orthe redemption date, whichever is earlier. These dates have not been determined. Duringthe interim period, interest will be billed by HUD on the first day of February. May, Augustand November. A schedule of principal and interest will be provided by BUD after theconversion of the loan.
• HUD 108 B-02-MC-06-008-BHA
On August 7,2003, the City of Berkeley received a loan from the U.S. Housing and UrbanDevelopment (f-lCD) Section 108 Loan Guarantee Program in the amount of S1.400.000.The same loan process was loaned to Berkeley Housing Authority for funding therehabilitation of the 75 units in the Public Housing Operating Fund Program. The interestrates ranged from 3.46% to 4.80%. The interest payment is due semiannually as ofFebruary 1 and August I of each year, commencing on February 1. 2004. This loan willmature on August 1, 2014.
Year Ending
June 30
_______________ _______________
2011
2012
2013
2014
Total
HUD 108- B02-MC-06-008-BHA
Principal Interest
S 151.000 S 27.136161,000 20,428
172,000 12,847
183,000 4,419
S 667.000 S 64,830
96
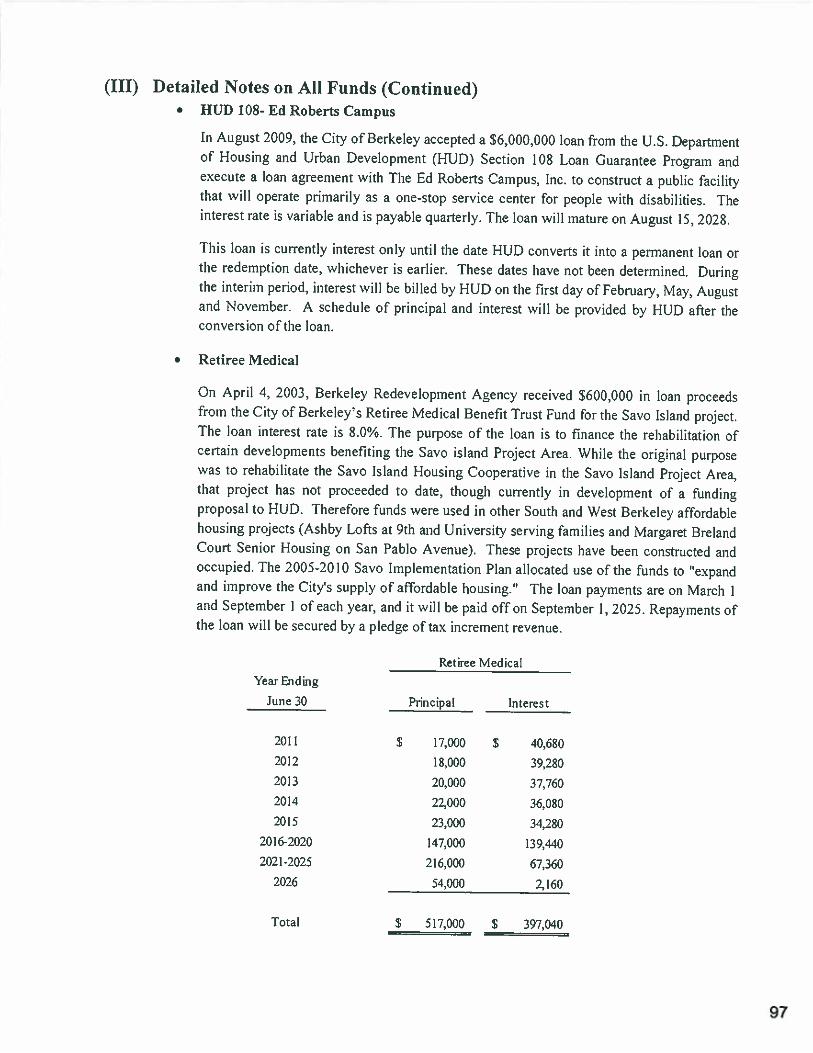
(III) Detailed Notes on All Funds (Continued)• HUD 108- Ed Roberts Campus
In August 2009, the City of Berkeley accepted a S6,000,000 loan from the U.S. Departmentof Housing and Urban Development (HUD) Section 108 Loan Guarantee Program andexecute a loan agreement with The Ed Roberts Campus, Inc. to construct a public facilitythat will operate primarily as a one-stop service center for people with disabilities. Theinterest rate is variable and is payable quarterly. The loan will mature on August 15. 2028.
This loan is currently interest only until the date HUD converts it into a permanent loan orthe redemption date, whichever is earlier. These dates have not been determined. Duringthe interim period, interest will be billed by HUD on the first day of February, May, Augustand November. A schedule of principal and interest will be provided by HUD after theconversion of the loan.
• Retiree Medical
On April 4, 2003, Berkeley Redevelopment Agency received S600,000 in loan proceedsfrom the City of Berkeley’s Retiree Medical Benefit Trust Fund for the Savo Island project.The loan interest rate is 8M°/b. The purpose of the loan is to finance the rehabilitation ofcertain developments benefiting the Savo island Project Area. While the original purposewas to rehabilitate the Savo Island Housing Cooperative in the Savo Island Project Area,that project has not proceeded to date, though currently in development of a fundingproposal to HUD. Therefore funds were used in other South and West Berkeley affordablehousing projects (Ashby Lofts at 9th and University serving families and Margaret BrelandCourt Senior Housing on San Pablo Avenue). These projects have been constructed andoccupied. The 2005-2010 Savo Implementation Plan allocated use of the funds to “expandand improve the City’s supply of affordable housing.” The loan payments are on March 1and September 1 of each year, and it will be paid off on September 1,2025. Repayments ofthe loan will be secured by a pledge of tax increment revenue.
Retiree MedicalYear Ending
June30 Principal Interest
2011 $ 17,000 $ 40,6802Q12 18,000 39,2802013 20,000 37,7602014 22,000 36,080
2015 23,000 34,2802016-2020 147,000 139.440
2021-2025 216,000 67,360
2026 54,000 2,160
Total S 517,000 S 397,040
97
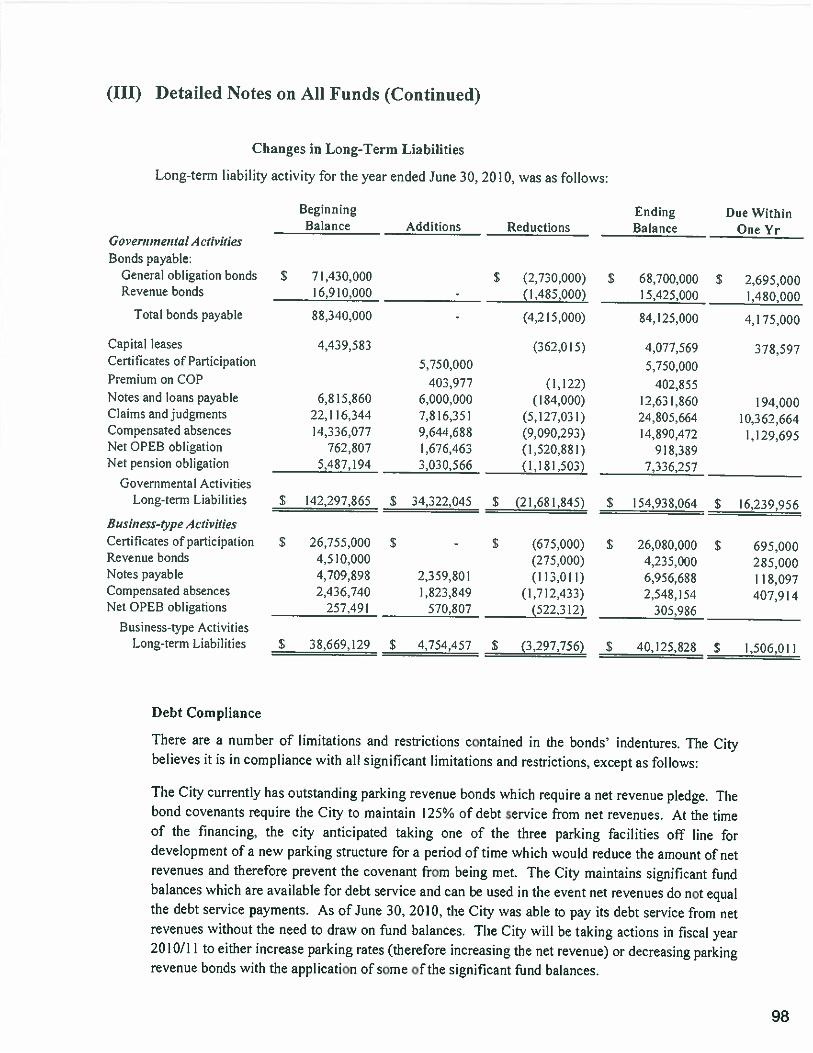
(III) Detailed Notes on All Funds (Continned)
Changes in Long-Term Liabilities
Long-term liability activity for the year ended June 30, 2010, was as follows:
Go verninental ActivitiesBonds payable:
General obligation bondsRevenue bonds
________________ ______________ _______________
—
Total bonds payable 84,125,000 4,175,000
Capital leases 4,077.569Certificates of Participation 5,750,000Premium on COP 402,855Notes and loans payable 12,631,860Claims and judgments 24,805.664Compensated absences 14,890,472Net OPEB obligation 918,389Net pension obligation
_________________ _______________ ________________
7.336.257Governmental Activities
Long-term Liabilities
________________ ______________ _______________
Business-type ActivitiesCertificates of participationRevenue bondsNotes payableCompensated absencesNet OPEB obligations
_________________ _______________ ________________ ________________________________
Business-type ActivitiesLong-term Liabilities
_________________ _______________ ________________ ________________________________
Debt Compliance
There are a number of limitations and restrictions contained in the bonds’ indentures. The Citybelieves it is in compliance with all significant limitations and restrictions, except as follows:
The City currently has outstanding parking revenue bonds which require a net revenue pledge. Thebond covenants require the City to maintain 125% of debt service from net revenues. At the timeof the financing, the city anticipated taking one of the three parking facilities off line fordevelopment of a new parking structure for a period of time which would reduce the amount of netrevenues and therefore prevent the covenant from being met. The City maintains significant fundbalances which are available for debt service and can be used in the event net revenues do not equalthe debt service payments. As of June 30. 2010, the City was able to pay its debt service from netrevenues without the need to draw on fund balances. The City will be taking actions in fiscal year2010/Il to either increase parking rates (therefore increasing the net revenue) or decreasing parkingrevenue bonds with the application of some of the significant hind balances.
BeginningBalance Additions Reductions
EndingBalance
Due WithinOne Yr
S 2.695.0001,480.000
S 68,700,00015,425,000
S 71.430.000 $ (2.730.000)16,910,000 . (1.485.000)
88,340,000 - (4,215,000)
4,439,583 (362,015)5.750.000
403.977 (1.122)6,815,860 6.000.000 (184.000)
22,116.344 7,816,35] (5,127,031)14.336,077 9,644,688 (9,090.293)
762,807 1,676,463 (1,520,881)5.487,194 3,030,566 (1,181.503)
S 142.297.865 S 34,322.045 $ (21,681.845)
S 26,755,000 S - S (675,000)4,510,000 (275,000)4,709,898 2.359.801 (113.01])2,436,740 1,823,849 (1,712.453)
257.491 570.807 (522.312)
5 38,669,129 $ 4,754,457 $ (3,297.756)
378,597
194,00010,362,6641,129,695
S 154.938.064 S 16,239.956
S 26,080,000 $ 695,0004,235.000 285,0006.956.688 1 I 8,0972.548.154 407.914
3 05 .9 86
5 40,125,828 $ 1,506,011
98
(III) Detailed Notes on All Funds (Continued)Arbitrage
The Tax Reform Act of 1986 instituted arbitrage restrictions related to the issuance of tax-exemptbonds issued after August 31. 1986. Those regulations relate to the investment of tax-exempt bondproceeds at an interest yield greater than the interest yield paid to bondholders. An independentfirm performs arbitrage rebate calculations to determine the applicability of federal arbitrageregulations. There were no bond issues with a positive arbitrage rebate liability during the fiscalyear.
Compensated Absences
It is the policy of the City to record the cost of vested vacation and sick leave as earned. Earnedvacation and sick leave that is taken during the year is payable from the fund(s) the employee’ssalary or wage is chargeable to. The vested compensated absences balances for employees whoretire or otherwise leave the City are paid from the Sick Leave and Vacation Payouts InternalService Fund at the time of departure.
Internal Service Funds
These funds predominantly serve the governmental funds. Accordingly, long-term liabilities forthem are incuded as part of the totals above for governnientai activities. At June 30, 2010,$570,184 in compensated absences, $24,805,664 in claims and judgments payables, and $64,792 inNet OPEB Obligation are included in the above amounts. The liabilities for workers’ compensationare paid from the Workers’ Compensation Internal Service Fund and the liabilities for publicliability claims are paid from the Public Liability Internal Service Fund.
Special Assessment Debt Without City Commitment
On June 1, 2002, the City issued $9,750,000 in Community Facilities District No. I bonds (fordisaster fire protection). pursuant to the Mello-Roos Community Facilities Act of 1982 (beingsection 5331 1 et seq. of the California Government Code and City Council Resolution #66,615-N.S). The bends were issued to finance a mobile disaster fire protection system for the delivery ofauxiliary fire fighting water, including transportation pumping units, ultra large diameter hose,transport and support vehicles, portable hydrants, accessory fittings, hose bridges, and a storage siteor sites, together with incidental expenses related thereto. These bonds will be repaid from amountslevied against property owners benefited by the disaster fire protection system. The amounts leviedagainst property owners to repay the bonds are accounted for in an agency fund. The faith andcredit or taxing power of the City is not pledged to the pa ment of the bonds. Accordingly, the debthas not been included in the basic financial statements. The bonds are due in annual installmentsranging from $270,000 to S760.000, and have an interest rate ranging between 3.0% and 4.75%.The City is not obligated in any way to repay the debt in the event of a default. The total principaloutstanding as of June 30, 2010 was 56.990.000.
Conduit Bond Issues
On June 1, 1992, the City issued refunding revenue bonds on behalf of Alta Bates Medical Centerin the amount of 593.200.000. This issue was refinanced in August 1997 for $88,660,000. Theamount outstanding at June 30, 2010 totaled 559,015,000 and is due as follows:
99
(III) Detailed Notes on All Funds (Continued)August 30, 2009 to August 15, 2010 $ 3,285,000August 20, 2010 to August30, 2023 55,730,000
S 59.015.000
In addition, on June 1, 1993, the City issued variable rate revenue bonds on behalf of the BerkeleyYoung Men’s Christian Association in the amount of $10,755,000. The bonds were re-offered onJune 1, 1998. The amount outstanding at June 30, 2008 totaled 58.51 5,000 but it was fully paid inJuly 2008 by a re-offering of bonds in July 2008. The amount outstanding at June 30, 2010 totaled$15,865,000. These bonds are not included in the accompanying financial statements as neither thefaith and credit nor the taxing power of the City of Berkeley have been pledged to the payment ofthese obligations.
Tax Revenue Anticipation Notes Payable
The City issued $25,000,000 of tax revenue anticipation notes with a coupon rate of 1.0% and ayield of 0.42% in October 2009, in order to alleviate the strain on working capital prior to thereceipt of property tax revenues in December. The notes are recorded in the General Fund, Interestand principal on these notes are payable on October 28, 2010 by the General Fund (In FY2OII, theissue date was moved up to July 1,2010 and increased to $50 million. The notes were issued with acoupon rate of 2.0% and yield of .40%). The City has maintained a MIG-1 rating on its short-termissues. A schedule of changes in the Tax Revenue Anticipation Note follows:
July 1, 2009 IncreasesS 25.000.000 S 25,000,000
DecreasesS 25,000.000
June 30, 2010S 25.000.000
Pledged Revenue
• City Pledge to Berke’ey Joint Powers Financing Authority: On July 19, 2005, the Cityissued $5,620,000 of bonds called the Revenue Bonds, 2005 Series A (City of BerkeleyParking System Financing Project), which were collateralized solely by the City’s pledgeof the net revenues of the City’s Off Street Parking Fund. The bonds were issued to refund,at a lower interest rate, the outstanding bonds that were issued to finance improvements tothe Center Street and Sather Gate garages, and to finance certain new improvements to thegarages. The City payments pledged as of June 30, 2010 total $6,786,909, and the pledgedCity payments are scheduled from fiscal years 2011 to 2022. The City has pledged andassigned to Berkeley Joint Powers Financing Authority approximately 100 percent of theCity’s rights to the net revenues of the Off Street Parking Fund. For FY 2010, the pledgedrevenues totaled $7,439,872 compared with debt service of $450,180.
• City Pledge to The Bank of New York Trust Company: On October 5, 2005, theBerkeley Redevelopment Agency (BRA) issued 57.880,000 of bonds called the WestBerkeley Redevelopment Project 2005 Refunding Tax Allocation Bonds. The bonds wereissued to fund various redevelopment projects of the BRA’s West Berkeley Redevelopment
100

(III) Detailed Notes on All Funds (Continued)Project and to refund, at a lower interest rate, some outstanding bonds. Tax incrementrevenues are pledged in their entirety to the payment of principal and interest on the bonds.Pledged BRA payments are scheduled from fiscal years 2011 to 2015. BRA has pledgedand assigned to The Bank of New York Trust Company (on behalf of the bondholders)approximately 58.905,405 or 100 percent of the BRA’s rights to the tax incrementrevenues. For FY 2010, the pledged revenues totaled $1,781.081 compared with debtservice of $845,572.
City Pledge to The Bank of New York Trust Company: On October 6, 1999, the City ofBerkeley issued 59.125.000 of bonds called the Berkeley Joint Powers Financing AuthorityLease Revenue Bonds. Series 1999. The bonds were issued for the acquisition of a theatreand park facilities. All of the revenues and fund balance are pledged in their entirety to thepayment of principal and interest on the bonds. The City has pledged and assigned toBerkeley Joint Powers Financing Authority approximately 100 percent of the City’s rightsto the revenues and 100% of the fund balance of the Berkeley Repertory Theatre Fund. ForFY 2010, the pledged revenues totaled $40,963 and pledged fund balance totaled 5645.877.compared with debt service of 5639,886. The fund was subsidized by a S410,898 TransferIn from the General Fund.
City Pledge to Depository Trust Company (DTC): On October 28, 2009, the City ofBerkeley issued $25,000,000 of FY 2010 Tax and Revenue Anticipation Notes. The Noteswere issued to provide moneys to meet the City’s General Fund cash flow requirementsduring the 2009-10 fiscal year commencing July 1. 2009 and ending June 30, 2010,including current expenditures. capital expenditures, and the discharge of other obligationsor indebtedness. The City pledges to deposit in a special fund (a) an amount equal to 50%of the principal amount of the Notes in Januaiy 2010; (b) an amount equal to 50% of theprincipal amount of the Notes in the month of May 2010; and (c) an amount sufficient topay interest as due on the Notes at their maturity, in the month of May 2010. The Citypledges 525.3 million in General Fund taxes and other revenue received in 2009-10.Pledged City payments are scheduled from fiscal years 2010 to 2011. The City has pledgedand assigned to DTC (on behalf of the note holders) approximatey $25.3 million or 17.6percent of the City’s rights to the General Fund annual revenues. For FY 2010, the pledgedrevenues totaled $26 million compared with debt service of $26 million.
Proposition IA Borrowing by the State of California: Under the provisions ofProposition IA and as part of the 2009-10 budget package passed by the California statelegislature on July 28, 2009, the State of California borrowed 8% of the amount of propertytax revenue, including those property taxes associated with the in-lieu motor vehicle licensefee, the triple flip in lieu sales tax, and supplemental property tax, apportioned to cities,counties and special districts (excluding redevelopment agencies). The state is required torepay this borrowing plus interest by June 30, 2013. After repayment of this initialborrowing. the California legislature may consider only one additional borrowing within aten-year period.
The amount of this borrowing pertaining to the City of Berkeley was $ 4,310,725
101
(III) Detailed Notes on All Funds (Continued)Authorized with the 2009-10 State budget package, the Proposition IA SecuritizationProgram was instituted by the California Statewide Communities Development Authority(“California Communities’). a joint powers authority sponsored by the California StateAssociation of Counties and the League of California Cities, to enable local governments tosell their Proposition IA receivables to California Communities. Under the SecuritizationProgram, California Communities simultaneously purchased the Proposition IA receivablesand issued bonds (“Prop IA Bonds”) to provide local agencies with cash proceeds in twoequal installments, on January 15, 2010 and May 3, 2010. The purchase price paid to thelocal agencies equaled 100% of the amount of the property tax reduction All transactioncosts of issuance and interest were paid by the State of California. Participaiing localagencies have no obligation on the bonds and no credit exposure to the State. The Cityparticipated in the securitization program and accordingly property taxes have beenrecorded in the same manner as if the State had not exercised its rights under PropositionIA. The receivable sale proceeds were equal to the book value and, as a result no gain orloss was recorded.
102

(III) Detailed Notes on All Funds (Continued)
Restricted assets
The balance of the restricted asset accounts in the enterprise and governmental funds are as follows:
Enterprise Funds:
Off Street Parking Fund:Revenue bond construction accountRevenue bond debt service reserve account
Building Acquisition Fund:COP 2003 Acquisition and construction accountCOP 2003 debt service reserve account
$ 3,108,026456,624
3,564,650
Total Enterprise Funds:
Governmental Funds:RDA 2005 Proceeds account (West Berkeicy Improvement capital project fund)RDA 2005 Redevelopment fund account (West Berkeley Improvement capital project fund)RDA 2005 2005 Reserve account (West Berkeley Improvement debt service fund)RDA 2005 Special fund account (West Berkeley Improvement debt service fund)
COP 2010 Project fund account (2010 COP Animal shelter capital project fund)COP 2010 Cost of issuance account (2010 COP Animal shelter capital project fund)COP 2010 Reserve fund account (2010 COP Animal shelter debt service fund)COP 2010 Capital interesi account (2010 COP Animal sheker debt service fund)
Berkeley Repertory Theatre debt service fundSale lease financing debt service fund
Total Govemmental Funds:
$ 12,620,755
$ 1,223,254
521,979788,003645,969
$ 9,887,712
7,166,5051,889,6009,056,105
5,100,000
12,287412,975
4.40,400
645,874
96,970
103

CITY OF BERKELEY
Notes to the Basic Financial Statement (Continued)June 30, 2010
IV. Other Information
A. Restatement of Fund Balance and Net Assets
1. Governmental Activities:Dais nrc Slice I S laicuin., I of
Gown’,nrnlal Funds NVI .-e’S,’r..nuv.i (.Jihn
Gcnera Grni, Lthran CDBG I’.jL IS i’u,cI’F U9r,:aI GeinwiniMsi .“.diuinwn n G”ernmen.dGnernnwnt1
FueJ Fur.J F’a,-J Fund Ta’ Bna Rt,u,s. inipiu”Cnkni Fu,nJ’ Ai:c’ Ao,,irFund thlann’JNci
.•tseis. al June 311.ZWI9. as iwnnioi.si.reported
S 44.991.427 $ 25,7511.9117 $ 12.247.239 S 4,711.545 S 2.9111.1113 S - 5 211.0224,75 $ 44.639.94-] 5 91.1129.1124 5 235.312.549
Rnhacrnenl:
Ca,h 42. 31) ‘3555.299, 9555.29) 42 1 1])’
-“‘ar4 Rntr:’abkTh11779(, (,.\791i
Nane, Rn,.n-.*-L- 22.1IoI :2” (II,
(SI her pay able I (4)11 2.544 44’ I 3.424
Gemmed Revenue 7.927.765] III] , 15(4 65]’ 11.129.4211
N”” aabk
Inte’.es i pas aisic
flIt’flaI nervier fund
in9eres acccued
F’, nd ftilai’emslNm I
•vsse is. ai June 30.2159. as reslaled S 45.044.103 .5 ‘7.925.765 S 2.291.939 5 4.721.533 5 2.9111.9 I 3 $ 9.955.299 S 211.247.675 5 44.395.4’13 9(1.646.241 2311 236.762
There was a misclassification of $42,130 in cash between the General Fund and a non-major governmentalfund in prior years. In FY2009. the construction proceeds of the measure ff Library Branch Renovationsbond proceeds, totaling $9.955.299. were inadvertently recorded in the Library Fund., a correcting priorperiod adjustment was made to establish a separate capital fund for these bond proceeds, which are to bespent on Library branches’ renovations and expansions. Notes receivable for tenant security depositstotaling 5225.000 was inadvertently omitted from the general ledger in prior years. The City overstatedother liabilities totaling $l3.424 in prior years ($10,450 in General Fund. S 2.544 in Grants Fund and S 430in Other Governmental Funds) due to problems in the held voucher account dating back to FY 1999.Parking Ticket Receivables of $2,687,790 recorded in the Duncan Parking Ticket Module was inadvertentlyomitted from the City’s general ledger in prior years. This amount was offset in a deferred revenue accountin the governmental fund balance sheet. There was a total of S8.129.428 of prior period adjustments due tothe deferral of revenue among Grants fund. CDBG and non-major governmental funds for grantsreceivable not collected within the 60 day availability period. In prior years. this amount was not deferred.
104

(IV) Other Information (Continued)
B. Risk Management
The City is exposed to various risks of loss related to torts: theft of. damace to and destruction ofassets; errors and omissions; injuries to employees: and natural disasters.
1. Public LiabilityThe City has excess coverage for Public Liability claims between $350,000 and $1,000,000 throughBay Cities Joint Powers Insurance Authority (BCJPIA). The California Affiliated RiskManagement Authority (CARMA) provides additional coverage to BCJPIA and its member entitiesfrom claims in excess of$I million to 529 million. The program is administered through the PublicLiability Internal Service Fund which is funded through transfers from the General Fund on abudgetary basis of S 175,000 is required as of August 1st each year. Disbursements from the PublicLiability Internal Service Fund are restricted to the payment of liability claims, personnel and otherinvestigation costs.
The City is a member of the Bay Cities Joint Powers Insurance Authority (BCJPIA) for its liabilitycoverage. BCJPIA was created in 1986 to develop effective risk management programs to reducethe amount and frequency of losses; to provide for pooled self-insurance among member agencies,to share the risk of self-insured losses; and to jointly purchase and provide administrative and otherservices including. but not limited to claims adjusting. data processing, risk management, lossprevention, accounting services, actuarial services, and legal services in connectien with theprogram. BCJP1A consists of 15 cities, three towns, one joint recreation committee, oneredevelopment agency and one police authority all located within the metropolitan Bay Area.
BCJPIA provides General Liability, Auto Liability, and Errors & Omissions coverage for itsmembers in excess of the member’s retained limit, or Self-Insured Retention (SIR), up to$1 .000,000 per occurrence.
Each Member retains the portion of every loss that falls within their SIR, ranging from $5,000 to$500,000. The City’s SIR is $350,000. BCJPIA is also a member of the California Affiliated RiskManagement Authorities (CARMA). a risk-sharing joint powers authority. When losses exceed the51.000,000 per occurrence limit. CARMA provides coverage up to 525.000.000. BCJPIA isgoverned by a Board of Directors, which is comprised of appointed officials from the memberentities.
Condensed unaudited accrual basis financial information of BCJPIA as of and for the year endedJune 30, 2010 is as follows (amounts expressed in thousands):
105
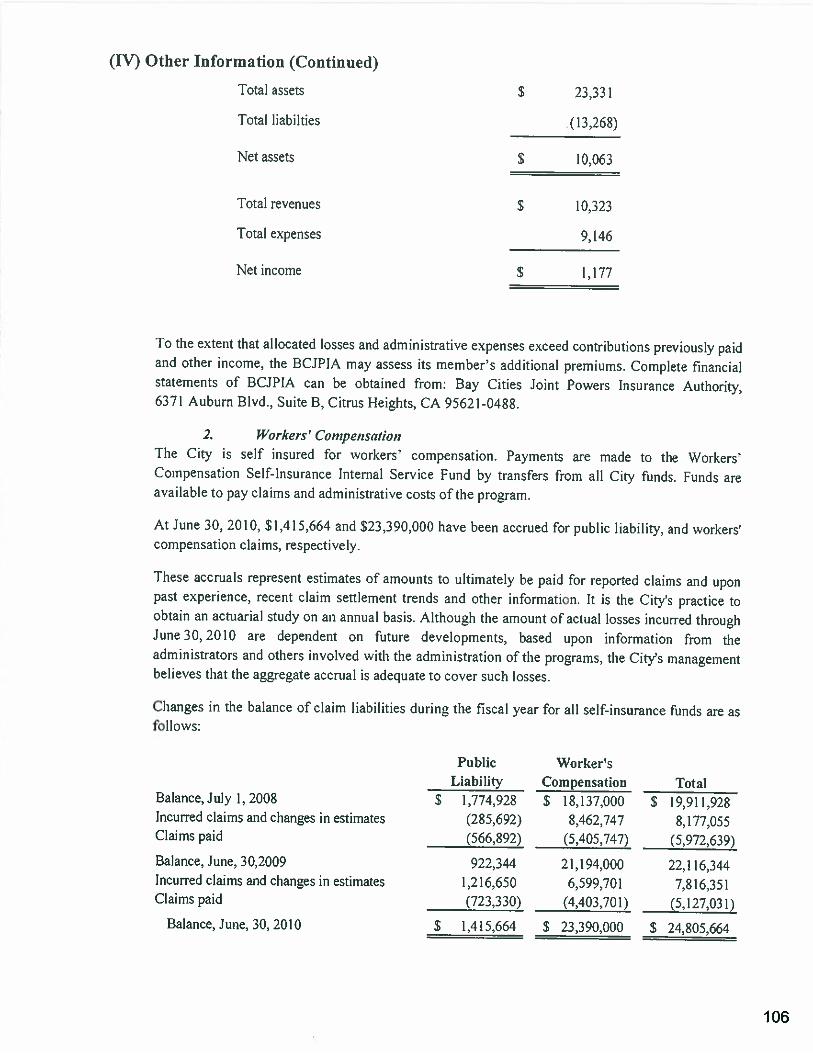
(IV) Other Information (Continued)
Total assets
Total liabilties
Net assets
Total revenues
Total expenses
Net income
$ 23.331
(13,268)
S 10.063
S 10,323
9,146
5 1,177
To the extent that allocated losses and administrative expenses exceed contributions previously paidand other income, the BCJPIA may assess its member’s additional premiums. Complete financialstatements of BCJPIA can be obtained from: Bay Cities Joint Powers Insurance Authority,6371 Auburn Blvd.. Suite B, Citrus Heights. CA 95621-0488.
2. Workerc’ Compensation
The City is self insured for workers’ compensation. Payments are madeCompensation Self-Insurance Internal Service Fund by transfers from all Cityavailable to pay claims and administrative costs of the program.
to the Workers’funds. Funds are
At June 30, 2010. $l,4l5664 and S23.390.000 have been accrued for public liability, and workerscompensation claims, respectively.
These accruals represent estimates of amounts to ultimately be paid for reported claims and uponpast experience, recent claim settlement trends and other information. It is the City’s practice toobtain an actuarial study on an annual basis. Although the amount of actual losses incurred throughJune 30, 2010 are dependent on future developments, based upon information from theadministrators and others involved with the administration of the programs, the City’s managementbelieves that the aggregate accrual is adequate to cover such losses.
Changes in the balance of claim liabilities during the fiscal yearfollows:
for all self-insurance funds are as
Balance, July 1,2008Incurred claims and changes in estimatesClaims paid
Balance, June, 30,2009Incurred claims and changes in estimatesClaims paid
Balance, June. 30, 2010
Public WorkersLiability Compensation Total
S 1,774,928 S 18,137,000 S 19,911,928(285,692) 8,462.747 8,177,055(566,892) (5,405,747) (5,972,639)
922,344 21,194,000 22,116,3441,216,650 6,599,701 7,816,351(723.330) (4.403.701) (5,127,03 i)
S 1.415,664 S 23,390.000 $ 24,805,664
106
(IV) Other Information (Continued)There were no significant reductions in insurance coverage from the prior year in public liabilityand there were no settlements exceeding the limits of the Citys excess coverage for the past threeyears.
C’. Contingent Liabilities
Grants
Amounts received or receivable from grant agencies are subject to audit and adjustment by grantoragencies, principally the federal government. Any disallowed claims, including amounts alreadycollected, may constitute a liability of the applicable funds. The amount, if any. of expenditureswhich may be disallowed by the grantor cannot be determined at this time although Citymanagement expects such amounts, if any. to be immaterial.
Lawsuits and Claims
There are a number of lawsuits and claims pending against the City. Included in these are a numberof property damage, civil suits, and personal injury seeking damages in excess of the City’sinsurance limits. The aggregate amount of the uninsured liabilities of the City which may resultfrom all suits and claims will not, in the opinion of City management. materially affect the City’sfinances, or impair its ability to otherwise meet its obligations.
D. Defined Benefit Pension Plans
1. California Public Employees’ Retirement SystemPlan Description
The City contributes to three plans in California Public Employees’ Retirement System (CaIPERS).The first plan covers all of the City’s full-time and part-time benefited sworn uniformed fireemployees and all chiefs (Safety Fire Plan). The second covers all of the City’s full-time and part-time benefited sworn uniformed police employees and all chiefs (Safety Police Plan). The thirdplan covers all remaining eligible City employees (Miscellaneous Plan). These plans are agentmultiple-employer defined benefit pension plans administered by CaIPERS, which acts as acommon investment and administrative agent for participating public employers within the State ofCalifornia. State statutes within the Public Employees’ Retirement Law establish a memo of benefitprovisions as well as other requirements. The City may select optional benefits provisions from thebenefit menu by contract with CaIPERS and adopted through City ordinance. Optional benefits thatthe City has contracted for the Miscellaneous Plan include, but are not limited to, the 2.7% at age55 retirement benefit formula, single highest year final compensation credit for unused sick leave,and post retirement survivor allowance. The benefits include (among others) service retirement.non-industrial disability retirement, industrial disability retirement, post-retirement death benefit,and pre-retirement death benefits. CaIPERS issues a separate comprehensive annual financialreport, which may be obtained from the CaIPERS Executive Office - 400 P Street, Sacramento, CA95814.
.All full-time and part-time benefited sworn uniformed fire employees and all chiefs are eligible toparticipate in CaIPERS Safety Fire Plan and all full-time and part-time benefited sworn uniformedpolice employees and all chiefs are eligible to participate in CaIPERS-Safety Police Plan. All otherfull-time, regular “at will” and part-time employees in the career service are required to be enrolledin the CaIPERS Miscellaneous Plan. CaIPERS pension benefits vest after five years of service. The
107
(IV) Other Information (Continued)Safety Plans pension benefits are based on the employees’ years of service, age and finalcompensation and the Miscellaneous Plan pension benefits are based on the employee’s years ofCaIPERS benefited service, age at retirement, and single highest year of compensation. Thesebenefit provisions and all other requirements are established by State statute and City ordinance.
Part-time and hourly employees working less than half time are excluded from CaIPERSparticipation regardless of the number of hours worked through an hourly exclusion contractamendment. These employees are enrolled in the Public Agency Retirement System, (PARS),which is established under Internal Revenue Code Section 401(a) as a tax qualified multipleemployer trust.
Funding Policy
Miscellaneous Plan members are required by statute to contribute 8% of their annual coveredsalary. The Employer Paid Member Contribution (EPMC) is the method the City uses for reportingthe employee contribution for Miscellaneous Plan employees. CaIPERS’ recognizes the EPMCmethod of making the employee contribution in Public Employment Retirement Law (PERL)Section 20691 The 8% employee contribution is not included in base pay but is instead madethrough a separate payroll transaction to CaIPERS as “special compensation” and is not subject tofederal or state taxes until the money is distributed at time of retirement or when otherwisewithdrawn from CaIPERS. CaIPERS’ recognizes the EPMC as special compensation” in theCalifornia Code of Regulations (Chapter 2 of Division I of Title 2, Subchapter I, Article 5) Section571(a)(1). Safety Fire Plan and Safety Police Plan members are required to contribute 9% of theirannual covered salary.
The City is required to contribute the actuarially detemined remaining amounts necessary to ftndthe benefits for its members. The actuarial methods and assumptions used are those adopted by theCaIPERS Board of Administration. The requ red employer contribution rate for the year endedJune 30, 20010 was 16.004%, 23.497%, and 35.738% for Miscellaneous Plan, Safety Fire Plan andSafety Policy Plan employees annual covered payroll, respectively. The contribution requirementsof the plan members are established by State statute, and the employer contribution rates areestablished and may be amended by CaIPERS.
108
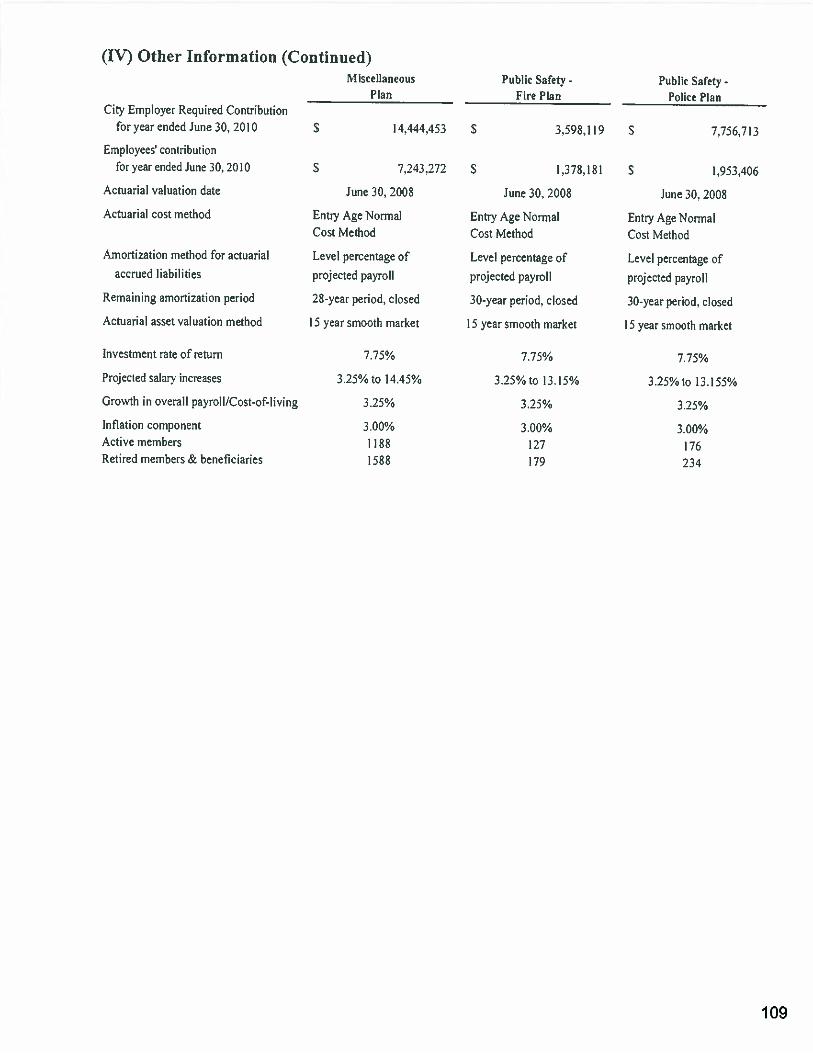
(IV) Other Information (Continued)Miscellaneous Public Safety - Public Safety -
Plan Fire Plan Police PlanCity Employer Required Contribution
for year ended June 30. 2010 S 14.444.453 S 3,598,119 S 7,756,713
Employees’ contributionforvearer.dd June3O.2010 S 7.243.272 S 1.378.18: S 1.953,406
Actuarial valuation date June 30, 2008 June 30. 2008 June 30, 2008
Actuarial cost method Entry Age Normal Entry Age Normal Entry Age Nona!Cost Method Cost Method Cost Method
Amortization method for actuarial Level percentage of Level percentage of Level percentage ofaccrued liabilities projected payroll projected payroll projected payroll
Remaining amortization period 28-year period, closed 30-year period, closed 30-year period, closed
Actuarial asset valuation ne:hod 15 year smooth market 15 year smooth market 15 year smooth market
Investment rate of return 7.75% 775% 7.75%
Projected salary increases 3.25% to 14.45% 3.25% to 13.15% 3.25% to 13.155%
Gro1h in overali payroll/Cost-of-living 3.25% 3.25% 3.25%
Inflation component 3.00% 3.00% 3.00%Active lileTtibers 1188 127 176Retired members & beneficiaries 1588 179 234
109
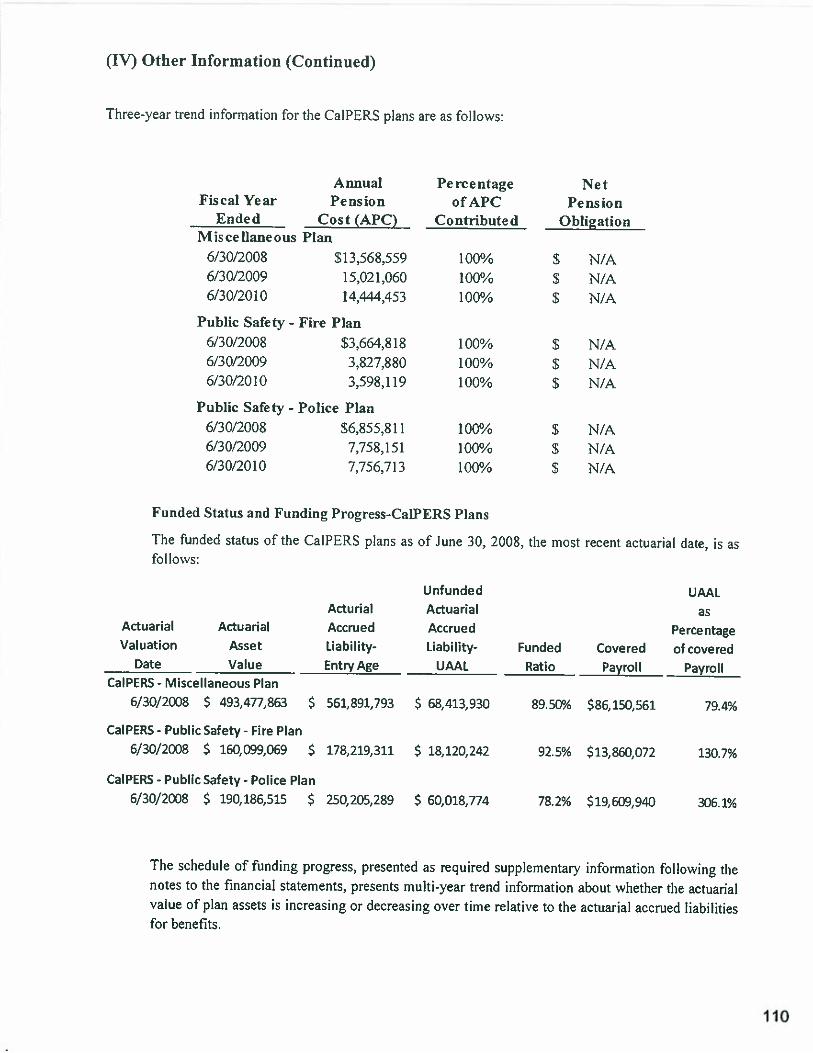
(IV) Other Information (Continued)
Three-year trend information for the CaIPERS plans are as follows:
Annual Percentage NetFiscal Year Pension ofAPC Pension
Ended Cost (APC) Contributed ObligationMiscellaneous Plan
6/30/2008 $13,568,559 100% $ N/A6/30/2009 15.02L060 100% S N/A6/30/20 10 14.444.453 100% S N/A
Public Safety - Fire Plan6/30/2008 $3,664,818 100% $ N/A6/30/2009 3,827,880 100% $ N/A6/30/2010 3,598,119 100% $ N/A
Public Safety - Police Plan6/30/2008 56,855,811 100% $ N/A6/30/2009 7,758,151 100% S N/A6/30/2010 7,756,713 100% $ N/A
Funded Status and Funding Progress-CaIPERS Plans
The funded status of the CaIPERS plans as of June 30, 2008, the most recent actuarial date, is asfollows:
Unfunded UAALActurial Actuarial as
Actuarial Actuarial Accrued Accrued PercentageValuation Asset Liability- Liability- Funded Covered of covered
Date Value Entry Age UAAL Ratio Payroll PayrollCaIPERS - Miscellaneous Plan
6/30/2008 $ 493,477,863 $ 561,891,793 $ 68,413,930 89.50% $86,150,561 79.4%
CaIPERS- Public Safety- Fire Plan6/30/2008 $ 160,099,069 $ 178,219,311 $ 18,120,242 92.5% $13,860,072 130.7%
CaIPERS - Public Safety - Police Plan6/30/2008 $ 190,186,515 $ 250,205,289 S 60,018,774 78.2% $19,609,940 306.1%
The schedule of funding progress, presented as required supplementary information following thenotes to the financial statements, presents multi-year trend information about whether the actuarialvalue of plan assets is increasing or decreasing over time relative to the actuarial accrued liabilitiesfor benefits.
110
(IV) Other Information (Continued)Berkeley Police Retirement Income Benejit Plan
Plan Description
The City sponsors a Retiree Income Benefit Plan for its Police retirees. This plan is a singleemployer plan which provides defined income benefits (i.e., Pension plan) for Police employeeswho retired from the City on or after July 1, 1989, who were also vested in a CaIPERS pension,who had ten years of service with the Berkeley Police Department and retire from the City on orafter age 50. Benefits commence 10 years after retirement for retirements before July 6, 1997, fiveyears after retirement for retirements before July 1, 2007, and two years after retirement forretirements after July 1, 2007. In addition, retirees receiving a disability or industrial disabilityretirement benefit from CaIPERS are eligible.
The plan is administered by The Lipman Company (TLC). The establishment and amendments ofbenefit provisions are negotiated between the employee bargaining units and the City, and areapproved by the City Council. The plan does not issue a publicly available financial report thatincludes financial statements and required supplementary information. At July 1, 2008, the date ofthe most recent actuarial valuation, there were 184 active members, 85 retired employees receivingcurrent benefits and 39 retired employees in deferred pay status. The City pays a monthly inconiebenefit equal to the City’s active employee two party Kaiser rate (5938.96 for calendar year FY2010) regardless of marital status. The income benefit is prorated by service based on the following‘ears of service of the retiree, effective July 1, 2007 (prior to July I, 2007, the vesting percentagewas 75% for 20-24 years of service):
Years of Service City PercentageLess than 10 0%
lOtol4 25%15to19 50%
20 or more 1 00%
Benefits are paid from a Section 401(a) trust and arc therefore taxable to the retiree when paid.Benefits are payable for the retiiees lifetime, and continue to the retiree’s surviving spouse for hisor her lifetime.
Summary of significant accounting policies — basis of accounting and valuation of investments
The financial statements of the Berkeley Police Retirement Income Benefit Plan are prepared usingthe accrual basis of accounting. The City’s contributions are recognized in the period in which thecontributions are due. There are no plan member contributions. Benefits and refunds arerecognized when due and payable in accordance with the terms of the plan. All plan investmentsare reported at fair value. The fair value of the investments are based on the market value on thedate of the actuarial report.
Funding Policy
The City’s current targeted funding policy is equal to the service cost for active employees plus anamount to amortize unfunded liabilities over an open 30-year period (rolling 30 year amortization)as a level percentage of payroll. Plan members are not required to contribute to the Plan. Theestimated required employer contribution rate for the year ended June 30, 2010 was 3.26% ofcovered payroll for Police employees. For FY 2010, the City contributed 51,181,503, which was$1,574,703 less than the ARC of 52,756,206 for this plan. The unpaid contribution as of June 30,
111
(IV) Other Information (Continued)2010 of 57.336.257 to fund this pension obligation is recorded as a liability. Any changes to thecontribution requirements of the plan are negotiated by the bargaining units and City LaborNegotiating team, and approved by the City Manager and City Council.
The following shows the calculation of the Annual Required Contributions for FY 2010:
Amount
Nonna Cost at Year End $ 958,905Amortization of UAAL 1.797,301
Annual Required Contribution (ARC) $ 2.756.206
The actuarial cost method used for determining the benefit obligations is the Projected Unit BenefitCost Method. Under this method, the actuarial present value of projected benefits is the value ofbenefits expected to be paid for current actives and retirees and is calculated based on certainassumptions and census data. The Actuarial Accrued Liability (AAL) is the actuarial present valueof benefits attributed to employee service rendered prior to the valuation date. The AAL equals thepresent value of benefits mu]tiplied by a fraction equal to service to date divided by sen-iceexpected at retirement. The Normal cost is the actuarial present value of benefits attributed to oneyear of service. This equals the present value of benefits divided by service at expected retirement.Since retirees are not accruing any more service, their normal cost is zero. In determining theAnnual Required Contribution, the unfunded AAL is amortized as a level percentage of payrollsover 30 years. The actuarial assumptions included (a) 6.5% investment rate of return (net ofadministrative expenses): (b) inflation increases are tied to the City’s 2-party Kaiser premium andare assumed to be 8% for FY 2010, with increases grading down by .5% per year to 5% for FY2016 and thereafter; (c) 3% annual payroll increase: (d) 60% of retirees are assumed to retire with acovered spouse; and (e) female spouses are assumed to be three years younger than male spouses.
Three-year trend information for the Berkeley Police Retirement Income benefit plan is as follows:
Annual Percentage NetFiscal Year Pension Contribution ofAPC Pension
Ended Cost (APC) Made Contributed Obligation
6/30/2008 $2,315,698 $586,286 25% 53.383,7986/30/2009 2,925,396 822,000 28% 5,487,1946/30/2010 3,030,566 1,181,503 39% 7,336,257
112
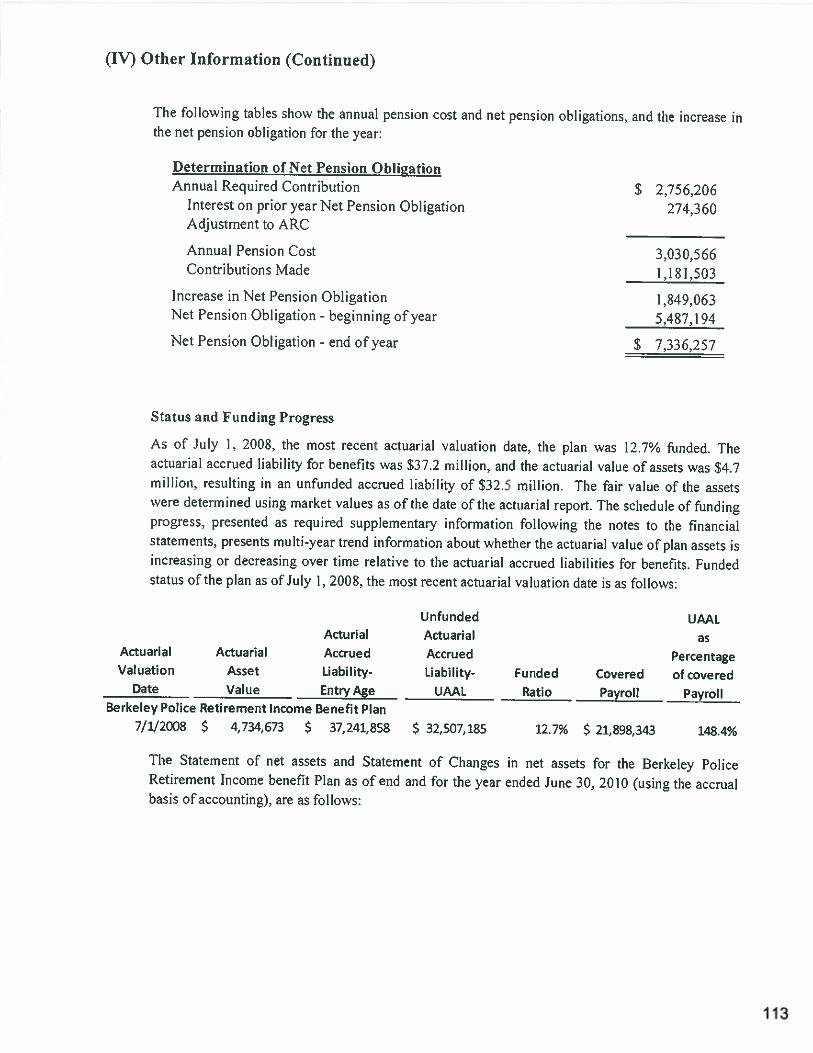
(IV) Other Information (Continued)
The following tables show the annual pension cost and net pension obligations, and the increase inthe net pension obligation for the year:
Determination of Net Pension ObligationAnnual Required Contribution $ 2,756,206
Interest on prior year Net Pension Obligation 274,360Adjustment to ARC
______________
Annual Pension Cost 3,030,566Contributions Made 1181.503
Increase in Net Pension Obligation 1,849,063Net Pension Obligation - beginning of year 5,487.194
Net Pension Obligation - end of year $ 7,336,257
Status and Funding Progress
As of July 1, 2008, the most recent actuarial valuation date, the plan was 12.7% funded. Theactuarial accrued liability for benefits was $37.2 million, and the actuarial value of assets was $4.7million, resulting in an unfunded accrued liability of $32.5 million. The fair value of the assetswere determined using market values as of the date of the actuarial report. The schedule of fundingprogress, presented as required supplementary information following the notes to the financialstatements, presents multi-year trend information about whether the actuarial value of plan assets isincreasing or decreasing over time relative to the actuarial accrued liabilities for benefits. Fundedstatus of the plan as of July 1,2008, the most recent actuarial valuation date is as follows:
Unfunded UAALActurial Actuarial as
Actuarial Actuarial Accrued Accrued PercentageValuation Asset Liability- Uability- Funded Covered of covered
Date Value Entry Age UAAL Ratio Payroll PayrollBerkeley Police Retirement Income Benefit Plan
7/1/2008 $ 4,734,673 $ 37,241,858 $ 32,507,185 12.7% $ 21,898,343 148.4%
The Statement of net assets and Statement of Changes iii net assets for the Berkeley PoliceRetirement Income benefit Plan as of end and for the year ended June 30, 2010 (using the accrua’basis of accounting), are as follows:
113
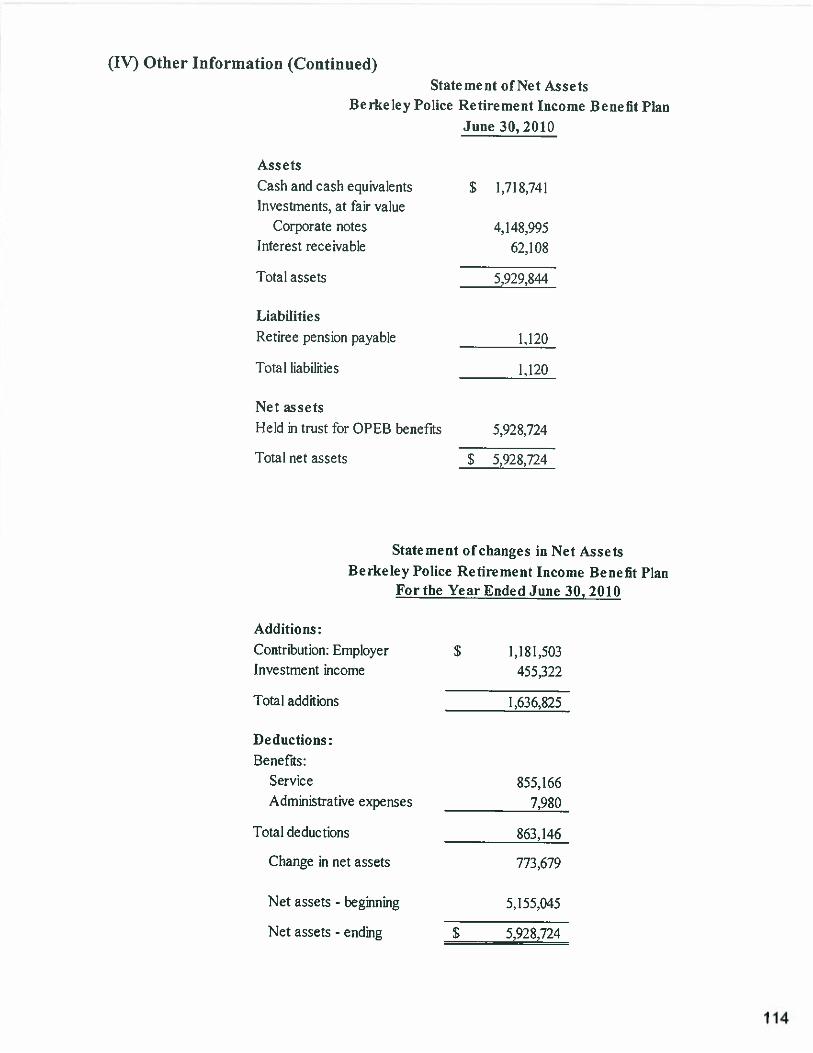
(IV) Other Information (Continued)Statement of Net Assets
Berkeley Police Retirement Income Benefit Plan
AssetsCash and cash equivalentsInvestments, at fair value
Corporate notesInterest receivable
Total assets
LiabilitiesRetiree pension payable
Total liabilities
Net assetsHeld in trust for OPEB benefits
Total net assets
June 30, 2010
S 1,718,741
4,148,99562,108
5,929.844
1.120
1,120
5.928,724
S 5,928,724
Additions:
Statement of changes in Net AssetsBerkeley Police Retirement Income Benefit Plan
For the Year Ended June 30, 2010
Contribution: EmployerInvestment income
S 1.181.503455,322
Total additions
Deductions:Benefits:
ServiceAdministrative expenses
Total deductions
Change in net assets
Net assets - beginning
Net assets - ending
1.636.825
855.1667.980
863.146
773.679
5,155.045
S 5.928.724
114

(IV) Other Information (Continued)
2. Safety Members Pension Fund
Plan Description
The City maintains the Safety Members Pension Fund (SMPF). This plan is a single-employerdefined benefit pension plan for fire and police officers that retired before March 973. InMarch 1973, all active fire and police officers were transferred from SMPF to CaIPERS. The SafetyMembers Pension Board administers the plan. The authority under which benefit provisions areestablished or may be amended is the Berkeley Municipal Code chapters 4.20, 4.24, 4.28 and 4.32.At July 1, 2010, the date of the most recent actuarial valuation, there were 28 retired members andsurviving spouses.
Service and disability retirement benefits are based on a percentage of salary at retirement,multiplied by years of service. Benefits are adjusted annually by either;
(a) Current active salary increases (based on the same rank at retirement) or
(b) The increase in the California Consumer Price Index (with a l% minimum and a 3%cap). SMPF also provides surviving spouse benefits.
Summary of significant accounting policies — basis of accounting and valuation of investments
The financial statements of the Safety Members Pension Fund are prepared using the accrual basisof accounting. The City’s contributions are recognized in the period in which the contributions aredue. There are no plan member contributions. Benefits and refunds are recognized when due andpayable in accordance with the terms of the plan. All plan investments are reported at fair value.The fair value of the investments is based on the market value on the date of the actuarial report.
Funding Policy
The City pays SMPF benefits on a pay-as-you-go basis. In February 1989, the Berkeley CivicImprovement Corporation (BCIC) purchased, on behalf of the City, a Guaranteed Income Contract(GIC) from Massachusetts Mutual. This contract provides annual payments through 2018 and anannual guaranteed 9.68% rate of return (net of expenses). The City pays the difference betweenactual benefit payments and contract provided annual payments, from the General Fund. Additionalamounts may be paid, in 2008 through 2017, under a Risk Agreement to compensate the City forthe difference between the amounts paid by the City to its pensioners and the actuarially determinedamounts.
The City is required to determine the plan’s annual pension cost (APC) based on the most recentactuarial valuation. The APC equals the plan’s annual required contribution (ARC), adjusted forhistorical differences between the ARC and amounts contributed. The actuary has determined theCity’s annual required contribution and amounts contributed. The actuary has determined the City’sARC is the greater of (a) a 20-year amortization of the unfunded actuarial liability, or (b) actualbenefit payments made for the year. For the year ended June 30, 2010, the City’s ARC wasSI ,666,559 and was equal to the benefit payments during the year. The City contributed this
115

(IV) Other Information (Continued)amount for the year through a $665,168 payment from the GIC plus $1,001,391 paid from theGeneral Fund. The actuarial liability was determined using the unit credit actuarial cost method.
The actuarial assumptions included (a) 80% investment return. (b) 1992 CaIPERS ExperienceTable. (c) projected annual benefit increases of 5% a year for full fluctuating and 3% a year for CPICOLAs. Both (a) and (c) include a 3% annual inflation component. The following table provideshistorical information of the Annual Pension Cost:
Annual Percentage NetFiscal Year Pension of APC Pension
Ended Cost (APC) Contributed Obligation7/112008 Sl,783.940 100% N/A7/1/2009 1.756.185 100% N/A7/1/2010 1,666,559 100% N/A
Prior to 1997. the actuarial valuation did not calculate an Annual Pension Cost. Consequently.consistent with GASB 27, the Net Pension Obligation at transition (July 1, 1996) equaled zero. Theplan’s unfunded actuarial accrued liability is being amortized as a Level percentage of projectedpayrolls on a closed basis. The amortization period of the unfunded actuarial liability endsJune 30,2017. A copy of the stand-alone financial report may be obtained at 2180 Milvia Street.Berkeley, CA.
Contributions and benefits are recognized in the Statement of Changes in fiduciaiy net assets usingthe accrual basis of accounting. The fair value of the SMPE assets was determined by market valueas reflected in the provisions of the guaranteed investment contract with Massachusetts Mutual.
Funded Status and Funding Progress
The schedule of funding progress, presented as required supplementary information following thenotes to the financial statements, presents multi—year trend information about whether the actuarialvalue of plan assets is increasing or decreasing over time relative to the actuarial liabilities forbenefits. Funded status of the SMPF as of June 30, 2010, the most recent actuarial date, is asfollows:
Unfunded UAALActurial Actuarial as
Actuarial Actuarial Accrued Accrued PercentageValuation Asset Uability- Liability- Funded Covered of covered
Date Value Entry Age UAAL Ratio Payroll PayrollBerkeley Safety members Pension Fund
7/1/2010 $ 2,630,205 $ 6,895,254 $ 4,265,049 38.1% N/A N/A
116
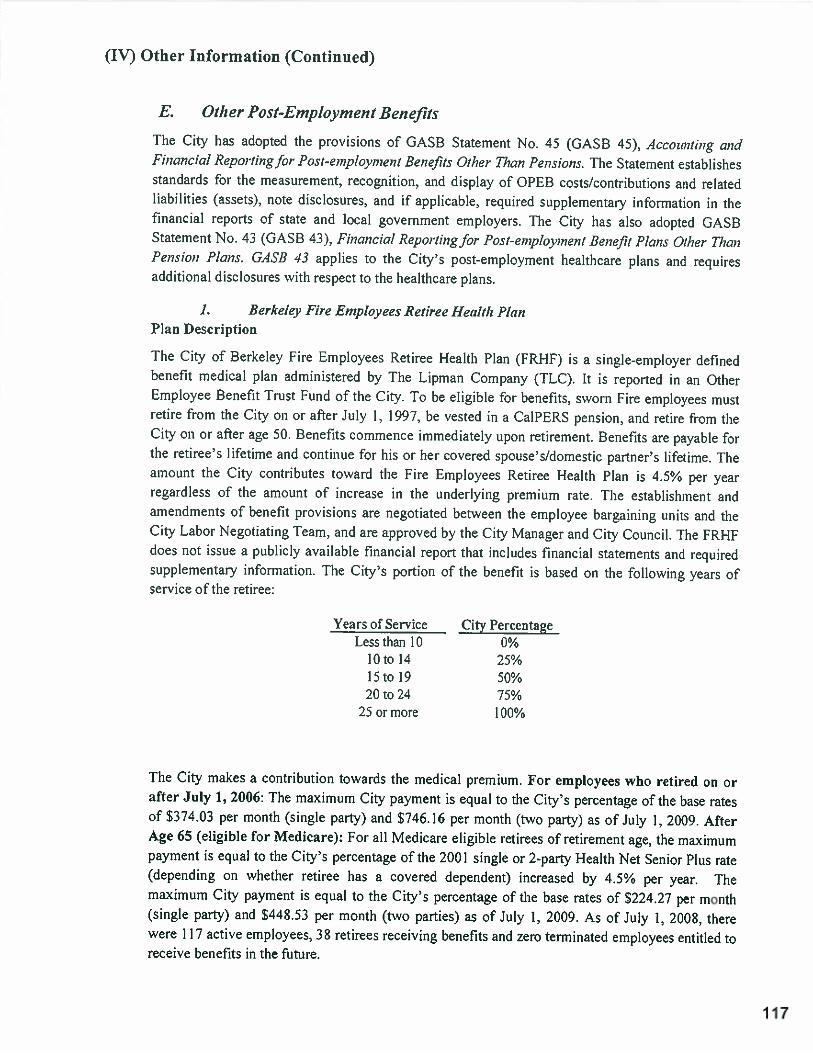
(IV) Other Information (Continued)
E. Other Post-Employment Benefits
The City has adopted the provisions of GASB Statement No. 45 (GASB 45), Accounting andFinancial Reporting for Post-employment Benefits Other Than Pensions. The Statement establishesstandards for the measurement, recognition, and display of OPER costs/contributions and relatedliabilities (assets), note disclosures, and if applicable, required supplementary information iii thefinancial reports of state and local government employers. The City has also adopted GASBStatement No. 43 (GASB 43), Financial Reporting for Post-employment Benefit Plans Oilier ThanPension Plans. GASB 43 applies to the City’s post-employment healthcare plans and requiresadditional disclosures with respect to the healthcare plans.
1. Berkeley Fire Employees Retiree Health PlaitPlan Description
The City of Berkeley Fire Employees Retiree Health Plan (FRHF) is a single-employer definedbenefit medical plan administered by The Lipman Company (TLC). It is reported in an OtherEmployee Benefit Trust Fund of the City. To be eligible for benefits, sworn Fire employees mustretire from the City on or after July 1. 1997, be vested in a CaIPERS pension, and retire from theCity on or after age 50. Benefits commence immediately upon retirement. Benefits are payable forthe retiree’s lifetime and continue for his or her covered spouse’s/domestic partner’s lifetime. Theamount the City contributes toward the Fire Employees Retiree Health Plan is 4.5% per yearregardless of the amount of increase in the underlying premium rate. The establishment andamendments of benefit provisions are negotiated between the employee bargaining units and theCity Labor Negotiating Team, and are approved by the City Manager and City Council. The FRHFdoes not issue a publicly available financial report that includes financial statements and requiredsupplementary information. The City’s portion of the benefit is based on the following years ofservice of the retiree:
Years of Sen’ice City PercentageLessthanl0 0%
lOto 14 25%15to19 50%20to24 75%
2sormore 100%
The City makes a contribution towards the medical premium. For employees who retired on orafter July 1,2006: The maximum City payment is equal to the City’s percentage of the base ratesof $374.03 per month (single party) and 8746.16 per month (two part’) as of July I, 2009. AfterAge 65 (eligible for Medicare): For all Medicare eligible retirees of retirement age, the maximumpayment is equal to the City’s percentage of the 2001 single or 2-party Health Net Senior Plus rate(depending on whether retiree has a covered dependent) increased by 4.5% per year. Themaximum City payment is equal to the City’s percentage of the base rates of 5224.27 per month(single party) and 8448.53 per month (two parties) as of July 1, 2009. As of July 1,2008, therewere 117 active employees, 38 retirees receiving benefits and zero terminated employees entitled toreceive benefits in the future.
117
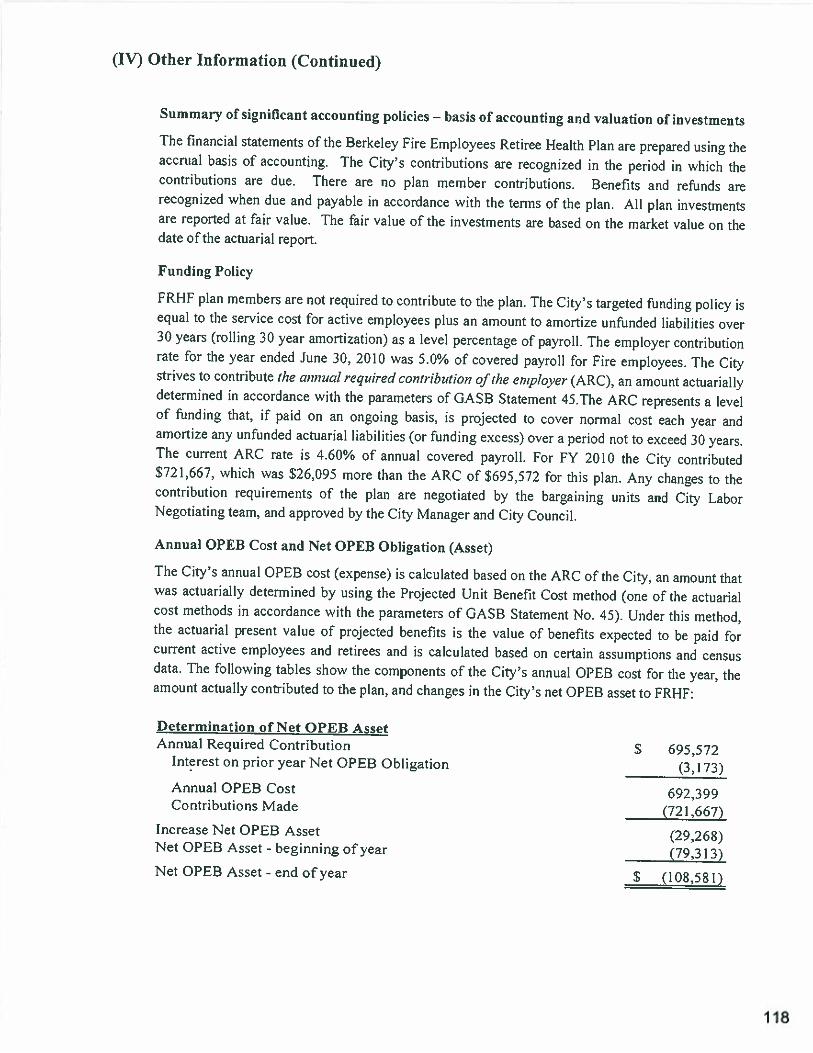
(IV) Other Information (Continued)
Summary of significant accounting policies — basis of accounting and valuation of investments
The financial statements of the Berkeley Fire Employees Retiree Healthaccrual basis of accounting. The City’s contributions are recognizedcontributions are due. There are no plan member contributions.recognized when due and payable in accordance with the tenns of theare reported at fair value. The fair value of the investments are baseddate of the actuarial report.
Funding Policy
Plan are prepared using thein the period in which theBenefits and refunds are
plan. All plan investmentson the market valne on the
FRHF plan members are not required to contribute to the plan. The City’s targeted funding policy isequal to the service cost for active employees plus an amount to amortize unfunded liabilities over30 years (rolling 30 year amortization) as a level percentage of payroll. The employer contributionrate for the year ended June 30, 2010 was 5.0% of covered payroll for Fire employees. The Citystrives to contribute the annual required contribution of the eniplover (ARC), an amount actuariallydetermined in accordance with the parameters of GASB Statement 45.The ARC represents a levelof funding that, if paid on an ongoing basis, is projected to cover normal cost each year andamortize any unfunded actuarial liabilities (or funding excess) over a period not to exceed 30 years.The current ARC rate is 4.60% of annual covered payroll. For FY 2010 the City contributed$721,667, which was $26,095 more than the ARC of $695,572 for this plan. Any changes to thecontribution requirements of the plan are negotiated by the bargaining units and City LaborNegotiating team, and approved by the City Manager and City Council.
Annual OPEB Cost and Net OPEB Obligation (Asset)
The City’s annual OPEB cost (expense) is calculated based on the ARC of the City, an amount thatwas actuarially determined by using the Projected Unit Benefit Cost method (one of the actuarialcost methods in accordance with the parameters of GASB Statement No. 45). Under this method,the actuarial present value of projected benefits is the value of benefits expected to be paid forcurrent active employees and retirees and is calculated based on certain assurnptior.s and censusdata. The following tables show the components of the City’s annual OPEB cost for the year, theamount actually contributed to the plan, and changes in the City’s net OPEB asset to FRHF:
Determination of Net OPEB AssetAnnual Required Contribution
Interest on prior year Net OPEB Obligation
Annual OPEB CostContributions Made
Increase Net OPEB AssetNet OPEB Asset - beginning of year
Net OPEB Asset - end of year
$ 695,572(3,173)
692,399(721.667)
(29,268)(79.3B)
S (108.58!)
118
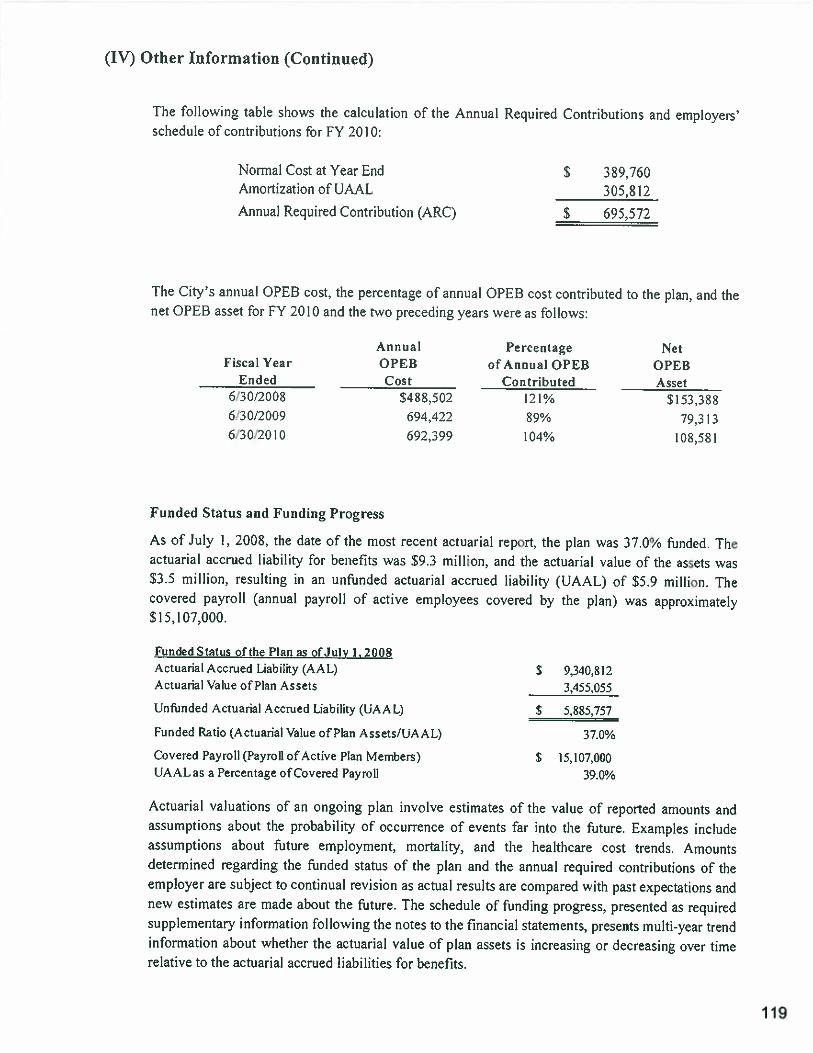
(IV) Other Information (Continued)
The following table shows the calculation of the Annual Required Contributions and employers’schedule of contributions for FY 2010:
Normal Cost at Year EndAmortization of UAAL
Annual Required Contribution (ARC)
$ 389.7603 05.8 12
S 695.572
The City’s annual OPEB cost, the percentage of annual OPEB cost contributed to the plan, and thenet OPEB asset for FY 2010 and the two preceding years were as follows:
Fiscal YearEnded
6/3 0/2 0086/3 0/20096/30/2010
AnnualOPEBCost
5488.502
694,422692,399
Percentageof Annual OPEB
Contributed121%
89%104%
NetOPEBAsset
$153,388
79,313
108,581
Funded Status and Funding Progress
As of July 1, 2008, the date of the most recent actuarial report, the plan was 37.0% funded. Theactuarial accrued liability for benefits was $9.3 million, and the actuarial value of the assets was$3.5 million, resulting in an unfunded actuarial accrued liability (UAAL) of $5.9 million. Thecovered payroll (annual payroll of active employees covered by the plan) was approximately$15,107,000.
Funded Status of the Plan as of July 1,2008Actuarial Accrued Liability (AAL)Actuarial Value of Plan Assets
Unfunded Actuarial Accrued Liability (UAAL)
Funded Ratio (Actuarial Value of Plan Assets/UAAL)
Covered Payroll (Payroll ofActive Plan Members)UAALas a Percentage ofCovered Payroll
$ 9,340,8123,455,055
$ 5,885.757
3 7.0%
$ 15.107,00039.0%
Actuarial valuations of an ongoing plan involve estimates of the value of reported amounts andassumptions about the probability of occurrence of events far into the future. Examples includeassumptions about future employment, mortality, and the healthcare cost trends. Amountsdetermined regarding the funded status of the plan and the annual required contributions of theemployer are subject to continual revision as actual results are compared with past expectations andnew estimates are made about the future. The schedule of funding progress, presented as requiredsupplementary information following the notes to the financial statements, presents multi-year trendinformation about whether the actuarial value of plan assets is increasing or decreasing over limerelative to the actuarial accrued liabilities for benefits.
119
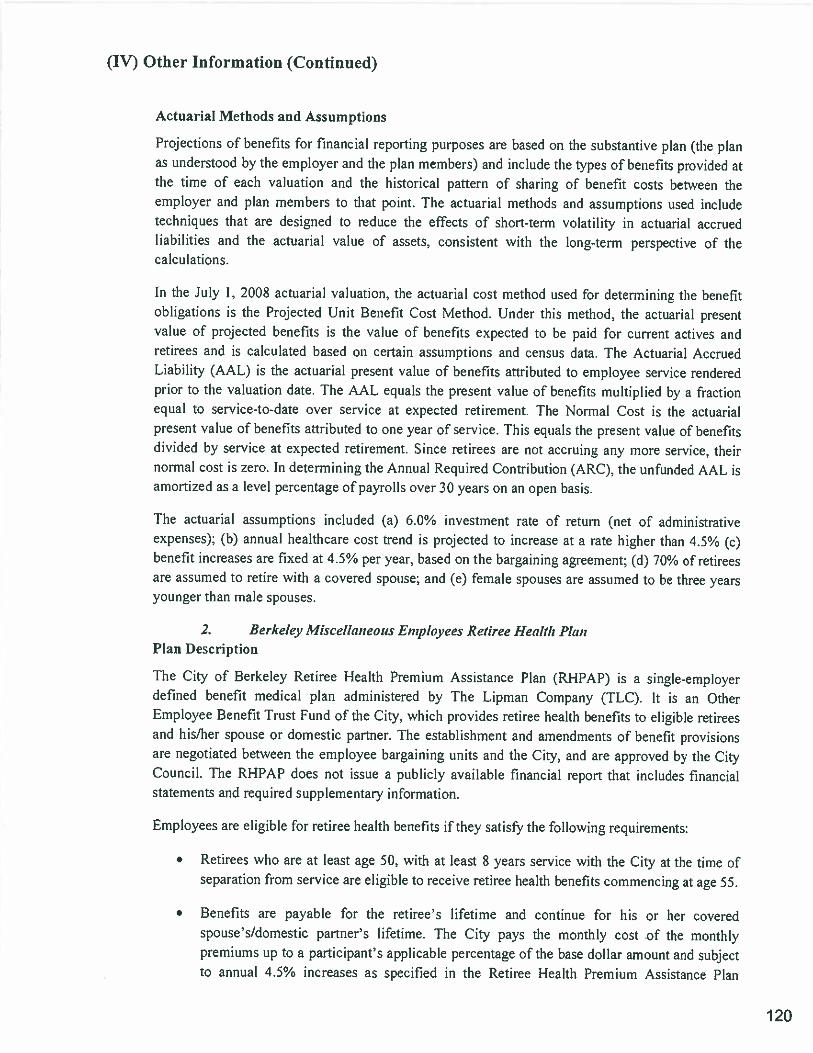
(IV) Other Information (Continued)
Actuarial Methods and Assumptions
Projections of benefits for financial reporting purposes are based on the substantive plan (the planas understood by the employer and the plan members) and include the types of benefits provided atthe time of each valuation and the historical pattern of sharing of benefit costs between theemployer and plan members to that point. The actuarial methods and assumptions used includetechniques that are designed to reduce the effects of short-tenn volatility in actuarial accruedliabilities and the actuarial value of assets. consistent with the long-term perspective of thecalculations.
In the July I, 2008 actuarial valuation, the actuarial cost method used for determining the benefitobligations is the Projected Unit Benefit Cost Method. Under this method. the actuarial presentvalue of projected benefits is the value of benefits expected to be paid for current actives andretirees and is calculated based on certain assumptions and census data. The Actuarial AccruedLiability (AAL) is the actuarial present value of benefits attributed to employee service renderedprior to the valuation date. The AAL equals the present value of benefits multiplied by a fractionequal to service-to-date over service at expected retirement. The Normal Cost is the actuarialpresent value of benefits attributed to one year of service. This equals the present value of benefitsdivided by service at expected retirement. Since retirees are not accruing any more service, theirnormal cost is zero. In determining the Annual Required Contribution (ARC). the unfunded AAL isamortized as a level percentage of payrolls over 30 years on an open basis.
The actuarial assumptions included (a) 6.0% investment rate of return (net of administrativeexpenses); (b) annual healthcare cost trend is projected to increase at a rate higher than 4.5% (c)benefit increases are fixed at 4.5% per year, based on the bargaining agreement; (d) 70% of retireesare assumed to retire with a covered spouse; and (e) female spouses are assumed to be three yearsyounger than male spouses.
2. Berkeley Miscellaneous Employees Retiree Heal/li PlanPlan Description
The City of Berkeley Retiree Health Premium Assistance Plan (RHPAP) is a single-employerdefined benefit medical plan administered by The Lipman Company (TLC). It is an OtherEmployee Benefit Trust Fund of the City, which provides retiree health benefits to eligible retireesand his/her spouse or domestic partner. The establishment and amendments of benefit pi-ovisionsare negotiated between the employee bargaining units and the City, and are approved by the CityCouncil. The RHPAP does not issue a publicly available financial report that includes financialstatements and required supplementary information.
Employees are eligible for retiree health benefits if they satisl5’ the following requirements:
• Retirees who are at least age 50, with at least 8 years service with the City at the time ofseparation from service are eligible to receive retiree health benefits commencing at age 55.
• Benefits are payable for the retiree’s lifetime and continue for his or her coveredspouse’sldomesiic partner’s lifetime. The City pays the monthly cost of the monthlypremiums up to a participant’s applicable percentage of the base dollar amount and subjectto annual 4.5% increases as specified in the Retiree Health Premium Assistance Plan
120
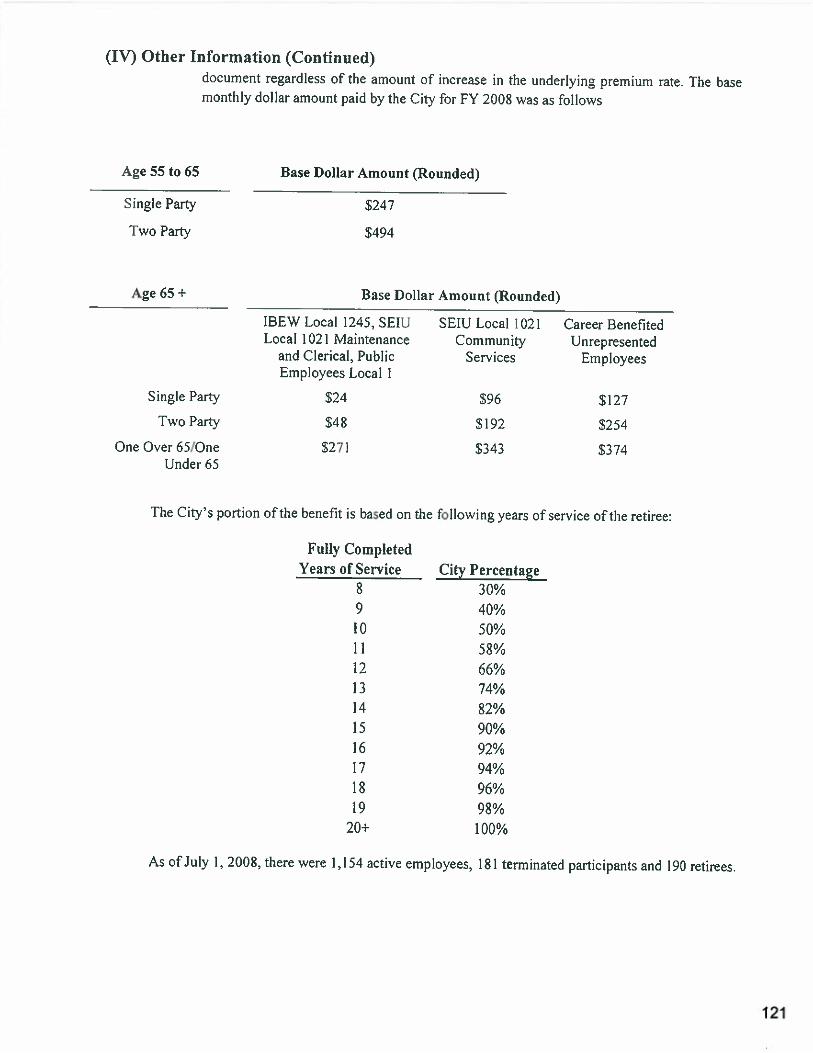
(IV) Other Information (Continued)document regardless of the amount of increase in the underlying premium rate. The basemonthly dollar amount paid by the City for FY 2008 was as follows
Age 55 to 65 Base Dollar Amount (Rounded)
Single Party $247
Two Party $494
Age 65 + Base Dollar Amount (Rounded)
IBEW Local 1245, SEIU SEW Local 1021 Career BenefitedLocal 1021 Maintenance Community Unrepresented
and Clerical. Public Services EmployeesEmployees Local 1
Single Party $24 $96 $127
Two Party $48 $192 $254
One Over 65/One $271 $343 $374Under 65
The City’s portion of the benefit is based on the following years of service of the retiree:
Fully CompletedYears of Service City Percentage
8 30%9 40%10 50%11 58%12 66%13 74%14 82%15 90%16 92%17 94%18 96%19 98%
20- 100%
As of July 1, 2008, there were 1,154 active employees, 181 terminated participants and 190 retirees.
121
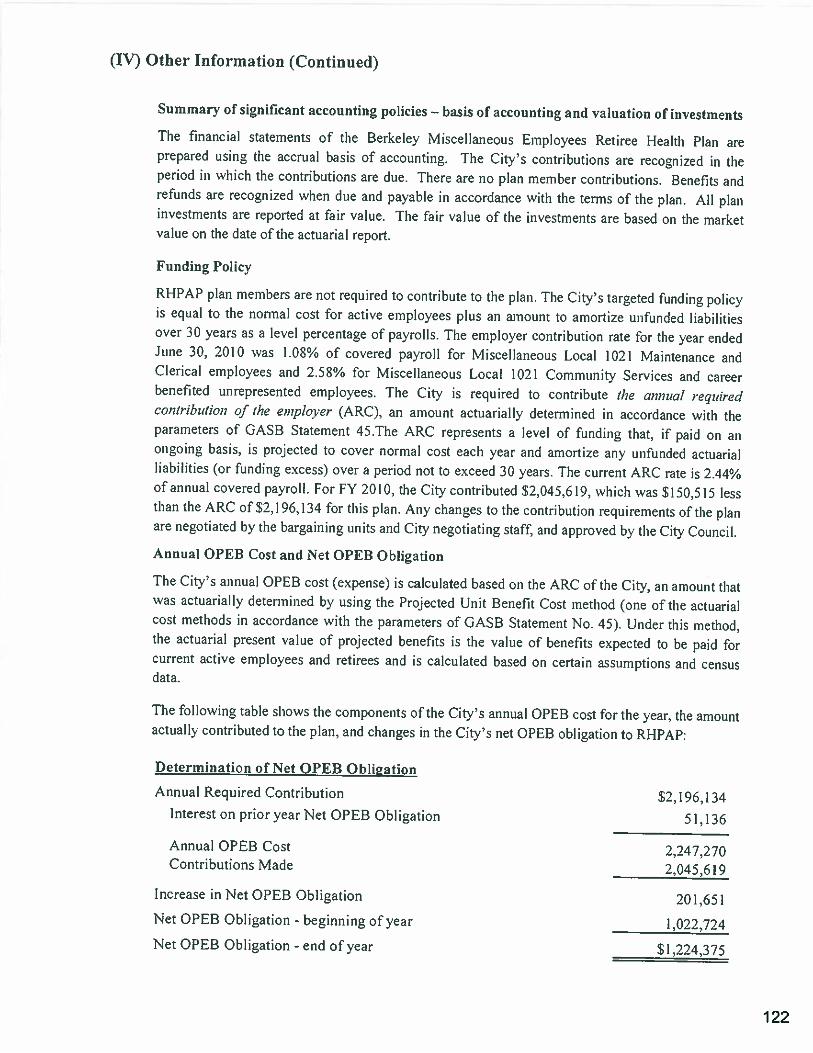
(IV) Other Information (Continued)
Summary of significant accounting policies — basis of accounting and valuation of investments
The financial statements of the Berkeley Miscellaneous Employees Retiree Health Plan areprepared using the accrual basis of accounting. The City’s contributions are recognized in theperiod in which the contributions are due. There are 110 plan member contributions. Benefits andrefunds are recognized when due and payable in accordance with the terms of the plan. All planinvestments are reported at fair value. The fair value of the investments are based on the marketvalue on the date of the actuarial report.
Funding Policy
RHPAP plan members are not required to contribute to the plan. The City’s targeted funding policyis equal to the normal cost for active employees plus an amount to amortize unfunded liabilitiesover 30 years as a level percentage of payrolls. The employer contribution rate for the year endedJune 30, 2010 was I.08% of covered payroll for Miscellaneous Local 1021 Maintenance andClerical employees and 2.58% for Miscellaneous Local 1021 Community Services and careerbenefited unrepresented employees. The City is required to contribute the annual requiredcontribution of the enipiover (ARC), an amount actuarially determined in accordance with theparameters of GASB Statement 45.The ARC represents a level of funding that, if paid on anongoing basis, is projected to cover normal cost each year and amortize any unfunded actuarialliabilities (or funding excess) ovet a period not to exceed 30 years. The current ARC rate is 2.44%of annual covered payroll. For FY 2010, the City contributed 52.045.619. which was S!50.5 15 lessthan the ARC of 52.196.134 for this plan. Any changes to the contribution requirements of the planare negotiated by the bargaining units and City negotiating staff, and approved by the City Council.
Annual OPEB Cost and Net OPEB Obligation
The City’s annual OPEB cost (expense) is calculated based on the ARC of the City, an amount thatwas actuarially detenined by using the Projected Unit Benefit Cost method (one of the actuarialcost methods in accordance with the parameters of GASB Statement No. 45). Under this method.the actuarial present value of projected benefits is the value of benefits expected to be paid forcurrent active employees and retirees and is calculated based on certain assumptions and censusdata.
The following table shows the components of the City’s annual OPEB cost for the year, the amountactually contributed to the plan, and changes in the City’s net OPEB obligation to RHPAP:
Determination of Net OPEB Obligation
Annual Required Contribution $2,196,134interest on prior year Net OPEB Obligation 51,136
Annual OPEB Cost 2,247,270Contributions Made 2,045.619
Increase in Net OPEB Obligation 201,651Net OPEB Obligation - beginning of year 1,022.724Net OPEB Obligation - end of year 51,224,375
122
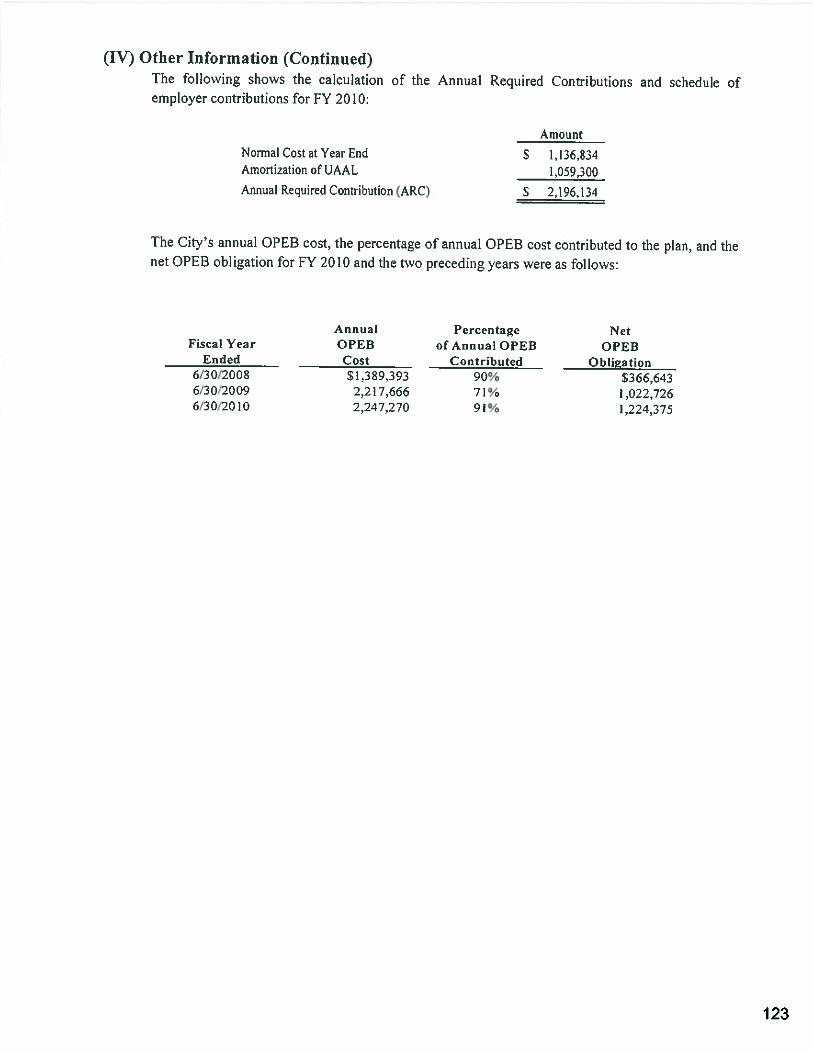
(IV) Other Information (Continued)The following shows the calculation of the Annual Required Contributions and schedule ofemployer contributions for FY 2010:
AmountNormal Cost at Year End S 1,136.334Amortization of LAAL 1059.300Annual Recuired Contribution (ARC) S 2,196.134
The City’s annual OPEB cost, the percentage of annual OPEB cost contributed to the plan, and thenet OPEB obligation for FY 2010 arid the two preceding years were as follows:
Annual Percentage NetFiscalYcar OPEB ofAnnualOPEB OPEB
Ended Cost Contributed Obligation6/30/2008 $1,389,393 90% 5366,6436/30/2009 2.217,666 71% 1,022,7266/30/2010 2,247,270 91% 1,224.375
123
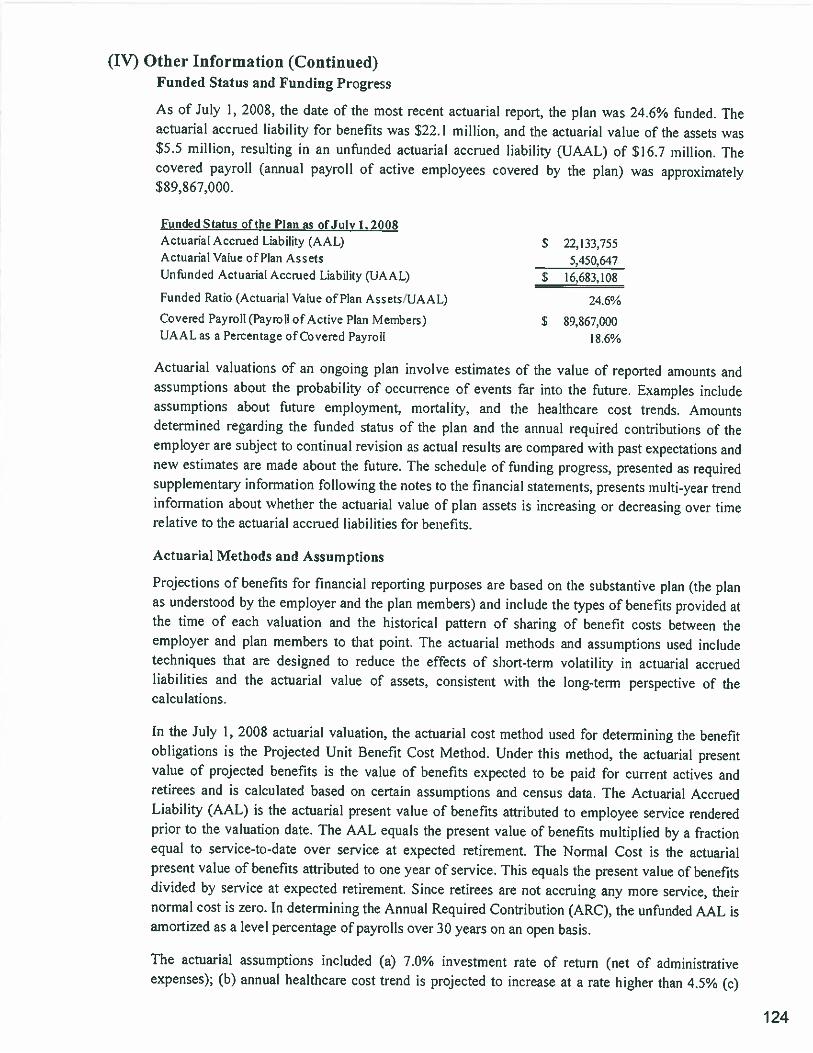
(IV) Other Information (Continued)Funded Status and Funding Progress
As of July 1, 2008, the date of the most recent actuarial report, the plan was 24.6% fUnded. Theactuarial accrued liability for benefits was $22.1 million, and the actuarial value of the assets was$5.5 million, resulting in an unfunded actuarial accrued liability (UAAL) of $16.7 million. Thecovered payroll (annual payroll of active employees covered by the plan) was approximately$89,867,000.
Funded Status of the Plan as ofJulv 1,2008Actuarial Accrued Liability (AAL) S 22,133.755Actuarial Value of Plan Assets 5.450,647L’nfijrtded Actuarial Accrued Liability (UAAL) S 16.683,108
Funded Ratio (Actuarial Value of Plan Assets/LIAAL) 24.6%Covered Payroll (Payroll of Active Plan Members) $ 89,867,000UAALas a Percentage ofCovered Payroll 186%
Actuarial valuations of an ongoing plan involve estimates of the value of reported amounts andassumptions about the probability of occurrence of events far into the future. Examples includeassumptions about future employment, mortality, and the healthcare cost trends. Amountsdetermined regarding the funded status of the plan and the annual required contributions of theemployer are subject to continual revision as actual results are compared with past expectations andnew estimates are made about the future. The schedule of funding progress, presented as requiredsupplementary information following the notes to the financial statements, presents multi-year trendinformation about whether the actuarial value of plan assets is increasing or decreasing over timerelative to the actuarial accrued liabilities for benefits.
Actuarial Methods and Assumptions
Projections of beneflts for financial reporting purposes are based on the substantive plan (the planas understood by the employer and the plan members) and include the types of benefits provided atthe time of each valuation and the historical pattern of sharing of benefit costs between theemployer and plan members to that point. The actuarial methods and assumptions used includetechniques that are designed to reduce the effects of short-term volatility in actuarial accruedliabilities and the actuarial value of assets, consistent with the long-term perspective of thecalculations.
In the July 1. 2008 actuarial valuation, the actuarial cost method used for determining the benefitobligations is the Projected Unit Benefit Cost Method. Under this method, the actuarial presentvalue of projected benefits is the value of benefits expected to be paid for current actives andretirees and is calculated based on certain assumptions and census data. The Actuarial AccruedLiability (AAL) is the actuarial present value of benefits attributed to employee service renderedprior to the valuation date. The AAL equals the present value of benefits multiplied by a fractionequal to service-to-date over service at expected retirement. The Normal Cost is the actuarialpresent value of benefits attributed to one year of service. This equals the present value of benefitsdivided by service at expected retirement. Since retirees are not accruing any more service, theirnormal cost is zero. In determining the Annual Required Contribution (ARC), the unfunded AAL isamortized as a level percentage of payrolls over 30 years on an open basis.
The actuarial assumptions included (a) 7.0% investment rate of return (net of administrativeexpenses); (b) annual healthcare cost trend is projected to increase at a rate higher than 4.5% Cc)
124
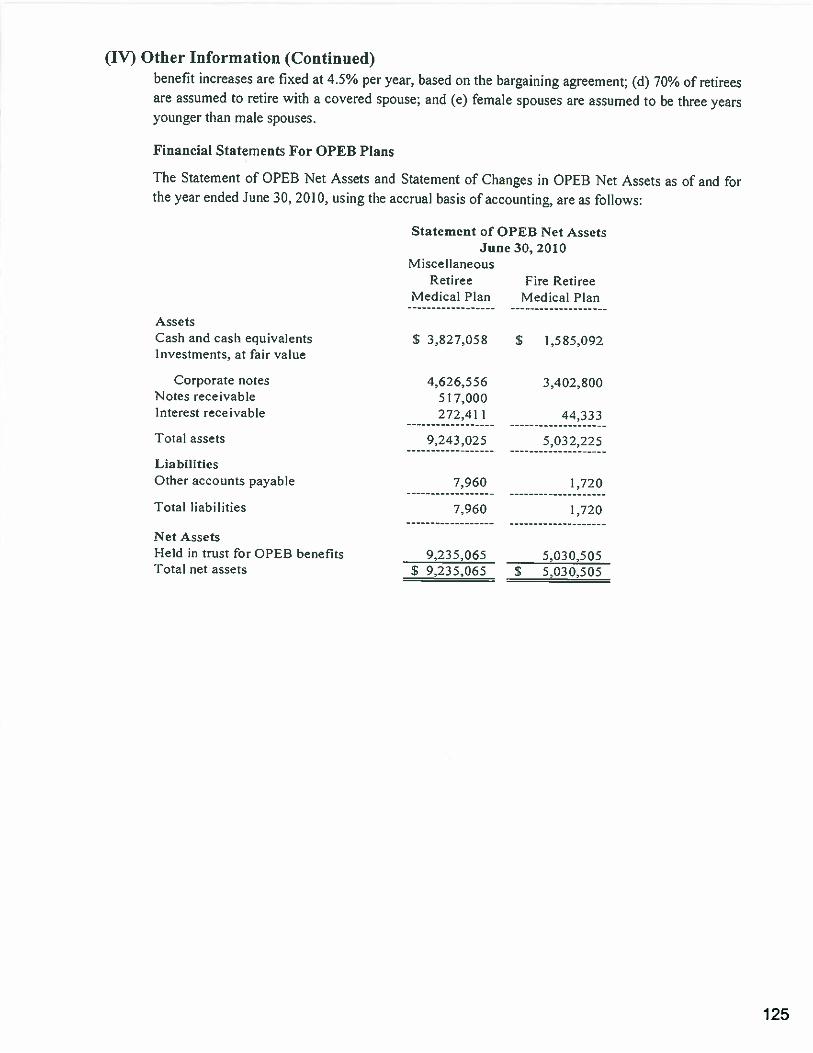
(IV) Other Information (Continued)benefit increases are fixed at 4,5% per year. based on the bargaining agreement; (d) 70% of retireesare assumed to retire with a covered spouse; and (e) female spouses are assumed to be three yearsyounger than male spouses.
Financial Statements For OPEB Plans
The Statement of OPEB Net Assets and Statement of Changes iii OPEB Net Assets as of and forthe year ended June 30. 2010, using the accrual basis of accounting. are as follows:
Statement of OPEB Net AssetsJune 30, 2010
MiscellaneousRetiree Fire Retiree
Medical Plan Medical Plan
AssetsCash and cash equivalents S 3,827,058 $ 1,585,092investments, at fair value
Corporate notes 4,626,556 3,402,800Notes receivable 517,000Interest receivable 272,411 44.333
Total assets 9243.025 5.032.225
LiabilitiesOther accounts payable 7,960 1.720
Total liabilities 7,960 1,720
Net AssetsField in trust for OPEB benefits 9.231065 5.030505rotal net assets S 9.235.065 S 5.030,505
125
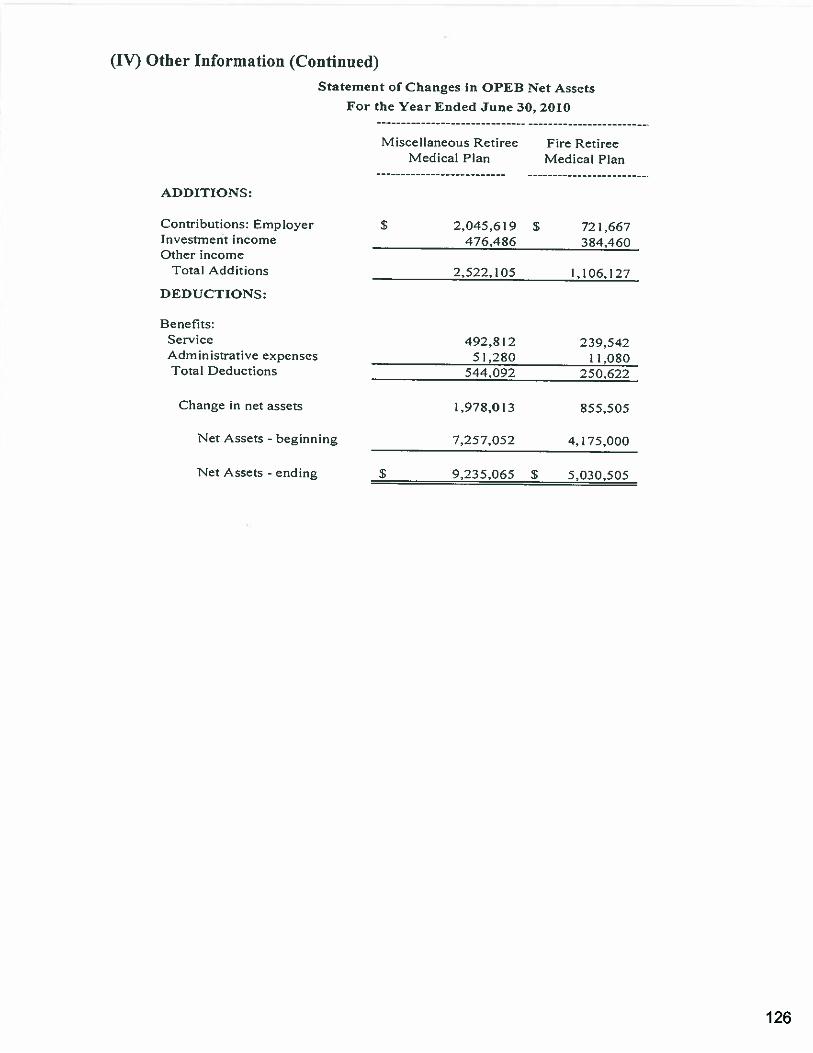
(IV) Other Information (Continued)
ADDITIONS:
Statement of Changes in OPEB Net Assets
For the Year Ended June 30, 2010
Contributions: EmployerInvestment incomeOther income
Total Additions
DEDUCTIONS:
Benefits:ServiceAdministrative expensesTotal Deductions
Change in net assets
S 2,045.619476,486
S 721,667384.460
Miscellaneous RetireeMedical Plan
Fire RetireeMedical Plan
1522,105 L106.127
492,812 239,54251,280 11,080
544.092 250,622
1,978,013 855,505
7,257,052 4,175,000
5 9,235.065 $ 5,030,505
Net Assets beginning
Net Assets - ending
126
(IV) Other Information (Continued)
F. Defined Contribution Plans
1. Supplemental Retirement and Income Plaits (‘SRIP)There are three separate Supplemental Retirement and Income Plans (SRIP) that were enacted byOrdinance at different times and are set forth in the Berkeley Municipal Code as follows:
Supplementary Retirement and Income Plan I — Berkeley Municipal Code Chapter 4.36.101 et seq.
Supplementary Retirement and Income Plan II — Berkeley Municipal Code Chapter 4.38.101 et seq.
Supplementary Retirement and Income Plan III — Berkeley Municipal Code Chapter 439.101 etseq.
SRIP I and SRIP 11 cover non-sworn employees. SRIP Ill covers SVOrIt Police personnel except forthe Police Chief who is included in SRIP II.
SRIP I
On January 1, 1983, Ordinance No. 5450-NS., which was codified in the Berkeley Municipal Codeunder Chapter 4.36.101 et seq., established SRIP I. The SRIP I plan consists of two components: I)a defined contribution money purchase pension plan adopted in accordance with Sections 40 1(a)and 50 1(a) of the Internal Revenue Code, and 2) an employer paid disabilit benefit.
Money Purchase Pension Plan: The administrators of the money purchase pension plan areHartford Life Insurance Company and Prudential Retirement Services. The plan is a definedcontribution plan whereby the City contributes 5.7% of salary up to a salary of $32,400 into a taxdeferred and self directed investment account and 1% of salary tip to a salary of $32,400 into adisability reserve account for each covered employee (all pennanent City employees). The totalassets of SRIP I available for benefits at June 30, 2010, was $8,280,793. which was comprised ofparticipant accounts, in the amount of $8,183,202. These assets are the property of the individualaccount holders and not the property of the City. These assets cannot be used to pay disabilitybenefits.
Disability Benefit: Employees hired after January 1, 1983 but prior to July 22, 1988, who becamedisabled in their own occupation are entitled to receive a disability income benefit equal to 60% oftheir highest compensation, reduced by any disability payments they receive from Social Security,State Disability Insurance, or Workers’ Compensation. Employees hired after July 21, 1988 are noteligible for benefits under this plan which was closed to new enrollees.
Benefits are payable for the disabled participant’s lifetime or until recovery from disability. Thethird party administrator is Cigna. Currently, the City pays the monthly cost of the monthlydisability benefits on a pay-as-you-go basis. There were a total of 180 closed groups of participants,56 active employees and 78 disabled participants receiving benefits. The unfunded liability forSRIP I at July 1,2008, the date of the last actuarial study, was $13,055,000. For FY 2010, the Citypaid total SRIP I disability payments ofSI,657,924.
With the inception of SRIP II. the City contracted with Standard Insurance Company of Oregon toprovide a portion of disability benefits through a Long Term Disability plan for those activeemployees remaining in SRIP I on or after July 22, 1988. Subsequently, the City prospectivelydropped the Long Tern) Disability plan provided by Standard Insurance Company of Oregon andpurchased a Long Term Disability plan from Hartford Life Insurance Company. Later, the City
127

(IV) Other Information (Continued)dropped the Long Term Disability plan provided by Hanford Life and purchased a Long TermDisability Plan from UNUM Provident. Ultimately, the City chose to delete the Long TermDisability plan and self fund the benefit. The disability benefits of all those in SRIP I disabled priorto July 22, 1988 as well as the self-insured portion of SRIP I disability benefits arising on or afterJuly 22. 1988 applicable to SRIP I coverage, are paid from City contributions.
sm ii
On July 22. 1988, Ordinance No. 5900-N.S., which was codified in the Berkeley Municipal Codeunder Chapter 4.38.101 et seq., established SRIP 11, a defined contribution money purchase pensionplan adopted in accordance with Sections 40 1(a) and 501(a) of the Internal Revenue Code. The planis a defined contribution money purchase pension plan. whereby the City contributes 6.7% of salaryup to a salary of S32,400 into a tax deferred and self directed investment account for each eligibleemployee. Enrollment in the plan is mandaton for all eligible persons hired on or after July 22,1988. and elective for those eligible and hired prior to July 22, 1988.
SR1P Ill
Effective January 1, 1989, the City established SRIP III, which was codified iii the BerkeleyMunicipal Code under Chapter 439.101 et seq., a defined contribution money purchase pensionplan adopted in accordance with Sections 401(a) and 501(a) ofthe Internal Revenue Code. The planis a defined contribution plan, whereby the City contributes 2% of salary up to a salan of 532.400into a tax deferred and self directed investment account for all sworn police officers except thePolice Chief.
The total assets of SRIP II and SR[P III available for benefits at June 30, 2010 were $48,649,739,and there were 2,089 participants.
The City Council is responsible for establishing or amending (through changes in the BerkeleyMunicipal Code) retirement provisions and contribution requirement for all SRJP plans. Theseinvestments are held by trustees for the benefit of the participants and are not included in the City’sbasic financial statements.
The City’s contributions (required and actual) and covered payroll for the year ended June 30, 2010were as follows:
City’s City’s Covered % of CoveredPlan Contributions Payroll Payroll
SRIP I $ 93,536 $ 1,640,973 5.7%SRIP II 2,518,275 37,560,826 6.7%SRIP III 124,202 5,738,788 2.0%
128
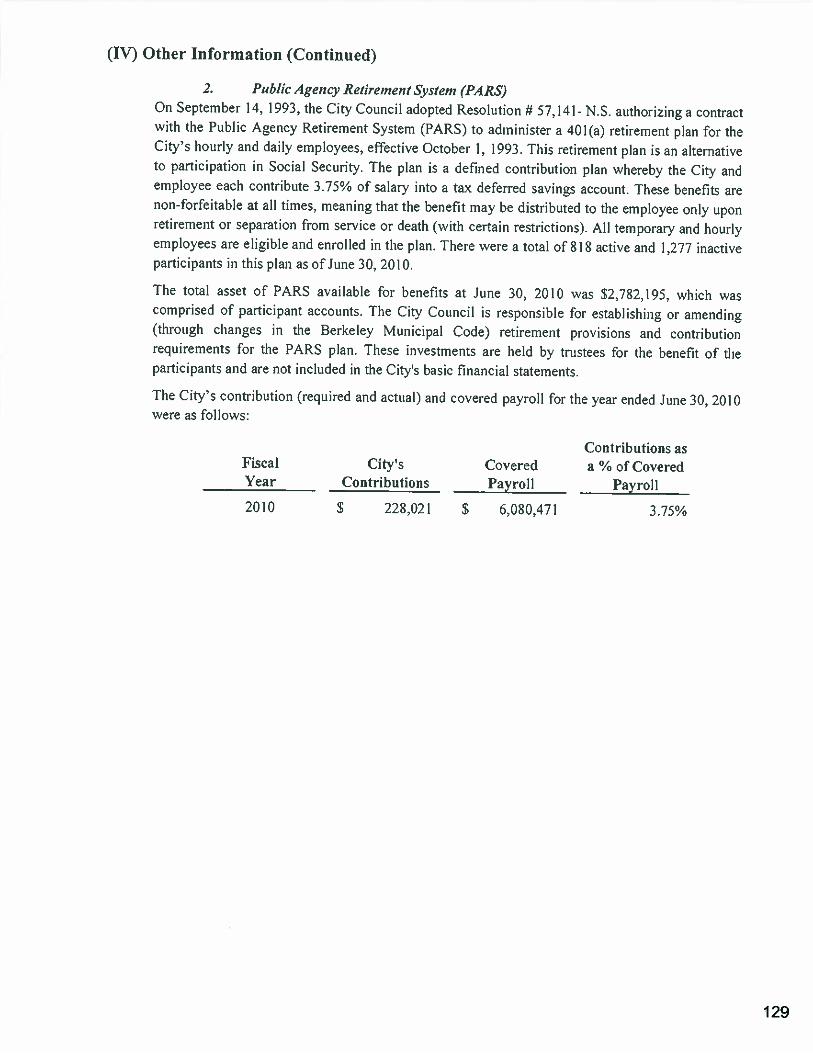
(IV) Other Information (Continued)
2. Pitb/ic Agency Retirement System (PARS)On September 14. 1993, the City Council adopted Resolution # 57,141- NS. authorizing a contractwith the Public Agency Retirement System (PARS) to administer a 401(a) retirement plan for theCity’s hourly and daily employees, effective October 1, 1993. This retirement plan is an alternativeto participation in Social Security. The plan is a defined contribution plan whereby the City andemployee each contribute 3.75% of salary into a tax deferred savings account. These benefits arenon-forfeitable at all times, meaning that the benefit may be distributed to the employee only uponretirement or separation from service or death (with certain restrictions). All tempora and hourlyemployees are eligible and enrolled in the plan. There were a total of8ls active and 1,277 inactiveparticipants in this plan as of June 30, 2010.
The total asset of PARS available for benefits at June 30, 2010 was $2,782,195, which wascomprised of participant accounts. The City Council is responsible for establishing or amending(through changes in the Berkeley Municipal Code) retirement provisions and contributionrequirements for the PARS plan. These investments are held by trustees for the benefit of theparticipants and are not included in the City’s basic financial statements.
The City’s contribution (required and actual) and covered payroll for the year ended June 30, 2010were as follows:
Contributions asFiscal City’s Covered a % of CoveredYear Contributions Payroll Payroll
2010 $ 228,021 $ 6,080.471 3.75%
129
(IV) Other Information (Continued)
G. Related Party Transaction
In June 2010, The City recruited a new Chief of Police. Included as part of the compensationpackage was a $500,000, 15 year or due- on- sale, 3% interest only housing assistance loan made tothe Chief of Police. The loan is secured by a note signed by the Chief of Police and his spouse, anda deed of trust on the residence that was purchased. The payments may be deferred and there is noprepayment penalty. The loan and accrued interest must be repaid in full within 12 months of theChief of Polic&s separation with the City.
H. Subsequent Events
1. 2010 Neighborhood Branch Library Improvement Project Bonds
On July 20, 2010, the City of Berkeley issued the second series of bonds totaling $16 million froman aggregate authorized amount of $26,000,000 of General Obligation Bonds duly approved by atleast two-thirds of the voters voting on Measure FF at an election held on November 4, 2008. toprovide funds to finance renovations, construction, seismic and access improvements, andexpansion of program areas at four neighborhood branch libraries in the City. The interest rates onthe bonds range from .45% to 4%. Interest is payable semi-annually on March 1 and September 1,and principal is payable annually on September I. The General Obligation bonds mature onSeptember 1. 2039. but are callable on or after September I, 2020. The other $10 million of the $26million authorized by the voters was issued on April 14, 2009.
2. FY 2011 Tax and Revenue Anticipation Notes
TypicaIl. the City issues 525,000.000 of tax revenue anticipation notes in October in order toalleviate the strain on working capital prior to the receipt of property tax revenues in December. hipy 2011, the issue date was moved up to July 1, 2010 and increased to $50 million. The notes wereissued with a coupon rate of 2.0% and yields of .40%., the notes are recorded in the General Fund.Interest and principal on these notes are payable on June 30, 2011 by the General Fund. The Cityhas maintained a MIG- I rating on its short-term issues.
The amount of the issue was increased by 525 million because staff determined that it waseconomically beneficial for the City to prepay PERS costs at the beginning of the fiscal year at adiscounted rate of approximately 3.7% (total of $26 million), rather than pay them each payrollperiod. This discounted rate is equivalent to a rate of return of over 7%. Prepaying the PERS costswill generate a reduction in these costs of nearly $900,000 in FY 20)1. The additional S25 millionborrowed to prepay the PERS costs will be repaid from the collection of the PERS charges from allCity departments each payroll period in FY 2011.
130
REQUIRED SUPPLEMENTARYINFORMATION
(Other than MD&A)
131
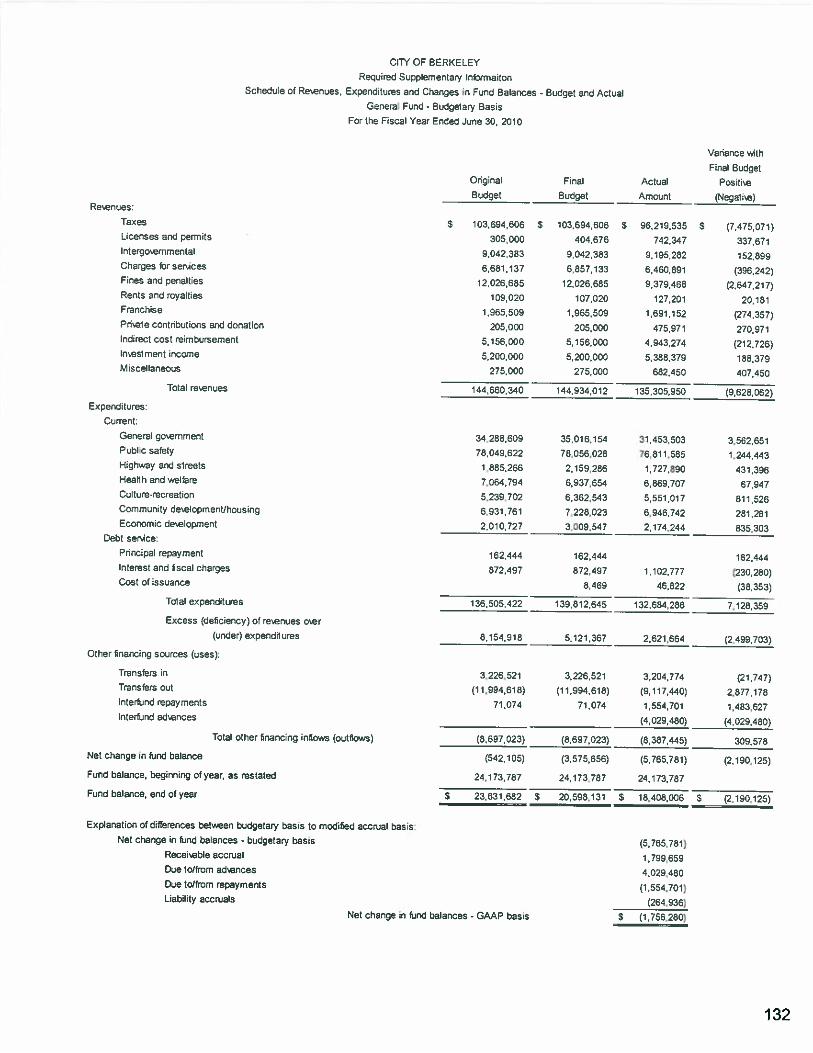
CITY OF BERKELEY
Required Supplementary lnbrmaitcnSchedule of Re*nues, Expenditures and Changes in Fund Balances - Budget and Actual
General Fund - Budgetary Basis
For the Fiscal Year Ended June 30, 2010
Vahance with
Final BudgetOngna Final Actual Posft’eBudge: Budget Amount
Reenues:
Taxes $ 103,694,606 $ 103,694,606 $ 96,219,535 $ (7,475071)Licenses and permits 305000 404,676 742,347 337.671lntergo’ernrnentaF 9,042,383 9,042.383 9.195,282 152.899Charges tbrservces 6.681,137 6,857.133 6.460,891 (396242)Fr”es and pelaltes ‘2026.685 ‘2.026.665 9,379,268 (2,647.217)Rents ard rcya:ies 109.020 107,020 127,201 23,181Franchise 1,965539 1.955509 1,691.152 (274 357)Prie:e contibuticns and dcrat’c’n 205,OcO 205.000 475,971 273,971Indirect cost reimbursement 5,156,000 5,156,000 4,943,274 (212.726)lnestment income 5.200,000 5,200,000 5,388,379 188.379Miscellaneous 275,000 275,000 682,450 407,450
Total re’enues 144,660340 144,934,012 135,305,950 (9,628,062)Expenditures:
General goernment 34,288,609 35.316.154 31 453,533 3,562,651Public safety 78,049,622 78,056,028 76,811,585 1,244443Highway and streets 1,885,266 2,159,266 1,727,890 431,396Health and welfare 7.064,794 6,937,654 6,869707 67,947Culture-recreation 5,239,702 6,362.543 5.551,017 811,526Community de2lopmentIhousing 6,931,761 7,228.023 6,946.742 281,281Eccnornic ce’.eoprert 2,0’3.727 3.309.547 2,174,244 835,303
DeS: seAce:
Prr.cipal repayment 162.444 162,444 162.444teres: and tscat charges 872,497 872,497 1,102,777 (230,260)Cost of issuance 8.469 46,822 (38,353)
Total expendituros 136.505,422 139,812,645 132,684,286 7,128,359
Excess (deficiency) of re’enues oer
(under) expenditures 8,154,918 5,121,367 2,621,664 (2,499,703)
Other inancir.g sources (uses):
Trarsfers in 3226.521 3.226 521 3.204,174 (21,747)Transfars cut (11,994,618) (11,994,618) (9,117.440: 2.877,178lnterfiand repayments 71,074 71.074 1,554,701 1.483,627lnterfiund athences (4,029,480) (4,029,480)
Total other financing inflows (outflows) (8,697,023) (8,697.023) (8,387.445) 309.578
Net change in fljnd balance (542.105) (3,575.656) (5.765,781) (2,190,125)
Fund balance, beginn:ng of year, as restated 24.173.787 24.173 757 22:73,787
Furd balance, end of year S 23.631.682 S 20.598,13’ $ 18,4C8,c6 S (2,193.125)
Explanation of differences between budgetary basis to modified aecruat basis:Net change in hind balances - budgetary basis (5,765,781)
Rccei’ieble accrual 1.799,659Due tolfrom ad’iences 4.029,480Due tcfflron’ repayments (1.554,701’:Liability accruals (264.936;
Net change in fund balances - G&AP bass $ (1.756.280)
132
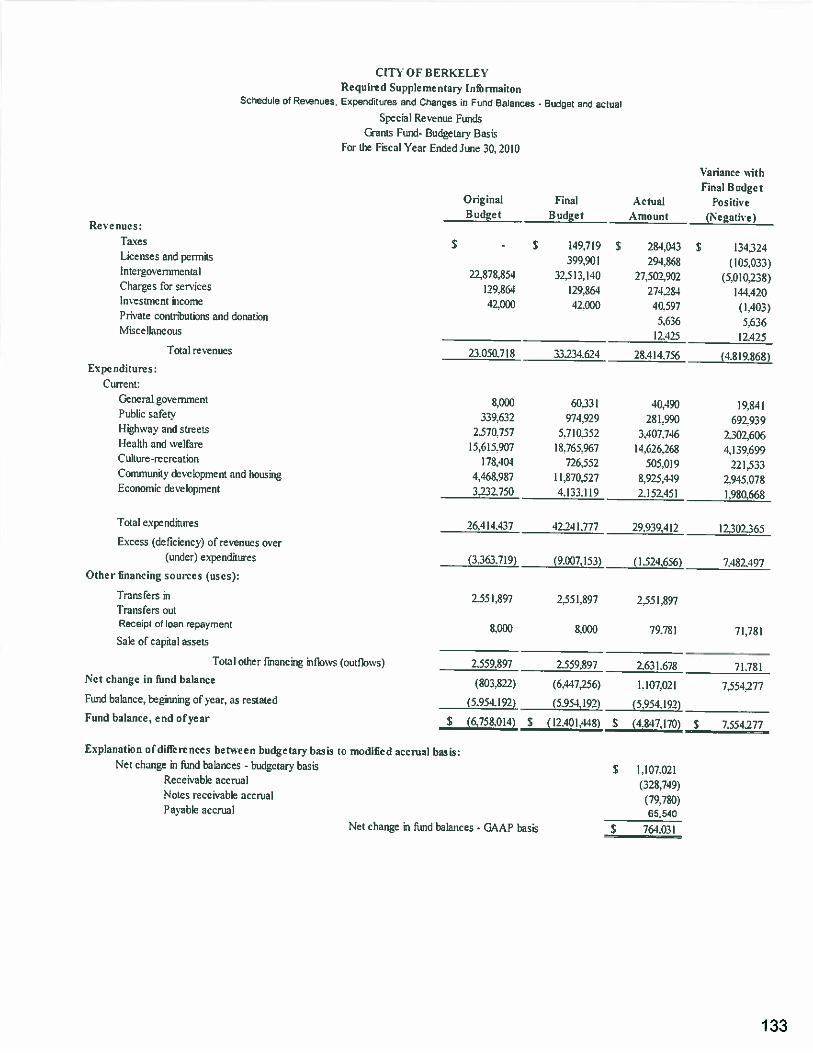
CITY OF BERKELEYRequired SuppIementan Informaiton
Schet. e cf Re.e,ues. Exped.tses and Changes in Func Balaices - Bud;et ad aotualSpecial Revenue Funds
Grants Fund- Budgeta,-v BasisFor the Fiscal Year Ended June 30. 2010
Variance thFinal Budget
Original Final Actual PositiveBudget Budget Amount (Negative)
Revenues:Taxes $ - $ 149.719 S 284.043 S 131,324Licenses and pennits 399.90l 294.868 (105.033)Intergovernmental 22.878.854 32.513.140 27502,902 (5.010253)Charges for senices 129.861 29.864 274284 144.420Investment income 42. 42.000 40.597 (1.403)Private contributions and donation 5.636 5.636Miscellaneous 12.425 12.425
Totalrevenues 23.050.718 33234.624 28.414.756 (4.819.868)Expenditures:
Current:General government 8.000 60.331 40.490 19.841Public safety 339.632 974.929 281.990 692339I-Iighway and streets 2.570,757 5.7 10.352 3.407.746 2302.606l-Teahh and welfare 15.615.907 18.765.967 14.626.268 4.139.699Cuhure-rccreabn 178.404 726,552 505.019 221.533Community development and housing 4.468.987 I l.870.527 8.925.449 2.945.078Economic 42\Iopmet:t 3.232.750 4.133.119 2.152.451 1,980.668
‘l’otal expenditures 26.4 14.437 4224 1.777 29.939.412 12.302.365Excess (deti&ncy) of revenues over
(under) expenditures (3.363.719J (9007.l53) (1.524.656) 7.481497Other financing sources (uses):
Transfers in 2.551,897 2.551,897 2.551,897Transfers outReceipt of can repayment 8.000 8.000 79.781 71.781Sale of capind assets
Total other fiancing inflows (outflows) 2.559.897 2.559.897 1631.678 71.781Net change in fund balance (803.822) (6.447.256) 1.107,021 7.554,277Fond balance. ginning of year. as restated (5.954.192) (5.954.192) (5.954.192)Fund bahmce, end of;car S (6.758.014) S (12.401.448) S (4147.170) S 7.554277
Explanation of differences bet,.cen budgetary basis to modified accrual basis:Net change in fund balances - budgetary basis S 1.107.021
Receivable accrual (328,749)Notes receivable accrual (79.780)Pasahie accrt.al 65,543
Net change in fund balances’ GAAP basis S 761.031
133
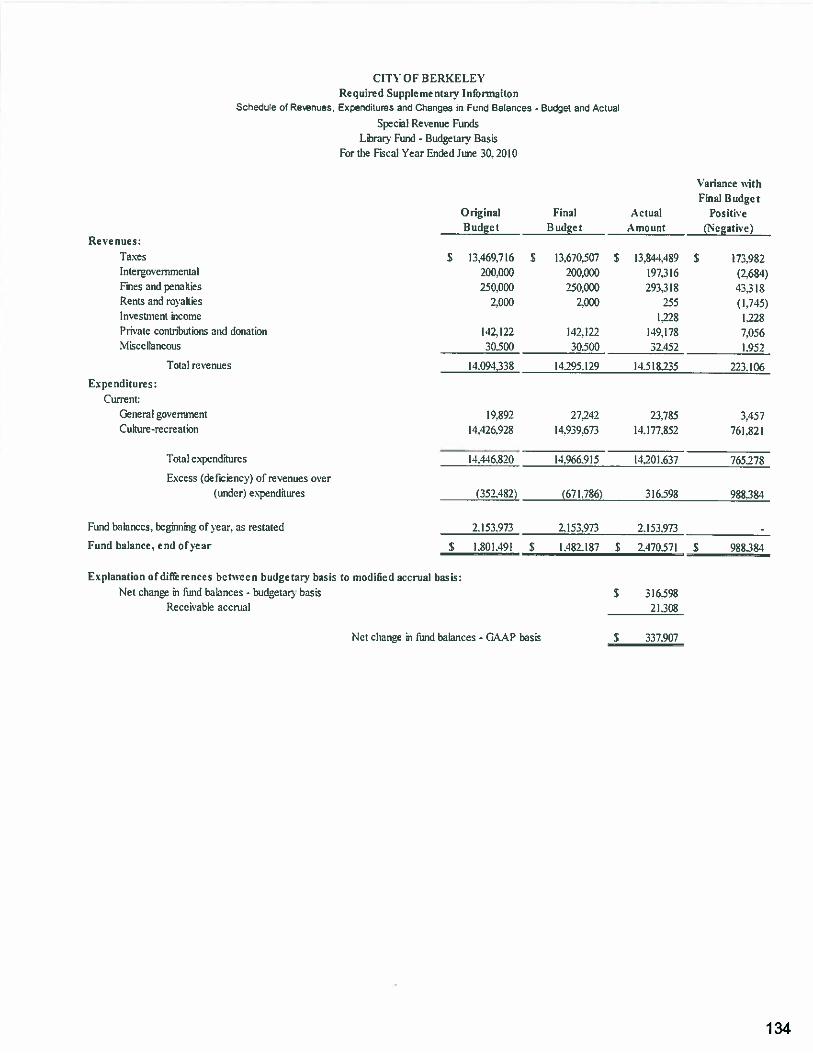
CITY OF BERKEI..EYRequired Supplemenran Informaiton
Sce&!e of Ree,ues EXperdilLieS aid Cha—ges n Fu9d Ba!arces - Bud;et and Acua.Special Revenue Funds
Ltrarv Fund - Budgetary BasisFor the Fiscal Year Ended June 30. 200
Total expenditures
Excess (deficiency) of revenues over(under) expenditures
Fund balances. bginning of year. as restated
Fund balance, end ofyear
14.4-46.820 14.966.915 4201.637 785278
(352.482) (671.786) 316.598 988.384
2.153.073 2.153.973 2.153.973 -
$ .801.491 S 1.482.187 $ 2.470.571 $ 988.384
EpIanaIion ofdifferences between budgetan basis to modified accrual basis:
S 337.907
Revenues:
TaxesIntergovernmentalFhes and penaltiesRents and royaltiesInvestment hwornePrtvale contnbutions and donatonNksceltaneous
Total revenues
Expenditures:Current:
ariance s,ilhFinal Budget
Original Final Actual PositiveBudget Budget Amount (Negative)
S 13.469.716 $ 13.670.507 $ 13,814.489 $ 173.982200.000 200.000 197.316 (2.684)250.000 250.000 293.318 43.318
2.000 2,000 255 (1.745)1228 1.228
142.122 142.122 149.178 7.05630.500 30.500 32.452 1.952
14.094.338 14295.129 14.518235 223.106
General government 19.892 27242 23.785 3.457Culture-recreation 14.42&928 14,939.673 14.177.852 761.821
Net change i fund b&ances . budgetary basisReceivable accrual
Net change h f.nd balances - GAAP basis
$ 316.5982 1.308
134
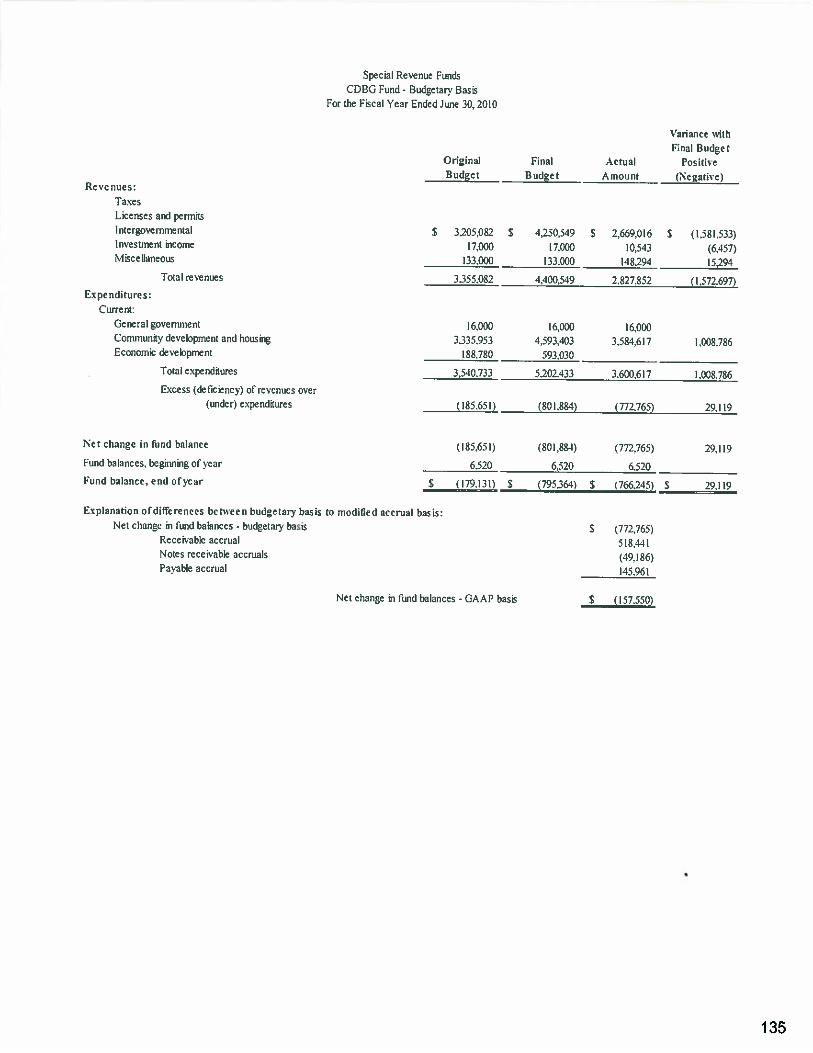
Revc flues:Taxes
Special Revenue FundsCDBG Fund - Budaetarv Basis
For the Fiscal Year Ended June 30. 2010
Variance ii(hFinal Budget
Oñginal Final Actual PositiveBudget Budget Amount (Negative)
Licenses and perrnizsIntergovernmentalInvestment thcorneMiscellaneous
Expenditures:
Current:
Total revenues
$ 320&082 $ 4250.549 S 2,669.016 (I.58L533)17.000 17.000 0.543 (6.457)
133,000 133.000 148294 15,294
3355.082 4.lOu59 2.827,852 (l.572.697
Genera) goverr.me:stCommunity development and housingEconomic development
Total expenditures
Excess (deficncv) of revenues over(under) experditures
16.000 16.000 16,0003.335.953 1.593.403 3.584.617 1,008.786
188.780 593.030
3.540.733 5,202433 3.600,617 I .008.786
(185.651) (801.884) (772.765) 29,119
(185.65) (80lfl4) (7727651 291t9
6520 6.520 6.520
5 (179.131) S (795364) $ (766245) $ 29.1 19
Net change in find balance
Fund balances, beginnmg of year
______________________________________________________________________
Fund balance, end ofyc ar
Explanation of ditrere nets be hvec n budgetan basis to niodilie d accrual has is:Net ctangc a fund haiances - budgetary basts S 1772765)
Reeeiab)e accrual 518,4-elNotes receivable accrua:s 149.186)Pa’ebe accrual 145.961
Net change in fund balances . GAAP basis 5 (157.550)
135
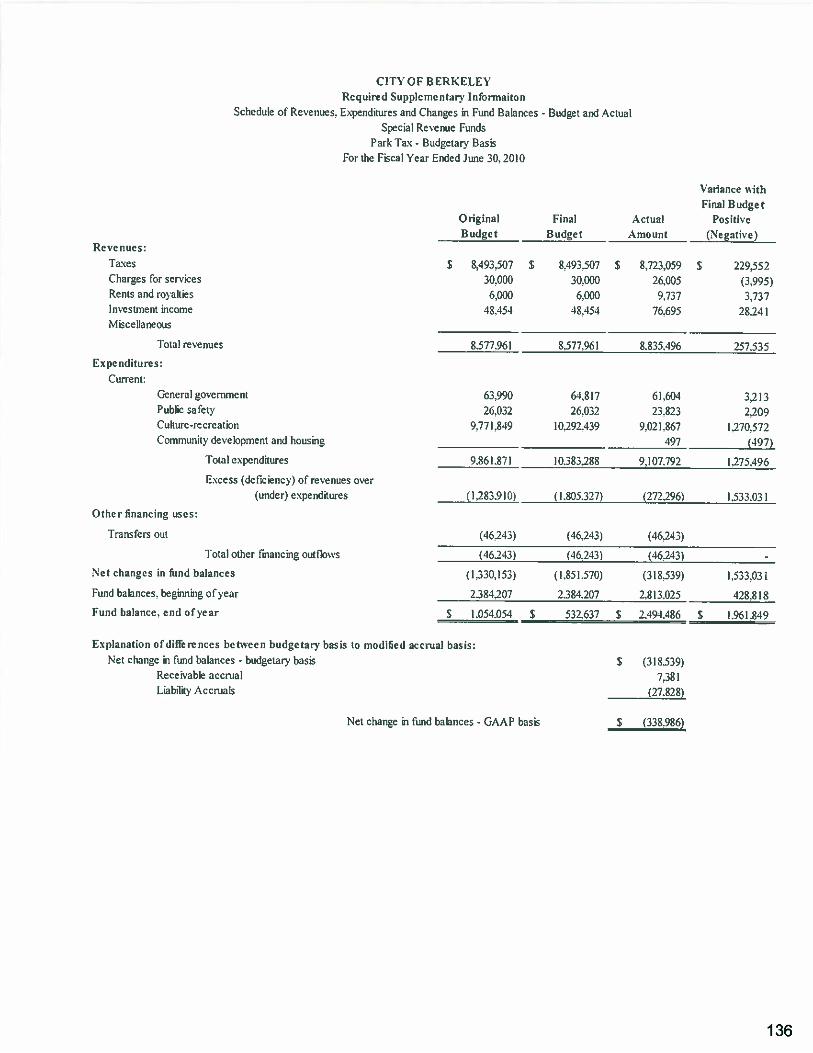
CITY OF BERKELEYRequired Supplementary lnfoi-maiton
Schedule of Rexenues. Expenditures and Changes in Fund Balances - Budget a:d ActualSpecial Revenue Funds
ParkTax- Budgetary BasisFor the Fiscal Year Ended June 30. 2010
Charges for servicesRents and royaltiesI flVCStfllCflt income
M,sce3aneous
Expenditures:Current:
General governmentPublic safetyCulture-re creationCommunity development and housing
____________
Tota] expenditures
Excess (deficiency) of revenues over(under) expenditures
_____________
Net changes in find balances
Fund balances. bcainring of year
Fund balance, end of year
Explanation ofdifferences between budgetarv basis to modified accrnal basis:Net change h fund balances - budgetary basis
ReceLabie accrualLiability Accruais
Revenues
Taxes
Variance withFinal Budget
Original Final Actual PositiveBudget Budget Amount (Negative)
total revenues
S 8.493.507 S 8.493.507 S &723.059 $ 229.55230.000 30.000 26.005 (3.995)
6.000 6.000 9.737 3,73748.454 4&454 76.695 28.241
Other financing uses:
Transfers out
Total other financing outflows
8.577.961 8.577.961 8.835A96 257.535
63.990 64.817 61.604 3.21326.032 26.032 23.823 2.209
9371.849 10.292.439 9.021.867 1.270.572497 (497)
9.86 1.871 10.383,288 9,107.792 1.275.496
(1.283.910) (1,805,327) (272,296) 1.533.031
(16243) (46.243) (46.243)
(46.243) (46.213) (46.243) -
(1.330.153) (1.851.570) (318.539) 1.533.031
2384207 2384.207 2.813.025 128.818
S 1.054.054 S 532.637 S 2.494.486 S 1.961.849
Net change in fund balances - GAAP basis
S (318.539)7.381
(27.828)
S (338.986)
136
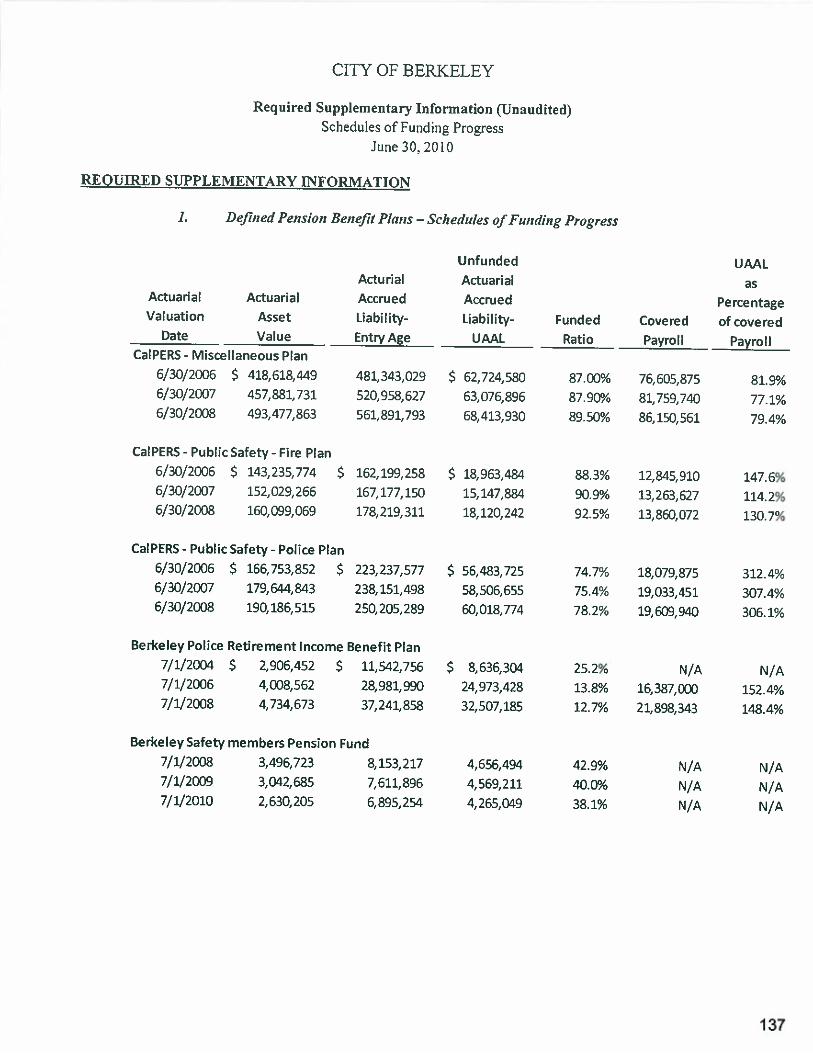
CITY OF BERKELEY
Requircil Supplementary’ Information (Unaudited)Schedules of Funding Progress
June 30,2010
REQUIRED SUPPLEMENTARY INFORMATION
I. Defined Pension Benefit Plans — Sc?; edules ofFunding Progress
Unfunded UAALActurial Actuarial as
Actuarial Actuarial Accrued Accrued PercentageValuation Asset Liability- Liability- Funded Covered of covered
Date Value Entry Age UAAL Ratio Payroll PayrollCaIPERS - Miscellaneous Plan
6/30/2006 $ 418,618,449 481,343,029 $ 62,724,580 87.00% 76,605,875 81.9%6/30/2007 457,881,731 520,958,627 63,076,896 87.90% 81,759,740 77.1%6/30/2008 493,477,863 561,891,793 68,413,930 89.50% 86,150,561 79.4%
CaIPERS - Public Safety- Fire Plan6/30/2006 $ 143,235,774 $ 162,199,258 $ 18,963,424 88.3% 12,845,910 147.6%6/30/2007 152,029,266 167,177,150 15,147,884 90.9% 13,263,627 114.2%6/30/2008 160,099,069 178,219,311 18,120,242 92.5% 13,860,072 130.7%
CaIPERS - Public Safety - Police Plan
6/30/2006 $ 166,753,852 $ 223,237,577 $ 56,483,725 74.7% 18,079,875 312.4%6/30/2007 179,644,843 238,151,498 58,506,655 75.4% 19,033,451 307.4%6/30/2008 190,186,515 250,205,289 60,018,774 78.2% 19,609,940 306.1%
Berkeley Police Retirement Income Benefit Plan7/1/2004 $ 2,906,452 $ 11,542,756 $ 8,636,304 25.2% N/A N/A7/1/2006 4,008,562 28,981,990 24,973,428 13.8% 16,387,c 152.4%7/1/2008 4,734,673 37,241,858 32,507,185 12.7% 21,898,343 148.4%
Berkeley Safety members Pension Fund
7/1/2008 3,496,723 8,153,217 4,656,494 42.9% N/A N/A7/1/2009 3,042,685 7,611,896 4,569,211 40.0% N/A N/A7/1/2010 2,630,205 6,895,254 4,265,049 38.1% N/A N/A
137
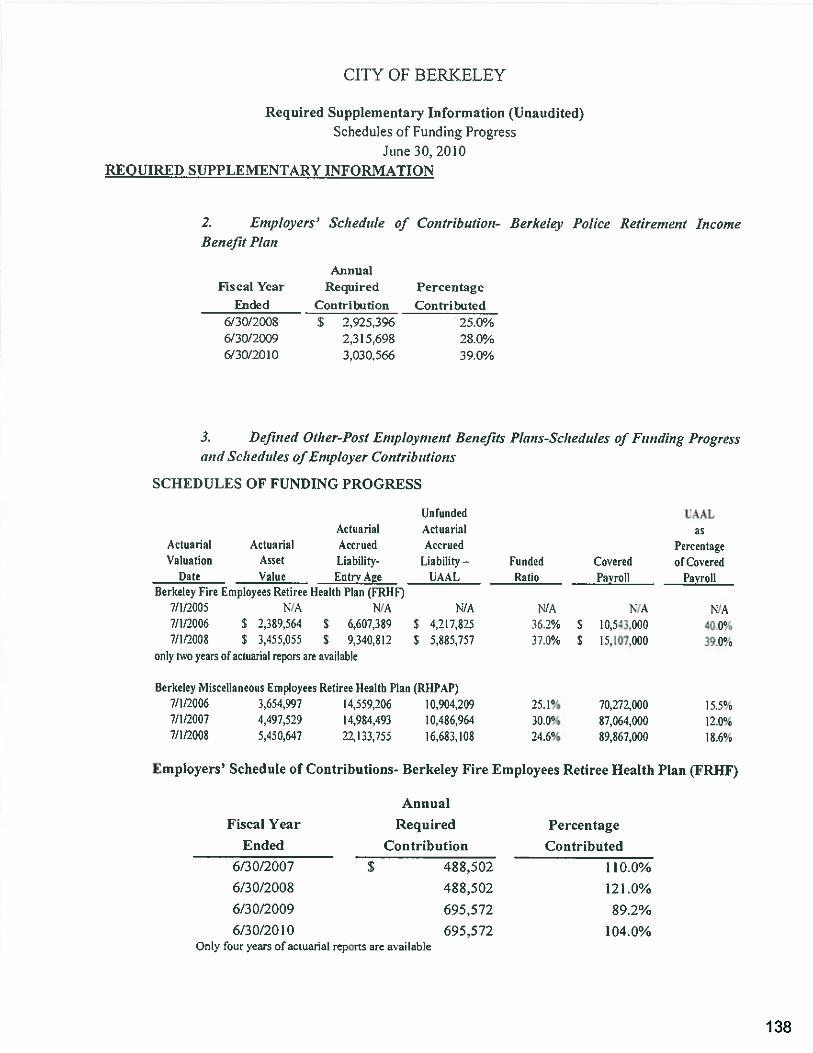
CITY OF BERKELEY
Required Supplementary Information (Unaudited)Schedules of Funding Progress
June 30, 2010REQUIRED SUPPLEMENTARY INFORMATION
2. Employers’ Schedule of Contribution- Berkeley Police Retirement IncomeBenefit Plait
AnnualFiscal Year Required Percentage
Ended Contribution Contributed6/30/2008 $ 2,925,396 25.0%6/30/2009 2.315,698 28.0%6/30/20 10 3,030,566 39.0%
3. Defined Other-Post Employment Benefits Plans-Schedules of Funding Progressand Sclz edifies ofEmployer Contributions
SCHEDULES OF FUNDING PROGRESS
Unfunded UAALActuarial Actuarial as
Actuarial Actuarial Accrued Accrued PercentageValuation Asset Liability- Liabilib — Funded Covered of Covered
Date Value Entn Ace UAAL Ratio Payroll PayrollBerkeley Fire Employees Retiree Health Plan (FRHF)
7/1i2005 N/A N/A N/A N/A N/A N/A7/1/2006 S 2,389,564 S 6,607.389 S 4,217,825 36.2% S 10.513,000 40.0%7/1/2008 5 3,455,055 $ 9,340,812 5 5,885.757 37.0% S 15,107,000 39.0%
only two years of actuarial repors are available
8erkeley Miscellaneous Employees Retiree Health Plan (RHPAP)7/1/2006 3,654,997 14,559,206 10,904,209 251% 70,272,000 155%7/1/2007 4,497,529 14,984,493 10.486.964 30.0% 87,064,000 120%7/1/2008 5,450,647 22,133.755 16,683,108 24.6% 89,867,000 18.6%
Employers’ Schedule of Contributions- Berkeley Fire Employees Retiree Health Plan (FRHF)
Annual
Fiscal Year Required Percentage
Ended Contribution Contributed
6/30/2007 $ 488,502 110.0%
6/30/2008 488,502 121.0%
6/30/2009 695,572 89.2%
6/30/2010 695,572 104.0%Only four years of actuarial reports are available
138
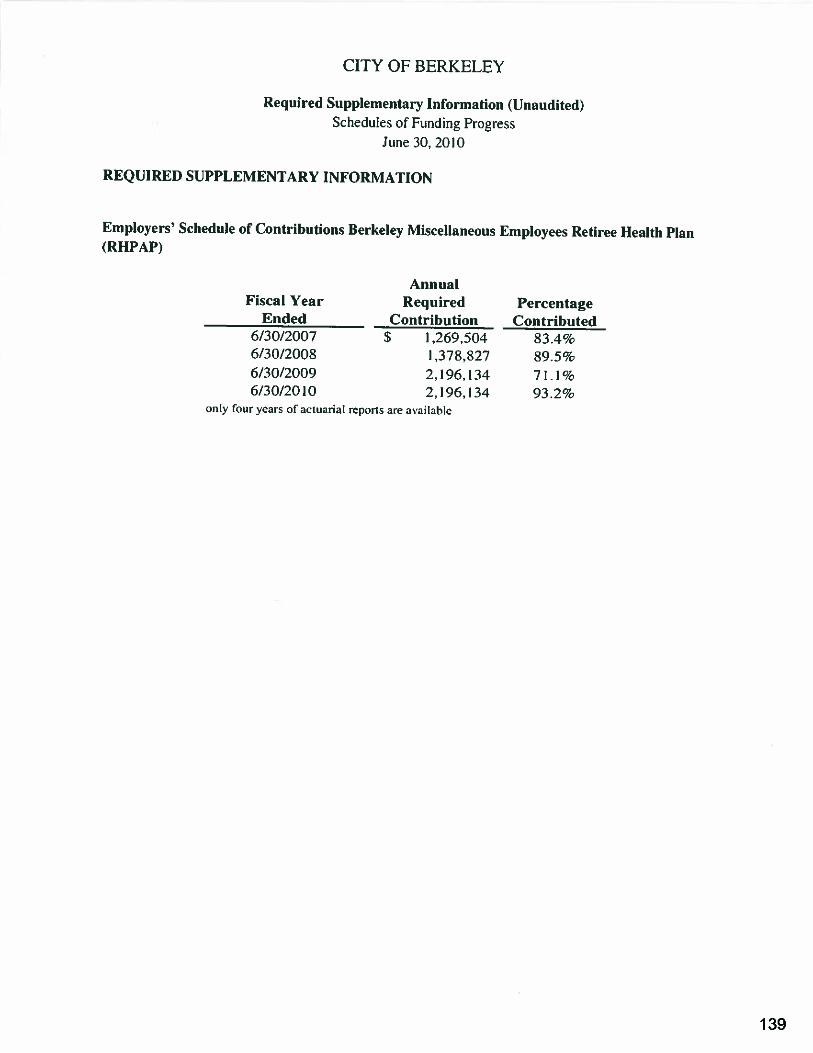
CITY OF BERKELEY
Required Supplementary Information (Unaudited)Schedules of Funding Progress
June 30. 2010
REQUIRED SUPPLEMENTARY INFORMATION
Employers’ Schedule of Contributions Berkeley Miscellaneous Employees Retiree Health Plan(RHPAP)
AnnualFiscal Year Required Percentage
Ended Contribution Contributed6/30/2007 S 1.269.504 83.4%6/30/2008 1.378.827 89.5c6/30/2009 2,196.134 71.1%6/30/2010 2,196,134 93.2%
only four years of actuarial reports are available
139
CITY OF BERKELEY
Notes to Required Supplementary Information
June 30, 2010
REQUIRED SUPPLEMENTARY LNFORMATION (Continued)Budgetary Information
Prior to June 1, the City Manager submits to the City Council a proposed operating budget or theupcoming fiscal year. The proposed budget includes a summary of the proposed expenditures andforecasted revenues, and available cash balances (i.e. budget basis fund balance/net assets for theCity’s General Fund, Special Revenue Funds; Capital Project Funds; all Enterprise Funds, and allInternal Service Funds. The City of Berkeley adopts an annual appropriated budget for its Generalfund, special revenue funds (except CA Housing Finance Agency fund; Gilman Sport Field fund;Special Gas Tax fund; Special Gas Tax fund; Fire Assessment District fund; Solano Avenue Bidfund; Underground District fund; Lillie B. Wall Memorial fund: East bay Public Utility fund; Fundfor Impounded and Unneutered), capital project funds (except Public Education/Govt Access Fac.Fund; Measure G Fire Seismic Project; Capital Improvement Administration; Street Improvement;97 GO Bonds Measure 5; Savo Island Project; 2010 COP Animal Shelter fund), and debt servicefunds (except 2010 COP Animal Shelter fund).
The City Council adopts an annual budget by resolution prior to July 1 of each fiscal year. Theannual budget indicates appropriations by fund. The Council may adopt supplemental appropriationsduring the year. At the fund level, expenditures may not legally exceed appropriations. The CityManager is authorized to transfer budgeted amounts between departments or programs within anyfund. Any revisions or transfers that alter the total appropriations of any fund must be approved bythe City Council. The City utilizes a five-year capital plan, which is updated annually. CapitalProject Funds are appropriated annually as part of the regular budget process. Any unused funds arere-appropriated to the following fiscal year until the project is completed.
The City Council approved an original annual appropriation ordinance of $333,355,332 and madesupplementary budget appropriations totaling $65,329,237 during the year. The supplementarybudget appropriations consisted of the following: (I) FY2009 outstanding encumbrances of
S 14,132,206; (2) unencumbered carryovers of $27,761,527; and (3) other budget adjustments of$23,435,504. Encumbrance accounting, under which purchase orders, contracts and othercommitments for the expenditure of money are recorded in order to reserve that portion of theapplicable appropriation, is employed as an extension of formal budgetary integration ingovernmental fund types.
Encumbrances outstanding at yearend are reported as reservations of fund balances. They do notconstitute expenditures or liabilities because the commitments will be honored during the subsequentyear.
Budgetarf Results Reconciled to Results in Accordance with GAAP
The adopted budget adopted and actual results reported in the governmental funds’ budgetaryschedules are on a modified cash basis, which is inconsistent with generally accepted accountingprinciples (GAAP). Under this budget basis, revenues are recorded when received, and interffindloans and repayments are recorded as other financing sources/uses, instead of increases anddecreases in the due to/due from accounts.
140
Combining and IndividualFund Statements and
Schedules
141
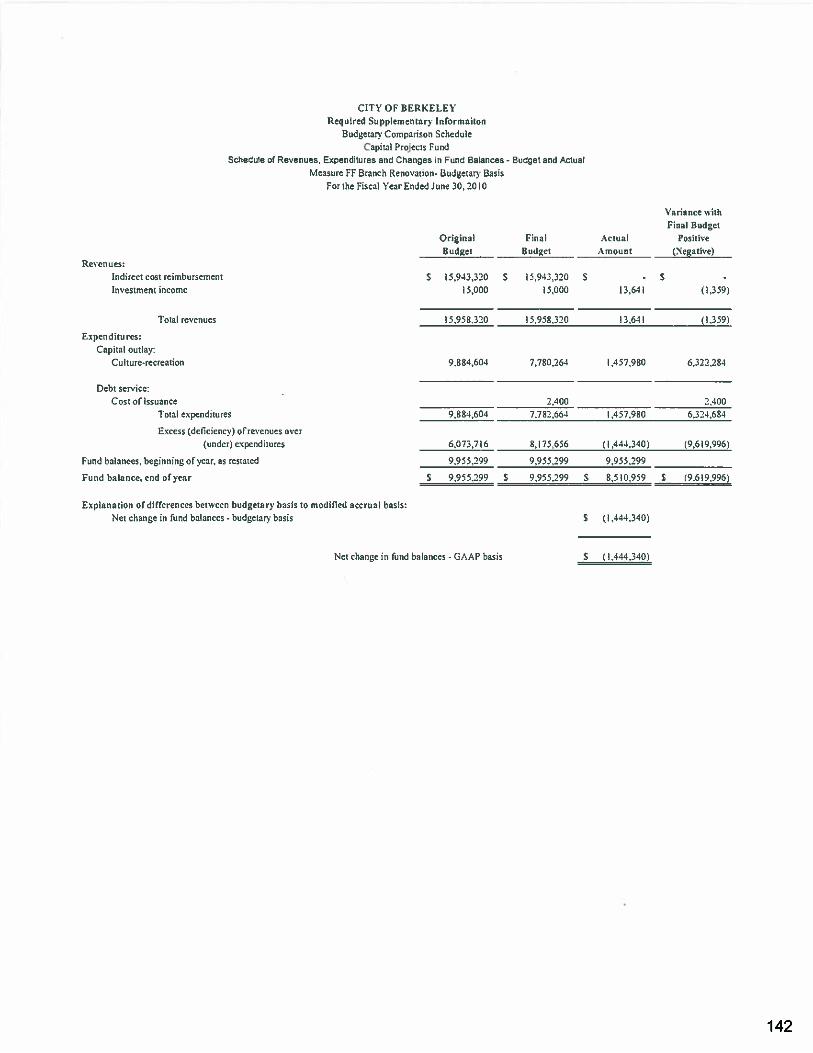
Revenues:
Expend lures:Capital outlay:
Cu lure-tee reauon
CITY OF BERKELEYRequired SupplementarY lnformaiton
Budgetaiw Comparison ScheduleCapital Projects Fund
Schedule of Revenues, Expenditures and Changes in Fund Balances - Budget and ActualMeasure FE Branch Renovation- Budgetan Basis
For the Fiscal Year EnJed June 30, 2010
Variance withFinal Budget
Original Final Actual PositiveBudget B ud2et Antoun C (Negative)
Dcbl Service:
CosI of IssuanceTotal expccr.di:ures
Excess (deficiency) of revenues o’ Cr(under, expenditures
F-and baances, begin:sing ofvear. as rcsta:ed
Fund balance, end of year
2,400 :.:oo9,884.604 7.782,664 1,457.980 6.324.682
6.073.7:6 8:75,556 (i,44,34C) 9,6l9.996
9.955.299 9,955.299 9,955.299
S 9.955.299 S 9.955,299 S 8.513.959 S 9.519,996)
Explanation of differences between budgetary basis to modified accrual basis:Net change in lund balances - budgetary basis S (1.444.340)
Net change in fund balances - GAAP basis S l1,14,3401
intel revenues
Indirect cost reinthursement S 15.943,520 S 5.943,320 S - SInvestment income I 5,000 5,000 13,641 (1,359)
15.958.320 15.958,320 5,t tI.359)
9.384,501 7.780,264 L457,980 6.322,28e
142
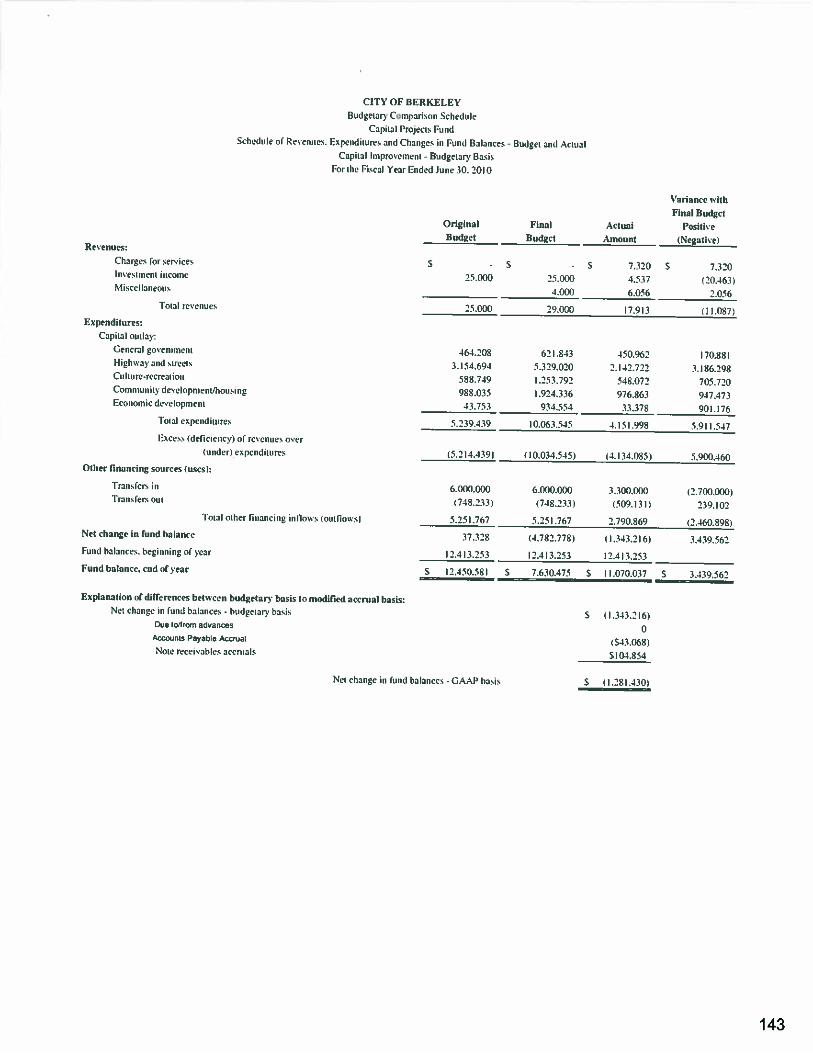
CITS OF BERKELEYBudgclai Coniparisnn Sclieditle
Capital Pmjccis FundExpenditsifts and Changes in Fund Balapires - Budget and Artlia)
Capital niproveinciti - BudgelaR’ BasisFor the Fiscal Year Ended June 50. 2010
Charges for serviceslit ‘es 1111cm incoiTle
N Ii see I Iatieotts
Expendilltres:
Capiia oullas:
General goveninleillHighway and TrectCli liii rc-recreai iouCcuiituuuunilv developnictuuluottsingI:rOnOniic developnieni
Total c\ocndiiuures
cess dcli etc 1ev of rcvc tilt Cs over
id cr1 cx pcnd p ‘cures
Oilier fttiaiicing sources I uses I:
‘I ratus fers inTransfers oto
Explanalion ofdiflerences hem ccii budgetary basis to mIiried accrual basis:Nc’ cluanoc ml lund balances - httdgctars basis
Due airom advancesAccounis Payable Accrual
Note receivables accntals
Schedule sic Res ernie’.
Revenues,
To, a I revLilu Cs
‘atiance withFinal Budget
Original Fi,ial Actual Positi’Budget Budget Amount (Negative)
S - S - S 7.320 S 7.32025.000 25.000 4.537 120.465)
4(10(1 6.056 2.056
25.0 214.1100 7913 ll.087i
464.208 621.843 450.962 170.8815.154.694 5.329.020 2.142.722 3.186.298
588.749 I .253.792 548.072 705,720988.035 1924.336 976.863 947.47545.753 93.a.554 35.378 901.176
5.239.39 10.065.545 4.1 5.998 5.911.547
5.2 14.439) 110.034.515) 4.134.085) 5.91)0.460
6.000.000 6.000.000 3.500.000 12.700.000l(748,233) (748.233) 1500.13]) 239.102
5.251.767 5.251.767 2.790.869 2,460,898p
37.328 (4.782.778) ) 1.343,2161 3.439.562
12.113.253 12.413.253 12.413.253
S 12.450.581 S 7.630.475 S 11.070.037 S 3.439.562
Toial oilier fi,paiictng infloss s lolutfioseid
Net change- in fund balance
Fund balances. beginning of year
Fund balance, end ot year
Net citatuge itt fund balances - GAAP basis
11,343.216)
0543.068 I
S 104.8 54
S 1.281.4301
143
Nonmajor Governmental Funds
SPECIAL REVENUE FUNDS
Special Revenue funds are used to account for proceeds of specific revenue sources (otherthan capital projects) that are legally restricted to expenditure for specific purposes. The useof special revenue funds is required if legally or otherwise mandated.
Asset ForfeitureFund established to account for monies received from the seizure and forfeiture ofassets acquired by the City as a result of narcotics related law enforcement.
Special Tax for DisabledFund established to account for special tax, which is solely for providing emergencyservices and incidental case management for severely physically disabled persons.
Workforce Investment ActFund established to account for funds provided by allocation of WorkforceInvestment Act grant funds
Sec 108 HUD Loan Grant AssistantFund established to account for funds for Sec 108 HUD loan and its disbursement.
California Housing Finance AgencyFund established to account for funds for operating a local housing program.
Gilman Sports FieldFund established to account for funds for Gilman sports field.
Animal ShelterFund established to account for funds donated for providing animal shelter andrelated services.
Paramedic Assessment DistrictFund established to account for special tax assessed for paramedic service
Tieback Mitigation R-O-WFund established for the collection of mitigation fees from developers for the futurepotential cost associated in removing tiebacks or any other cost associated in thePublic right of way.
Domestic Violence Prevention Vital StatisticsFund established to account for the surcharge for birth and death certificates that areissued by the Berkeley Public Health Vital Statistics unit to be used in theadministration and coordination of domestic violence and family violence preventionactivities.
144
Affordable Child CareFund established from fees collected from developers of large scale commercialdevelopment to assist low-income families with monthly child care payments.
Inclusionary Housing ProgramFund established to account for the administration of the lnclusionary HousingProgram, whereby 20% of new units in apartment projects in the City of Berkeleymust be offered at a rent or sale price that is affordable to low income households.The City charges fees fcr the administration and monitoring of this program.
Condo Conversion ProgramFund established to account for the administration of the affordable housing. Housingdepartment can charge 10% of the revenue for program delivery costs.
Playground CampFund received from registration and miscellaneous fees for the purpose of operatingthe City’s vacation camp and day camps.
Special Gas Tax Fund (30)Fund established to account for City’s gasoline tax apportionment revenues. Gas taxfunds are restricted to maintenance and construction of certain City street. This funddoes not have much activity at the present.
Special Gas Tax Fund - DiscFund established to receive monies from City’s gasoline tax apportionment revenuefor discretionary use.
State -2106Fund established to receive monies from City’s gasoline tax apportionment revenueper Section 2106, Streets and Highway Code.
State -2107Fund established to receive monies from City’s gasoline tax apportionment revenueper Section 2107, Streets and Highway Code
State - 2107.5Fund established to receive monies from City’s gasoline tax apportionment revenueper Section 2107.5, Streets and Highway Code.
State — SB300Fund established to account for the money received under the state’s SB300program.
State— Prop 111Fund established to receive monies from State Proposition 111 for the highway trafficcongestion relief and spending.
State Proposition 172Fund established to receive monies from sales tax to be used for public safety.
145
Traffic Congestion ReliefFund established to receive monies from State to be used for highway and streetpurpose.
Rental Housing Safety ProgramFund established to receive monies by charging an annual per unit fee to the rentalhousing property owner, imposing fines to all related violations. The purpose of thisfund is to provide and streamline the Rental Housing Safety Program (RHSP) whilemaintaining the overall goal of having owners, tenants, and the City work together toincrease the safety of all residential rental units.
Measure B: Local Streets and RoadsFund established to account for the tax assessed for local streets and roads.
Measure B: Bike and PedestriansFund established to receive monies used for the maintenance of bike and pedestrianlanes.
Measure B: ParatransitFund established to account for the revenue assessed from property tax to be usedfor expenses related for paratransit services.
Fire Assessment DistrictFund established to account for the $55,000,000 Fire Protection Bond Measure(11/92) and monies collected from the fire assessment district. These funds are tobe used solely to finance the acquiring, and constructing and equipping of a new firestation, the repairing and seismic retrofitting of five existing fire stations, thereplacement of deteriorated four-inch water mains with eight-inch mains and theconcurrent street overlay work necessitated with the issuance of the bonds.
CFD#1 District Fire Protect BDFund established to account for fire and disaster tax passed in Bond Measure GG in2009. The monies collected are for emergency responses.
Street LightingFund established to receive special assessment district monies used formaintenance and or servicing of existing and future public lighting facilities, and theinstallation or construction of public lighting for the maintenance of servicing thereof,including grading, clearing, removal of debris, the installation of curbs and gutters)walls, sidewalks or paving or water, irrigation, drainage or electrical facilities.
Solano Avenue BidFund established to account for the revenue assessed from the Solano Avenue’sbusiness district to be used for expenses related for cleaning, repairing andadvertising improvement for the district in order to general aggressive sales benefitas a long term goal.
Underground DistrictFund established to account for Fire District Underground property assessments.
Downtown Business Improvement DistrictFund established to be used to contract with Downtown Berkeley association forDowntown revitalization program.
146
Telegraph Business Improvement DistrictFund established to receive special real property assessments monies, which isused to improve the commercial business district of Telegraph area. Themanagement district provides maintenance, revitalization and marketing servicesabove and beycnd those provided by the City of Berkeley.
North Shattuck Business Improvement DistrictFund established for the purpose of collecting and accounting for bid revenues.
Business Economic DevelopmentFund established to receive monies from a federal grant (Economic DevelopmentAdministration) for the purpose of providing loans to eligible South Berkeleyestablishments under a program approved by the City Council.
Citywide RLF (Revolving Loan Fund)Fund established to account for Citywide Commercial revolving loan fund forrevitalization of business enterprises and job stimulation.
Employee Computer LoanFund established to account for interest free loans made to employees to purchasecomputers, and for the repayment of those loans.
Miles LabFund established to provide job training for Berkeley residents.
Employee TrainingFund established to provide training to city employees
UC SettlementFund established to account for agreed upon expenses to be shared between City ofBerkeley and University of California, Berkeley.
Private Party SidewalksFund established to account for reimbursements from private parties, which werepreviously passed through Landscape Assessment District Fund, now a parks tax,and all sidewalk funding is to be removed from this fund.
Public ArtFund established to set aside funds for the development of visual art in public places,including art developed in conjunction with city construction projects.
Lillie B. Wall MemorialFund established to provide day nursing care to needy children in the City ofBerkeley
Vital and Health StatisticsFund established to account for monies held in trust for vital and health statisticprogram.
East Bay Public Utilities CommissionFund initiated to oversee expenses involved in the construction of certain publicimprovements in Assessment District No. 1960-1 in the City of Berkeley.
147
Other Special DepositsFund established to receive monies left in trust with the City of Berkeley for specificpurposes from various sources.
Health State Aid RealignmentFund established to receive monies (Assembly Bill 1491) from vehicle license feesand state sales tax to support public health activities within the Citys healthjurisdiction. This fund provides for the ongoing fiscal relief measure in response tothe local funding dilemma created by Proposition 13. These funds replace theAssembly Bill S allocations normally received by the city for providing Public HealthServices.
Tobacco ControlFund established to receive State monies from special tax on cigarettes to providepublic health education and outreach on tobacco use prevention and cessation.
Mental Health State Aid RealignmentFund established to receive monies from State sales tax fcr the purpose of providingmental health services to the citizens of Berkeley and Albany.
City Opt. Public Safety TrustFund established to receive monies from State as a result of Assembly Bill 3229 forthe purpose of purchasing radio equipment for the Communications Center of thenew public safety building.
Fund for Impounded and UnneuteredFund established to account for monies held in trust for impounded and unneuteredanimals.
Alameda County Abandoned Vehicle Abatement AuthorityFund established to provide an interest bearing abandoned and inoperative vehiclefund in accordance with requirements mandated by the California Vehicle Code:section 22710.
148

CAPITAL PROJECT FUNDS
Capital projects funds are used to account for financial resources to be used for theacquisition or construction of major capital facilities (other than those financed by proprietaryfunds and trust funds).
Public, Education & Government Access FacilitiesFund established to account for monies received from the Cable TelevisionFranchise. These monies are to be used for capital expenditure for PEG studios,video production equipment, mobile production van(s), internal wiring connections,and related capital items,
Measure C: Fire Seismic ProjectsFund established to account for fire seismic projects.
Measure C: Public Safety BuildingFund established to account for the retrofit of public safety building.
Capital Project AdministrationFund estab!ished to account for money received for the support the administration ofthe capital projects group
Street Improvement FundFund established by Resolution 26,971 to receive shared County Gas Tax revenuesfrom the City of Berkeley and County of Alameda for use on specific streetimprovement projects. Contract is for five years, fiscal year 1968-89 through fiscalyear 1992-93.
97 General Obligation Bonds Measure SFund established to account for capital improvements in Berkeley’s Main Library,Civil Center, and downtown Berkeley area.
Park Acquisition DevelopmentMonies provided by an annual tax levy of $20 for each $100 of assessed valuation.This levy ended after FY 1979-80. A minimum of 75% of the revenues are used forthe acquisition and development of real property which are used for recreation andopen space purposes determined by the Recreation and Parks Commission andPlanning Commission. The balance of the Fund (up to 25%) may be used for therenovation of existing City park properties and for associated administrativeexpenses.
West Berkeley Improvement FundFund established to account for capital improvement in the west Berkeley projectarea for Berkeley Redevelopment Agency.
West Berkeley: Low and Moderate HousingFund established to account for 20% set aside from tax increment in west Berkeleyproject area that is for the purpose of developing low and moderate income housing.
149
Savo Island ProjectFund established to account for capital improvement in the Savo Island project areafor Berkeley redevelopment agency.
Savo Island Project: Low and Moderate HousingFund established to account for 20% set aside from tax increment in Savo Islandproject area that is mainly for the purpose of developing low and moderate incomehousing.
Animal Shelter Land/BldgFund established to receive monies for acquisition of facilities for animal shelter.
2010 COP Animal ShelterFund established to account for 2010 municipal bond measure solely for the purposeof building a new animal shelter.
150
DEBT SERVICE FUNDS
Funds established to account for the accumulation of resources for, and the payment of,general long-term debt principal and interest.
Sale Lease FinancingFund established to receive monies and to make interest and debt service paymentsfor the 96 Refunding Lease Revenue Bonds (BJPFA).
09 Measure FE - LibraryFund established to account for a bond measure FF in 2009— the library’s retrofittingprojects, part of the monies received are for furniture and fixture.
West Berkeley Improvement FundFund established to account for the west Berkeley project area’s 2005 bonds and forreceiving tax increment money to pay against the indebtedness.
Savo Island Improvement FundFund established to receive tax increment money and to account for payment of debtfrom City’s miscellaneous retiree medical trusts.
GO 2007 Refunding BondsFund established to receive monies and to make interest and principal payment onthe Berkeley 2007 General obligation refunding bonds replacing the old Measure Sseries A, B, C.
Berkeley Repertory TheatreFund established to receive monies and to make interest and principal payment onthe Berkeley Joint Powers Financing Authority Lease Revenue Bonds, Series 1999.The proceeds of the bonds are used to acquire a new theater facility with a park tobe constructed by the Berkeley Repertory Theatre or other public facilities.
GO 2002 Refunding BondsFund established to receive monies and to make interest and principal payment onthe Berkeley 2002 General Obligation bonds replacing the old Measure G series Aand B.
GO 2007 Refunding Bonds ProceedsFund established to receive Proceeds from the 2007 General Obligation Refundingbonds which replaced the old Measure G series C.
GO 2008 Animal Shelter— Measure IFund established to receive monies and to make interest and principal payment onthe Berkeley 2002 General Obligation bond for the animal shelter.
2010 COP Animal Shelter
Fund established to receive funds to finance a portion of the acquisition andconstruction of an animal shelter
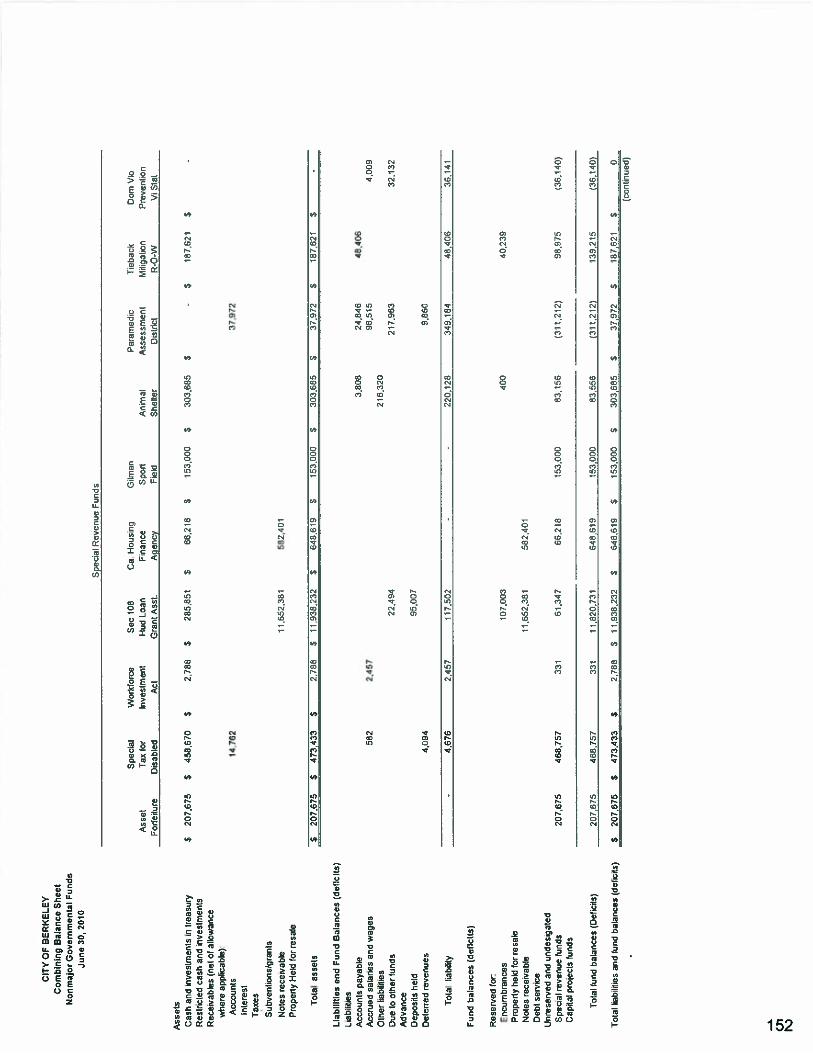
CIT
YO
FB
ER
KE
LE
YC
ombi
ning
Bal
ance
Sh
eet
Nonm
ajor
Go
ver
nm
enta
lF
unds
Jun
e30
,20
10
Ass
ets
Cas
han
din
vest
men
tsin
trea
sury
Res
tric
ted
cash
and
inve
stm
ents
Rec
eiva
bles
(net
ofal
low
ance
whe
reap
plic
able
):A
ccou
nts
Inte
rest
Tax
es
Sub
vent
ion
sfg
rant
s
Not
esre
ceiv
able
Pro
pert
yH
eld
for
resa
le
Tot
alas
sels
Lia
bili
ties
and
Fun
dB
alan
ces
(def
icit
s)L
iabi
litie
sA
ccou
nts
paya
ble
Acc
rued
sala
ries
and
wag
esO
ther
liabi
litie
sD
ueto
othe
rfu
nds
Adv
ance
Dep
osit
she
ldD
eter
red
reve
nues
Tol
allia
bilit
y
Fun
dbal
ance
s(d
efic
its)
Res
erve
dfo
r:E
ncum
bran
ces
Pro
perl
yhe
ldfo
rre
sale
Not
esre
ceiv
able
Deb
tse
rvic
eU
nres
erve
dan
dun
desi
gale
dS
peci
alre
venu
efu
nds
Cap
ital
proj
ects
fund
s
Tot
alfu
ndba
lanc
es(D
efic
its)
Spe
cial
Rev
enue
Fun
ds
Spe
cial
Wor
kfor
ceS
ec10
8C
a.H
ousi
ngG
ilman
Par
amed
icT
ieba
ckD
omV
ioA
sset
Tax
for
Inve
stm
ent
Hud
Loa
nF
inan
ceS
port
Ani
mal
Ass
essm
ent
Miti
gatio
nP
reve
ntio
nF
orfe
itur
eD
isab
led
Act
Gra
ntA
sst.
Age
ncy
Fiel
dS
helt
erD
istr
ict
R-O
-WVi
Sla
t
S2D
7.67
5$
458,
870
$2
78
8$
2658
51$
66,2
18$
153,
000
$30
3,66
5$
-$
167,
621
$-
14
76
237
,972
11,6
52,3
8156
2.40
1
$20
7.67
5$
473,
433
$2.
788
$11
.938
.232
$84
8,61
9$
153,
D00
$3D
3.68
537
,972
$18
7.62
1$
-
3.80
624
.846
48,4
D6
582
2,45
796
,515
4,00
921
6,32
022
,494
217.
963
32,1
32
95.0
074,
094
9.86
0
-4.
676
2,45
711
7,50
2-
-22
0,12
834
9.18
448
,406
36,1
41
107,
003
400
40.2
39
11,6
52,3
6158
2,40
1
207675
468,
757
331
61,3
4766
.218
153.
000
83.1
56(3
11,2
12)
98,9
75(3
6,14
0)
207.
675
468.
757
331
11,8
20.7
3164
8,61
915
3,00
083
.556
(311
,212
)13
9,21
5(3
6.14
0)
$20
7.67
5$
473,
433
$2.
788
$11
.938
.232
$64
8,61
9$
153.
000
$30
3,68
5$
37,9
72$
187,
621
$0
(con
tinu
ed)
Tot
allia
bilit
ies
and
fund
bala
nces
(det
icits
)
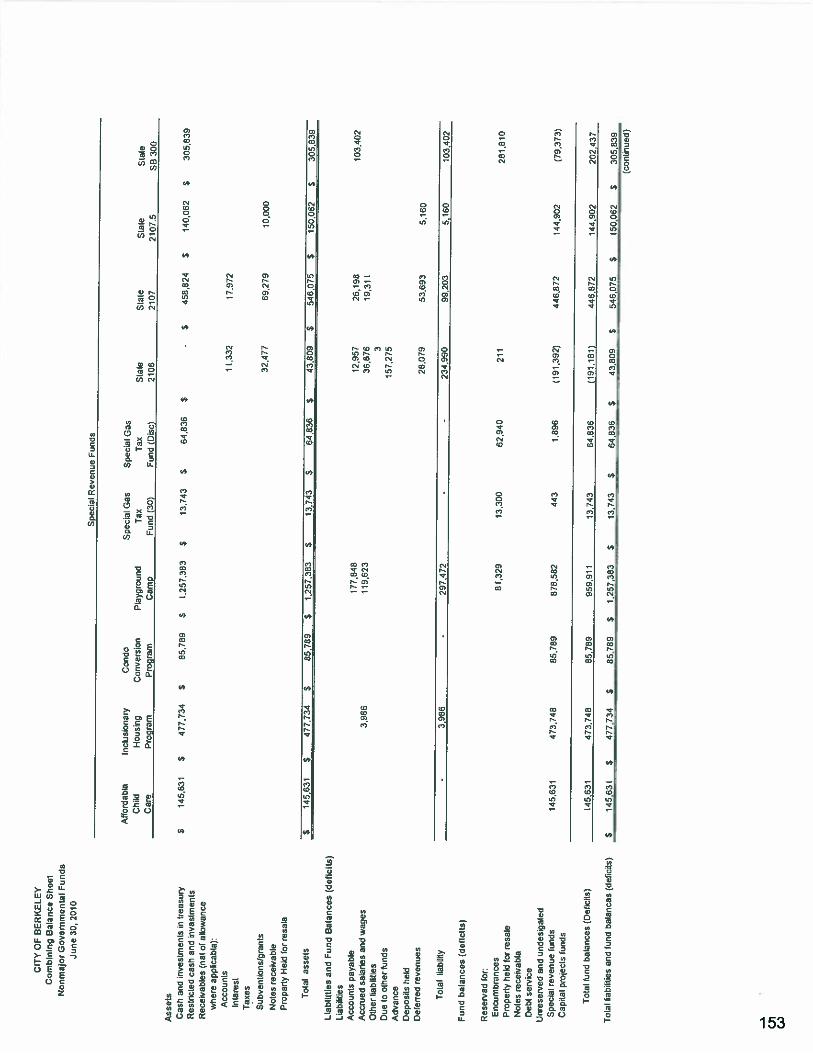
CIT
YO
FB
ER
KE
LE
YC
ombi
ning
Bal
ance
Sh
eet
Non
maj
orG
ov
ern
men
tal
Fun
ds
June
30,
2010
Ass
ets
Cas
han
din
vest
men
tsin
trea
sury
Res
trded
cas
artd
1ves
tmen
tsR
ecei
vabl
es(n
etoF
alo
wat
cew
here
appl
icab
le):
Acc
ount
sIn
tere
stT
axes
Subv
enti
ons/
gran
tsN
otes
rece
ivab
leP
rope
rty
Hel
dFo
rre
Sale
Tot
alas
sets
Lia
bili
ties
and
Fun
dB
alan
ces
(det
icit
s)L
,abi
lties
Acc
ount
spa
yabl
eA
ccru
edsa
lari
esan
dw
ages
Oth
erlia
bilit
ies
Due
toot
her
fund
sA
dvan
ceD
epos
its
held
Det
erre
dre
venu
es
Tot
alia
bJity
Fun
dbal
ance
s(d
efic
its)
Res
erve
dfo
r:E
ncum
bran
ces
Pro
perl
yhe
ldfo
rre
sale
Not
esre
ceiv
able
Deb
tse
rve
Unr
eser
ved
and
unde
siga
tac
Spe
cial
reve
nue
fund
sC
ap:ta
’pr
ojec
tsfu
nds
Tot
alfu
ndba
lanc
es(D
atic
its)
Spe
cial
Rev
enue
Fun
ds
Aff
orda
ble
Incl
usio
nary
Con
doS
peci
alG
asS
peci
alG
asC
hild
Hou
sing
Con
vers
ion
Pla
ygro
und
Tax
Tax
Sta
teS
tate
Sla
teS
tate
Car
eP
rogr
amP
rogr
amC
amp
Fund
(30)
Fund
(Dis
c)21
0621
0721
01.5
SB30
0
S14
5,63
1S
477,
734
S85
,789
$1,
257.
383
$1
3.7
43
$64
.836
$-
$45
8.82
4$
140,
062
$30
5,83
9
11.3
3217
,972
32,4
7769
.279
ID,0
0D
514
5.63
1$
477,
734
$85
.789
$1,
257.
383
$13
,743
S64
636
543
.809
S54
6,07
5$
150,
062
$30
5,83
9
177.
848
12,9
5728
,198
103,
402
3,98
611
9,62
336
,676
1931
13
157,
275
28,0
795
36
93
5.16
0
-3.
966
-29
7,47
2-
-23
4.99
099
,203
5,16
010
3.40
2
81,3
2913
.300
62,9
4021
128
1,81
0
145.
631
47
37
45
65,7
8987
8.58
244
31.
896
(191
,392
)44
6.87
214
4,90
2(7
9.37
3)
145,
631
473.
748
85,7
8995
9,91
113
,743
64,8
36(1
91,1
81)
446,
872
144,
902
202,
437
$145,6
31
$47
7.73
4S
85,7
89S
1,25
7383
$13
.743
$64
,838
$43
.809
$54
6,07
55
150062
$30
5.83
9(c
onti
nued
)
Tot
allia
bilit
ies
and
fund
bala
nces
(def
icits
)
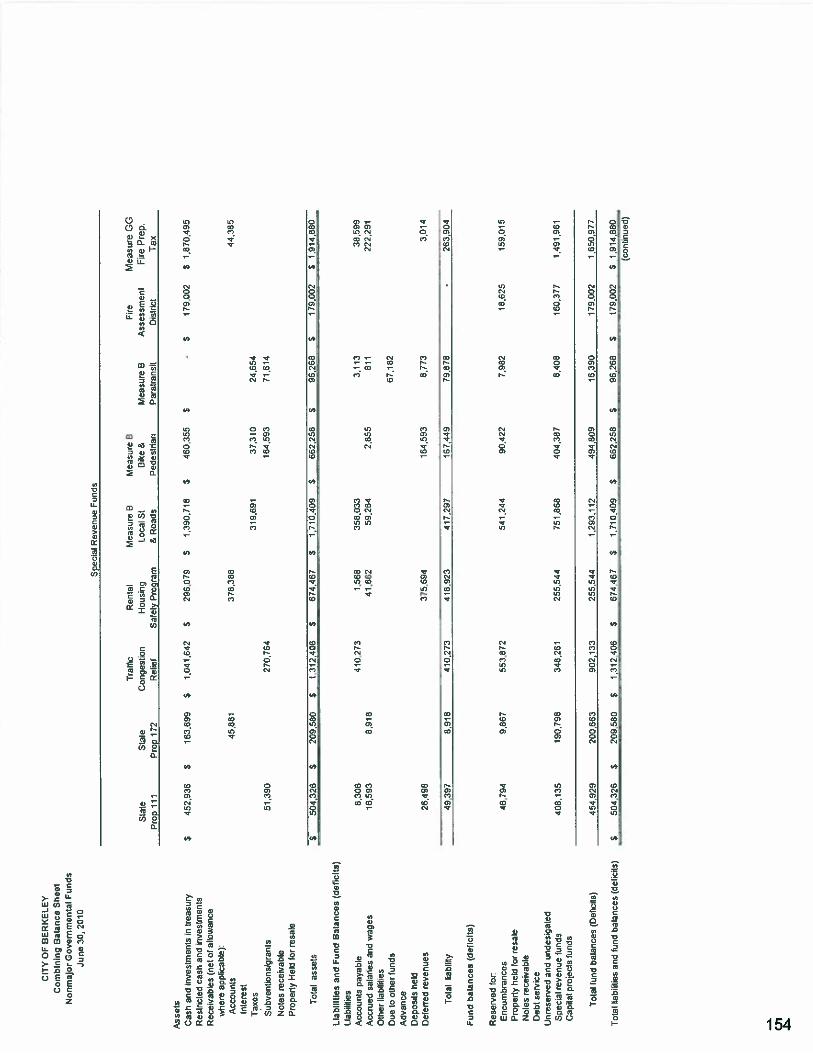
CIT
YO
FB
ER
KE
LE
YC
ombi
ning
Bal
ance
Sh
oo
tN
onrn
ajor
Go
ver
nm
enta
lF
unds
Jun
o30
,20
10
Ass
ets
Cas
han
din
vest
men
tsin
trea
sury
Res
tric
ted
cash
and
inve
stm
ents
Rec
eiva
bles
(net
ofal
low
ance
whe
reap
plic
able
)A
ccou
nts
Inte
rest
Tax
es
Subv
enti
onsl
gra
nIs
Not
esre
ceiv
able
Pro
perl
yI-i
e!d
for
resa
!e
Tot
alas
sets
Lia
bili
ties
and
Fun
dB
atan
ces
(def
icit
s)L
iabi
litie
sA
ccou
nts
paya
b’e
Acc
rued
sala
ries
and
wag
esO
ther
liabi
litie
sD
ueto
olhe
rfu
nds
Adv
ance
Dep
osit
she
ldD
eter
red
reve
nues
Tot
allia
bilit
y
Fun
dbal
ance
s(d
efic
its)
Res
erve
dfo
r:E
ncum
bran
ces
Pro
pert
yhe
ldfo
rre
sale
Not
esre
ceiv
able
Deb
tse
rvic
eU
nres
erve
dan
dun
desi
gate
dS
peci
alre
venu
etu
nds
Cap
ital
proj
ects
fund
s
Tot
alfu
ndba
lanc
es(D
ehci
ts)
Spe
cial
Rev
enue
Fun
ds
Tra
ffic
Ren
tal
Mea
sure
BM
easu
reB
Fire
Mea
sure
GO
Sta
teS
tate
Con
gest
ion
Hou
sing
Loc
alSt
Dik
e&
Mea
sure
BA
sses
smen
tF
ire
Pre
p.P
rop
111
Pro
p17
2R
elie
fS
afet
yP
rogr
am&
Roa
dsP
edes
tria
nP
arat
ransI
Dis
tric
tT
ax
$452936
$16
3.69
9$
1041642
$29
6.01
9$
1390,7
18
$460355
$-
$17
9,00
2$
1.87
0,49
5
45,8
8137
8,38
844
,385
319,
691
37,3
024
,654
51.3
9027
0,76
416
4,59
371
,64
550
4.32
6$
209
580
$1.
312,
406
$67
4.46
7$
1,71
0,40
9S
662,
258
$96
,268
$17
9.00
2$
1,91
4,88
0
6,30
641
0,27
31.
568
258,
033
3.11
338
.599
16,5
938.
918
41,6
6259
,284
2.85
581
122
2,29
1
67,1
82
26,4
9837
5,69
4l6
4,59
38,
173
3,01
4
49,3
976,
918
410,
273
418,
923
417,
297
161,
449
79,8
78-
263,
904
46,7
949,
867
553,
872
541.
244
90,4
227,
982
18,6
2515
9,01
5
408,
135
190,
796
348,
261
255,
544
751.
868
404,
387
8,40
816
0,37
11,
491,
961
454,
929
200,
663
902,
133
255
544
1.29
3,11
249
4,80
96
,39O
179002
1,65
0,91
7
S50
4,32
65
209.
580
$1,
312,
406
S67
4,46
7$
1,71
0,40
9$
662,
258
$96
,268
S17
9,00
2S
1914
,880
(con
tinu
ed)
Tot
alka
bi’it
les
and
fund
bat
snce
s(d
efcd
s)
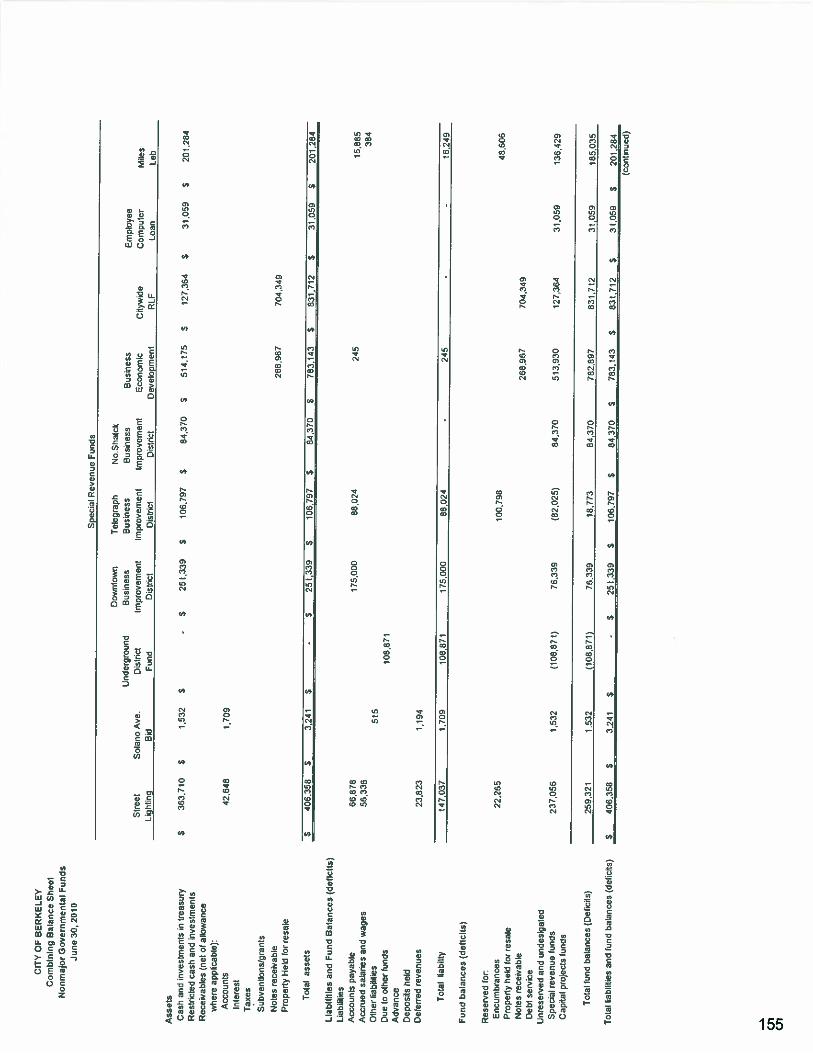
CIT
YO
FB
ER
KE
LE
YC
ombi
ning
Bal
ance
Shee
tN
on
maj
orG
ov
ern
men
tal
Fun
ds
Jun
e30
,20
10
Ass
ets
Cas
han
dIn
vest
men
tsin
trea
sury
Res
:rtt
edca
snan
dnv
estm
ents
Rec
eiva
bles
(net
ofal
ow
ance
whe
reap
pbca
ble)
:A
ccou
nts
Inte
rest
Tax
es
Subv
enti
onsl
gran
tsN
otes
rece
ivab
leP
rope
rty
Her
dfo
rre
sate
Tot
alas
sets
Lia
bili
ties
and
Fun
dB
alan
ces
(def
icit
s)L
iaba
ilies
Acc
ount
spa
yabl
eA
ccm
edsa
arle
san
dw
ages
Oth
erri
abiji
ties
Due
toot
her
fund
sA
dvan
ceD
epos
its
held
Def
erre
dre
venu
es
Tot
allia
bilit
y
Fun
dbal
ance
s(d
efic
its)
Res
erve
dfo
r:E
nc,d
,lbr
arrc
esP
rope
rty
heic
for
resa
leN
otes
rece
ivab
leD
ebt
serv
ice
Unr
eser
ved
and
unde
siga
ted
Spe
cial
reve
nue
fund
sC
apit
alpr
ojec
tsfu
nds
Tot
alfu
ndba
lanc
es(D
efic
its)
Spe
cial
Rev
enue
Fun
ds
Dow
ntow
nT
ele9
raph
No
Shat
clc
Und
ergr
ound
Bus
ines
sB
usin
ess
Bus
ines
sB
usin
ess
Em
ploy
eeS
tree
tS
otan
oA
ve.
Dis
tric
tIm
prov
emen
ttm
prov
emen
tIm
prov
emen
tE
cono
mic
City
aiid
eC
ompu
ter
Mile
sL
ight
ing
Bid
Fund
Dis
tric
tD
istr
ict
Dis
tric
tD
evel
opm
ent
RLF
Loa
nL
ab
S36
3.71
D$
15
32
$-
$25
’.33
9$
100.
797
$84
.370
$51
4.17
5S
127.
364
$31
.059
$20
1.28
4
42.6
481,
709
268,
967
704,
349
$40
6.35
8$
3241
$-
$25
1,33
9$
106,
797
$84
,370
$78
3,14
3$
831,/
12
$31
.059
$20
1.20
4
66.8
7817
5.00
088
,024
245
15,8
6556
.336
384
515
108,
871
23.8
231.
194
147.
037
1.10
910
8.87
117
5.00
088
.024
-24
5-
-16
.249
22.2
6510
0,79
848
,606
26B
,967
704.
349
237,
056
1,53
2(1
08,8
71)
76.3
39(8
2,02
5)84
,370
513.
930
127,
364
31.0
5913
6,42
9
259.
321
1,53
2(1
08,8
71)
16,3
3918
.773
84,3
7078
2,89
783
1.71
231
,059
185,
035
4D6.
35B
$3,
241
$-
S25
1.33
9$
108,
797
$84
,370
$78
3,14
3S
831,
712
$31
,059
$20
1,28
4(c
onti
nued
)
Tot
all:a
bilh
ies
and
fund
bala
nces
(de’
.cls
)$
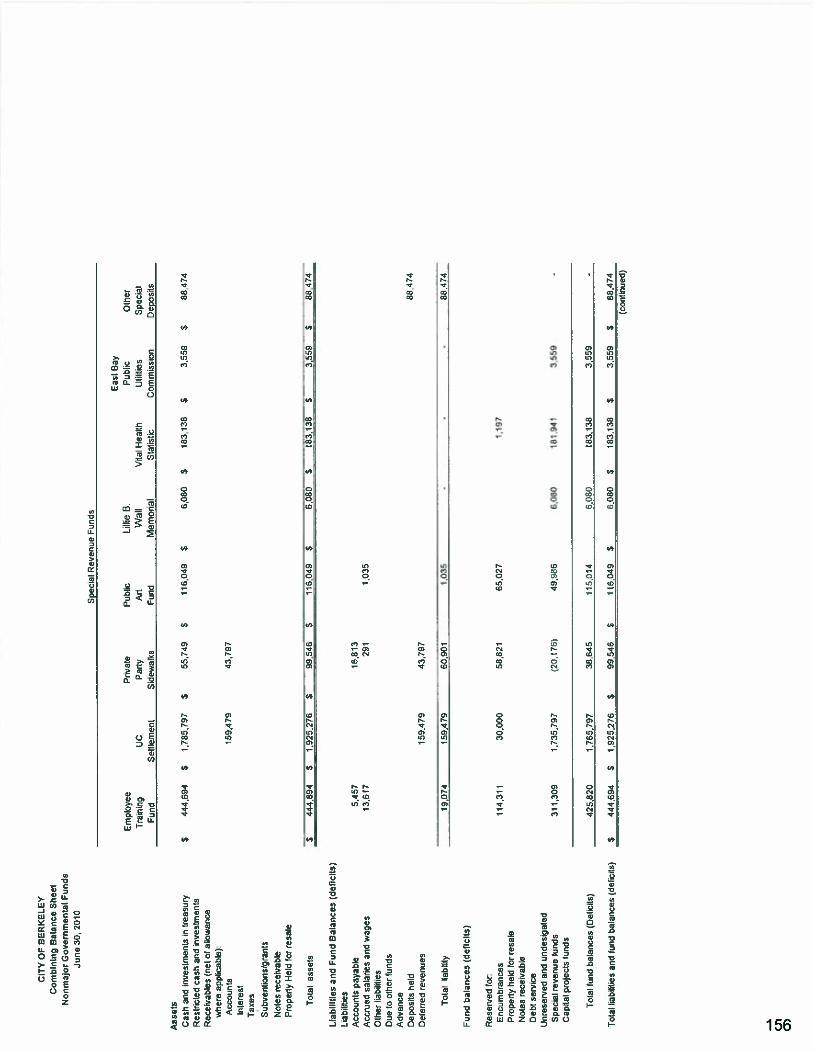
CIT
YO
FB
ER
KE
LE
YC
ombi
ning
Bal
ance
Shee
tN
onm
ajor
Go
ver
nm
enta
lF
un
ds
Jun
e30
,20
10
Ass
ets
Cas
han
dIn
vest
men
tsin
trea
sury
Res
tric
ted
cash
and
inve
stm
ents
Rec
eiva
bles
(net
ofat
owan
cew
here
appl
icab
le)
Acc
ount
sIn
tere
stT
axes
Sub
vent
ions
/gra
nts
Not
esre
ceiv
able
Pro
pert
yH
eld
for
resa
le
Tot
alas
sets
Lia
bili
ties
and
Fun
dB
alan
ces
(deF
icit
s)t.i
abil4
ies
Acc
ount
spa
yabl
eA
ccru
edsa
lari
esan
dw
ages
Oth
erlia
bilit
ies
Due
toot
her
fund
sA
dvan
ceD
epos
its
held
Def
erre
dre
venu
es
Tot
altia
brlit
y
Fun
dbal
ance
s(d
efic
its)
Res
erve
d‘o
r.E
ram
bra
ices
Pro
pert
yhe
ldfa
rre
sale
Not
esre
ceiv
abe
Deb
tsew
eU
nres
erve
dan
dur.
des
gat
edS
peci
alre
venu
etu
nas
Cap
ital
proj
ects
tuna
s
Tot
alfu
ndba
lanc
es(D
etic
its)
Spe
cial
Rev
enue
Fun
ds
Eas
tB
ay
Em
ploy
eeP
ryat
eP
ub
lLi
ilie
B.P
ua[o
CtN
erT
raih
gU
CPa
rty
AnW
ail
Via
:H
ealth
bull
ies
Spe
cial
Fund
Set
tlem
ent
Sld
ewar
4sFu
ncM
emon
ial
Sta
twtt
Com
mis
sion
ep
osi
ts
S44
4,69
4$
17
65
,79
7S
55,7
49S
116,
049
$6,
080
$18
3,13
8$
3.55
9$
88
47
4
169.
479
43,7
97
$44
4.69
4$
1.92
5.27
6$
99,5
46$
116,
049
$6,
080
$18
3.13
8$
3,55
9$
88
47
4
5,46
716
,813
13,6
1729
11.
035
88,4
741
59
,47
943
,197
19,0
74
I5
9,4
79
60,9
01
1,0
35
--
-8
8,4
74
114.3
11
30
,00
058,8
21
65,0
27
1,1
97
311,
309
1,73
5.79
7(2
0.1
76)
49.9
866.
080
181.
941
3,55
9-
425,
620
1,76
5,79
738
.645
115.
014
6.08
018
3,13
83.
559
-
Tot
allia
bitti
esan
dlu
ndba
lanc
es(d
etle
ils)
$44
4.69
4$
1.92
5,27
6S
99.5
45$
116,
C49
5.
6,08
0$
183.
138
$3.
559
$83
,474
(con
tilu
ed)
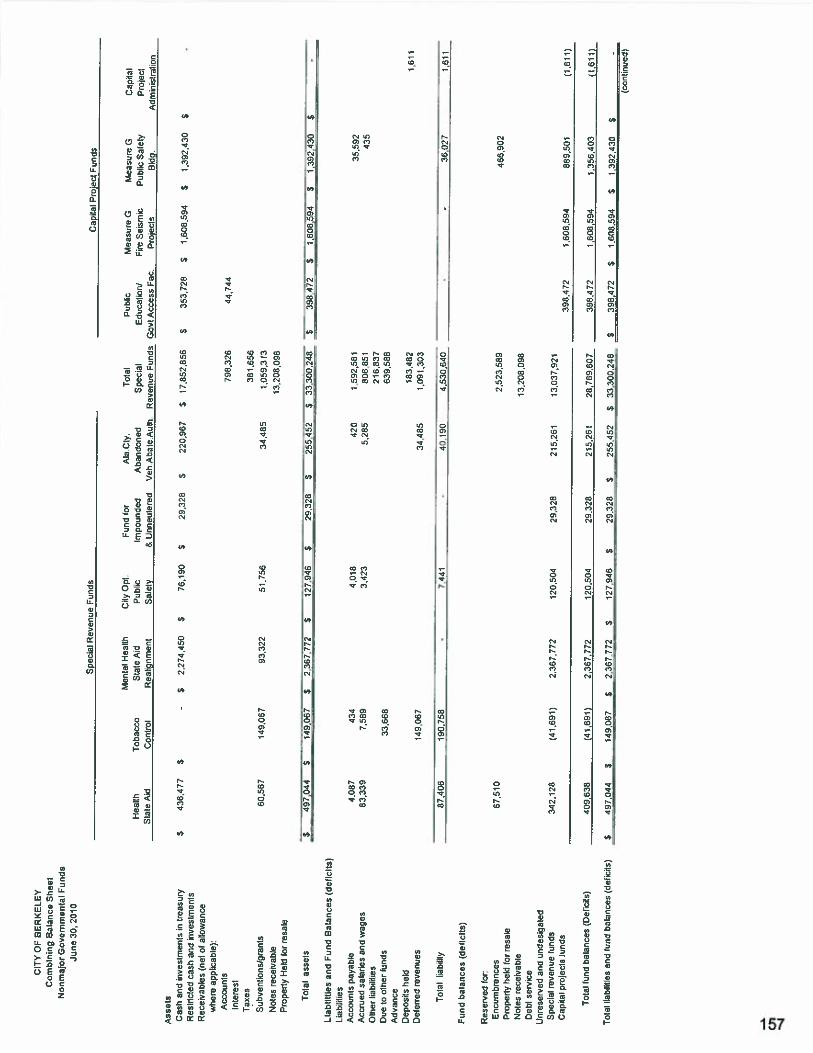
CIT
YO
FB
ER
KE
LE
YC
ombi
ning
Bal
ance
Sh
eet
Nonnaj
or
Go
ver
nm
enta
lF
un
ds
Jun
e30
,20
10
Spe
cial
Rev
enue
Fun
dsC
aoiia
lP
ro,e
ctru
nes
Ass
ets
Cas
han
dnv
estr
nent
sin
trea
sury
Res
trtr
odca
st,
and
nves
tmen
tsR
ecei
vabl
es(n
etof
aow
ance
whe
reap
pza
ble
):A
ccou
nts
Inte
rest
Tax
es
Sube
enli
ons/
gran
ts
Not
esre
ceiv
able
Pro
pert
yH
erd
for
resa
le
Tot
alas
sets
Lia
bili
ties
and
Fun
dB
alan
ces
(def
icit
s)L
ia’o
ht:e
sA
ccou
nts
paya
ble
Acc
rued
sa’a
ries
and
wag
esO
ther
l,ah
l,te
sD
ueto
othe
rfu
nds
Adv
ance
Deposts
herd
Def
erre
dre
venu
es
Tot
allia
bilit
y
Fun
dbal
ance
s(d
efic
its)
Res
erve
dfo
r:E
ncum
bran
ces
Pro
pert
yhe
ldfo
rre
sale
Not
esre
ceiv
able
Deb
tse
rvic
eU
nres
erve
dan
dun
desi
gate
dS
peci
alre
venu
efu
nds
Cap
rtal
proj
ects
Fund
s
Tot
alfu
ndba
lanc
es(D
etic
ils)
149,
067
$2.
367.
772
S12
7,94
629
,328
S25
5,45
2S
33,3
00,2
48S
398.
472
$1.
608,
594
S1.
392.
430
$
Men
tal
Hea
lthC
ityO
pt.
Fund
for
Ala
.Cty
.T
olal
Publ
icM
easu
reG
Mea
sure
GC
apit
alH
eath
Tob
acco
Sta
teA
idPu
blic
Impo
unde
dA
band
oned
Spe
cial
Edu
cati
on/
Fire
Sei
smic
Publ
icS
afet
yP
roje
ctS
tate
Aid
Con
trol
Rea
lign
men
lS
afej
y&
tjnn
eute
red
Veh
.Aba
te.A
uth.
Rev
enue
Fun
dsG
ovt
Acc
ess
Fac.
Pro
ject
sB
ldg.
Adm
inis
trat
ion
S4
35
,47
7$
-S
2,27
4,45
0S
16.1
90$
29.3
28S
220.
967
517
,652
.856
$35
3,72
8$
1,60
8,59
4S
392,
430
$
798,
326
44,7
44
301,
656
63,5
6714
9,06
793
,322
51,7
5634
,485
1,05
9,31
3
13.2
08.0
98
S49
7.04
4$
14
90
67
$2,
367,
772
$12
7.94
6$
29,3
28$
255.
462
$33
,300
,248
$39
8,47
2S
1,60
6,59
4$
1.39
2.43
0$
4.08
743
44,
018
420
1.59
2,58
135
,592
83.3
397.
589
3.42
35.
285
606
851
435
216
.837
33,6
6863
9.58
6
183,
482
1,61
114
9.06
734
,485
1,09
1.30
3
87,4
0619
0.75
8-
7,44
1-
40.1
904,
530.
640
--
36,0
271,
611
67.5
102,
523,
569
466,
902
13,2
08.0
98
342,
128
(41,
691)
2,36
7,77
212
0,50
429
.328
215,
261
13,0
37,9
2139
8,47
21.
608.
594
889,
501
(1,6
11)
409,
638
(41
.691
)2,
367,
772
120.
504
29,3
2821
5,26
126
,769
,601
398,
472
1,60
8,59
41
356,
403
(1,6
11)
Tot
a:lia
bilii
’es
and
Fund
bala
nces
(de”
ci:s
)$
49
70
44
(con
tinu
ed)
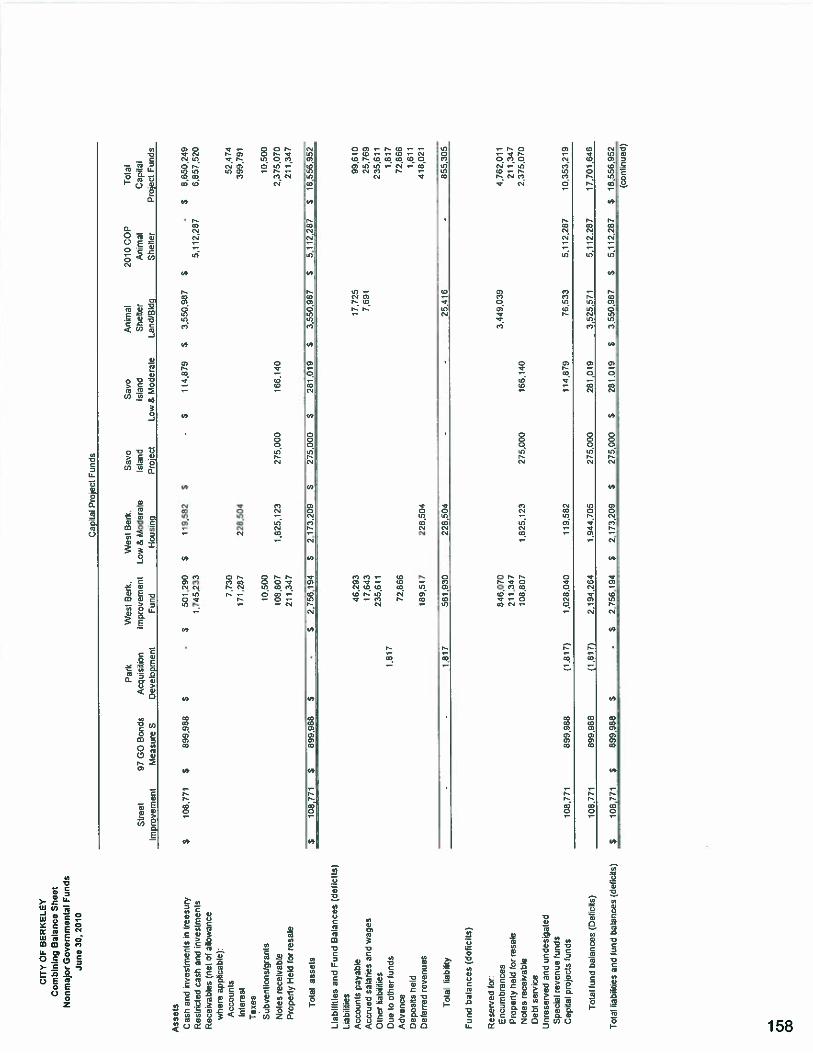
CIT
YO
FB
ER
KE
LE
YC
ombi
ning
Bal
ance
Shee
tN
onm
ajor
Go
ver
nm
enta
lF
un
ds
Jun
e30
.20
10
Ass
ets
Cas
han
din
vest
men
tsin
trea
sury
Res
tric
ted
cash
and
inve
stm
ents
Rec
eiva
bles
(net
ofal
low
ance
whe
reap
phca
ble)
:A
ccou
nts
Inte
rest
Tax
es
Sc
bven
tion
slgr
ants
Not
esre
ceiv
abte
Pro
pert
yH
eld
for
resa
le
Tot
alas
sets
Lia
bili
ties
and
Fun
dB
slan
cos
(def
icit
s)L
iabi
l4ie
sA
ccou
nts
paya
ble
Acc
njed
sala
ries
and
wag
esO
ther
liabi
litie
sD
ueto
othe
rfu
nds
Adv
ance
Dep
osil
she
ldD
efer
red
reve
nues
Tot
allia
bilit
y
Fun
dbal
ance
s(d
efic
its)
Res
erve
dfo
r:E
ncum
bran
ces
Pro
pert
yhe
ldfo
rre
sale
Not
esre
ceiv
able
)eo
tse
rv.C
e
Unre
serv
ed
and
undes.
gate
d
Spec
ial
rev
en
ue
funds
Cap
ital
pro
;ect
sfu
nd
s
Tot
alfu
nd
ba’a
nces
(Del
ic’i
ts)
Cap
tat
Pro
ject
Funds
Par
kW
est
Ber
tc.
Wee
:B
ent
Sav
oS
avo
Anit
a20
10C
OP
Tot
a!
S’s
eet
97G
OB
onds
Acq
u.sd
ion
lmpr
ovem
eni
Low
&M
oder
a:e
Isia
nc‘s
iand
Sh
eter
An
mal
Cap
ital
.rnp
rove
men
tM
easu
reS
Dev
e’cp
rnen
tFu
ndH
ousn
gP
ro
1ecl
Low
&M
oder
ate
Lad
’3ld
qS
het
erP
role
ctF
uncs
510
8,77
1$
899,
988
$-
$50
1,29
0$
119,
582
$$
114,
879
$3,
550,
987
$-
$8,
650,
249
1.74
5,23
35,
112,
287
6,85
7,52
0
7,73
052
,474
171287
228,
504
399.
791
10,5
0010
.500
108,
807
1.82
5.12
327
5,00
016
6,14
02375.0
70
211,
347
211.
347
S10
8,77
1$
899.
988
$-
$2,
756.
194
$2,
173209
$27
5.00
0$
281.
019
$3.
550.
987
$5,
112,
287
$ia
,sS
’ET
46,2
93I7
,725
99,6
10I7
,643
7,69
125
,769
235.
611
235,
611
1,31
71.
817
72,8
6672
.866
1,61
118
9,51
722
8,50
441
8,02
1
.-
1.81
756
1.93
022
8.50
4-
-25
.416
‘85
6.30
5
846,
070
3,44
9,03
94.
762.
011
211,
347
211,
341
138.
837
1,82
5,12
321
5.00
016
6.14
02,
315,
070
108,
771
899,
988
(1.8
17)
1028
,040
119.
582
114.
879
76.5
335,
112.
287
10,3
53.2
19
108.
771
599.
988
(l,8
1T)
2,19
4.26
41,
944,
705
275,
000
281.
019
3.52
5.57
15.
112.
287
17,7
01,6
46
899
988
$$
2.75
6.19
4$
2,17
3,20
9$
275,
000
$26
’.0
19S
3,55
0,98
7S
5.11
2.28
7$
18,5
56,9
52(c
031’
nued
)T
otal
Ilebi
litie
san
dtu
rdba
ler.
ces
(det
’icd
s)$
105,7
71$
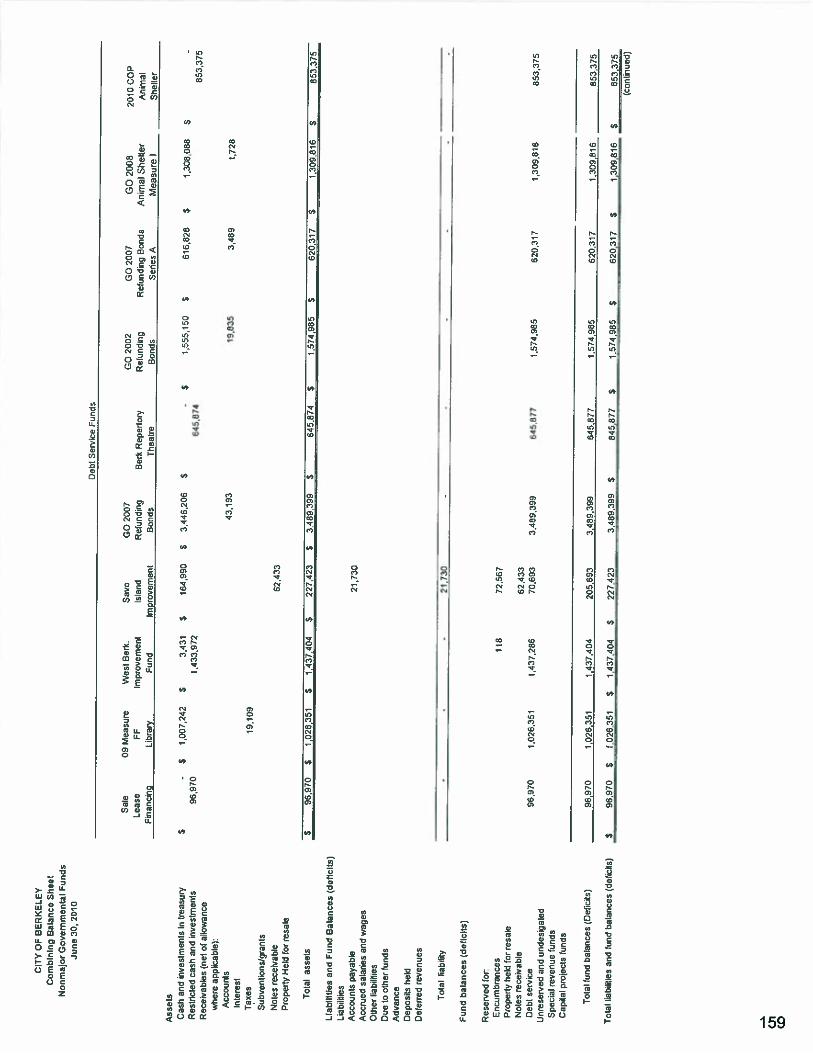
CIT
YO
FB
ER
KE
LE
YC
ombi
ning
Bal
ance
Sh
eer
Non
maj
orG
ov
ern
men
tal
Fun
ds
Jun
e30
,20
10
Ass
ets
Cas
han
din
vest
men
tsin
trea
sury
Res
inct
edca
sY’.
and
nves
tmen
tsR
ecei
vabl
es(n
etof
allo
wan
cew
here
appl
icab
le):
Acc
ount
sIn
tere
stT
axes
Subv
enti
ons!
gra
nts
Not
esre
ceiv
able
Pro
pert
yi’t
eid
for
resa
’e
Tot
alas
sets
Lia
bili
ties
and
Fun
dB
alan
ces
(def
icit
s)L
iabi
litie
sA
ccou
nts
paya
ble
Acc
rued
sala
des
and
wag
esO
ther
liabi
tties
Due
toot
her
fund
sA
dvan
ceD
epos
its
heki
Det
erre
dre
venu
es
mis
t:ia
b1ily
Fun
dbal
ance
s(d
efic
its)
Res
erve
dfo
r:E
ncum
bran
ces
Pro
perl
yhe
ldfo
rre
sale
Not
esre
ceiv
able
Deb
tse
rve
unre
serv
edan
dun
desi
gate
dS
peci
alre
venu
efu
nds
Cap
ita
proj
ects
fund
s
Tot
alfu
ndba
lanc
es(D
efic
its)
Deb
tS
ervi
ceF
unds
Sal
e09
Mea
sure
Wes
tB
erk.
Sav
oC
C20
07C
C20
02C
C20
07G
O2D
0820
10C
OP
Lea
seFF
Impr
ovem
ent
Isla
ndR
efun
ding
Ber
kR
eped
ory
Ret
undi
ngR
efun
ding
Bon
dsA
nim
alS
hel
ter
Ani
mal
Fin
anci
ngL
ibra
ryFu
ndtm
prcv
emen
tB
onds
The
atre
Bon
dsS
erie
sA
Mea
sure
IS
hell
er
S-
$1,
007,
242
$3.
431
$16
4.99
0$
3.44
6,20
6$
-$
1,55
5.15
0$
61
68
28
$1.
308.
088
$-
96.9
70,4
33.9
7264
5,87
485
3,37
5
43.1
9319
,835
3,48
01,
728
19,1
09
62,4
33
1’
96,9
70$
102
6,35
1$
1437,4
04
$22
7.42
3$
34
89
,39
9$
645,
874
$1.
574,
985
S62
0,31
7$
1,3
09616
$85
3,37
6
21,7
30
--
-21
,730
--
--
--
118
72.5
67
62,4
3396970
1,02
6,35
11,
437,
286
70.6
933,
489,
399
54
55
77
1.57
4.98
562
0,31
71,
309,
816
853,
375
96.9
701,
026,
351
1,43
7,40
420
5,69
33,
480,
399
645,
877
1574
,995
620,
317
1.30
9.81
685
3,37
5
$96
,970
$1,
026,
351
$1,
437,
404
$22
7,42
33,
489,
399
$64
5,87
7$
1,57
4,98
5$
620,
317
S1,
309,
816
$85
3,37
5(c
onti
nued
)
Tot
allia
bilit
ies
and
fund
bala
nces
(def
icits
)
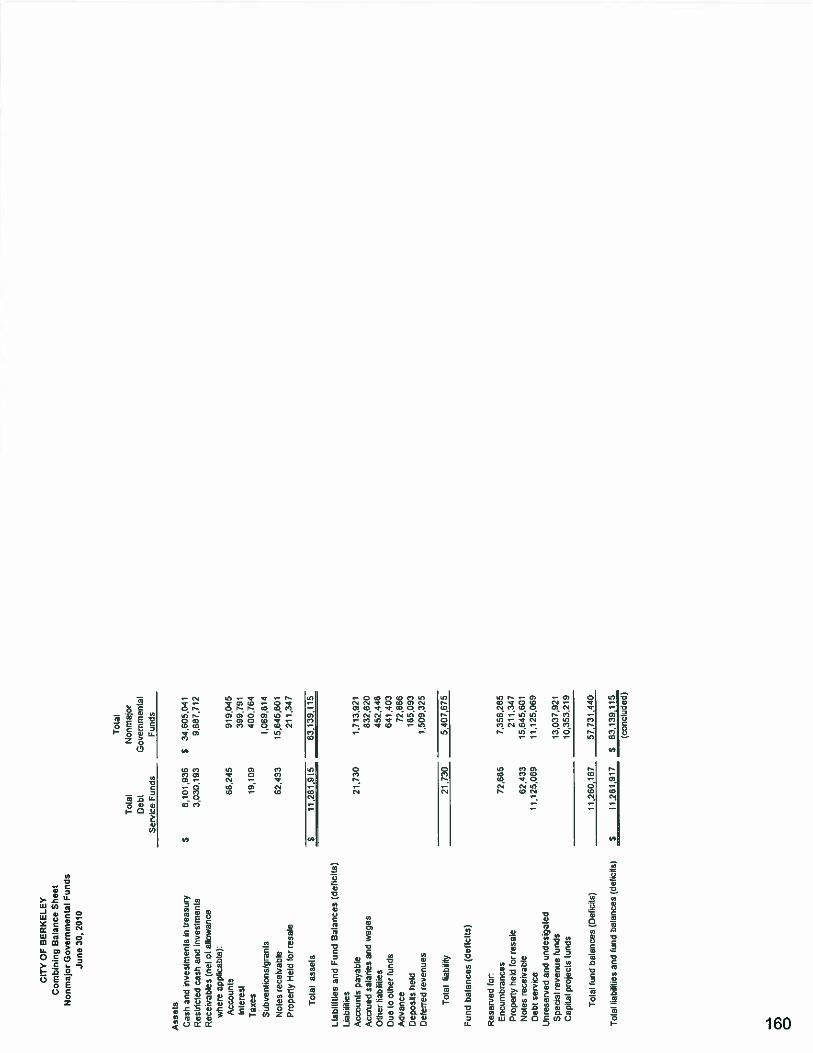
CIT
YO
FB
ER
KE
LE
YC
ombi
ning
Bal
ance
Sh
eel
No
nm
ajo
rGo
ver
nm
enta
lF
unds
Jun
e30
,20
10
Tot
alT
otal
No-
maj
orD
ebt
Gov
ernm
enta
lS
ervi
ceF
unds
Fun
os
Ass
eta
Cas
han
din
vest
men
tsin
lrea
sury
$8
10
1.9
36
$34
.605
,041
Res
tric
ted
cash
and
inve
stm
ents
3.03
0,19
39,
887.
712
Rec
eiva
bles
(net
ofal
low
ance
whe
reap
plic
able
):A
ccou
nls
60,2
45919045
Inte
rest
3997
91
Tax
es19
,109
400,
764
Sub
venl
ions
/gra
nts
1069
,614
Not
esre
ceiv
a3
62,4
3315
,645
,601
Pro
pert
yH
eld
forre
sa
1e2
11
34
7
Tot
alas
sets
$11
,281
,915
63,1
39.1
15
Lia
bili
ties
and
Fun
dB
alan
ces
(def
icit
s)Li
ab,i
eee
Acc
ount
spa
yabl
e21
,730
1,71
3,92
1A
ccru
edsa
lanes
and
wag
es83
2,62
0
Oth
erlia
bdili
es45
2,44
8
Due
toot
her
fund
s64
1,40
3
Adv
ance
72,8
66
Dep
osit
she
ld18
5,09
3
Def
erre
dre
ven
ues
1.50
9.32
5
Tot
alla
bilit
y21
.730
5,40
7,67
5
Fun
dbat
ance
s(d
efic
its)
Res
erve
dfo
rE
ncum
bran
ces
72.6
857,
358,
285
Pro
perl
yhe
ldfo
rre
sale
211,
347
Not
esre
ceiv
able
62,4
3315
,645
.601
Deb
tse
rvce
1.1
25,0
6911
,125
,069
Unr
eser
ved
and
unce
siga
ted
Spe
cial
reve
nue
fund
s13
,037
,921
Cap
ital
proj
ects
fund
s10
,353
,219
Tot
alfu
ndba
lanc
es(D
efic
its)
11,2
60,1
8757
,731
.440
Tot
allia
bilit
ies
and
fund
bala
nces
(def
icits
)$
11,2
81,9
17$
83,1
39,1
15(c
oncl
uded
)

CIT
YO
FB
ER
KE
LE
YC
om
bin
ing
Sta
tem
ent
ofR
even
ues
,E
xp
end
itu
res,
and
Chan
ges
inF
un
dB
alan
ces
(Def
icit
s)N
onM
ajor
Go
ver
nm
enta
lF
unds
For
the
yea
ren
ded
June
30,
2010
Spe
cial
Rev
enue
Fun
ds
Spe
cial
Wor
kfor
ceS
EC
106
CA
Hou
sing
Oilm
anP
aram
edic
Tie
back
Dcm
Vio
Ass
etT
axfc
rIn
vest
men
tH
UD
Loa
nF
inan
ceS
port
Ani
mal
Ass
essm
ent
Miti
galio
nP
reve
ntio
nF
orfe
itur
eD
isab
led
Act
Gra
ntA
sst.
Age
ncy
Fiel
dS
hell
erD
istr
ict
R-O
-WV
iS
tat
Rev
enues
Tax
es$
-S
892,
129
$-
-$
-$
-$2327792
$-
$-
Lic
ense
and
perm
its
Inte
rgov
ernm
enta
l15
0090
Cha
rges
for
se-v
ice
98,0
0008
,434
Fin
esan
dpe
nalt
ies
38,5
50R
ents
and
roya
ltie
sP
riva
teco
ntri
buti
ons
and
dona
tion
s39
,199
Inve
stm
ent
inco
me
83
56
5M
isce
llan
eous
38
55
089
2.12
9
__
__
__
__
__
__
83.5
65-
150,
000
39,1
992
32
7,7
92
98,0
0038
,434
512
.804
31,5
7812
,717
6,23
72.
870,
414
69,0
5076
,421
777,
672
46,4
9615
1,19
62,
202
168
CCC
51,1
38
6,24
279
0.47
647
,692
22
,fj,
,-
-3
15
78
2,88
3,13
169
.050
78.4
21
Exc
ess(
defi
cien
cy)
ofre
ven
ues
over
(und
er)
expe
ndit
ures
32,3
0810
1,65
3(4
7.69
2)(1
37.7
90)
____________
150,
000
7,62
1,,
__
j55
5,3
39
)26
,950
43,6
8149
0,18
6(1
0712)
6,CC
C,00
0
-43
,681
6,00
0.00
0-
--
‘179
,’174
--
32,3
0810
1,65
3(4
.011
)5,
862,
210
150,
000
7,62
1(7
5,66
5)28
,950
(39,
987)
175,
366
367,
104
4.34
25.
958.
520
648,
619
3,00
075
,935
(235
,347
)11
0,26
43,
847
$23
7.67
5S
468,
757
$33
1$
11,8
20,7
31S
648,
519
$15
3,C
CO
$83
,556
$(3
11,2
12)
$13
9.21
5,_
Jp
JQ
(contn
uea
)
Tot
alre
ven
ues
Exp
endi
ture
sC
urre
ntG
enel
atgo
vern
men
tPu
b!ic
safe
tyH
ighw
ayan
dst
reet
sH
ealt
han
dw
elfa
reC
uttu
re-r
ecre
atio
nC
omm
unit
yde
velo
pmen
tan
dho
usin
gE
cono
mic
deve
lopm
ent
Deb
tse
rvic
e:P
rinc
ipal
reoa
yrne
ntIn
Iere
san
dfs
cal
char
ges
Cos
tof
Issu
ance
Cap
ital
outla
y:H
ighw
ayan
dst
reet
sC
omm
unit
yde
velo
pmen
tan
dhcu
sng
Tot
alex
pend
itur
es
Oth
erfi
nanc
ing
sourc
es(u
ses)
:T
rans
fers
inT
rans
fers
out
Issu
ance
oflo
anIs
suan
ceof
cert
ific
ates
ofpa
rtic
ipat
ion
Pre
miu
mon
cert
ific
ates
o’pa
-tic
.pat
ion
Sa:
e0
!za
p;ta
Ias
sets
Tot
alot
her
fina
ncin
gso
urc
es(u
ses)
Net
chan
gein
fund
bal
ance
s
Fun
dbal
ance
s(d
efic
its),
Jun
e30
.20
09as
rest
ated
Fun
dbal
ance
s(O
efci
ts),
Jun
e30
,20
10
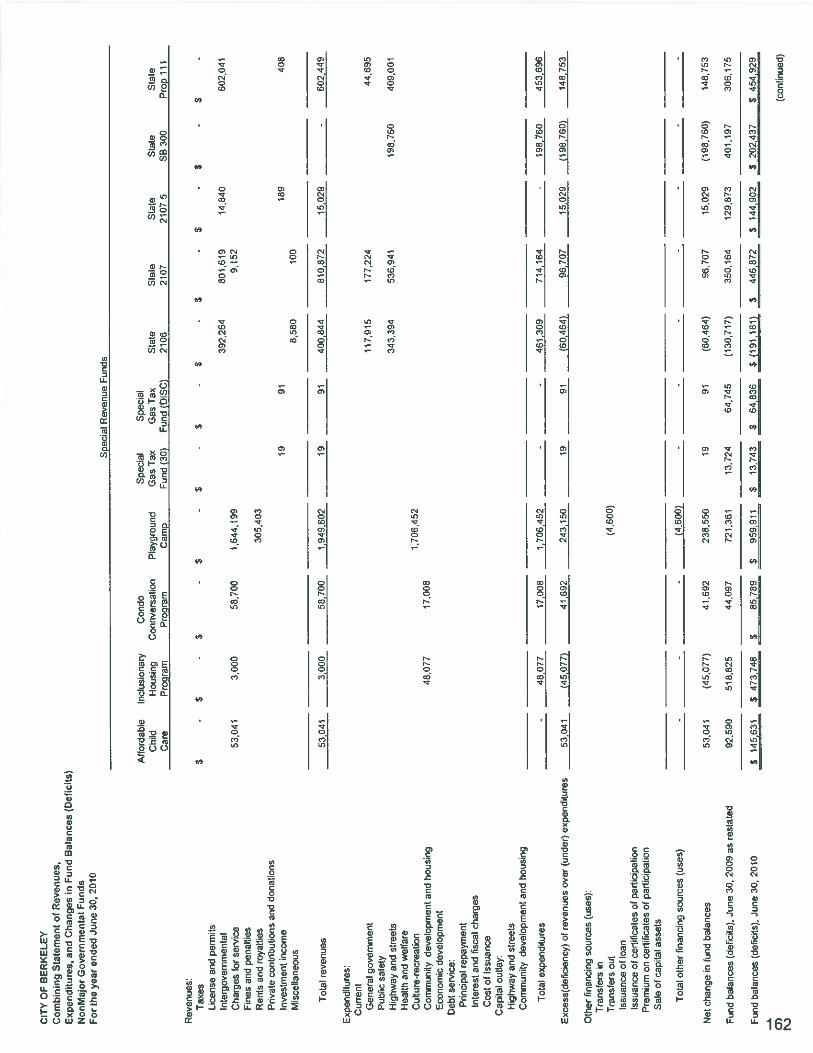
CIT
YO
FB
ER
KE
LE
YC
om
bin
ing
Sta
tem
ent
ofR
even
ues
,E
xp
end
itu
res,
and
Chan
ges
inF
un
dB
alan
ces
(Def
icit
s)N
onM
ajor
Go
ver
nm
enta
lF
unds
For
the
yea
ren
ded
June
30,
2010
Rev
enues
Tax
esL
icen
sean
dpe
rmit
sIn
terg
over
nmen
tal
Cha
rges
far
serv
ice
Fin
esan
dpe
nalt
ies
Ren
tsan
dro
yalt
ies
Pri
vate
cont
ribu
tion
san
ddo
nati
ons
Inve
stm
ent
inco
me
Mis
cell
aneo
us
Tot
alre
ven
ues
Exp
endi
ture
s:C
urre
ntG
ener
algo
vern
men
tP
ubli
csa
fety
Hig
hway
and
stre
ets
Hea
lth
and
wel
fare
Cul
ture
-rec
reat
ion
Com
mun
ity
deve
lopm
ent
and
hous
ing
Eco
nom
icde
velo
pmen
tD
ebt
serv
ice:
Pri
ncip
alre
paym
ent
Inte
rest
and
fisc
alch
arg
esC
ost
ofIs
suan
ceC
a&ta
.ou
tlay
Hig
hway
and
stre
ets
Com
mun
ity
dev
elcp
r-en
tan
cno
usin
g
Tot
alex
pen
dtu
res
Exc
ess(
defi
cien
cy)
otre
ven
ues
over
(und
er)
expe
ndit
ures
Oth
erfi
nanc
ing
sourc
es(u
ses)
Tra
nsfe
rsin
Tra
nsfe
rsou
tIs
suan
ceat
loan
Issu
ance
ofce
’lif
icat
esof
part
icip
atio
nPr
emiu
mon
cert
ific
ates
ofpa
rtic
ipat
ion
Sal
eof
capta
las
sets
Tot
alot
her
fina
ncin
gso
urc
es(u
ses)
Net
chan
gein
fund
bal
ance
s
Fun
dbal
ance
s(d
efic
ils),
Jun
e30
,20
09as
rest
ated
Fun
dbal
ance
s(d
efic
its).
June
30.
2010
Spe
cial
Rev
ej,u
eF
unds
Atl
orda
bie
Incl
usio
nary
Con
doS
peci
aS
oeci
alC
hild
Hou
sing
Con
rive
rsat
,on
Pla
yoro
ur.d
Gas
Tax
Gas
Tax
Sla
teS
late
Sta
teS
tate
Sta
teC
are
Pro
gram
Pro
gram
Cam
pF
und
(30)
Fun
d(D
ISC
)21
0621
072
10
75
SB30
0P
rop
111
$-
$-
$-
$-
$-
$-
$-
$.
S-
$-
$-
392264
801,
619
14,8
4060
2,04
153
,041
3,00
058
,700
1,64
4,19
99,
152
305.
403
1991
189
408
8,58
010
0
5304
13,
000
58,7
001949.6
02
1991
400,
844
810,
872
15,0
29-
60
24
49
117,
915
177,
224
44,6
95
343,
394
536,
941
198.
760
409,
001
1,70
6,45
248
,077
17,0
08
-46
.077
17.0
081.
706.
452
--
461,
3C9
714,
164
-19
5,76
045
3,69
6
53
,04
1(4
5.07
7)41
692
243
150
19
91(6
0.46
4)96
.707
15.0
29(1
95.7
60)
148.
753
(463
3)
--
-(4
,600
)-
--
--
--
53,0
41(4
5.07
7)41
,692
238.
550
1991
(60,
464)
96,7
0715
,029
(190
,760
)14
8,75
3
92.5
9051
8,82
544
,097
721.
361
13,7
2464
,745
(130
,717
)35
0,16
412
9,87
340
1,19
730
6,17
5
514
5,63
1$
473.
748
$85
.789
$95
9,91
1$
13.7
43564jl
36
$(1
91.1
81)
$44
6,87
2$
14
4,9
02
$202437
$45
4,92
9
(con
tinu
ed)
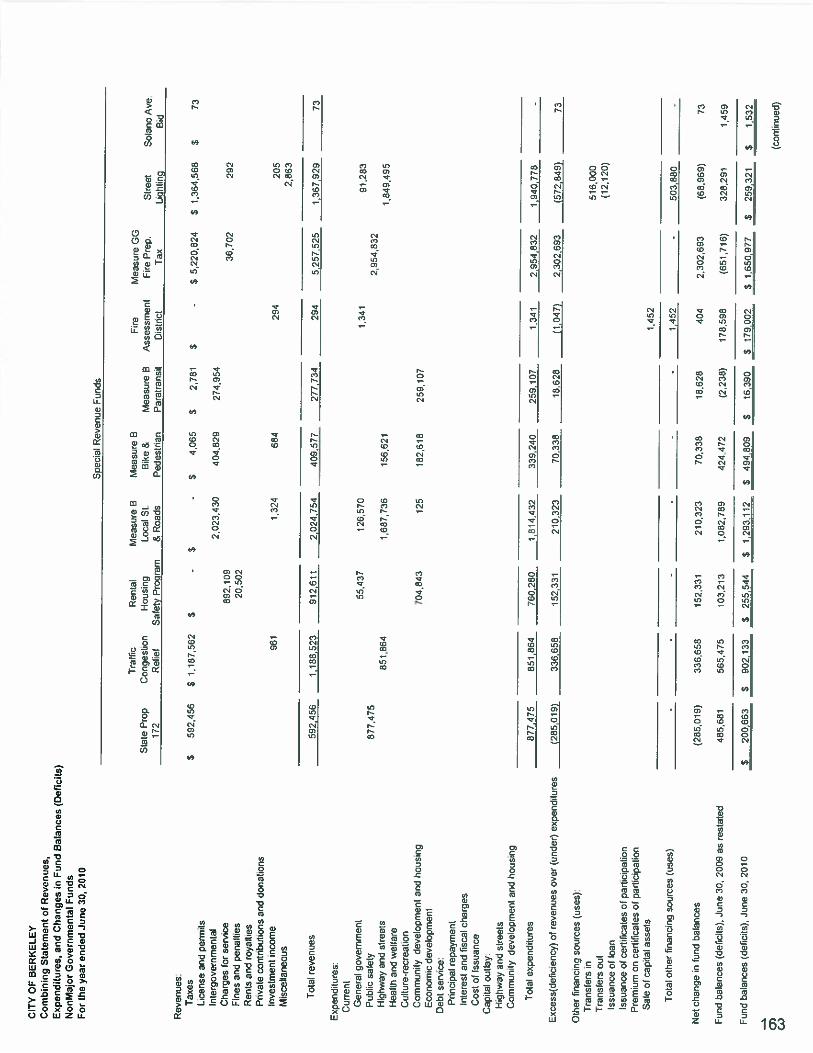
CIT
YO
FB
ER
KE
LE
YC
om
bin
ing
Sta
tem
ent
ofR
even
ues
,E
xp
end
itu
res,
and
Ch
ang
esin
Fu
nd
Bal
ance
s(D
efic
its)
Non
Maj
orG
ov
ern
men
tal
Fund
sF
orth
eyea
rended
June
3020
10
Soe
cial
Rev
enue
Fun
ds
Tra
ffic
Ren
lal
Mea
sure
BM
easu
reB
Fire
Mea
sure
GO
Sta
teP
rop
Con
gest
ion
Hou
sing
Loc
alSt
.B
ike
&M
easu
reB
Ass
essm
ent
Fire
Pre
p.S
tree
tS
olan
oA
ve.
172
Rel
ief
Saf
ely
Pro
gram
&R
oads
Ped
estr
ian
Par
atra
nsit
Dis
tric
tT
axL
jgn
gB
id
Tot
alre
ven
ues
Exp
endi
ture
s:C
urre
ntG
ener
algo
vern
men
tP
ubli
csa
lety
Hig
hway
and
stre
ets
Hea
lth
and
wel
fare
Cul
ture
-rec
reat
ion
Com
mun
ity
deve
lopm
ent
and
hous
ing
Eco
nom
icde
veio
pmen
tD
ebt
serv
ice:
Pri
ncip
alre
paym
ent
Inte
rest
and
fisc
alch
arg
esC
ost
ofIs
suan
ceC
apit
alou
tlay:
Hig
hway
and
stre
ets
Com
mun
ity
deve
lopm
ent
and
hous
ing
Tot
alex
pend
ilur
es
Rev
enue
s:T
axes
$59245
6$
1187
.562
$-
$-
$4,
065
$2,
751
$-
$5,
220,
824
$1.
364,
568
$73
Lic
ense
and
perm
its
inte
rgov
emm
enta
l2,
023.
430
404,
529
274,
954
Cha
rges
for
serv
ice
802,
109
36,7
0229
2F
ines
and
pena
ltie
s20
,502
Ren
tsar’
roy
atie
sP
riva
teco
ntri
buti
ons
and
cor,
atic
nsIn
vest
men
tin
com
e95
11,
324
684
294
205
Mis
cell
aneo
us2,
863
592,
456
1,18
8,52
391
2,61
12,
024,
754
409,
577
277,
734
294
5,25
7,52
51,
367,
929
73
55,4
3712
6,57
01,
341
91,2
8387
7,47
52,
954,
532
851,
864
1,68
7,73
615
6,62
11,
849,
495
704,
843
125
182,
618
259,
107
877,
475
851,
864
760,
280
1,81
4.43
233
9,24
025
9,10
71,
341
2.95
4,83
2:9
40.7
78
-
Exce
ss(d
efie
ncy
)of
rev
enu
esov
er(u
nder
)ex
pend
itur
es(2
85.0
15)
336,
658
152.
331
210,
323
70.3
3818
.528
ç’,0
47)
2,30
2,69
3(5
72,8
49)
73
516,
000
(12,
120)
1,45
2
--
--
--
1,45
2-
503,
880
-
(285
,019
)33
3.65
815
2,33
121
0,32
370
,338
18,6
2840
42,
302,
693
(68,
969)
73
485,
681
565,
475
103,
213
1.08
2,78
942
4.47
2(2
,238
)17
8,59
8(6
51,7
16)
328.
291
1,45
9
$20
0,66
3$
902,
133
$25
5,54
4S
1,2
93112
5494509
$6.
390
517
9.00
2$1
MS
O97
7$
259,
321
$1,
532
(con
tinu
ed)
Oth
erfi
nanc
ing
sourc
es(u
ses)
:T
rans
fers
inT
rans
fers
out
Issu
ance
oflo
anIs
suan
ceof
cert
itic
ates
ofpa
rtic
ipat
ion
Pre
miu
mon
cert
ific
ates
ofpa
rtic
ipat
ion
Sal
eof
capi
tal
asse
ts
Tot
alot
her
fina
ncin
gso
urc
es(u
ses)
Net
chan
gen
‘uno
oat
ance
s
Fuid
bal
ance
s(d
efic
its)
,Ju
ne
30,
2009
asre
stat
ed
Fun
dbal
ance
s(d
efic
ts),
Jun
e30
.20
10
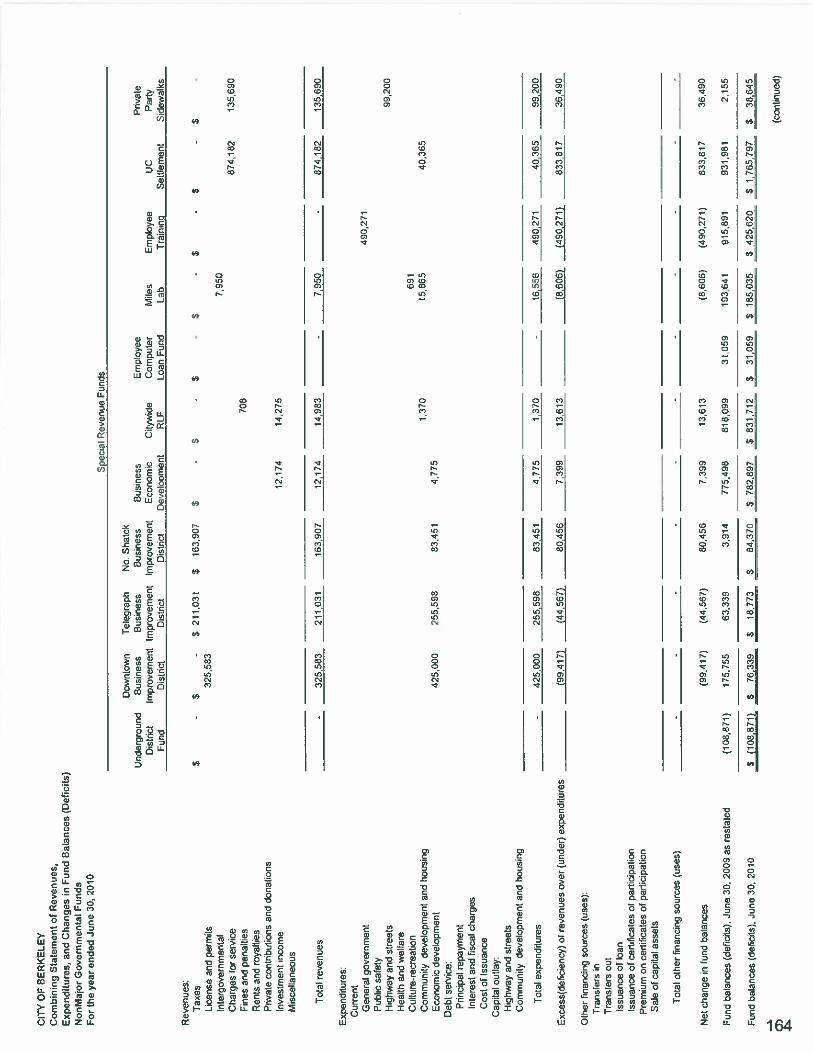
CIT
YO
FB
ER
KE
LE
YC
om
bin
ing
Sta
tem
ent
ofR
even
ues
,E
xp
end
itu
res,
and
Ch
ang
esin
Fu
nd
Bal
ance
s(D
efic
its)
Non
Maj
orG
ov
ern
men
tal
Funds
For
the
yea
ren
ded
Jun
e30
,20
10
Rev
enue
s:T
axes
Lic
ense
and
perm
its
Inte
rgov
ernm
enta
lC
harg
esfo
rse
rvic
eF
ines
and
pena
ltie
sR
ents
and
roya
ltie
sP
riva
teco
ntri
buti
ons
and
dona
tion
sIn
vest
men
tin
com
eM
isce
llan
eous
Tot
alre
ven
ues
Exp
endi
ture
s:C
urre
ntG
ener
algo
vern
men
tPu
blic
safe
tyH
ighw
ayan
dst
reet
sH
ealt
han
dw
elfa
reC
ultu
re-r
ecre
atio
nC
omm
unit
yde
velo
pmen
tan
dho
usin
gE
cono
mic
deve
lopm
ent
Deb
tse
rvic
e:Pr
inci
pal
repa
ymen
tIn
tere
stan
dfi
scal
char
ges
Cos
tof
Issu
ance
Cap
ital
outla
y:H
ighw
ayan
dst
reet
sC
omm
unit
yde
velo
pmen
tan
dho
usin
g
Tct
alex
pend
itur
es
Oth
erfi
nanc
ing
sourc
es(u
ses)
:T
rans
fers
inT
rans
fers
out
Issu
ance
oflo
anIs
suan
ceof
cert
ific
ates
ofpa
rtic
ipat
ion
Pre
miu
mon
cert
ific
ates
ofpa
rtic
ipat
ion
Sal
eof
capi
tal
asse
ts
Tot
alot
her
fina
ncin
gso
urc
es(u
ses)
Net
chan
gein
fund
bal
ance
s
Fun
dba
lanc
es(d
efic
its)
,Ju
ne
30.
2009
asre
stat
ed
Fun
dbal
ance
s(d
efic
its),
Jun
e30
.20
10
Spe
cial
Rev
enue
Fun
ds
Dow
ntow
nT
eleg
raph
No
Sha
tck
Und
ergr
ound
Bus
ines
sB
usin
ess
Bus
ines
sB
usin
ess
Em
ploy
eeP
riva
teD
istr
ict
Impr
ovem
ent
Impr
ovem
ent
Impr
ovem
ent
Eco
nom
icC
itvid
eC
ompu
ter
Mite
sE
mpl
oyee
UC
Par
tyFu
ndD
istr
ict
Dis
tric
tD
istn
ctD
evel
opm
ent
RLF
Loa
nF
und
Lah
Tra
inin
gS
ettl
emen
tS
idew
alks
$-
$-
$211,0
31
$16
3,90
7$
-$
-$
-$
-$
-$
-$
-
325583
7950
87
41
82
135690
708
12,1
7414
.275
-32
5,58
321
1,03
116
3.90
712
,174
14.9
83-
7.95
0-
874,
182
135.
690
490.
271
99,2
00
691
1,37
015
,865
40.3
6542
5,00
025
5,59
883
.451
4,77
5
-42
5.00
025
5.59
883
,451
4,77
51,
370
-16
,556
490.
271
40365
99,2
00
Exc
ess(
defi
cien
cy)
ofre
ven
ues
over
(und
er)
expe
ndit
ures
__
__
__
__
__
_
.J!I
Z)_
(44,
567)
60,4
567.
399
13,6
13
___________
(6,6
06)
(490
,271
)83
3.81
736
,490
(99,
417)
(44,
567)
80,4
557,
399
13,6
13(8
,606
)(4
90,2
71)
833,
817
36,4
90
(108
,871
)17
5.75
563
.339
3,91
477
5.49
881
8,09
931
,059
193,
641
915,
891
931,
981
2,15
5
$(1
08,8
71)
$76
,339
$18
.773
$54
,370
$78
2,89
7$
831,
712
$31
.059
$185035
$42
5,62
0$
1,76
5,79
7$
38,6
45
(con
tinu
ed)
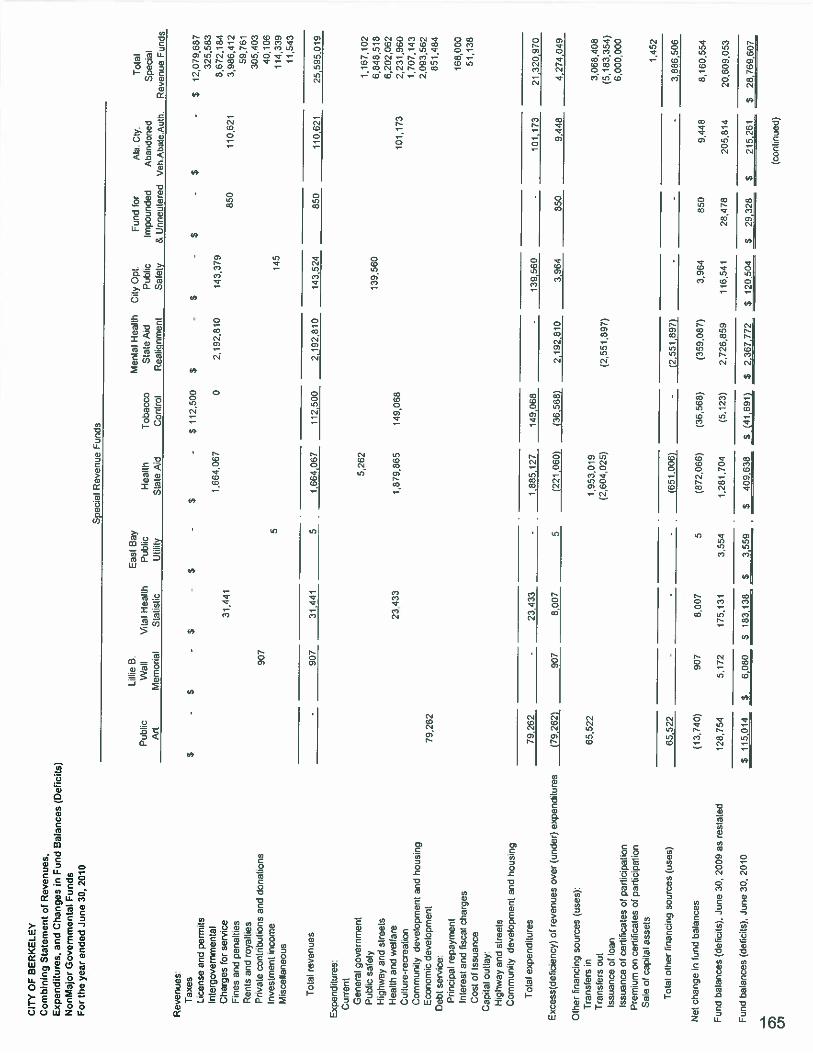
CIT
YO
FB
ER
KE
LE
YC
om
bin
ing
Sta
tem
ent
ofR
even
ues
,E
xp
end
itu
res,
and
Chan
ges
inF
un
dB
alan
ces
(Def
icit
s)N
onM
ajor
Go
ver
nm
enta
lF
unds
For
the
yea
ren
ded
June
30,
20W
Spe
cial
Rev
enue
Fun
ds
Lilli
eB,
Eas
tB
ayM
enta
lH
ealt
hC
ityO
pt.
Fun
dfo
rA
la.
dy
,T
otal
Pub
lic
Wal
lV
ital
Hea
lth
Publ
icH
ealt
hT
obac
coS
tate
Aid
Pub
lic
Impo
unde
dA
band
oned
Spe
cial
NI
Mem
oria
lS
tats
icIJ
tliiv
Sta
teA
dC
ontr
olR
ealg
nm
ent
Sat
ety
&U
nneu
lred
Veh
Aba
le.A
uln
Rev
enue
Fun
ds
Rev
enues
Tax
es$
-S
-$
-$
-$
-$112,5
00
$-
$-
$-
$-
$12,0
79,6
87
Lic
ense
and
oerm
its
325,
583
Inte
rgov
ernm
enta
l1,
664,
067
02,
192,
810
143,
379
8,67
2,18
4C
harg
esfo
rse
rvic
e31
,441
850
1106
213
,98
64
12
Fin
esan
dpe
nalt
ies
59,7
61R
ents
and
roya
ltie
s30
5,40
3P
riva
teco
ntri
buti
ons
and
dona
tion
s90
740
,106
Inve
stm
ent
inco
me
5145
114,
339
Mis
cell
aneo
us11
,543
Tot
alre
ven
ues
-90
731
.441
51.
664,
057
112,
503
2.19
2,81
314
3,52
485
011
0,62
125
,595
,019
Exp
end
iture
s:C
urre
ntG
ener
algo
vern
men
t5,
262
1,16
7,10
2P
ubli
csaf
ety
139,
560
6,84
8,51
8H
ighw
ayan
dst
reet
s6,
202,
062
Hea
lth
and
wel
fare
23.4
331,
879,
865
149.
068
101,
173
2,23
1,96
0C
u’iu
-e-r
ecre
atpo
n1,
707,
143
Com
mun
;ty
oeve
iopm
ent
ano
hous
ing
2.09
3.56
2E
conom
icdev
elopm
ert
79,2
6265
1,48
2D
ebt
serv
ice:
Pri
ncip
alre
paym
ent
168,
000
Inte
rest
and
fisc
alch
arg
es51
,138
Cos
tof
Issu
ance
Cap
ital
outla
y:H
ighw
ayan
dst
reet
sC
omm
unit
yde
velo
pmen
tan
dho
usin
g
Tot
alex
pend
itur
es7
92
62
-23
.433
-,
1.88
5,12
749
,068
-13
9.56
0-
101,
173
21.3
20,9
70
Exce
ss(d
efie
ncy
)cf
rev
enu
esov
er(u
nder
)ex
pen
dit
wes
(79.
262)
907
8.00
75
22.0
601
(36,
568)
2.19
2,81
03,
964
850
9448
4,27
4,04
9
Oth
erfi
nanc
ing
sourc
es(u
ses)
’T
rans
fers
in65
,522
1,95
3,01
93.
068,
408
Tra
nsfe
rsou
t(2
,604
,025
)(2
.551
.897
)(5
.183
,354
)Is
suan
ceof
loan
6,0
00
00
0Is
suan
ceof
cedi
fica
tes
ofpa
rtic
ipat
ion
Pre
miu
mon
cert
ific
ates
ofpa
rtic
ipat
ion
Sal
eof
capi
tai
asse
ts1,
252
Tot
alot
her
fina
ncin
gso
urc
es(u
ses)
65,5
22-
--
(651
,006
).
(2.5
51.8
97)
--
-3.
886,
506
Net
chan
gein
fund
bal
ance
s(1
3,74
0)90
78,
007
5(8
72.0
66)
(36,
568)
(359
,087
)3,
964
850
9,44
88,
160,
554
Fun
dbal
ance
s(d
efic
its)
.Ju
ne
sO,
2009
asre
stat
ed12
8,75
45,
172
175,
131
3,55
41,
281,
704
(5.1
23)
2,72
6,85
911
6,54
128
,478
205,
814
20,6
09,0
53
Fun
dbal
ance
s(d
efic
its),
Jun
e30
,20
10$
115,
014
$6,
080
$18
3.13
8$
3,55
9$
409,
638
$(4
1,69
1)$
2,36
7,77
2$
120,
504
j2%
,$
215.
26,1
$28,7
69,6
07
(con
tinu
ed)
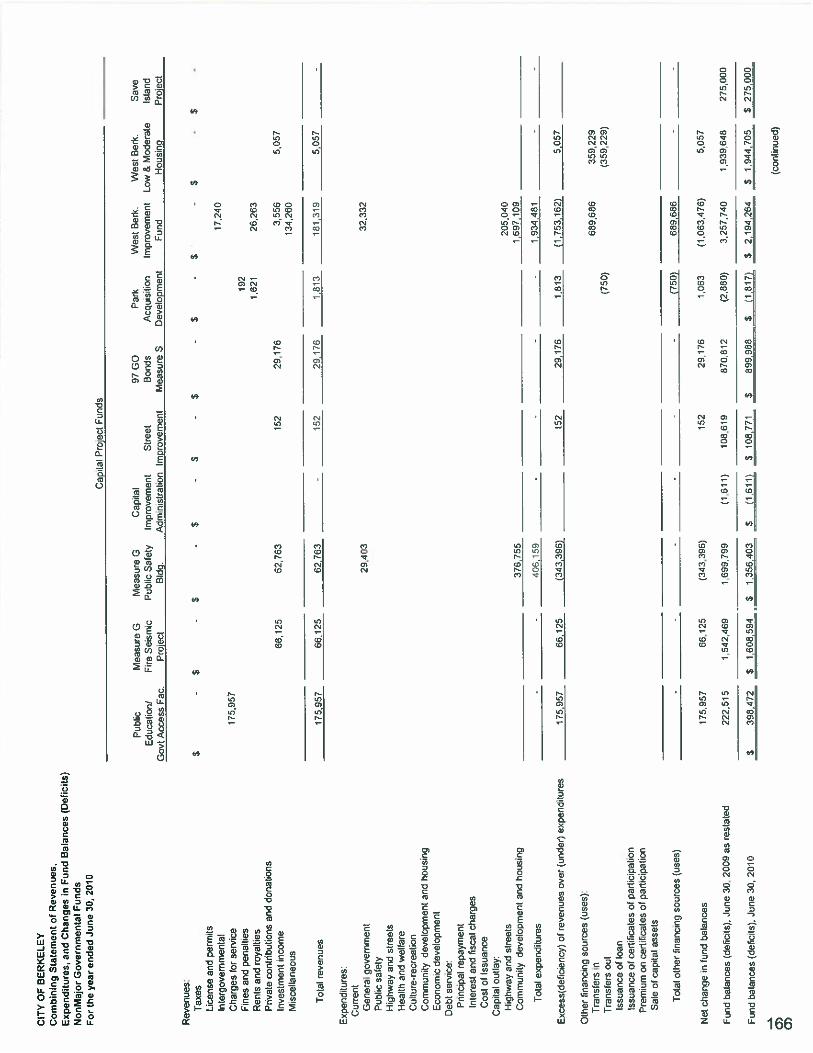
CIT
YO
FB
ER
KE
LE
YC
om
bin
ing
Sta
tem
ent
ofR
even
ues
,E
xp
end
itu
res,
and
Ch
ang
esin
Fu
nd
Bal
ance
s(D
efic
its)
Non
Maj
orG
ov
ern
men
tal
Funds
For
the
yea
ren
ded
Jun
e30
,20
10
Rev
enue
s:T
axes
Lic
ense
and
perm
its
Inte
rgov
ernm
enta
lC
harg
esfo
rse
rvic
eF
ines
and
pena
ltie
sR
ents
and
roya
ltie
sP
riva
teco
ntri
buti
ons
and
dona
tion
sIn
vest
men
tin
com
eM
isce
ltan
eCus
Tot
alev
enues
Exoer
cilu
res
Cur
rent
Gen
eral
gove
rnm
ent
Pub
lic
safe
tyH
ighw
ayan
dst
reet
sH
ealt
han
dw
elfa
reC
ultu
re-r
ecre
atio
nC
omm
unit
yde
veto
prne
ntan
dho
usin
gE
cono
mic
deve
lopm
ent
Deb
tse
rvic
e:Pr
inci
pal
repa
ymen
tIn
tere
star
dfi
scal
char
ges
Cos
tcf
Issu
ance
Cap
ital
outl
ayH
ighw
ayan
dst
reet
sC
omm
unit
yde
velo
pmen
tan
dho
usin
g
Tot
alex
per.
ditu
res
Exc
ess(
defi
cien
cy)
ofre
ven
ues
over
(und
er)
expe
ndit
ures
Oth
erS
nanc
ing
sourc
es(u
ses)
Tra
nsfe
rsin
Tra
nsfe
rsou
tIs
suan
ceof
loan
Issu
ance
ofce
rtif
icat
esof
part
icip
atio
nP
rem
ium
once
rtif
icat
esof
part
icip
atio
nS
ate
ofca
pita
las
sets
Tot
alot
her
Sna
rcin
gso
j-ce
s(u
ses)
Net
chan
gein
fund
bal
ance
s
Fur.
dbal
ance
sId
efic
ts),
Jun
e30
,20
09as
rest
ated
Fur.
dbal
ance
std
etic
Is),
Jun
e30
,20
10
Cap
itat
Prc
ect
Fun
ds
Publ
icM
easu
reG
Mea
sure
GC
apit
al97
GO
Par
kW
est
Ber
kW
est
Ber
t.S
ave
Educa
tor!
Fire
Sei
sm;c
Publ
icS
afet
yIm
prov
emen
tS
tree
tB
onds
Acq
uist
jon
Impr
ovem
ent
Low
&M
era
teIs
lane
Gov
tA
cces
sF
acP
roje
ctB
ldg.
Adm
inis
trat
ion
Impr
ovem
ent
Mea
sure
SD
evel
opm
ent
Fun
dH
ousi
ngP
roje
ct
$-
$-
$-
$-
S-
$-
$-
$-
$-
$
17,2
40
175,
957
192
1,62
126
,263
66,1
2562
,763
152
29.1
753,
556
5.05
713
4,26
0
175.
957
66,1
2562
.763
-15
229j7
61.
813
181,
319
5.05
7
29,4
0332
,332
205,
040
__________
____
__
__
__
__
__
__
376.
755
___________
___________
_____________
___________
1.69
7.1c
9
--
406,
159
-.
--
1,93
4.48
1-
175.
957
66,1
25(3
43,3
96)
______
152
29.1
761.
813
(1,7
5316
2)5,
057
689,
686
359,
229
(750
)(3
59,2
29)
--
--
-
-_Jf
689,
686
-
‘75,
957
66,1
25(3
43,3
96)
152
29.1
761.
063
(1,0
63,4
75)
5,05
7
222515
1.54
2,46
91,
699,
799
(1.6
11)
108,
619
870.
812
(2.8
80)
3,25
7,74
01.
939.
648
275,
000
$39
8,47
2S
1.6
0,4
_S
.356,4
c3S
(1.6
111
$10
8,77
1S
699.
988
_j1
7S
29
&2
64
S1.
944,
705
S27
5,00
0
(con
tinu
ed)
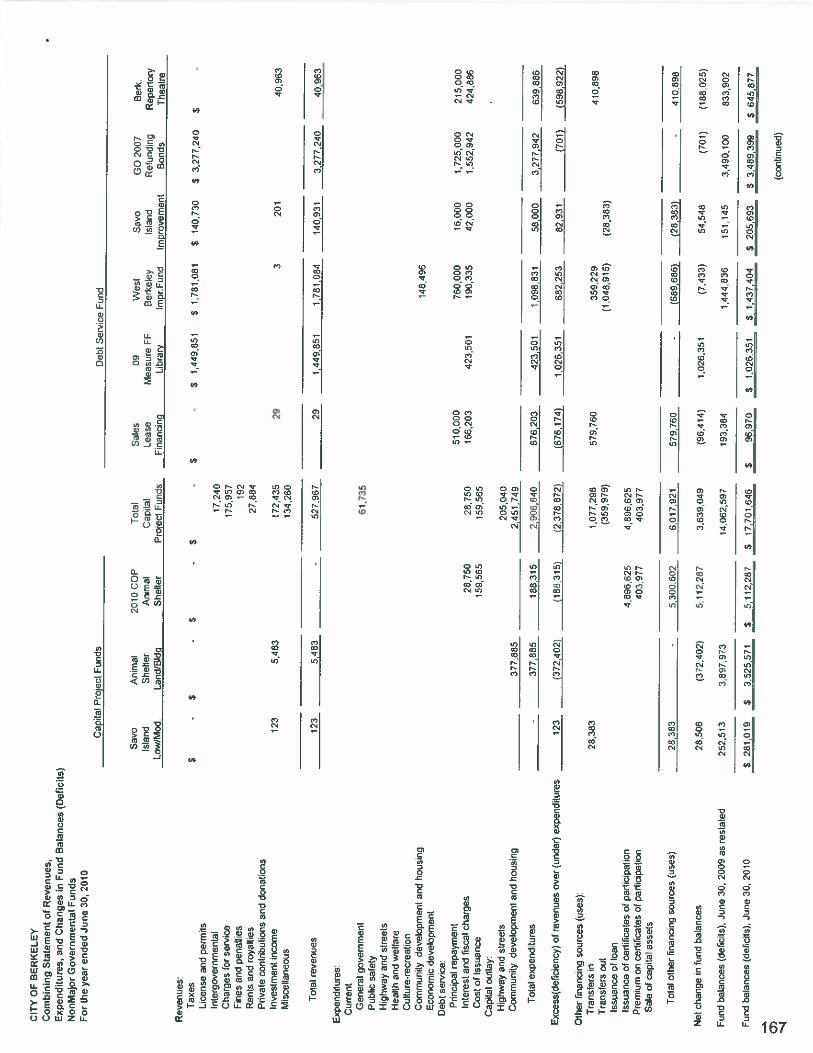
CIT
YO
FB
EF
*(E
LE
YC
om
bin
ing
Sta
tem
ent
ofR
even
ues
,E
xpen
diL
ures
,an
dC
han
ges
inF
un
dB
alan
ces
(Def
icit
s)N
onM
ajor
Go
ver
nm
enta
lF
unds
For
the
yea
ren
ded
Jun
e30
,20
10C
apit
alP
roje
ctF
unds
Deb
tS
ervi
ceF
und
Exp
enci
ture
sC
urre
ntG
ener
algo
vern
men
tP
ubli
csa
fely
Hig
hway
and
stre
ets
Hea
lth
and
wel
fare
Cu
Iture
-rec
reat
ion
Com
mun
ity
deve
lopm
ent
and
hous
ing
Eco
nom
icde
velo
pmen
tD
ebt
serv
ice:
Pri
ncip
alre
paym
ent
!nte
rest
ano
Fisc
alch
arg
esC
ost
ofIs
suan
ceC
apit
alou
tlay
Hig
hway
and
stre
ets
Com
mun
ity
deve
lopm
ent
and
hous
ing
205,
040
2.45
1,74
9
510,
000
166,
203
423.
501
760,
000
16,0
001,
725,
000
215,
000
190,
335
42,0
001552.3
42
424.
886
Exc
ess(
deri
cien
cy)
ofre
ven
ues
over
(und
er)
expe
ndit
ures
123
(372
,402
)(1
88,3
15)
(2,3
78,8
72)
Oth
erfi
nanc
ing
sourc
es(u
ses)
:T
rans
fers
inT
rans
fers
out
Issu
ance
oflo
anIs
suan
ceof
cert
ific
ates
ofpa
rtic
ipat
ion
Pre
miu
mon
cert
ific
ates
ofpa
rtic
ipat
ion
Sat
eof
capi
tal
asse
ts
JZ
!,1
74
1,02
6,35
168
2,25
382
.931
_
__701]_
_jj2
2
______________
______________
__
__
__
__
__
__
_____________
410.
898
Net
chan
gein
fund
bai
ance
s26
,506
(372
.402
)5.
112.
287
3,63
9,04
9(9
6,41
4)1,
026.
351
(7,4
33)
54,5
48(7
01)
(188
,025
)
$1.
437,
404
S20
5,69
3$
3,48
9,39
9$
645,
877
Rev
enue
s:T
axes
Lic
ense
and
perm
its
Inte
rgov
ernm
enta
lC
harg
esfo
rse
rvic
eFi
nes
and
pena
ltie
sR
ents
and
roya
ltie
sP
riva
tecn
thD
tors
and
dona
tion
sln
vest
en
tin
com
eM
isce
llan
eous
Tot
alre
ven
ues
Sav
oA
n.m
at23
10C
OP
To:
alS
ales
09W
est
Sav
oG
O20
07B
erk.
Isla
ndS
helt
erA
nim
alC
apit
alL
ease
Mea
sure
FFB
erke
ley
Isla
ndR
efun
ding
Rep
erto
ryL
ow/M
odL
and/
BId
oS
helt
erF
unds
Fin
anci
ngL
ibra
rytm
pr.F
und
Impr
ovem
ent
Bon
dsT
heat
re
$-
$-
$-
$-
$-
$1,
449,
851
$1,
781,
081
$14
0,73
0$
3,27
7,24
0$
-
17,2
4017
5,95
719
227
,884
123
5,48
317
2.43
529
320
140
,953
134.
260
23
5,48
2-
527,
957
291,
449,
851
1.78
1,38
414
0.93
13.
277,
240
40.9
63
61,7
35
28,7
5015
9,56
528
,750
-59
.585
____________
377,
885
148,
495
Tota
;expen
dtu
res
.37
7,88
518
8.31
52,
906.
840
676,
203
423,
501
,098
831
58,0
003.
271,
942
639,
886
Fun
dbal
ance
s(d
etic
ls),
Jun
e30
.20
09as
rest
ated
Fun
dbal
ance
s(d
eiL
cits
),Ju
ne
30,
2010
28,3
831,
077,
298
579,
760
359,
229
410,
898
(359
,979
)(1
,048
,915
)(2
8.38
3)
4,89
6,62
54,
896,
625
403,
977
403,
977
Tot
alot
her
fina
ncin
gso
urc
es(u
ses)
28,3
53-
5.30
0,80
25,
017,
921
579.
760
-689.6
86)
(28.
383)
252,
613
3,89
1,97
314
,062
.59
7
$28
1,01
9$
3,52
5,57
1$
5,1
12
,28
7S
17,7
01.6
46$
96.9
70$
1,02
6,35
1
193,
384
14
44
836
151.
145
3,49
0,1c
c83
3.90
2
(conti
nued)
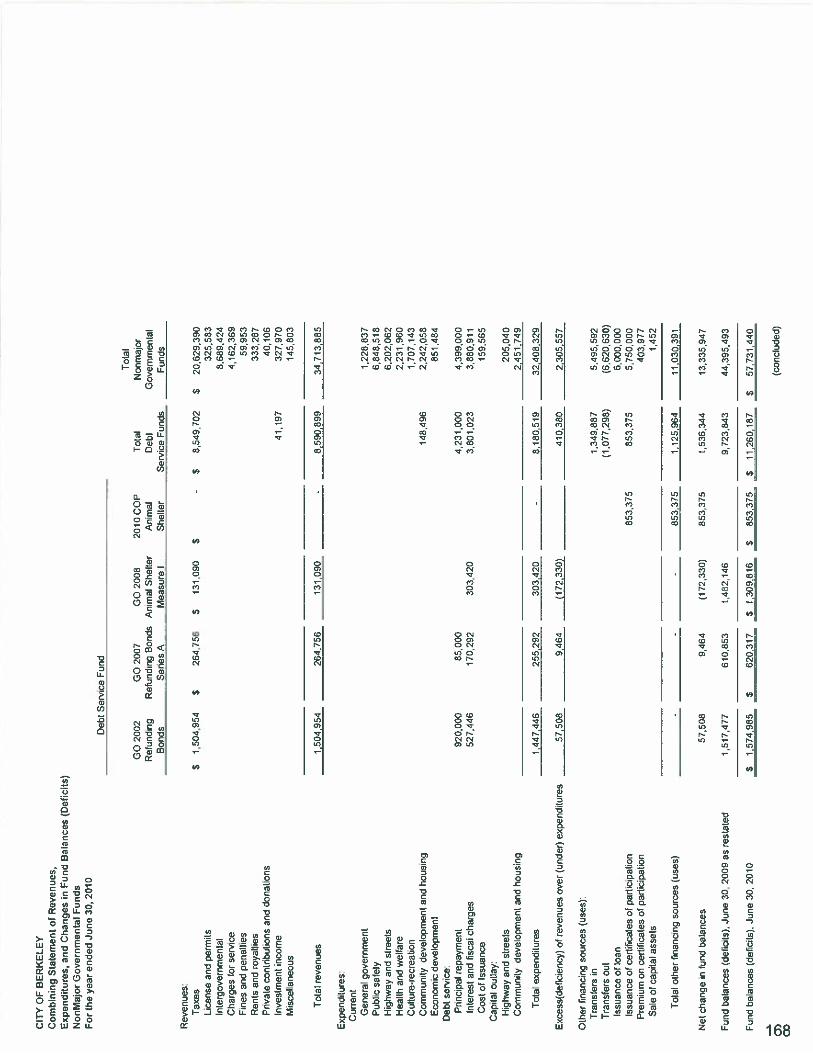
CIT
YO
FB
ER
KE
LE
YC
om
bin
ing
Sta
tem
ent
ofR
even
ues
,E
xpen
dit
ure
s,an
dC
han
ges
inF
un
dB
alan
ces
(Def
icit
s)N
onM
ajor
Go
ver
nm
enta
lF
unds
For
the
yea
ren
ded
Jun
e30
,20
10D
ebt
Ser
vice
Fun
d
Tot
alG
D20
02G
O20
07G
O20
0620
10C
OP
Tol
alN
onm
ajor
Ref
undi
ngR
efun
ding
Bon
dsA
nim
alS
helt
erA
nim
alD
ebt
Gov
ernm
enta
lB
onds
Ser
ies
AM
easu
reI
She
ller
Ser
vice
Fun
dsF
unds
Rev
enue
s:T
axes
$1
50
4.9
54
$26
4,75
5$
131,
090
$-
$8,
549,
702
$20
,629
,390
Lic
ense
and
perm
its
325,
583
Inte
rgov
ernm
enta
l8,
689,
424
Cha
rges
for
serv
ice
4,16
2,35
9F
ines
and
pena
ltie
s59
.953
Ren
tsan
dro
yalt
ies
333.
287
Pri
vate
cont
ribu
tion
san
ddo
nati
ons
40,1
06In
vest
men
tin
com
e41
,197
321,
970
Mis
cell
aneo
us14
5,80
3
Tot
alre
ven
ues
1,50
4.95
426
4,75
6¶3
1,09
0-
8,59
0,89
934
,713
,885
Exp
endi
ture
s:C
urre
ntG
ener
algo
vern
men
t1,
228,
837
Pub
lic
safe
ty6.
848.
518
Hig
hway
and
stre
ets
6,20
2,06
2H
ealt
han
dw
elfa
re2.
231,
960
Cul
ture
-rec
reat
ion
1,70
7,14
3C
omm
unit
yde
velo
pmen
tan
dho
usin
g14
8,49
62.
242.
058
Eco
nom
icde
velo
pmen
t85
1,48
4D
ebt
serv
ice:
Pri
ncip
alre
paym
ent
920,
000
85,0
004,
231,
000
4,39
9,00
0In
tere
stan
dfi
scal
char
ges
527,
446
¶70,
292
303,
420
3,80
1,02
33,
880,
911
Cos
tof
Issu
ance
159.
565
Cap
ital
outla
y:H
ighw
ayan
dst
reet
s20
5,04
0C
omm
unit
yde
velo
pmen
tan
dho
usin
g2,
451,
749
Tot
alex
pend
itur
es1,
447,
446
255,
292
303,
420
-8,
180,
519
32,4
08,3
29
Exc
ess(
defi
cien
cy)
ofre
ven
ues
over
(und
er)
expe
ndit
ures
57,5
089,
484
(172
,330
)
____________
410,
380
2,30
5,55
7
Oth
erfi
nanc
ing
sou
rces
(use
s):
Tra
nsfe
rsin
1,34
9,88
75,
495,
592
Tra
nsfe
rsou
t(1
,077
,298
)(6
,620
,630
)Is
suan
ceof
loan
6,00
0,00
0Is
suan
ceof
cert
ific
ates
ofpa
rtic
ipat
ion
853,
375
853,
375
5,75
0,00
0P
rem
ium
once
rtif
icat
esof
part
icip
atio
n40
3,97
7S
ale
ofca
pita
las
sets
1,45
2
Tot
alot
her
fina
ncin
gso
urc
es(u
ses)
--
-85
3,37
51,
125,
964
11,0
30,3
91
Net
chan
gein
fund
bal
ance
s57
,508
9,46
4(1
72,3
30)
853,
375
1.53
6,34
413
,335
,947
Fun
dbal
ance
s(d
efic
its)
,Ju
ne
30,
2009
asre
stat
ed1.
517,
477
610,
853
1,48
2,14
69,
723,
843
44,3
95,4
93
Fund
bal
ance
s(d
efic
its)
.Ju
ne
30,
2010
$1,
574.
985
$62
0,31
7$
1,3
09
,81
6$853,3
75
$11
,260
,187
$57
.731
,440
(con
clud
ed)
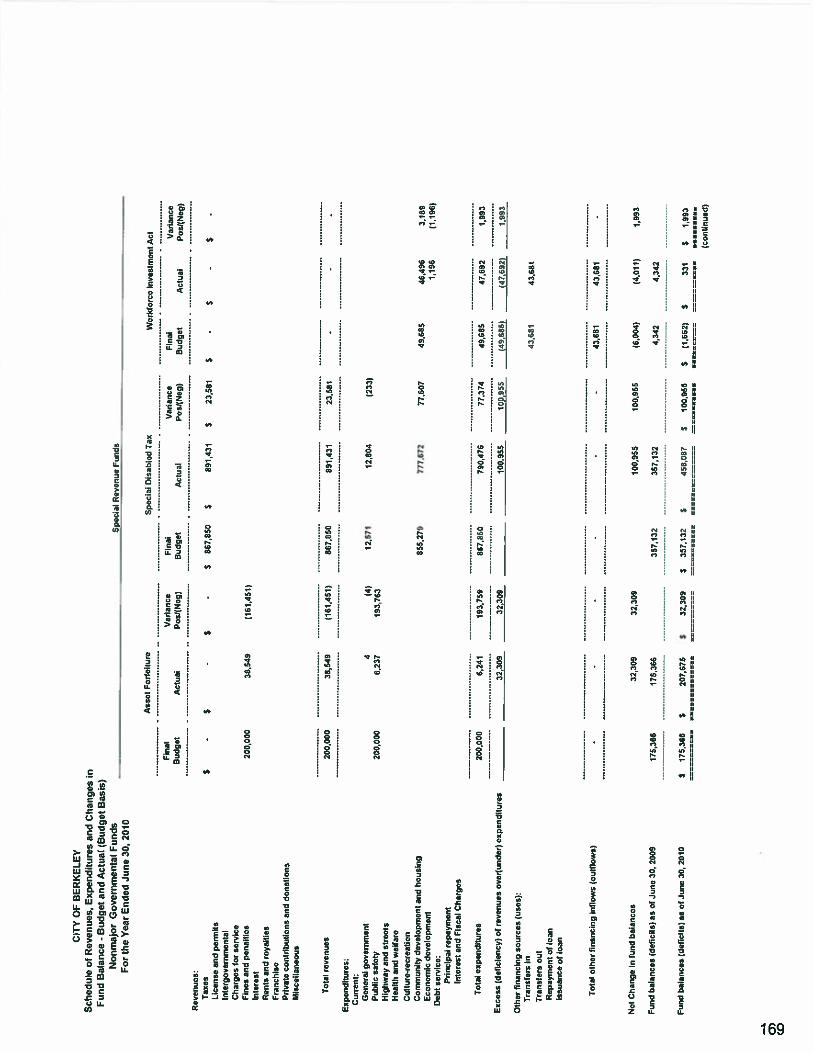
CIT
YO
FB
ER
KE
LE
YS
ched
ule
ofR
even
ues
,E
xpen
dit
ure
san
dC
han
ges
inF
und
Bal
ance
-B
udget
and
Act
ual
(Budget
Bas
is)
No
nm
ajo
rG
over
nm
enta
lF
unds
Spec
ial
Rev
enu
eF
unds
For
the
Yea
rE
nded
June
30,
2010
Ass
etF
orf
eitu
resp
ecia
lD
isab
led
Tax
Wo
rkio
rce
Inv
estm
ent
Act
Fin
alV
aria
nce
Fin
alV
aria
nce
Fin
alV
aria
nce
Budget
Act
ual
Po
s/(N
eg)
Bu
dg
etA
ctual
Po
sI(N
eg)
Bu
dg
etA
ctual
Posf
lNog)
Rev
enues
:T
axes
S-
$-
$-
$667,8
50
$89
1,43
1S
23,5
515
S‘
$L
icen
sean
dper
mit
sIn
terg
ov
ernm
enta
lC
har
ges
for
serv
ice
Fin
esan
dp
enal
ties
200,
000
38,5
49(1
61,4
51)
Inte
rest
Ren
tsan
dro
yal
ties
Fra
nch
ise
Pri
vat
eco
ntr
ibuti
ons
and
do
nat
ion
sM
isce
llan
eous
Tota
lre
ven
ues
20
0,o
eo38
,549
(161
.451
)86
7,85
089
1,43
123
,581
-
Expen
dit
ure
s:C
urr
ent:
Gen
eral
gover
nm
ent
4(4
112
,571
12804
1233
)P
ubli
csa
fety
200.
000
8,23
719
3,76
3H
ighw
ayan
dsi
reets
Hea
lth
and
wel
fare
Cult
ure
-rec
reat
ion
Cor
rwnu
nity
dev
elopm
ent
and
ho
usi
ng
855,
279
777.
672
77.0
0749
,685
46.4
963,
189
Eco
no
mic
dev
elo
pm
ent
1,19
6(1
,196
)D
ebt
serv
ice:
Pri
nci
pal
repay
men
tIn
tere
stan
dF
isca
lC
har
ges
Tota
lex
pen
dit
ure
s200,0
00
6,24
119
3,75
9867,8
50
790,
476
77374
49.6
85
47,6
921,
993
Exce
ss(d
efic
iency
)of
rev
enu
esover
(under
)expendit
ure
s
__
__
__
__
__
__
32,3
0932
,309
__
__
__
__
__
__
100,
955
109,
955
149,
685)
(47,
692)
1.99
3
Oth
erfi
nan
cing
sourc
es
(use
s):
Tra
nsf
ers
in43
,661
Tra
nsf
ers
ou
tR
epay
men
tof
loan
Issu
ance
of
loan
Tota
loth
erfi
nan
cing
infl
ow
s(o
utf
low
s)-
.-
--
-43
,681
43,6
41
Net
Chan
ge
infu
nd
bal
ance
s32
.309
32,3
0910
0,95
510
0,95
5(8
.004
)(4
.011
)1,
993
Fund
bal
ance
s(d
efic
its)
asof
Jun
e30
,20
0917
5,36
617
5.36
635
7,13
235
7,13
24,
342
4,34
2
Fu
nd
bal
ance
s(d
cfic
ilsl
asof
Jun
e30
,20
105
115,
366
$207675
$32
,309
$35
7,13
2$
456,0
87
$10
0,95
5$
(1.6
62)
$33
1$
1,99
3
(conti
nurd
)

CIT
YO
FB
ER
KE
LE
YS
ched
ule
ofR
even
ues
Expen
dit
ure
san
dC
han
ges
Fun
dB
alan
ce-
Bud
get
and
Act
ual
(Bud
get
Bas
is)
Non
maj
orG
over
nmen
tal
Fun
dsS
pec
ial
Rev
enu
eF
un
ds
For
the
Yea
rE
nded
Jun
e30
,20
10
Sec
108
HU
DL
oan
Gm
Ass
l.A
nim
alS
hel
ter
Fu
nd
Par
amed
icA
ssess
men
tD
istr
ict
Fin
alV
aria
nce
Fin
alV
aria
nce
Fin
alV
aria
nce
Budget
Act
ual
PosI
(Neg
lB
ud
get
Act
ual
Po
s!(N
eg)
Bu
dg
etA
ctual
Posf
lNeg
)
Rev
enu
es:
Tax
es$
-$
-$
-S
-$
-S
-$
2.2
63,2
44
52
,32
5,8
32
56
2,5
68
Lic
ense
and
pern
its
Inte
rgo
ver
nm
enta
l-
176,
320
176.
320
char
ges
for
serv
ice
Fin
esan
dpen
alti
esln
tere
sl56
,218
83,5
6627
,348
Ren
tsan
dro
yal
ties
Fra
nch
ise
Pri
vat
eco
ntr
ibuti
ons
and
donat
ion
s45,0
00
39,1
99(5
,801
)M
isce
llan
eous
-
Tota
lre
ven
ues
56.2
1883
,886
27,3
4845,0
80
215,
519
170,
519
2,26
3,24
42.3
25,8
32
62,5
88
Etp
endit
ure
s:C
urr
ent:
Gen
eral
gover
nm
ent
41,6
0031
,578
10,0
2212
,571
12,7
17(1
46)
Publi
csa
fety
2,8
52,3
18
2,8
70,4
14
(18,
096)
Hig
hw
ayan
dst
reets
Hea
lth
and
wel
fare
Cult
ure
-rec
reat
ion
Com
munit
yd
evel
op
men
tan
dh
ousi
ng
1515
)E
con
om
icdev
elopm
ent
6,0
02
,00
06002,2
02
(202
1D
ebt
serv
ice:
Pri
nci
pal
rep
aym
ent
168.
000
168,
000
0In
tere
stan
dF
isca
lC
har
ges
51,0
1851
,018
0
Tota
lex
pen
dit
ure
s6,2
21,0
18
6,2
21,2
35
1217
)41
,800
31,5
7810
,022
2,8
54,8
89
2,88
3,13
1(1
8,24
2)
Ex
cess
(def
icie
ncy
)of
rov
enu
esover
(under
)ex
pen
dit
ure
s(6
,164,8
00)
(6,1
37,6
69)
27,1
313.
400
183,
941
180,
541
(60l&
!)(5
57,2
99)
44,3
46
Oth
erfi
nan
cin
gso
urc
es
(use
s):
Tra
nsf
ers
in49
0,16
6490,1
86
Tra
nsf
ers
ou
t(1
0.71
2)(1
0,71
2)R
epay
men
tof
loan
168,
000
161,
116
(6,8
84)
Issu
ance
of
loan
6,0
00,0
00
6,0
00,0
00
Tota
loth
erfi
nan
cing
infl
ow
s(o
utf
low
s)6,1
68,0
00
6,1
61,1
16
(6,8
84)
--
-47
9.47
4479,4
74
Net
ch
an
ge
infu
nd
bal
ance
s3,
200
23,4
4720
,247
3,40
018
3,94
118
0,54
1(1
22,1
71)
(77,
825)
44,3
46
Fu
nd
bala
nces
(def
icit
s)as
ofJu
ne
30,
2009
145,
023
145,
023
115,
934
115,
934
(261
,409
)(2
61,4
98)
Fun
dbal
ance
s(d
efic
its)
as
ofJu
ne30
2010
$14
8,22
35
168,
470
$20
,247
$11
9,33
4$
299.
875
$18
0,54
1$
1383
,669
1$
(339
,323
)$
44,3
46
(co
nti
nu
ed)
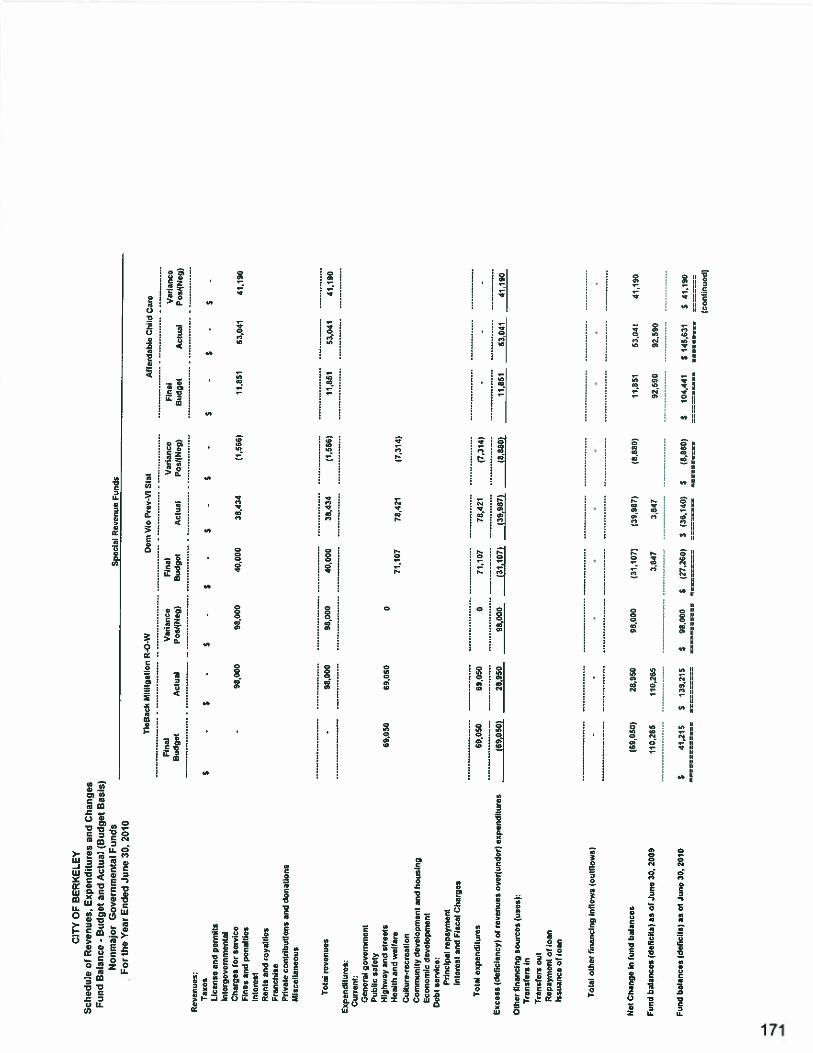
CIT
YO
FB
ER
KE
LE
Ysc
hed
ule
ofR
even
ues.
Expen
dit
ure
san
dC
han
ges
Fun
dB
alan
ce-
Bud
get
and
Act
ual
(Bud
get
Bas
is)
Non
maj
orG
over
nmen
tal
Funds
For
the
Yea
rE
nded
Jun
e30
.20
10S
pec
ial
Rev
enu
eF
unds
Rev
enu
es:
Tax
esL
icen
sean
dper
mit
sIn
torg
over
nm
cni
aI
Char
ges
for
serv
ice
Fin
esan
dp
enal
ties
Inte
rest
Ren
tsan
dro
yal
ties
Fra
nch
ise
Pri
vat
eco
ntr
ibuti
ons
and
donat
ion
sM
isce
llan
eous
Expen
dit
ure
s:C
urr
ent:
Gen
eral
gover
nm
ent
Publi
csa
fety
Hig
hw
ayan
dsh
eets
Hea
lth
and
wel
fare
Cull
ure
-rec
real
ion
Co
mm
un
ity
dev
elopm
ent
and
hou
sin
gE
con
om
icdev
elopm
ent
Deb
tse
rvic
e:P
rin
cip
alre
pay
men
tIn
tere
stan
dF
isca
lC
har
ges
Oem
vio
Pre
v-V
iS
tat
Var
ian
ceF
inal
var
iance
Posi
(Neg
)B
ud
get
Act
ual
Post
iNeg
)
*1,8
6153
,04*
41,1
90
11,8
5153
,041
41,1
90
Oth
eril
nan
cing
sou
rces
(uso
si:
Tra
nsf
ers
in
Tra
nsf
ers
out
Rep
aym
ent
of
loan
Issu
ance
of
loan
Tota
loth
erfi
nan
cing
infl
ow
soutf
low
s)
Net
Chan
ge
infu
nd
bal
ance
s(6
9,05
0)28
,950
98,0
00(3
1,10
7)(3
9,98
7)(8
,880
)11
,851
53,0
4141,1
90
Fund
bala
nces
(def
icit
s)as
of
Jun
e30
,20
0911
0,26
511
0,26
53,
847
3,84
792
,590
92590
Fund
bal
ance
s(d
clic
its)
as
ofJu
ne
30,
2010
$41,2
15
$13
9,21
5$
98
,00
°$
(27,
260)
$(3
5,14
0)$
(8,6
80)
$10
4,44
1$
145,
531
$41,1
90
(conti
nued
)
Fin
al
$S
$
Tota
lre
ven
ues
S
Aff
ord
able
Chi
ldC
are
Fin
alvar
ianoc
Bu
dg
etA
ctual
PosI
(Ncg
)
$-
$-
$-
11.8
5153
,041
41,1
90
Tie
Bac
kM
itit
gat
ion
R-0
-W
Budget
Act
ual
-98
,000
98,0
0040,0
00
38,4
341,
566)
98,0
0098
,000
40,0
0038
,434
(1,5
661
89,0
50
69,0
500
71,1
0778
,421
)7,3
I4
69,0
5069
,050
071
,107
78,4
21(7
,314
)
(69,
050)
25,9
5098
,000
,J%
p7
Tota
lex
pen
dit
ure
s
Exce
ss(d
efic
ien
cy)
of
rev
enu
esover
(under
)ex
pen
dit
ure
s

CIT
YO
FB
ER
KE
LE
YS
ched
ule
ofR
even
ues.
Expen
dit
ure
san
dC
han
ges
Fun
dB
alan
ce-
Bud
get
and
Act
ual
(Bud
get
Bas
is)
Non
maj
orG
over
nmen
tal
Funds
For
the
Yea
rE
nded
June
30,
2010
Sp
ecia
lR
even
ue
Fu
nd
s
Rev
enu
es:
Tax
esL
icen
sean
dper
mil
tIn
terg
ov
ernm
enta
lC
har
ges
for
serv
ice
Fin
esan
dp
enal
ties
Inte
rest
Ren
tsan
dro
yal
ties
Fra
nch
ise
Pri
vat
eco
ntr
ibuti
ons
and
donat
ion
sM
isce
llan
eous
Expen
dit
ure
s:C
urr
ent:
Gen
eral
gover
nm
ent
Publi
csa
fety
Hig
hw
ayan
dst
reets
Hea
lth
and
wel
fare
Cult
ure
-rec
reat
ion
Conm
iunit
ydev
elopm
ent
and
hou
sin
gE
con
om
icdev
elopm
ent
Deb
tse
rvic
e:P
rin
cip
alre
pay
men
tIn
tere
stan
dF
isca
lC
har
ges
Oth
erfi
nan
cing
sourc
es
(use
s):
Tra
nsf
ers
in
Tra
nsf
ers
ou
tR
epay
men
tof
loan
Issu
ance
ci
loan
Incl
usi
onar
yH
ousi
ng
Pro
gra
m
Fin
alV
aria
nce
Budget
Act
ual
Po
silN
eg)
S-
$-
$-
$
Condo
Conver
sion
Pro
gra
m
Fin
alV
aria
nce
Bu
dg
etA
ctual
Posl
(Ncg
)
$-
$
Tota
loth
erfi
nan
cing
infl
ow
s(o
utn
ow
s)t4
,600
)13
2.06
9)(2
7.46
9)
Net
Ch
ang
ein
fund
bal
ance
s(1
0.31
5)t4
5,07
7113
4,76
2)41
,692
41,6
92(2
29,1
97)
23t,
S5O
467,7
47
Fu
nd
bala
nces
der
.cit
s)as
of
Jun
e30
,20
09518825
515,
625
44,0
9744
.097
721.
361
721,
361
Fu
nd
bal
ance
s(d
efic
its)
as
ofJu
ne
30,
2010
5506,5
10
$473,7
48
$(3
4,76
2)$
44.0
975
85,7
89$
41,5
92$
492,1
64
595
9,91
15
467,7
47
(co
nti
nu
nd
l
Tota
lre
ven
ues
Pla
yg
rou
nd
Cam
p
Fin
alB
ud
get
Act
ual
$-
$$
Var
iance
Posf
(Neg
)
(45,
063)
58,7
0058
,700
1,7
05,0
00
1,67
1,65
8(3
3,33
2)
20
t,0
00
305,
403
97,4
03
48,0
633,
000
48,0
63
3,00
0(4
5,06
3)-
58,7
0058
.700
20.0
0017
,008
2,99
224
,097
24,0
97
hO
Ot
27,0
89
__
__
__
__
__
__
____________
__
__
__
__
__
__
__
41,6
9285
,789
Tota
lex
pen
dit
ure
s
Exce
ss(d
efic
iency
)of
reven
ues
over
(under
)ex
pen
dit
ure
s
1,9
13,0
00
1,97
7,07
164
,071
2,1
37,5
97
1,7
06,4
62
431,1
45
58,3
7848
,077
10,3
01
58,3
7848
,077
10,3
01
110,
3151
145,
0771
(34,
762)
44,0
97
2,1
37,5
97
(224
,597
)
1,7
06,4
52
270,
619
431,1
45
495,2
16
(27,
469)
(4,6
00)
(4.6
00)
(27,
469)
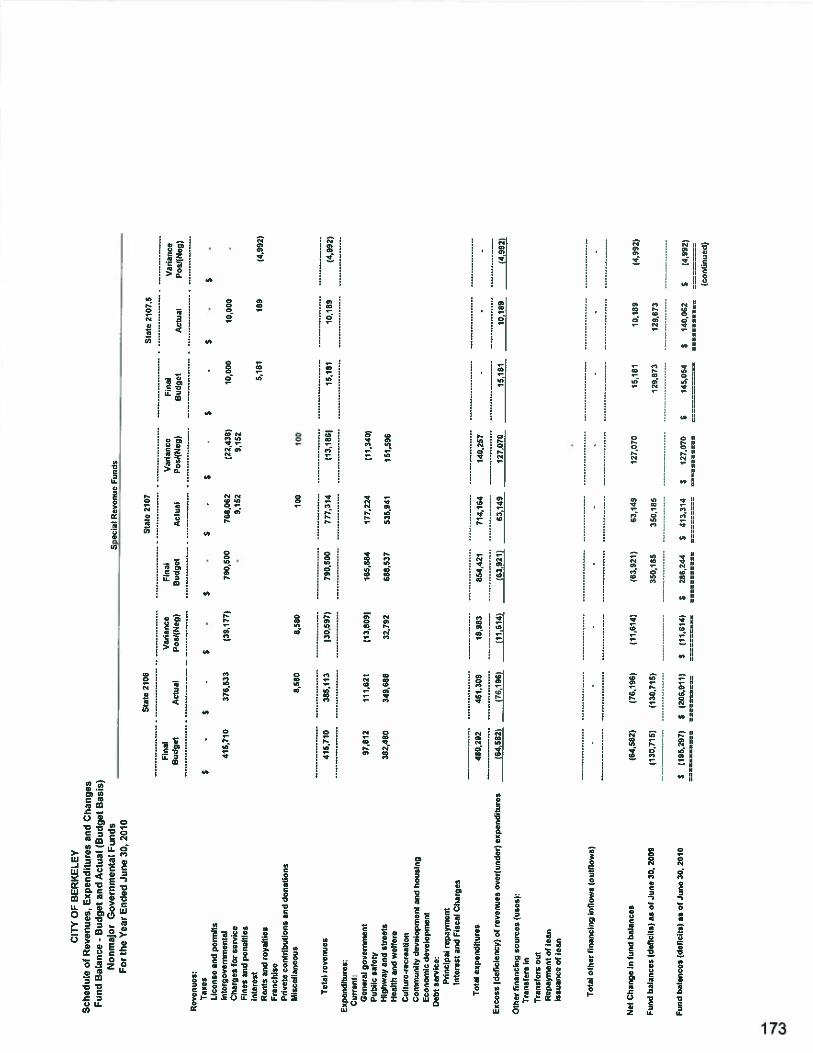
CIT
YO
FB
ER
KE
LE
YS
ched
ule
ofR
even
ues
,E
xpen
dit
ure
san
dC
han
ges
Fund
Bal
ance
-B
udget
and
Act
ual
(Budget
Bas
is)
Nonm
ajor
Go
ver
nm
enta
lF
unds
Spec
ial
Rev
enue
Funds
For
the
Yea
rE
nded
Jun
e30
,20
10
Sta
te21
06S
tate
2107
Sta
te21
07.5
Fin
alvar
iance
Fin
alvar
iance
Fin
alvar
iance
Budget
Act
ual
Po
sf(N
eg)
Budget
Act
ual
Po
sNeg
)B
ud
get
Act
ual
Pos!
(Neg
)
Fte
vonues
:T
axes
$-
$-
$-
$-
$-
S-
$-
$-
S-
Lic
ense
and
per
mit
sIn
terg
ov
ernm
enta
l415,7
10
376,
533
(39,
177)
790,5
00
768,0
62
(22,
438)
10,0
0010
,000
-
Char
ges
for
serv
ice
-9,
152
9,15
2F
ines
and
pen
alti
esIn
tere
st5,
181
189
(4.9
92)
Ren
tsan
dro
yal
ties
Fra
nch
ise
Pri
vat
eco
ntr
ibuti
ons
and
donat
ion
sM
isce
llan
eous
8,58
08,
580
100
100
tota
lre
ven
ues
415,7
10
315,
113
(30.
5971
790,
500
777,
314
(13,
186)
15.1
8110
,189
(4,9
92)
Expen
dit
ure
s:C
urr
ent:
Gen
eral
gover
nm
ent
97,8
1211
1,62
1(1
3,80
91165,8
84
177,
224
(11,
340)
Pubti
csa
fely
Hig
hw
ayan
dst
reets
382,4
80
349,
688
32,7
92588,5
37
536,
941
151,
596
Hea
lth
and
wel
fare
Cult
ure
-rec
reat
ion
Conm
iunit
ydev
elopm
ent
and
hou
sin
gE
con
om
icd
evel
op
men
tD
ebe
serv
ice:
Pri
nci
pal
repay
men
tIn
tere
stan
dF
isca
lC
har
ges
Tota
lex
pen
dit
ure
s480,2
92
481,
309
18,9
8385
4,42
171
4,16
414
0,25
7-
--
Exce
ss(d
efic
ien
cy)
of
rev
enu
esover
)under
)ex
pen
dit
ure
s_
J!L
!2
6(1
1.61
4)53
,149
127,
070
15,1
8110
,189
(4,9
92)
Oth
erfi
nan
cing
sourc
es
(use
s):
Tra
nst
ers
in
Tra
nsf
ers
ou
tR
epay
men
tof
loan
Issu
ance
of
toan
Tota
loth
erfi
nan
cing
infl
ow
s(o
utf
low
s)-
Net
Chan
ge
infu
nd
bal
ance
s(6
4,58
2)(7
6.19
6)(1
l,614)
(63,
921)
63,1
4912
7.07
015
,181
10,1
89(4
,992
)
Fu
nd
bal
ance
s(d
efic
its)
asot
Jun
e30
,20
09(1
30,7
15)
(138
,715
)35
0,16
535
0,16
512
9,87
312
9,67
3
Fund
bat
once
s(d
ct,c
its)
asoF
Jun
e30
,20
10$
(195
,297
)$
(206
,911
)5
(11,
614)
$28
6,24
4$
413,
314
$12
7,07
0$
145,
054
514
6,06
2S
(4,9
92)
(conti
nued
)
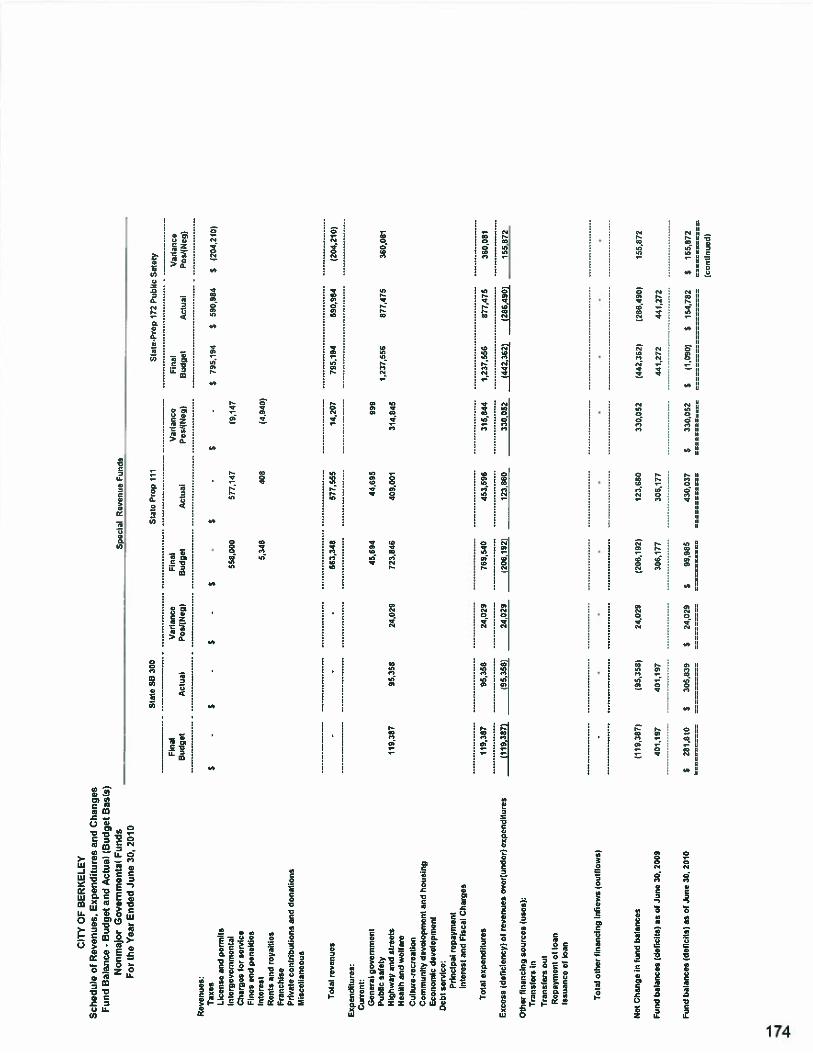
CIT
YO
FB
ER
KE
LE
YS
ched
ule
ofR
even
ues
Expen
dit
ure
san
dC
han
ges
Fun
dB
alan
ce-B
ud
get
and
Act
ual
(Bud
get
Bas
is)
Non
maj
orG
over
nmen
tal
Fun
dsF
orth
eY
ear
End
edJu
ne
30,
2010
Sp
ecia
lR
even
ue
Fu
nd
s
Rev
enues
:Ta
xes
Lic
ense
and
per
mit
sIn
terg
ov
ernm
enta
lC
har
ges
for
serv
ice
Fin
esan
dp
enal
ties
Inte
rest
Ren
tsan
dro
yal
ties
Fra
nch
ise
Pri
vat
eco
ntr
ibu
tio
ns
and
donat
ion
sM
isce
llan
eous
Expen
dit
ure
s:C
urr
ent:
Gen
erat
go
ver
nm
ent
Pubti
csa
fety
Hig
hw
ayan
dst
reets
Hea
lth
and
wel
fare
Cult
ure
-rec
reat
ion
Com
munit
ydovet
opm
ont
and
ho
usi
ng
Eco
no
mic
dev
elopm
ent
Deb
tse
rvic
e:P
rinci
pal
repay
men
tIn
tere
stan
dF
isca
lC
har
ges
Sta
teS
B38
0
Fin
alV
aria
nce
Bu
dg
etA
ctual
Po
sIlN
eg)
$-
$-
$-
Sta
teP
rop
111
Fin
alV
aria
nce
Bu
dg
etA
ctual
Posf
lNeg
)
Oth
erfi
nan
cing
sourc
es
(use
s):
Tra
nsf
ers
in
Tra
nsf
ers
ou
tR
epay
men
tof
loan
Issu
ance
oflo
an
Tota
loth
erfi
nan
cing
inft
ow
s(o
utn
ow
s)
Net
change
infu
nd
bal
ance
s(1
19,3
27)
(95.
358)
24,0
2912
06.1
921
123,
860
330,
052
1442
.362
)(2
86.4
90)
155,
872
Fu
nd
bal
ance
s(d
efic
its)
asof
Jun
e30
,20
09401,1
97
401197
306,1
77
30
6.1
77
441,
272
441,
272
Fu
nd
bal
ance
s(d
elic
its)
as
ofJu
ne
30,
201e
$281,8
10
305,8
39
$24
,029
$99
.985
430,
037
330,
052
$(1
,090
)5
154782
$15
5,87
2
(co
nti
nu
ed)
Tota
lre
vcn
ues
Sta
to’P
rop
172
Publi
cS
afet
y
Fin
alV
aria
nce
Bu
dget
Act
ual
PosI
(Neg
)
$79
5,19
4$
590,9
84
$(2
04,2
10)
S-
$,
$
558,
000
577,
147
19,1
47
5,34
840
8(4
,940
)
--
563,
348
577,
555
14,2
0779
5.19
459
0,98
420
4.21
0)
45,8
9444
,695
999
1,2
37,5
56
877,
475
360,
081
119,
387
95,3
5824
.029
723,
846
409,
001
314,
845
119,
387
95,3
5824
,029
769.5
40
453,
696
315,
844
1,2
37,5
56
877,
475
360,
081
(119,3
87)
__J8
24,0
29(2
05,1
92)
123,
860
330,
052
(442
,362
)(2
015
5,87
2
Tota
lex
pen
dit
ure
s
Etc
ess
(def
icie
ncy
)of
reven
ues
over
(under
)ex
pen
dit
ure
s
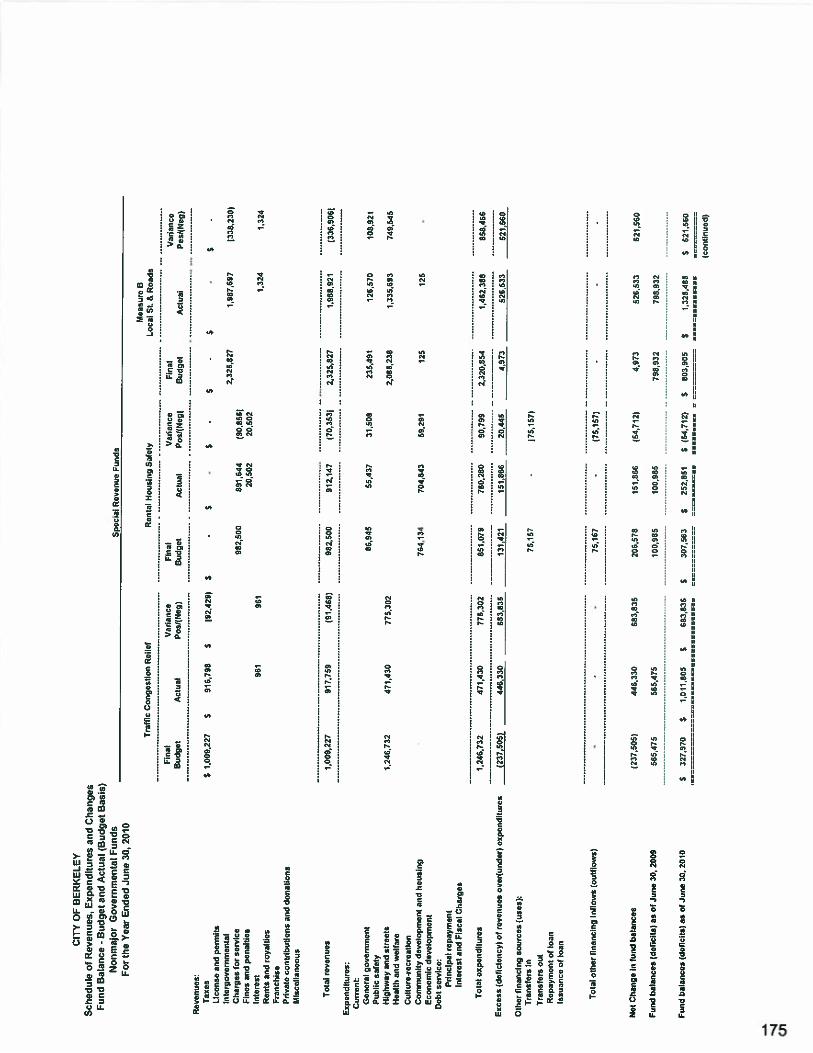
CIT
YO
FB
ER
KE
LE
YS
ched
ule
ofR
even
ues,
Expen
dit
ure
san
dC
han
ges
Fun
dB
alan
ce-
Budget
and
Act
ual
(Bud
get
Bas
is)
Non
maj
orG
over
nmen
tal
Fu
nd
sF
orth
eY
ear
End
edJu
ne
30,
2010
Tra
ffic
congest
ion
Rel
ief
Sp
ecia
lR
even
ue
Funds
Ren
tal
Housi
ng
Saf
ety
Mea
sure
SL
ocal
St.
&R
oad
s
Rev
enues
,T
axes
Lic
ense
and
per
mit
sIn
terg
over
nm
enta
lC
har
ges
for
serv
ice
Fin
esan
dpen
alti
esIn
tere
stR
ents
and
royal
ties
Fra
nch
ise
Pri
vat
eco
ntr
ibuli
ons
and
donat
ion
sM
isce
llan
eous
Expen
dit
ure
s:C
urr
ent:
Gen
eral
gover
nm
ent
Publi
csa
fety
Hig
hw
ayan
dst
reets
Hea
llh
and
wel
fare
Cult
ure
-rec
reat
ion
Convsu
nit
ydev
elopm
ent
and
ho
usi
ng
Eco
no
mic
dev
elo
pm
ent
Deb
tse
rvic
e:P
rin
cip
alre
pay
men
tIn
tere
stan
dF
isca
lC
har
ges
Oth
erfi
nan
cing
sourc
es
(use
s):
Tra
nsf
ers
in
Tra
nsf
ers
ou
tR
epay
men
tof
loan
Issu
ance
of
loan
Fin
alV
aria
nce
eudget
Act
uat
Pos/
(Neg
l
$1,0
09,2
27
$916,7
93
S(9
2,42
9)$
982,
500
891,
644
(90.
8561
20,5
0220
,502
Tota
loth
erfi
nan
cing
infl
ow
s(o
ull
low
sl-
--
75,1
57-
(75,
157
1-
-
446,3
30
206,
578
151,
866
(54,
712)
4,97
3
565,
475
565,4
75
100,
985
100,
985
526,5
33
521,5
60
$327,9
70
$1,0
11,8
05
$683,6
35
$30
7,56
3S
252,
851
$(5
4,11
2)S
803,
905
S1,3
25,4
65
5521,5
60
(conti
nued
)
Fin
alB
udges
Tota
lre
ven
ues
Var
iance
Fin
alV
aria
nce
Act
ual
Pn
s/(N
eg)
Bu
dg
etA
ctual
Po
s/(N
eg)
$-
$-
$-
S-
$-
2,3
25,8
27
1,98
7.59
7(3
38,2
30)
1,32
41,
324
912,1
47
170.
353)
2,32
5,82
71,
988,
921
(336
,906
1
56.4
3731
,508
235.
491
126,5
70
105,
921
2,0
85.2
38
1,33
5,89
374
9,54
5
961
961
1,0
09,2
27
917,
759
191.
468)
982,5
00
66,9
45
1.2
46,7
32
471,4
30
775,
302
1,2
46,7
32
471,4
30
775,
302
851.
079
(237505)
446,3
30
683,8
35
131,
421
75,1
57
Tota
lex
pen
dit
ure
s
Ex
cess
(def
icie
ncy
)of
rev
enu
esover
(under
)expendit
ure
s
764,
134
704,
843
59,2
9112
512
5
760,2
80
90,7
992,3
20,8
54
1,4
62,3
88
858,4
66
151,
866
20,4
454.
973
526.
533
521,5
60
(75,
157)
Net
Chan
ge
infu
nd
bal
ance
s
Fund
bala
nces
(def
icit
slas
ofJu
ne
30,
2009
Fund
bal
ance
a(d
efic
ils)
as
ofJu
ne
30.
2010
(237
,505
)68
3,63
5
798,
932
798,
932
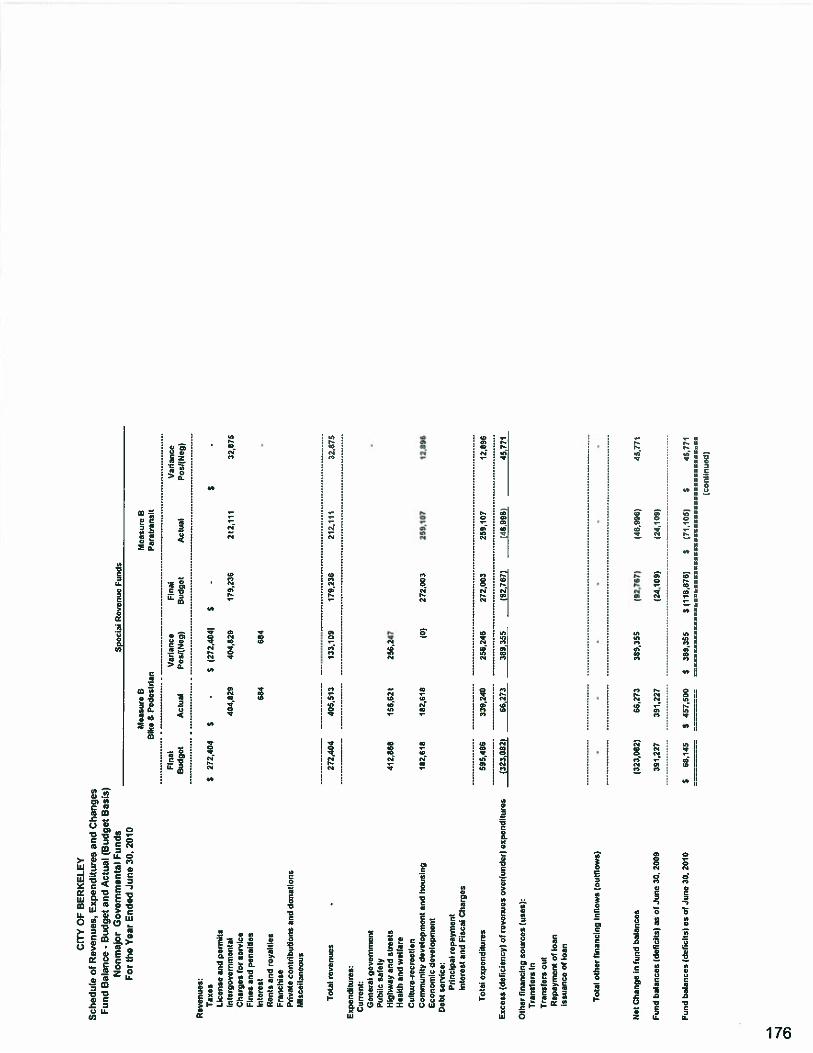
CIT
YO
FB
ER
KE
LE
YS
ched
ule
ofR
even
ues,
Expen
dit
ure
san
dC
han
ges
Fun
dB
alan
ce-
Bud
get
and
Act
ual
(Bud
get
Bas
is)
Non
maj
orG
over
nmen
tal
Fun
dsS
pec
ial
Rev
enu
eF
un
ds
For
the
Yea
rE
nded
June
30,
2010
Mea
sure
BM
easu
reS
Bik
eS
Ped
estr
ian
Par
atra
nsi
t
Fin
alV
aria
nce
Fin
alV
aria
nce
Budget
Act
ual
Pos/
flie
g)
Bu
dg
etA
ctual
Pos’
)Neg
)
Rev
enu
es:
Tax
es$
272.4
04
$-
1272
.404
1$
$-
Lic
ense
and
per
mit
sIn
terg
ov
ernm
enta
l404.8
29
404.8
29
179,
236
212,
111
32,8
76C
har
ges
for
serv
ice
Fin
esan
dp
enal
ties
Inte
rest
684
684
-
Ren
tsan
dro
yal
ties
Fra
nch
ise
Pri
vat
eco
ntr
ibuti
ons
and
donat
ion
sM
isce
llan
eous
rota
lre
ven
ues
272,
404
405,5
13
133,
109
179,
236
212,
111
32,6
75
Exp
end
itu
res:
Curr
ent:
Gen
eral
go
ver
nm
ent
-
Publi
csa
fety
Hig
hw
ayan
dst
reets
412,
868
156.
621
256,
247
Hea
lth
and
wel
fare
Cult
ure
-rec
reat
ion
Com
munit
ydev
elopm
ent
and
hou
sin
g18
2,61
818
2,61
8(0
)272,e
03
259,
107
12,8
96E
con
om
icd
evel
opm
ent
Deb
tse
rvic
e:P
rinci
pal
repay
men
tIn
tere
stan
dF
isca
lC
har
ges
Tota
lex
pen
dit
ure
s595,4
86
339,
240
256,
246
272,0
03
259,1
07
12,8
96
Exce
ss(d
efic
iency
)of
reven
ues
over
(under
)expendit
ure
s(3
23,0
82)
66,2
73
389,3
55
92,7
67)
146,
996)
45,7
71
Oth
erfi
nan
cing
sourc
es
fuse
s):
Tra
nsf
ers
in
Tra
nsf
ers
ou
tR
epay
men
tof
loan
Issu
ance
of
loan
Tota
loih
erfi
nan
cing
infl
ow
s(o
utf
low
s)-
--
Net
Chan
ge
infu
nd
bal
ance
s(3
23,0
82)
66,2
73
389,
355
92,7
67)
146,
996)
45,7
71
Fu
nd
bala
nces
def
icit
s)aso
lJu
ne
se,
2009
391,
227
391,
227
(24,
109)
(24,
109)
Fu
nd
bal
ance
s(d
etic
ital
as
ofJu
ne
30.
2010
$68,1
45
$45
7,5
00
538
9,35
5$
11
16
87
61
$(7
1.10
Sf
$45
,771
(co
nti
nu
ed)
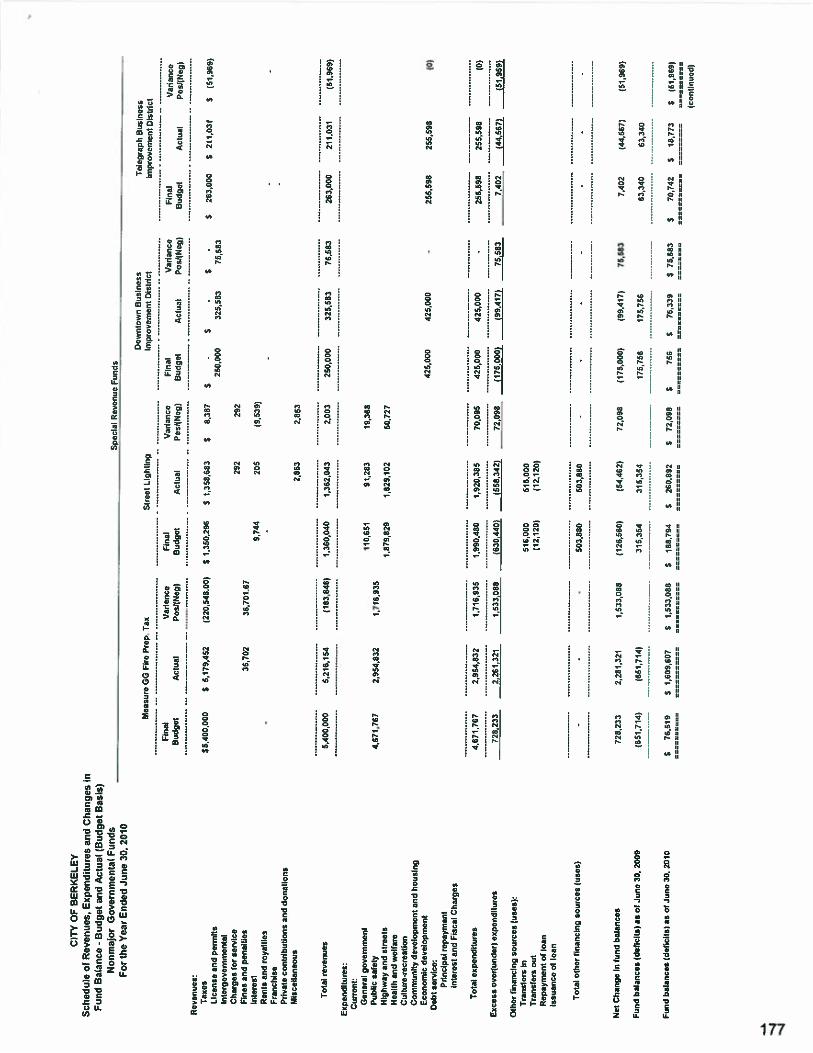
CIT
YO
FB
ER
KE
LE
YS
ched
ule
ofR
even
ues
,E
xpen
dit
ure
san
dC
han
ges
inF
und
Bal
ance
-B
udget
and
Act
ual
(Bu
dg
etB
asis
)N
on
maj
or
Go
ver
nm
enta
lF
unds
—
For
the
Yea
rE
nded
June
30,
2010
Rev
enues
:T
axes
Lic
ense
and
per
mit
sIn
terg
ov
ernm
enta
lC
har
ges
for
serv
ice
Fin
esan
dp
enal
lies
Inte
rest
Ren
tsan
dro
yal
ties
Fra
nch
ise
Pri
vat
eco
ntr
ibuti
ons
and
do
nati
ons
Mis
cell
aneo
us
Ex
pen
dit
ure
s:C
urr
ent:
Gen
eral
gover
nm
ent
Pu
bli
csa
lety
Hig
hway
and
stre
els
Hea
lthan
dw
elta
reC
ult
ure
-rec
reat
ion
Co
mm
un
ity
dev
elopm
ent
and
hou
sin
gE
con
om
icdev
elopm
ent
Deb
tse
rvic
e:P
rinci
pal
repay
men
tIn
tere
stan
dF
isca
lC
har
ges
Str
eet
Lig
hti
ng
Fin
alV
aria
nce
Bu
dg
etA
ctual
Posl
(Neg
)
Dow
nto
wn
Busi
nes
sIm
pro
vem
ent
Dis
tric
t
Fin
alV
aria
nce
Budget
Act
ual
Posl
(Neg
3
Tel
egra
ph
Busi
nes
sIm
pro
vem
ent
Dis
tric
t
Fin
alV
aria
nce
Bu
dg
etA
ctual
Posl
(Nrg
3
$26
3,00
0$
211,
031
$15
1,96
9)
Oth
erfi
nan
cin
gso
urc
es
use
s);
Tra
nsf
ers
inT
ransf
ers
ou
tR
epay
men
tof
loan
Issu
ance
of
loan
Tota
loth
erfi
nan
cing
sourc
es
(use
s)
516,0
00
516,
000
(12,
120)
(12,
120)
--
--
-50
3,88
0503,8
80
Net
Chan
ge
infu
nd
bal
ance
s728,2
33
2,26
1,32
11,5
33,0
86
(126
,560
)(5
4,46
2)72
,028
(175
,000
)(9
9,41
7)75
,583
7,40
2(4
4,56
7)(5
1,96
9)
Fu
nd
bal
ance
s(d
efic
its)
asof
Jun
e30
,20
49(6
51.7
14)
(651
,714
)31
5,35
4315,3
54
175,
756
175,
756
63,3
4063
,340
Fund
bala
nces
(def
icit
s)as
01Ju
ne30,
2010
$76,5
19
$1,
609,
607
$1,5
33,0
58
$188794
526
0,89
2$
72,0
96$
756
$76
,339
$75
,583
$70
,742
$18
,773
$(5
1,96
9)
(co
nti
nu
ed)
Mea
sure
CC
Fir
eP
rep
.T
ax
Fin
alV
aria
nce
Budget
Act
ual
Posi
(Nvg)
Sp
ecia
lR
even
ue
Fu
nd
s
$5
,40
0,0
00
S5,1
79,4
52
(220,5
4800)
$1,
350,
296
$1,3
58,6
83
36,7
0236,7
01.6
7
Tota
lre
ven
ues
Tot
alex
pen
dil
ure
s
Exce
sso
ver
(under
)ex
pen
dit
ure
s
S8,
387
5-
$.
5-
250,
000
325,
583
75,5
83
292
292
9,74
420
5(9
,539
)
2,86
32,
863
5,4
00,0
00
5,2
16,1
54
(183
,846
)1,3
60,0
40
1,3
62
04
32,
003
25
0,0
00
325,
583
75,5
8326
3,00
021
1,03
1(5
1.96
9)
110,
651
91,2
8319
,368
4,6
71,7
67
2,9
54,8
32
1,7
16,9
35
1,8
79,8
29
1,82
9,10
250
,727
425,
000
425,0
00
.25
5,59
825
5,59
8(0
)
4,6
71
.76
72,9
54,8
32
1.7
16.9
35
1,9
90,4
80
1,9
20,3
85
70,0
95
425,
000
425,0
00
.25
5,59
8255.5
98
10)
728,
233
2,26
1,32
11,5
33,0
88
(630
.440
)(5
58,3
42)
72,0
98(1
75,0
00)
(99,
417)
75,5
837,
402
(44,
567)
(51,
969)
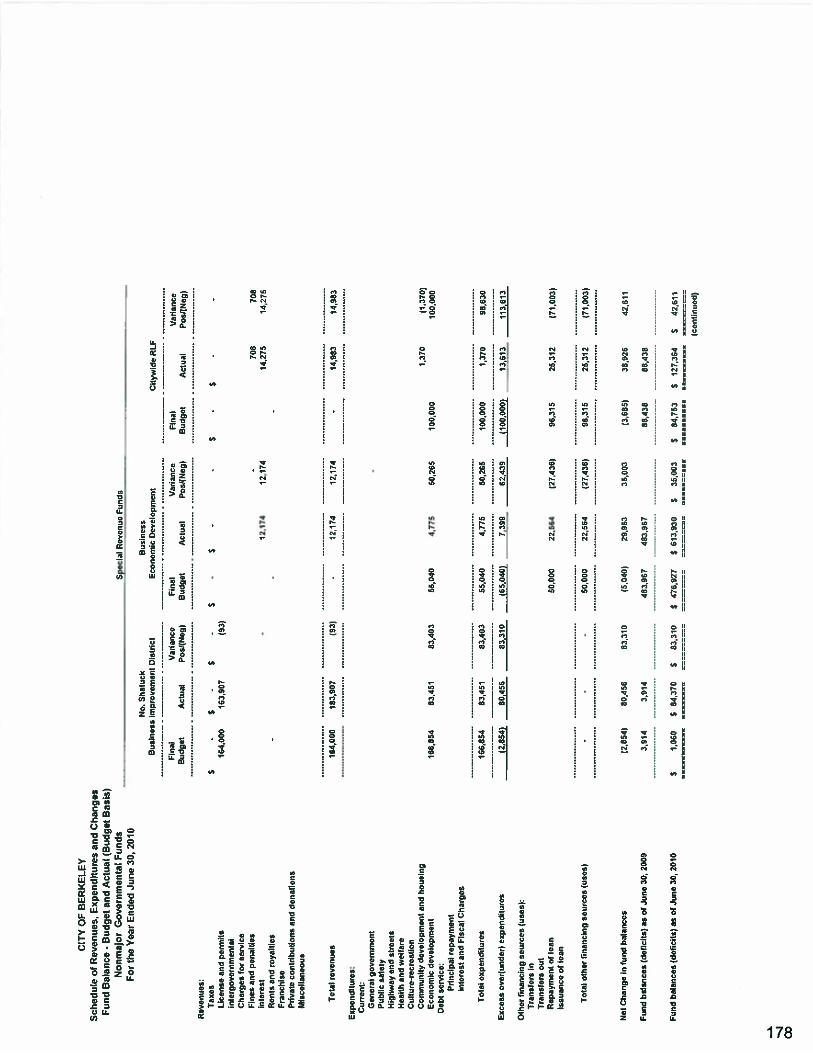
CIT
YO
FB
ER
KE
LE
YS
ched
ule
ofR
even
ues
,E
xpen
dit
ure
san
dC
han
ges
Fund
Bal
ance
-B
udget
and
Act
ual
(Budget
Bas
is)
No
nm
ajor
Go
ver
nm
enta
lF
unds
Sp
ecia
lR
even
ue
Fu
nd
s
For
the
Yea
rE
nded
June
30,
2010
No-
Sh
atu
ckB
usi
nes
sB
usi
nes
sIm
pro
vem
ent
Dis
tric
tE
conom
icD
evel
opm
ent
Cit
yat
ide
RL
F
Fin
alV
aria
nce
Fin
alV
aria
nce
Fin
alV
aria
nce
Budget
Act
ual
Po
sI)N
eg)
Bu
dg
etA
ctual
PosI
(Neg
)B
ud
get
Act
ual
PosI
)Neg
)
Rev
enu
es:
Tax
es$
-$
$-
$-
$-
-S
-$
--
Lic
ense
and
per
mit
s16
4,00
016
3,90
793
)In
terg
ov
ern
men
tal
Ch
srg
es
for
serv
ice
Fin
esan
dpen
alti
es70
870
8In
tere
st-
12,1
7412
,174
14,2
7514
,275
Ren
tsan
dro
yal
ties
--
-
Fra
nch
ise
Pri
vat
eco
ntr
ibuti
ons
and
donat
ion
sM
isce
llan
eous
Tota
lre
ven
ues
164,
009
183,
907
93)
-12
,174
12,1
7414
,983
14,9
83
Expen
dit
ure
s:C
urr
ent:
Gen
eral
gover
nm
ent
-
Publi
csa
fety
Hig
hw
ayan
dst
reets
Hea
lth
and
wel
fare
Cult
ure
-rec
reat
ion
Com
munit
yd
evel
op
men
tan
dti
ousi
ng
1,37
0(1
,37
0)
Eco
no
mic
dev
elo
pm
ent
166,
554
33,4
5183
,403
55,0
404,
775
59,2
8510
0,90
019
0,00
0D
ebt
serv
ice:
Pri
nci
pal
repay
men
iIn
tere
stan
dF
isca
lC
har
ges
Tota
lex
pen
dit
ure
s166854
83,4
5183
,403
55,0
404,
775
50,2
6510
0.00
01,
370
93,5
30
Exce
sso
ver
(under
)ex
pen
dit
ure
s(2
,854
)80,4
58
53,3
10
(55,
040)
7,39
982
,439
(100
,000
)13
,613
113,
613
Oth
erfi
nan
cin
gso
urc
es
(use
s):
Tra
nsf
ers
inT
ransf
era
ou
lR
epay
men
tof
loan
50.0
0022
,564
127,
435)
96,3
1525
,312
(71,
003)
Issu
ance
oflo
an
Tota
loth
erfi
nan
cing
sourc
es
(use
s)-
.-
50,0
0022
,564
(27,
436)
96.3
1525
.312
(71,
003)
Net
Chan
ge
infu
nd
bala
nces
(2.8
54)
80,4
5883
,310
(5.0
40)
29,9
8335
,003
13,6
85)
38,9
2642
,611
Fu
nd
bala
nces
(def
icit
s)as
ofJu
ne
30,
2009
3,91
43,
914
483,
967
483.
967
88,4
3888
,438
Fu
nd
bal
ance
s(d
erid
es)
asof
Jun
e36
,20
10$
1,06
0$
84,3
70$
83,3
105
475,9
27
$51
3,93
0S
35,0
035
84,7
53S
127,
364
$42
,611
)co
nli
nu
ed)
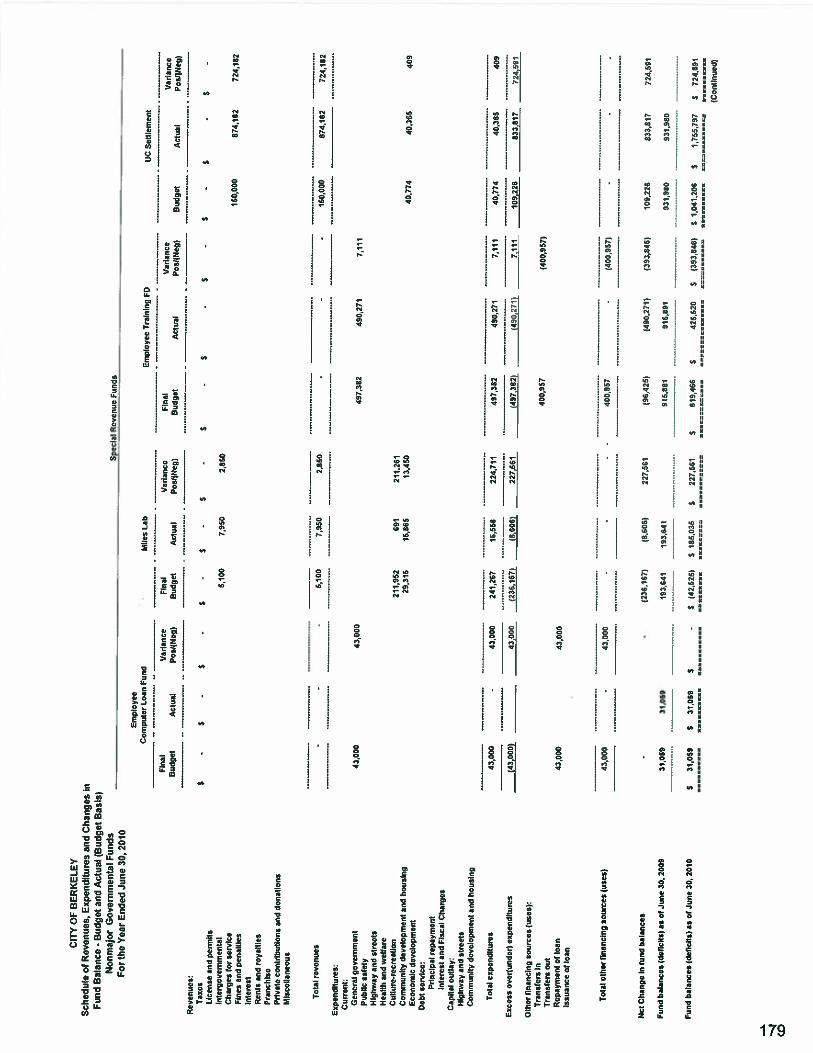
Gin
’O
FB
ER
KE
LE
YS
ched
ule
otR
even
ues
,E
xpen
dit
ure
san
dC
han
ges
inF
und
Bal
ance
-B
ud
get
and
Act
ual
(Bud
get
Bas
is)
Non
maj
orG
over
nmen
tal
Fu
nd
sSp
ecia
lR
even
ueF
unds
For
the
Yea
rE
nded
JLln
e30
,20
10E
mplo
yee
Com
pute
rL
oan
Fun
dM
iles
Lab
Em
plo
yee
Tra
inin
gFD
UC
Set
tlem
ent
FIna
lV
aria
nce
Fin
alV
aria
nce
Fin
alV
aria
nce
Var
iance
Budget
Act
ual
Pos
!(N
eg)
Budget
Act
ual
Pes
IlN
eg)
Budget
Act
ual
Pos
i(N
eg)
Budget
Act
ual
Pos
I(N
eg)
Rev
enues
:T
axes
$-
S-
$-
$.
$-
$-
S-
$-
$-
$-
S-
5L
icen
sean
dp
erm
its
Inte
rgover
nm
enta
l5,
100
7,95
02,
350
Cha
rges
(or
serv
ice
150,
000
874,
182
724,
182
Fin
esan
dp
enal
tits
Inte
rest
Ren
tsan
dro
yal
ties
Fra
nch
ise
Pri
vat
eco
ntr
ibta
liem
san
ddonat
ions
Mis
cell
aneo
us
Tot
alre
ven
ues
--
-5,
100
7,95
02,
850
--
-15
0,00
087
4,18
272
4,18
2
Es
pen
dit
Lxre
5
Curr
ent:
Gen
erai
go
ver
nm
ent
43,0
0043
,000
497,
382
480,
271
7,11
1P
ubli
csa
Fet
yH
ighw
ayan
dst
reet
sH
ealt
han
dw
elfa
reC
ult
ure
-rec
reat
ion
211,
952
691
211,
261
Com
munit
yd
evel
op
men
tan
dhousi
ng
29,3
1515
,865
¶3,4
5040
,774
40,3
6540
9E
conom
icdev
elo
pm
ent
Deb
tse
rvic
e:P
rinc
ipal
rep
aym
ent
Inte
rest
and
Fis
cai
Char
ges
Cap
ital
outl
ay:
Hig
hway
and
stre
ets
Com
munit
yd
evel
op
men
tan
dhousi
ng
Tot
alex
pen
dit
ure
s43
,000
43,0
0024
1,26
716
,556
224,
711
49
13
82
490,
271
7,11
140
,774
40,3
6540
9
Ex
cess
over
iundor)
expen
dit
ure
s_j9
90
43.0
00(2
36,1
671
(8,6
06)
227,
561
i497
,382
i(4
00,2
71)
7,11
110
9,22
683
3,81
772
4,59
1
Oth
erfi
nan
cin
gso
urc
es(u
ses)
:T
ran
sfer
sin
400,
957
(400
,957
)T
ran
sfer
sou
tR
epay
men
tor
loan
43,0
0043
,000
Issu
ance
oflo
an
Tot
alo
ther
fin
anci
ng
sourc
es(u
ses)
43,0
00-
43,0
00-
--
-40
0,95
7-
(400
,957
)-
.
Net
Chan
ge
infu
nd
bxia
nce
s-
-12
36.1
67)
18,6
06)
227,
561
(96.
4251
(490
,271
)(3
93,8
46)
109226
833,
817
724,
501
Fun
db
alan
ces
(det
iclt
s)as
ofJu
ne
30
,2009
31,0
5931
,059
193,
641
193,
641
915,
891
915,
891
931,
980
931,
980
Fun
dbal
ance
s(d
erid
es)
asof
June
30,
2010
531
,059
$31
,059
5-
S(4
2,52
6i$
185,
035
$22
7.56
1$
819,
466
542
5,62
0$
(393
,846
)5
1,0
41
,20
6$
1,76
5,79
7$
724,
591
(Conti
nued
i

CIT
YO
FB
ER
KE
LE
YS
ched
ule
ofR
even
ues
,E
xp
end
itu
res
and
Chan
ges
iF
und
Bal
ance
-B
udge
tan
dA
ctua
l(B
udge
tB
asis
)N
onm
ajor
Gov
ernm
enta
lFL
inds
For
the
Yea
rE
nded
June
30,
2010
Rev
enu
es:
Tax
esL
icen
sean
dp
erm
its
inte
rgo
ver
nm
enta
lC
har
ges
for
serv
ice
Fin
esan
dp
enal
ties
Inte
rest
Ren
tsan
dro
yal
ties
Fra
nch
ise
Pri
vat
eco
ntr
ibu
tio
ns
and
donat
ions
Mis
cell
aneo
us
Ex
pen
dit
ure
s:C
urr
ent:
Gen
eral
go
ver
nm
ent
Pub
lic
safe
tyH
ighw
ayan
dst
reet
sH
ealt
han
dw
elfa
reC
uIt
ure
-re
cro
eti
nC
om
munit
yd
ovcl
opm
ent
and
ho
usi
ng
Eco
nom
icd
evcl
op
men
iD
ebt
serv
ice:
Pri
nci
pal
rep
aym
ent
Inte
rest
and
Fls
tai
Ch
arg
esC
apit
aloutl
ay:
Hig
hway
and
stre
ets
Com
munit
yd
evel
op
men
tan
dhousi
ng
Pri
vat
eP
arty
Sid
ewal
ks
Fin
alV
aaia
nco
Bu
dg
etA
ctua
lP
osl
(Neg
)
$.
$-
$-
Pub
lic
Afl
Fin
alV
aria
nce
Fin
alB
udget
Act
ual
Po
siif
leg
)B
udget
$-
S-
$-
$-
1.66
2,31
9c1
23,8
68
Oth
erfi
nan
cing
sou
rco
s(u
sesi
:T
ran
sfer
sin
Tra
nsf
ers
out
Rep
aym
ent
ofle
anIs
suan
ceor
loan
65,5
2265
,522
1,55
3,01
81,
953,
018
(2,6
04,0
24)
(2,6
04,0
24)
Tot
alo
ther
Iinan
cinq
sourc
es(u
ses)
--
-55
,522
65,5
22i6
51.O
OSi
(651
.006
)-
Net
Chan
ge
infu
ndbal
ance
s11
20.5
46)
36,4
9015
7,03
6(4
3,86
3)(1
3.74
0)3,
897
8,00
74,
110
(1,3
25,4
03)
(873
,814
)45
1,38
9
Fun
dbal
arse
cs(d
enci
ts)
asof
Jun
e30
,20
09
Fun
db
alan
ces
idet
icit
s)as
ofJu
ne
30,
2010
2,15
52,
188
128.
754
128,
754
175,
131
175.
131
1,22
2,88
51,
222,
885
(118
,391
)5
36,6
455
157,
036
S84
.891
S11
5,01
4$
30,1
235
179,
028
S18
3,13
65
4,11
05
(102
,518
)$
349,
071
S45
1,58
5
iconti
nued
i
Spec
ial
Rev
enue
Funds
Vita
l
135,
690
Tot
alre
ven
ues
35,6
90
Hea
lth
Sta
tist
icH
ealt
hS
tate
Aid
Var
iance
Fin
alV
aria
nce
Acl
ual
Posi
iNeg
)B
udget
Act
ual
Pos
fIN
eg)
S-
S-
$-
$-
$-
1,78
6,18
71,
662,
319
(123
,868
)36
,000
Tot
alex
pen
dit
ure
s
Etc
oss
over
(un
der
)ex
pen
dit
ure
s
100,
000
31,4
41(4
,560
)
100,
000
136,
690
35,6
90-
-36
.000
31,4
41(4
,560
)1,
786,
187
18,3
295,
262
13.0
67
220.
546
99,2
0012
1,34
632
,103
23,4
338,
670
2,44
2.26
51,
879,
865
562,
390
109,
386
79.2
6230
.123
220,
546
99,2
0012
1,34
610
9,38
579
,262
30,1
2332
,103
23,4
338,
670
2,46
0,58
41,
885,
127
575,
467
(120
,546
)36
,490
157,
036
(109
.385
)(7
9,26
2)30
,123
3,89
78.
007
4,11
0(6
74,3
97)
(222
,806
)45
1,68
9
30,1
23
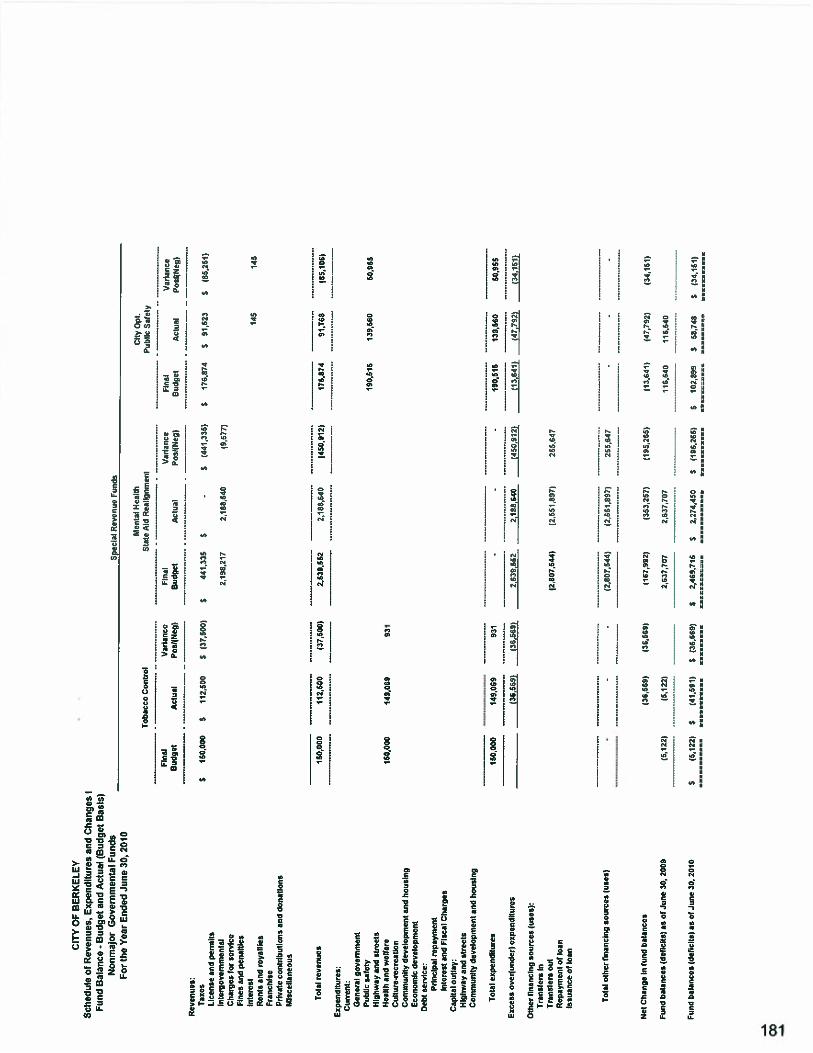
CIT
YO
FB
ER
KE
LE
YS
ched
ule
ofR
even
ues
,E
xpen
dit
ure
san
dC
han
ges
iF
und
Bal
ance
-B
ud
get
and
Act
ual
(Bud
get
Bas
is)
Non
maj
orG
over
nmen
tal
Fu
nd
sS
pec
ial
Rev
enue
Funds
For
the
Yea
rE
nded
June
30,
2010
Men
tal
Hea
lth
Cit
yO
pt,
To
bac
coC
ontr
olS
tale
Aid
Rea
lignm
ent
Pub
lic
Saf
ely
Fin
alV
aria
nce
Fin
alvar
iance
Fin
alV
aria
nce
Bu
dg
etA
ctua
lP
osfl
Neg
)B
udget
Act
ual
Pos
flN
eg)
Budget
Act
ual
Posq
Neg
)
Rev
enues
:T
axes
$15
0,00
0S
112,
500
S(3
7,50
0)$
441,
335
$-
5(4
41,3
35)
$17
6,87
4$
91,6
23$
(85,
251)
Lic
ense
and
per
mit
sin
terg
over
nm
enta
l2,
188,
217
2,18
8,64
09,
577)
Ch
arg
esfo
rso
rvic
eF
ines
and
pen
alti
esIn
tere
st14
5‘1
45R
ents
and
royal
ties
Fra
nch
ise
Pri
vat
eco
ntr
ibu
tio
ns
and
donat
ions
Mis
cell
aneo
us
Tot
alro
ven
uo
s15
0,00
011
2,50
0(3
7,50
0)2.
639,
552
2188,6
40
1450
,912
117
6,87
491
.768
85,1
05)
Etp
endit
ure
s:C
urr
ent:
Gen
eral
go
ver
nm
ent
Pub
lic
safe
ty19
0,51
513
9,56
050
,955
Hig
hway
and
stre
ets
Hea
lth
and
wel
fare
150,
000
149,
069
031
Cu
itur
o-r
ecre
alio
nC
om
munit
yd
evcl
op
men
tan
dh
ou
sing
Eco
nom
icdev
elo
pm
ent
Deb
tse
rvIc
e:P
rinc
ipal
rep
aym
ent
inte
rest
and
Fis
cal
Ch
arg
esC
apit
aloutl
ay:
Hig
hway
and
stre
ets
Com
munit
yd
evel
op
men
tan
dhousi
ng
Tot
alex
pen
dit
ure
s15
0,00
014
9,06
993
1.
.-
190,
515
138,
560
50,9
55
Ex
cess
over
(un
der
)ex
pen
dit
ure
s
______________
(36.
569)
.J!!1
2,63
9.55
22,
188,
640
_J!c,l2
(13.
641)
(47,
782)
(34,
151)
Oth
ern
nan
cin
gso
urc
es(u
ses)
:T
ran
sfer
sin
Tra
nsf
ers
out
2807,5
44)
(2.5
51.0
971
255.
647
Rep
aym
ent
otlo
anIs
suan
ceof
lean
Tot
alo
ther
fin
anci
ng
sourc
esuse
s).
-(2
,807
,544
)2,
551,
897)
255,
647
.-
Net
Chan
ge
infu
ndbal
ance
s(3
6,56
9)(3
6.56
9)11
67,9
921
(363
,257
)(1
95,2
65)
(13.
641)
(47,
792)
(34.
151)
Fun
db
atan
ces
(def
icit
s)as
oaJu
ne
3D,
2009
t5.1
22)
(5.1
221
2,63
1,70
72,
637,
707
116,
540
116,
540
Fun
dbal
ance
s(d
eric
itsi
asof
June
30.
2010
$(5
,12
2)
$(4
1,6
91)
5(3
6,5
69)
$2,
469,
715
$2,
274,
450
S(1
95.2
65)
$10
2,89
9$
68,7
48S
(34,
151)
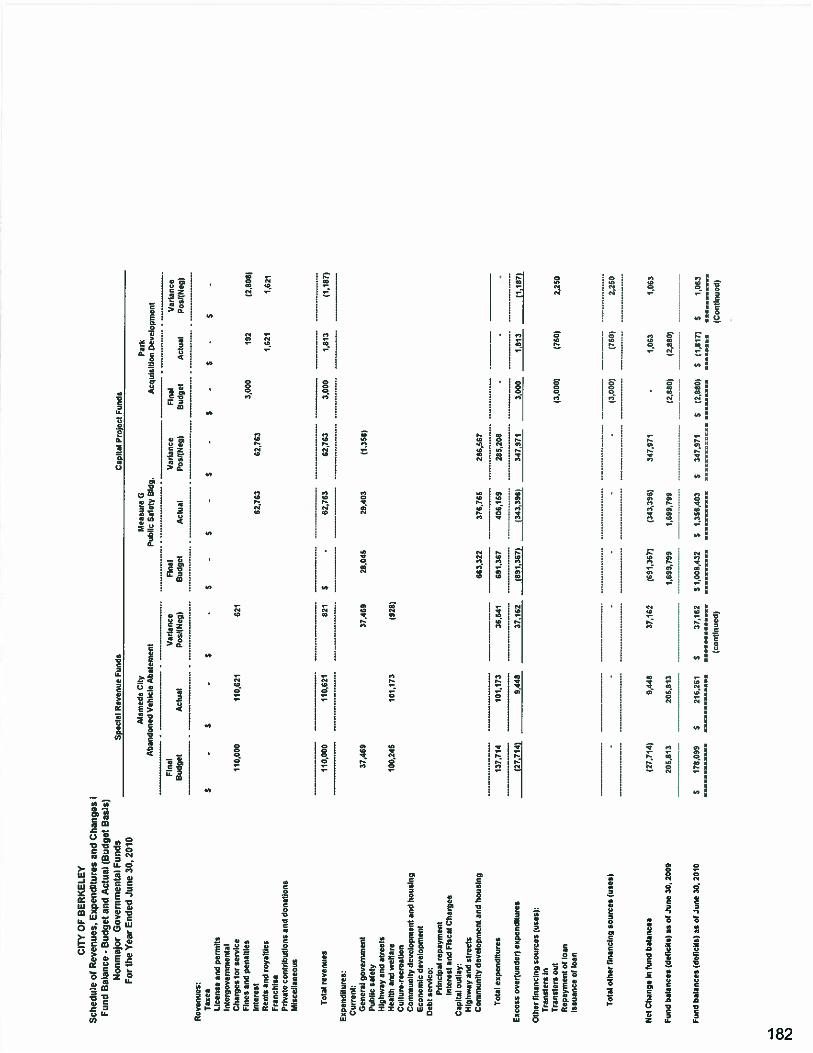
CIT
YO
FB
ER
KE
LE
YS
ched
ule
ofR
even
ues
,E
xp
end
itu
res
and
Chan
ges
iF
und
Bal
ance
-B
udge
tan
dA
ctua
l(B
udge
tB
asis
)N
onm
ajor
Gov
ernm
enta
lF
un
ds
For
the
Yea
rE
nded
June
30.
2010
Rev
enues
:T
axes
Lic
ense
and
per
mit
sIn
terg
over
nm
enta
lC
har
ges
for
serv
ice
Fin
esan
dp
enal
ties
Inte
rest
Ren
tsan
dro
yal
ties
Fra
nch
ise
Pri
vat
eco
ntr
ibu
tio
ns
and
donat
ions
Mis
cell
aneo
us
Spec
ial
Rev
enue
Funds
Ala
med
aC
ity
Ab
and
on
edv
ehic
leA
bat
emen
t
Fin
alV
aria
nce
Bu
dg
etA
ctua
lP
osl
lt4
rg)
-$
110,
000
110,
621
Cap
ital
Pro
ject
Funds
Mea
sure
GP
ant
Pub
lic
Saf
ely
Bld
g.A
cquis
itio
nD
evel
opm
ent
Fin
alv
aria
nce
Fina
lV
aria
nce
Budget
Act
ual
Posl
iNep
)B
udget
Act
ual
Pos
l(N
eg)
-$
621
S-
$-
$-
$.
$
3,00
018
2(2
,808
)62
,763
62,7
631,
621
1,62
1
exp
endit
ure
s:C
urr
ent:
Gen
era!
gover
nm
ent
Pub
lic
safe
tyH
ighw
ayan
dst
reet
sH
ealt
han
dw
elfa
reC
ult
ure
-rec
reat
ion
Com
munit
yd
evel
op
men
tan
dhousi
ng
Eco
nom
icdev
elopm
ent
Deb
tse
rvic
e:P
rinci
pal
rep
aym
ent
Inte
rest
and
Fis
cal
Char
ges
Cap
ital
outl
ay:
Hig
hway
and
stre
ets
Com
munit
yd
evel
op
men
tan
dhousi
ng
Oth
erfi
nan
cing
sou
rces
(use
s):
Tra
nsf
ers
inT
ran
sfer
sout
Rep
aym
ent
oflo
anIs
suan
ceot
loan
663,
322
376,
755
36,5
4169
1,36
740
6,15
9
37,1
6221
36Z
).(3
43,3
96)
(3,0
00)
(750
)22
50
Tot
alo
ther
nn
anci
ng
sou
rces
(use
s)-
.-
-3.
000)
(750
)2.
250
Net
Chan
ge
infu
ndbal
ance
s(2
7.71
419,
448
37.1
62(6
91367)
(343
.394
)34
7,97
11,
063
1,04
3
Fun
db
alan
ces
(deF
icit
s)as
otJu
ne
30,
2000
20
5,8
13
20
5,8
13
1,6
99,7
98
1,6
88
,79
9(2
,8s0
)(2
,880
1
Fun
dbal
ance
s(d
efic
its)
asof
June
30,
2010
$17
8,09
9$
285,
261
37
,16
2S
1,00
8,43
2S
1.35
6,40
3$
347,
971
S(2
,880
)$
(1,8
17)
SI
063
(conti
nued
)(C
onti
nued
)
Tot
alre
ven
ues
110,
000
110,
621
37,4
69
100,
245
101,
173
137,
714
101,
173
(27,
714)
9,44
5
621
$-
62,7
6362
,763
3,00
01,
813
(1,1
87)
37,4
6928
.045
29,4
0311
.358
)
(928
)
Tot
alex
pen
dit
ure
s
Ex
cess
over
(un
der
)ex
pen
dit
ure
s
286,
567
285,
208
347,
971
3,00
01,
813
(1.1
87)
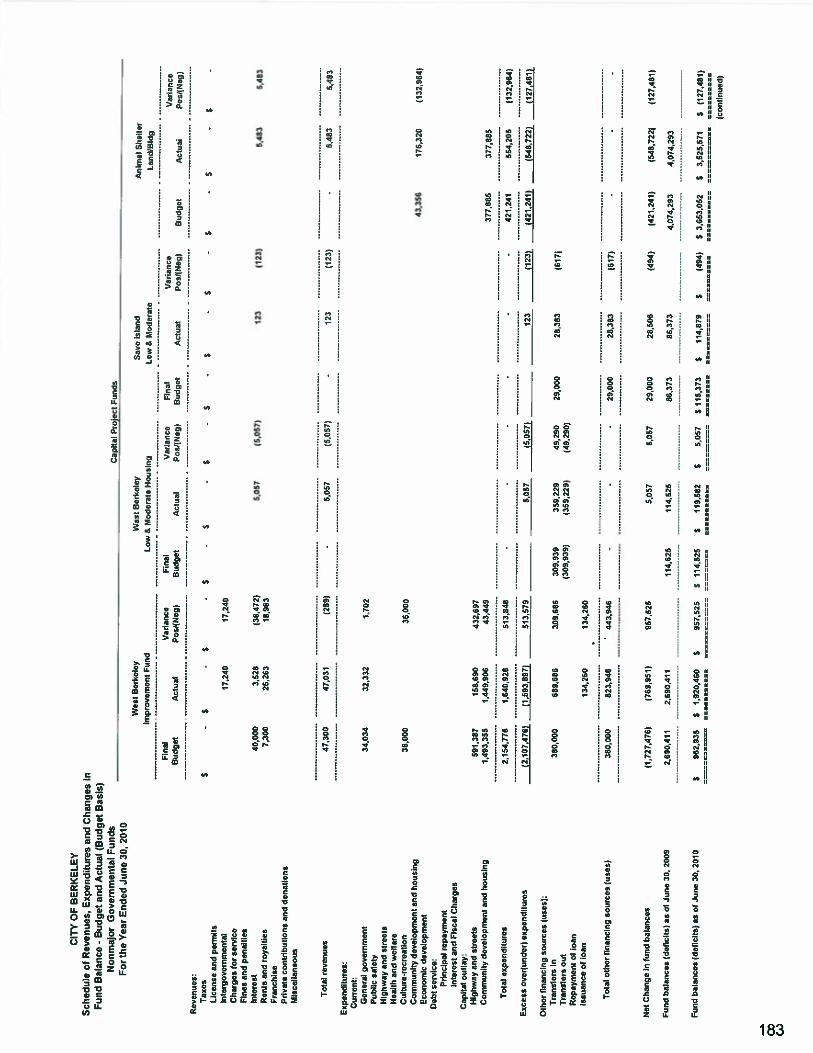
CIT
YO
FB
ER
KE
LE
YS
ched
ule
ofR
even
ues,
Expen
dit
ure
san
dC
han
ges
inF
und
Bal
ance
-B
udget
and
Act
ual
(Bud
get
Bas
is)
Non
maj
orG
over
nmen
tal
Fun
dsC
apit
alP
roje
ctF
unds
For
the
Yea
rE
nded
June
30,
2010
Wes
tB
erkel
eyW
est
Ber
kel
eyS
avo
Isla
nd
Ani
mal
Shel
ter
Impro
vem
ent
Fu
nd
Low
&M
od
erat
eH
ousi
ng
Low
&M
oder
ate
Lan
d/B
ldg
Fin
alV
aria
nce
Fin
alV
aria
nce
Fin
alV
aria
nce
Var
iance
Bu
dg
etA
ctual
Pos/
(Neg
)B
ud
get
Act
ual
Po
st/N
ag)
Bu
dg
etA
ctual
Po
st/N
ag)
Budget
Act
ual
Po
sl(N
egl
Rev
enues
:Ta
xes
$-5
-5
-5
-$
-$
-$
-$
-$
.$
-S
-S
Lic
ense
and
per
mit
sIn
terg
ovem
men
lal
11.2
4017
.240
Ch
arg
es
for
serv
ice
Fin
esan
dp
enal
ties
Inte
rest
40,0
00
3,52
8(3
6.47
2)5,
057
(50
57
)12
3(1
23)
5,46
35,
483
Ren
tsan
dro
yal
ties
7,30
026
,263
18,9
63F
ranch
ise
Pri
vat
eco
ntr
ibuti
ons
and
donat
ion
sM
isce
llan
eous
Tota
lre
ven
ues
47,3
00
47,0
31(2
89)
-5,
057
15.0
57)
-12
3(1
23)
-5,
483
5,48
3
Expen
dit
ure
s:C
urr
ent:
Gen
eral
gover
nm
ent
34,0
3432
,332
1.70
2P
ub
lic
safe
tyH
ighw
ayan
dst
reets
Hea
lth
and
wel
fare
Cult
ure
-rec
reat
ion
36,0
0036
,000
Co
mm
un
ity
dev
elo
pm
ent
and
hou
sin
g43
,356
176.
320
(132
,964
)E
con
om
icd
svet
op
nie
nt
Oel
,tse
rvic
e:P
rinci
pal
repay
men
tIn
tere
stan
dF
isca
lC
harg
es
Cap
ital
outl
ay:
Hig
hw
ayan
dst
reets
591,
387
168,
690
432,6
97
Co
mm
un
ity
dev
elo
pm
ent
and
hou
sin
g1,4
93,3
55
1,44
9,90
643449
377,
885
377,
885
Tota
lex
pen
d,t
ure
s2
,15
4,7
76
1,6
40,9
26
513,
648
-.
.-
-42
1,24
155
4,20
5(1
32,9
64)
Etc
ess
ov
er(u
nder
)esp
endit
ure
s(2
,107,4
76)
(1,5
93,8
97)
513,
579
___________
5,05
7J7L
__________
123
(123
)(4
21,2
41)
(548
,722
1(1
27,4
81)
Oth
erfi
nan
cing
sourc
es
(use
s):
Tra
nsf
ers
in38
0,00
068
9,68
6309,6
88
309,
939
359,
229
49,2
90
29,0
0028
,383
(617
)T
ransf
ers
ou
t(3
09,9
39)
(359
,229
)(4
9,29
0)R
epay
men
tof
loan
Issu
ance
oflo
an13
4,26
013
4,25
0
Tota
loth
erfi
nan
cing
sourc
es
(use
s)38
0,00
082
3,94
6‘
443,9
46
-29
,000
28,3
83(6
17)
--
Net
Chan
ge
infu
nd
bala
nces
(1,7
27,4
76)
(769
,951
)957,5
25
5.05
75,
057
29,0
0028
,506
(494
((4
21.2
41)
(548
,722
1(1
27,4
81)
Fund
bala
nces
(deF
icil
s)as
ofJu
ne
30,
2009
2,69
0,41
12,
690.
411
114,
525
114,
525
88,3
7386
,373
4,0
74,2
93
4,0
74,2
93
Fund
bal
ance
s(d
efic
its)
as
ofJu
ne
30,
2010
$962,9
35
$1,9
20,4
60
$957,5
25
$11
4,52
5$
119,
582
$5,
057
$11
5,37
3$
114,
879
$(4
94)
$3,6
53,0
52
$3,
525,
571
$(1
27,4
81)
(conti
nued
)

CIT
YO
FB
ER
KE
LE
YS
ched
ule
ofR
even
ues
,E
xp
end
itu
res
and
Chan
ges
inF
und
Bal
ance
-B
ud
get
and
Act
ual
(Bud
get
Bas
is)
Non
maj
orG
over
nmen
tal
Fu
nd
sD
ebt
Ser
vice
Fun
dsF
orth
eY
ear
End
edJu
ne
30,
2010
Sal
esL
ease
09M
easu
reFF
Wes
tB
erke
ley
Fin
anci
ngL
ibra
ryIm
prov
emen
tF
und
Fin
alV
aria
nce
Fin
alV
aria
nce
Fin
alV
aria
nce
Bud
get
Act
ual
Pos
l(N
eg)
Bud
get
Act
ual
Pos
l(N
eg)
Bud
get
Act
ual
Pos
f(N
eg)
Rev
enue
s;T
axes
$-
$-
$-
$42
2,70
6$
1,43
0,74
3$
1,00
8,03
7$
1,51
2,06
1$1
,781
,081
$26
9,02
0L
icen
sean
dpe
rmit
sIn
terg
over
nmen
tal
Char
ges
for
serv
ice
Fin
esan
dpen
alti
esIn
tere
st29
2915
,000
3(1
4,99
7)R
ents
and
roya
ltie
sF
ranch
ise
Pri
vate
con
trib
uti
on
san
ddon
atio
ns
Mis
cell
aneo
us
Tot
alre
ven
ues
-29
2942
2,70
61.
430,
743
1,00
8,03
71,
527,
061
1,78
1,08
425
4,02
3
Exp
endi
ture
s;C
urre
nt;
Gen
eral
go
ver
nm
ent
Pub
lic
safe
tyH
ighw
ayan
dsl
reet
sH
ealt
han
dw
elfa
reC
ult
ure
-rec
reat
ion
Com
mun
ity
dev
elopm
ent
and
ho
usi
ng
148,
064
148,
496
(432
)E
cono
mic
dev
elo
pm
ent
Deb
tse
rvic
e;P
rinc
ipal
repa
ymen
t51
0,00
051
0,00
076
0,00
076
0,00
0In
tere
stan
dfi
scal
char
ges
162,
275
166,
203
(3,9
28)
422,
706
423,
501
(795
)19
2,88
519
0,33
52,
550
Tot
alex
pen
dit
ure
s67
2,27
567
6,20
3(3
,928
)42
2,70
642
3,50
1(7
95)
1,10
0,94
91,
098,
831
2,11
8
Ex
cess
over
(und
er)
exp
end
itu
res
(672
,275
)(6
76,1
74)
__
__
__
__
__
__
1,00
7,24
21,
007,
242
426,
112
682.
253
256,
141
Oth
erfi
nanc
ing
sourc
es(u
ses)
;T
ransf
ers
in95
4,31
357
9,76
0(3
84,5
53)
309,
939
359,
229
49,2
90T
ransf
ers
out
(689
,939
)(1
,048
,915
)(3
58,9
76)
Rep
aym
ent
oflo
anIs
suan
ceof
loan
Tot
aloth
erfi
nanc
ing
sourc
es(u
ses)
964,
313
579.
760
(364
,553
)-
--
(380
,000
)(6
89.6
86)
(309
,686
)
Net
Cha
nge
infu
ndb
alan
ces
292,
038
(96,
414)
(388
,452
)1,
007,
242
1,00
7,24
246
,112
(7,4
33)
(53,
545)
Fun
dbal
ance
s(d
efic
its)
asof
June
30,
2009
193,
364
193,
384
656,
836
656,
836
Fun
db
alan
ces
(def
icit
s)as
ofJu
ne
30.
2010
$48
5,42
2$
96,9
70$
(388
,452
)$
-$
1,00
7,24
2$
1,00
7,24
2$
702,
948
$64
9,40
4$
(53,
545)
(con
tinu
ed)
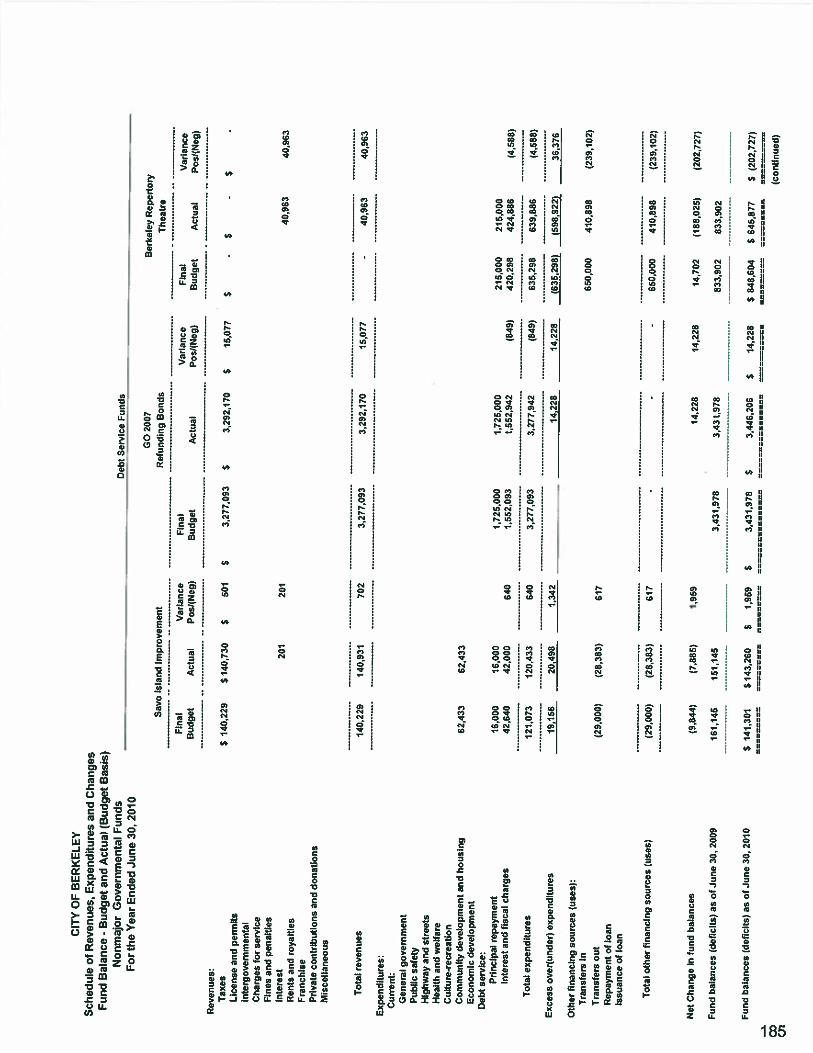
CIT
YO
FB
ER
KE
LE
YS
ched
ule
ofR
even
ues
,E
xp
end
itu
res
and
Chan
ges
Fun
dB
alan
ce-
Bu
dg
etan
dA
ctua
l(B
udge
tB
asis
)N
onm
ajor
Gov
ernm
enta
lF
un
ds
Deb
tS
ervi
ceF
unds
For
the
Yea
rE
nded
Jun
e30
,20
10G
O20
07B
erke
ley
Rep
erto
ryS
avo
Isla
ndIm
prov
emen
tR
efun
ding
Bon
usT
heat
re
Fin
alV
aria
nce
Fin
alV
aria
nce
Fina
lV
aria
nce
Bud
get
Act
ual
Pos
i(N
eg)
Bud
get
Act
ual
Pos
/(N
eg)
Bud
get
Act
ual
Pos
I(N
eg)
Rev
enue
s:T
axes
$14
0,22
9$1
40,7
30$
501
$3,
277,
093
$3,
292,
170
$15
,077
$-
$-
$-
Lic
ense
and
per
mit
sIn
terg
over
nmen
tal
Char
ges
for
serv
ice
Fin
esan
dp
enal
ties
Inte
rest
201
201
40,9
6340
,963
Ren
tsan
dro
yalt
ies
Fra
nch
ise
Pri
vate
contr
ibuti
ons
and
don
atio
ns
Mis
cell
aneo
us
Tot
alre
ven
ues
140,
229
140.
931
702
3,27
7,09
33,
292,
170
15,0
77-
40,9
6340
.963
Exp
endi
ture
s:cu
rren
t:G
ener
alg
ov
ern
men
tP
ubli
csa
fety
Hig
hway
and
stre
ets
Hea
lth
and
wel
fare
Cul
ture
-rec
reat
ion
com
munit
yd
evel
op
men
tan
dh
ou
sin
g62
,433
62,4
33E
cono
mic
dev
elo
pm
ent
Deb
tse
rvic
e:P
rinc
ipal
repa
ymen
t16
,000
16,0
001,
725.
000
1,72
5,00
021
5,00
021
5.00
0In
tere
stan
dfi
scal
char
ges
42,6
4042
,000
640
1,55
2,09
31,
552,
942
(849
)42
0,29
842
4,88
6(4
588)
Tot
alex
pen
dit
ure
s12
1,07
312
0,43
364
03,
277,
093
3,27
7,94
2(8
49)
635,
298
639,
886
(4,5
88)
Exce
ssov
er(u
nder
)ex
pen
dit
ure
s19
,156
20,4
981.
342
14,2
2814
,228
_J9
8j2
2)
36,3
76
Oth
erfi
nanc
ing
sourc
es(u
ses)
:T
rans
fers
in65
0,00
041
0,89
8(2
39,1
02)
Tra
nsf
ers
out
(29.
000)
(28,
383)
617
Rep
aym
ent
oflo
anIs
suan
ceof
loan
Tot
aloth
erF
inan
cing
soL
irce
s(u
ses)
(29,
000)
(28.
363)
617
--
-65
0,00
041
0,89
8(2
39,1
02)
Net
Cha
nge
infu
ndbal
ance
s(9
,844
)(7
,885
)1,
959
14.2
2814
,228
14,7
02(1
88,0
25)
(202
.727
)
Fun
db
alan
ces
(def
icit
s)as
ofJu
ne
30,
2009
151,
145
151,
145
3,43
1,97
63,
431,
978
833,
902
833,
902
Fun
db
alan
ces
(def
icit
s)as
ofJu
ne
30.
2010
$14
1,30
1$1
43,2
60$
1.95
9$
3,43
1978
$3,
446,
206
$14
,228
$848,6
04
$645,8
77
$(2
02,7
27)
(con
tinu
ed)
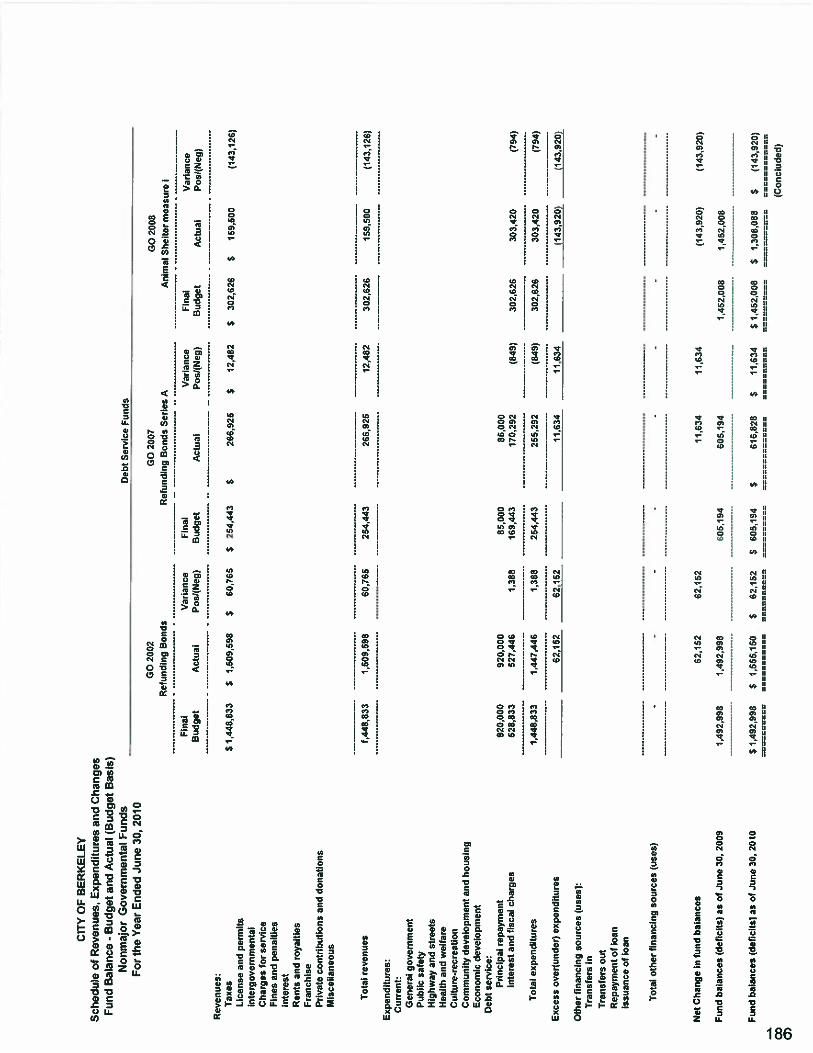
CIT
YO
FB
ER
KE
LE
YS
ched
ule
ofR
even
ues
,E
xpen
dit
ure
san
dC
han
ges
Fun
dB
alan
ce-
Bud
get
and
Act
ual
(Bud
get
Bas
is)
Non
maj
orG
over
nmen
tal
Fu
nd
sD
ebt
Ser
vice
Fun
dsF
orth
eY
ear
End
edJu
ne
30,
2010
GO
2002
GO
2007
GO
2008
Ref
undi
ngB
onds
Ref
undi
ngB
onds
Ser
ies
AA
nim
alS
helt
erm
easu
reI
Fina
lV
aria
nce
Fina
lV
aria
nce
Fina
lV
aria
nce
Bud
get
Act
ual
Pos
I(N
eg)
Bud
get
Act
ual
Pos
i(N
eg)
Bud
get
Act
ual
Pos
t(N
eg)
Rev
enue
s:T
axes
51
44
8,8
33
$15
09,5
98$
60,7
65$
254,
443
$26
6,92
5$
1248
2$
302,
626
$15
9,50
0(1
43,1
26)
lice
nse
and
perm
its
Inte
rgov
ernm
enta
lch
arges
for
serv
ice
Fin
esan
dp
enal
ties
Inte
rest
Ren
tsan
dro
yalt
ies
Fra
nch
ise
Pri
vate
contr
ibuti
ons
and
donat
ion
sM
isce
llan
eou
s
Tot
alre
venL
ies
1,44
8,83
31,
509,
598
60,7
6525
4,44
326
6,92
512
,482
302,
626
159,
500
(143
.126
)
Ex
pen
dit
ure
s:C
urre
nt:
Gen
eral
go
ver
nm
ent
Pub
lic
safe
tyH
ighw
ayan
dst
reet
sH
ealt
han
dw
elfa
reC
ultu
re-r
ecre
atio
nC
omm
unit
yd
evel
op
men
tan
dh
ou
sin
gE
cono
mic
dev
elo
pm
ent
Deb
tse
rvic
e:P
rinc
ipal
repa
ymen
t92
0,00
092
0,00
085
,000
85,0
00In
tere
stan
dfi
scal
char
ges
5288
3352
7,44
61,
388
169,
443
170.
292
(849
)30
2,62
630
3,42
0(7
94)
Tot
alex
pen
dit
ure
s1,
448,
833
1,44
7,44
61,
388
254,
443
255,
292
(849
)30
2,62
630
3,42
0(7
94)
Ex
cess
over
(und
er)
expen
dit
ure
s
__
__
__
____
62
16
262
,152
___________
11,6
3411
634
__
__
__
__
__
_
—(1
43,9
20)
(143
,920
)
Oth
erfi
nanc
ing
sourc
es(u
ses)
:T
ransf
ers
inT
ransf
ers
out
Rep
aym
ent
oflo
anIs
suan
ceof
loan
Tot
aloth
erfi
nanc
ing
sourc
es(u
ses)
--
--
--
-
Net
Cha
nge
infu
ndbal
ance
s62
,152
62,1
5211
,634
11,6
34(1
4392
0)(1
43,9
20)
Fun
db
alan
ces
(def
icit
s)as
ofJu
ne
30,
2009
1,49
2,99
81,
492,
998
605,
194
605,
194
1,45
2.00
81,
452,
008
Fun
db
alan
ces
(def
icit
s)as
ofJ
un
e30
,20
10$1
,492
,998
$1,
555.
150
$62
.152
$60
5,19
4$
616,
828
$11
,634
$1,4
52,0
08$
1.30
8,08
8$
(143
,920
)
(Con
clud
ed)
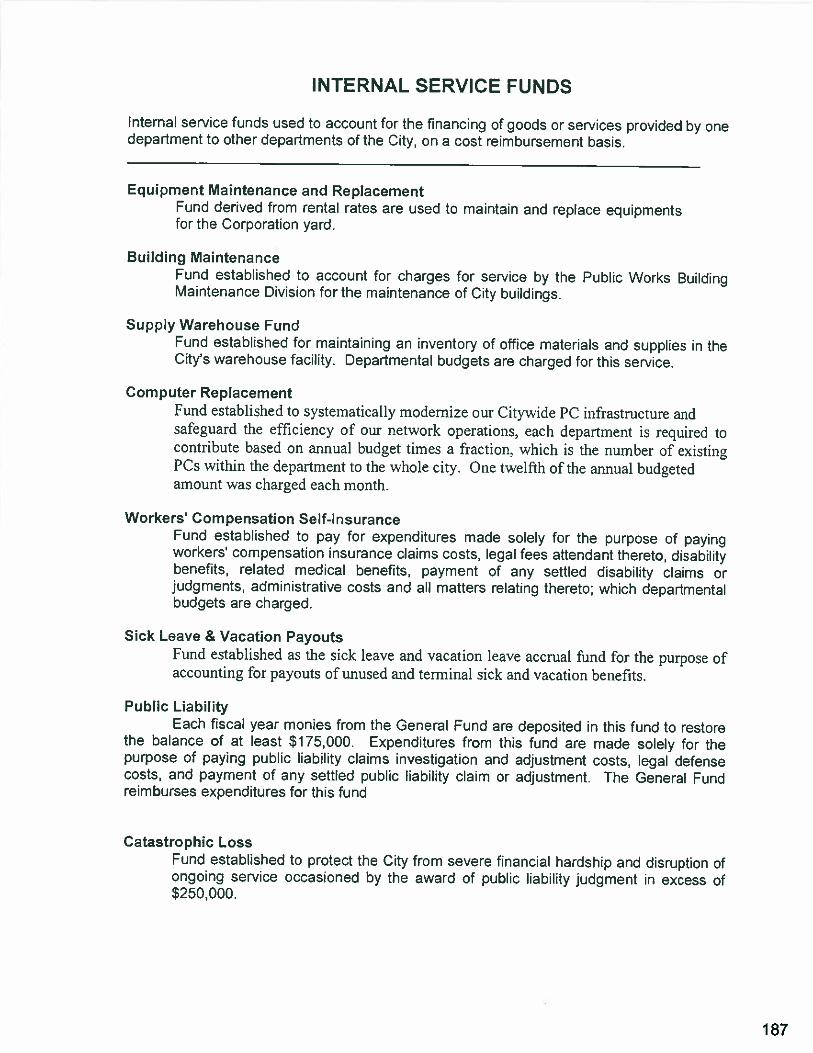
INTERNAL SERVICE FUNDS
Internal service funds used to account for the financing of goods or services provided by onedepartment to other departments of the City, on a cost reimbursement basis.
Equipment Maintenance and ReplacementFund derived from rental rates are used to maintain and replace equipmentsfor the Corporation yard.
Building MaintenanceFund established to account for charges for service by the Public Works BuildingMaintenance Division for the maintenance of City buildings.
SuppLy Warehouse FundFund established for maintaining an inventory of office materials and supplies in theCity’s warehouse facility. Departmental budgets are charged for this service.
Computer ReplacementFund established to systematically modernize our Citywide PC infrastructure andsafeguard the efficiency of our network operations. each department is required tocontribute based on annual budget times a fl-action, which is the number of existingPCs within the department to the whole city. One twelfth of the annual budgetedamount was charged each month.
Workers’ Compensation Self-InsuranceFund established to pay for expenditures made solely for the purpose of payingworkers’ compensation insurance claims costs, legal fees attendant thereto, disabilitybenefits, related medical benefits, payment of any settled disability claims orjudgments, administrative costs and all matters relating thereto; which departmentalbudgets are charged.
Sick Leave & Vacation PayoutsFund established as the sick leave and vacation leave accrual fund for the purpose ofaccounting for payouts of unused and terminal sick and vacation benefits.
Public LiabilityEach fiscal year monies from the General Fund are deposited in this fund to restore
the balance of at least $175,000. Expenditures from this fund are made solely for thepurpose of paying public liability claims investigation and adjustment costs, legal defensecosts1 and payment of any settled public liability claim or adjustment. The General Fundreimburses expenditures for this fund
Catastrophic LossFund established to protect the City from severe financial hardship and disruption ofongoing service occasioned by the award of public liability judgment in excess of$250,000.
187
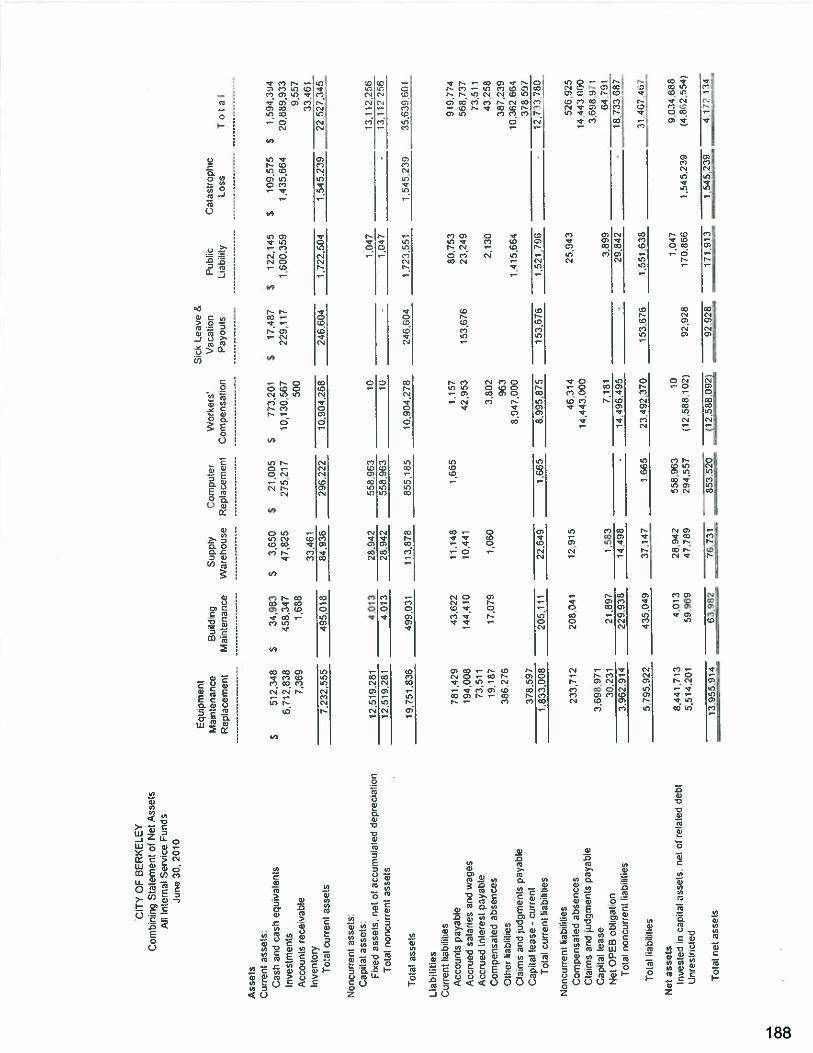
CIT
YO
FB
ER
KE
LE
YC
ombi
ning
Sta
tem
ent
ofN
etA
sset
sA
ltlr
.te1’
.al
Ser
vice
Fun
dsJu
ne
30.
2010
Ass
ets
Cur
rent
asse
ts:
Cas
han
dca
sheq
uiva
lent
s
Inve
stm
ents
Acc
ount
sre
ceiv
able
Inve
ntor
yT
otal
curr
ent
asse
ts
$34
.983
458,
347
1,68
8
__
__
__
_________
__
__
__
__
__
__
_
33,4
6)
7.23
2.55
549
5.01
884
,936
Com
pute
rW
orke
rsR
epla
cem
eni
Com
pens
atio
nP
ubli
cC
atas
trop
hic
Lia
bilit
yL
oss
To
Ia
I
9.55
733
.46
11,
545,
239
22,5
27,3
45
Non
curr
ent
asse
ts:
Cap
taas
sets
:Fi
xed
asse
ts,
net
ofac
cum
ulat
edde
prec
ia9o
n
Tot
aln
on
cu
rre
asse
ts12
,519
,281
4,01
328
,942
558,
963
10
12,5
19,2
814.
013
28,9
4255
8.96
310
________
1,04
713,1
12256
-1,
047
‘13,1
2m
G
Tct
alas
sets
19,7
51,8
3649
9,03
111
3,87
885
5,18
510
,904
,278
246,
604
1,72
3,55
14.
545,
239
35,6
39,6
01
1,15
742
,953
153,
676
3,80
22.
130
963
8,94
7,00
01,
415.
604
46
31
425
,943
14.4
43.0
00
______________
____________
3,39
9-
29,8
42
919,
774
568,
737
73,5
1143
258
387.
239
10,3
62.6
6437
8.59
112
,733
780
520,
925
1444
3,1)
003,6
98.u
iI
64.7
91
18,7
33.6
87
‘Tot
allia
bilit
ies
5.79
5.92
243
5,04
937
,147
1.66
52
3,4
92
,37
015
3,57
61.
551,
638
3140
7.41
17
Net
ass
ets
Inve
sted
inca
pta
lass
es.
net
ofre
late
dde
btU
nres
tric
ted
4.01
328
,942
558,
963
59,9
6947
.789
294,
557
10(1
258
8,10
2)1,
047
9,03
468
817
0,86
61,5
45,2
39
(4,8
G2,
554;
13,9
55,9
1463
,982
76,7
3185
3,52
0(1
2.5
8.O
,292
.928
171.
913
1,54
5,23
94,
172
134
Bui
ldin
gM
aint
enan
ce
Equ
ipm
ent
Mai
nten
ance
Rep
lace
men
t
$51
2.34
86.
712,
838
7.36
9
Sup
ply
War
ehouse
S3,
653
47. 8
25
Sic
kL
eave
&V
acat
ion
Pay
ou
ts
S21
,005
577
3,20
1$
17,4
87S
122,
145
275,
217
10.1
30,5
6722
9,11
71.
600.
359
500
296,
222
10,9
04,2
6824
6,60
41,
722,
504
S10
9,57
5$
1,59
4,J5
i41,
435,
664
20.8
89,9
33
Lia
bil
itie
s
Cur
rent
liabi
litie
sA
ccou
nts
paya
ble
781,
429
43.6
2211
,148
1,66
5
Acc
rued
sala
ries
and
wag
es19
4,03
84
4,4
10
10,4
41
Acc
rued
nter
est
paya
ble
73,5
11
Com
pens
ated
abse
nce
s19
,187
17,0
791,
060
Oth
erlia
blib
es38
6,27
6
Cla
ims
and
judg
men
tspa
yabl
eC
apit
alle
ase
-cu
rren
t37
8.59
7
Tot
alcu
rren
tlia
bilit
ies
1.83
3.03
820
5,11
122
,649
1.66
58,
995.
875
153,
676
1,5
21796
Non
curr
ent
tabi
liti
esC
ompe
nsal
edab
sen
ces
233,
712
208,
041
12.9
15
Cai
rns
ano
ud
grn
ents
paya
ble
Cap
ilal
leas
e3,
698.
971
Net
OP
EB
obli
gati
on30
.231
—21
,897
1,58
37,
181
Tot
alno
ncur
rent
liabi
litie
s3.
962,
914
229,
938
14,4
98-
14.4
96,4
95
80,7
5323
,249
8441,7
13
5,51
4,20
192
.92
8
Tot
alne
tas
sets
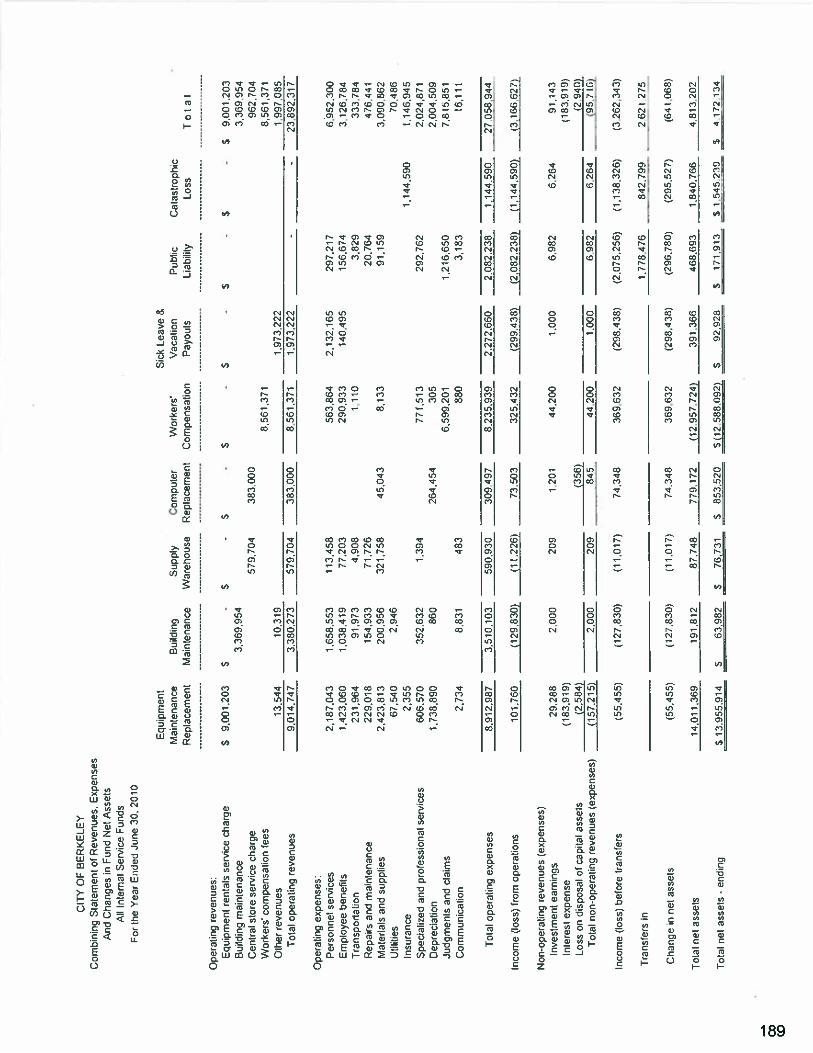
CIT
YO
FB
ER
KE
LE
YC
ombi
ning
Sta
tem
ent
ofR
even
ues
.E
xp
ense
sA
ndC
han
ges
inF
und
Net
Ass
ets
All
Inte
rnal
Ser
vice
Fun
dsF
orth
eY
ear
End
edJu
ne
30,
2010
Equ
ipm
ent
Sick
Lea
ve&
Mai
nten
ance
Bui
ldin
gS
uppl
yC
ompu
ter
Wor
kers
Vac
atio
nP
ubli
cC
atas
trop
hic
Rep
lace
men
tM
aint
enan
ceW
areh
ou
seR
epla
cem
ent
Com
pens
atio
nP
ayou
tsL
iabi
lity
Los
sT
ot
aI
Ope
rati
ngre
ven
ues
:E
quip
men
tre
ntal
sse
rvic
ech
arge
S9,
001.
203
S-
S-
S-
$S
-$
-$
-$
9,00
1,20
3B
uitd
ing
mai
nte
nan
ce3,
369.
954
3.36
9.95
4C
entr
alst
ore
serv
ice
char
ge57
9.70
438
3,00
096
2.70
4W
orke
rs’
com
pen
sati
on
fees
8,56
1,37
18.
561,
371
Oth
erre
ven
ues
13,5
4410
.310
___________
___________
__
__
__
__
__
__
_
1.97
3.22
21,
997,
085
Tot
alop
erat
ing
rev
enu
es9.
014,
747
3,38
0.27
357
9,70
438
3.00
08.
561,
371
1,97
3,22
223
,892
,317
Ope
rati
ngex
pen
ses:
Per
sonnel
serv
ices
2,18
7,04
31,
658.
553
113,
458
563,
864
2,13
2,16
529
7,21
76:
952.
300
Em
ploy
eebe
nefi
ts1,
423,
060
1,03
8.41
977
,203
290,
933
140,
495
156,
674
3,12
6,78
4T
rans
port
atio
n23
1,96
491
,973
4,90
81,
110
3,82
933
3,78
4R
epai
rsan
dm
ainte
nan
ce22
9,01
815
4,93
371
,726
20,7
6447
6,44
1M
ater
ials
and
supp
lies
2,42
3.81
320
0,95
632
1,75
845
,043
8,13
391
,159
3,00
0,86
2U
tilili
es67
.540
2,94
670
,486
Insu
ranc
e2,
355
1,14
4,59
01.
146,
945
Spe
cial
ized
and
pror
essi
onal
serv
ices
606,
570
352,
632
1,39
477
1,51
329
2,76
22,
024,
811
Dep
reci
atio
n1,
738,
890
860
264,
454
305
2,00
4,50
9Ju
dgm
enls
and
clai
ms
6,59
9,20
11,
216,
650
7,81
5,85
1
Com
mun
icat
ion
2,73
48.
831
483
880
3,18
316
,111
Tot
alop
erat
ing
expen
ses
8,91
2.98
73,
510.
103
590.
930
309,
497
8,23
5,93
92,
272,
660
2.08
2,23
81,
144,
590
27,0
58,9
44
Inco
me
(los
s)fr
omop
erat
ions
101,
760
(129
,830
)(1
1.22
6)73
.503
325,
432
(299
,438
)(2
,082
,238
1(1
,144
,590
)(3
,166627)
Non-o
per
atin
gre
ven
ues
(ex
pen
ses)
Inve
stm
ent
earn
ings
29,2
882,
000
209
1,20
144
,200
1,00
06,
982
6,26
401
,143
Inte
rest
expen
se(1
83,9
19)
(183
.919
)
Loss
on
disposal
of
capital
assets
(2
.5
84
)
_______________
_____________
(356
)
_______________
__
__
__
__
__
__
__
______________
______________
(2.9
41)1
Tot
alno
n-op
erat
ing
rev
enu
es(e
xp
ense
s)(1
57,2
15)
2,00
020
984
544
,200
1,00
06,
982
6,26
4(9
5,7
l
Inco
me
(los
s)be
fore
tran
sfer
s(5
5,45
5)(1
27,8
30)
(11,
017)
74,3
4836
9,63
2(2
98,4
38)
(2,0
75,2
56)
(1,1
38,3
26)
(3,2
62,3
43)
Tra
nsfe
rsin
1,77
8.47
684
2,79
92
,62
12
75
Chan
ge
inne
tass
ets
(55,
455)
t127
.830
)(1
1.01
7)74
.348
369,
632
(298
,438
)(2
96,7
80)
(295
,527
)(6
41.0
68)
Tot
alne
tas
sets
14,0
11,3
6919
1,81
287
.748
779,
172
(12,
957,
724)
391,
366
468,
693
1,84
0,76
64,
813,
202
Tot
alne
tas
sets
-en
din
g$
13,9
55.9
14S
63.9
82S
76,7
31$
853,
520
S(1
2.58
8.09
2)S
92.9
28S
17j1
_1
$1,5
45.2
3D
1
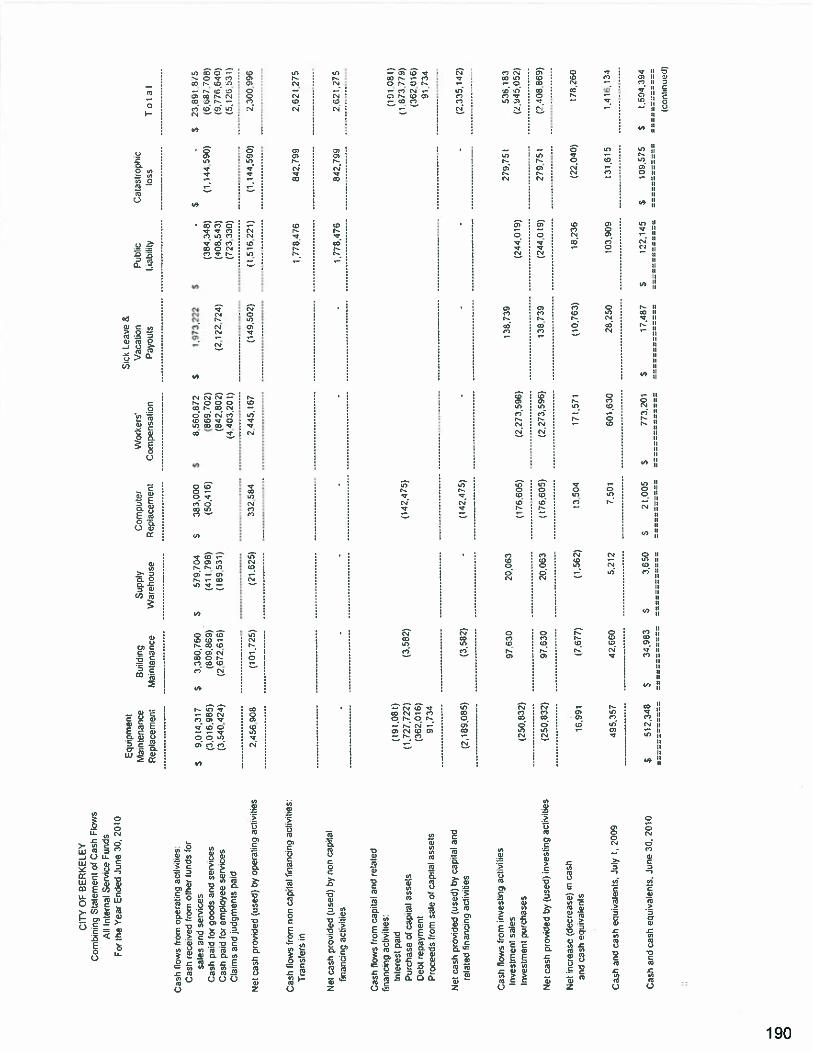
CIT
YO
FD
ER
KE
LE
YC
ombi
ning
Sta
tem
ent
ofC
ash
Flow
sAl
lIn
tern
alS
ervi
ceFu
nds
ror
the
Yea
rE
nded
June
30,
2010
Equ
ipm
ent
(lai
nto
1an C
eR
ep:a
cerr
er6
Sc
Lea
ve&
Vac
atio
nP
ayou
tsC
atas
trop
hic
toss
To
tal
Cas
h(l
aws
from
oper
atin
gac
tivi
ties
:
Cas
hre
ceiv
edfr
omot
her
fund
sfo
rsa
tes
and
serv
ices
Cas
hpa
idfo
rgo
ods
and
serv
ices
Cas
hpa
idfo
rem
ploy
eese
rvic
esC
laim
san
dju
dgm
ents
paid
(384
, 34
8)(4
08,5
43)
(723
,330
)
(1.5
16.2
21)
Cas
hfl
ows
tror
non
cap:
lal
Ona
ncir
gac
t:vlie
S’
Tra
nsfe
rsin
Net
cash
prov
ided
(use
d)by
non
capi
tal
fina
ncin
gac
tiviti
es
1,7)
8,47
684
2,79
92.
621,
275
-1,
778,
476
842,
799
2,62
1,2)
5
Cas
hfl
ows
from
caci
taan
dre
late
dfi
nanc
ing
activ
ities
:In
tere
stpa
idP
urch
ase
ofca
pita
las
sets
Deb
tre
paym
ent
Pro
ceed
sfr
omsa
leof
capi
tal
asse
ts
Net
cash
prov
ided
(use
d)by
capi
tal
and
rela
ted
fina
ncin
gac
tiviti
es
Cas
h‘l
cws
from
nves
ting
ac:’
vtie
sIn
vest
men
tsa
les
Inve
stm
ent
purc
hase
s
Net
cash
prov
ided
by(u
sed)
inve
slin
gac
tivrl
ies
Net
incr
ease
(dec
reas
e)in
cash
and
cash
equi
vale
nts
Cas
han
dca
shec
uva
ferl
s,Ju
y1,
2009
(‘9
,08
).7
27.7
22)
(3.5
621
(362
,016
)91
,734
(7,6
77)
(1.5
62)
(191
,081
)(1
873.
779)
(362
,016
191
.734
(2,3
35,1
42)
279,
751
536,
183
(244
.019
)(2
.fj4
b95
2)
210,
751
(2.1
08,8
69)
Cas
han
dca
sheo
jiva
ienr
s,Ju
ne30
.20
10$
5123
45S
34.5
83S
3650
S21
,005
S77
3201
$17
,487
$12
2,14
5$
109
575
51
59
43
94
Bu:
ldin
gS
uppl
yC
ompu
ter
VV
orke
rs’
Ma,
nler
,ari
ceW
areh
ou
seR
epla
ce,,
er,t
Com
pens
atio
n
Net
cash
pav
ided
(use
d)by
oper
atin
cac
liv’
ties
$9,
014,
317
(3.0
16.9
85)
(3.5
40.
424
)
2.4
56908
$3,
380,
760
S(8
09,8
69)
(2,8
72.6
16)
579,
704
(411
,798
)(1
89,5
31)
Pub
lic
Lia
b,lit
y
(101
.725
)(2
1.62
5)
$38
3,00
0$
8,5
60872
(50,
416)
(869
,702
)(8
42.
802)
(440
3,20
1)
332
524
2,44
5.67
1,97
3,22
2$
.$
(2,1
22,7
24)
(149
,502
)
-$
23,8
91,8
75(1
,144
,590
)(6
,68/,
708)
(0, 7
76.6
40)
(5,1
25,5
31)
(1,1
44,5
90)
2.30
6.99
6
(142
,475
)
(2,1
89,0
85)
(3.5
82)
‘(1
42,4
75)
97.6
3020
,063
138,
739
(250
.832
)(1
7660
5)(2
,273
596)
(250
.832
)97
,830
20,0
63(1
76,6
05)
(2,2
73.5
96)
138,
739
(244
,019
1
10.9
9113
.504
171.
571
(10,
763)
18,2
36(2
2.04
0)17
8,26
0
495,
357
42.8
605,
212
7.50
160
1,63
028
.250
103,
909
31,6
151,
416,
34
(Cni
iiru
ed)
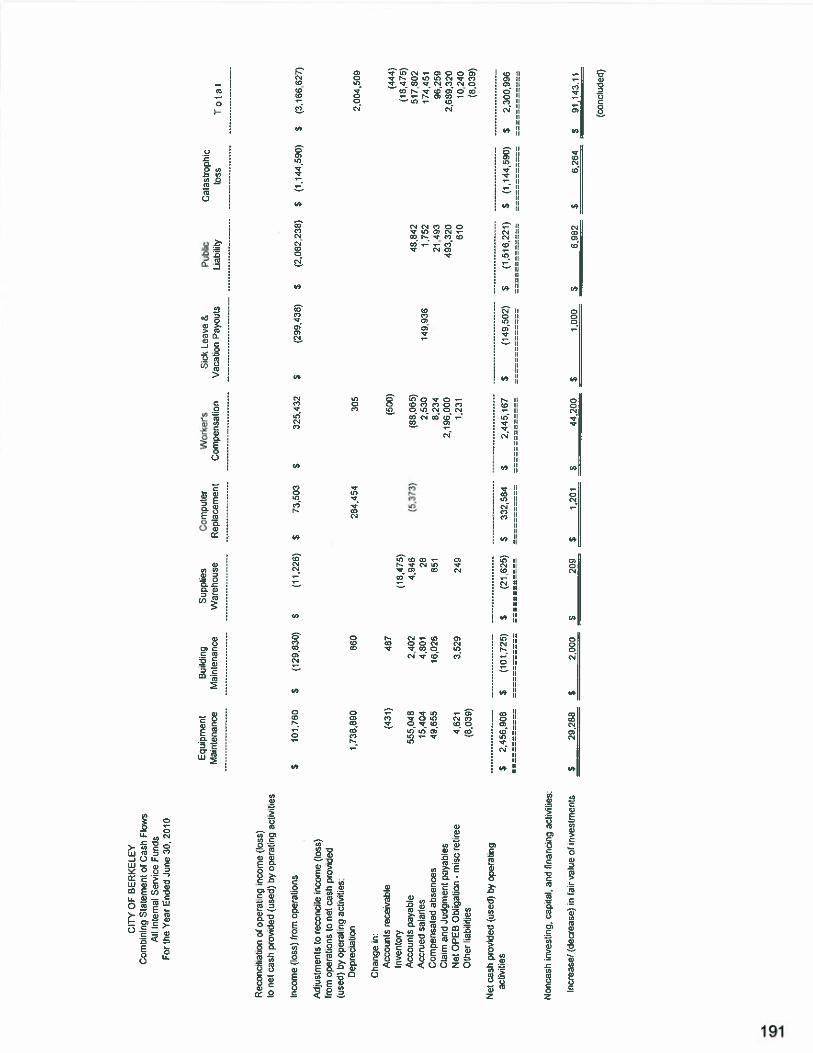
CIT
YO
FB
ER
KE
LE
YC
ombi
ning
Sta
tem
ent
olC
ash
Flow
sA
llIn
tern
alS
ervi
ceF
unds
For
the
Yea
rE
nded
June
30,
2010
Rec
orci
liat
ion
ofoD
era
noin
com
e(1oss
)to
net
cash
prov
ided
(use
s)by
oper
atin
gac
tiviti
es
Equ
ipm
ent
Bui
ldin
gS
uppl
ies
Com
pute
rW
orke
isM
aint
enan
ceM
aint
enan
ceW
areh
ouse
Rep
lace
men
tC
ompe
nsat
ion
Inco
me
(tos
s)fr
omop
erat
ions
$10
1,16
0$
(129
,830
)S
(11,
225)
S73
,503
$32
5,43
2$
(299
,438
)S
(2,0
82,2
38)
S(1
.144
,590
)$
(3,1
66,6
27)
Adj
ustm
ents
tore
conc
iein
com
e(l
oss)
from
oper
atio
nsto
ret
cash
prov
ided
(use
d)by
op
erat
ng
acrv
i:.e
sD
epre
ciat
ion
1,73
8,89
02,
004
.509
Cha
nge
inA
ccou
nts
rece
ivab
leIn
vent
ory
Acc
ount
spa
yabl
eA
ccru
edsa
lari
esC
ompe
nsat
edab
sence
sC
lam
and
Judg
men
tpa
yabi
esN
etO
PE
GO
blig
atio
n-
mis
cre
tree
Oh
eria
bilit
ies
(431
)
555,
048
15,4
0449
.655
4,62
1(8
,039
)
(16,
475)
4,94
8 28 851
3,52
924
9
(500
)
(5.3
13)
(88,
065)
2,53
08,
234
2,19
6,00
01,
231
48.8
42I.
752
21,4
9349
3,32
061
0
(444
)(1
6,47
5)51
7,80
217
4,45
196
,259
2,6
89.3
2010
,240
(8,0
39)
Net
cash
prov
,ded
(use
c9by
oper
atin
gac
tiviti
es$
2,45
6,90
8S
(101
,725
)$
(21,
625)
S33
2,58
4S
2,44
5,16
7S
(149
,502
)S
(1,5
16,2
21)
$(1
/a4
,59
0)
$2,
300,
996
Non
cash
inve
stin
g,ca
pita
l,an
dtn
anci
ngac
tiviti
es:
lncr
ease
I(d
ecre
ase)
infa
irva
lue
ofin
vest
men
ts$
29,2
88$
2,00
0$
209
S1,
201
$44
,200
$1,
000
$5,
982
$6,
264
$91
,143
.11
Sick
Lea
ve&
Publ
icC
atas
trop
hic
Vac
atio
nP
ayou
tsLi
abili
tylo
ssT
ota
l
860
254,
454
487
2,40
24,
801
16,0
26
305
149,
936
(con
clud
ed)
Fiduciary Funds
Pension and Other Employee Benefit Trust Funds
Police Retirement fundThis fund is used to account for the single-employer income benefits pension plan forBerkeley police officers that retired on or after July 1, 1989.
Safety Member Pension Fund/Pension Annuity FundThis fund is used to account for the single-employer defined benefit pension plan for fireand police officers that retired before March 1973.
Fire MedicalThis fund is used to account for the single-employer defined benefit medical plan forsworn fire officers that retire on or after July 1, 1997.
Retiree MedicalThis fund is used to account for the single-employer defined benefit medical plan forretirees and his/her spouse or domestic partner.
192
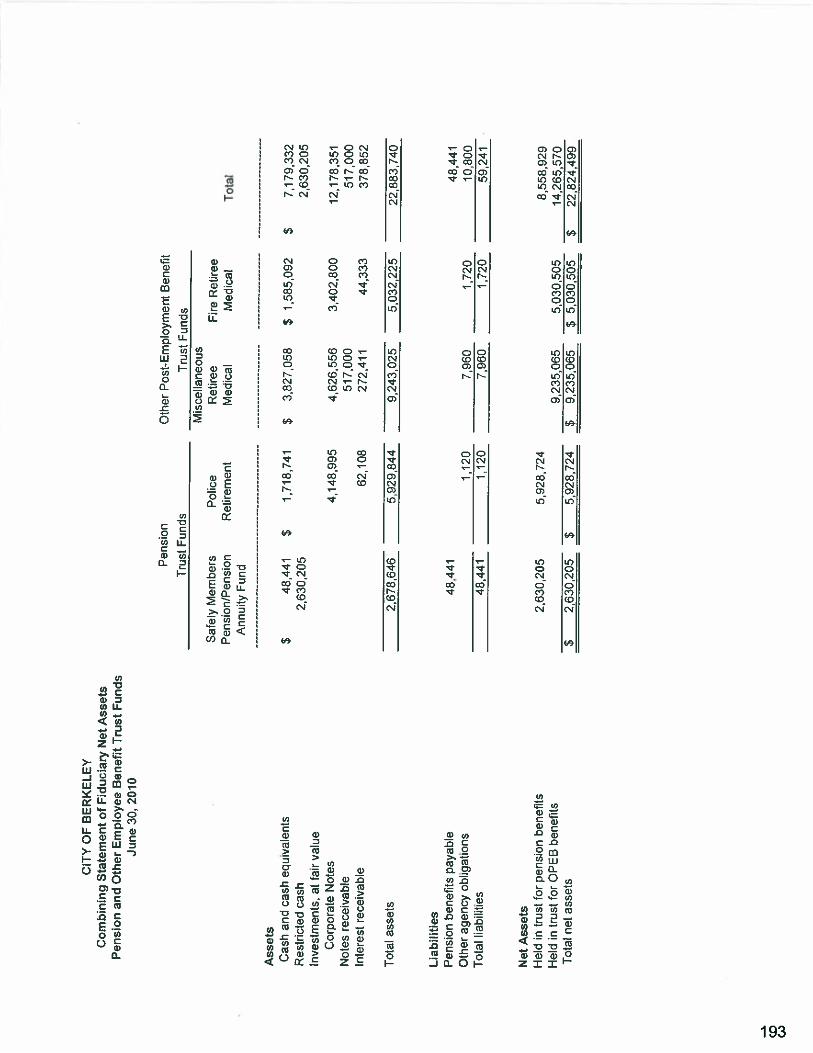
CIT
YO
FB
ER
KE
LE
YC
om
bin
ing
Sta
tem
ent
ofF
idu
ciar
yN
etA
sset
sP
ensi
on
and
Oth
erE
mp
loy
eeB
enef
itT
rust
Funds
Jun
e30
,20
10
Pol
ice
Ret
irem
ent
Mis
cell
aneo
usR
etir
eeM
edic
al
Ass
ets
Cas
han
dca
sheq
uiva
lent
sR
estr
icte
dca
shIn
vest
men
ts,
atfa
irva
lue
Cor
pora
teN
otes
Not
esre
ceiv
able
Inte
rest
rece
ivab
le
Ann
uity
Fun
d
4,62
6,55
651
7,00
0
Tot
alas
sets
Lia
bil
itie
sP
ensi
onbe
nefi
tspa
yabl
eO
ther
agen
cyob
liga
tion
sT
otal
liabi
litie
s
Net
Ass
ets
Hel
din
trus
tfo
rpe
nsio
nbe
nefi
tsH
eld
intr
ust
for
OP
EB
bene
fits
Tot
alne
tas
sets
2:67
8.64
65,
929,
844
9,24
3.02
55,
032,
225
22,8
83,7
40
48,4
4148
,441
1,12
07,
960
1,72
010
,800
48,4
411,
120
7,96
01,
720
59,2
41
2,63
0,20
55,
928:
724
8,55
8,92
99,2
35065
5,03
0.50
514
,265
,570
S2,
630,
205
S5,
928,
724
$9,
235,
065
$5,
030,
505
$22
,824
,499
Pen
sion
Tru
stF
unds
Saf
ety
Mem
bers
Pen
sion
/Pen
sion
Oth
erP
ost-
Em
ploy
men
tB
enef
it
Tru
stF
unds
$48
,441
2,63
0,20
5
Fire
Ret
iree
Med
ical
$
Tot
al
1,71
8,74
1$
3,82
7,05
8$
1,58
5,09
2$
7,17
9,33
22,
630,
205
4,14
8,99
5
62,1
0827
2,41
1
3,40
2,80
0
44,3
33
12,1
78,3
5151
7,00
037
8,85
2
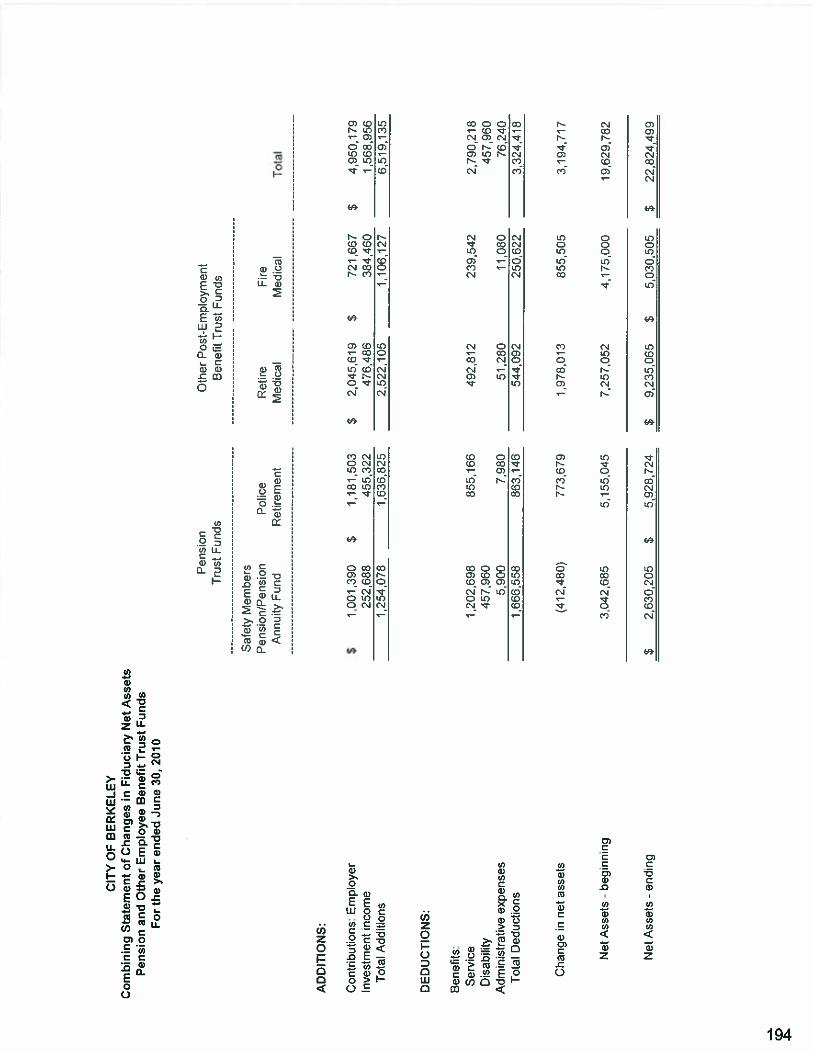
CIT
YO
FB
ER
KE
LE
YC
om
bin
ing
Sta
tem
ent
ofC
han
ges
inF
idu
ciar
yN
etA
sset
sP
ensi
on
and
Oth
erE
mp
loy
eeB
enef
itT
rust
Funds
Fo
rth
eyea
ren
ded
June
30,
2010
Con
trib
utio
ns:
Em
ploy
erIn
vest
men
tin
com
eT
otal
Add
itio
ns
$1.
001,
390
252,
688
1,25
4,07
8
$72
1,66
7$
4,95
0,17
938
4,46
01,
568,
956
1,10
6,12
76,
519,
135
DE
DU
CT
ION
S:
Ben
efit
s:S
ervi
ceD
isab
ility
Adm
inis
trat
ive
expen
ses
Tot
alD
educ
tion
s
1,20
2,69
885
5,16
645
7,96
02,
790,
218
457,
960
76,2
403,
324,
418
AD
DIT
ION
S:
Pen
sion
Oth
erP
ost-
Em
ploy
men
tT
rust
Fun
dsB
enef
itT
rust
Fun
ds
Saf
ety
Mem
bers
Pen
sion/P
ensi
on
Ann
uity
Fun
dP
olic
eR
etir
eFi
reR
etir
emen
tM
edic
alM
edic
alT
otal
S1
18
1.5
03
$2,
045,
619
455,
322
476,
486
1,63
6,82
52,
522,
105
Cha
nge
inne
tas
sets
Net
Ass
ets
-be
ginn
ing
Net
Ass
ets
-en
ding
492,
812
239,
542
5,90
07,
980
1,66
6,55
886
3,14
6
(412
,480
)77
3,67
9
3,04
2,66
55,
155,
045
$2
63
02
05
$5,
928,
724
51,2
8011
,080
54
40
92
250,
622
1,97
8,01
385
5,50
53,1
94717
7,25
7,05
24,
175,
000
19,6
29,7
82
59,
235,
065
$5,
030:
505
$22
,824
,499
Agency Funds
District 47 Underground/MillerThis fund is used to account for property tax collected and bond proceeds for the District47 residents for the underground utility.
Sustainable EnergyThis fund is used to account for property tax collected and bond proceeds for therenewable solar system for the Berkeley citizens.
Thousand Oaks UndergroundingThis fund is used to account for property tax collected and bond proceeds for theThousand Oaks District residents for the underground utility.
Measure H School TaxThis fund is used to account for property tax under Measure H for the Berkeley UnifiedSchool District.
CFD No. I Disaster Fire Protection Mello-RoosThis fund is used to account for property tax collected and bond proceeds for theCommunity Fire District Mello-Roos.
Sick Leave EntitlementThis fund is used to account for unused sick leave balance for retiree.
195
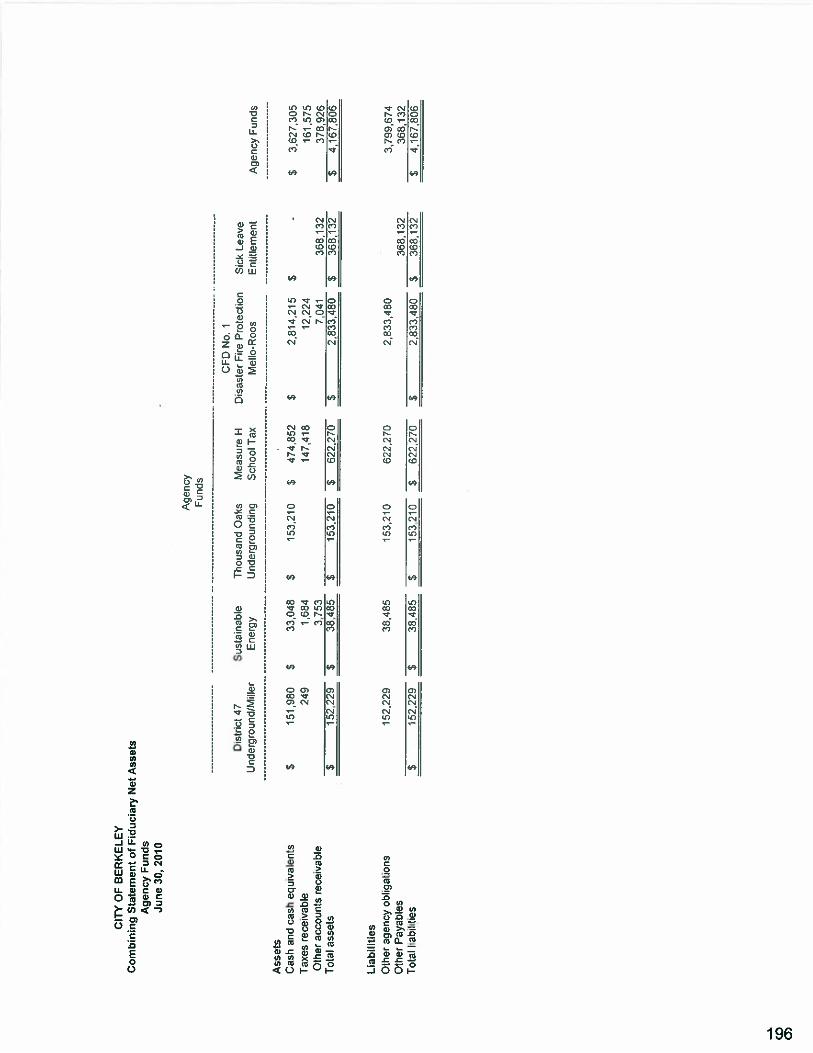
Cl’
fl’
OF
BE
RK
EL
EY
Com
bin
ing
Sta
tem
ent
ofF
iduci
ary
Net
Ass
ets
Agen
cyF
unds
Jun
e30
,20
10
Age
ncy
Fun
ds
Ass
ets
Cas
han
dca
sheq
uiva
lent
sT
axes
rece
ivab
leO
ther
acco
unts
rece
ivab
leT
otal
asse
ts
$15
1.96
0$
249
$3,
627,
305
161,
575
378,
926
$4,
167,
806
3,79
9,67
436
8.13
2$
4,16
7,80
6
Age
ncy
Fun
ds
CF
DN
o.1
Dis
tric
t47
Sus
tain
able
Tho
usan
dO
aks
Mea
sure
HD
isas
ter
Fire
Pro
tect
ion
Sic
kL
eave
Und
ergr
ound
/Mil
ler
Ene
rgy
Und
ergr
ound
ing
Sch
ool
Tax
Mel
lo-R
oos
Ent
itle
men
t
Lia
bil
itie
s
Oth
erag
ency
obli
gati
ons
Oth
erP
ayab
les
Tot
alli
abil
itie
s
33,0
48$
153,
210
$47
4,85
21,
684
147418
_____________
_____
3,75
3
_________________
__
__
__
__
__
$15
2,22
9$
3846
5S
153,
210
S62
2,27
0
$2,
814,
215
$12
,224
7041
368,
132
S2,
833.
480
$358,3
2
152,
229
38,4
8515
3,21
362
2,27
02,
833,
480
___________
_____
__
__
__
__
__
__
__
__
__
__
__
__
__
__
______________
____________________
368,
132
515
2,22
9$
38,4
85S
153.
210
S62
2.27
0$
2,83
3,48
05
368,
132
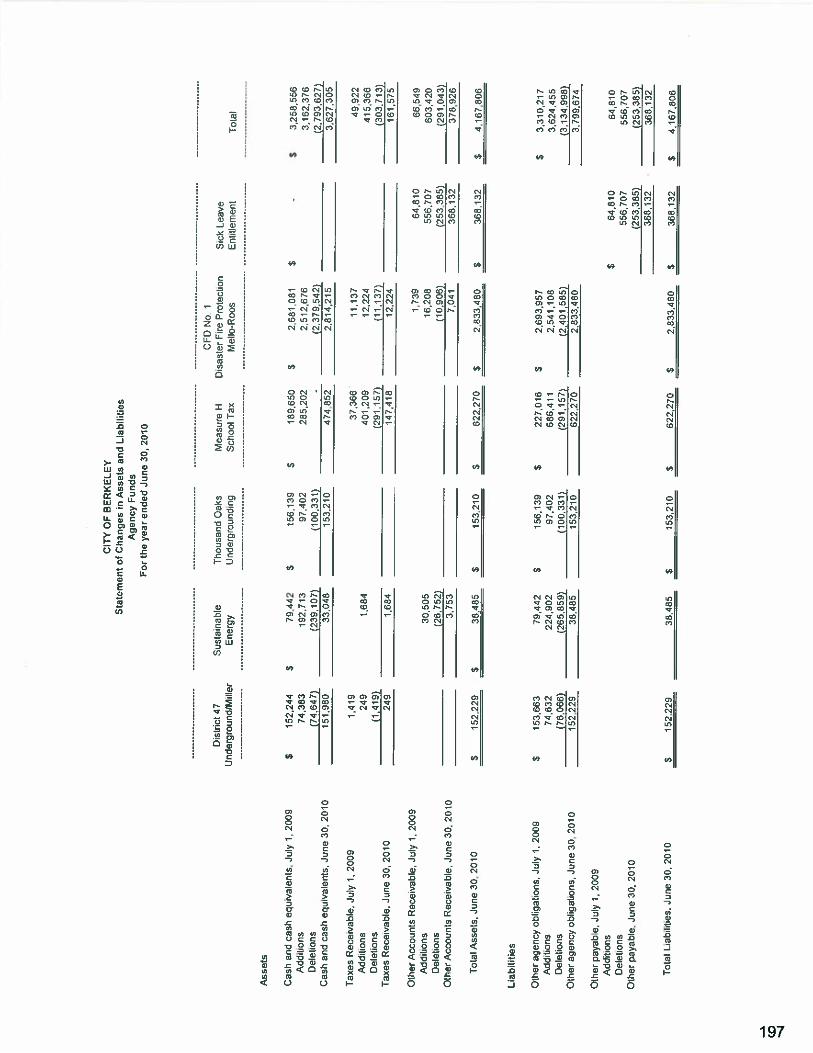
CIT
YO
FB
ER
KE
LE
YS
tate
men
tor
Chan
ges
inA
sset
san
dL
iabi
liti
esA
genc
yF
un
ds
For
the
yea
ren
ded
Jun
e30
.20
10
CFO
No.
ID
sthct
47S
ust
ainab
teT
ho
usa
rdO
aks
Mea
sure
HD
isas
ter
Fire
Pro
tect
ion
Sic
kL
eave
Und
ergr
ound
/Mil
ler
Ene
rgy
Und
ergr
ound
ing
Sch
ool
Tax
Mel
lo-R
cos
Eri
titere
ni
Tot
al
Ass
ets
Cas
han
dca
sheq
uiva
lent
s,Ju
ly1
,20
09
$15
2,24
4S
79,4
42$
158,
139
S189660
$2.6
81081
$-
$3,
258,
556
Add
ition
s74
,383
192,
713
97,4
0228
5,20
22,
512,
676
3,18
2376
Del
etio
ns(7
4.64
7)(2
39,1
07)
(100
.331
)-
(2.3
79.5
42)
(2793.6
27)
Cas
han
dca
sheq
uiva
lent
s,Ju
ne
30,
2010
151.
980
33,0
4815
3.21
047
4,55
22,
814,
215
3,62
7,30
5
Tax
esR
ecei
vabl
e.Ju
ly1.2
009
1,41
937
.366
11,1
3749
,922
Add
itio
ns24
91664
401.
209
12.2
2441
5,36
6D
elet
ions
(1.4
19)
_________________
(291
.157
)(I
1,3
7)
(303
,713
)T
axes
Rec
eivab
e,Ju
re30
,20
1024
91,
684
147.
418
12.2
2416
1,57
5
Oth
erA
cco
un
tsR
ece’
vab’
e.Ju
ly1
,20
09
1739
64.6
1066529
Add
itio
ns30
.505
16.2
0855
6,70
760
3.42
0D
elet
ions
(26.
752)
(‘°°L
(253,
(291
,043
)O
ther
Acc
ount
sR
ecei
vabl
e,Ju
ne
30,
2010
3,75
37,
041
358,
132
378,
926
Tot
alA
sset
s,Ju
ne
30,
2010
$15
2,22
9$
38,4
85S
153,
210
$62
2,27
0$
2.63
3.48
0$
368,
132
$4
,16
78
06
Lia
bil
itie
s
Oth
erag
ency
obl.
ga:
ions.
July
1.2
009
S15
3.66
379
,442
S15
8,13
95
227,
016
S2.
693.
957
S3
31
0,2
17
Add
:tio
ns74
,632
224,
902
91,4
0268
6.41
12,
541.
105
3.62
4,45
5D
elet
ions
(76.
066)
(265
.859
)(1
03,3
31)
(29i5
7)
(2,4
01.5
85)
(3.1
34,9
96)
Oth
erag
ercy
ob
lig
alio
ns.
June
30,
2010
152
229
38,4
6515
3.21
062
2,27
02,
533.
480
3.19
9,67
4
Oth
erpa
yab.
e.L
ily
I,20
09A
ddit
ions
$64
,610
64.8
10D
elet
ions
556,
707
556.
707
Oth
erpa
yabl
e.Ju
ne
30,
2010
(253
.385
)(2
53,3
85)
368.
132
368,
132
Tot
alL
iabi
blie
s,Ju
ne
30,
2010
$15
2,22
938485
$15
3.21
0$
622.
270
$2.
833.
460
$36
8,13
25
4,16
7.80
6

Index to Statistical Section
This part of the comprehensive annu& financial report presents detailed information as acontext for understanding what the information in the financial statements, notedisclosures, and required supplementary information says about the City’s overallfinancial health.
Contents Page
Financial Trends 199-205These schedules contain trend information to help the reader understandhow the City’s financial performance and well-being have changed overtime.
Revenue Capacity 206-209These schedules contain information to help the reader assess the factorsaffecting the City’s ability to generate its property tax.
Debt Capacity 210-214These schedules present infonation to help the reader assess theaffordability of the City’s current levels of outstanding debt and theCity’s ability to issue additional debt in the future.
Demographic and Economic Information 215-217These schedules offer demographic and economic indicators to helpthe reader understand the environment within which the City’sfinancial activities take place and to help make comparisons over timeand with other governments.
Operating Information 2 18-221These schedules contain information about the City’s operations andresources to help the reader understand how the City’s financial informationrelates to the services the City provides and the activities it peForius.
Sources: Unless otherwise noted, the information in these schedoles is derived from thecomprehensive annual financial reports for the relevant year. The City implementedStatement 34 in fy2002; schedules presenting government-wide information includeinformation beginning in that year.
198
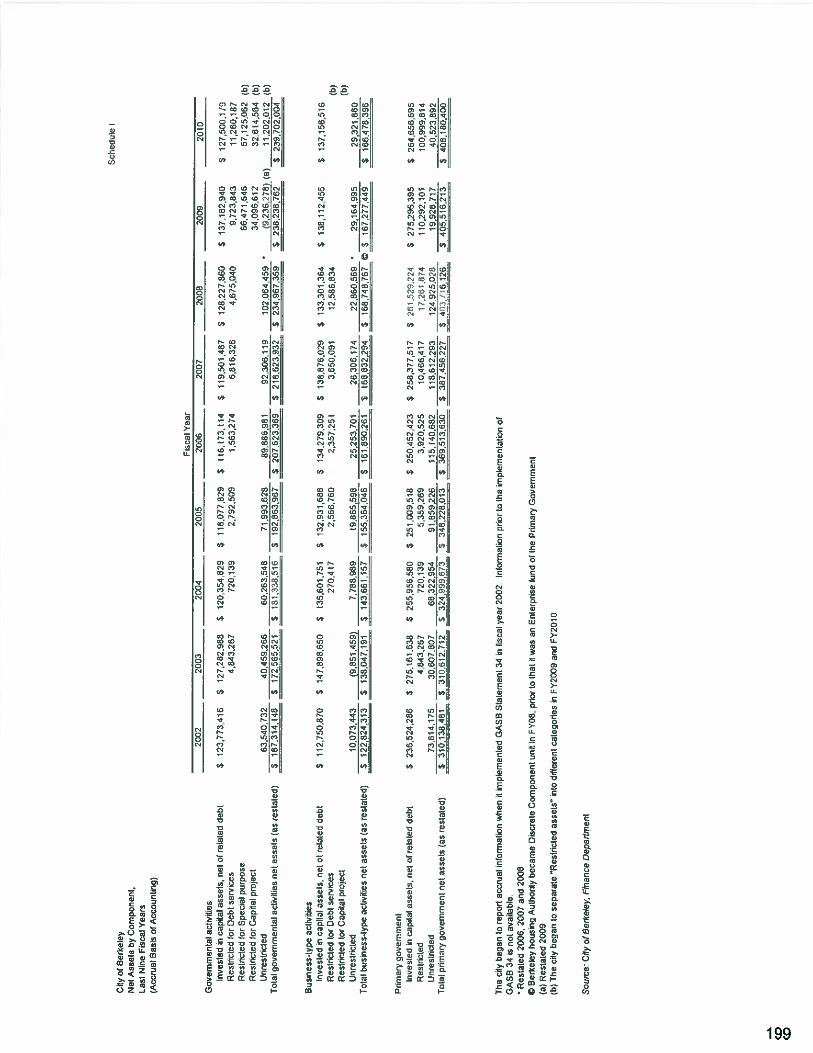
Sch
edul
eI
City
ofB
erke
ley
Net
Ass
ets
byC
ompo
nent
,L
ast
Nin
eFi
scal
yea
rs(A
ccna
’B
asis
ofA
ccou
ntin
g)
Fis
cal
Yea
r20
0220
0320
0420
0520
0920
0720
0820
0920
10G
over
nmen
tal
activ
ities
Inve
sted
inca
pita
las
sets
,ne
tof
rela
ted
debt
Res
tric
ted
tor
Deb
tse
rvic
esR
estr
icte
dfo
rS
peci
alpu
rpos
eR
estr
icte
dfo
rC
apit
alpr
ojec
tU
nres
tric
ted
Tot
algo
vern
men
tal
activ
ities
not
asse
ts(a
sre
stat
ed)
Bus
ines
s’ty
peac
tiviti
esIn
vest
edin
capi
tal
asse
ts,
net
otre
late
dde
btR
estr
icte
dto
rD
ebtse
vto
sR
estr
tted
tor
Cap
ital
proj
ect
On
resf
rict
edT
otal
busi
ness
’tyo
eac
tiviti
esne
tas
sets
(as
rest
ated
)
$12
3,77
3,41
6$
127,
262,
988
$12
0,35
4829
$11
8,07
7,82
9$
116,
173,
114
$11
9,50
1,48
7$
128,
227,
860
$13
7,18
2,94
0$
127,
500,
1/9
4,84
3,26
772
0,13
92,
792,
509
1,56
3,27
46,
816.
326
4,87
5,04
09,
723,
843
11,2
60,1
8766
,471
.646
57.1
25.0
62b)
34,0
96,6
1232
,614
,564
(b)
63.5
40.7
3240
,459
,266
60.2
63,5
4671
.993
.628
89,8
66,9
8192
.306
,119
102,
064,
459
(9.2
36.2
76J(
a)11
,202
,012
(b)
$18
7,31
4.14
8S
172,
565,
521
$181,3
38516
$19
2.86
3.96
7$
207.
623,
369
$21
8,62
3,93
2$234,9
67,3
59
$238,2
38762
$23
9,70
2,00
4
$13
2,93
1.68
8$
134,
279,
309
$13
6,87
8,02
9$
133,
301,
364
$13
8,11
2,45
527
0,41
72,
556.
750
2,35
7,25
13.
853,
091
12,5
86,8
34
10.0
73,4
43(9
.851
.459
)7.
788.
989
19,8
65.5
9825
,253
,701
2630
6.17
422
.860
.569
‘2
9,6
4,9
SS
________________
S12
2,82
4.31
3$
138,
047,
191
$‘4
3,66
1,15
1S
155.
364.
048
$16
’69
3,26
1$
‘68
832.
294
S16
8.74
8.76
7©
$‘6
7.27
7.4.
19
Prim
ary
govo
m’n
ent
litv
esle
dfl
capi
ta:
asse
ts,
net
ofre
ated
debt
Rest
tted
Unr
estr
icte
dT
otal
prim
ary
gove
rnm
ent
net
asse
ts(u
sre
stat
ed)
$23
6.52
4,28
6$
275,
161,
638
S25
5,95
6,S
ec$
251,
039.
518
$25
0,45
2,42
3$
258,
377,
517
$26
1.52
9,22
44,
543,
267
720.
138
5,35
9.26
93,
920,
525
10,4
66,4
111i
,16’,
874
73,6
14,1
7530
,601
,801
68,3
22,9
5491
,859
,226
115.
140.
662
116,
612.
293
124/
j:.’
5.02
8$
310,
138.
461
$31
0.61
2.71
2$
324.
999.
673
$34
8,22
8,01
3$
369,
513,
630
$38
7,45
6,22
7$
403,
116,
126
$27
5,29
5,39
511
0.29
2,10
119
.928
,717
$40
5,51
6,21
3
$25
4,65
6.65
510
0,99
9,81
440
.523
.892
$40
6,1
80,4
00
The
city
bega
nto
repo
rlac
crua
lin
form
atio
nw
hen
itim
plem
ente
dG
ASB
Sta
tem
ent
34in
tisca
lye
ar20
02.
Info
rmat
ion
prio
rto
the
impl
emen
tati
onof
GA
SB34
isno
tav
aila
ble.
Res
tate
d20
06,
2007
and
2008
©B
erke
ley
hous
ing
Aut
hori
tyb
ecam
eD
iscr
ete
Com
pone
ntun
itin
FY06
,pr
ior
toth
atit
was
anE
nter
pris
efu
ndof
the
Prim
ary
Gov
ernm
ent
(a)
Res
tate
d20
09(b
IT
heci
tybe
gan
tose
par
ate
“Res
tric
ted
asse
ts”
into
diff
eren
tca
tego
ries
inFY
2009
and
FY2O
IO
$11
2,75
0.87
05
147,
898,
650
$13
5.60
1,75
1S
137,
156,
516
29,3
21,8
80$
166,
478,
396
b) tb)
Scu
rce’
Cdy
ofB
erke
/ey,
Fi,
ianc
eD
epar
tmen
t
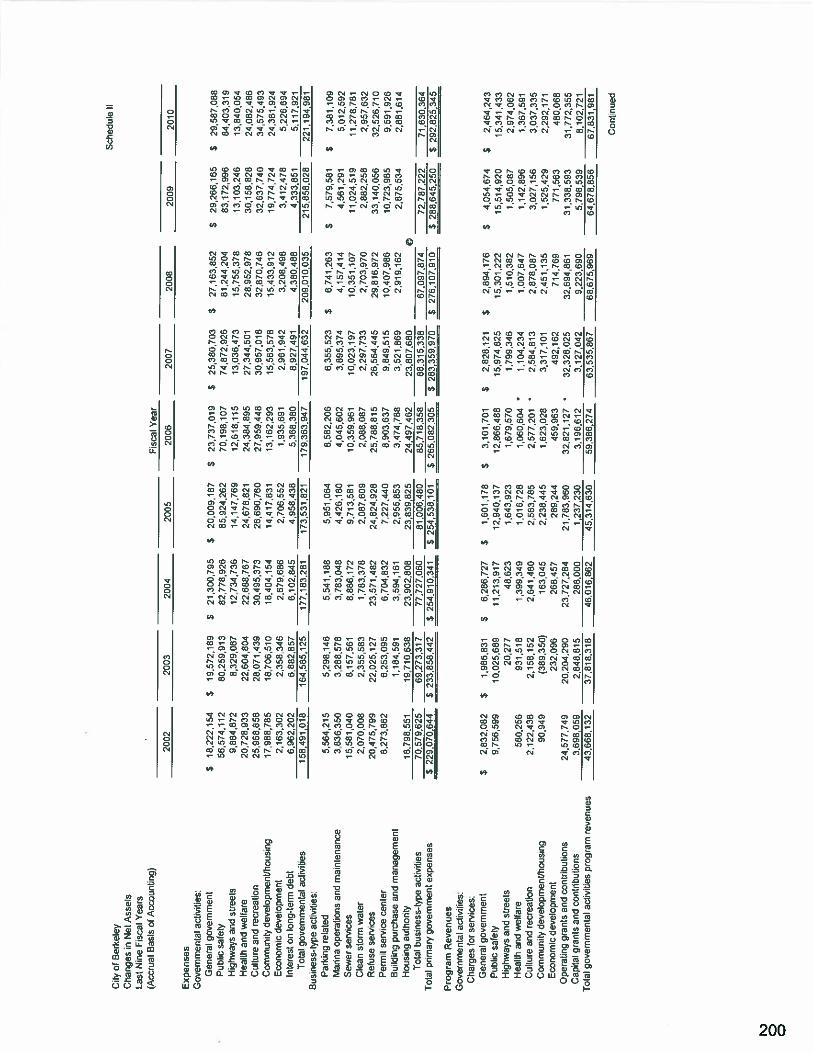
Sch
edul
eII
City
ofB
erke
ley
Cha
nges
inN
etA
sset
sL
ast
Nin
eFi
scal
Yea
rs(A
ccrual
Basis
of
Acco
un
tin
g)
__
__
__
__
__
__
______________
_____________
__
__
__
__
__
__
_
Fisc
alY
ear
_____________
______________
_____________
_____________
2002
2003
2004
2005
2006
2007
2008
2009
2010
Expen
ses
Gov
ernm
enta
lac
livili
es:
Gen
e’a
gove
rnm
ent
$18
222.
154
S19
,572
,163
S21
,300
,795
S20
,009
,187
S23
,737
019
S25
,380
,703
S27
,163
,852
S25
,266
,165
S29
,587
,088
Pub
lics
afet
y56
,574
,112
60,2
59,9
1362
,775
,926
65,9
24,2
6270
,196
,107
74,8
12,9
2661
.244
204
53,1
72,9
965
44
23
31
9H
ighw
ays
and
stre
ets
9,88
4,87
28,
329,
067
12.7
34,7
3614,4
7,7
69
12,6
18,1
1513
,036
,473
15.7
55,3
7813
.103
,246
13.6
40,0
54H
ealth
and
weL
fare
20.7
26,9
3322
,604
,804
22,6
88,7
6724
,678
,821
24.3
84,6
9527
.344
,501
28,9
52,9
7830
,156
,828
24,0
82,4
86C
ultu
rean
dre
crea
tioi
2595
8,65
828
,071
.439
30,4
95,3
7326
,690
.760
27,9
59,4
4830
,957
,018
32,6
70,7
4632
,637
740
34,5
75,4
93C
cmm
unit
ydev
elop
mer
.tihc
uslr
.g17
.986
,785
16,7
06,5
1018,4
04:5
414
,417
.831
13,1
62,2
9215
,653
,518
1543
3,91
219
,774
724
24,3
61,9
24E
cono
mic
deve
lopm
ent
2,16
3,30
22,
358,
346
2,67
9,68
62,
706,
552
1,03
5,69
12,
961,
942
3,20
8,49
63,
412,
418
5,22
6,69
4In
tere
ston
long
-ter
mde
bt6,
962,
202
6,58
2,85
76,
102,
845
4,95
6.43
85,
368,
380
6,92
1,49
14,
380,
468
4,33
3,65
15,
117,
921
Tot
algo
vern
men
tal
acti
viti
es15
8,49
1,01
816
4,58
5,12
517
7,18
3.28
117
3,53
1,62
111
9,36
3,94
719
7,04
4,63
220
9,01
0,03
521
5,85
8,02
822
1,19
4,98
1B
usin
ess-
type
activ
ities
:P
arki
ngre
late
d5,
564,
215
5,29
8,14
65,
541,
188
5,95
1,06
46,
582,
206
6,35
5,52
3$
6,74
1,26
3$
7,57
9,58
1$
7,38
1,10
9M
arin
aop
erat
ions
and
mai
nten
ance
3,83
6,35
03,
288,
576
3,78
3,04
64,
426,
180
4,04
5,60
23,
895,
374
4,15
7,41
44,
561,
291
5.01
2,59
2S
ewer
serv
ices
15,5
61,0
409,
157,
561
8,86
6,17
29,
713,
581
10,3
59.9
6110
023,
197
10.3
51,1
0711
,024
,519
11,2
18,7
81C
lean
stor
mw
ater
2,07
0,00
82,
355,
583
1,76
3,37
62,
067,
609
2,06
8,08
72,
297,
733
2,70
3,91
02,
882,
256
2,95
7,63
2R
efL
sese
rvic
es20
,475
,799
22,0
25.1
2123
.571
,462
24,8
24,9
2825
,785
,615
26,5
64.4
4525816
972
33,1
40,0
5632
,526
710
Per
mt
serv
ice
cent
er6,
273,
662
6,25
3,03
56,
704,
832
7227440
8,90
3,63
79,
849,
515
10,4
07,9
8610
,123
,985
9,59
1,92
6B
uild
ing
purc
hase
and
man
agem
e’it
1.18
4,59
13,
594,
181
2955
,a53
3,47
4,78
83,
521,
869
2,91
0,16
22,
815,
534
2.88
1614
Hou
sing
auth
orit
y6
,79
85
51
19,7
10,6
382
3,9
02
80
523
,839
,825
24
,49
14
62
23807,6
80
______________
_____________
_____________
Tot
alb
usn
ess-
typ
eac
:vL
t’es
—70
.579
.625
69,2
73,3
1777
,127
,050
81,0
06,4
808
5,7
18
35
886
,315
,338
67,0
97,8
7472
,781
,222
71,6
30,3
64T
otal
pri
-rar
yg
ov
emm
ente
xpel
ses
S22
9.01
0,64
4S
233,
858.
442
S25
4,91
0,34
1S
254.
530,
101
$26
5,08
2,30
5S
283,
3599
705216iO
l.910
$28
8,64
5,25
0S
292.
825,
325
Pro
gra
mR
even
ues
Gov
ernm
enta
lac
tiviti
es:
Cha
rges
for
serv
ices
:G
ener
algo
vern
men
t$
2,83
2082
$1,
9668
31$
6,28
6,72
7$
1,60
1,17
8$
3,10
1,70
1S
2,82
8,12
1$
2,89
4,17
6$
4,05
4,67
4$
2,46
4,24
3Pu
blic
safe
ty9.
156,
599
10,0
25,6
8911
,213
,917
12,9
40,1
3712
,866
.468
1597
4,82
51
53
01
22
215
,514
,920
15,3
41,4
33H
ighw
ays
and
stre
ets
20,2
7748
,623
1,64
3,92
31,
679,
510
1,79
9,34
61,
5103
821,
505,
087
2,97
4,06
2H
ealth
and
wel
fare
590,
256
931,
518
1,39
9,34
91,
016,
728
1,06
0,60
41,
104,
234
1,00
1,64
11,
142,
896
1,36
1,59
1C
ultu
rean
dre
crea
Uon
2.12
2,43
82,
158,
152
2641
,480
2563,7
85
2,57
7201
2,55
4,81
32.
878,
087
3,02
7,15
63.
037,
335
Com
mu
nit
yd
evel
op
men
Uh
ou
sin
g90
,949
(36
93
5o
153045
22
38
44
51,
623,
028
3,31
7,10
12,
451,
135
1,52
5,42
92,
292,
171
Eco
nom
icdev
etoom
ei:
23
20
96
268.
457
289,
244
459,
953
492,
152
114,
769
771,
563
480,
068
Oper
atin
gg
ran
tsan
dco
ntr
ibu
tio
ns
24577749
20
20
4,2
90
23,7
27,2
e421
,783
,960
32,8
21,1
2732
,328
,025
32,6
94,8
6131
,338
,593
31,7
72,3
55C
apia
lgr
ants
and
cont
riou
tion
s3,
698,
059
2,64
8,81
526
8,0-
00,2
37,2
30
3,19
6,61
23,
121.
042
9,22
3,69
05.
198,
539
8,10
2,72
1T
otal
gove
-nm
enta
lac
twit
ies
prog
-am
even
ues
43,6
68.1
5231
,818
,318
46016,8
62
45.3
14,6
3059386,2
74
63,5
35,6
67e8
.675,9
60
64,6
78,8
5661831,9
81
Con
tinu
ed
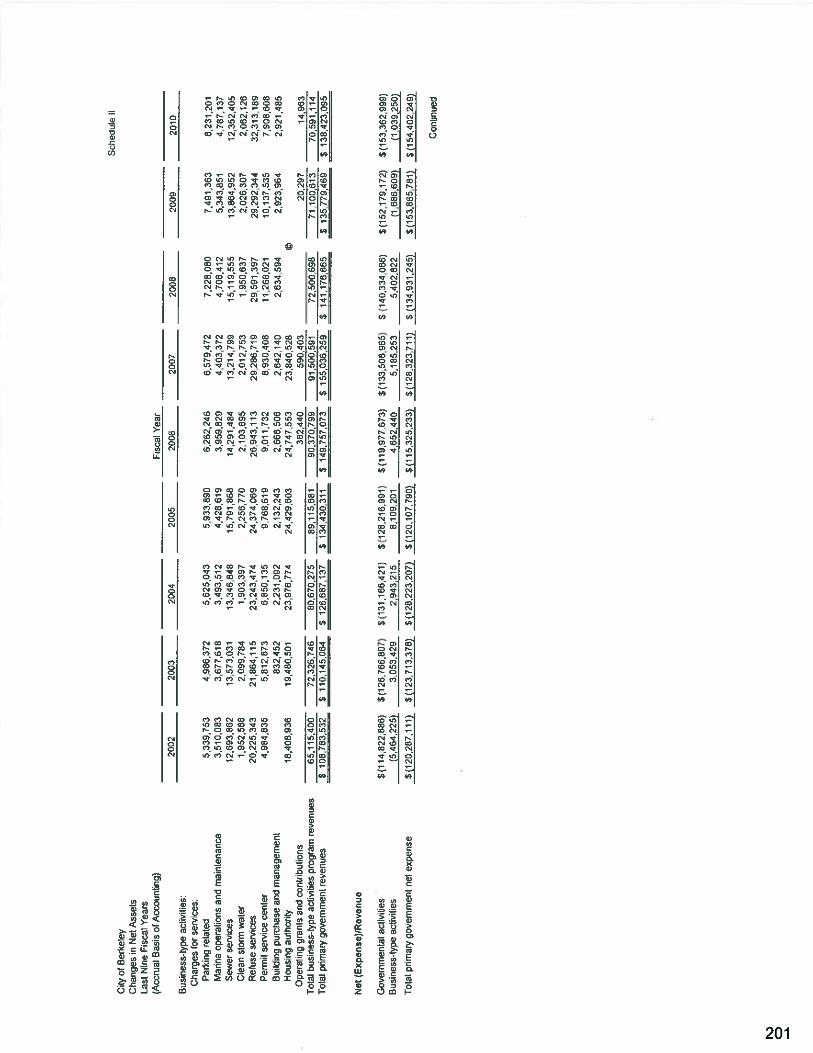
Sc4
edul
eII
City
otB
erke
ley
Cha
nges
inN
etA
ssel
sL
ast
Nin
eFi
scal
Yea
rs(A
ccru
alB
asis
atA
ccou
ntin
g)
__
__
__
__
__
__
__
________________
_______________
_______________
Fisc
alY
ear
_______
________
_______________
_______________
_______________
2002
2003
2004
2005
2006
2007
2008
2009
2010
Bus
ines
s-ty
peac
tivi
les:
Cha
rges
br
serv
’ces
Par
king
rela
ted
5.33
9,75
34.
986.
372
5,62
504
35.
933.
890
6.26
2.24
66,
579,
472
7.22
8,08
07,
491.
363
8.23
1,20
1M
arin
aop
eral
ians
and
mai
nten
ance
3.51
C.0
533:
677.
618
2,49
3512
4,42
8,81
93,
959.
829
4,40
3,37
24,
708,
412
5,34
3.85
14
78
7,1
37
Sew
erse
rvic
es12693,8
62
13,5
73.0
3113
,346
.848
16,7
91,8
6814
,291
,464
13,2
44,7
9915
,119
,555
13,8
64,9
5212
,352
,405
Cle
anst
orm
wal
er1,
952,
588
2,09
9.78
41,
903,
397
2,25
5,77
02,
103,
695
2,01
2,75
31,
950,
637
2,02
6,30
72,
052,
126
Ref
use
serv
ices
20,2
25,3
4321
,864
,115
23,2
43,4
7424
,374
,069
26,9
43,1
1329
,286
,719
29,5
91.3
9729
,292
,344
32,3
13,1
89P
erm
itse
rvic
ece
nte
r4,
984,
835
5,81
2,87
36,
850,
135
9,76
8,61
99,
011,
732
8,93
0,40
811
,268
,021
10,1
37,5
357,
908.
608
Bui
ldin
gp
urc
has
ean
dm
anag
emen
t83
2,45
22,
231,
092
2,13
2,24
32,
568,
506
2,6
42,1
40
2,63
4,59
42,
923,
964
2,92
1,48
5H
ousi
ngau
thor
ity
16,4
08,9
3619
,480
,501
23.9
76.7
7424
,429
,603
24,7
47,5
5323
,640
,526
©O
pera
ting
gra
nts
and
cont
ribu
tion
s
_______________
_______________
_______________
_______________
362,
440
590,
403
_______________
20,2
9714
,963
Tot
alb
usi
nes
s-ty
pe
acti
viti
espr
ogra
mre
ven
ues
65,1
15,4
0072
,326
,746
80,6
70,2
7569
,115
,681
90,3
70,7
9991
,500
,501
72,5
00,6
9671
,100
,613
70,5
91,1
14T
otal
pri
rnar
ygover
nm
entr
even
ues
$10
8,78
3,53
2$
110,
145,
064
$12
6,68
7,13
7$
134.
430,
311
$14
9,15
7,07
3$
155,
036,
269
$14
1,17
6,66
5$
135,
779.
469
$13
8,42
3,09
5
Not
(Expen
se)/
Rev
onuo
Gov
ernm
enta
lac
tivi
tres
$(1
14,8
22,8
86)
$(12
6,76
6,B
07)
$(1
31,1
66,4
21)
$(1
28,2
16,9
91)
$(1
19,9
77,6
73)
$(1
33,5
08,9
65)
$(1
40,3
34,0
66)
(152
,179
,172
)$(1
53,3
62.9
99)
Busi
nes
s-ty
pe
acti
viti
es(5
,464
,225
)3.
053,
429
2,94
3,21
58,
109,
201
4,65
2,44
05,
185,
253
5,40
2.82
2(1
,686
,609
)(1
.039
,260
)
Tot
alpn
mar
yg
ov
ern
men
tne
tex
pen
se$
(120
,281
,111
)(1
23,1
13.3
78)
$(1
28,2
23.2
07)
$(1
20,1
07,7
90)
$(1
15.3
25,2
33)
$(1
28,3
23,7
11)
$(1
34,9
31245)
$(1
53,8
65,7
61)
$(1
54.4
02.2
49)
Con
tinu
ed
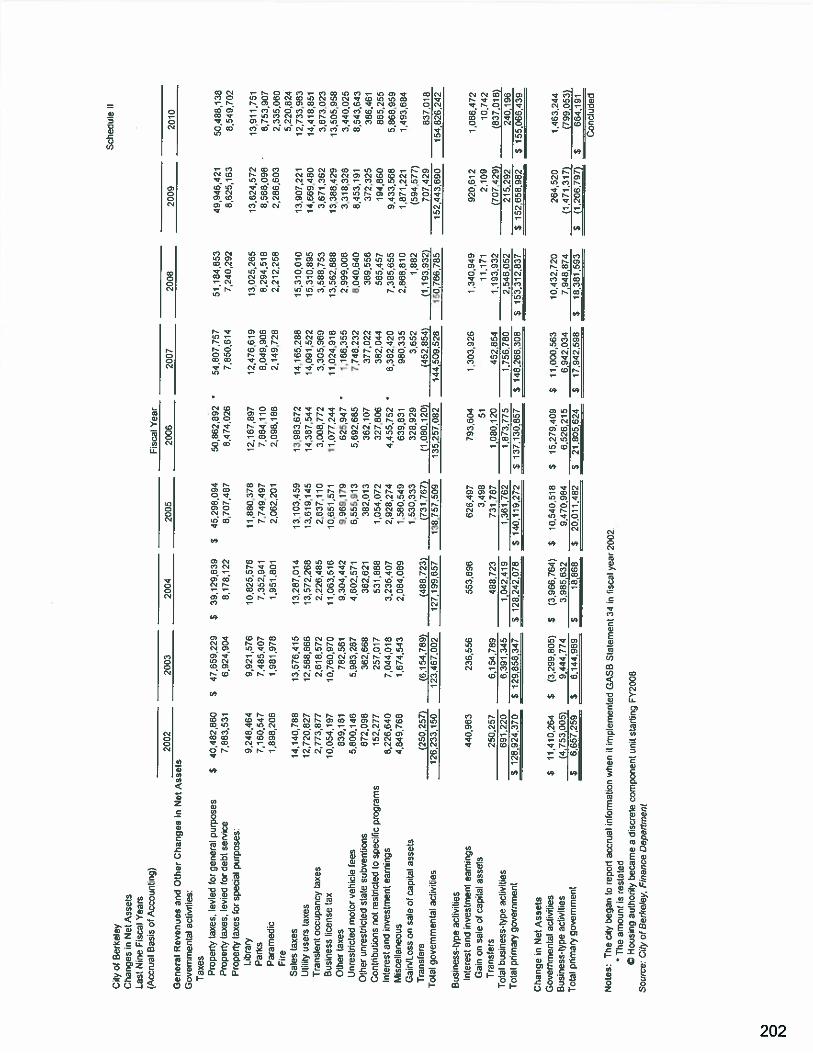
Sch
edul
eII
City
ofB
erke
ley
Cha
nges
inN
etA
sset
sL
ast
Nin
eFi
scal
Yea
rs(A
ccrual
Basis
of
Acco
un
tin
g)
__
__
__
__
__
__
__
________________
_______________
_______________
Fis
cal
Yea
r
_______________
_______________
_______________
_______________
2002
2003
2004
7005
2006
2007
2006
2009
2010
Gen
eral
Rev
enues
and
Oth
erC
han
ges
inN
etA
sset
sG
over
nmen
tal
activ
ities
:T
axes
Prop
erty
taxe
s,le
vied
for
gene
ral
purp
oses
$40
,482
,860
$47
,659
229
$39
,129
.639
$45
298,
094
5086
2,89
2*
54,8
0775
75
11
84
85
349
946,
421
50,4
86,1
36P
rope
rty
taxe
s,le
vied
ford
ebt
serv
ice
7,86
3531
6,92
4,90
48,
178,
122
8707
,487
0474
,026
7850
,614
7,24
0,29
28,
625,
163
8,54
9,70
2P
rope
rty
taxe
sfo
rsp
ecia
lpu
rpos
es:
Lib
rary
9,24
6,46
49,
921,
576
10,8
25.5
7611
,680
,318
12,1
67,8
9712
,476
,619
13,0
25,2
6513
.624
572
13,9
11,7
51P
arks
7,16
0,54
77,
485,
407
7,35
2,94
11,
149.
497
7,86
4110
8,04
9,90
68,
294,
518
8,56
8,09
88,
753,
907
Par
amed
ic1898206
1,98
1978
1.95
1.80
12,
062,
201
2,09
8,18
62,
149,
728
2,21
2,25
82,
286,
603
2,33
5,06
0Fi
re5,
220,
624
Sal
esta
xes
14,1
40,7
8913
,576
,415
13.2
67,0
1413
,103
,459
13,9
83.6
7214
.155
,288
15.3
’0,0
1013,9
o7,2
212
,733
,983
Util
ityus
ers
taxe
s12
.720
.827
12.5
88,6
6613
,572
,268
13,6
19,1
4514
,367
544
4,09
1,52
21
53
10
,89
514
,669
,480
14,4
18,8
51T
-ans
ier,
tocc
upan
cyta
xes
2,17
3,87
72,
618,
572
2.22
648
52,
537,
113
3,00
8,77
23,
305,
969
3,58
8,75
33,
671,
362
3,57
3,02
3B
usin
ess
lice
nse
tax
10,0
54,1
9710
,760
,970
11,0
63,5
1610
,651
,571
11,0
77,2
4411
,024
,918
13,5
62.8
6813
,388
,429
13,5
05,9
58O
ther
taxe
s63
9,18
178
2,56
19,
304,
442
9,96
9,17
962
5,94
71,
166,
355
2,99
9,00
63,
318,
326
3.44
0,02
5U
nres
tric
ted
mot
crve
hicl
ele
es5,
600,
146
5,98
3,26
74,
602,
571
6,55
5,91
35,
692,
685
7.74
8.23
28,
040.
640
8,45
3,19
18,
543,
643
Oth
erun
rest
rict
edst
ate
subv
enti
ons
672,
098
362,
668
362,
621
362,
013
362,
107
377,
022
369,
556
372,
325
386,
461
Con
trib
utio
nsno
tre
stri
cted
tosp
ecir
icpr
ogra
ms
152,
277
257,
017
531,
888
1,c5
4,o7
232
7,80
638
2,04
456
5,45
719
4,85
066
5,25
5In
tere
stan
din
vest
men
tea
rnin
gs8,
226,
640
7,04
4,01
83.
235.
407
2.92
8,27
44,
455,
752
6,38
2,42
07,
385,
655
9,43
3,56
65,
868,
959
Mis
cell
aneo
us
4,84
9,75
81,
674,
543
2,3
84,0
89
1.58
0,54
963
9,53
198
0.33
52,
868,
810
1,87
1,22
11,
493,
584
Gai
n/L
oss
onsa
:eot
capi
tal
asse
is1.
530,
333
328.
929
3.65
21,
882
(594
.577
)T
rans
fers
(250
.257
)(6
,154
,789
)(4
88.7
23)
(731
,767
)(1
,080
.120
)(4
52,8
54)
(1,1
93,9
32)
707.
429
837,
010
Tot
alg
cver
nm
enta
lac
t.vi1
:es
126
233.
150
123,
467,
002
127,
199.
657
138,
757
509
135,
257.
082
144,
509,
528
150,
786.
785
152,
443.
690
154,
826,
222
Bus
ines
s-ty
peac
tiviti
esIn
tere
stan
din
vest
men
tea
rnin
gs44
0,96
323
6,55
555
3,69
662
6,49
779
3,60
41,
303,
925
1,34
0,94
992
0,61
21,
066,
472
Gai
non
sale
ofca
pita
las
sets
3,49
851
11,1
712,
109
10,7
42T
ran
sfer
s25
0.25
76,
154,
789
488,
723
731,
767
1,08
0,12
045
2,85
41,
193,
932
(707
,429
)(8
37.0
18)
Tot
albu
sine
ss-t
ype
activ
ities
591,
220
6,39
1.34
51,
042,
419
1,36
1,76
21,
873,
775
1,75
6,78
02,
546,
052
215,
292
240,
196
To
talp
rim
ary
go
ver
nrn
ent
$12
6,92
4,37
0S
129,
858.
347
$12
8,24
2,07
6$
140,
119,
272
$13
7,13
0,85
7$
146,
266.
308
$15
3,31
2,83
7S
15
26
58
,98
2$
155,
066,
439
Cha
nge
inN
etA
sset
sG
over
nmen
tal
acti
viti
es$
11,4
10,2
645
(3,2
99,8
05)
$(3
,966
,764
)S
10,5
40,5
18S
15,2
79.4
09$
11,0
30.5
6310
.432
.720
264,
520
1,46
3.24
4B
usin
ess-
type
activ
ities
(4,7
53,0
05)
9,44
4,77
43,
985
632
9,47
0,96
46,
525.
215
6,94
2.03
47,
948
874
(,471,3
17)
(799
,053
)T
otal
pnm
aryg
over
nmen
t$
6,65
7,25
9$
6,14
4,96
9$
18,8
68$
20,0
11,4
82$
21,8
05,6
24$
17,9
42.5
90$
18,3
81.5
93J_i1
29
67
97
$66
4,19
1C
oncl
uded
Not
es:
The
city
bega
nto
repo
rtac
crua
lin
form
atio
nw
hen
itim
plem
ente
dG
ASB
Sta
tem
ent
34in
tisca
lye
ar20
02.
The
amou
ntis
rest
ated
CH
ousi
ngau
thor
itybe
cam
ea
disc
rete
com
pone
ntun
itst
artin
gFY
2008
Sou
rce:
City
c(B
erke
ley.
Fin
ance
Dep
artm
ent
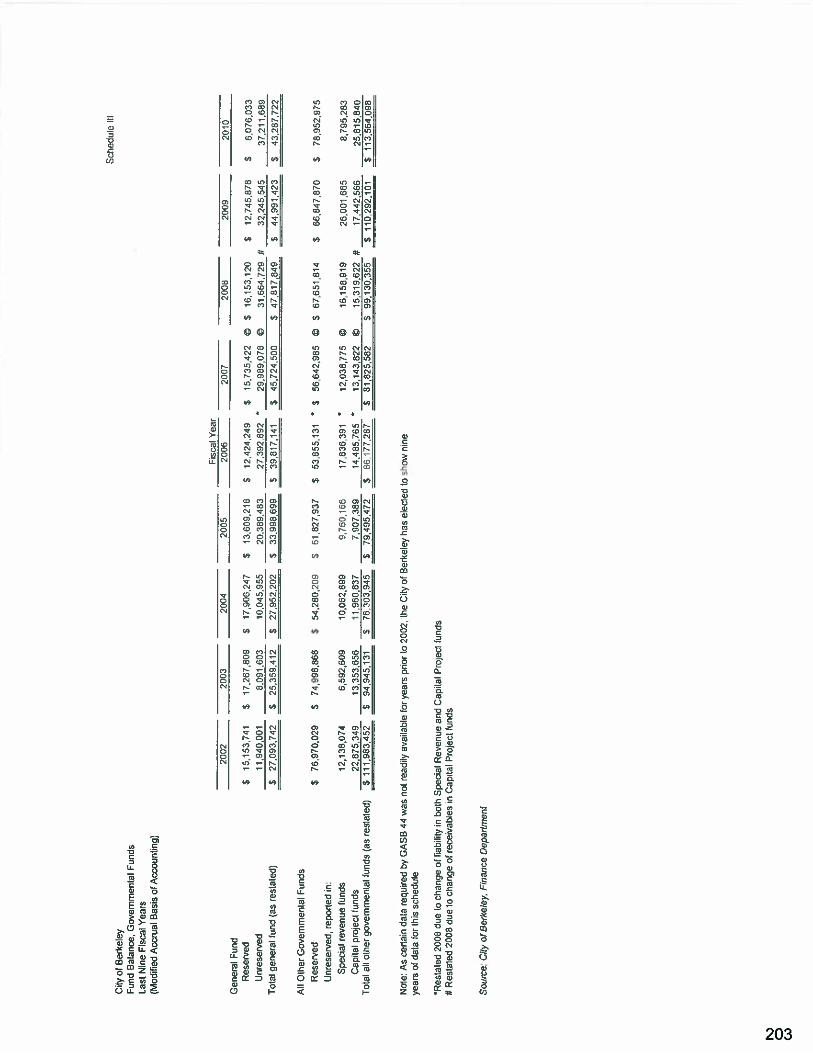
Sch
edue
ittC
ityof
Ber
keey
Fund
Bal
ance
.G
over
nmen
tal
Fun
dsL
ast
N.n
eFi
scal
Yea
s(M
odif
ied
Acc
rLa:
Oas
isof
Acc
ount
ng)
Alt
Oth
erG
over
nmen
tal
Fun
dsR
eser
ved
Unr
eser
ved,
repo
rted
in
Spe
cial
reve
nue
fund
s12138074
6.59
2609
10,0
62,5
999
,76
0.5
517
,536
391
*12
,038
,775
©C
acil
ait:n
;.ect
tund
s22
,875
349
13
.35
3,6
56
11
.95
0,8
37
7,90
7.36
9lh
45
516
5*
13,1
43.8
22©
To
:ala
l;olr
eruover
nm
enla
lfti
nds(
asre
sta:
ed)
$1
11
,98
35
2S
94,9
45,1
31S
Zil
t3,9
45
$79
.495
.472
55.5
71,2
87
$21
,825
,582
-
Not
eA
sC
erla
inda
tare
quir
edsy
GA
SBtt
was
rot
eaci
lvav
ai.a
ole
foye
ars
prie
rto
2002
the
Oy
ct3e
rkel
eyha
see
c:e0
tosh
own,
neye
ars
ofda
tafo
rIb
issc
hedu
le
‘Res
tate
d20
06du
o10
chan
geof
liobi
lily
inbo
thS
peci
alR
even
uean
dC
aptla
tP
roje
ctfu
nds
#R
esla
led
2008
due
toch
ange
ofre
ceiv
abte
sin
Cap
itat
Pro
ject
fund
s
Gen
eral
Fund
Res
erve
dU
nres
erve
dT
otal
gene
ral
fund
(as
resl
ated
)
__
__
__
__
__
__
__
Fisc
alY
ear
2002
2003
2004
2005
2005
2007
2008
2009
$15
,153
,741
$17
,261
,809
$17
,906
,247
$13
,809
,216
$12
,424
,249
$15
,735
,422
©$
16,1
53,1
20$
12,7
45,8
78$
6,07
6,03
311
,940
,001
8,09
1,60
310
,045
,955
20.3
89,4
8321
,392
802
*2
9,9
89
,07
8©
31,6
64,7
29II
32,2
45,5
4537
,211
,689
S21
,093
,742
$25
,359
,412
$27
,952
,202
S33
,998
,699
$39
,817
,141
$45
,724
,500
$47
,617
,849
S44
,991
,423
$43
,287
,722
2010
$76
,970
,029
574
,998
,866
$54
,280
,209
$61
,827
,937
$53
,655
,131
*$
56,6
42,9
85©
$67
,65t
,814
$66
,011
,870
$78
,952
,975
16,1
58,3
1925
,331
.665
15,3
19,6
2217
,442
,566
99,1
30,3
55S
l10,
292,
1O
8,79
5.2
8325
,815
.84
0i
113,
564,
098
Sou
rce:
City
ofB
erke
ley,
F/n
ance
Dep
artm
ent
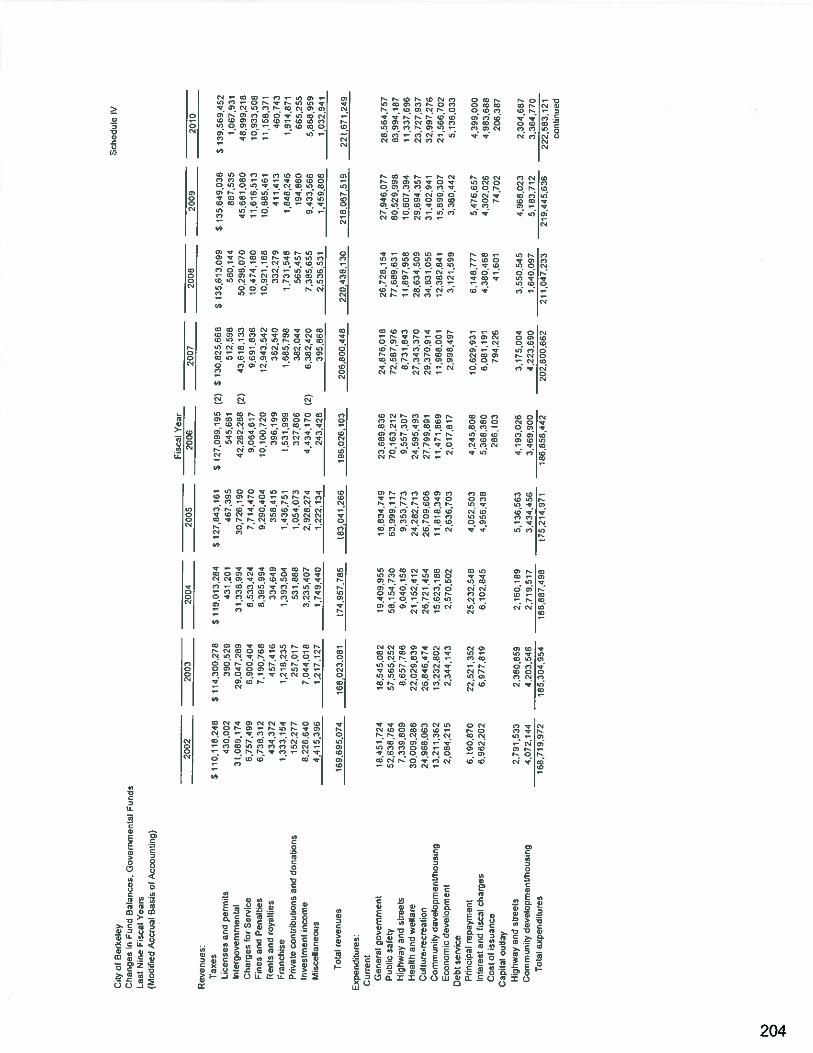
Sch
edul
eIV
City
ofB
erke
ley
Ch
anges
inF
und
Bal
ance
s,G
over
nmen
tal
Fun
dsL
ast
Nin
eF
isca
lY
ears
(Mod
ifie
dA
ccru
alB
asis
ofA
ccou
ntin
g)
Fis
cal
Yea
r20
0220
0320
0420
0520
0620
0720
0820
0920
10R
even
ues
.fa
xes
$I13118246
511
433
021
8$
11
90
13
28
4$
127,
843,
161
S12
7,09
9,19
5(2
)S
130825.6
68
$13
5.61
3,09
9$
135.
649.
038
S13
956
0,45
2L
icen
ses
and
perm
its
430,
032
390
529
4320
146
7,39
554
5,68
512.
598
580,
144
887.
535
1061,9
31
Inte
rgov
emni
enta
l31089,1
74
29,0
47,2
893
13
38
,99
430
,726
,190
42,2
02,2
88(2
)43
,618
,133
50,2
98,0
7045
,681
,000
48.9
99,2
18C
har
ges
for
Ser
vice
6,75
7,49
96,
900,
404
8,53
3,42
47,
714,
470
9,05
4,61
79,
691,
836
10,4
74,1
8011
,616
,513
10,9
33,5
08F
ines
and
Pen
alti
es6,
738,
312
7,1
90,7
688,
395,
994
9,29
0,40
410
.100
,720
12,9
43,5
4210
,921
,168
10,8
85,4
6111
,158
,371
Ren
tsan
dro
yall
ies
434,
372
457,
416
334,
649
358,
415
396.
199
362,
540
332,
279
411,
413
460,
743
Fra
nchi
se1,
333,
154
12
18
,23
51,
393.
504
1,43
6.75
11,
531,
999
1.68
5.79
81.
731,
548
1,84
8,24
61,
914,
871
Pnv
ate
cont
ribu
lion
san
dd
on
atio
ns
152,
277
257.
017
531.
888
1,05
4.07
332
7,80
638
2,04
456
5,45
719
4.86
066
5,25
5In
vest
men
tin
com
e0.
226,
640
7.04
4.01
83,
235,
407
2.92
8,27
44,
434,
170
(2)
0,38
2,42
07,
385,
655
9,43
3,56
65,
868.
959
Msc
ella
neo
us
4,41
5,39
61,
217,
127
1,7
t944
01,
222,
134
243.
428
395,
868
2,S
35.5
31,
459,
808
1.03
2.94
1
Tot
alre
venes
169,
695,
074
158.
023.
091
174,
957,
785
183,
041,
266
195,
026,
103
206
,80
0,4
822
0,43
8,13
021
8,96
7,51
922
1.67
1,24
9E
xpen
ditu
res
Cur
rent
Gen
eral
gove
rnm
ent
18,4
51.7
2418
.545
.082
19,4
09,9
5518
,834
.749
23,6
89,8
3624
,876
,018
26,7
28,1
5427
,946
,077
28,5
64,7
57P
ubli
csa
fely
52,6
38,7
6457
,565
,252
58,1
54,7
3063
,999
.117
70.1
63.2
1272
,587
,976
77,6
89,6
3180
,529
,998
83,9
94,1
87H
ighw
ayan
dst
reet
s7,
339,
809
8,65
7,78
69,
040,
158
9,35
3,77
39.
557.
307
8,73
1,84
311
,897
,958
10,6
07,3
9411
.337
,696
Hea
lth
and
wel
fare
30,0
09,2
8622
,029
,839
21,1
52,4
1224
,282
,713
24.5
95,4
9327
.343
.370
28.6
34.5
0929
.694
,357
23,7
27,9
37C
ultu
re-r
ecre
atio
n24
,968
,063
26,8
46,4
7426
.721
,454
20,7
09.6
0627
.799
.891
29.3
70,9
1434
,831
,055
31.4
02.9
4132
,997
,276
Com
mun
ity
deve
iopm
ens/
hous
ing
13.2
11.3
6213
,232
,802
15,6
23,1
8611
,818
,349
11.4
71,8
6911
,988
,001
12,3
82,8
4115
,898
,307
21,5
66,7
02E
cono
mic
dev
elopm
ent
2,08
4,21
52,
344.
143
2.57
0.50
22.
636,
703
2,01
7,61
72,
998,
497
3,12
1.59
93,
360,
442
5.13
6,03
3D
ebt
serv
ice
Pri
ncip
alre
pay
men
t6,
199.
570
22.5
21.3
5225
,232
.545
4,05
2,50
34
245,
608
13,6
29.9
316.
148.
777
5,’
76
,65
74.
399,
000
nte
rest
and
fisc
alch
arg
es6,
962,
202
6.97
7,81
96.
102,
845
4.95
6,43
85,
368,
380
6,08
1,19
14.
380,
468
4.30
2.02
64,
983,
688
Cos
tof
as,a
nce
286.
103
792.
226
41
60
174
.702
236,
387
Cap
ita!
outl
ayH
ighw
ayan
dsl
reet
s2,
791,
533
2.38
0,85
92,
160.
189
5,1
36,5
634.
193
,026
3,17
5.00
43,
550,
545
4,96
6.02
32,
304,
687
Com
mun
ity
dev
elo
pm
ent/
ho
usi
ng
4,07
2,14
44,
203,
546
2,71
9.51
73,
434.
456
3,46
9.90
04,
223,
690
1,64
0,09
75,
183.
712
3,36
4,77
0T
otal
exp
end
itu
res
168.
719,
972
185,
304,
954
188,
887,
496
175,
214,
971
186,
858,
442
202,
800,
662
211.
047,
233
219,
445,
636
222,
583,
121
cont
inue
d
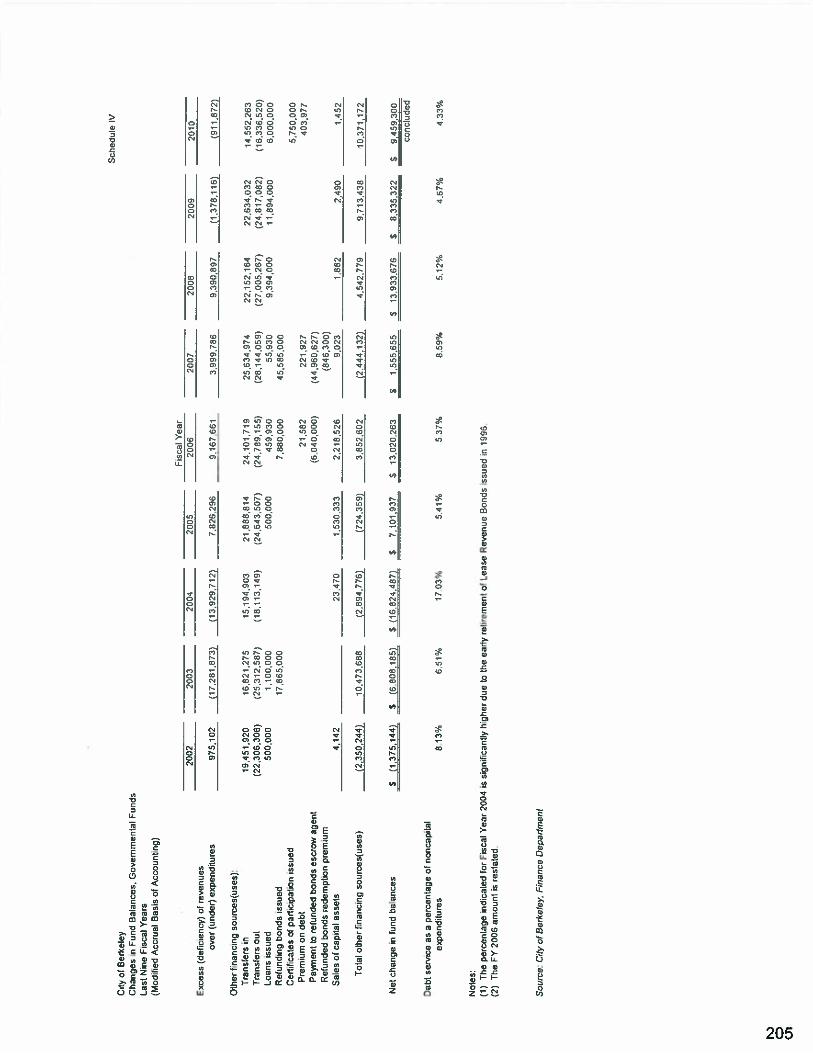
Sch
edule
IVC
ityof
Ber
kele
yC
han
ges
,nF
und
Bal
ance
s,C
over
’n’,
e’:a
IF
unds
Las
tN
ine
Fis
cal
Yea
rs(M
cd.f
ied
Ac:
rual
Bas
isof
Acc
ount
ing)
975,
102
(17.
281.
873)
,jj,
929.l
12j
75
26
29
69,
157
661
Oth
erfr
nanc
ing
sou
rces
(use
s):
Tra
nsfe
rsin
Tra
nsfe
rsou
lL
oans
issu
edR
efun
ding
bond
sis
sued
Cer
tifi
cate
sof
part
tcip
atio
nis
sued
Pre
miu
mon
debt
Pay
men
tto
refu
nded
bond
ses
crow
agen
tR
efun
ded
bond
sre
dem
ptio
npr
emiu
mS
ales
ofca
pita
las
sets
19,4
51,9
2016
,821
,275
(22306,3
06)
(25,
312,
567)
500,
000
1.10
0,00
017865,0
00
15,1
94.9
0321
,688
,814
24.1
01.7
19(1
6,11
3,14
9)(2
4,64
3,50
7)(2
4.78
9.1
55)
500,
000
459,
930
7,88
0,00
0
25,6
34,9
74(2
8,14
4,05
9)55
.93
045
,585
,000
9,02
3
5.75
0,00
040
3,97
7
Tot
alot
her
fina
ncin
gso
urc
es(u
ses)
10,4
73.6
88(2
,894
.7.?
!1(7
24,3
59)
3,85
2.60
2(2
,444
,132
)4,
542,
779
9.71
3.43
810
.371
,172
Net
chan
ge
infu
ndb
alan
ces
$(I‘1
!11
$(6
,808
.185
)$
(16,
824.
4871
$7.
101,
937
$13
.020
.263
$1.
555,
655
$13
,933
,676
$8,
335,
322
$9,
459,
300
conc
lude
d
Not
es:
(1)
The
oer
centa
ge
indi
cate
dfo
rF
isca
lY
ear
2004
issi
gnf
cani
lyhi
gher
due
toth
eea
rly
reli
rerr
eni.
ofL
ease
Rev
enue
Bon
dsis
sueo
in19
96(2
)T
heFY
2006
amo
un
tis
rest
ateo
Exce
ss(d
ef:c
ienc
y)of
reven
ues
over
(und
er)
expe
nd!t
ures
2002
2003
2004
2005
°isc
al_Y
ear
__
__
___
__
__
__
__
__
__
__
__
__
__
_
2006
2007
2008
2039
2010
4,14
2
3.99
9,78
69,
390,
891
(1,3
78.1
16)
(91
,87
2)
22.1
52,
164
(27,
005.
267)
9,3
94,0
00
21,5
8222
1.92
7(6
,040
,000
)(4
4,96
0,62
7)(8
46,3
00)
__
__
__
__
__
__
__
__
23,4
701.
530,
333
2.21
8,52
6
__
__
__
__
__
__
__
__
22.6
34,0
32(2
4,01
7,08
2)11
,894
,000
Deb
tse
rvic
eas
aper
centa
ge
ofno
ncap
ital
expa
ndit
ures
813
%
14.5
52,
263
(16.
336,
520)
6.00
0,0
00
1,88
22,
490
1,45
2
65
1%
1703
%541%
537%
8.59
%52%
487%
433
%
Sourc
e:C
ityot8
ei*el
eyF
inan
ceD
epar
tmen
t
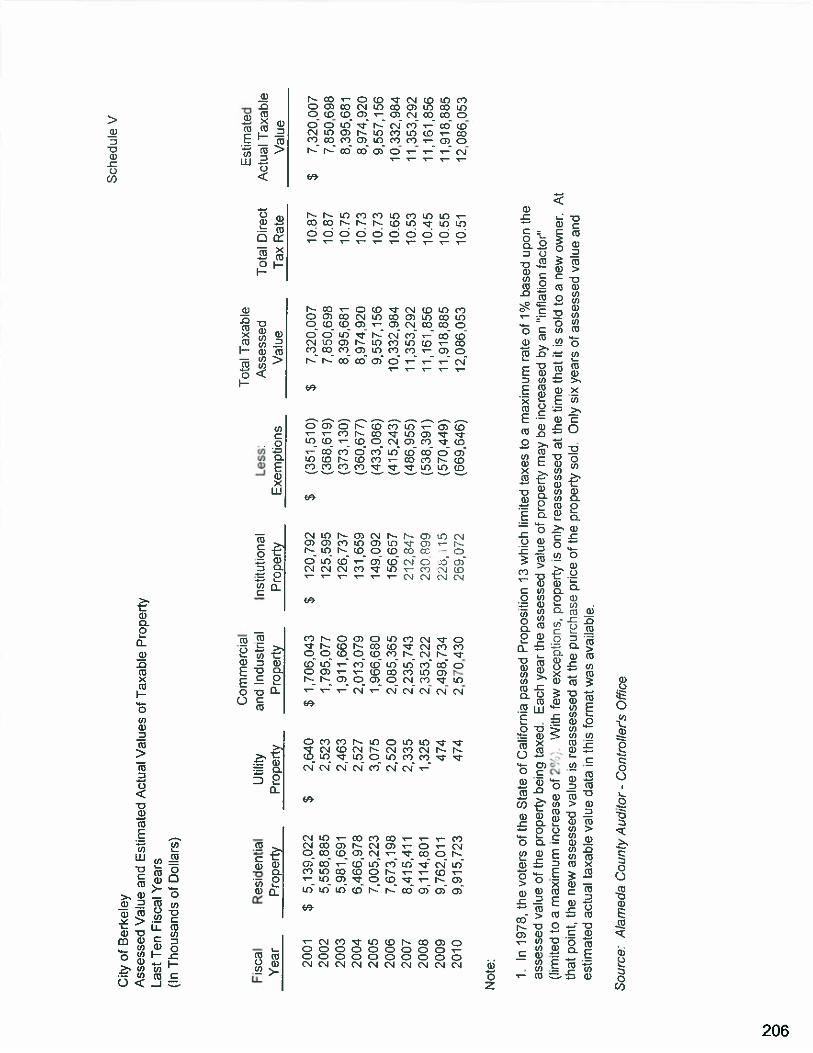
Sch
edule
VC
ityof
Ber
kele
yA
sses
sed
Val
uean
dE
stim
ated
Act
ual
Val
ues
ofT
axab
leP
rope
rty
Las
tT
enF
isca
lY
ears
(In
Th
ou
san
ds
ofD
olla
rs)
Com
mer
cial
Tot
alT
axab
leE
stim
ated
Fis
cal
Res
iden
tial
Util
ityan
dIn
dust
rial
Inst
itut
iona
lL
ess:
Ass
esse
dT
otal
Dir
ect
Act
ual
Tax
able
Yea
rP
rope
rty
Pro
pert
yP
rope
rty
Pro
pert
yE
xem
ptio
nsV
alue
Tax
Rat
eV
alue
2001
$513
90
22
$2640
$1
70
6,0
43
$12
0,79
2$
(351
,510
)$
7,32
0,00
710
.87
$7320,0
07
2002
5,5
58.8
85
2523
t795,0
77
125,
595
(368
,619
)7,
850,
698
10.8
77,
850,
698
2003
5,98
1,69
12,
463
1,91
1,66
012
6,73
7(3
73,1
30)
8,39
5,68
11075
8,39
5,68
120
046,4
66,9
78
2,52
72,
013.
079
131,
659
(360
.677
)8,
974,
920
10.7
38,
974,
920
2005
7,0
05
22
33,
075
1,96
6,68
014
9,09
2(4
33,0
86)
9,55
7,15
610
.73
9,55
7,15
620
067,
673,
198
2,52
02,
085,
365
156,
657
(415
,243
)10
,332
,984
10.6
510
,332
,984
2007
8,41
5,41
12,
335
22
35
,74
321
2,84
7(4
86,9
55)
11,3
53,2
9210
.53
11,3
53,2
9220
089,
114,
801
1,32
52,
353,
222
23fl
.899
(538
,391
)11
,161
,856
10.4
511
,161
,858
2009
9,76
2,01
147
42,
496,
734
2zo,
j15
(570
,449
)11
,918
,885
10.5
511
,918
,885
2010
9,91
5,72
347
42:
570,
430
269.
072
(669
.646
)12
,086
.053
10.5
112
.086
,053
Not
e:
1.In
1978
,th
evo
ters
ofth
eS
tate
ofC
alif
orni
apas
sed
Pro
posi
tion
13w
hich
limite
dta
xes
toa
max
imum
rate
of1%
bas
edup
onth
eass
ess
ed
valu
eof
the
prop
erty
bein
gta
xed.
Eac
hy
ear
the
asse
ssed
valu
eof
prop
erty
may
bein
crea
sed
byan
“inf
latio
nfa
ctor
”(l
imite
dto
am
axim
umin
crea
seof
2’,
‘.
With
few
exce
ptio
ns,
prop
erty
ison
lyre
asse
ssed
atth
eti
me
that
itis
sold
toa
new
owne
r,A
tth
atpo
int,
the
new
asse
ssed
valu
eis
reas
sess
edat
the
pu
rch
ase
pric
eof
the
prop
erty
sold
.O
nly
six
yea
rsof
asse
ssed
valu
ean
des
tim
ated
actu
alta
xabl
eva
lue
dat
ain
this
form
atw
asav
aila
ble.
So
urc
e:A
lam
eda
Cou
nty
Aud
itor
-C
ontr
olle
r’s
Off
ice
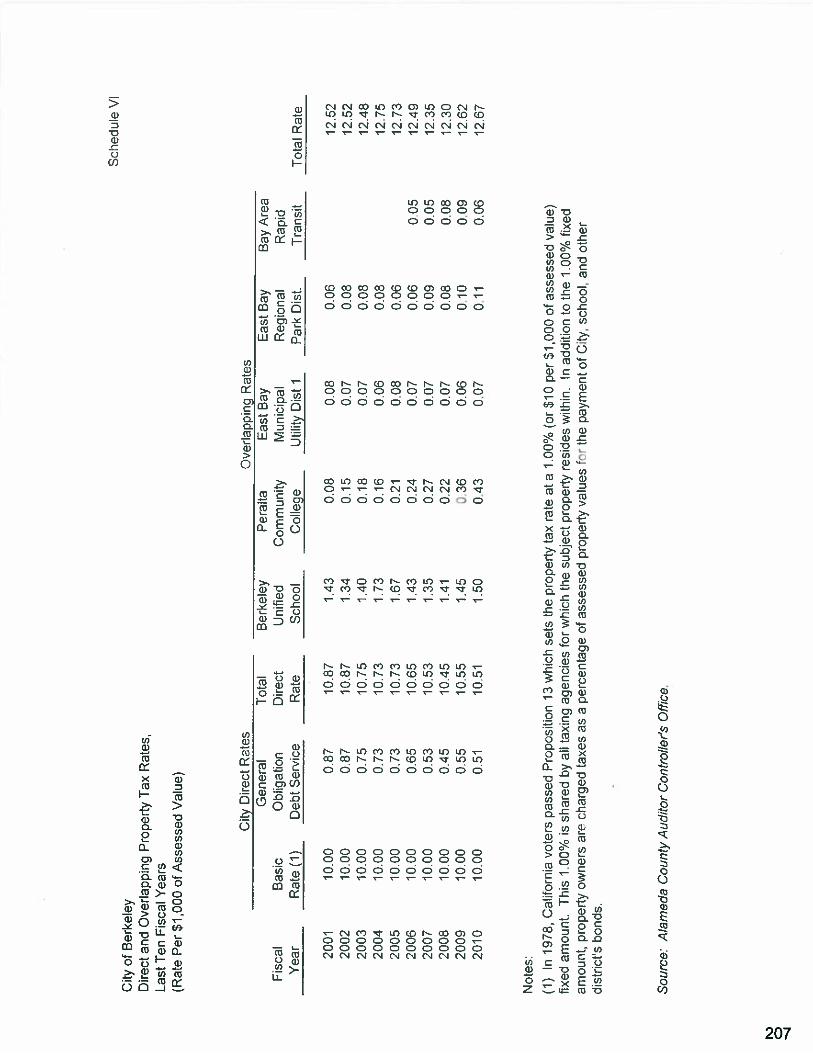
Sch
edu
leV
IC
ityof
Ber
kele
yD
irec
tan
dO
verl
appT
hgP
rope
rty
Tax
Rat
es,
Las
tT
enF
isca
lY
ears
(Rat
eP
er$1
,000
ofA
sses
sed
Val
ue)
City
Dir
ect
Rat
esO
verl
appi
ngR
ates
Gen
eral
Tot
alB
erke
ley
Per
alta
Eas
tB
ayE
ast
Bay
Bay
Are
aF
isca
lB
asic
Obl
igat
ion
Dir
ect
Uni
fied
Com
mun
ity
Mun
icip
alR
egio
nal
Rap
idY
ear
Rat
e(1
)D
ebt
Ser
vice
Rat
eS
choo
lC
olle
geU
tility
Dis
tI
Par
kD
ist,
Tra
nsit
Tot
alR
ate
2001
10.0
00.
8710
.87
1.43
008
0.08
0.06
12.5
220
0210
.00
0.87
10.8
71,
340.
150.
070.
0812
.52
20D
310
.00
0.75
10.7
5‘L
400.
180.
070.
0812
,48
2004
10.0
00.
7310
.73
1.73
0.16
0.06
0.08
12.7
520
0510
.00
0.73
10.7
31.
670.
210.
080.
0612
.73
2006
10.0
00.
6510
.65
1.43
0.24
0.07
0.06
0.05
12.4
920
0710
.00
0.53
10.5
31.
350,
270.
070.
090.
0512
.35
2Q08
10.0
00.
4510
.45
1,41
0.22
0.07
0.08
0.08
12.3
020
0910
.00
0.55
10.5
51.
450.
360.
060.
100.
0912
.62
2010
10.0
00.
5110
.51
1.50
0.43
0.07
0.11
0.06
12.6
7
Not
es:
(1)
In19
78,
Ca(
ifor
nia
vote
rspas
sed
Pro
posi
tion
13w
hich
sets
the
prop
erty
tax
rate
ata
1.00
%(o
r$1
0pe
r$1
,000
ofas
sess
edva
lue)
fixe
dam
ount
,T
his
1.00
%is
shar
edby
all
taxi
ngag
enci
esfo
rw
hich
the
sub
ject
prop
erty
resi
des
with
in.
Inad
diti
onto
the
1.00
%fi
xed
amou
nt,
prop
erty
owne
rsar
ech
arged
tax
esas
ap
erce
nta
ge
ofas
sess
edpr
oper
tyv
alu
esr
the
paym
ent
ofC
ity,
scho
ol,
and
othe
rdi
stri
ct’s
bond
s.
So
urc
e:A
lam
eda
County
Aud
itor
Con
trol
ler’
sO
ffic
e.
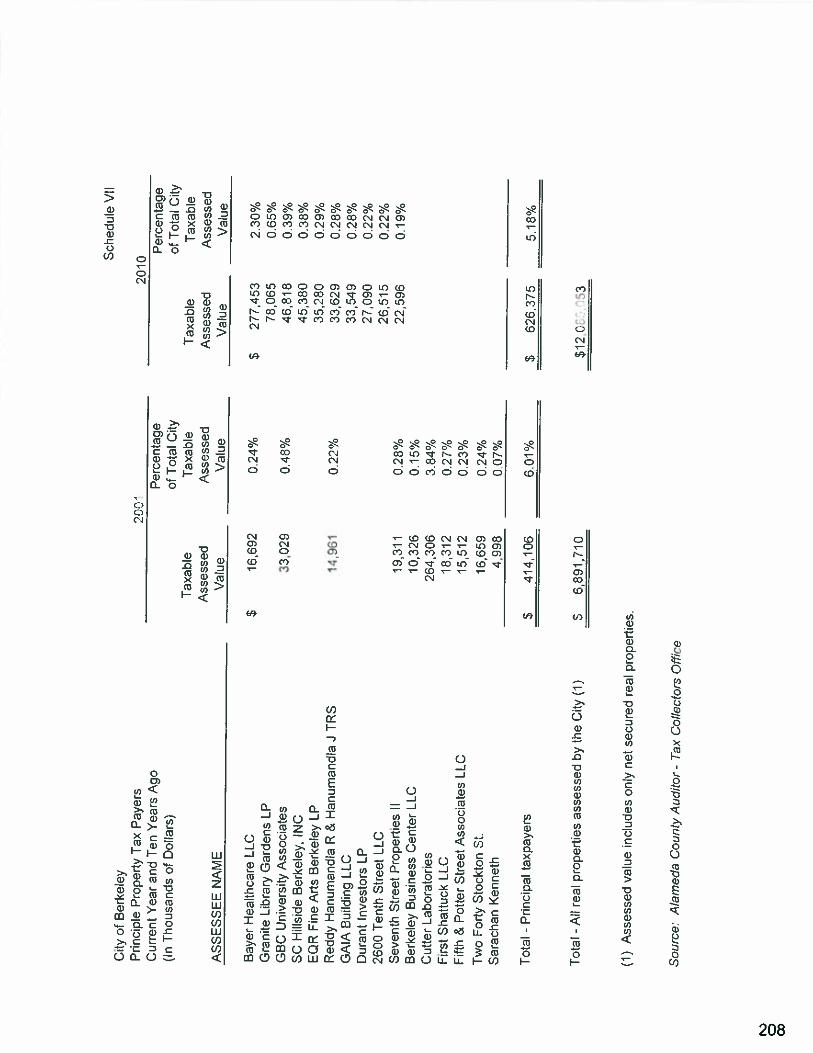
Sch
edu
leV
IIC
ityof
Ber
kele
yP
rinc
iple
Pro
pert
yT
axP
ayer
sC
urre
ntY
ear
and
Ten
Yea
rsA
go(I
nT
housa
nds
ofD
olla
rs)
AS
SE
SS
EE
NA
ME
Bay
erH
ealt
hca
reL
LC
Gra
nite
Lib
rary
Gar
den
sL
PG
BC
Uni
vers
ity
Ass
oci
ates
SC
Hil
lsid
eB
erke
ley,
INC
EQ
RF
ine
Art
sB
erke
ley
LP
Red
dyH
anu
man
dla
R&
Han
um
and
laJ
TR
SG
AlA
Bui
ldin
gL
LC
Dur
ant
Inves
tors
LP
2600
Ten
thS
tree
tL
LC
Sev
enth
Str
eet
Pro
per
ties
[IB
erke
ley
Bu
snes
sC
ente
rL
LC
Cut
ter
Lab
ora
tori
esF
irst
Shat
tuck
LL
CFi
fth
&P
otte
rS
tree
tA
ssoci
ates
LLC
Tw
oF
orty
Sto
ckto
nSt
.S
arac
han
Ken
neth
Tot
al-
Pri
ncip
alta
xp
ayer
s
$277,4
53
78,0
6546.8
18
45,3
80
35,2
8033
,629
33,5
49
27,0
90
26,5
15
22,5
96
Tot
al-
All
real
pro
per
ties
ass
ess
ed
byth
eC
ity(1
)$
6,6
91710
$12C
.E53
(1)
Ass
esse
dva
lue
incl
udes
only
net
secu
red
real
prop
erti
es.
2010
Per
centa
ge
ofT
otal
City
Tax
able
Tax
able
Ass
esse
dV
alue
-‘P
c.,
Per
centa
ge
ofT
otal
City
Tax
able
Tax
able
Ass
esse
dA
sses
sed
Val
ueV
alue
$16
,692
0.24
%
33
02
90.
48%
14,9
610.
22%
19,3
110.
28%
10,3
260.
15%
264,3
06
3.84
%18
,312
0.27
%15
,512
0.23
%16
,659
0.24
%4,
998
0.07
%
S414,1
06
6.01
%
Ass
esse
dV
alue
2.30
%0.
65%
0.39
%0.
36%
0,29
%0,
26%
0.28
%0.
22%
0.22
%0.
19%
S626.3
75
5.18
%
So
urc
e:A
lam
eda
Cou
nty
Aud
itor
-T
axC
olle
ctor
sO
ffic
e
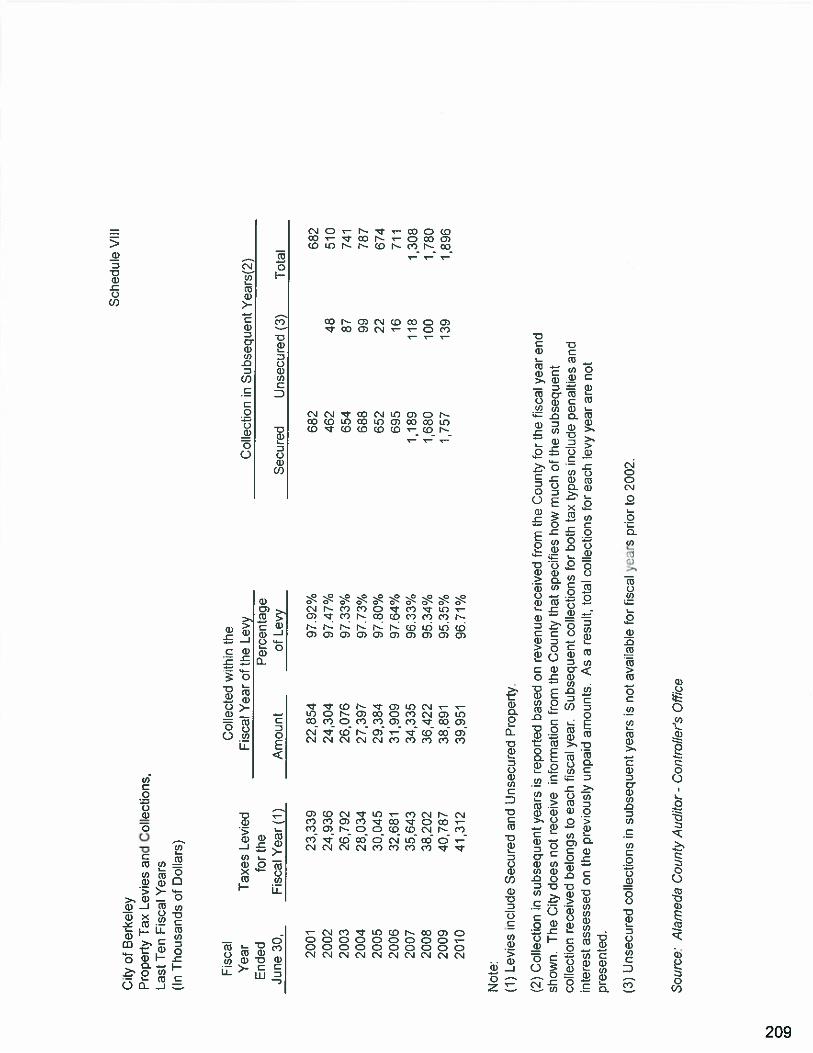
Sch
edule
VIII
City
ofB
erke
ley
Pro
pert
yT
axL
evie
san
dC
olle
ctio
ns,
Las
tT
enF
isca
lY
ears
(In
Th
ou
san
ds
ofD
olla
rs)
Not
e:(1
)L
evie
sin
clud
eS
ecu
red
and
Unse
cure
dP
rope
rty.
(2)
Col
lect
ion
insu
bse
quen
tyea
rsis
repo
rted
bas
edon
reve
nue
rece
ived
from
the
Cou
nty
for
the
fisc
alye
aren
dsh
own.
The
City
do
esno
tre
ceiv
ein
form
atio
nfr
omth
eC
ount
yth
atsp
ecif
ies
how
muc
hof
the
sub
seq
uen
tco
flec
tion
rece
ived
belo
ngs
toea
chfi
scal
year
.S
ubse
quen
tco
llec
tion
sfo
rbo
thta
xty
pes
incl
ude
pen
alti
esan
din
tere
stas
sess
edon
the
prev
ious
lyun
paid
amou
nts
.A
sa
resu
lt,
tota
lco
Hec
tion
sfo
rea
chle
vyy
ear
are
not
pre
sen
ted
.
(3)
Unse
cure
dco
llec
tion
sin
subse
quen
tyea
rsis
not
aval
able
for
fisc
alyc
urs
prio
rto
2002
.
Fis
cal
Col
lect
edw
ithin
the
Yea
rT
axes
Lev
ied
Fis
cal
Yea
rof
the
Lev
yE
nded
for
the
Per
centa
ge
Jun
e30
,F
isca
lY
ear
(1)
Am
ount
ofL
evy
Col
lect
ion
inS
ub
seq
uen
tY
ears
(2)
Sec
ure
dU
nse
cure
d(3
)T
otal
2001
23,3
3922
,854
97.9
2%68
268
220
0224
,936
24,3
0497
.47%
462
4851
020
0326
,792
26,0
7697
.33%
654
8774
120
0428
,034
27,3
9797
.73%
688
9978
720
0530
,045
29,3
8497
.80%
652
2267
420
0632
,681
31,9
0997
.64%
695
1671
120
0735
,643
34,3
3596
.33%
1,18
911
81,
308
2008
38
20
236
,422
95.3
4%1680
100
1,78
020
0940787
38,8
9195
.35%
1757
139
1,89
620
1041
,312
39,9
5196
,71%
So
urc
e:A
lam
eda
Cou
nty
Aud
itor
-C
ontr
olle
r’s
Off
ice
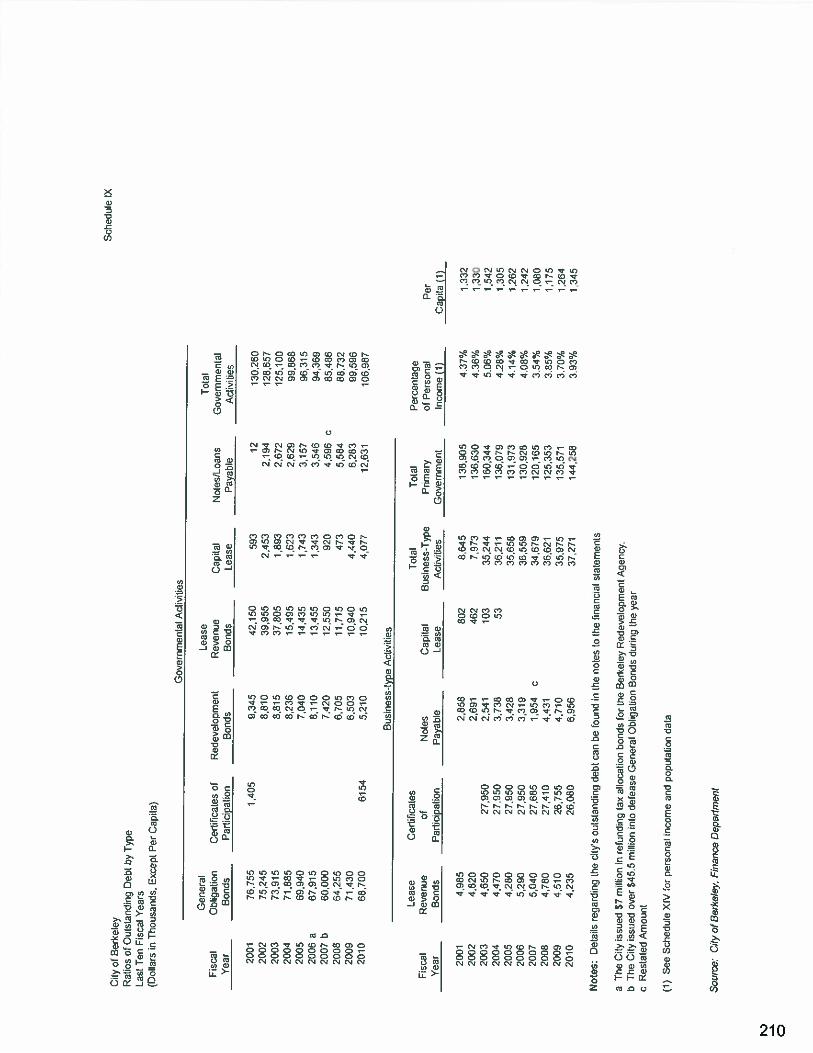
Sch
edul
eIX
City
ofB
erke
ley
Rat
ios
ofO
utst
andi
ngD
ebt
byT
ype
Las
tT
enFi
scal
Yea
rs(D
olla
rsin
Tho
usan
ds,
Exc
ept
Per
Cap
ita)
Gov
ernm
enta
lA
ctiv
ities
Gen
eral
Lea
seT
otal
Fis
cal
Obl
igat
ion
Cer
tiri
cale
sof
Red
evel
opm
ent
Rev
enue
Cap
ital
No
tesk
oan
sG
cver
nmen
tal
Yea
rB
onds
Par
tict
pati
onB
onds
Bon
dsL
ease
Pay
able
Act
:vtie
s
2001
76,7
55.4
05
9,34
542
,150
593
1213
0.25
020
0275
.245
8,81
039
.955
2.45
32,
194
128,
657
2003
73,9
158.
815
37,8
051,
893
2,67
212
5,10
020
0471
,885
8,23
515
,495
1,62
32.
629
99.5
6820
0569
,940
7,04
014
,435
1,74
33.
157
96,3
1520
06a
67.9
158.
110
13,4
551,
343
3,54
694
,369
2007
b60
.000
7,42
012
,550
920
4,59
6c
85,4
8620
0864
,255
6,70
511
,715
473
5,58
488
,732
2009
71,4
306,
503
10,9
404,
440
6,28
399
,596
2010
68,7
0061
545,
210
10,2
154,
077
12,6
3110
6,98
7
Bus
ines
s-ty
peA
ctM
ties
Lea
seC
erti
Oca
tes
Tot
alT
otal
Per
cent
age
Fis
cal
Rev
e9ue
ofN
otes
Cap
itai
Bus
ines
s-T
ype
Fr:
mar
yof
Per
sona
lP
erY
ear
Bon
esP
arti
cipa
tion
Pay
able
Lea
seA
ctiv
ities
Gov
ernm
ent
Inco
me
(1)
2001
4,98
52,
858
802
8,64
513
8,90
54.
37%
1,33
220
024,
820
2.69
146
27,
973
136,
630
4.36
%1,
330
2003
4,65
027
,950
2,54
110
335
,244
160,
344
5.06
%1,
542
2004
4,47
027
,950
3,73
853
36,2
1113
6,07
94.
28%
1,30
520
054280
27.9
503.
428
35,6
5813
1.9
734.
14%
1,26
220
065,
290
27,9
503,
319
36.5
5913
0,92
84.
08%
1.24
220
375,
040
27.6
851,
954
c34
,579
120,
165
3.5’
%1,
080
2008
4,78
027
:410
4,43
136
.621
125,
353
385%
1.17
520
094.
510
26,7
554,
710
35,9
7513
5,57
1370%
1,26
420
104,
235
26,0
806.
956
37,2
711’
4,25
83.
93%
1345
Not
es;
Det
ails
rega
rdin
gtn
eot
y’s
outs
tand
ing
debt
can
befc
und
nth
eno
tes
toth
efi
nanc
ial
stat
emen
ts
aT
heC
ityis
sued
$7m
illio
nin
refu
ndin
gta
xal
loca
tion
bond
sfo
r[h
eB
erke
ley
Red
evel
opm
ent
Age
ncy.
bT
heC
ityis
sued
over
$45.
5m
illio
nin
todef
ease
Gen
eral
Obl
igat
ion
Bon
dsdu
ring
the
year
cR
esta
ted
Am
ount
(1)
See
Sch
edul
eX
IVfo
rpe
rson
alin
com
ean
dpo
puta
tion
data
Sou
rce:
Ci&
ofB
erke
ley
Fin
ance
Dep
artm
ent

Sch
edul
eX
City
ofB
erke
ley
Rat
ios
ofG
ener
alB
onde
dD
ebt
Out
stan
ding
Las
tT
enF
isca
lY
ears
(Dol
lars
inT
hous
ands
,E
xcep
tP
erC
apit
a)
Gen
eral
Bon
ded
Deb
tO
utst
andi
ngP
erce
nta
ge
ofG
ener
alT
axA
ctua
lT
axab
leF
isca
lO
blig
atio
nR
even
ueA
lloca
tion
Val
ueof
Per
Yea
rB
onds
Bon
dsB
onds
Tot
alP
rope
rty
(a)
Cap
ita
(b)
2001
76,7
5542
,150
9,34
512
8,25
01.
94%
1,24
820
0275
,245
39955
8,81
012
4,01
01.
74%
1,19
220
0373
,915
37,8
058,
815
120,
535
158%
1,15
6
a20
0471
,885
15,4
958,
236
95,6
161.
16%
915
2005
69,9
4014
,435
7,04
091
,415
1.05
%86
767
,915
13,4
558,
110
89,4
800.
94%
841
2007
60,0
0012
,550
7,42
079
,970
0.77
%75
220
086
4,2
55
11
71
51!
bW6,
705
82,6
750.
68%
775
2009
71,4
3010
,940
59
70
88,3
400.
74%
824
2010
68,7
0010
,215
‘‘
5,21
084
,125
0.70
%77
8
Not
es:
Det
ails
rega
rdin
gth
eci
ty’s
outs
tand
ing
debt
can
befo
und
inth
eno
tes
toth
efi
nanc
ial
stat
emen
ts.
(a)
See
Sch
edul
eV
for
prop
erty
valu
eda
tafo
rF
Y20
0Ito
2010
(b)
Pop
ulat
ion
data
can
befo
und
insc
hedu
le14
.
Sou
rce:
Fin
ance
Dep
artm
ent,
City
ofB
erke
ley
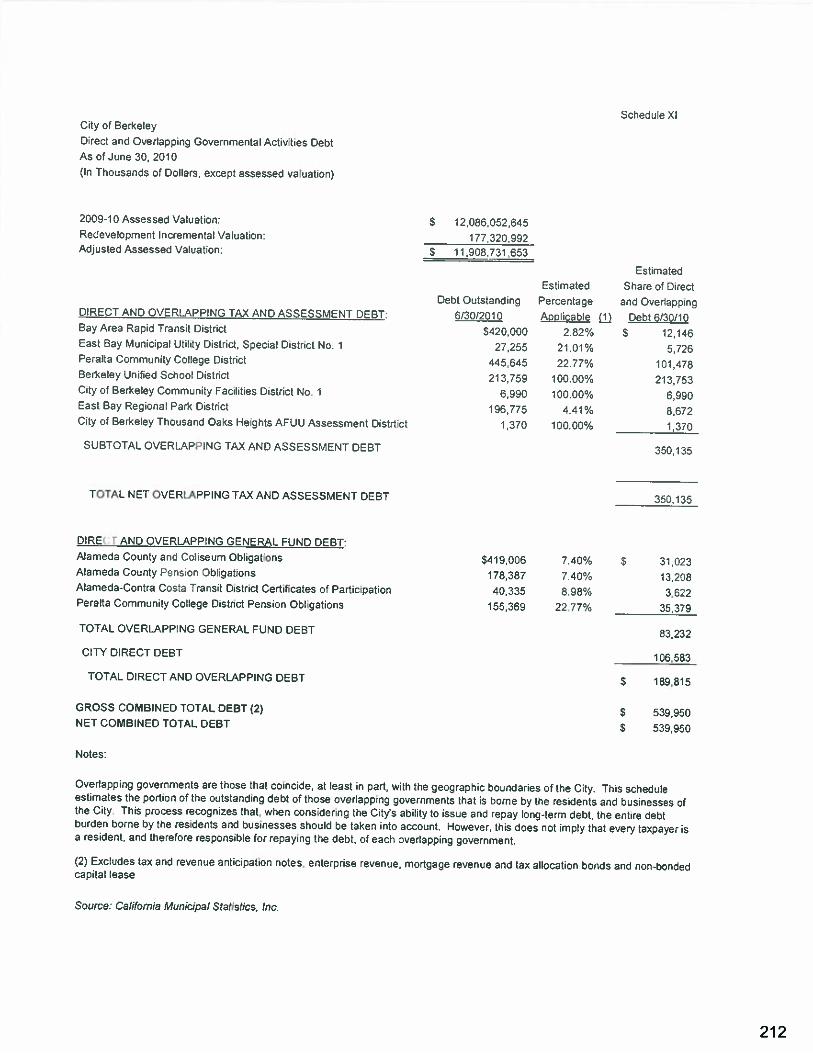
Schedule XlCity of Berkeley
Dfrect and Ovenapping Governmental Activfties DebtAs of Jre 30. 2013
(In Thousands of Dollars, except assessed valuation)
2009-IC Assessed Valuabon S 12 085,052 645Redev&opmert Incremental Valuation: 177320992Adjusted Assessed ValuatEcn: S 11938.731,653
EstimatedEstimated Share of Direct
Debt Outstanding Percentage and OverlappingDIRECT AND OVERLAPPING TAX AND ASSESSMENT DEBT: 6/3012010 Aoo[icable (jJ Debt 6/30/ICBay Area Rapid Transit District 5423,000 2.82% S 12,46East flay Municipal Utility District, Special District No. 1 27.255 21.01% 5.726Perafla Community College Disuict 445645 22.77% 101478Serkeley Unified School District 213,759 100,00% 213,753City of Berkeley Community Facilities District No. 1 6,990 100.00% 6,990East flay Regional Park District 196,775 4.41% 8,672Cty of Berkeley Thousand Oaks Heights AFUU Assessment Disttct 1.370 100.00% 1370
SUBTOTAL OVERLA2PING TAX AND ASSESSMENT DEBT 350,35
TOTAL NET OVERLAPPING TAX AND ASSESSMENT DEBT 350,135
DIRE AND OVERLAPPING GENERAL FUND DEBT:Alameda County and Coliseum Obligations 5419,006 7.40% $ 31,023Alameda County Iension Obhgaticns 178,387 7.40% 13,208Alameda-Contra Costa Transit District Certificates of Participation 40,335 8.98% 3,622Peralta Community College District Pension Obligations 155,369 22.77% 35,379
TOTAL OVERLAPPING GENERAL FUND DEBT 83,232
CITY DIRECT DEBT 105,583
TOTAL DIRECT AND OVERLAPPING DEBT $ 189,815
GROSS COMBINED TOTAL DEBT (2) $ 539950NET COMBINED TOTAL DEBT $ 539,950
Notes.
Overlapping governments are those that coincide, at least in part, with the geographic boundaries of the City This scheduleestimates the portion of the outstanding debt of those overlapping governments that is hcrne by the residents and businesses ofthe City. This process recognizes that, when considerng the Cit/s abilty to :ssue and ‘epay ong-term debt, the entire debtburden borne by the residents and ousinesses should be taken into accounL However, th s does not mpiy that eve.? taxpayer isa resident, and theeore responstble for mpaying the debt, of ea& veiapping government.
(2) Excludes tax and revenue anticipation nctes, enterprise revenue, mortgage revenue and tax allocation bonds and non-bondedcapital lease
Source: California Municipal Statistics, Inc.
212
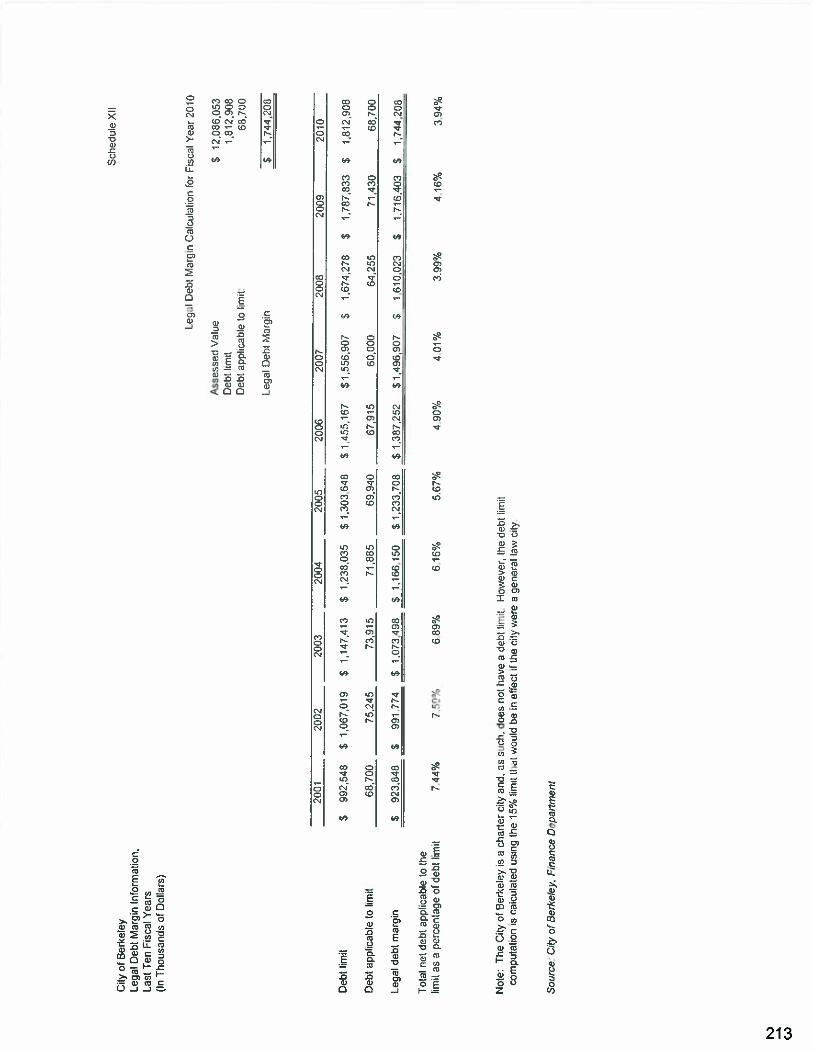
Sch
edul
eXI
IC
ityof
Ber
keFe
yL
egal
Deb
tM
argi
nlr
icrm
a:ic
n.L
ast
Ten
Fis
cal
Yea
rs(I
nT
hous
ands
ofD
olla
rs)
Leg
alD
ebt
Mar
gin
Cal
cula
tion
for
Fis
cal
Yea
r20
10
Ass
esse
dV
alue
$12
,086
,053
Deb
tlim
it1,
612,
908
Deb
tap
plic
able
tolim
it:68
,700
Leg
alD
el-I
r.la
rgin
$1.
744,
208
Not
e:T
heC
ityof
Ber
kelc
yis
ach
arte
rci
tyan
d,as
such
,do
esno
tha
vea
debt
limit.
How
ever
,th
ede
btlim
itco
mpu
tati
onis
caic
ulat
edusr
gth
e15
%lim
it:I:
d:.v
culd
bein
effe
ctif
the
city
wer
ea
gene
ral
law
city
.
Deb
tlii
jiit
Deb
tap
plic
able
tolim
it
Leg
alde
btm
argi
n
Tot
alne
tde
btap
plic
able
toth
elim
itas
ape
rcen
tage
ofde
btlim
it
20
020
02
$99
2,54
8$
1,06
7,01
9
68,7
0075
.245
$92
3,84
8$
991.
774
2003
$1,
147,
413
73,9
15
1,07
3,49
8
200
$1,
233,
035
71885
1,16
6,15
0
2005
$1,
303,
6.16
69,9
40
$1,
233,
708
2006
$1,
455,
167
67,9
15
$1,
387,
252
2007
$1,
555,
907
60,0
00
S1,
496,
907
2008
$1,
674,
278
64,2
55
1,61
0,02
3$
$$
$
2009
$1,
787,
833
71,4
30
1,71
6,40
3
2010
$1,
812,
908
68,7
00
1,74
4,20
8
7.44
%7,
59%
6.89
%6.
16%
5.67
%4.
90%
4.01
%3.
99%
4.16
%3.
94%
Sou
rce.
City
ofB
erke
ley,
Fin
ance
Dep
artm
ent
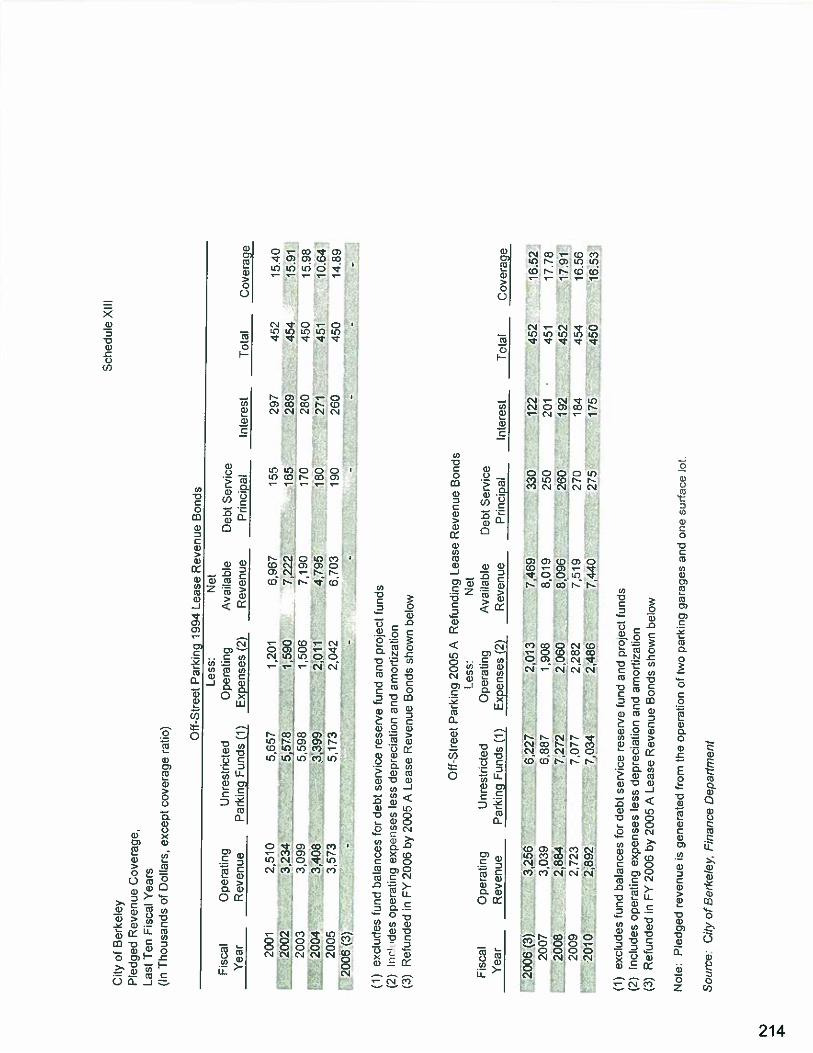
Sch
edul
eX
IIIC
ityof
Ber
kele
yP
ledo
edR
even
ue
Cov
erag
e,L
ast
Ten
Fis
cal
Yea
rs(I
nT
ho
usa
nd
sof
Dol
lars
,ex
cept
cov
erag
era
tio)
Off
-Str
eet
Par
king
1994
Lea
seR
even
ue
Bon
dsL
ess:
Net
Fis
cal
Ope
rati
ngU
nres
tric
ted
Ope
rati
ngA
vaii
able
Deb
tS
ervi
ceY
ear
Rev
enu
eP
arki
ngF
unds
(1)
Ex
pen
ses
(2)
Rev
enue
Pri
ncip
alIn
tere
stT
otal
Cov
erag
e
2001
2510
5,65
712
016967
155
297
452
15.4
020
02-
3234
5,57
81,5
90
7,22
216
528
945
415
.91
2003
3,09
95,
698
1,50
67,
190
170
280
450
15.9
820
043,
408
3,39
92,
011
4,79
518
027
145
110
.64
2005
3,57
35.
173
2,04
26.
703
190
260
450
1489
2006(3
)-
--
--
--
-
(1)
excl
udes
fund
bal
ance
sfo
rde
btse
rvic
ere
serv
efu
ndan
dpr
ojec
tfu
nds
(2)
lnr!
:de
sop
erat
ing
expe;
ises
less
depr
ecia
tion
and
amor
tiza
tion
(3)
Ref
unde
din
FY20
06by
2005
AL
ease
Rev
enue
Bon
dssh
own
belo
w
Off
-Str
eet
Par
king
2005
AR
efun
ding
Lea
seR
even
ue
Bon
dsN
etF
isca
lO
pera
ting
Unr
estr
icte
dO
pera
ting
Ava
ilab
leD
ebt
Ser
vice
Yea
rR
even
ue
Par
king
Fun
ds(1
)E
xp
ense
s(2
)R
even
ueP
rinc
ipal
Inte
rest
Tot
alC
over
age
2006
(3)
3,25
66,
227
2,01
37.
469
330
122
452
16.5
220
073,
039
6.88
71,
908
8,01
925
020
145
11
77
820
082,
884
-7,
272
2,06
08096
260
192
452
17.9
120
092,
723
7.07
72,
282
7,51
927
018
445
416
.56
2010
2,89
27,
034
2,48
67,
440
275
175
450
16.5
3
(1)
excl
udes
fund
bal
ance
sfo
rde
btse
rvic
ere
serv
efu
ndan
dpr
ojec
tFu
nds
(2)
Incl
udes
oper
atin
gex
pen
ses
less
depr
ecia
tion
and
amor
tiza
tion
(3)
Ref
unde
din
FY20
06by
2005
AL
ease
Rev
enu
eB
onds
show
nbe
low
Not
e;P
ledg
edre
venu
eis
gen
erat
edfr
omth
eop
erat
ion
oftw
opa
rkin
gg
arag
esan
don
esu
rfac
elo
t.
Sou
rce:
City
ofB
erke
ley,
Fin
ance
Dep
artm
ent
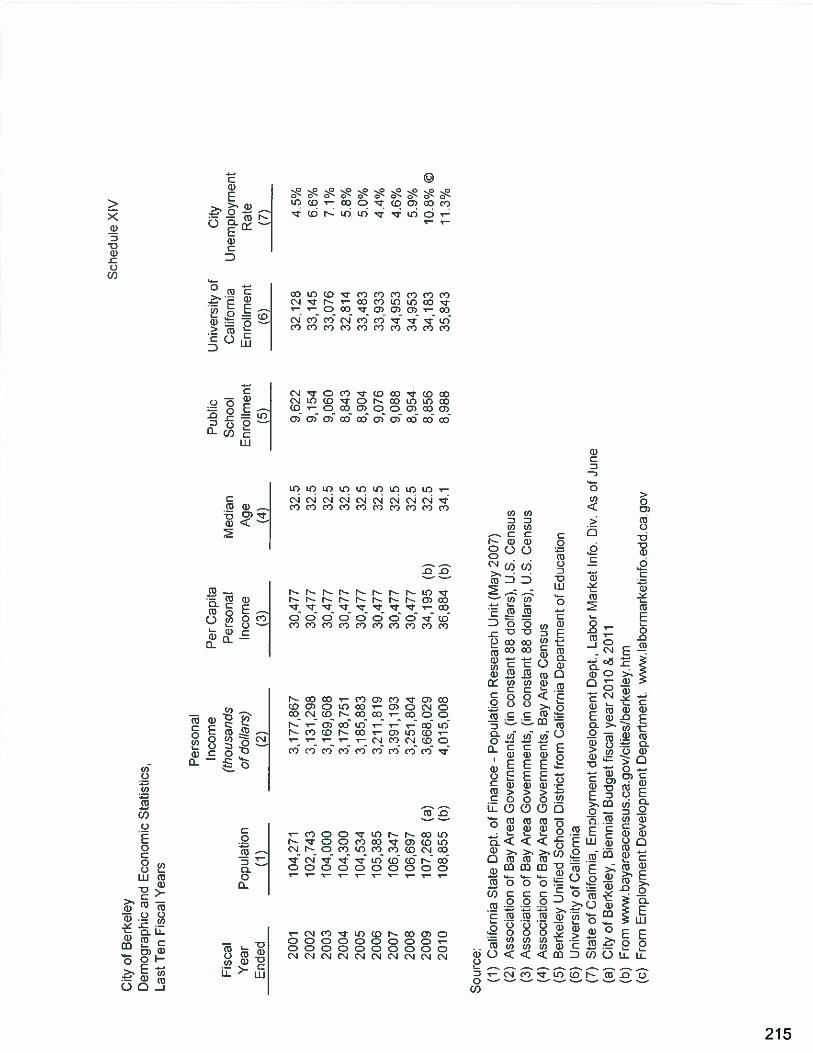
Sch
edu
leX
IVC
ityof
Ber
kele
yD
emog
raph
ican
dE
cono
mic
Sta
tist
ics,
Las
tT
enF
isca
lY
ears
Cal
ifor
nia
Sta
teD
ept.
ofFi
Ass
ocia
tion
ofB
ayA
rea
Ass
ocia
tion
ofB
ayA
rea
Ass
ocia
tion
ofB
ayA
rea
Ber
kele
yU
nifi
edS
choo
lU
nive
rsit
yof
Cal
ifor
nia
Sta
teof
Cal
ifor
nia.
En
oy
men
tdev
elopnen
tD
ept.,
Lab
orM
arke
tIn
fo.
Div
.A
sof
June
City
ofB
erke
ley.
Bie
nnia
lB
udge
tfi
scal
yea
r20
10&
2011
Fro
mw
*w
.bay
area
censu
sca.
gov/c
itie
s/ber
kel
eyh
tmF
rom
Em
ploy
men
tD
evel
opm
ent
Dep
artm
ent.
ww
i.la
borm
arket
info
.edd.c
a.gov
Per
sonal
Inco
me
Fis
cal
(th
ou
san
ds
Yea
rP
opul
atio
nof
doll
ars)
End
ed(1
)(2
)
Per
Cap
ita
Pub
lic
Uni
vers
ity
ofC
ityP
erso
nal
Med
ian
Sch
ool
Cal
ifor
nia
Une
mpl
oym
ent
Inco
me
Age
Enr
oflm
ent
Enr
ollm
ent
Rat
e(3
)(4
)(5
)(6
)(7
)
2001
104271
31
77
86
730477
32.5
9,62
232
,128
4.5%
2002
102743
3,13
1,29
830
,477
32.5
9,15
433
,145
6.6%
2003
104,
000
3,16
9,60
830
,477
32.5
9,06
033
,076
7.1%
2004
104,
300
3,17
8,75
130
,477
32.5
8,84
332
,814
5.6%
2005
104,
534
3,18
5,88
330
,477
32.5
8,90
433
,483
5.0%
2006
105,
385
3,21
1,81
930
,477
32.5
9,07
633
,933
4.4%
2007
106,
347
3.39
1,19
330
,477
32.5
9,08
834
,953
4.6%
2008
106,
697
3.25
1,80
430
,477
32.5
8,95
434
,953
5,9%
2009
107,
268
(a)
3,66
8,02
934
,195
(b)
32.5
8,85
634
,183
10.8
%©
2010
108,
855
(b)
4,01
5,00
836
,884
(b)
34.1
8,98
835
,843
11.3
%
Sourc
e(1
)(2
)(3
)(4
)(5
)
(a)
(b)
(c)
nan
ce—
Pop
ulat
ion
Res
earc
hU
nit
(May
2007
)G
over
nm
ents
,(in
const
ant
88do
Har
s),
U.S
.C
ensu
sG
over
nm
ents
,(in
const
ant
88do
Har
s),
U.S
Cen
sus
Gov
ernm
ents
,B
ayA
rea
Cen
sus
Dis
tric
tfr
omC
alif
orni
aD
epar
tmen
tof
Edu
cati
on
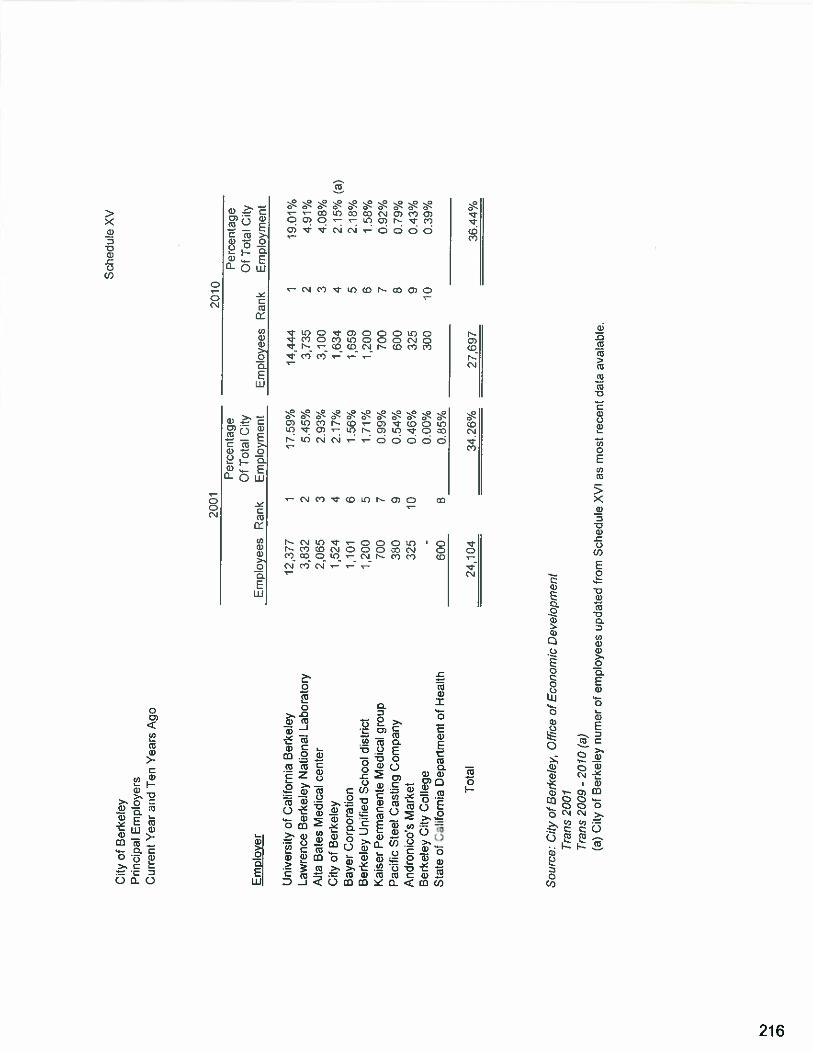
City
ofB
erke
ley
Pri
ncip
alE
mpl
oyer
sC
urre
ntY
ear
and
Ten
Yea
rsA
go
Sch
edul
eX
V
Em
ploy
er
2001
2010
Per
centa
ge
Per
cen
tag
eO
fT
otal
City
Of
Tot
alC
ityE
mpl
oyee
sR
ank
Em
ploy
men
tE
mpl
oyee
sR
ank
Em
ploy
men
t
12,3
7717
.59%
14,4
441
19.0
1%3,
832
5.45
%3,
735
24.
91%
2,06
52.
93%
31
00
34.
08%
1,52
42.
17%
16
34
42.
15%
(a)
1,10
11.
56%
16
59
52.
18%
1,20
01.
71%
1,20
06
158%
700
0.99
%70
07
0.92
%38
00.
54%
600
80.
79%
046%
325
90.
43%
0.00
%30
010
0.39
%
___________
80.
85%
24,1
0434
.26%
27,6
9736
.44%
Sou
rce:
City
ofB
erke
ley,
Off
ice
ofE
cono
mic
Dev
elop
men
tT
rans
2001
Tra
ns2
00
9-
2Q10
(a)
Tot
al
Uni
vers
ity
ofC
alif
orni
aB
erke
ley
Law
renc
eB
erke
ley
Nat
iona
lL
abor
ator
yA
ltaB
ates
Med
ical
cen
ter
City
ofB
erke
ley
Bay
erC
orpo
rati
onB
erke
ley
Uni
fied
Sch
ool
dist
rict
Kai
ser
Per
man
ente
Med
ical
grou
pP
acif
icS
teel
Cas
hng
Com
pany
And
rcni
co’s
Mar
ket
Ber
kele
yC
ityC
olle
geS
tate
ofC
alif
orni
aD
epar
tmen
tof
Hea
lth
1 2 3 4 6 5 7 932
510
600
(a)
City
ofB
erke
ley
mim
erof
emplo
yee
sup
date
dfr
omS
ched
ule
XV
Ias
mos
tre
cent
data
avat
abte
.
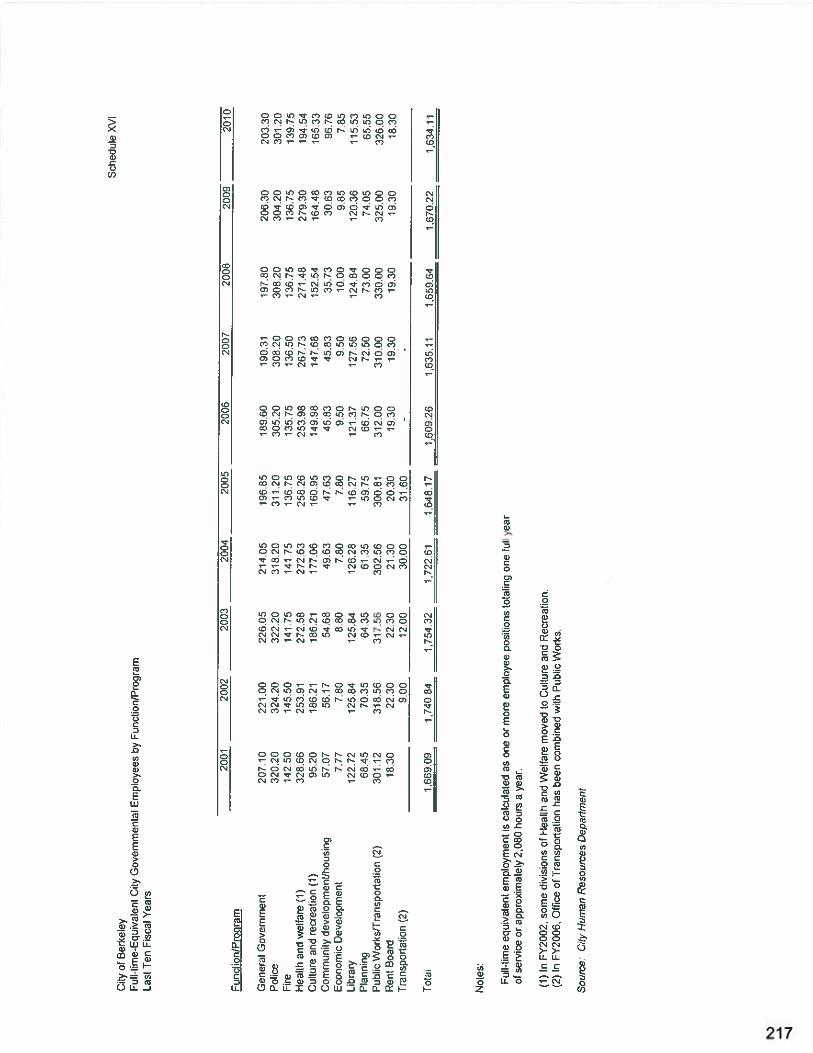
Sch
edul
eX
VI
Oty
ofB
erke
ley
Fun
-tir
ne-E
cuiv
alen
tC
ityG
over
nmen
tal
Ern
p’oy
ees
byF
unct
ionl
Pro
9ram
Las
IT
enFi
scal
Yea
rs
Fun
ctic
riL
flrc
war
n
Cen
erdl
Gov
ernm
ent
Polic
eFi
re1-
leal
Iban
dw
elfa
re(1
)C
ultu
rean
dre
crea
tioi
(I)
Com
mun
ity
deve
loom
er.U
nous
ing
Eco
nom
icD
evel
opm
ent
Lib
rary
Pla
nnin
gPu
blic
Wor
ks/T
rans
port
atio
n(2
)R
ent
Boa
rdT
rans
port
atio
n(2
)
Not
es:
2001
2002
2003
2004
2005
2006
2007
2008
2009
2010
207.
1022
1.00
226.
0521
4.05
196.
8518
9.60
190.
3119
1.80
206.
3020
3.30
32
02
032
4.20
322.
2031
8.20
311.
2030
5.20
308.
2030820
304.
2030
1.20
142,
5014
5.50
141.
7514
1.76
136.
7513
5.75
136.
5313
6.75
136.
7513
9.75
328.
6625
3.91
272.
5827263
258.
2625
3.98
267.
7327
1.48
279.
3019
4.54
95.2
018
6.21
1852
117
7.06
160.
9514
9.98
147.
6815
2.54
164.
4816
5.33
57.0
756
.17
5468
49.6
347
.63
45.8
345
.83
35.7
330
.63
96.7
67.
777
60
8.83
7.80
7.80
9.50
9.50
10.0
09.
657.
6512
2.72
125.
8412
5.84
126.
2811
6.27
121.
3712
7.56
124.
8412
0.36
115.
5366
.45
70.3
564
.35
61.3
559
.75
66.7
572
.50
73.0
074
.05
65.5
530
1.12
318.
5631
7.56
302.
5630
0.81
312.
0031
0.00
330.
0032
5.00
326.
0018
.30
22.3
022
.30
21.3
020
.30
19.3
01930
19.3
019
.30
18.3
09.
0012
.00
30.0
031
.60
--
1,74
0.84
1,75
4.32
1,72
2.61
1,64
8.17
I .60
9.26
1,63
5II
1,65
9.64
Full-
time
equi
vale
ntem
ploy
men
tis
calc
ulat
edas
one
orm
ore
empl
oyee
posi
tion
sto
talin
gon
eIu
’i:y
ear
ofse
rvic
eor
appr
oxim
atel
y2,
080
hour
sa
year
.
(1)
InF
f20
02
,so
me
divi
sion
sof
Hea
lth
and
Wei
fare
mov
edto
Cul
ture
and
Rec
reat
ion.
(2)
InFY
2O(1
G,
Off
ice
of‘F
rans
porl
alio
nha
sbe
enco
mbi
ned
with
Pubt
,cW
orks
.
Tot
al1,
669.
091,
670.
221,
634.
11
Sou
rce:
City
Hum
anR
esou
rces
Dep
artm
ent
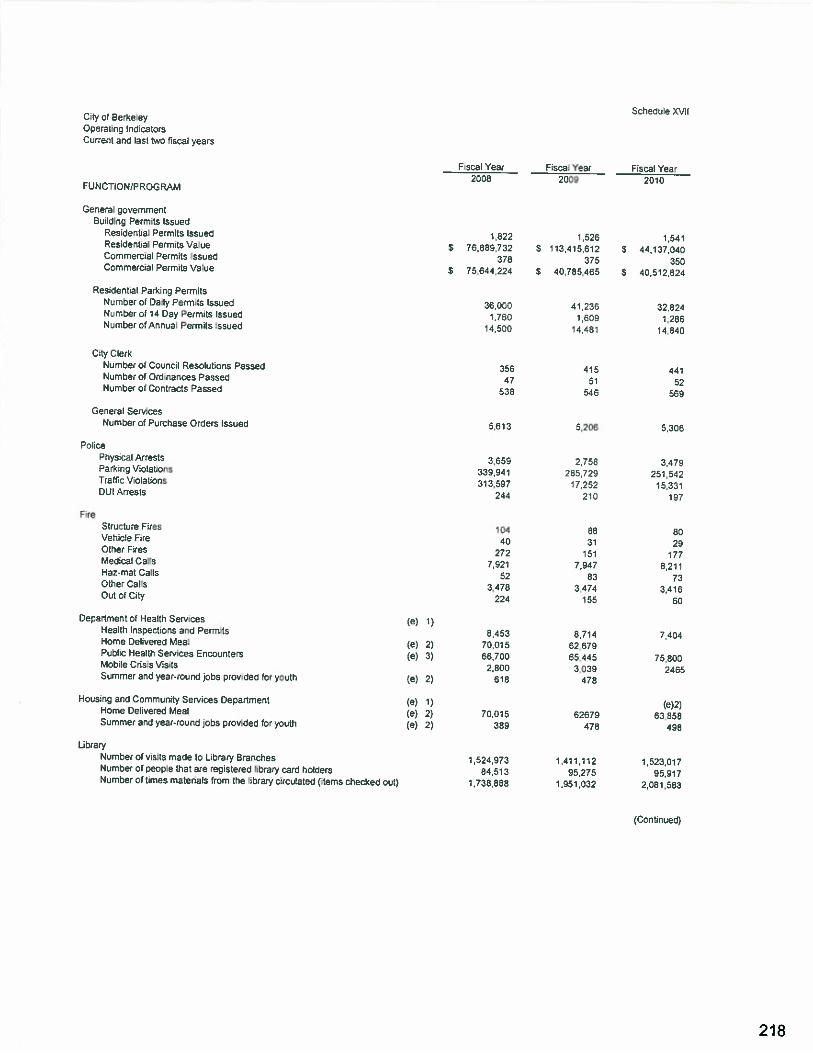
Schedule XVIICity of BerkeleyOperatic: indicatorsCurrent arc last two flscal years
Fiscal Year Fiscal Year Fiscal ‘Year2008 2009 2010
FUNCTION/PROGRAM
General governmentBuilding Permits Issued
Rss;derta; Permits Issues 1822 1.526Residential Permits Value $ 76.889,732 S 113 415 812 $ 44,137,DecCcnmec:al Permits Issued 378 376 35cCommercial Permits Value $ 75,644,224 5 40,785,465 $ 40,512,824
Residential Parking PermitsNumber of Daily Permits Issued 36,000 41.236 32.824Number of 14 Day Permits Issued 1,760 1 609 1.286Number ofAnrua. Permits tssued 14,500 4 43 14340
City ClerkNumber of Council Resolutions Passed 366 415 441Number of Ordinances Passed 47 51 52Number of Contracts Passed 538 546 569
General ServicesNumber of Purchase O-ders Issued 5,813 5,205 5,306
PolicePhysical Arrests 3,659 2,758 3,479Parking Violations 339,941 285,729 251,542Traffic Violations 313,597 17,252 15,331DUI Arrests 244 210 197
FireSlructure Fires 104 88 60Vehicle Fire 40 31 29Other E:es 272 51 177Medical Calls 7,921 7.947 8,211Haz-mat Calls 52 83 73Other Calls 3,478 3,474 3,416CutofCity 224 156 60
Department of Heal:, Servrces (e) 1)Heath Inspections and Permits 8,453 8.714 7,404Home Delivered Meal (e) 2) 700’S 62679Pubbc Health Services Encounters (e) 3) 66,700 65,445 75,800Mobile Crisis Visits 2,800 3,039 2465Summer and year-round jobs provided for youth (e) 2) 618 475
Housing and Community Services Department (e) 1) (e)2)Home Delivered Meal (e) 2) 70.015 62679 63 355Surner and year-round obs prctides for youth Ce) 2) 359 475 495
LisraryNumber of visits made to Library Branches 1524,973 1,411.112 1,523,017Number of people that are registered library card holders 84.513 95,275 95,917Number of times materials from the library circulated (items checked out) 1,738,888 1.951,032 2,081,583
(Continued)
218
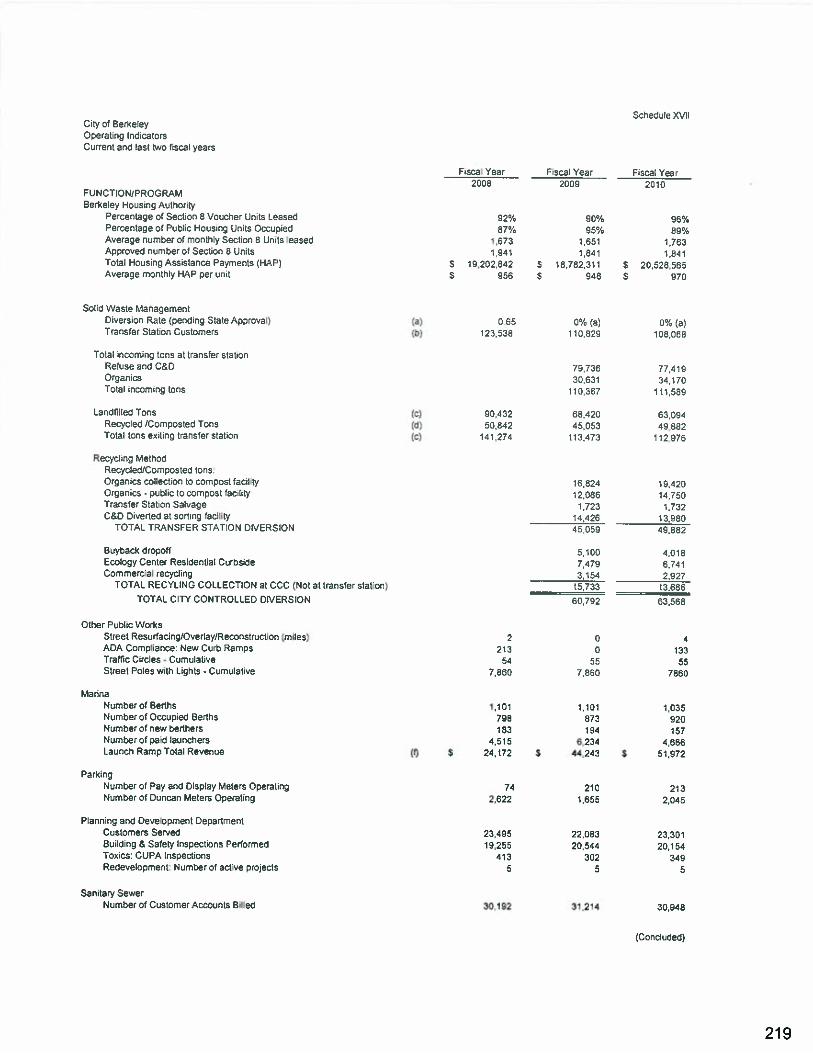
Schedule XVIICity of BerkeleyOperating IndicatorsCurrent and last two fiscal years
Fiscal Year Fiscal Year Fiscal Year2008 2009 2010
FUNCTION/PROGRAMBerkeley Housing Authority
Percentage of Section 8 Voucher Units Leased 92% 90% 96%Percentage of Public Housing Units Occupied 87% 95% 89%Average number of monlhly Section 8 Units leased 1673 1,651 1763Approved number of Section 8 Units 1841 1841 1841Total Housing Assistance Payments (HAP) S 19,202642 $ 16,782,311 $ 20,526,565Average monthly HAP per unit $ 956 $ 948 $ 970
Solid Waste ManagementDiversion Rate (pending State Approval) (a) 065 0% (a) 0% (a)Transfer Station Customers (b) 123,538 110829 108,068
Total incoming tons at transfer stationRefuse and C&D 79,736 77,419Organics 30631 34,170Total incoming tons 110367 111,589
Landlilted Tons (c) 90,432 68,420 63.094Recycled /Compcsted Tons (d) 50,842 45,053 49,882Totat tons exiting transfer staticn (c) 141,274 113,473 112,976
Recycling MethodRecycled/Ccmposted tons:Organics collection to compost facility 16,824 19,420Organics - public Io compost facility 12,085 14.750Transfer Station Salvage 1,723 1,732C&O Diverted at sorting facility 14,426 13.980
TOTAL TRANSFER STATION DIVERSION 45,059 49.882
Buybackdropoff 5,100 4.018Ecology Center Residential Curbside 7,479 6.741Ccmmercial recycling 3,154 2.927
TOTAL RECYLINC COLLECTION aI CCC (Not at transfer station) 15,733 13.686TOTAL CITY CONTROLLED DIVERSION 60,792 63.568
Other Public WorksStreet Resurfacing/Overlay/Reconstruction (miles) 2 0 4ADA Compliance: New Curb Ramps 213 0 133Traffic Circles - Cumulalive 54 55 55Street Poles with Lighls - Cumulative 7.860 7,860 7860
MarinaNumberof Berths i,ioi 1,101 1,035Number cf Occupied Berths 798 873 920Number of new berthers 183 194 157Number of paid launchers 4.515 6,234 4,566Launch Ramp Total Revenue (0 $ 24.172 $ 44,243 $ 51,972
ParkingNumber of Pay and Display Meters Operating 74 210 213Number of Duncan Meters Operating 2.622 1,655 2.045
Planning and Development DepartmentCustomers Served 23,495 22.083 23,301Building & Safety Inspections Performed 19,255 20,544 20,154Tcxics: CUPA Inspections 413 302 349Redevelopment: Number of active projecls 5 5 5
Sanitary SewerNumber of CustomerAccounls Billed 30,192 31,214 30,948
(Concluded)
219
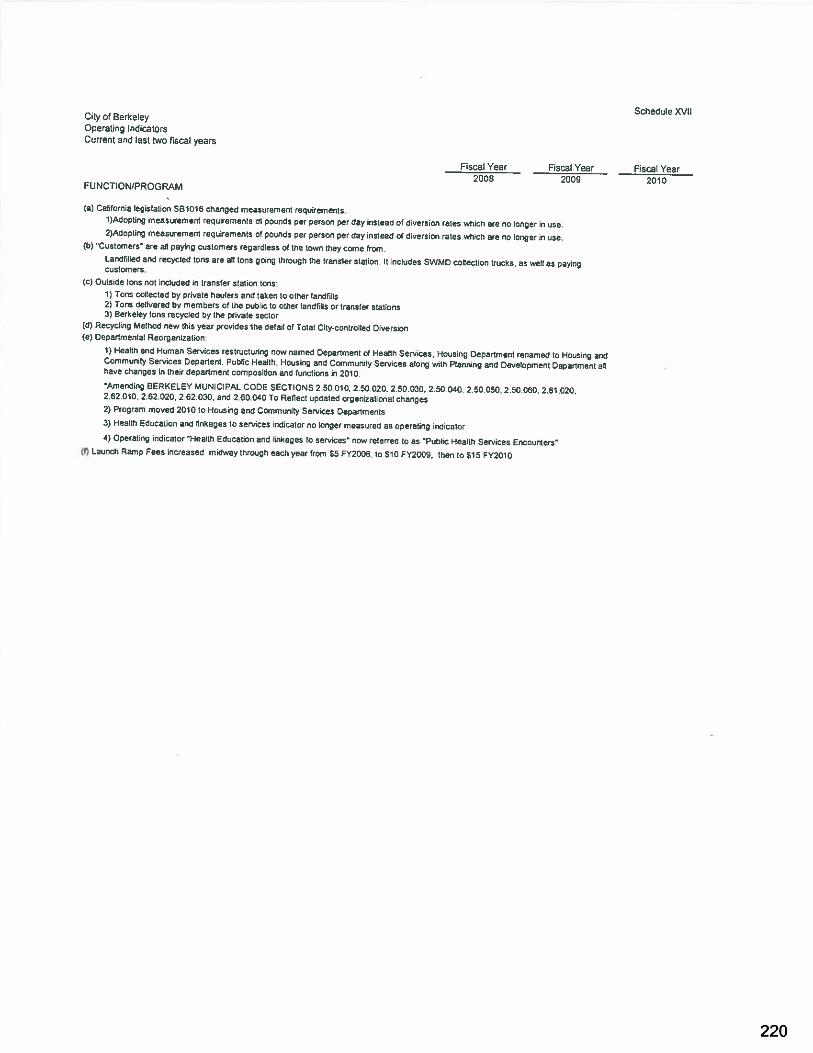
Schedule XVIICity Cf BerkeeyOperating IndicatorsCurrent ar,d ‘asr twO tscal years
Fiscal Year Fiscal Year Fiscal Year2008 2009 2010FUNCTION)PROGRAM
(a) Cal:’orn a ‘egistat or. SBO16 changed measurenner,t requirerrertsAdopling measurement requirements ot pounds per person pa’ day instead of divemicn rates which are r.o longer in usa.2)Aocptmg measuemer requirements ci pounds SOr person per day ‘nstead of di’a,.cn rates v.i’cf’ are rc longer itt u-SO
(b) “Customers’ are alt paying customers regardless of the own hey come from,Landtitled and recycled tons are all Ions going through the transfer slation. It inoludes SWMD collection trucks, as well as payingcustomers,
(C) Outside tons not included in transfer station tons:1) Tons colecled by crivate haulers and laker to other lsdt’.ls2) Tone lel,vered by members of the cube to other iandtns or transfer srat:ons3) Sere’ey tons recyo’ed cy the private sector
(d) Recycl.r.; Melricd new tts year provides toe detail of Total Ciry-conlroires DiversionCe) Deparnmental Reorganization.
1) health and Human Services restructuring now named Depariment of Health Services, Housing Department renamed to Housing andCommunity Services DepartenL Public Health, Housing and Community Services along with Planning and Development Dapanment althave changes in their department composition and functions in 2010
‘Arenong BERKELEY Muvo:OAL CODE SECTIONS 2.53.0’ 9 2 53.023. 2 50.03-3. 2 SC’ 040. 2 50 350, 2.50.360. 2.5’ .020.2.62 010, 2.62.020. 2.62 030, and 2.60.040 To Renect updated organizational changes2) Program moved 2310 to Hcusg and Community Services Denarimenls
3) Health Education and linkages to services indicator no longer measured as operating indicator
4) Oparatng indicalor “Heallh Edacation and linkages to services” now referred to as “Public Health Services Encounters”(0 Launch Ramp Fees increased midway through each year from $5 FY2008, lo $10 FY200g. then to $15 FY2OIO
220
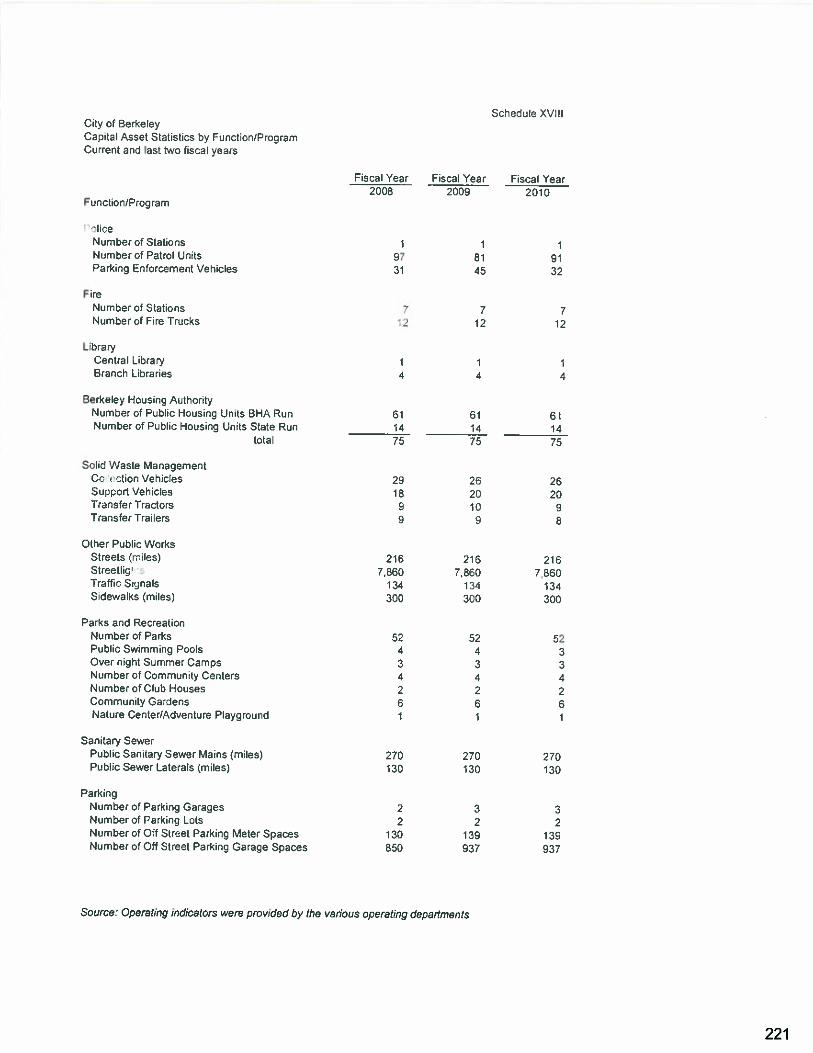
Scnedule XViIICity of BerkeleyCapital Asset Statistics by Fnctc/PcgramCurrent and last two fisca years
Fiscai Year Fiscal Year Fiscal Year2008 2009 2010
Function/Program
liceNumber of Stations 1 1 1Number of Patrol Units 97 81 91Parking Enforcement Vehicles 31 45 32
FireNumber of Stations 7 7 7Number of Fire Trucks 12 12
LibraryCentral Library 1 1Branch Libraries 4 4 4
Berkeey Housinc AuthortyNumber of Public Housing Un its SHA Run 61 61 61Number of Pblic Houswg Units State Run 14 14 14
total 75 75 75
Solki VVasle ManagementCc ution Vehicles 29 26 26Su:.port Vehicles 18 20 20TransferTractors 9 10 9Transfer Trailers 9 9 8
Other Public WorksStreets (rr!es) 216 216 216Streetlic-s 7860 7,860 7860Traffic S xriais 134 134 13-4Sdewaiks (miles) 300 300 300
Parks and RecreationNumber of Parks 52 52 52Public Swimming Pools 4 2 3Over night Summer Camps 3 3 3Number of Ccrnrnunity Centers 4 4 4Number of Club Houses 2 2 2Community Gardens 5 6 6Nature Center/Adventure Playground 1 1 1
Sanitary SewerPublic Sanitary Sewer Mains (miles) 270 270 270Public Sewer Laterals (miles) 130 130 130
ParkingNumber of Parking Garages 2 3 3Number of Prrkine Lots 2 2 2Number of Of Str:et Parking Meter Spaces 130 139 139Number of (ufl Street Parking Garage Spaces 850 937 937
Source: Operating /ndicators were prnwded cy the var/Gus operating departments
221
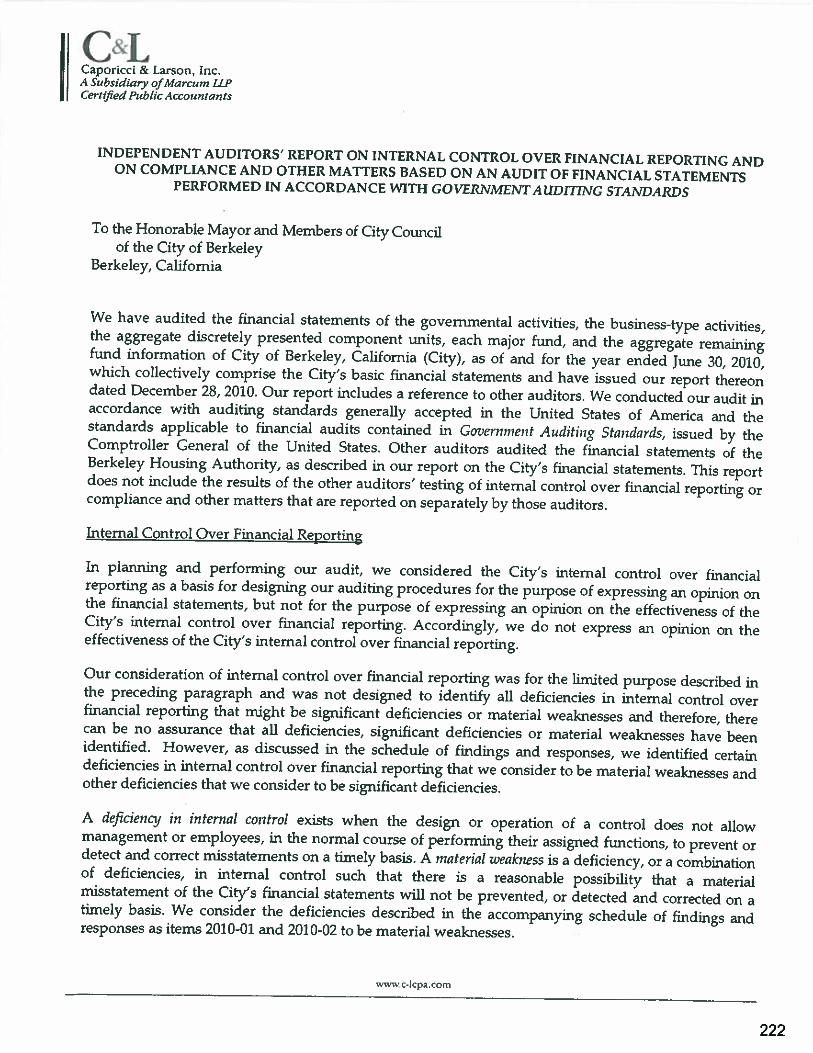
01Caporicci & Larson, Inc.A Szthsidiaiy ofMa rcunz LIPCert ifteci Public Accountants
INDEPENDENT AUDITORS’ REPORT ON INTERNAL CONTROL OVER FINANCIAL REPORTING ANDON COMPLIANCE AND OTHER MATrERS BASED ON AN AUDIT OF FINANCIAL STATEMENTSPERFORMED IN ACCORDANCE WITH GOVERNMENT AUDITING STANDARDS
To the Honorable Mayor and Members of City Councilof the City of Berkeley
Berkeley, California
We have audited the financial statements of the governmental activities, the business-type activities,the aggregate discretely presented component units, each major fund, and the aggregate remainingfund information of City of Berkeley, California (City), as of and for the year ended June 30, 2010,which collectively comprise the City’s basic financial statements and have issued our report thereondated December 28, 2010. Our report includes a reference to other auditors. We conducted our audit inaccordance with auditing standards generally accepted in the United States of America and thestandards applicable to financial audits contained in Government Auditing Standards, issued by theComptroller General of the United States. Other auditors audited the financial statements of theBerkeley Housing Authority, as described in our report on the City’s financial statements. This reportdoes not include the results of the other auditors’ testing of internal control over financial reporting orcompliance and other matters that are reported on separately by those auditors.
Internal Control Over Financial Reporting
In planning and performing our audit, we considered the City’s internal control over financialreporting as a basis for designing our auditing procedures for the purpose of expressing an opinion onthe financial statements, but not for the purpose of expressing an opinion on the effectiveness of theCity’s internal control over financial reporting. Accordingly, we do not express an opinion on theeffectiveness of the City’s internal control over financial reporting.
Our consideration of internal control over financial reporting was for the limited purpose described inthe preceding paragraph and was not designed to identify all deficiencies in internal control overfinancial reporting that might be significant deficiencies or material weaknesses and therefore, therecan be no assurance that all deficiencies, significant deficiencies or material weaknesses have beenidentified. However, as discussed in the schedule of findings and responses, we identified certaindeficiencies in internal control over financial reporting that we consider to be material weaknesses andother deficiencies that we consider to be significant deficiencies.
A deficiency in internal control exists when the design or operation of a control does not allowmanagement or employees, in the normal course of performing their assigned functions, to prevent ordetect and correct misstatements on a timely basis. A material weakness is a deficiency, or a combinationof deficiencies, in internal control such that there is a reasonable possibility that a materialmisstatement of the City’s financial statements will not be prevented, or detected arid corrected on atimely basis. We consider the deficiencies described in the accompanying schedule of findings andresponses as items 2010-01 and 2010-02 to be material weaknesses.
wwc.lcpa coin
222
To the Honorable Mayor and Members of City Councilof tile City of Berkeley
Berkeley, CaliforniaPage Two
A significant deficiency is a deficiency, or a combination of deficiencies in internal control that is lesssevere than a material weakness, yet important enough to merit attention by those charged withgovernance. We consider the deficiency described in the accompanying schedule of findings andresponses as item 2010-03 to be a significant deficiency.
Compliance and Other Matters
As part of obtaining reasonable assurance about whether City’s financial statements are free of materialmisstatement, we performed tests of its compliance with certain provisions of laws, regulations,contracts, and grant agreements, noncompliance with which could have a direct and material effect onthe determination of financial statement amounts. However, providing an opinion on compliance withthose provisions was not an objective of our audit, and accordingly, we do not express such an opinion.The results of our tests disclosed an instance of noncompliance or other matters that is required to bereported under Government Auditing Standards and which is described in the accompanying schedule offindings and responses as item 2010-04.
The City’s response to the findings identified in our audit is described in the accompanying schedule offindings and responses. We did not audit the City’s response and, accordingly, we express no opinionon it.
This report is intended solely for the information and use of management, City Council, others withinthe entity, and federal awarding agencies and pass-through entities and is not intended to be andshould not be used by anyone other than these specified parties.
cAu’-, .
Caporicci & Larson, Inc.San Francisco, CaliforniaDecember 28, 2010
223
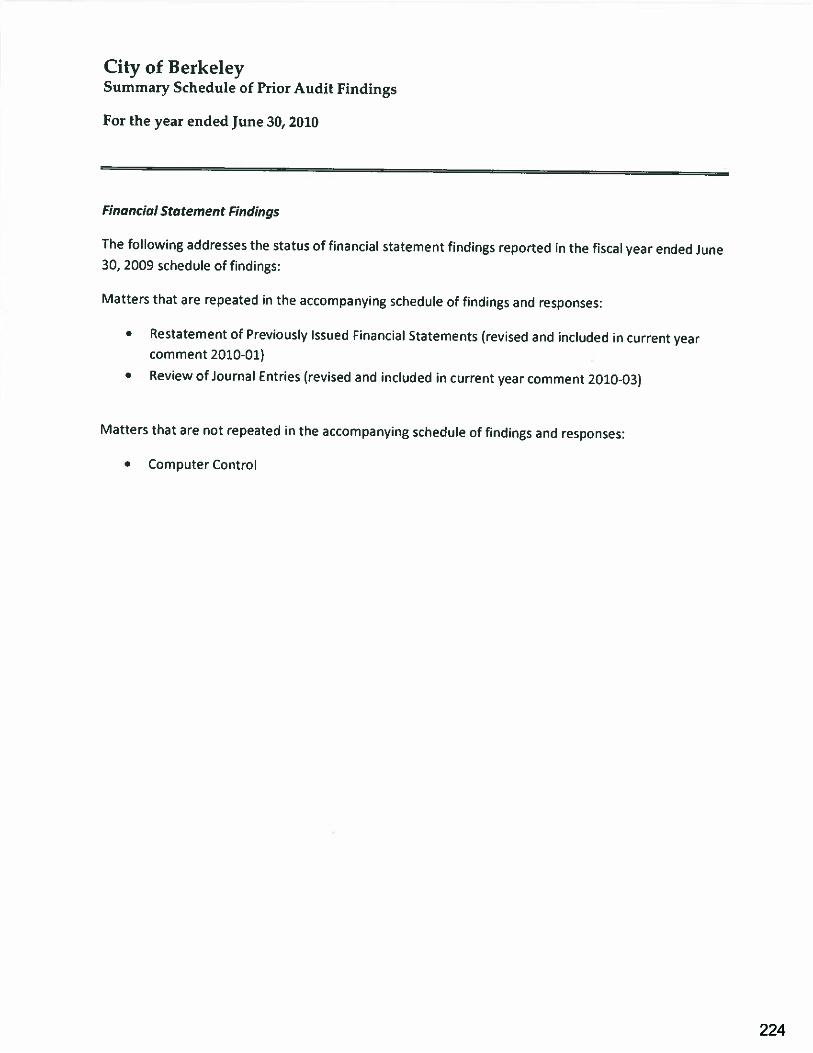
City of BerkeleySummary Schedule of Prior Audit Findings
For the year ended June 30, 2010
Financial Statement Findings
The following addresses the status of financial statement findings reported in the fiscal year ended June30, 2009 schedule of findings:
Matters that are repeated in the accompanying schedule of findings and responses:
• Restatement of Previously Issued Financial Statements (revised and included in current yearcomment 2010-01)
• Review of Journal Entries (revised and included in current year comment 2010-03)
Matters that are not repeated in the accompanying schedule of findings and responses:
• Computer Control
224
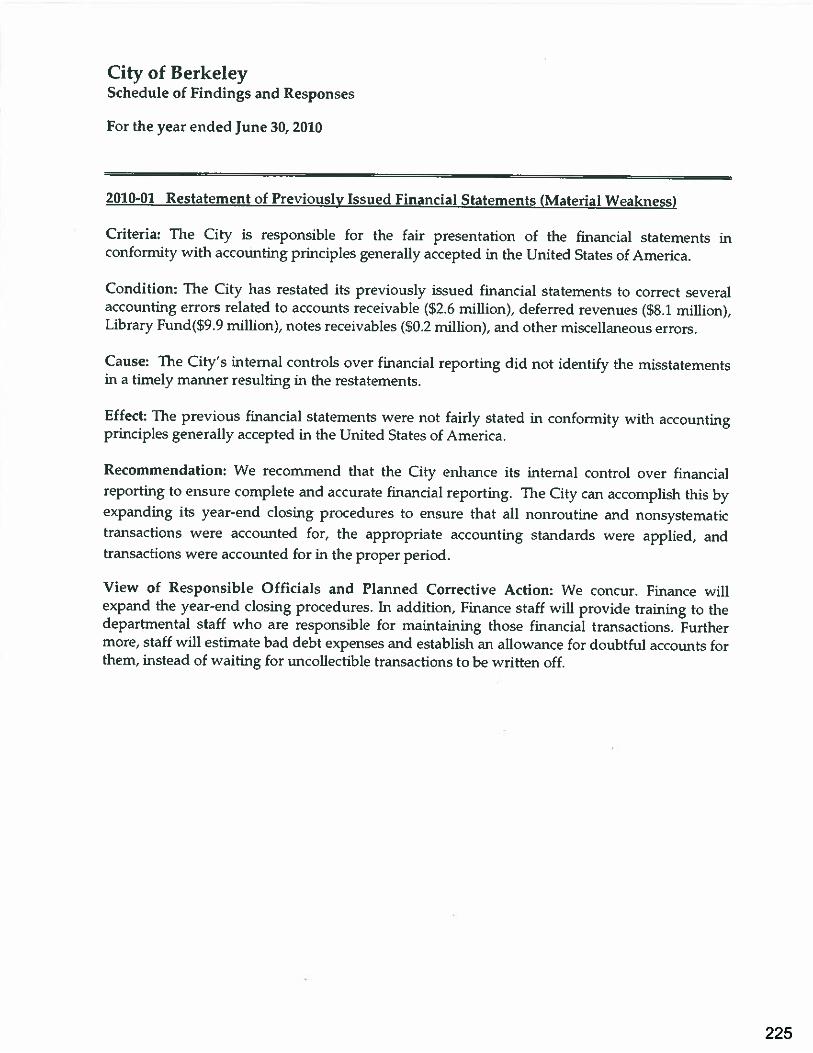
City of BerkeleySchedule of Findings and Responses
For the year ended June 30, 2010
2010-01 Restatement of Previously Issued Financial Statements (Material Weakness)
Criteria: The City is responsible for the fair presentation of the financial statements inconformity with accounting principles generally accepted in the United States of America.
Condition: The City has restated its previously issued financial statements to correct severalaccounting errors related to accounts receivable (52.6 million), deferred revenues ($8.1 miHion),Library Fund(59.9 million), notes receivables (SO.2 million), and other miscellaneous errors.
Cause: The City’s internal controls over financial reporting did not identify’ the misstatementsin a timely maimer resulting in the restatements.
Effect: The previous financial statements were not fairly stated in conformity with accountingprinciples generally accepted in the United States of America.
Recommendation: We recommend that the Cit-v enhance its internal control over financialreporting to ensure complete and accurate financial reporting. The City can accomplish this byexpanding its year-end closing procedures to ensure that all nonroutine and nonsystematictransactions were accounted for, the appropriate accounting standards were applied, andtransactions were accounted for in the proper period.
View of Responsible Officials and Planned Corrective Action: We concur. Finance willexpand the year-end closing procedures. In addition, Finance staff will provide training to thedepartmental staff who are responsible for maintaining those financial transactions. Furthermore, staff will estimate bad debt expenses and establish an allowance for doubtful accounts forthem, instead of waiting for uncollectible transactions to be written off.
225
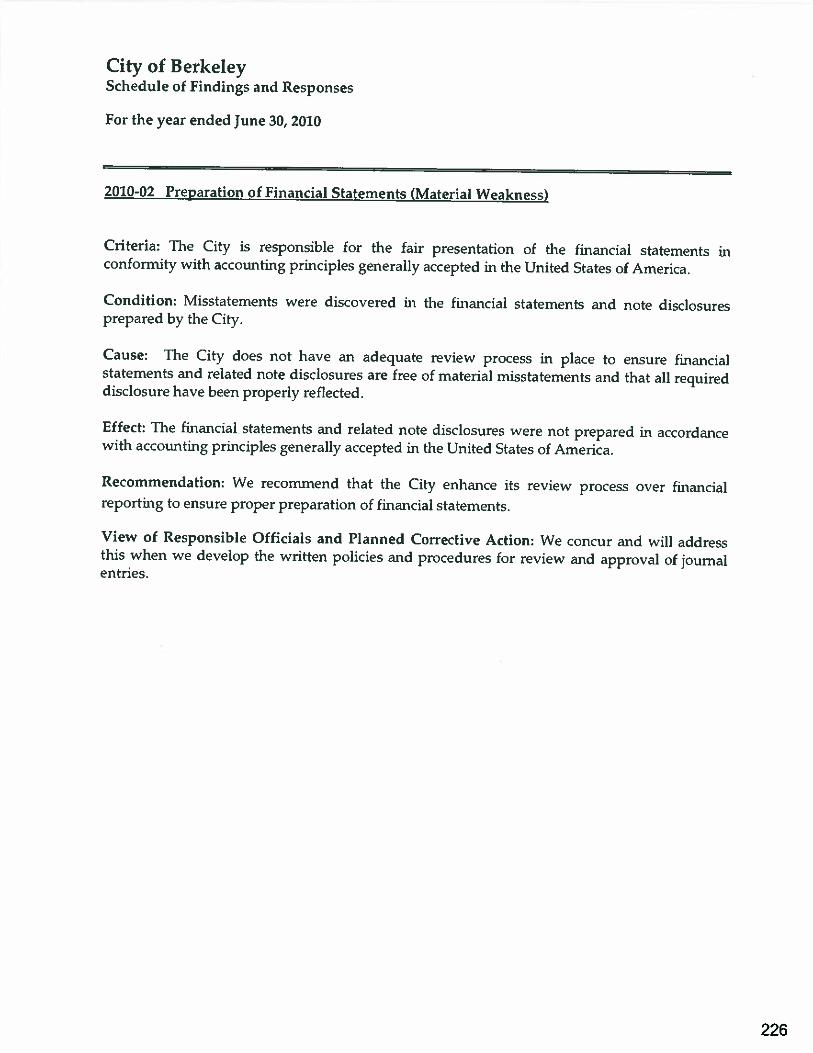
City of BerkeleySchedule of Findings and Responses
For the year ended June 30, 2010
2010-02 Preparation of Financial Statements (Material Weakness)
Criteria: The City is responsible for the fair presentation of the financial statements inconformity with accounting principles generally accepted in the United States of America.
Condition: Misstatements were discovered in the financial statements and note disclosuresprepared by the City.
Cause: The City does not have an adequate review process in place to ensure financialstatements and related note disclosures are free of material misstatements and that all requireddisclosure have been properly reflected.
Effect: The financial statements and related note disclosures were not prepared in accordancewith accounting principles generally accepted in the United States of America.
Recommendation: We recommend that the City enhance its review process over financialreporting to ensure proper preparation of financial statements.
View of Responsible Officials and Planned Corrective Action: We concur and will addressthis when we develop the written policies arid procedures for review and approval of journalentries.
226
City of BerkeleyScheduJe of Findings and Responses
For the year ended June 30, 2010
2010-03 Review of Journal Entries (Significant Deficiency)
Criteria: All journal entries need to be properly reviewed and approved before they get postedto the financial systems.
Condition: The journal entry review process is not consistent among City departments: somedepartments perform an independent review of all journal entries prepared, while some do not.In addition, journal entries sent to the Accounting Division do not always have supportingdocuments attached.
Cause: The City does not have a formal written policy regarding the review, and approvalprocess of journal entries by the individual departments and the Accounting Division.
Effect: Unauthorized or unsupported journal entries may get posted to the financial systemswhich can result in a material misstatement in the City’s financial statements.
Recommendation: We recommend that the City develop a formal written policy for the reviewand approval of journal entries. The policy should document the process required to befollowed by each department to review and approve journal entries. The City should ensurethat the process designed for each department will improve accuracy and ensure properauthorization of the journa] entries.
View of Responsible Officials and Planned Corrective Action: We concur. Draft writtenpolicies and procedures for the review and approval of journal entries is in progress.
227
City of BerkeleySchedule of Findings and Responses
For the year ended June 30, 2010
2010-04 Compliance with Debt Covenants (Compliance)
Criteria: The Debt Covenant for the City’s 2005 Series A Parking Revenue Bonds requires theCity to maintain Net Revenues of the Parking Fund each year to equal at least 125% of theannual debt service.
Condition: For the fiscal year ended June 30, 2010, the City’s Parking Fund Net Revenuesequaled 90% of the arnuial debt service payments, which did not meet the required debt servicecoverage ratio.
Cause: One of the three parking facilities was taken off line for the development of a newparking structure. As a result, parking revenues were reduced.
Effect: The City was not in compliance with the debt covenants of the 2005 Series A ParkingRevenue Bonds.
Recommendation: The City should closely monitor the net revenues from the parking facilitiesto ensure the compliance with related debt covenants.
View of Responsible Officials and Planned Corrective Action: Prior to the issuance of therevenue bonds, City management, the City’s Financial Advisor and the City’s Bond Counselagreed to include available fund balance in the definition of net revenues, to allow a cushion tomeet the coverage covenant when one of the parking facilities was taken off line for thedevelopment of a new parking structure. This provision was inadvertently left out of theOfficial Statement and bond covenants.
The City will closely monitor the net revenues from the parking facilities, and take actionstoward ensuring compliance with the related debt covenants.
228