cineworld group fy 2018 results fy... · group pro forma1 revenue of $4,711m up 7.2% group pro...
TRANSCRIPT

Cineworld Group FY 2018 Results14 March 2019 0
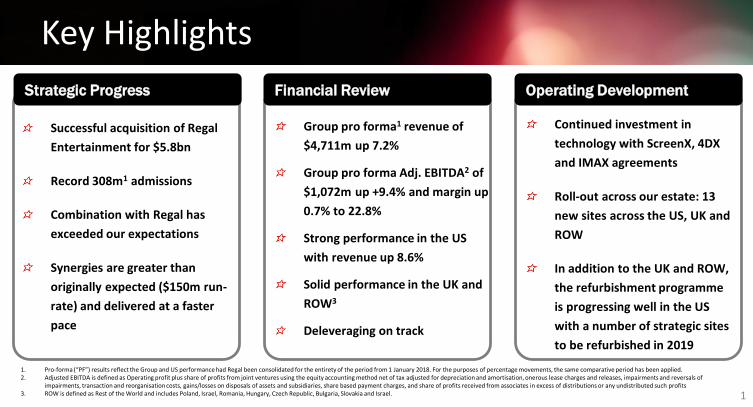
Key Highlights
Successful acquisition of Regal
Entertainment for $5.8bn
Record 308m1 admissions
Combination with Regal has
exceeded our expectations
Synergies are greater than
originally expected ($150m run-
rate) and delivered at a faster
pace
Strategic Progress Financial Review
Group pro forma1 revenue of
$4,711m up 7.2%
Group pro forma Adj. EBITDA2 of
$1,072m up +9.4% and margin up
0.7% to 22.8%
Strong performance in the US
with revenue up 8.6%
Solid performance in the UK and
ROW3
Deleveraging on track
Continued investment in
technology with ScreenX, 4DX
and IMAX agreements
Roll-out across our estate: 13
new sites across the US, UK and
ROW
In addition to the UK and ROW,
the refurbishment programme
is progressing well in the US
with a number of strategic sites
to be refurbished in 2019
Operating Development
1. Pro-forma (“PF”) results reflect the Group and US performance had Regal been consolidated for the entirety of the period from 1 January 2018. For the purposes of percentage movements, the same comparative period has been applied.2. Adjusted EBITDA is defined as Operating profit plus share of profits from joint ventures using the equity accounting method net of tax adjusted for depreciation and amortisation, onerous lease charges and releases, impairments and reversals of
impairments, transaction and reorganisation costs, gains/losses on disposals of assets and subsidiaries, share based payment charges, and share of profits received from associates in excess of distributions or any undistributed such profits3. ROW is defined as Rest of the World and includes Poland, Israel, Romania, Hungary, Czech Republic, Bulgaria, Slovakia and Israel. 1
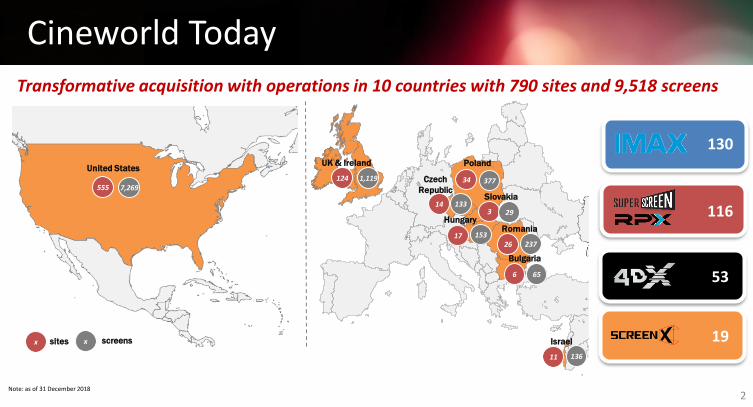
Cineworld Today
124
14
34
3
1726
6
UK & Ireland Poland
Czech
RepublicSlovakia
HungaryRomania
Bulgaria
Israel
11
555
screenssitesx x
7,2691,119 377
13329
65
237153
136
Transformative acquisition with operations in 10 countries with 790 sites and 9,518 screens
United States
Note: as of 31 December 2018
53
116
130
19
2

Financial Review

Record Performance
75%
15%
10%United States
UK & Ireland
ROW
61%28%
11%
Box office
Retail
Other Income
Note: Pro forma figures and actual movements
Revenue by geography
Revenue by product and services
2018 PF Admission
308m
+2.6%
2018 PF Revenue
$4.7bn
+7.2%
2018 PF EBITDA
$1,072m
+9.4%
4
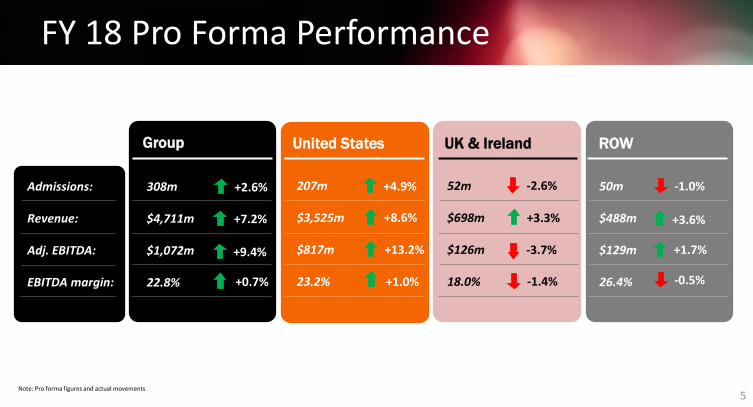
FY 18 Pro Forma Performance
United States UK & Ireland ROW
207m
$3,525m
$817m
23.2%
+8.6%
50m
$488m
$129m
26.4%
52m
$698m
$126m
18.0%
+3.3%
308m
$4,711m
$1,072m
22.8%
Group
+1.7%-3.7%
+2.6%
+7.2%
+9.4%
+0.7%
+4.9%
+13.2%
+1.0%
-2.6% -1.0%
-0.5%-1.4%
Admissions:
Revenue:
Adj. EBITDA:
EBITDA margin:
Note: Pro forma figures and actual movements
+3.6%
5
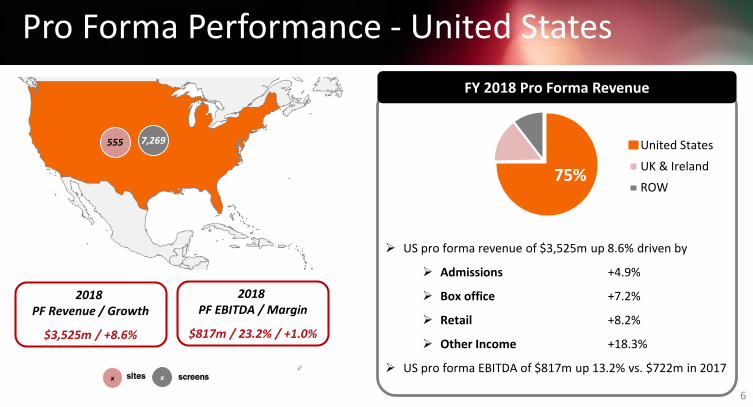
Pro Forma Performance - United States
US pro forma revenue of $3,525m up 8.6% driven by
Admissions +4.9%
Box office +7.2%
Retail +8.2%
Other Income +18.3%
US pro forma EBITDA of $817m up 13.2% vs. $722m in 2017
United States
UK & Ireland
ROW
2018 PF Revenue / Growth
$3,525m / +8.6%
2018 PF EBITDA / Margin
$817m / 23.2% / +1.0%
75%
555 7,269
screenssitesx x
FY 2018 Pro Forma Revenue
6

United States - KPI
196.9206.5
2017 2018
Pro Forma Admissions (m)
+4.9%
10.110.3
2017 2018
+2.2%
4.84.9
2017 2018
+3.1%
Pro Forma ATP ($) Pro Forma SPP ($)
7
screenssitesx x
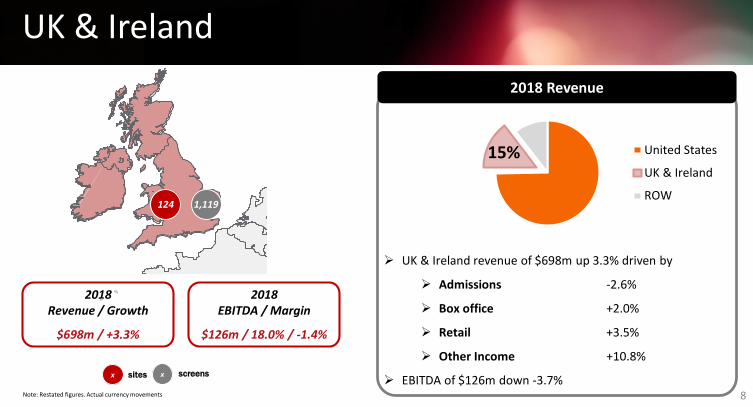
UK & Ireland
UK & Ireland revenue of $698m up 3.3% driven by
Admissions -2.6%
Box office +2.0%
Retail +3.5%
Other Income +10.8%
EBITDA of $126m down -3.7%
United States
UK & Ireland
ROW
2018 Revenue / Growth
$698m / +3.3%
2018 EBITDA / Margin
$126m / 18.0% / -1.4%
15%
124 1,119
2018 Revenue
Note: Restated figures. Actual currency movements 8
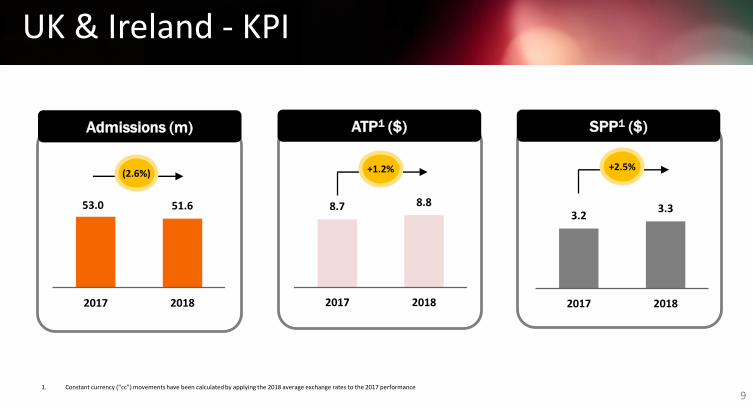
UK & Ireland - KPI
53.0 51.6
2017 2018
(2.6%)
8.7 8.8
2017 2018
+1.2%
3.23.3
2017 2018
+2.5%
Admissions (m) ATP1 ($) SPP1 ($)
1. Constant currency (“cc”) movements have been calculated by applying the 2018 average exchange rates to the 2017 performance
9
screenssitesx x
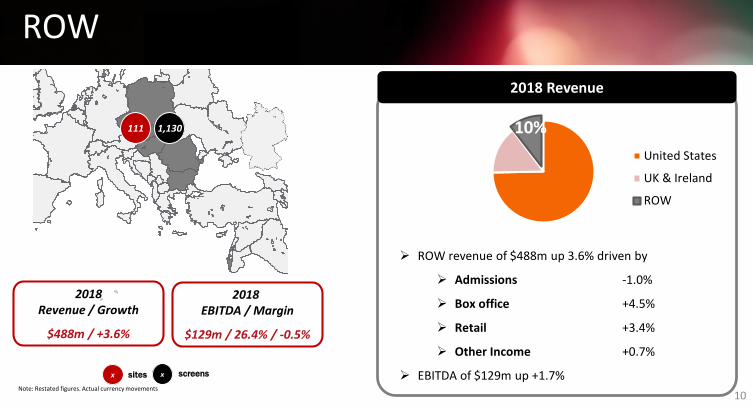
ROW
ROW revenue of $488m up 3.6% driven by
Admissions -1.0%
Box office +4.5%
Retail +3.4%
Other Income +0.7%
EBITDA of $129m up +1.7%
United States
UK & Ireland
ROW
2018 Revenue / Growth
$488m / +3.6%
2018 EBITDA / Margin
$129m / 26.4% / -0.5%
10%111 1,130
2018 Revenue
Note: Restated figures. Actual currency movements
10

ROW – KPI
50.8 50.3
2017 2018
(1.0%)
5.55.6
2017 2018
+2.0%
2.5 2.5
2017 2018
+1.6%
Admissions (m) ATP1 ($) SPP1 ($)
1. Constant currency (“cc”) movements have been calculated by applying the 2018 average exchange rates to the 2017 performance
11
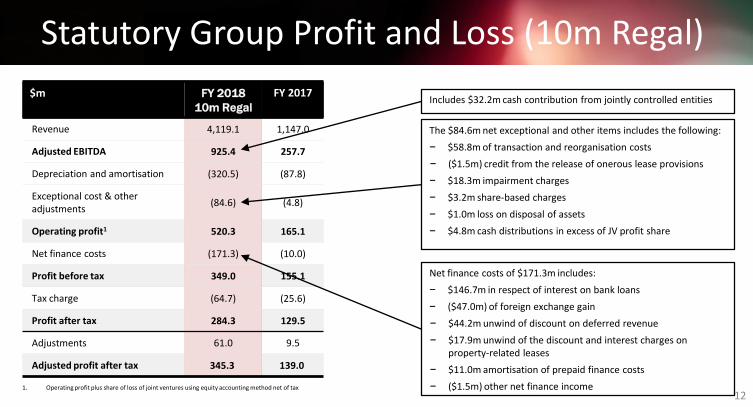
Statutory Group Profit and Loss (10m Regal)
$m FY 2018
10m Regal
FY 2017
Revenue 4,119.1 1,147.0
Adjusted EBITDA 925.4 257.7
Depreciation and amortisation (320.5) (87.8)
Exceptional cost & other adjustments
(84.6) (4.8)
Operating profit1 520.3 165.1
Net finance costs (171.3) (10.0)
Profit before tax 349.0 155.1
Tax charge (64.7) (25.6)
Profit after tax 284.3 129.5
Adjustments 61.0 9.5
Adjusted profit after tax 345.3 139.0
The $84.6m net exceptional and other items includes the following:
− $58.8m of transaction and reorganisation costs
− ($1.5m) credit from the release of onerous lease provisions
− $18.3m impairment charges
− $3.2m share-based charges
− $1.0m loss on disposal of assets
− $4.8m cash distributions in excess of JV profit share
Net finance costs of $171.3m includes:
− $146.7m in respect of interest on bank loans
− ($47.0m) of foreign exchange gain
− $44.2m unwind of discount on deferred revenue
− $17.9m unwind of the discount and interest charges on property-related leases
− $11.0m amortisation of prepaid finance costs
− ($1.5m) other net finance income
Includes $32.2m cash contribution from jointly controlled entities
1. Operating profit plus share of loss of joint ventures using equity accounting method net of tax
12

EPS growth of 20.4% - Deal accretive from year 1$m FY 2018 FY 2017
Profit after tax 284.3 129.5
Adjustments:
Amortisation on acquired intangibles 25.0 6.6
Transaction and reorganisation costs 58.8 10.0
Impairments 18.3 (6.7)
Share based payment charges 3.2 2.4
Onerous lease charges and releases (1.5) 1.7
Profit on disposal 1.0 (2.6)
Excess cash distributions from JV 4.8 -
Recycle of fair value on hedging reserve 3.5 -
Impact of foreign exchange translation (45.1) -
Tax affect of adjusted items (7.0) (1.9)
Adjustments total 61.0 9.5
Adjusted profit after tax 345.3 139.0
Diluted earnings per share denominator 1,268.3 615.6
Diluted EPS 22.4c 21.0c
Adjusted diluted EPS 27.2c 22.6c
The exceptional items includes the following:
− $58.8m of transaction costs
− ($1.5m) credit from the release of onerous lease provisions
− $18.3m impairment charges
− $3.2m share-based charges
− $1.0m loss on disposal of assets
− $4.8 Excess cash distributions from JV
− $3.5m unwind of net investment hedge
− ($45.1m) FX movements on monetary assets and liabilities
13
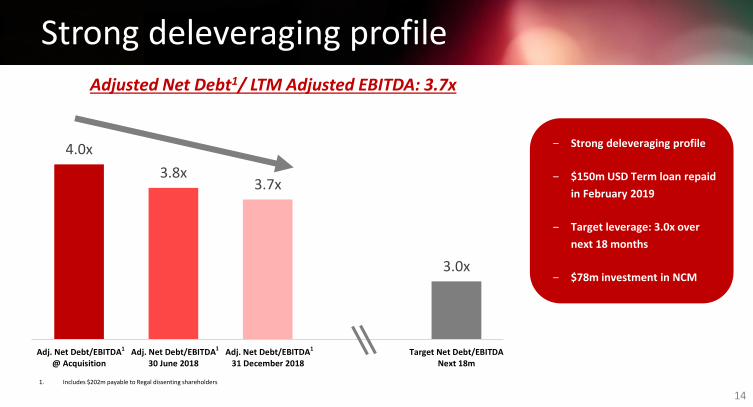
Strong deleveraging profile
4.0x
3.8x3.7x
3.0x
Adj. Net Debt/EBITDA@ Acquisition
Adj. Net Debt/EBITDA30 June 2018
Adj. Net Debt/EBITDA31 December 2018
Target Net Debt/EBITDANext 18m
Adjusted Net Debt1/ LTM Adjusted EBITDA: 3.7x
1. Includes $202m payable to Regal dissenting shareholders
1 1 1
‒ Strong deleveraging profile
‒ $150m USD Term loan repaid
in February 2019
‒ Target leverage: 3.0x over
next 18 months
‒ $78m investment in NCM
14
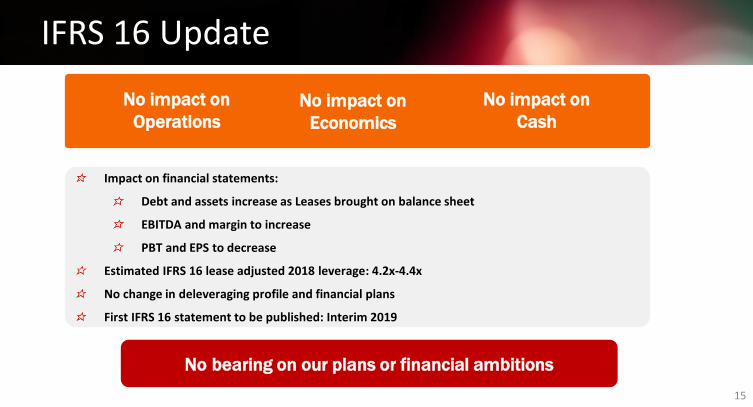
IFRS 16 Update
INC
REA
SE
No impact on
Operations
Impact on financial statements:
Debt and assets increase as Leases brought on balance sheet
EBITDA and margin to increase
PBT and EPS to decrease
Estimated IFRS 16 lease adjusted 2018 leverage: 4.2x-4.4x
No change in deleveraging profile and financial plans
First IFRS 16 statement to be published: Interim 2019
No impact on
Economics
No impact on
Cash
No bearing on our plans or financial ambitions
15

Dividend Payments
3. Pre IFRS16 impact
Full year dividend of 15.0c for 2018 up 17.6%
Final dividend of 10.15c per share to be paid in July 2019
Interim dividend of 4.85c paid in October 2018
From 2019 onwards, the company will pay four interim dividends for each financial year:
First three quarters of the year will be equal to 25% of the full year dividend of the prior year
(3.75c per share per quarter for 2019)
Final payment will be reflective of the Group’s full year earnings performance and resulting in a
full year dividend payment aligned with the Group’s pay-out ratio of approximately 55%
16
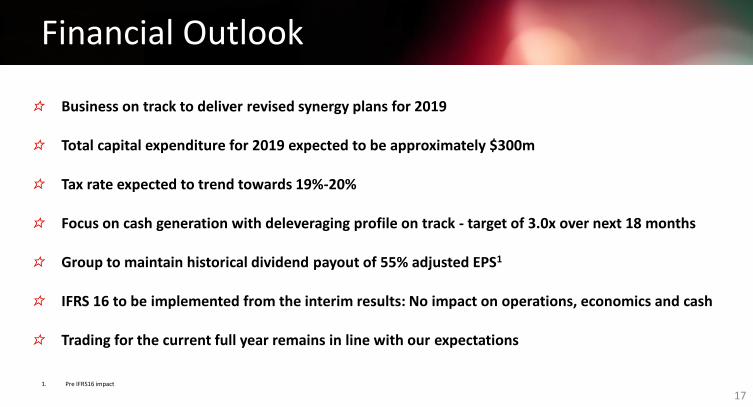
Financial Outlook
Business on track to deliver revised synergy plans for 2019
Total capital expenditure for 2019 expected to be approximately $300m
Tax rate expected to trend towards 19%-20%
Focus on cash generation with deleveraging profile on track - target of 3.0x over next 18 months
Group to maintain historical dividend payout of 55% adjusted EPS1
IFRS 16 to be implemented from the interim results: No impact on operations, economics and cash
Trading for the current full year remains in line with our expectations
1. Pre IFRS16 impact
17
Business Update

Rebranding
19
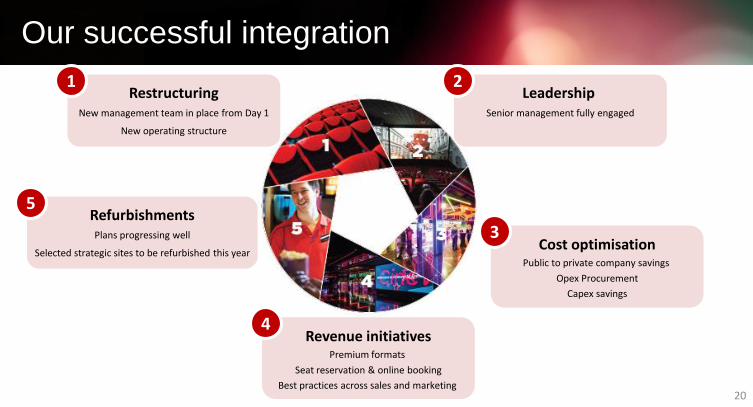
Our successful integration
RestructuringNew management team in place from Day 1
New operating structure
1Leadership
Senior management fully engaged
2
Cost optimisationPublic to private company savings
Opex Procurement
Capex savings
3
Revenue initiativesPremium formats
Seat reservation & online booking
Best practices across sales and marketing
4
RefurbishmentsPlans progressing well
Selected strategic sites to be refurbished this year
5
20

Upgrading Integration BenefitsUpgrading our run-rate guidance to $150m
$45m
$70m
Planned Achieved
+56%
2018
$100m
$150m
Planned Expected
+50%
2019E
21

Our Strategy
Refurbishment of cinemas in the US and UK
Introduce next generation cinemas in the US
Stadium seating, leather seats and refurbished foyers
Cost Control
Enhance Customer
Value
ExpandRevenue
Opportunities
Increase investments in premium formats (4DX, IMAX, Screen X)
Better facilities: concessions and food offering, VIP offering
Loyalty and subscription program
Effective planning
Procurement, centralised purchasing and systems
Increased productivity
22

Continued Roll-out Across the US and Europe
Speke, UKLynbrook, NY
13 new sites and 108 screens across our estate in 2018
Ramnicu Valcea, Romania
United States UK & Ireland ROW
6sites
59screens
1Site
6screens
6sites
43screens
23
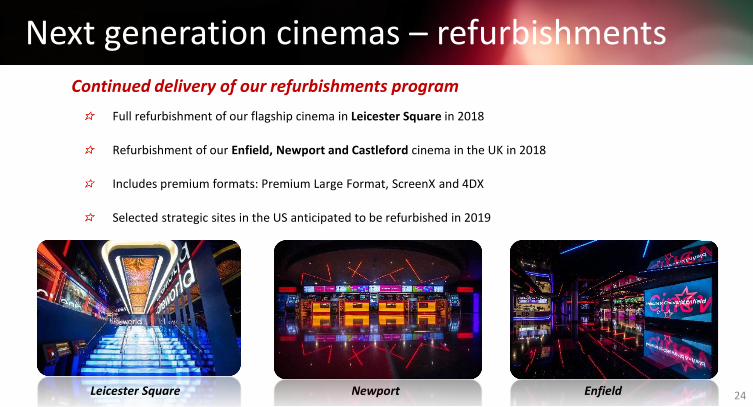
Next generation cinemas – refurbishments
Full refurbishment of our flagship cinema in Leicester Square in 2018
Refurbishment of our Enfield, Newport and Castleford cinema in the UK in 2018
Includes premium formats: Premium Large Format, ScreenX and 4DX
Selected strategic sites in the US anticipated to be refurbished in 2019
Continued delivery of our refurbishments program
Leicester Square Newport Enfield 24

Our US Refurb Program
Union Square, NY
Irvine Spectrum, CA
Over 25
Agreed and Signed
Renovations
25

Our US Refurb Plan
Hacienda Crossing, CA
26

Our US Refurb Plan
Atlantic Station, GA
27
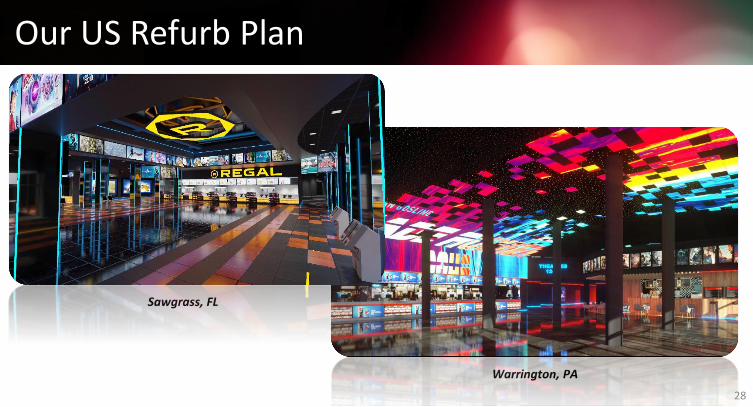
Our US Refurb Plan
Sawgrass, FL
Warrington, PA
28
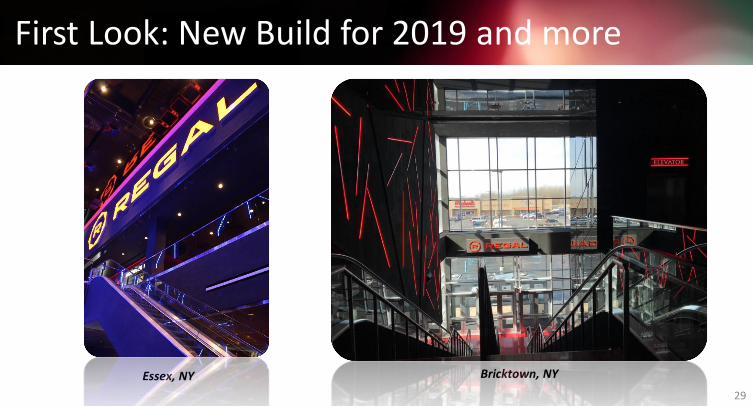
First Look: New Build for 2019 and more
Essex, NY Bricktown, NY
29

First Look: New Build for 2019 and more
Mission Market, CA
Yorda Linda, CA30

First Look: New Build for 2019 and more
BL, Texas31

Technology InvestmentsInvestment into a wide range of new and exciting technologies including
Digital Laser Projectors
New 4DX (80 screens) and IMAX (55 screens) agreements
ScreenX (100 screens): 270 degree panoramic film-viewing experience
Digital posters
Large format LED screens
53
116
130
19
2018
32

What is coming?
Over 25 agreed and signed renovations in the US
Further refurbishments planned in the UK (10 sites) and ROW (2 sites)
Continued focus on customer experience to be “The Best Place to Watch a Movie”
17 new sites and 184 screens across our estate in 2019
United States UK & Ireland ROW
7sites
78screens
4Site
39screens
6sites
67screens
33

Release Schedule: 2019
34

2020 and beyond – Key Titles
35