chronodes: interactive multi-focus exploration of event ... · chronodes: interactive multi-focus...
TRANSCRIPT

Chronodes: Interactive Multi-focusExploration of Event Sequences
Peter J Polack Jr, Shang-Tse Chen, Minsuk Kahng,Kaya de Barbaro, Rahul Basole, Duen Horng Chau
College of ComputingGeorgia Institute of Technology
{ppolack, schen351, kahng, kaya, basole, polo}@gatech.edu
Moushumi SharminCollege of Science & EngineeringWestern Washington University
ABSTRACTThe advent of mobile health (mHealth) technologies chal-lenges the capabilities of current visualizations, interactivetools, and algorithms. We present Chronodes, an interac-tive system that unifies data mining and human-centric vi-sualization techniques to support explorative analysis of lon-gitudinal mHealth data. Chronodes extracts and visualizesfrequent event sequences that reveal chronological patternsacross multiple participant timelines of mHealth data. Itthen combines novel interaction and visualization techniquesto enable multi-focus event sequence analysis, which allowshealth researchers to interactively define, explore, and com-pare groups of participant behaviors using event sequencecombinations. Through summarizing insights gained from apilot study with 20 behavioral and biomedical health experts,we discuss Chronodes’s efficacy and potential impact in themHealth domain. Ultimately we outline important open chal-lenges in mHealth, and offer recommendations and designguidelines for future research. For a video demonstration ofChronodes, please refer to the provided video figure.
Author KeywordsMobile health sensor data; mHealth; sequence mining;cohort discovery; event alignment
ACM Classification KeywordsH.5.m. Information Interfaces and Presentation (e.g. HCI):Miscellaneous
INTRODUCTIONAs revolutionary developments in mobile sensor technologyextend to more applications in healthcare, the potential for un-derstanding patterns and relationships among physiologicalfactors is burgeoning. With these sensors, health researchersare afforded new capabilities to collect and analyze healthdata from study participants, with more accuracy and pre-cision than ever before. We have commenced a pioneeringinitiative to develop innovative methods that turn the wealthof mobile health (mHealth) sensor data unlocked by these
Figure 1. From mobile health (mHealth) event data, Chronodes extractsfrequent patterns of events that users can interactively explore. (A) Mul-tiple days of mHealth sensor data are represented as discrete events overtime. Only a snapshot of the full dataset is shown. (B) Chronodes minesfrequent sequences of events that users can interactively combine to re-veal patterns that occur before and after them (left and right). All figuresbest viewed in color. Red: smoking episodes. Blue: activity intensity.
emerging and evolving sensors into reliable and actionablehealth information. As smoking is the leading yet preventablecause of death in the United States, and as smoking lapse con-tributes to high failure rate in quit attempts, smoking cessa-tion is one of the most challenging research problems in thisarea. For this reason, we have selected smoking cessation andlapse as our primary topic of focused analysis, and are cur-rently developing tools to assist health researchers discovertemporal, physiological, and behavioral patterns and factorsthat cause abstinent smokers to lapse.
To assess the behaviors surrounding smoking abstinence andrelapse, health researchers need to to understand lifestylechoices and activities that are related to smoking relapse, andare particularly interested in the sequences of events leadingup to lapse [4, 21]. Furthermore, whereas analysts are inter-ested in determining universal indicators and causes of smok-ing relapse, behavioral variation between participant groupsis equally relevant [8, 1]. Should younger individuals’ dailyroutines be distinguished from those of older? Will early
1
arX
iv:1
609.
0853
5v1
[cs
.HC
] 2
7 Se
p 20
16
morning and late night smokers exhibit different pre-smokingbehaviors [22]?
To begin answering these questions, researchers need tools todiscover which subsets (cohorts) of abstinent smokers exhibitsimilar or dissimilar behaviors, and to compare the groups assuch. Ultimately, these methods must also represent longi-tudinal, high-resolution mHealth datasets. Figure 1 shows asnapshot of this complexity for only a few evenings’ worth ofmHealth data—visualizing the data as-is is complex and dif-ficult to make sense of. Exploring how chronological patternsrelate to common behaviors is non-trivial, as it is not only achallenge to define groups of behaviors from mHealth data,but also to examine and compare these groups interactively.In contrast to traditional electronic health records (EHR)where temporal events are already explicitly defined, largelynon-overlapping, and do not repeat frequently throughout theday, mHealth analysis requires that event chronology is de-rived from overlapping sensor data streams that span daytimecontinuously.
Mobile Health (mHealth) DatasetsWe obtained real-world mHealth datasets collected throughfield studies investigating the use of the AutoSense SensorSuite for inferring general stress state [9]. In the first of thesestudies, 6 participants (who smoke) wore the sensors for 3days, totaling about 400 hours. In a proceeding study, thesame format of data was recorded for 52 participants beforeand after planned smoking abstinence (pre-quit and post-quit,respectively), with each participant’s data totaling approxi-mately 6 days [29]. The sensor suite recorded 40 data streamsfor each participant, capturing a wide variety of physiolog-ical signals, e.g., electrocardiogram (ECG), galvanic skinresponse (GSR), and heart-rate variability (HRV) measure-ments. The resulting datasets consisted of over 750,000 and4,650,000 data points, respectively (sampled at 1 Hz). TheAutoSense data represents one of the few mHealth data ini-tiatives available for research use, as collecting good-qualitymHealth data is a great technical challenge, due to limitationsin sensor hardware and battery technologies [9, 7, 13].
Our Contributions• MHealth data introduces unique challenges that existing
tools for analyzing EHR do not adequately address. Chron-odes is one of the first attempts to explore how to best rep-resent and explore mHealth data, combining data miningand human-centric visualization techniques to aid data ex-ploration, pattern discovery, and fine-grained analysis oflongitudinal mHealth records.• Chronodes introduces two novel capabilities that help
health researchers interactively explore and combine se-quences to ask important, complex questions like “whathappens between first lapses that precede high activity, andsecond lapses that follow low activity but high stress?”,and then to generate and explore variations of this questioninteractively:
1. While existing tools align on multiple occurrences ofa single event type, Chronodes allows alignment ontwo or more event types so users can see what happensin between (e.g., between first and second lapse).
2. Chronodes’ alignment points can be a single event, ora sequence consisting of multiple events (e.g., smok-ing lapse→ high-activity).
• We conducted an informal study with 20 expert researchersfrom a spectrum of mHealth related disciplines. By sum-marizing the insights gained, we outline important openresearch and design challenges in developing the mHealthfield, and offer recommendations and design guidelines forfuture research.
For a video demonstration of Chronodes, please refer to theprovided video figure.
RESEARCH QUESTIONS & DESIGN MOTIVATIONSBefore beginning development on Chronodes, we workedwith health researchers on our team to collect important ques-tions that an interactive visualization tool should help answer:
Q1 What are the events preceding and proceeding each in-stance of smoking lapse? [4]
Q2 What habitual events or cues (e.g., smoking every dayafter lunch) are correlated to smoking lapse? [21]
Q3 What are the correlations between smoking lapse andother physiological factors, such as stress? [8, 1]
Q4 What event patterns are specific to individual partici-pants, and otherwise universal to all participants? [22]
We propose to leverage frequent sequence mining as acore method to approach these research questions. MiningmHealth data for recurring event sequences helps to answerquestions Q2 and Q4: it permits investigations of participantbehaviors within days, across days, and between participants,all at a generalized, human-interpretable level. By then adapt-ing ‘event alignment’ into ‘frequent sequence alignment,’ weenable answers to Q1: we allow Chronodes users to in-vestigate the frequent sequences that occur before and afteraligned sequences of interest.
To address Q3, finding correlations between smoking eventsand physiological factors, we can represent physiological fac-tors as events. For example, we can consider a high-stressactivity and a drive to work as different events, and repre-sent them within frequent sequences once they are mined. Aswe intend for Chronodes to be applied to a wide variety ofhealth conditions, it is important that the process of convert-ing physiological factors to events is user-adjustable. In thisway, we enable users to adjust event definitions interactivelyas in [10], before the events are mined for event sequence pat-terns. How these events are derived, and the implications ofdefining events in this way, are discussed in later sections.
CHRONODES OVERVIEWTo preface Chronodes’ contributions, we provide a high-leveloverview of the system’s fundamental features.
2

Figure 2. (A) The Chronodes Sequence Stage showing a scatterplot of frequent sequences, and (B) the Event Orchestra below it displaying the participantevent data that these sequences were mined from. Whereas all sequences in the Event Orchestra are grayed out by default, when the user mouses over afrequent sequence on the Sequence Stage its location throughout the participant data is highlighted in the Event Orchestra. (C) The legend for this pilotdataset is magnified here for better readability.
Description of the User InterfaceThe Chronodes user interface (Figure 2) is comprised of twoareas that update to the user’s interactions. The Event Orches-tra, fixed to the bottom of the screen (Figure 2B), lists a subsetof participants represented by our dataset, and displays the se-ries of events that these participants perform over the courseof 24 hour days. As the user interacts with event sequences,participants and events that are associated with each sequence‘light up’ correspondingly (mousing over in Figure2). The Event Orchestra demonstrates to new users how de-rived event sequences relate to the ‘raw’ event data, and alsoserves as a continuous indicator of the subset of data selectedelsewhere in the interface (highlighted). In this way, the EventOrchestra’s primary role is as a guiding frame of reference,but is not essential to interacting with Chronodes and can beminimized.
The Sequence Stage is the primary area of user interaction,and accounts for the largest amount of space in the Chronodesinterface (Figure 2A). It is within the Sequence Stage that theuser selects, manipulates, and compares frequent event se-quences. To demonstrate how the user performs these opera-tions, we will describe Chronodes functionality through a usecase scenario. The provided video figure offers an overviewof this scenario as well.
Use Case Walk-throughThis scenario demonstrates how the pilot study data describedin the Introduction is used with Chronodes in practice. Ouruser Jane is a health researcher that intends to discover and
understand physiological events commonly associated withsmoking episodes. Upon launch, Chronodes displays theevents that occur throughout the participants’ days in theEvent Orchestra. In the Sequence Stage, Chronodes displaysthe frequent event sequences derived from this event data. Byinitially displaying both the raw event data and the derived se-quences side-by-side as in [33], we lend Jane introductory in-formation about how event sequences are derived, what theyrepresent, and where they occur.
Initially, the frequent sequences are displayed in a scatterplot(Figure 2A) that helps Jane to identify frequent sequences ofinterest. The axes of this scatterplot will be described in de-tail later on; for now, Jane is interested foremost in eventssurrounding smoking episodes, so she chooses a smoking→high-activity event sequence ( in Figure 2A) from thescatterplot. As she moves the cursor over this sequence, theEvent Orchestra highlights the multiple occurrences of thissequence across multiple participants and days of data. Bythen clicking the sequence, it becomes a focal sequence, andmoves to the center of the Sequence Stage as all other se-quences fade away. Once centered, Chronodes reveals theadjacent event sequences that occur most frequently beforeand after the smoking event sequence that Jane selected (Fig-ure 3: Step 1).
To indicate which of these sequences occurs before and af-ter the focal sequence, Chronodes displays the adjacent se-quences as on a timeline: sequences that occur before the fo-cal sequence are placed on the left, and those that occur after
3

are on the right (Figure 3). The adjacent sequences are thenranked vertically by frequency, so that the most frequent onesare topmost.
At this point, sequence frequency is not the only thing thatmatters to Jane; distance in time from the focal sequence isalso relevant. To account for this, Chronodes positions se-quences horizontally based on their proximity in time to thefocal sequence. In other words, sequences that tend to occurimmediately before or after the focal sequence are closer to it(notice the horizontal staggering between sequences in Figure3: Step 1).
Critically, it is important for our users to understand this ata glance, that chronology on the Sequence Stage timeline isrelative to the focal sequence, and not absolute as in a normaltimeline. This is distinct from existing healthcare analysisvisualizations, which depict participant timelines with lineartemporality. To demonstrate this visually, Chronodes displaysthe frequent sequences on white tracks that depict the flow oftime (Figure 3). In this way, every track that Jane can tracewith her eyes is a sequence of sequences that occurs some-where in the participants’ data. The tracks ‘bottleneck’ atthe focal sequence because it is the focal sequence that everyother sequence has in common in its proximity.
To reduce visual clutter, only the top 10 most frequent se-quences on each side are displayed, but Jane can scroll verti-cally through these options to reveal more. Jane sees a low-activity high-stress event ( in Figure 3: Step 1) that occursonly sixth most frequently, but immediately, after her focalsequence. She selects it, and it becomes a second focal se-quence along the tracks (Figure 3: Step 2).
Now that Jane has selected two focal sequences, Chronodesdisplays the sequences that occur only where both focal se-quences are present (i.e. · · · ). To illustrate thiscomprehension to new users, the events satisfied by Jane’stwo focal sequences remain dimly lit in the Event Orchestra(as in Figure 2: Step 2). Although the adjacent sequences be-fore and after these focal sequences are still visible, anotherfeature now emerges: Jane can click a + symbol in betweenthe focal sequences (Figure 3: Step 2) to reveal the sequencesthat occur between two focal sequences (Figure 3: Step 3).This functionality reveals a fundamental advantage of inter-active frequent sequence alignment: the capacity to reveal thetrends that occur between two or more events of interest.
Jane can clearly see the frequent sequences that occur before,between, and after the two focal sequences, but which partic-ipants do these adjacent sequences belong to? What time ofthe day are they occurring? As before, Jane can simply mouseover any sequence to reveal its associated events in the EventOrchestra. By doing so, Jane discovers that the sequencesshe is observing are shared by a certain subset of participants.Furthermore, for each of these participants, the events she ishighlighting tend to occur in the evening. This shows that bydefining these two focal sequences, Jane has effectively nav-igated to a ‘cohort’ of participants that mutually exhibit theevent behaviors she specified. This demonstrates the inter-
Figure 3. Varying configurations of focal sequences and the sequencesof events that occur around them. (Step 1) one focal sequence with thesequences before and after it. The user clicks a sequence after and itbecomes a second focal sequence in (Step 2) the two focal sequenceswith the sequences before and after them. The user clicks the + sym-bol and the timeline becomes (Step 3): the two focal sequences with thesequences between them.
active and expressive capabilities of Chronodes, to use eventpatterns to discover cohorts of participants.
Finally, Jane can delete one of her focal sequences to returnto a previous state of her analysis. As adding more focalsequences defines a more specific cohort because it resem-bles an AND operation, deleting focal sequences, conversely,
4

broadens the cohort. Jane can continue to explore subsets ofher participants’ behaviors in this fashion.
CHRONODES CONTRIBUTIONSNow that an overview of the Chronodes interface has beenpresented, we proceed in this section to describe these fea-tures in terms of the contributions they lend to research invisualization, data mining, and mHealth analysis.
Visualizing Frequent Sequences for InteractionChronodes develops on event-based timelines by replacingevents with sequences of events that can be rearranged in-teractively. Every event sequence, whether discovered by fre-quent sequence mining or defined interactively by the user,is an interactive element. As in ‘event alignment,’ any eventsequence can be designated as a focal sequence, so that allevents before and after it are displayed chronologically (Fig-ure 3).
Representing mined frequent sequences for interaction is anovel integration of data mining and visualization with a se-ries of conceptual and computational challenges that Chron-odes is designed to solve. Fundamentally, it is important forour users to understand that, although we represent frequentsequences as singular visual elements, they in actuality rep-resent many event sequences over time. This relationship isdemonstrated by the Event Orchestra: when the user mousesover a frequent sequence on the Stage, the correspondingevent sequences across any number of participants are high-lighted in the Orchestra. In other words, a frequent sequencein the Sequence Stage inherently represents many event se-quences that frequently occur in the Event Orchestra.
We represent frequent sequences as a ‘kebab’ ( ), soas to convey the fact that frequent sequences are a series ofevents on a timeline, potentially separated by time. There-fore, the length and distancing of events within the frequentsequences (intra-sequence, within the ) is determinedby averaging the timestamps of these events, wherever theyoccur in the associated event sequences. On the other hand,as every frequent sequence represents event sequences thatoccur at variable times, indicating chronology between se-quences (inter-sequence) is not as simple as averaging thetimestamps of the constituent sequences together. Althoughan average of event sequence timestamps, unlike a median,preserves inter-sequence chronology, we need to ensure thatthe average does not oversimplify what our users need to seeduring alignment. For instance, if event sequence A occursboth before and after focal sequence B, should we place Abefore, after, or within focal sequence B? As a solution, weconsider the sequences before and the sequences after focalpoints as distinct, so that in this scenario, sequence A appearsboth before and after focal sequence B.
For Chronodes’ initial scatterplot, retaining inter-sequencechronology is not an issue, as sequences are positioned ac-cording to the axes. The y-axis represents the average num-ber of times that an event sequence occurs per day; that is,if a sequence of events tends to occur 5 times every day, its
position on the y-axis is 5. The x-axis indicates the total num-ber of days that the event sequence is found: if the event se-quence occurs for only one participant’s Monday, Tuesday,and Wednesday, its position on the x-axis is 3. As an emer-gent result, sequences are distributed into a two-dimensionalspectrum of sequence prevalence (Figure 4).
Figure 4. (Ordinary) sequences occur so frequently that they are notvery interesting (e.g., walking). (Habitual) sequences occur on manydays, but do not repeat frequently on the days that they occur (e.g., ex-ercising once every day). (Rare) sequences occur very infrequently.
Multiple Sequence AlignmentsUnlike existing work on event-based alignment, Chronodesdoes not limit user interaction to single alignment on singleevents; instead, it encourages the user to create multiple align-ments on any number of events side-by-side. As exhibited inFigure 3, this also permits the user to find sequences of eventsbetween events of interest, unprecedented in existing eventalignment techniques.
Comparing and Cloning CohortsWhen Jane specified the first sequence from the Se-quence Stage scatterplot, this sequence appeared as a focal se-quence with its own tracks and adjacent sequences (Figure 3:Step 1). As she continued to select more adjacent sequenceslike the proceeding , she narrowed down on a more spe-cific subset of the participant data: only days that included allof · · · were displayed (Figure 3: Step 2) In thisway, Chronodes provides the functionality to constructivelydefine cohorts using sequences of events. This extends thecapabilities of prior work that enables users to display par-ticipants that exhibit a specified sequence of events, but doesnot permit the interactive rearrangement of these events oncethey are set.
5
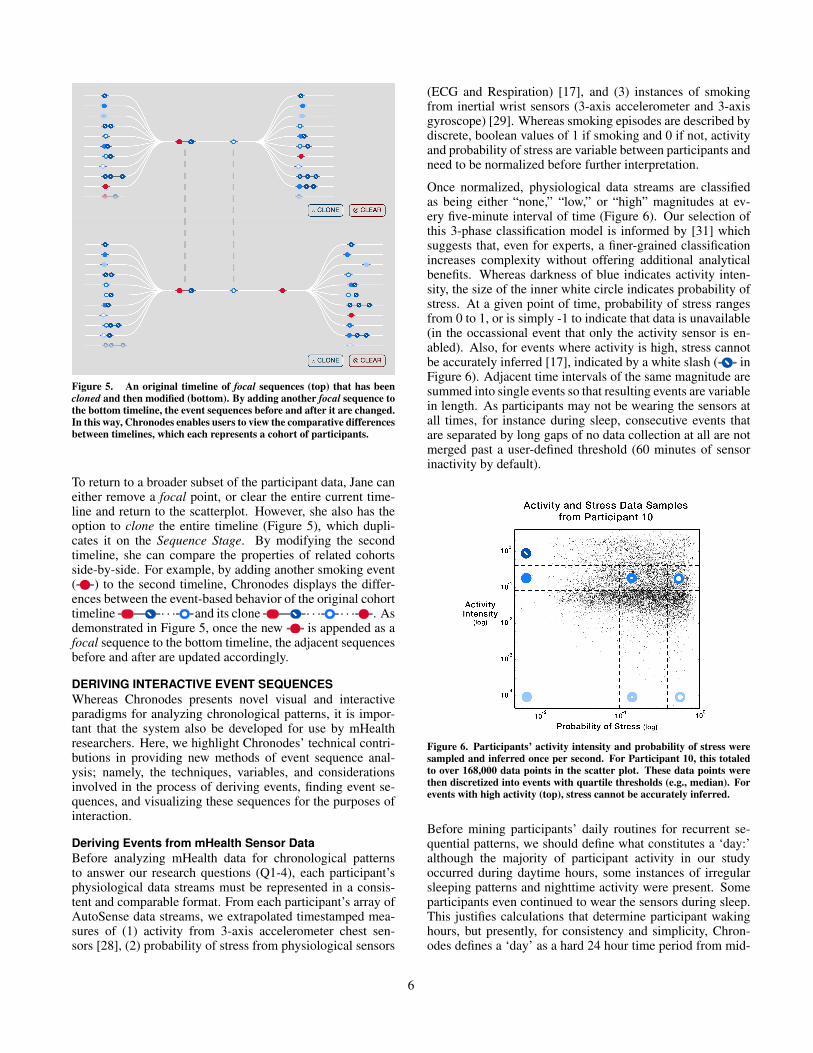
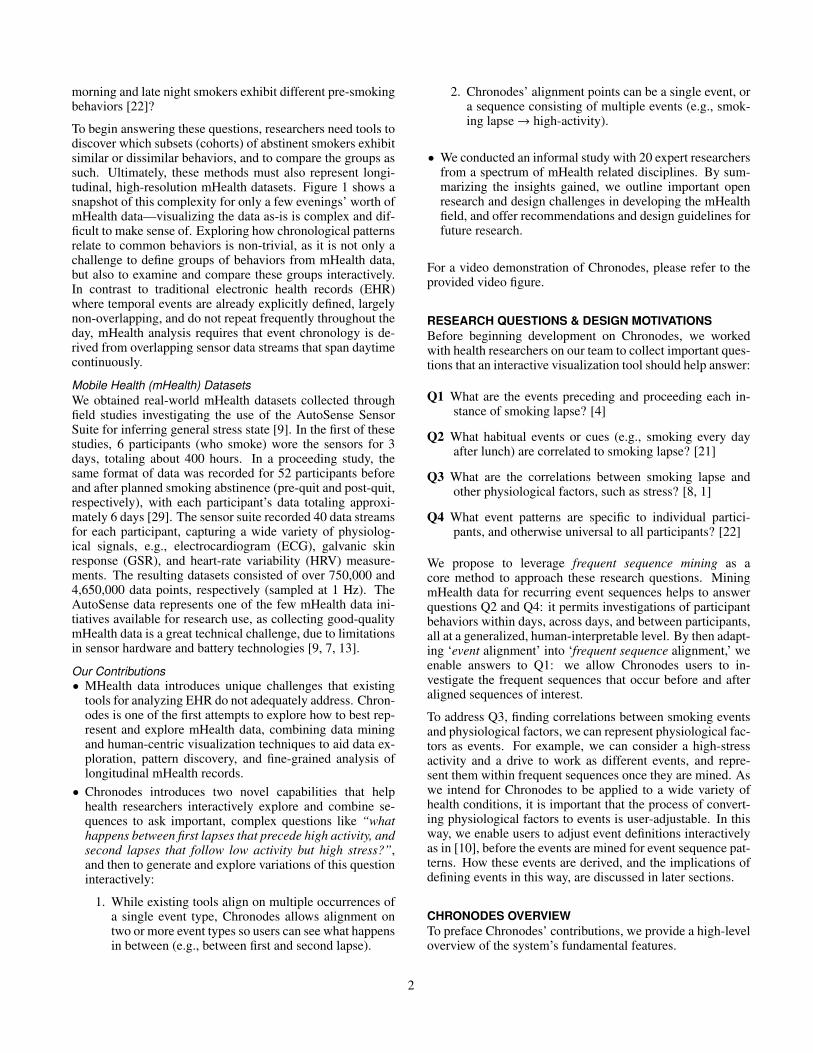
Figure 5. An original timeline of focal sequences (top) that has beencloned and then modified (bottom). By adding another focal sequence tothe bottom timeline, the event sequences before and after it are changed.In this way, Chronodes enables users to view the comparative differencesbetween timelines, which each represents a cohort of participants.
To return to a broader subset of the participant data, Jane caneither remove a focal point, or clear the entire current time-line and return to the scatterplot. However, she also has theoption to clone the entire timeline (Figure 5), which dupli-cates it on the Sequence Stage. By modifying the secondtimeline, she can compare the properties of related cohortsside-by-side. For example, by adding another smoking event( ) to the second timeline, Chronodes displays the differ-ences between the event-based behavior of the original cohorttimeline · · · and its clone · · · · · · . Asdemonstrated in Figure 5, once the new is appended as afocal sequence to the bottom timeline, the adjacent sequencesbefore and after are updated accordingly.
DERIVING INTERACTIVE EVENT SEQUENCESWhereas Chronodes presents novel visual and interactiveparadigms for analyzing chronological patterns, it is impor-tant that the system also be developed for use by mHealthresearchers. Here, we highlight Chronodes’ technical contri-butions in providing new methods of event sequence anal-ysis; namely, the techniques, variables, and considerationsinvolved in the process of deriving events, finding event se-quences, and visualizing these sequences for the purposes ofinteraction.
Deriving Events from mHealth Sensor DataBefore analyzing mHealth data for chronological patternsto answer our research questions (Q1-4), each participant’sphysiological data streams must be represented in a consis-tent and comparable format. From each participant’s array ofAutoSense data streams, we extrapolated timestamped mea-sures of (1) activity from 3-axis accelerometer chest sen-sors [28], (2) probability of stress from physiological sensors
(ECG and Respiration) [17], and (3) instances of smokingfrom inertial wrist sensors (3-axis accelerometer and 3-axisgyroscope) [29]. Whereas smoking episodes are described bydiscrete, boolean values of 1 if smoking and 0 if not, activityand probability of stress are variable between participants andneed to be normalized before further interpretation.
Once normalized, physiological data streams are classifiedas being either “none,” “low,” or “high” magnitudes at ev-ery five-minute interval of time (Figure 6). Our selection ofthis 3-phase classification model is informed by [31] whichsuggests that, even for experts, a finer-grained classificationincreases complexity without offering additional analyticalbenefits. Whereas darkness of blue indicates activity inten-sity, the size of the inner white circle indicates probability ofstress. At a given point of time, probability of stress rangesfrom 0 to 1, or is simply -1 to indicate that data is unavailable(in the occassional event that only the activity sensor is en-abled). Also, for events where activity is high, stress cannotbe accurately inferred [17], indicated by a white slash ( inFigure 6). Adjacent time intervals of the same magnitude aresummed into single events so that resulting events are variablein length. As participants may not be wearing the sensors atall times, for instance during sleep, consecutive events thatare separated by long gaps of no data collection at all are notmerged past a user-defined threshold (60 minutes of sensorinactivity by default).
Figure 6. Participants’ activity intensity and probability of stress weresampled and inferred once per second. For Participant 10, this totaledto over 168,000 data points in the scatter plot. These data points werethen discretized into events with quartile thresholds (e.g., median). Forevents with high activity (top), stress cannot be accurately inferred.
Before mining participants’ daily routines for recurrent se-quential patterns, we should define what constitutes a ‘day:’although the majority of participant activity in our studyoccurred during daytime hours, some instances of irregularsleeping patterns and nighttime activity were present. Someparticipants even continued to wear the sensors during sleep.This justifies calculations that determine participant wakinghours, but presently, for consistency and simplicity, Chron-odes defines a ‘day’ as a hard 24 hour time period from mid-
6

night to midnight, necessarily accounting for behaviors thatrepeat at consistent times across days.
Deriving Frequent Sequences From EventsOnce participant data streams are represented as a continuousseries of events, sequence mining provides Chronodes userswith meaningful chronological relationships and sequencesof events that can be manipulated interactively. Upon launch,Chronodes finds daily event sequences present throughout allparticipant events using the PrefixSpan [23] sequence miningalgorithm. PrefixSpan retrieves patterns that occur frequentlyamongst sequential events, and is an efficient algorithm formining frequent sequences from a large number of individualevent strings (i.e., a large number of 24 hour days). Algo-rithms of this kind are increasingly useful as we scale up tomore participants. Before the mined frequent sequences canbe rendered as visual components that the user can interactwith, we must first modify PrefixSpan to consider variationsin repetitive, gapped, and closed sequence mining.
When PrefixSpan runs, it returns a list of frequent sequencesranked by frequency, with their positions in the participantdata. Importantly, the algorithm does not mine for repetitivefrequent sequences: if a smoking episode occurs three timesevery day, PrefixSpan only recovers the first occurence perday. To extend the algorithm to find repetitive sequences, weuse the locations of the initially found frequent sequences tosearch the remainder of the 24 hour day for repetitions.
Also by default, PrefixSpan mines for gapped event se-quences: events can be considered as a part of the same se-quence even if they are separated by many other events (a‘gap’). This is not ideal for scenarios where healthcare ana-lysts are only interested in the events immediately preceedingor proceeding smoking relapse; however, preventing gaps en-tirely would not allow our users to understand relationshipsbetween event behaviors that occur hours apart. To suit thisrange of use cases, we set a maximum gap parameter thatChronodes users can adjust concurrently.
Ultimately PrefixSpan does not limit mining to closed se-quences; for example, it redundantly returns both the closed
, and its subset . Although we can mod-ify PrefixSpan to return only the closed frequent sequences,Chronodes’ design lends interactive capabilities that allow usto do something more comprehensive. By initially provid-ing only the shorter frequent sequences that have a longervariation (in our example, present only ), by select-ing this sequence as a focal sequence we can see all of thevariations that are related to it. As Chronodes displays the se-quences that come after the focal sequence once it is selected(like ), it is also displaying longer variations of the fo-cal sequence as a side-effect ( · · · is equivalent to
). In doing so, we enable a new interactive methodfor exploring event sequences mined with frequent sequencemining, whereby users can constructively narrow in on re-lated sequences. Additionally, as an emergent result, we cankeep the frequent sequence ‘entry points’ on the scatterplotsimple.
Interacting with Frequent SequencesChronodes maps every mined frequent sequence to its recur-ring location in the event data, so that mousing over or select-ing each sequence indicates its distribution in the Event Or-chestra (Figure 2). Also, as every frequent sequence is relatedto a particular cohort of participants (either all or some partic-ipants have the sequence), we can use information about theassociated cohort to limit our searches for adjacent sequences.Any participant or day outside of the currently specified co-hort does not need to be searched for sequences, thereby lim-iting use of computational resources as we scale to more par-ticipants and data streams.
Specific care is taken to ensure that, when a frequent se-quence is selected in Chronodes, the user can understand theeffects of their action on the visualization. Upon selection,sequences animate to the center as the nearby sequences fadeaway, and the new tracks grow outward. After these ani-mations complete, the Event Orchestra updates to indicatethe focal sequences and new cohort of participants being ob-served.
System ImplementationChronodes’s front-end visualization component is web-basedand written in JavaScript (jQuery1, React2, D33), and servedby a Python web server (web.py4). The front-end interfacesends API requests to the web server that returns data pro-cessed for display. Timestamped inferences about partici-pant activity, stress, and smoking episodes are stored in anSQLite database5, for its cross-platform compatibility, inte-gration with Python, and support for the dataset size of ourpilot study.
USER STUDY WITH HEALTH EXPERTSWe conducted an informal pilot investigation with 20 behav-ioral, biomedical, and computational health experts comingfrom a large research team to gain insights into the efficacyand limitations of Chronodes. Through the study we in-tended to understand how Chronodes may help them withmHealth data exploration, pattern discovery, and decisionmaking. The interdisciplinary nature of the research teampresents the unique opportunity for us to gain insight intohow Chronodes may be used by experts with diverse back-grounds. Table 1 highlights some of their domain expertiseand experience. We refer to these participants as “experts” toavoid confusion with the AutoSense participants (from whomthe mHealth data was collected).
MethodEach study session began with a demonstration of the Chron-odes interface. The participants were welcome to ask ques-tions at any time. After the demonstration, the participantswere instructed to think aloud in describing their perspec-tives and criticisms of the interface’s features. Commentswere recorded and organized by which interface feature they1jquery.org2facebook.github.io/react3d3js.org4webpy.org5sqlite.org
7

ID Domain Expertise Years in Field
A Health psychologist 13B Statistician (focus: clinical design, analytics) 26C Behavioral health researcher 38D Machine learning 10E Health informatics 31F HCI, human-centered computing 26G Sensor and hardware designer 16H Clinician & health informatics 25J mHealth software designer 13K mHealth software architect 12
Table 1. Expert participants, their diverse domain expertise andyears in fields (12–38 years). These experts’ characteristics arerepresentative of the 20 experts in our study.
pertained to: (1) event derivation and representation, (2) fre-quent sequence derivation, representation, and placement, (3)mining and placement of adjacent sequences around focal se-quences, and (4) the use of multiple focal sequences. Dueto the nature of our informal study, we did not record audioof the demonstrations. We took notes to capture feedback onthe usability, effectiveness, as well as limitations and possi-ble improvements of the system. Remarks included in thissection are paraphrased summaries of this feedback.
RESULTS AND IMPLICATIONS FOR FUTURE RESEARCHIn this section, we summarize insights gleaned from theuser study, present open challenges, and provide recommen-dations for future visualization and analysis research withmHealth data.
Representing mHealth DataThe challenge of analyzing and representing mHealth data isone of variability (continuous quantitative data streams), un-certainty (missing or incorrect measurements), high volume(data from many sensors simultaneously), and high dimen-sionality (many participants and many data streams) at once.To represent continuous mHealth data streams across manyparticipants effectively, focused investigations into each ofthese factors are necessitated for future research.
Leveraging Temporal Variation during Event DerivationDrawing on prior works [20, 19], Chronodes representsmHealth data as discrete events, which supports the visual-ization and analysis of chronological patterns, their frequen-cies, and their relationships. In EHR scenarios where healthdata is already described by discrete events (e.g., medicationsadministered in asthma treatment in EventFlow [20], hospi-tal administration events in CoCo [19]), discretization fromcontinuous data streams to discrete events is not required.However, working with quantitative data streams in mHealthprovides the opportunity to define more complex event types,leveraging temporal variation to define discrete events thatcapture the ways physiology changes over time.
For example, Expert H described that when an event occurs,health analysts are often interested in the residual effects ofthe event over time, and how these effects might in turn af-fect our understanding of the events that follow. Additionally,some events are better described as fluctuating, quantitativevalues altogether. In other words, being able to investigate the
underlying causes or emergent effects of an mHealth event isuseful for understanding why it is present in the first place,and what kinds of implications it has. For this, Expert H pro-vided the example of stress: although we may certainly rep-resent a high-stress episode as happening at a discrete pointin time, it may be more effectively represented as a state witha variable magnitude, and with variable effects that are sus-tained until after the high stress is sensed.
Describing mHealth data as temporal features [14] or mo-tifs [6] are potential routes for addressing this challenge. Tothis end, we enhanced Chronodes with a event derivation sys-tem (Figure 7) to discover temporal patterns in mHealth data,which can then be organized in Chronodes. To find thesepatterns, the event derivation system employs the SymbolicAggregate approXimation and Vector Space Model (SAX-VSM) [30] to represent the time series in the mHealth data(e.g., stress levels, activity intensities) as temporal segments,that are then clustered into groups with k-means [12, 26]. Af-ter discovering these groups of trends, or motifs, across par-ticipant records, the event derivation system allows users toexamine where these motifs occur, and select any number ofthem. Once selected, motifs can be defined as events for usein Chronodes, represented as glyphs of the sidebar motifs.
Figure 7. (A) The event derivation interface showing probability ofstress (gray), activity intensity (blue), and smoking episodes (red verticaldotted lines) for multiple participants. (B) The sidebar displays commontemporal trends (motifs) identified from this data using time series motifmining. (C) The user selects a motif to highlight where it occurs in thedata. (D) Zoomed-in view of a three-hour region showing two instancesof the highlighted motif (gray border added to enhance clarity). Motifsselected from the sidebar can be defined as events for use in Chronodes.
Addressing Uncertainty in mHealth DatamHealth data presents a unique relationship between thehigh-resolution data points recorded and the high-level hu-man behaviors that can be inferred from them at varying de-grees of certainty. In this way, Expert H was interested in howChronodes might portray the relationships between groundtruth sensor events and the behavioral variables that can beinferred from them (e.g., high stress inferred from increasedheart rate). Similarly, prior research suggests that there isa discrepancy between a self-reported event-timing and theactual event-timing: smokers often report smoking episodesprior to or after the actual smoking event [29]. Designing a
8

temporal visualization that mediates conflicts between self-reported events and sensor-collected objective event pointsthus introduces novel challenges that need to be further in-vestigated. Recent work has made a first attempt [31], butfurther research is warranted to find optimal solutions as tohow to best integrate self-reported data into sensor recordeddata, and to visualize these integrations.
Sense-making from High Volume mHealth DataExperts C and J commended Chronodes’ approach to makingsense of high-volume event data by way of interaction withevent sequences, which was echoed by other experts consis-tently. These remarks suggested Chronodes’ niche role inexploring mHealth data interactively with event sequences,particularly as these methods relate to other existing health-care analysis techniques that focus on event-based analysis(e.g., [20, 19]). Ultimately we can use the existing interactivetechniques in Chronodes to mine high-volume mHealth datamore effectively, learning from how tools like Progressive In-sights [32] permit exploration of data as it is being mined.
Context and Homologous EventsInstantial ContextExpert D noted that in some cases events may be identical interms of their content, but different in the context of how theywere registered or defined. A specific example given to uswas: how do we denote the difference between a self-reportedsmoking event, and one detected by carbon monoxide sen-sors? Of course, as these events are instantiated in differentways we could represent them as visually distinct, but in de-veloping Chronodes we would prefer to design a more robustway for users to understand the relationships between, andexistence of, these homologous events.
Situational ContextExpert D described the differences between events that mightdepend on location and spatial context, like between a smok-ing event at home and at work. Already we are designing anext iteration of Chronodes to account for these situationalcontexts. As our frequent sequence mining algorithm sup-ports events that occur simultaneously, we are able to con-sider and represent ‘smoking’ event (behavioral) occurring ‘athome’ (spatial) at once. As a result, these events in parallelprovide context to one another by being present at the sametime. However, visualizing multiple contextual events in par-allel may confound which events relate to one another in thefirst place, especially as we scale to more event types. Furtherresearch is needed to determine the kinds of computational,visual, and interactive techniques required to indicate how avariety of mHealth events relate to their situational contexts.
Temporal ContextExpert A is working to determine false positives in sensor-detected smoking episodes, and indicated a need to under-stand the differences between events that depend on time, likebetween a smoking event in the morning and at night. We arealso designing a solution for this kind of temporal context: asthe Event Orchestra represents a timeline, we can use it asan interactive filter to specify the time regions that we are in-terested in. In our scenario, Jane should be able to highlight
the morning in the Event Orchestra, and choose a smokingepisode focal sequence limited to that specified time area. Inthis way, she would see only the events that occur before andafter smoking episodes in the morning. This is a principal up-date that we are working to develop into our next version ofChronodes.
Extensibility to Other mHealth Analysis ScenariosAcross the study sessions Chronodes was deemed generaliz-able to a variety of uses in healthcare and mHealth data analy-sis. We describe these applications in this section to motivatefuture work in this area.
Behavioral AnalysisExpert B commented on the applicability of the Chronodesinterface to behavioral scientists, and suggested to performevaluative studies with this research area next. Particularly,after we had explained how timelines represented cohorts andcould be cloned, Expert B described the value of imposingconstraints on the cohort timelines other than event order.A specific example given was investigating the differencesin event chronology between male and female participants.This is a comparative strategy emphasized in prior motivat-ing works like CoCo [19], and when paired with online eventsequence specification is foreseeably powerful.
mHealth InterventionsExpert B also expressed excitement for Chronodes’ potentialapplications in investigating the effects of just-in-time adap-tive interventions. Specifically, marking different kinds of in-terventions as events and specifying them as focal sequenceswould be a significant step to not only planning interven-tions, but also understanding their outcomes across partic-ipant groups. For other end users, Expert J suggested thatChronodes could play an important role in clinicians interact-ing with these participants, where participants could be askedto recall why they tended to exhibit certain behaviors after aspecified event.
Health Sensor Development and ValidationExpert F described Chronodes as a useful tool for mHealthsensor developers that need to understand the relationshipsbetween the data elements that they record. Expert C, like-wise, described how Chronodes could be used to help sen-sor developers identify false positives from sensor alerts andcorresponding user reports. With this insight we are deeplyconsidering Chronodes’ applications not only in end-user be-havioral analysis, but also in the validation of mHealth tech-nologies in the first place.
RELATED WORKOur research builds on prior works in multiple disciplines,from visualization, health research, and data mining.
Visualization of Multiple TimelinesAggregating the event data of multiple timelines into a sin-gle timeline can be difficult to make sense of: the order ofevents from one timeline to another is completely uncorre-lated. This challenge is customary in healthcare analysis:apart from needing to understand the relationships between a
9

patient’s various physiological records, analysts must do thesame between thousands of patients on end [2]. Fundamen-tally, visualizing dissimilar records side-by-side proposed in[11] enables users to identify high-level correlations betweenthe distinct data streams. However, this approach becomesincreasingly intractable as we scale to more patients and sen-sor kinds. In an effort to unify many patient timelines, Care-Flow [24] visualizes the outcomes of 50,000 patients in a sin-gle, tree-like timeline. Although this approach provides anexpressive high-level overview of similar patient groups, ithas limited support for the specification of behavioral groupsand repetitive event sequences. Whereas Chronodes providesa summary of participant data in this fashion (Figure 1A), itsconcentration is a new sequence-based overview that revealsrepeating event patterns at a glance.
Event AlignmentTools like EventFlow [20], LifeFlow [34], as well as oth-ers in non-health related fields such as Experiscope [15], al-low users to select a specific event (e.g., drug A prescribed),thereby displaying the events that occur both before and af-ter the selected event, for all data records. This technique of‘event alignment’ is useful for extrapolating event causationand chronological trends, and also for organizing event flowsaround a consistent visual reference point.
Still, even with alignment, the abundance of data presentedby these interfaces, especially for large datasets, is complexand difficult to understand at a glance. To mitigate this visualoverload, existing tools rely on techniques of simplification,such as Find-and-Replace [20], which can compress multipleuser-specified events into one. Although this kind of simpli-fication reduces the number of visual elements on the screen,it hides information as the user is repeatedly working towardan increasingly simplistic representation—it is difficult to re-cover how the simplified data stream represents the origi-nal data [20]. With an interactive strategy similar to eventalignment, Chronodes reveals event-based patterns from ag-gregated data streams without the visual complexity of pre-senting mHealth data records as-is. Then, as opposed to it-eratively consolidating events to simplify the visualization ofall participant records, Chronodes leverages the properties offrequent event sequences to depict patterns of behaviors thatcan be constructed and explored interactively.
Cohort AnalysisAn alternate approach to understanding the trends of aggre-gated mHealth data streams is to consider groups of patientsas cohorts, or individuals that share certain properties [3,19]. In an effort to comparatively assess sequences ofevents between cohorts, projects such as CoCo (Cohort Com-parison) [19] show the chronology of events associated withtwo user-defined cohorts. Whereas this effectively revealsthe different properties and event sequences between spec-ified cohorts, CoCo is limited to specifying and comparingtwo cohorts (e.g., male and female), and does not enable theuser to redefine cohorts groups by arranging sequences ofevents. Chronodes builds on the cohort comparison method-ology by allowing the user to define cohorts constructively:rather than specifying cohorts for comparison and viewing
their sequences of events, Chronodes allows cohorts to bespecified by an arrangement of the events themselves. Bypairing this functionality with event alignment, Chronodesenables the user to fluidly explore cohorts and their associ-ated chains of events in tandem.
Sequence Mining and Pattern MatchingBuilding machine learning and pattern matching algorithmsinto interactive visualizations presents promising opportuni-ties for enhancing human pattern-finding abilities. [16] and[5] demonstrated how users could select specific patterns inquantitative data streams, and see where else they were found.For event-based data, [10] developed a query system to findpatterns across multiple event histories. [14] provides userswith more options to specify how these patterns are defined,and lends detailed representations of how patterns compare.
Acknowledging the potential of frequent sequence mining indense event-based health data, ActiviTree [33] renders fre-quent event patterns found throughout participant data as avisual tree of ‘common’ event sequences. Frequence [25]bridges this technique with its precursor CareFlow’s [24] rep-resentation of events and connecting edges, and then enablesspecification of cohorts by selecting sequential branches. Al-lowing users to extend events sequences as they are retrieved,Progressive Insights [32] offers an alternate, constructivemethodology to specifying event sequences. Whereas Ti-meStitch [27] designed new interactive paradigms for spec-ifying and manipulating event sequences in a constructive,non-linear fashion, Coquito [18] enabled the same construc-tive definition of behavioral groups for cohorts. Chronodesbuilds on this foundation of work with a constructive event-based querying system, enabling the exploration and discov-ery of frequent patterns across multiple continuous timelinesof mHealth records.
CONCLUSIONWe presented Chronodes, a system that unifies data miningand human-centric visualization techniques to support the ex-plorative analysis of longitudinal mHealth data. Chronodesextracts and visualizes frequent behavioral sequences andpromotes them as interactive elements, enabling health re-searchers to interactively define, explore, and compare groupsof participant behaviors using event sequence combinations.We evaluated Chronodes with an informal study with 20 ex-pert health researchers, and determined the application’s util-ity across a variety of healthcare and computational disci-plines. From these insights, we are continuing to developChronodes for applications to other health data analysis sce-narios, including understanding the health events surroundingcongestive heart failure and diabetes management, and ob-serving the effects of just-in-time adaptive interventions fromperspectives in behavioral science.
REFERENCES1. Mustafa alAbsi, Dorothy Hatsukami, and Gary L Davis.
2005. Attenuated adrenocorticotropic responses topsychological stress are associated with early smokingrelapse. Psychopharmacology 181, 1 (2005), 107–117.
10

2. Amir Bar-Or, J Healey, L Kontothanassis, and JMVan Thong. 2004. BioStream: a system architecture forreal-time processing of physiological signals. InEngineering in Medicine and Biology Society, 2004.IEMBS’04. 26th Annual International Conference of theIEEE, Vol. 2. IEEE, 3101–3104.
3. Rahul C Basole, Mark L Braunstein, Vikas Kumar,Hyunwoo Park, Minsuk Kahng, Duen Horng Polo Chau,Acar Tamersoy, Daniel A Hirsh, Nicoleta Serban, JamesBost, and others. 2015. Understanding variations inpediatric asthma care processes in the emergencydepartment using visual analytics. Journal of theAmerican Medical Informatics Association 22, 2 (2015),318–323.
4. Thomas H Brandon, Steven T Tiffany, Karen MObremski, and Timothy B Baker. 1990. Postcessationcigarette use: the process of relapse. Addictive behaviors15, 2 (1990), 105–114.
5. Paolo Buono, Aleks Aris, Catherine Plaisant, AmirKhella, and Ben Shneiderman. 2005. Interactive patternsearch in time series. In Electronic Imaging 2005.International Society for Optics and Photonics, 175–186.
6. Bill Chiu, Eamonn Keogh, and Stefano Lonardi. 2003.Probabilistic discovery of time series motifs. InProceedings of the ninth ACM SIGKDD internationalconference on Knowledge discovery and data mining.ACM, 493–498.
7. Krzysztof J Cios and G William Moore. 2002.Uniqueness of medical data mining. Artificialintelligence in medicine 26, 1 (2002), 1–24.
8. Sheldon Cohen and Edward Lichtenstein. 1990.Perceived stress, quitting smoking, and smoking relapse.Health Psychology 9, 4 (1990), 466.
9. Emre Ertin, Nathan Stohs, Santosh Kumar, Andrew Raij,Mustafa al’Absi, and Siddharth Shah. 2011. AutoSense:unobtrusively wearable sensor suite for inferring theonset, causality, and consequences of stress in the field.In Proceedings of the 9th ACM Conference onEmbedded Networked Sensor Systems. ACM, 274–287.
10. Jerry Alan Fails, Amy Karlson, Layla Shahamat, andBen Shneiderman. 2006. A visual interface formultivariate temporal data: Finding patterns of eventsacross multiple histories. In Visual Analytics ScienceAnd Technology, 2006 IEEE Symposium On. IEEE,167–174.
11. Adam Fouse, Nadir Weibel, Edwin Hutchins, andJames D Hollan. 2011. ChronoViz: a system forsupporting navigation of time-coded data. In CHI’11Extended Abstracts on Human Factors in ComputingSystems. ACM, 299–304.
12. Cyril Goutte, Peter Toft, Egill Rostrup, Finn Nielsen,and Lars Kai Hansen. 1999. On clustering fMRI timeseries. NeuroImage 9, 3 (1999), 298–310.
13. Jane Grimson, William Grimson, and WilhelmHasselbring. 2000. The SI challenge in health care.Commun. ACM 43, 6 (2000), 48–55.
14. Theresia Gschwandtner, Wolfgang Aigner, KatharinaKaiser, Silvia Miksch, and Andreas Seyfang. 2011.CareCruiser: Exploring and visualizing plans, events,and effects interactively. In Pacific VisualizationSymposium (PacificVis), 2011 IEEE. IEEE, 43–50.
15. Francois Guimbretiere, Morgan Dixon, and KenHinckley. 2007. ExperiScope: an analysis tool forinteraction data. In Proceedings of the SIGCHIconference on Human factors in computing systems.ACM, 1333–1342.
16. Harry Hochheiser and Ben Shneiderman. 2002. Adynamic query interface for finding patterns in timeseries data. In CHI’02 Extended Abstracts on HumanFactors in Computing Systems. ACM, 522–523.
17. K Hovsepian, M al’Absi, E Ertin, T Kamarck, MNakajima, and S Kumar. 2015. cStress: towards a goldstandard for continuous stress assessment in the mobileenvironment. In ACM UbiComp. 493–504.
18. Josua Krause, Adam Perer, and Harry Stavropoulos.2016. Supporting iterative cohort construction withvisual temporal queries. Visualization and ComputerGraphics, IEEE Transactions on 22, 1 (2016), 91–100.
19. Sana Malik, Fan Du, Megan Monroe, EberechukwuOnukwugha, Catherine Plaisant, and Ben Shneiderman.2015. Cohort Comparison of Event Sequences withBalanced Integration of Visual Analytics and Statistics.In Proceedings of the 20th International Conference onIntelligent User Interfaces. ACM, 38–49.
20. Megan Monroe, Rongjian Lan, Hanseung Lee, CatherinePlaisant, and Ben Shneiderman. 2013. Temporal eventsequence simplification. IEEE Transactions onVisualization and Computer Graphics 19, 12 (2013).
21. Raymond S Niaura, Damaris J Rohsenow, Jody ABinkoff, Peter M Monti, Magda Pedraza, and David BAbrams. 1988. Relevance of cue reactivity tounderstanding alcohol and smoking relapse. Journal ofabnormal psychology 97, 2 (1988), 133.
22. George C Patton, John B Carlin, Carolyn Coffey, RoryWolfe, M Hibbert, and Glenn Bowes. 1998. The courseof early smoking: a population-based cohort study overthree years. Addiction 93, 8 (1998), 1251–1260.
23. Jian Pei, Jiawei Han, Behzad Mortazavi-Asl, HelenPinto, Qiming Chen, Umeshwar Dayal, and Mei-ChunHsu. 2001. Prefixspan: Mining sequential patternsefficiently by prefix-projected pattern growth. InICCCN. IEEE, 215–224.
24. Adam Perer and David Gotz. 2013. Data-drivenexploration of care plans for patients. In CHI’13Extended Abstracts on Human Factors in ComputingSystems. ACM, 439–444.
11

25. Adam Perer and Fei Wang. 2014. Frequence: Interactivemining and visualization of temporal frequent eventsequences. In Proceedings of the 19th InternationalConference on Intelligent User Interfaces. ACM.
26. Le Phu and Duong Tuan Anh. 2011. Motif-basedmethod for initialization the K-means clustering for timeseries data. In AI 2011: Advances in ArtificialIntelligence. Springer, 11–20.
27. Peter J Polack Jr, Shang-Tse Chen, Minsuk Kahng,Moushumi Sharmin, and Duen Horng Chau. 2015.TimeStitch: Interactive Multi-focus Cohort Discoveryand Comparison. In IEEE VIS 2015 Conference Poster.IEEE.
28. M Rahman, R Bari, A Ali, M Sharmin, A Raij, KHovsepian, S Hossain, E Ertin, A Kennedy, D Epstein,K Preston, M Jobes, G Beck, S Kedia, K Ward, MalAbsi, and S Kumar. 2014. Are We There Yet?Feasibility of Continuous Stress Assessment viaWireless Physiological Sensors. In ACM BCB. 479–488.
29. N Saleheen, A Ali, S Hossain, H Sarker, S Chatterjee, BMarlin, E Ertin, M al’Absi, and S Kumar. 2015.puffMarker: a multi-sensor approach for pinpointing thetiming of first lapse in smoking cessation. In ACMUbiComp. 999–1010.
30. Pavel Senin and Sergey Malinchik. 2013. Sax-vsm:Interpretable time series classification using sax andvector space model. In Data Mining (ICDM), 2013 IEEE13th International Conference on. IEEE, 1175–1180.
31. Moushumi Sharmin, Andrew Raij, David Epstien, InbalNahum-Shani, J Gayle Beck, Sudip Vhaduri, KenziePreston, and Santosh Kumar. 2015. Visualization oftime-series sensor data to inform the design ofjust-in-time adaptive stress interventions. In Proceedingsof the 2015 ACM International Joint Conference onPervasive and Ubiquitous Computing. ACM, 505–516.
32. Charles D Stolper, Adam Perer, and David Gotz. 2014.Progressive visual analytics: User-driven visualexploration of in-progress analytics. IEEE Transactionson Visualization and Computer Graphics 20, 12 (2014),1653–1662.
33. Katerina Vrotsou, Jimmy Johansson, and MatthewCooper. 2009. ActiviTree: interactive visual explorationof sequences in event-based data using graph similarity.Visualization and Computer Graphics, IEEETransactions on 15, 6 (2009), 945–952.
34. Krist Wongsuphasawat, John Alexis Guerra Gomez,Catherine Plaisant, Taowei David Wang, MeiravTaieb-Maimon, and Ben Shneiderman. 2011. LifeFlow:visualizing an overview of event sequences. InProceedings of the SIGCHI conference on Humanfactors in computing systems. ACM.
12