distributed and interactive cube exploration - arnab nandiarnab.org/files/dice.nandi_.pdf ·...
TRANSCRIPT

Distributed and Interactive Cube ExplorationNiranjan Kamat #1, Prasanth Jayachandran #2, Karthik Tunga #3, Arnab Nandi #4
# Computer Science and Engineering Department, The Ohio State University2015 Neil Avenue, Columbus, OH 43210, USA
{kamatn1,jayachan2,tunga3,arnab4}@cse.osu.edu
Abstract—Interactive ad-hoc analytics over large datasets hasbecome an increasingly popular use case. We detail the challengesencountered when building a distributed system that allows theinteractive exploration of a data cube. We introduce DICE,a distributed system that uses a novel session-oriented modelfor data cube exploration, designed to provide the user withinteractive sub-second latencies for specified accuracy levels.A novel framework is provided that combines three concepts:faceted exploration of data cubes, speculative execution of queriesand query execution over subsets of data. We discuss designconsiderations, implementation details and optimizations of oursystem. Experiments demonstrate that DICE provides a sub-second interactive cube exploration experience at the billion-tuplescale that is at least 33% faster than current approaches.
I. INTRODUCTION
Large-scale analytics has found a growing number of usecases in a variety of disciplines, from business to the sciences.With the rapid rise in data, and the reliance on data-driveninsights for decision making, planning and analysis, the roleof analytics over massive datasets has become a critical one.
With the proliferation of large-scale data infrastructure, itis not uncommon for end-users to expect direct fine-grainedcontrol over large amounts of data. The availability of bothdedicated and dynamically provisioned distributed computa-tional resources allows analyses that were typically handledby database administrators to be performed by the end-usersof the analyses themselves. Further, there is an increasingdemand in real-time or near-real-time analytics, where allanalysis is performed on in-situ data, such as constantly-updating logs that are being appended to in a batched manner.As detailed in the following paragraphs, despite the availabilityof performant, distributed and scalable infrastructure, thereexist several challenges to large-scale analytics.
In addition to the typical use cases of reporting, wherepredetermined query templates are run over batches of newincoming data, and mining, where data is analyzed to discoverinteresting patterns of information, there has been a sharprise in the demand for ad-hoc analytics, exposed to the userover interfaces for business intelligence, interactive dashboardsand advanced domain-specific data-driven applications. Thesechallenges are exacerbated in the scope of ad-hoc analysis overa CUBE representation [19] of the data. Such a representationis useful for the purpose of exploratory data analysis, sincesuccessive investigatory questions can be answered in the formof drilldown or rollup queries.
Data cube exploration is often expected to be interactive –queries need to be responded to within a small latency bound.
Studies in human-computer interaction [36], [47] establishguidelines and demonstrate the functional and economic valueof rapid response times, heavily motivating a sub-1000 ms (i.e.sub-second) threshold for the database to respond to the user.For our system, we empirically observed that latencies of up to1000 ms were perceived as fluid, and it took around 5000 msfor the user to view and react to the query results.
A. Common Approaches
Intuitively, the simplest approach to ensuring fast, interac-tive cube exploration is to materialize the entire data cubesuch that each query to the cube is simply a lookup from amain memory cache. While such a setup will perform withinthe latency bounds we are subject to, we are constrained byscale: a fully materialized cube can be several multiples ofthe original dataset, which typically is larger than availablememory. Further, such a strategy does not work in the case ofad-hoc (e.g. computed) dimensions or if the user is inspectinga new measure. Thus, an often-used approach is to executethe query over an offline computed sample of the data [2],[10], [32], [54]. However, this approach cannot accommodatechanges in the underlying data. The techniques described inour paper are complementary to such an approach and caneasily be adapted, if needed, to accommodate offline sampling.Online aggregation approaches have also been studied [24],but require a significant overhaul of the entire query processinginfrastructure. Further related work is provided in Section V.
This paper introduces DICE, a system that proposes asession-oriented approach to data cube exploration that catersto the challenges observed. In contrast to existing OLAPsystems, our system is designed keeping in mind the user’sflow, surfacing approximate results within interactive latencies.
Contributions:• We introduce DICE, a distributed system that allows explo-ration of 1-billion-tuple data cubes at sub-second levels.•We provide a principled cost-based framework that combinestwo complementary techniques: speculative query executionand online data sampling to achieve interactive latencies forcube exploration in a distributed framework.• To bound the space of possible speculative queries, wepropose a faceted cube exploration model that considerssuccessive queries as part of a query session.• We share insights into the design and implementation of oursystem based on real-world query logs, user studies anddetailed performance evaluations.
facet query
result
More'Dimensions'
analytics frontends
facet traversals
UI actions Sampling Rate
slave1
DB
slave3
DB
slaveN
DB
Result Cache
Master
Network
slave2
DB
Workers
Query Federa1on
(result = measure & std dev)
Sample Aggrega1on
Specula1ve Query Execu1on
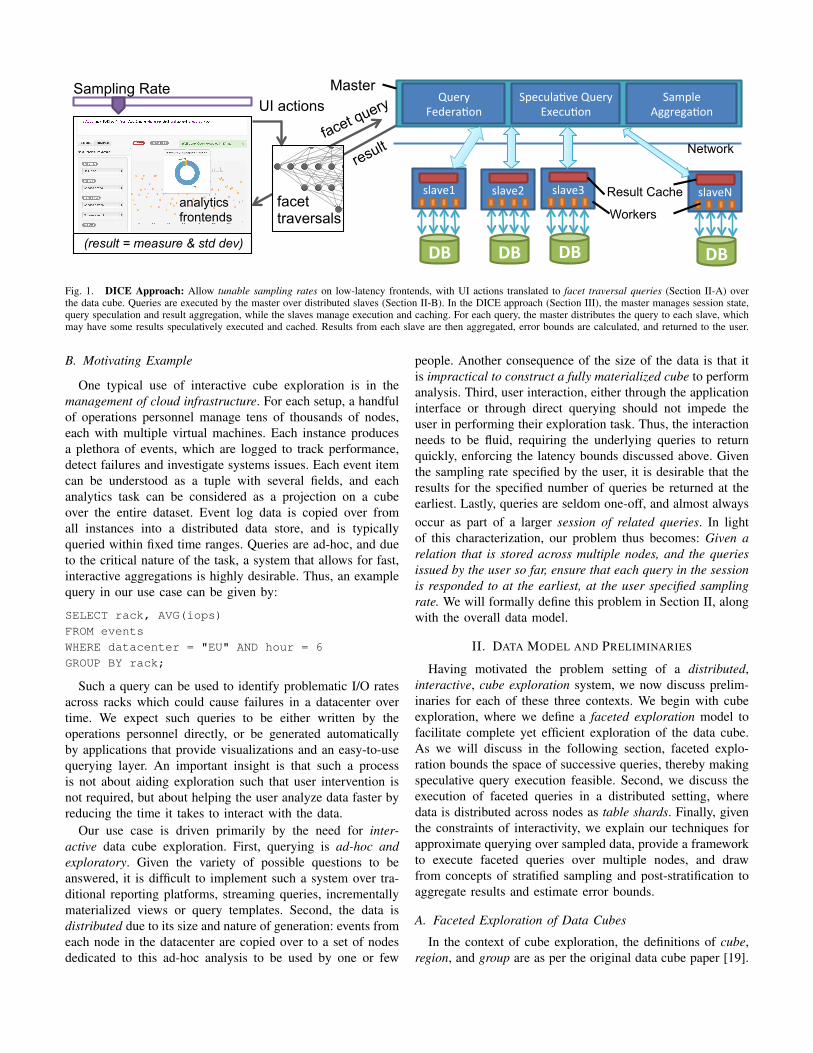
Fig. 1. DICE Approach: Allow tunable sampling rates on low-latency frontends, with UI actions translated to facet traversal queries (Section II-A) overthe data cube. Queries are executed by the master over distributed slaves (Section II-B). In the DICE approach (Section III), the master manages session state,query speculation and result aggregation, while the slaves manage execution and caching. For each query, the master distributes the query to each slave, whichmay have some results speculatively executed and cached. Results from each slave are then aggregated, error bounds are calculated, and returned to the user.
B. Motivating Example
One typical use of interactive cube exploration is in themanagement of cloud infrastructure. For each setup, a handfulof operations personnel manage tens of thousands of nodes,each with multiple virtual machines. Each instance producesa plethora of events, which are logged to track performance,detect failures and investigate systems issues. Each event itemcan be understood as a tuple with several fields, and eachanalytics task can be considered as a projection on a cubeover the entire dataset. Event log data is copied over fromall instances into a distributed data store, and is typicallyqueried within fixed time ranges. Queries are ad-hoc, and dueto the critical nature of the task, a system that allows for fast,interactive aggregations is highly desirable. Thus, an examplequery in our use case can be given by:
SELECT rack, AVG(iops)
FROM events
WHERE datacenter = "EU" AND hour = 6
GROUP BY rack;
Such a query can be used to identify problematic I/O ratesacross racks which could cause failures in a datacenter overtime. We expect such queries to be either written by theoperations personnel directly, or be generated automaticallyby applications that provide visualizations and an easy-to-usequerying layer. An important insight is that such a processis not about aiding exploration such that user intervention isnot required, but about helping the user analyze data faster byreducing the time it takes to interact with the data.
Our use case is driven primarily by the need for inter-active data cube exploration. First, querying is ad-hoc andexploratory. Given the variety of possible questions to beanswered, it is difficult to implement such a system over tra-ditional reporting platforms, streaming queries, incrementallymaterialized views or query templates. Second, the data isdistributed due to its size and nature of generation: events fromeach node in the datacenter are copied over to a set of nodesdedicated to this ad-hoc analysis to be used by one or few
people. Another consequence of the size of the data is that itis impractical to construct a fully materialized cube to performanalysis. Third, user interaction, either through the applicationinterface or through direct querying should not impede theuser in performing their exploration task. Thus, the interactionneeds to be fluid, requiring the underlying queries to returnquickly, enforcing the latency bounds discussed above. Giventhe sampling rate specified by the user, it is desirable that theresults for the specified number of queries be returned at theearliest. Lastly, queries are seldom one-off, and almost alwaysoccur as part of a larger session of related queries. In lightof this characterization, our problem thus becomes: Given arelation that is stored across multiple nodes, and the queriesissued by the user so far, ensure that each query in the sessionis responded to at the earliest, at the user specified samplingrate. We will formally define this problem in Section II, alongwith the overall data model.
II. DATA MODEL AND PRELIMINARIES
Having motivated the problem setting of a distributed,interactive, cube exploration system, we now discuss prelim-inaries for each of these three contexts. We begin with cubeexploration, where we define a faceted exploration model tofacilitate complete yet efficient exploration of the data cube.As we will discuss in the following section, faceted explo-ration bounds the space of successive queries, thereby makingspeculative query execution feasible. Second, we discuss theexecution of faceted queries in a distributed setting, wheredata is distributed across nodes as table shards. Finally, giventhe constraints of interactivity, we explain our techniques forapproximate querying over sampled data, provide a frameworkto execute faceted queries over multiple nodes, and drawfrom concepts of stratified sampling and post-stratification toaggregate results and estimate error bounds.
A. Faceted Exploration of Data Cubes
In the context of cube exploration, the definitions of cube,region, and group are as per the original data cube paper [19].
A region denotes a node in the cube lattice and a group denotestuples with the same values of attributes for that region. For ex-ample, one of the groups in the region {datacenter,month}is {EU,January} for the cube derived from the motivatingexample. We continue with our motivating example, usingthe following schema: Database table events catalogs all thesystem events across the cluster and has three dimensions, twoof which are hierarchical:location[zone:datacenter:rack], time[month:week:hour], iops
Challenges in Exploration: As a user exploring a data cube,the number of possible parts of the cube to explore (i.e. cubegroups) is very large, and thus, exploration can be unwieldy. Tothis end, we introduce the faceted model of cube exploration,which simplifies cube exploration into a set of facet traversals,as described below. As we will see in the following section,the faceted model drastically reduces the space of possiblecube exploration and simplifies speculative query execution,which is essential to the DICE architecture.
a,b
b a
*
sibling
pivot
parent
child
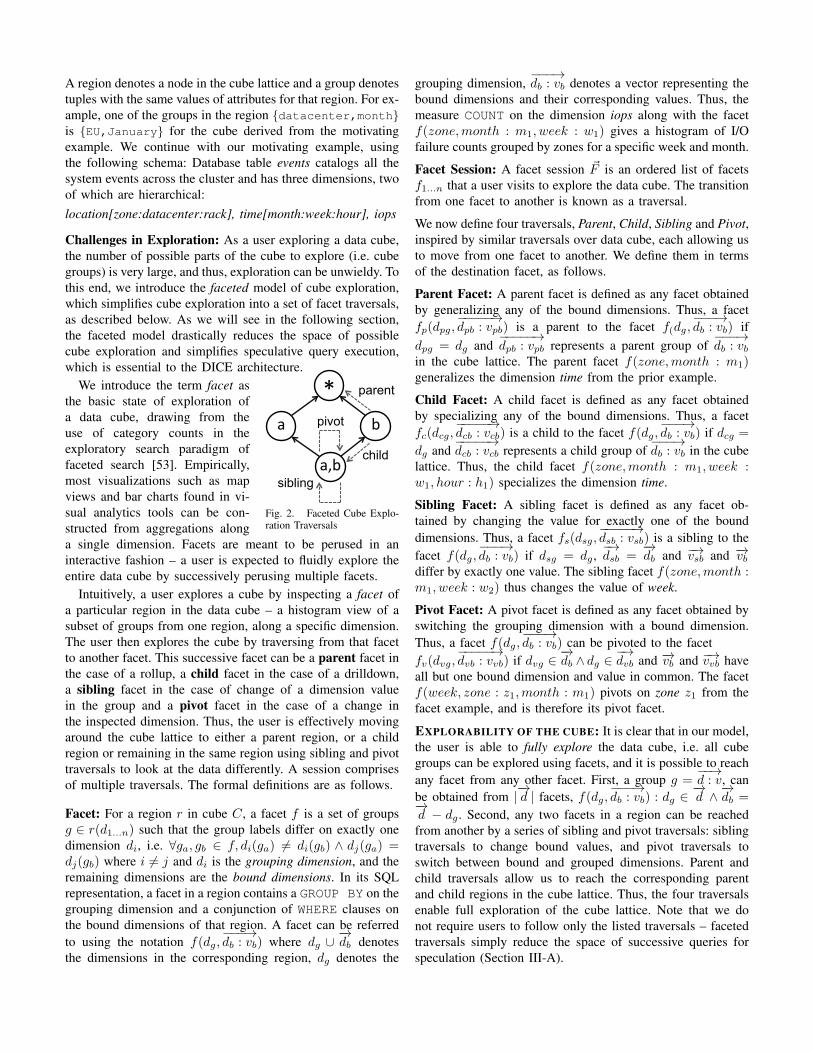
Fig. 2. Faceted Cube Explo-ration Traversals
We introduce the term facet asthe basic state of exploration ofa data cube, drawing from theuse of category counts in theexploratory search paradigm offaceted search [53]. Empirically,most visualizations such as mapviews and bar charts found in vi-sual analytics tools can be con-structed from aggregations alonga single dimension. Facets are meant to be perused in aninteractive fashion – a user is expected to fluidly explore theentire data cube by successively perusing multiple facets.
Intuitively, a user explores a cube by inspecting a facet ofa particular region in the data cube – a histogram view of asubset of groups from one region, along a specific dimension.The user then explores the cube by traversing from that facetto another facet. This successive facet can be a parent facet inthe case of a rollup, a child facet in the case of a drilldown,a sibling facet in the case of change of a dimension valuein the group and a pivot facet in the case of a change inthe inspected dimension. Thus, the user is effectively movingaround the cube lattice to either a parent region, or a childregion or remaining in the same region using sibling and pivottraversals to look at the data differently. A session comprisesof multiple traversals. The formal definitions are as follows.
Facet: For a region r in cube C, a facet f is a set of groupsg ∈ r(d1...n) such that the group labels differ on exactly onedimension di, i.e. ∀ga, gb ∈ f, di(ga) 6= di(gb) ∧ dj(ga) =dj(gb) where i 6= j and di is the grouping dimension, and theremaining dimensions are the bound dimensions. In its SQLrepresentation, a facet in a region contains a GROUP BY on thegrouping dimension and a conjunction of WHERE clauses onthe bound dimensions of that region. A facet can be referredto using the notation f(dg,
−−−→db : vb) where dg ∪
−→db denotes
the dimensions in the corresponding region, dg denotes the
grouping dimension,−−−→db : vb denotes a vector representing the
bound dimensions and their corresponding values. Thus, themeasure COUNT on the dimension iops along with the facetf(zone,month : m1, week : w1) gives a histogram of I/Ofailure counts grouped by zones for a specific week and month.
Facet Session: A facet session ~F is an ordered list of facetsf1...n that a user visits to explore the data cube. The transitionfrom one facet to another is known as a traversal.
We now define four traversals, Parent, Child, Sibling and Pivot,inspired by similar traversals over data cube, each allowing usto move from one facet to another. We define them in termsof the destination facet, as follows.
Parent Facet: A parent facet is defined as any facet obtainedby generalizing any of the bound dimensions. Thus, a facetfp(dpg,
−−−−−→dpb : vpb) is a parent to the facet f(dg,
−−−→db : vb) if
dpg = dg and−−−−−→dpb : vpb represents a parent group of
−−−→db : vb
in the cube lattice. The parent facet f(zone,month : m1)generalizes the dimension time from the prior example.
Child Facet: A child facet is defined as any facet obtainedby specializing any of the bound dimensions. Thus, a facetfc(dcg,
−−−−−→dcb : vcb) is a child to the facet f(dg,
−−−→db : vb) if dcg =
dg and−−−−−→dcb : vcb represents a child group of
−−−→db : vb in the cube
lattice. Thus, the child facet f(zone,month : m1, week :w1, hour : h1) specializes the dimension time.
Sibling Facet: A sibling facet is defined as any facet ob-tained by changing the value for exactly one of the bounddimensions. Thus, a facet fs(dsg,
−−−−−→dsb : vsb) is a sibling to the
facet f(dg,−−−→db : vb) if dsg = dg ,
−→dsb =
−→db and −→vsb and −→vb
differ by exactly one value. The sibling facet f(zone,month :m1, week : w2) thus changes the value of week.
Pivot Facet: A pivot facet is defined as any facet obtained byswitching the grouping dimension with a bound dimension.Thus, a facet f(dg,
−−−→db : vb) can be pivoted to the facet
fv(dvg,−−−−−→dvb : vvb) if dvg ∈
−→db ∧ dg ∈
−→dvb and −→vb and −→vvb have
all but one bound dimension and value in common. The facetf(week, zone : z1,month : m1) pivots on zone z1 from thefacet example, and is therefore its pivot facet.
EXPLORABILITY OF THE CUBE: It is clear that in our model,the user is able to fully explore the data cube, i.e. all cubegroups can be explored using facets, and it is possible to reachany facet from any other facet. First, a group g =
−−→d : v, can
be obtained from |−→d | facets, f(dg,
−−−→db : vb) : dg ∈
−→d ∧−→db =−→
d − dg . Second, any two facets in a region can be reachedfrom another by a series of sibling and pivot traversals: siblingtraversals to change bound values, and pivot traversals toswitch between bound and grouped dimensions. Parent andchild traversals allow us to reach the corresponding parentand child regions in the cube lattice. Thus, the four traversalsenable full exploration of the cube lattice. Note that we donot require users to follow only the listed traversals – facetedtraversals simply reduce the space of successive queries forspeculation (Section III-A).
EFFECTIVENESS OF FACETED MODEL: The four traversalsmentioned above are both intuitive and sufficient to explorethe entire data cube. The parent, child and pivot traversals areinspired by rollup, drilldown and pivot operations respectively.It is always possible to add more traversal types, especiallyby mining a user’s query history for common “patterns”of analysis, e.g. keeping the bound dimensions the sameand changing the group by dimension. Such extensions areeasily pluggable into our system, but not required – the fourtraversals described above are intuitive and powerful enough totraverse the cube. We quantify the applicability of our modelon real-world query logs and measure user satisfactionusing a user study, described in Section IV-C.
B. Distributed Execution
The interactive nature of our use case necessitates theapproximation of results by executing queries over a subsetof the data. We use sharded tables to achieve distributedand sampled execution of queries. A sharded table containsa subset of the rows of a SQL table and the concatenationof all shards across nodes is equivalent to the entire dataset.Each node may contain multiple shards. A sharded table is theatomic unit of data in our system: updates are performed atthe granularity of the shard level, and each session makes theassumption that the list of shards and the shards themselvesdo not change.
C. Querying over Table Shards
A sample of the data is constructed online by choosingrandom table shards during run-time, allowing for randomsampling. We use standard sampling concepts of stratifiedsampling [13] and post-stratification [13] for estimating theerror bounds. Details on our use of sampling methods areprovided in the appendix.
Given the preliminaries and definitions, in the naive case,the problem of ad-hoc cube exploration using the facet ex-ploration model is simply that of successively executing eachquery received at a given sampling rate. We formulate ourproblem as the following:
For a facet session ~F , where each ad-hoc facet query fiis expected to execute at a certain sampling rate, and theexpected time between the termination of one facet query andthe start of the next ad-hoc facet query (i.e., the time taken toview the results of the prior query) is τV , return fi as quicklyas possible to the end-user, preferably within the interactivethreshold τI .
Accuracy Gain Heuristic: In order to schedule speculativequeries at different sampling rates, we need to know the reduc-tion in sampling error at different sampling rates. However, itcannot be known before actually sampling the data. Therefore,we construct a heuristic based on the consistency property ofMaximum Likelihood Estimation (MLE), ||θ∗ − θ|| = O( 1√
n)
where θ∗ is the current estimate, θ is the true value and n isthe current sampling rate, which informs us that the differencebetween our estimate and the true value will be inversely
proportional to the square root of the current sampling rate.Therefore, we can estimate the future gain in accuracy basedon the sampling rate. Thus, the estimated gain in the accuracydue to a unit sampling rate increase can be given as
AccuracyGain(Rcurr) = c ∗ (1√Rcurr
− 1√Rcurr + 1
) (1)
where Rcurr is the current sampling rate and c is the constantfrom the proportionality heuristic.
With more time permissible, we issue the same query onmultiple tables on multiple nodes progressively giving usa smaller standard error for the estimators. Our goal thenduring speculative execution of the queries is to increase thelikelihood that the next user query would be cached at a highersampling rate allowing us to retrieve the results at the desiredsampling rate at the earliest. We cast this to fit the DICEframework in the following section.
III. THE DICE SYSTEM
A. Speculating Queries in a SessionA crucial insight to ad-hoc querying is that queries oc-
cur in sessions. Thus, it is prudent to think of improvingquery performance holistically at the session level. A sessioncomprises several ad-hoc queries, each of which requires low-latency responses. The result for each query is inspected bythe user for a small amount of time, after which the nextquery is issued. We consider this as a hidden opportunity –the database is simply waiting on the user to issue the nextquery. In light of this, our solution is to utilize this waitingtime to speculate, execute and cache the most likely followupqueries at the highest quality possible. While the concept ofspeculative execution is an intuitive one, there are severalchallenges to implementing it over a distributed, approximatequerying environment – especially in the context of data cubeexploration. The challenges comprise a host of interdependentproblems: What are the most likely followup queries? What isthe strategy to employ to execute and cache likely queries? Ina sampling approach, what is the highest sampling rate to runa speculative query at, given interactive constraints? Finally,is there a singular framework to combine these problems intoa cohesive, unified system?
Given these challenges, we present the DICE system thatsolves the problem by using three complementary strategies.First, it performs speculative query execution, by cachingresults of likely followup queries, allowing for reduced laten-cies for ad-hoc query sessions. The enumeration of the likelyfollowup queries is made possible by the faceted model ofdata cube exploration described in Section II. Second, DICEemploys a novel architecture of query execution over a dis-tributed database, executing queries piecemeal over individualtable shards and then assembling them in a post-processingstep. This novel architecture in turn allows for bounded-timeexecution of queries ensuring interactive latencies. Third, itemploys a cost-based model for the prioritized execution ofspeculative queries such that likely queries are executed athigher sampling rates.

B. System Architecture
The architecture of our system employs a hierarchicalmaster-slave approach, such that all queries are issued to themaster, and responded to by the master. In line with thesetting described in Section II-B, each slave manages multipletable shards. Each shard is atomic and read-only, and isimplemented as a table in a commodity relational database.The catalog of shards across all slave nodes is maintainedat the master. For a single exploration session, the catalog isused to ensure that the list of shards addressed is constant. Theslaves maintain an in-memory LRU cache for the results. In afast-changing database, table shards can be atomically addedand deleted from the slaves, and the master’s catalog can beupdated, allowing for querying over rapidly changing data.
C. Query Flow
The high-level query flow of DICE is as follows: eachad-hoc query is rewritten and federated to the slave nodes,where it is executed. The results are returned, aggregated andpresented to the user, along with the accuracy of the query.Upon success, a set of speculative queries is executed tillthe next user query is received, with the goal of increasingthe likelihood of caching as many of the future queries aspossible. When the successive ad-hoc query is issued, it isagain rewritten and federated, with the hope that its resultsare cached at the slaves at a high sampling rate, thus reducingthe latency of the overall ad-hoc query.
User Query: At startup, the master makes sure that allthe slaves are running and ready to accept queries. Onreceiving an ad-hoc query, the query is rewritten into multiplequeries, one per required random table shard and passed toeach slave. Since data is horizontally distributed across allslave nodes, the query itself is identical, with the exceptionof id of the table shard addressed. On completion of anad-hoc query (or if the results of the query were alreadyin the cache), each slave returns the results back to themaster, where the results are aggregated, and error calculationperformed, and this information presented to the user.
Speculative Queries: Upon completion of the ad-hocquery, the master immediately schedules a list of speculativequeries that can be issued by the user. While the space ofpossible queries is unbounded, we restrict our speculationsusing faceted exploration framework; thus allowing the listof possible queries to be enumerable. Speculated queries arethen ranked (as discussed in the following subsection), anddistributed amongst the slaves in a round-robin fashion. Eachslave issues, in an increasing order of rank, a predefinednumber of concurrent queries to its database and populatesthe results in its cache (speculative query results are not sentto the master). Upon receiving the next user query, the slavekills all currently running speculative queries.
Successive User Query: When the next ad-hoc queryarrives, it is again rewritten and federated to the slaves. If
the exact query or a unified query (refer to Section III-F) iscached, the result of the ad-hoc query is materialized fromthe cached result. If it is not cached it is then executed onthe database. The caching of speculated queries drasticallyimpacts ad-hoc query latency and allows for a fluid andinteractive data cube exploration experience.
D. Prioritizing Speculative Queries
As is clear from the query flow and the faceted model,each ad-hoc query can yield significantly large number ofspeculative queries. Given the bounded time available for exe-cution, it is typically not possible to execute all the speculativequeries. Thus, it is necessary to prioritize speculative queryexecution such that it maximizes the likelihood of results forthe successive query being returned from the cache. This canin turn be done by maximizing the overall gain in accuracy, asdiscussed in Section II-C. The selection of the maximal subsetcan be modeled as a linear integer programming problem asfollows:
MAXIMIZE:∑
q∈Q Prob(q) ·AccuracyGain(SR) · xqSUBJECT TO:
∑q∈Q Time(q) · xq <= totalSpecT ime
WHERE: xq ∈ {0, 1}.
Here, Prob(q) gives the probability of a query q, whichshould be obtained from the query logs, Q is the set of allspeculative queries at all sampling rates, AccuracyGain(SR)is the estimated gain in sampling accuracy which dependson the sampling rate SR of q as described in Section II-C,Time(q) is the estimated running time and totalSpecT imeis the expected total speculative time.
Considering the input parameters, it is not possible to solvethe above optimization problem in sub-second latency thuspreventing us from returning results within those latencies. Weexpect the majority of the query execution cost to be typicallydue to an in-memory table scan over identically sized dataif the table shards are pre-loaded in the memory. It is notpossible to load the entire dataset into memory but definitelya significant fraction which in our experiments was up to 20%such that the error bars for most of the groups were small.This lets us assume unit execution time for each query overa shard. In that case, it is clear that choosing the query thatyields the maximum of the product of the probability of aquery and the estimated accuracy gain for the correspondingsampling rate is the best decision. Therefore, the solution to theproblem of choosing of the best queries that yield the highestoverall accuracy gain turns into a greedy selection problem,the algorithm to which we provide in the following section.
Greedy Approach: The greedy cost-based approach priori-tizes the execution of the most likely queries that providethe highest overall accuracy gains. We represent the scoreof a query q at the sampling rate of SR as Prob(q) ·AccuracyGain(SR).
In the case of multi-query optimizations such as unifica-tion (described in Section III-F), where multiple queries aregrouped together into a unified query Q = q1..n, the scorecan be represented as
∑q∈Q Prob(q) ·AccuracyGain(q).
Queries are run greedily on the worker nodes in descendingorder of the score. Since worker nodes are capable of bounded-time execution and each query runs in a time lesser than theview latency threshold due to the small size of the table shard,this approach proves to be a viable strategy and successfullyprovides for sub-second latencies, as observed in Section IV.
In the case of sibling traversals for ordinal dimensions,a user is more likely to choose the changed bound dimen-sion value closer to the current value. We use a heuristicthat the distribution of the probability of the value thatthe changing dimension in the where predicate takes canbe given as P (newV al) = O( 1
||newV al−oldV al||2 ). Let theset of speculative sibling queries and their probabilities beSQ = {SQ1...n} and P = {P1...n} respectively. We re-distribute the sum of these probabilities between queries inSQ as P (x) = 1
c∗(x−oldV al)2 where c is the normalizationconstant given by
∑y∈Υ
1(y−oldV al)2 where Υ is the domain of
the changing dimension. Using query logs, user behavior canbe modeled using the above distribution as the prior.
E. The DICE Algorithm
We are now able to illustrate both the overall model of thesystem (Algorithm 1) and the DICE algorithm (Algorithm 2).
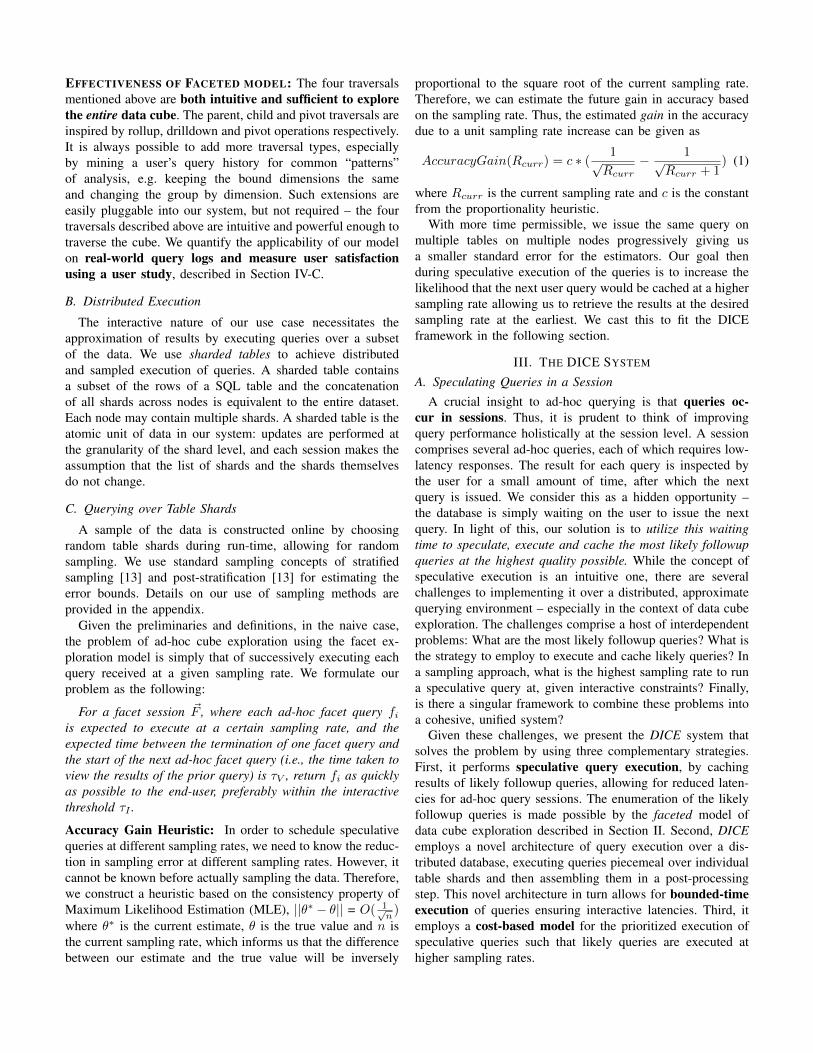
EXPLORE(User u)1 //CF : Current Facet2 CF = null3 while True4 do5 Query q ← TRAVERSE(u,CF )6 Results r ← EXEC(q)7 QSpec ← ENUMERATE-SPEC(q)8 PSpec ← DICE-PLAN-DETERMINE(QSpec, CF )9 for each node n, queries Q in PSpec
10 do //parallel loop till next user query11 NODE-EXEC-ALL(n,Q)
Algorithm 1: Core Exploration Loop
DICE-PLAN-DETERMINE(QSpec, CF )1 PSpec ← GET-SPEC-PROBABILITIES(QSpec)2 PSSpec ← SIBLING-ADJUSTMENT(PSpec, CF )3 Accuracy Gains← GENERATE-ACCURACY-GAINS-VECTOR()4 Unified Queries← QUERY-UNIFICATION(QSpec)5 PUnified Queries ← {}6 for each UQ in Unified Queries7 do8 PUQ ←
∑Q∈UQ PSSpec(Q)
9 Unified Accuracies = Unified Queries ×10 Accuracy Gains11 DESC-SORT(Unified Accuracies)12 return Unified Accuracies
Algorithm 2: DICE Execution Strategy
Algorithm 1 (Core Exploration Loop) describes the overallDICE cube exploration system. A user first selects a query(Line 5) which is then executed (Line 6). The system then
enumerates all the different possible speculative queries basedon the cube exploration model described earlier (Line 7) andranks them (Line 8). It then distributes the workload acrossall the available nodes (Lines 9−−11). Next, in Algorithm 2,we formally describe how DICE ranks the speculative queriesat different sampling rates.
Algorithm 2 (DICE Execution Strategy) starts by firstfinding out the normalized probabilities Pspec given a set ofspeculative queries (Line 1), and reweighting probabilities ofthe sibling queries as described in Section III-D (Line 2). Next,it generates the vector of the estimated accuracy gains for allsampling rates (Line 3) and then performs unification over allthe speculative queries (Line 4) as given in Section III-F.Finally, it ranks the unified queries at different sampling ratesby the product of their probabilities and their correspondingsampling rate accuracy gains (Lines 5−−11) and returns thesorted queries (Line 12).
F. Optimization: Query Unification
We now detail unification, a technique to speed up query ex-ecution. For each traversal, the number of speculative queriesgiven the current facet f(dg,
−−−→db : vb), in the worst case is:
NumParent = |−→db |
NumChild =∑
dim∈{Dimensions}−{−→db,dg}
Cardinality(dim)
NumSibling =∑
dim∈−→dbCardinality(dim)− |
−→db |
NumPivot = Cardinality(dg) ∗ |−→db |
Consequently, one can infer that the total number of specu-lative queries could be greater than the sum of the cardinalitiesof all the dimensions. Further, taking replication of queries dueto usage of table shards results into consideration, the totalnumber of speculative queries is equal to the product of thenumber of table shards and the number of distinct speculativequeries. Hence, it is not feasible to run all the speculativequeries for most real-world datasets at high sampling rateswithin interactive time bounds.
We can observe that the generation of speculative queriesleads to several queries that differ only by the value ofa single bound dimension. Unifying multiple such queriesinto a lesser number of queries becomes essential sinceconcurrently running all of them will congest the system.We have used two techniques of minimizing the number ofqueries by unification. The first is to unify WHERE clauses ona column into a GROUP BY on the column, and the secondis to split a dimension’s domain into ranges, and issuingrange-based queries. The results of these unified queries canbe post-processed to extract results for the user query.
Groupby Based Unification: Multiple queries can beunified into a single query by replacing the bound dimensionthat takes multiple values by a GROUP BY on the samedimension when the cardinality of a dimension is moderatelyhigh (i.e. above a set threshold). This unification leads tothe following speculative queries for the current user facetf(dg,
−−−→db : vb) in a cube of dimensions
−→d :

Parent− Set = {∀di; di ∈−→db : f(dg,
−−−→db : vb − di : vi)}
Sibling − Set = {∀di; di ∈−→db : f(dg, di,
−−−→db : vb − di : vi)}
Pivot− Set = {∀di; di ∈−→db : f(dg, di,
−−−→db : vb − di : vi)}
Child− Set = {∀di; di ∈−→d −−→db : f(dg, di,
−−−→db : vb)}
The sibling and pivot queries thus generated are identical.One can also notice that a parent query f(dg,
−−−→db : vb−di : vi)
can be answered by the corresponding sibling/pivot queryf(dg, di,
−−−→db : vb − di : vi) where di : vi ∈
−−−→db : vb. Thus,
groupby-based unification leads to an enormous reductionin possible queries needed to be run. However, the resultsfor the next query would need to be retrieved from thenew unified query’s result set, and this post-processingmay be expensive. Typically, groupby unification is useful,specifically for moderately high (thresholds set empirically)cardinality dimensions. There is, clearly, a tradeoff betweenrunning a large number of non-unified queries, and a singleunified query with a large result set.
Range Based Unification:At very high cardinalities, the problem of the very high num-
ber of speculative queries is not resolved by the groupby-basedunification since the result set is expected to be large. Unifyingthe queries into ranges was found to be extremely useful.We convert multiple speculative queries f(dg,
−−−−−−→db : v1..vn) into
fewer range-based speculative queries f(dg,−−−−−−−−→db : [v1..vn1)),
f(dg,−−−−−−−−−→db : [vn1
..vn2)) .. f(dg,
−−−−−−−−−−−→db : [vnk−1
..vnk ]). The choicebetween range-based and groupby-based unification dependson the column cardinality and is a tunable parameter. Thisparameter can be obtained empirically using the marginaldistribution of the column and the prior workload.
An interesting observation with range queries is that evenwith careful tuning of the ranges, the cardinality of the data foreach range-unified query is large enough to motivate the useof an index on range-unified columns. Thus, we only indexdimensions with very high cardinalities. While this introducesvariability into our cost model, the lack of a good determinerfor the cost of a range-unified query and aforementioned lackof a fast solution to our linear integer programming problemcompels us to invoke Occam’s Razor and use a unit cost in thiscase and the resultant greedy algorithm for query selection.
G. Optimality of DICE
As described in Sections III-D and III-F, we cast thelinear integer programming problem of maximizing the overallaccuracy under the constraint of maximum allocated time intoa greedy algorithm of choosing the new query at an additionalunit sampling rate. Also, as mentioned earlier in Section II-C,we would not know the accuracy gain without actually runningthe query. Thus, approximating the gain using the estimatedaccuracy gain based on the MLE Consistency property is asound assumption to make. Therefore, the DICE algorithm ofchoosing a new query with the highest product of probabilityfrom the workload and the estimated accuracy gain at thenewer sampling rate will indeed be the optimal strategy.
IV. EXPERIMENTS AND EVALUATION
A. Experimental Setup
DICE is implemented in Java running on Sun Java 6 VMsand uses PostgreSQL 9.1 as the database for each slave node.By default, we discard the first run of each experiment andreport the average of the following three runs (runs were nearlyidentical for all experiments, with no outliers, also observed bythe low standard deviation). We perform an exhaustive analysisof the DICE system over a variety of cluster configurations,workloads and algorithms for our metrics, as described below.
Cluster Configurations: CLUSTERSMALL is a private clusterbuilt on commodity hardware with only DICE runningduring the experiments. The master node has 1 Quad Core3.30GHz Intel i5 CPU, 16GB DDR3 RAM @1333MHz &256GB SATA HDD and the 15 slave nodes each possess 1Quad Core 2.13GHz Intel Xeon CPU, 4GB DDR2 RAM@667MHz & 720GB SATA HDD. Nodes are connected overa Gigabit Ethernet switch. Each slave contains 4 workers.CLUSTERCLOUD is an Amazon EC2 configuration of 1master and 50 slaves of the c1.xlarge type, each with7GB Memory and 8 Virtual cores, powering 8 workers perslave node. All nodes for both configurations run UbuntuLinux 12.04 LTS.
Dataset: Our generated dataset conforms to the exampleschema provided in Section I, and comprises 1 billion rowssharded uniformly across all nodes with a default table shardsize of 1M rows. The distributions and cardinalities are:location[uniform]:[zone{10}:datacenter{100}:rack{1000}],time[gaussian]:[month{12}:week{52}:hour{24}] andiops[zipfian]:{10000}.Each table shard is 102MB on disk, with a data size of 81MBand index size of 21MB, yielding in a total of 1000 tableshards spanning 100GB. Unless otherwise specified, we runexperiments at 20% sampling rate i.e., 200 million rows areactually processed. 1
Workloads: The user was asked to explore the datasettaking into consideration the faceted exploration model usinga popular BI tool. Query logs from the tool were used toderive the workload. A workload depicts a user query sessionof 10 facet traversals, with the measure function AVG. Unlessstated, 3 workloads were used for each experiment and withthe aforementioned 3 runs, results into a sample size of 90queries. The viewing latency threshold τV is fixed to 5000ms.
Algorithms: We compare five different algorithms:ALGONOSPEC stands for “No Speculation” and representsthe baseline use case, i.e. ad-hoc distributed querying withoutany speculation, similar in design to modern distributed queryexecution engines. ALGORANDOM represents distributedquerying using query speculation, but the queries chosen to
1It should be noted that due to the variability of schema, row / columnarstorage layouts and hardware performance, our focus is on the number ofrows processed, and not the disk representation.
be speculated are selected randomly from the set of possiblefacet traversals. ALGOUNIFORM selects speculative queriesuniformly from each type of facet traversal. ALGODICEuses the DICE speculative query selection technique.ALGOPERFECT “improves” upon DICE by allowing for aperfect prediction of the subsequent ad-hoc query – thisrepresents the (hypothetical) best-case performance of ourspeculation strategy, and is included to demonstrate theoverall potential of speculative caching.
Metrics: AVERAGE LATENCY is measured in milliseconds asthe average latency of a query across sessions and runs. Wealso depict ±1 standard deviation of latency using error barsin most of our results. AVERAGE ACCURACY is measured asthe absolute percentage deviation of the sampled results fromthe results over the entire dataset.
B. Results
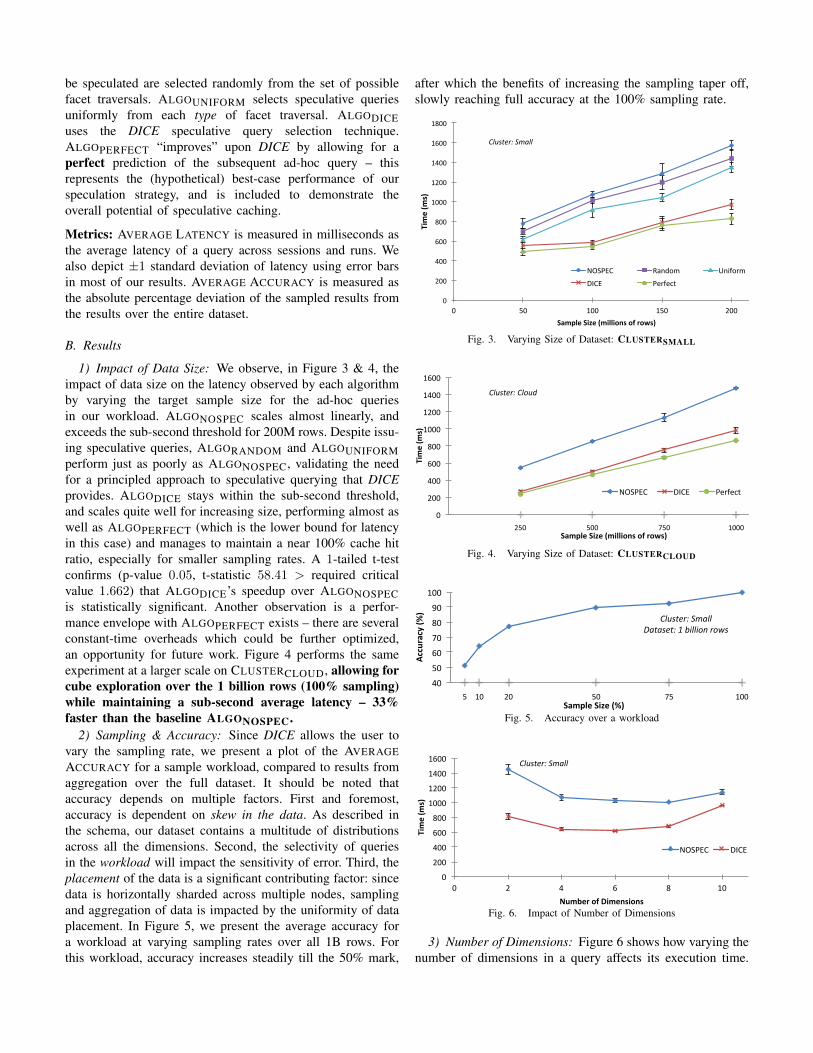
1) Impact of Data Size: We observe, in Figure 3 & 4, theimpact of data size on the latency observed by each algorithmby varying the target sample size for the ad-hoc queriesin our workload. ALGONOSPEC scales almost linearly, andexceeds the sub-second threshold for 200M rows. Despite issu-ing speculative queries, ALGORANDOM and ALGOUNIFORMperform just as poorly as ALGONOSPEC, validating the needfor a principled approach to speculative querying that DICEprovides. ALGODICE stays within the sub-second threshold,and scales quite well for increasing size, performing almost aswell as ALGOPERFECT (which is the lower bound for latencyin this case) and manages to maintain a near 100% cache hitratio, especially for smaller sampling rates. A 1-tailed t-testconfirms (p-value 0.05, t-statistic 58.41 > required criticalvalue 1.662) that ALGODICE’s speedup over ALGONOSPECis statistically significant. Another observation is a perfor-mance envelope with ALGOPERFECT exists – there are severalconstant-time overheads which could be further optimized,an opportunity for future work. Figure 4 performs the sameexperiment at a larger scale on CLUSTERCLOUD, allowing forcube exploration over the 1 billion rows (100% sampling)while maintaining a sub-second average latency – 33%faster than the baseline ALGONOSPEC.
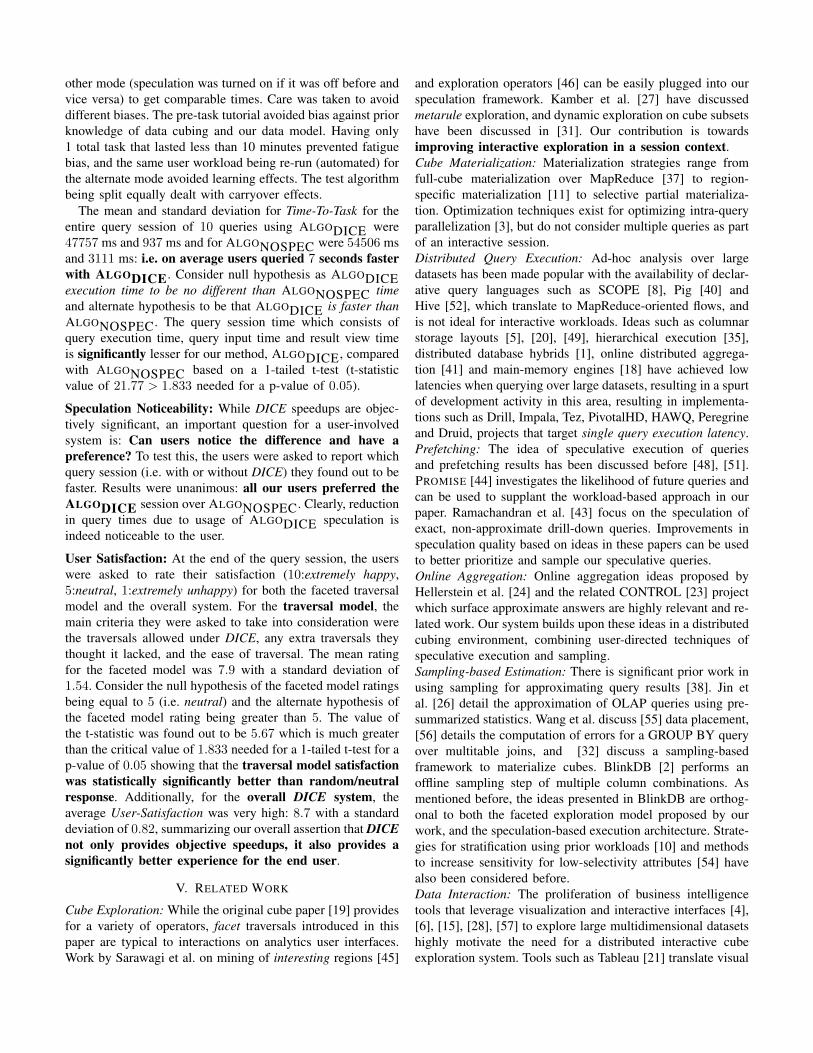
2) Sampling & Accuracy: Since DICE allows the user tovary the sampling rate, we present a plot of the AVERAGEACCURACY for a sample workload, compared to results fromaggregation over the full dataset. It should be noted thataccuracy depends on multiple factors. First and foremost,accuracy is dependent on skew in the data. As described inthe schema, our dataset contains a multitude of distributionsacross all the dimensions. Second, the selectivity of queriesin the workload will impact the sensitivity of error. Third, theplacement of the data is a significant contributing factor: sincedata is horizontally sharded across multiple nodes, samplingand aggregation of data is impacted by the uniformity of dataplacement. In Figure 5, we present the average accuracy fora workload at varying sampling rates over all 1B rows. Forthis workload, accuracy increases steadily till the 50% mark,
after which the benefits of increasing the sampling taper off,slowly reaching full accuracy at the 100% sampling rate.
0"
200"
400"
600"
800"
1000"
1200"
1400"
1600"
1800"
0" 50" 100" 150" 200"
Time%(m
s)%
Sample%Size%(millions%of%rows)%
Cluster:)Small)
NOSPEC" Random" Uniform"
DICE" Perfect"
Fig. 3. Varying Size of Dataset: CLUSTERSMALL
250$ 500$ 750$ 1000$0$
200$
400$
600$
800$
1000$
1200$
1400$
1600$
Time%(m
s)%
Sample%Size%(millions%of%rows)%
Cluster:)Cloud)
NOSPEC$ DICE$ Perfect$
Fig. 4. Varying Size of Dataset: CLUSTERCLOUD
5" 10" 20" 50" 75" 100"40"
50"
60"
70"
80"
90"
100"
Accuracy'(%
)'
Sample'Size'(%)'
Cluster:)Small)Dataset:)1)billion)rows)
Fig. 5. Accuracy over a workload
0"
200"
400"
600"
800"
1000"
1200"
1400"
1600"
0" 2" 4" 6" 8" 10"
Time%(m
s)%
Number%of%Dimensions%
Cluster:)Small)
NOSPEC" DICE"
Fig. 6. Impact of Number of Dimensions
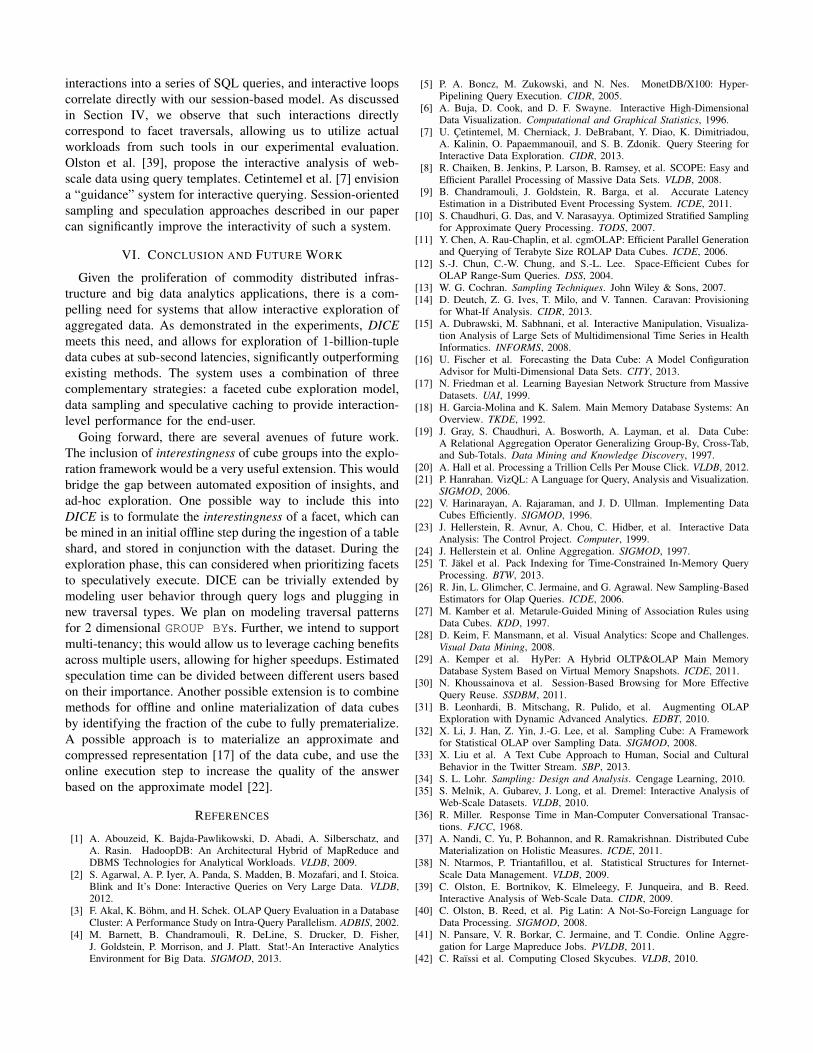
3) Number of Dimensions: Figure 6 shows how varying thenumber of dimensions in a query affects its execution time.

Dimensions are increased by adding new WHERE predicatesto the query. As seen in Figure 6, execution time decreases upto a certain point and then starts increasing. The decreasingslope in the curve is caused by selectivity – as dimensionsare added, less number of rows are processed, allowing forfaster materialization of resultsets. After a certain point, theevaluation cost of the multiple WHERE clauses takes over,especially because the order of filter dimensions is not ideal.
4) Number of Slave Nodes: We vary the number of slavenodes in Figure 7, while keeping the size of the data constant at200M rows. As expected, for all algorithms, latencies decreaseas the number of nodes increases. An interesting observationis made for ALGODICE however – for 4 nodes, DICE thrashesmemory due to the amount of data involved and the numberof speculative queries, which is not a problem for bothALGONOSPEC (no speculation / caching) or ALGOPERFECT(exactly one ad-hoc query being cached).
0"
500"
1000"
1500"
2000"
2500"
3000"
3500"
2" 4" 6" 8" 10" 12" 14" 16"
Time%(m
s)%
Number%of%Nodes%
Cluster:)Small)
NOSPEC"DICE"Perfect"
Fig. 7. Varying the Number of Slave Nodes
40#50#60#70#80#90#100#
0# 50# 100# 150# 200#
Cache&Hit&R
ate&(%
)&
Sample&Size&(millions&of&rows)&
Cluster:)Small)
DICE#
Fig. 8. Cache Hit Change with Sampling Rate Change
5) Cache Hit Variability: Since the cache hit rate is a keycontributor to the average latency of a session, in Figure 8 westudy how the cache hit rate varies with the sampling rate fora fixed cache size. We use the cache hit rate as a proportionalmeasure of the prediction quality. Higher cache hits are a directresult of high quality of speculation. We achieve close to a100% hit rate for 50 million sampled rows. As we increasethe sampling rate, we see the cache hit rate decreasing nearlylinearly, since the total number of speculative queries increaseslinearly with the sampling rate.
6) Sample Session: As an anecdotal example, we presentin Figure 9 the trace of a single cube exploration ses-sion for ALGONOSPEC, ALGODICE and ALGOPERFECT onCLUSTERSMALL. The X axis depicts successive ad-hocqueries in a session. (It should be noted that while the bars arestacked together for convenience for the reader, the session foreach algorithm is executed separately.) The Y axis representsAVERAGE LATENCY. Cache hit rate for ALGODICE is shownas a label above the bars. The cache hit rate for the first query
0"
500"
1000"
1500"
2000"
2500"
3000"
3500"
Time%(m
s)% NOSPEC"
DICE"
Perfect"0 .75 .75 .68
1 1 1
1 .68
.75
Cluster: Small
Fig. 9. Individual Latencies for Anecdotal Query Session
is 0.0, since there has been no speculation and the caches areempty. ALGODICE performs almost as well as ALGOPERFECTwith hit rates equal or closer to 1.0.
7) Impact of Various Techniques: We now study in Fig-ure 10, the performance impact of the various algorithms andoptimizations to our system on the CLUSTERSMALL cluster.We compare the AVERAGE LATENCY of various techniquescompared to ALGONOSPEC. ALGOUNIFORM is slightly fasterdue to some of the speculative queries being part of thesession. Including the unification optimization discussed inSection III-F reduces the number of concurrent queries, im-proving latency. Finally, including the locality model and cost-based prioritization of speculative queries yields ALGODICE,which outperforms all other methods.
0
500
1000
1500
2000
NOSPEC UNIFORM UNIFORM + BATCHING
DICE
Time (m
s)
Cluster: Small
Fig. 10. Impact of Various Techniques
C. Real-world Usage and User Study
Real-world Query Logs: To evaluate the real-world efficacyof the facet model, we procured a real-world query log of ad-hoc analytical queries by real users on a production systemgenerated HIVE data warehouse of an Internet advertisingcompany. Considering only the aggregation queries (with thegroup by clause), the log spanned 509 queries. Amongstthem 46 query sessions were detected which comprised of 116queries i.e. 22.97% of the queries. The traversals described inthe DICE model were found to cover 100% of the session-based queries, demonstrating that our traversal model is in-deed expressive enough to allow for significant speedups (theremainder are executed traditionally, without speculation.)User Studies: We performed a user study to compare theeffectiveness DICE over traditional methods.The study wasperformed with 10 graduate students across the departmentwho were knowledgeable in databases and data cubing, deter-mined using a pre-test. The users were then given a pre-tasktutorial on data cubing and our data model. They were thenasked to explore the cube using the faceted model for 10 ad-hoc queries of their choice. They were not told if the DICEspeculation was turned on or off (50% of the users each).After the session, the user’s query session was repeated in the
other mode (speculation was turned on if it was off before andvice versa) to get comparable times. Care was taken to avoiddifferent biases. The pre-task tutorial avoided bias against priorknowledge of data cubing and our data model. Having only1 total task that lasted less than 10 minutes prevented fatiguebias, and the same user workload being re-run (automated) forthe alternate mode avoided learning effects. The test algorithmbeing split equally dealt with carryover effects.
The mean and standard deviation for Time-To-Task for theentire query session of 10 queries using ALGODICE were47757 ms and 937 ms and for ALGONOSPEC were 54506 msand 3111 ms: i.e. on average users queried 7 seconds fasterwith ALGODICE. Consider null hypothesis as ALGODICEexecution time to be no different than ALGONOSPEC timeand alternate hypothesis to be that ALGODICE is faster thanALGONOSPEC. The query session time which consists ofquery execution time, query input time and result view timeis significantly lesser for our method, ALGODICE, comparedwith ALGONOSPEC based on a 1-tailed t-test (t-statisticvalue of 21.77 > 1.833 needed for a p-value of 0.05).
Speculation Noticeability: While DICE speedups are objec-tively significant, an important question for a user-involvedsystem is: Can users notice the difference and have apreference? To test this, the users were asked to report whichquery session (i.e. with or without DICE) they found out to befaster. Results were unanimous: all our users preferred theALGODICE session over ALGONOSPEC. Clearly, reductionin query times due to usage of ALGODICE speculation isindeed noticeable to the user.
User Satisfaction: At the end of the query session, the userswere asked to rate their satisfaction (10:extremely happy,5:neutral, 1:extremely unhappy) for both the faceted traversalmodel and the overall system. For the traversal model, themain criteria they were asked to take into consideration werethe traversals allowed under DICE, any extra traversals theythought it lacked, and the ease of traversal. The mean ratingfor the faceted model was 7.9 with a standard deviation of1.54. Consider the null hypothesis of the faceted model ratingsbeing equal to 5 (i.e. neutral) and the alternate hypothesis ofthe faceted model rating being greater than 5. The value ofthe t-statistic was found out to be 5.67 which is much greaterthan the critical value of 1.833 needed for a 1-tailed t-test for ap-value of 0.05 showing that the traversal model satisfactionwas statistically significantly better than random/neutralresponse. Additionally, for the overall DICE system, theaverage User-Satisfaction was very high: 8.7 with a standarddeviation of 0.82, summarizing our overall assertion that DICEnot only provides objective speedups, it also provides asignificantly better experience for the end user.
V. RELATED WORK
Cube Exploration: While the original cube paper [19] providesfor a variety of operators, facet traversals introduced in thispaper are typical to interactions on analytics user interfaces.Work by Sarawagi et al. on mining of interesting regions [45]
and exploration operators [46] can be easily plugged into ourspeculation framework. Kamber et al. [27] have discussedmetarule exploration, and dynamic exploration on cube subsetshave been discussed in [31]. Our contribution is towardsimproving interactive exploration in a session context.Cube Materialization: Materialization strategies range fromfull-cube materialization over MapReduce [37] to region-specific materialization [11] to selective partial materializa-tion. Optimization techniques exist for optimizing intra-queryparallelization [3], but do not consider multiple queries as partof an interactive session.Distributed Query Execution: Ad-hoc analysis over largedatasets has been made popular with the availability of declar-ative query languages such as SCOPE [8], Pig [40] andHive [52], which translate to MapReduce-oriented flows, andis not ideal for interactive workloads. Ideas such as columnarstorage layouts [5], [20], [49], hierarchical execution [35],distributed database hybrids [1], online distributed aggrega-tion [41] and main-memory engines [18] have achieved lowlatencies when querying over large datasets, resulting in a spurtof development activity in this area, resulting in implementa-tions such as Drill, Impala, Tez, PivotalHD, HAWQ, Peregrineand Druid, projects that target single query execution latency.Prefetching: The idea of speculative execution of queriesand prefetching results has been discussed before [48], [51].PROMISE [44] investigates the likelihood of future queries andcan be used to supplant the workload-based approach in ourpaper. Ramachandran et al. [43] focus on the speculation ofexact, non-approximate drill-down queries. Improvements inspeculation quality based on ideas in these papers can be usedto better prioritize and sample our speculative queries.Online Aggregation: Online aggregation ideas proposed byHellerstein et al. [24] and the related CONTROL [23] projectwhich surface approximate answers are highly relevant and re-lated work. Our system builds upon these ideas in a distributedcubing environment, combining user-directed techniques ofspeculative execution and sampling.Sampling-based Estimation: There is significant prior work inusing sampling for approximating query results [38]. Jin etal. [26] detail the approximation of OLAP queries using pre-summarized statistics. Wang et al. discuss [55] data placement,[56] details the computation of errors for a GROUP BY queryover multitable joins, and [32] discuss a sampling-basedframework to materialize cubes. BlinkDB [2] performs anoffline sampling step of multiple column combinations. Asmentioned before, the ideas presented in BlinkDB are orthog-onal to both the faceted exploration model proposed by ourwork, and the speculation-based execution architecture. Strate-gies for stratification using prior workloads [10] and methodsto increase sensitivity for low-selectivity attributes [54] havealso been considered before.Data Interaction: The proliferation of business intelligencetools that leverage visualization and interactive interfaces [4],[6], [15], [28], [57] to explore large multidimensional datasetshighly motivate the need for a distributed interactive cubeexploration system. Tools such as Tableau [21] translate visual
interactions into a series of SQL queries, and interactive loopscorrelate directly with our session-based model. As discussedin Section IV, we observe that such interactions directlycorrespond to facet traversals, allowing us to utilize actualworkloads from such tools in our experimental evaluation.Olston et al. [39], propose the interactive analysis of web-scale data using query templates. Cetintemel et al. [7] envisiona “guidance” system for interactive querying. Session-orientedsampling and speculation approaches described in our papercan significantly improve the interactivity of such a system.
VI. CONCLUSION AND FUTURE WORK
Given the proliferation of commodity distributed infras-tructure and big data analytics applications, there is a com-pelling need for systems that allow interactive exploration ofaggregated data. As demonstrated in the experiments, DICEmeets this need, and allows for exploration of 1-billion-tupledata cubes at sub-second latencies, significantly outperformingexisting methods. The system uses a combination of threecomplementary strategies: a faceted cube exploration model,data sampling and speculative caching to provide interaction-level performance for the end-user.
Going forward, there are several avenues of future work.The inclusion of interestingness of cube groups into the explo-ration framework would be a very useful extension. This wouldbridge the gap between automated exposition of insights, andad-hoc exploration. One possible way to include this intoDICE is to formulate the interestingness of a facet, which canbe mined in an initial offline step during the ingestion of a tableshard, and stored in conjunction with the dataset. During theexploration phase, this can considered when prioritizing facetsto speculatively execute. DICE can be trivially extended bymodeling user behavior through query logs and plugging innew traversal types. We plan on modeling traversal patternsfor 2 dimensional GROUP BYs. Further, we intend to supportmulti-tenancy; this would allow us to leverage caching benefitsacross multiple users, allowing for higher speedups. Estimatedspeculation time can be divided between different users basedon their importance. Another possible extension is to combinemethods for offline and online materialization of data cubesby identifying the fraction of the cube to fully prematerialize.A possible approach is to materialize an approximate andcompressed representation [17] of the data cube, and use theonline execution step to increase the quality of the answerbased on the approximate model [22].
REFERENCES
[1] A. Abouzeid, K. Bajda-Pawlikowski, D. Abadi, A. Silberschatz, andA. Rasin. HadoopDB: An Architectural Hybrid of MapReduce andDBMS Technologies for Analytical Workloads. VLDB, 2009.
[2] S. Agarwal, A. P. Iyer, A. Panda, S. Madden, B. Mozafari, and I. Stoica.Blink and It’s Done: Interactive Queries on Very Large Data. VLDB,2012.
[3] F. Akal, K. Bohm, and H. Schek. OLAP Query Evaluation in a DatabaseCluster: A Performance Study on Intra-Query Parallelism. ADBIS, 2002.
[4] M. Barnett, B. Chandramouli, R. DeLine, S. Drucker, D. Fisher,J. Goldstein, P. Morrison, and J. Platt. Stat!-An Interactive AnalyticsEnvironment for Big Data. SIGMOD, 2013.
[5] P. A. Boncz, M. Zukowski, and N. Nes. MonetDB/X100: Hyper-Pipelining Query Execution. CIDR, 2005.
[6] A. Buja, D. Cook, and D. F. Swayne. Interactive High-DimensionalData Visualization. Computational and Graphical Statistics, 1996.
[7] U. Cetintemel, M. Cherniack, J. DeBrabant, Y. Diao, K. Dimitriadou,A. Kalinin, O. Papaemmanouil, and S. B. Zdonik. Query Steering forInteractive Data Exploration. CIDR, 2013.
[8] R. Chaiken, B. Jenkins, P. Larson, B. Ramsey, et al. SCOPE: Easy andEfficient Parallel Processing of Massive Data Sets. VLDB, 2008.
[9] B. Chandramouli, J. Goldstein, R. Barga, et al. Accurate LatencyEstimation in a Distributed Event Processing System. ICDE, 2011.
[10] S. Chaudhuri, G. Das, and V. Narasayya. Optimized Stratified Samplingfor Approximate Query Processing. TODS, 2007.
[11] Y. Chen, A. Rau-Chaplin, et al. cgmOLAP: Efficient Parallel Generationand Querying of Terabyte Size ROLAP Data Cubes. ICDE, 2006.
[12] S.-J. Chun, C.-W. Chung, and S.-L. Lee. Space-Efficient Cubes forOLAP Range-Sum Queries. DSS, 2004.
[13] W. G. Cochran. Sampling Techniques. John Wiley & Sons, 2007.[14] D. Deutch, Z. G. Ives, T. Milo, and V. Tannen. Caravan: Provisioning
for What-If Analysis. CIDR, 2013.[15] A. Dubrawski, M. Sabhnani, et al. Interactive Manipulation, Visualiza-
tion Analysis of Large Sets of Multidimensional Time Series in HealthInformatics. INFORMS, 2008.
[16] U. Fischer et al. Forecasting the Data Cube: A Model ConfigurationAdvisor for Multi-Dimensional Data Sets. CITY, 2013.
[17] N. Friedman et al. Learning Bayesian Network Structure from MassiveDatasets. UAI, 1999.
[18] H. Garcia-Molina and K. Salem. Main Memory Database Systems: AnOverview. TKDE, 1992.
[19] J. Gray, S. Chaudhuri, A. Bosworth, A. Layman, et al. Data Cube:A Relational Aggregation Operator Generalizing Group-By, Cross-Tab,and Sub-Totals. Data Mining and Knowledge Discovery, 1997.
[20] A. Hall et al. Processing a Trillion Cells Per Mouse Click. VLDB, 2012.[21] P. Hanrahan. VizQL: A Language for Query, Analysis and Visualization.
SIGMOD, 2006.[22] V. Harinarayan, A. Rajaraman, and J. D. Ullman. Implementing Data
Cubes Efficiently. SIGMOD, 1996.[23] J. Hellerstein, R. Avnur, A. Chou, C. Hidber, et al. Interactive Data
Analysis: The Control Project. Computer, 1999.[24] J. Hellerstein et al. Online Aggregation. SIGMOD, 1997.[25] T. Jakel et al. Pack Indexing for Time-Constrained In-Memory Query
Processing. BTW, 2013.[26] R. Jin, L. Glimcher, C. Jermaine, and G. Agrawal. New Sampling-Based
Estimators for Olap Queries. ICDE, 2006.[27] M. Kamber et al. Metarule-Guided Mining of Association Rules using
Data Cubes. KDD, 1997.[28] D. Keim, F. Mansmann, et al. Visual Analytics: Scope and Challenges.
Visual Data Mining, 2008.[29] A. Kemper et al. HyPer: A Hybrid OLTP&OLAP Main Memory
Database System Based on Virtual Memory Snapshots. ICDE, 2011.[30] N. Khoussainova et al. Session-Based Browsing for More Effective
Query Reuse. SSDBM, 2011.[31] B. Leonhardi, B. Mitschang, R. Pulido, et al. Augmenting OLAP
Exploration with Dynamic Advanced Analytics. EDBT, 2010.[32] X. Li, J. Han, Z. Yin, J.-G. Lee, et al. Sampling Cube: A Framework
for Statistical OLAP over Sampling Data. SIGMOD, 2008.[33] X. Liu et al. A Text Cube Approach to Human, Social and Cultural
Behavior in the Twitter Stream. SBP, 2013.[34] S. L. Lohr. Sampling: Design and Analysis. Cengage Learning, 2010.[35] S. Melnik, A. Gubarev, J. Long, et al. Dremel: Interactive Analysis of
Web-Scale Datasets. VLDB, 2010.[36] R. Miller. Response Time in Man-Computer Conversational Transac-
tions. FJCC, 1968.[37] A. Nandi, C. Yu, P. Bohannon, and R. Ramakrishnan. Distributed Cube
Materialization on Holistic Measures. ICDE, 2011.[38] N. Ntarmos, P. Triantafillou, et al. Statistical Structures for Internet-
Scale Data Management. VLDB, 2009.[39] C. Olston, E. Bortnikov, K. Elmeleegy, F. Junqueira, and B. Reed.
Interactive Analysis of Web-Scale Data. CIDR, 2009.[40] C. Olston, B. Reed, et al. Pig Latin: A Not-So-Foreign Language for
Data Processing. SIGMOD, 2008.[41] N. Pansare, V. R. Borkar, C. Jermaine, and T. Condie. Online Aggre-
gation for Large Mapreduce Jobs. PVLDB, 2011.[42] C. Raıssi et al. Computing Closed Skycubes. VLDB, 2010.

[43] K. Ramachandran, B. Shah, and V. V. Raghavan. Dynamic Pre-Fetchingof Views Based on User-Access Patterns in an OLAP System. SIGMOD,2005.
[44] C. Sapia. PROMISE: Predicting Query Behavior to Enable PredictiveCaching Strategies for OLAP Systems. DaWaK, 2000.
[45] S. Sarawagi, R. Agrawal, and N. Megiddo. Discovery-Driven Explo-ration of OLAP Data Cubes. EDBT, 1998.
[46] S. Sarawagi and G. Sathe. i3: Intelligent, Interactive Investigation ofOLAP Data Cubes. SIGMOD, 2000.
[47] B. Shneiderman. Response Time and Display Rate in Human Perfor-mance with Computers. CSUR, 1984.
[48] A. Smith. Sequentiality and Prefetching. TODS, 1978.[49] M. Stonebraker, D. J. Abadi, A. Batkin, X. Chen, M. Cherniack, et al.
C-Store: A Column-Oriented DBMS. VLDB, 2005.[50] F. Tao et al. EventCube: Multi-Dimensional Search and Mining of
Structured and Text Data. KDD, 2013.[51] F. Tauheed et al. SCOUT: Prefetching for Latent Structure Following
Queries. VLDB, 2012.[52] A. Thusoo, J. Sarma, N. Jain, et al. Hive-A Petabyte Scale Data
Warehouse using Hadoop. ICDE, 2010.[53] D. Tunkelang. Faceted Search. Synthesis Lectures on Information
Concepts, Retrieval, and Services, 2009.[54] F. Wang and G. Agrawal. Effective Stratification for Low Selectivity
Queries on Deep Web Data Sources. CIKM, 2011.[55] Y. Wang, S. Parthasarathy, and P. Sadayappan. Stratification Driven
Placement of Complex Data: A Framework for Distributed Data Ana-lytics. ICDE, 2013.
[56] F. Xu, C. Jermaine, and A. Dobra. Confidence Bounds for Sampling-based Group by Estimates. TODS, 2008.
[57] J. Yi et al. Toward a Deeper Understanding of the Role of Interactionin Information Visualization. VCG, 2007.
APPENDIX
We build upon stratified sampling and post-stratification [13] for our sampling framework. Error boundsfor aggregation queries are based on the variance (acrosssamples) of the measure for each cube group. As an initialstep, we combine the variance for the same group acrossmultiple queries, after which the variances across multiplegroups are combined to give an error estimate for the entirequery.
TABLE ILIST OF NOTATIONS USED IN SECTION II-C
Symbol Explanations2h variance of the group hnh number of tuples in the group h in the sample
nhinumber of tuples belonging to the group h fromthe ith query
n total number of tuples in the samplemhi mean of the group h from the ith querymh mean of the group h from all the queriesvhi variance of the group h from the ith queryp proportion of tuples selected by the where clauseV [θ] variance of the estimator for the parameter θH number of groups in the union of all the queriesNh number of tuples in group h in the datasetN number of tuples in the dataset
Combining variances within groups: In order to deliverresults at higher sampling rates, DICE runs the same queryon multiple randomly chosen shards on multiple nodes. Thisresults in the same cube group being possibly obtained fromthe multiple table shards. Hence, the statistics for the samegroup from these multiple queries need to be combined to-gether. While combining the AVG, SUM and COUNT is straight
forward, we present a technique for combining variances as
s2h =
1
nh − 1(
numQ∑i=1
nhi(mhi−mh)2)+∑i
(nhi−1)vhi) (2)
where numQ is the number of queries that a query needsto be replicated to. Thus, we get the requisite statistics for acombined group across all the replicated queries.
Continuing our motivating example, the faceted representa-tion of the query is f(rack, hour : 6, datacenter : EU) withthe measure AVG and measure dimension iops . We appendthe COUNT and VARIANCE measures to the queries since theyare needed as given in Equation (2) to combine variances forthe same group across multiple queries. Assume the query isrun on a single shard on 2 nodes and result into a sampling rateof 10%, returning us groups and the corresponding measuresfrom the two queries respectively as:
{[rack:1,hour:6,datacenter:EU,AVG:10,COUNT:5,VAR:4],[rack:2,hour:6,datacenter:EU,AVG:12,COUNT:6,VAR:2]} &
{[rack:1,hour:6,datacenter:EU,AVG:5,COUNT:8,VAR:1],[rack:2,hour:6,datacenter:EU,AVG:6,COUNT:7,VAR:2]}.
Plugging in the values from above into (2), we get the variancefor the combined group [rack:1,hour:6,datacenter:EU] as s2
1 =8.32 and for [rack:2,hour:6,datacenter:EU] as s2
2 = 11.52.
Combining variances across groups: From the variances ofeach of the combined groups, we can get an error estimatefor the combination of all of these groups i.e. the combinedresult set. We consider three algebraic measures SUM, AVGand COUNT. From the standard sampling theory, the varianceof the estimator for the measure SUM can be given as:
V [t] =
H∑h=1
N2h(1− nh
Nh)sh
2
nh(3)
The variance of the estimator for the measure AVG can beobtained by dividing the above value by N2.
For the measure COUNT, we can use the proportion estima-tor since the where clause acts as the indicator function andthus the variance of the estimator for COUNT can be given as:
V [p] = (1− n
N)p(1− p)n− 1
(4)
The above formulae cannot be used as they are since wecannot know the value of Nh without accessing the entire data.We resolve this issue by estimating Nh
N by nhn and nh
Nhby
the sampling rate which resulting into an unbiased estimator.Holistic measures can be handled as described in [34].
Again plugging in the values we get, y = 6.92 ∗ 13/26 +8.77∗13/26 = 7.85 and V [t] = (13
26 )2 ∗ (1−0.1)∗ (8.32/13+11.52/13) = 0.35
The error will be given by
ConfidenceInterval
2 ∗ Estimate= zα
2∗
√V (θ)
θ(5)
where θ is the estimate of the measure parameter and V (θ)is the variance of the estimate.
Thus, for a confidence of 95%, we can get the standard errorfor the query as 1.96∗
√0.35
7.85 = 0.15 resulting into an accuracyof 85%.