chromatography - university of massachusetts...
TRANSCRIPT

Chromatography-3
Chromatography Objectives:
• To explore the relationship between chemical structures and their properties • To discover patterns in the behavior of certain chemicals • To experience how scientists develop and test hypotheses
Introduction: Chromatography is the general name for a wide range of techniques that are used to separate molecules based on their properties. In general, chromatography involves two phases:
• A Stationary Phase. This is typically a solid. In today’s lab, it will be paper. • A Moving Phase. This is typically a liquid. In today’s lab, it will be a very dilute
solution of salt in water. In general, the sample is applied to one end of the stationary phase and the moving phase is allowed to flow over the stationary phase. Depending on the properties of each molecule in the sample, it will be carried along with the moving phase to varying degrees. The degree to which a molecule is carried along by the moving phase can be expressed as a fraction called Rf (Retention factor) which is the distance traveled by the molecule divided by the distance traveled by the moving phase. In today’s lab, you will apply various colored dye molecules to paper and try to find a relationship between their structures and their Rf values. This is shown below: The Rf for Dye #1 = A/Max The Rf for Dye #2 = B/Max
Start: Dry paper
Origin:
Dye Dye #1 #2
Dip bottom in salt water
Wait ~ 15 mins for
water to rise and dyes to
migrate
End: Damp paper
Upper edge of water
Max
A B

Chromatography-4
What controls Rf? The Rf reflects the relative affinity of the dye for the paper vs the water. • If the dye binds to the paper to a greater extent than it dissolves in the water, the dye
will only move a short distance and the Rf will be low. • If the dye dissolves in the water to a greater extent than it binds to the paper, the dye
will move a long distance and the Rf will be high. It turns out that very little is known in detail about the exact features of a dye molecule that govern its Rf. Most people who do chromatography are interested in the fact that it separates different molecules not why different molecules move different distances. This is where we come in. Here is what’s known about paper chromatography of dye molecules in dilute salt solutions. You should feel free to Google this; let me know if you find anything interesting!
• Paper is mostly cellulose. Cellulose is a polymer of glucose. The structure of glucose is shown below. It is very hydrophilic with many –OH groups that can form hydrogen bonds.
• Salt in water increases the strength of the hydrophobic effect. This makes hydrophobic
molecules less soluble. Assignment Find out what you can about the relationship between structure and Rf for these molecules. We are much more interested in a small but solid conclusion than an all-encompassing but not well supported one. Since little is known about this, we will have to see what you can find. How will you do this? Run paper chromatograms of different dyes; compare their Rf values; and look for patterns you can test and confirm or refute. You will pool your data as a class at various points to see what you can or cannot conclude and which experiments should be done next. Two hints. Scientists often use these two different types of comparisons to explore a phenomenon.
• Pick extreme cases. For example, compare two molecules that are very different in some particular property. If they have different Rfs, then this feature is likely to be relevant.
• Pick very similar molecules. For example, two molecules that differ in one –OH group. That way, you can say that any difference in Rf is due to this one change.

Chromatography-5
pH and Chemical Structures Another variable that you can play with is pH – the relative acidity of the solution in which the dyes are migrating. We will not go into great detail about pH in Bio 111, but here is a ‘thumbnail sketch’ as it applies to this course. pH represents a measure of the concentration of H+ ions in a given solution. pH has a profound influence on chemistry as the same molecule can have significantly different structures at different pHs.
• Low pH (pH < 7) = acidic conditions = high concentration of H+ ions. • High pH (pH > 7) = alkaline conditions = low concentration of H+ ions.
You can choose one of two mobile phases for each of your experiments:
• 0.15% NaHCO3 – alkaline conditions • 0.1% HCl – acid conditions
The figures at the back of this section of the lab manual show the structures of the various dyes at different pHs. Some dyes have the same structure at different pHs while others change rather dramatically. You can use these differences to test hypotheses about structure and mobility. In general, the structure on the left is the acid form and the structure on the right is the alkaline form; if the structure doesn’t change much with pH, only one structure is shown. In general, in acid solution, you’ll find more H’s on the structure (often making N+); in alkaline solution, you’ll find fewer H’s on the structure (often making O-). Note that, sometimes, the pH is not high enough or low enough to change the structure significantly. As a result, you should always infer the structure of a dye from its color not just the pH. Procedure You will use this same procedure for each of your chromatography runs. 1) Prepare a developing tank by pouring 10 mL of the mobile phase (NaHCO3 or HCl) into a 400 mL beaker and covering the beaker with a watch glass. It is important that the air above the mobile phase become saturated with solvent vapor so that solvent does not evaporate from the stationary phase as the chromatogram develops. Therefore, be sure to keep the developing tank covered at all times. Be sure to take careful notes about which mobile phase you used. 2) With a pencil, draw a horizontal line 1.5 cm from the bottom edge of the chromatography paper. Draw vertical tick marks along this line every 2 cm (see figure 2a). Using a capillary and one of the standard dye solutions, make a spot on the chromatography paper at one of the marks. Try to keep your spots less than 4 mm in diameter. Allow the dye to dry and reapply the same dye in the same spot 1 or 2 times or until a sufficiently dark spot has been achieved. With a pencil, note the name of the dye below the spot. 3) Repeat steps 1 and 2 for the remaining dyes across the bottom of the chromatogram.
Chromatography-6
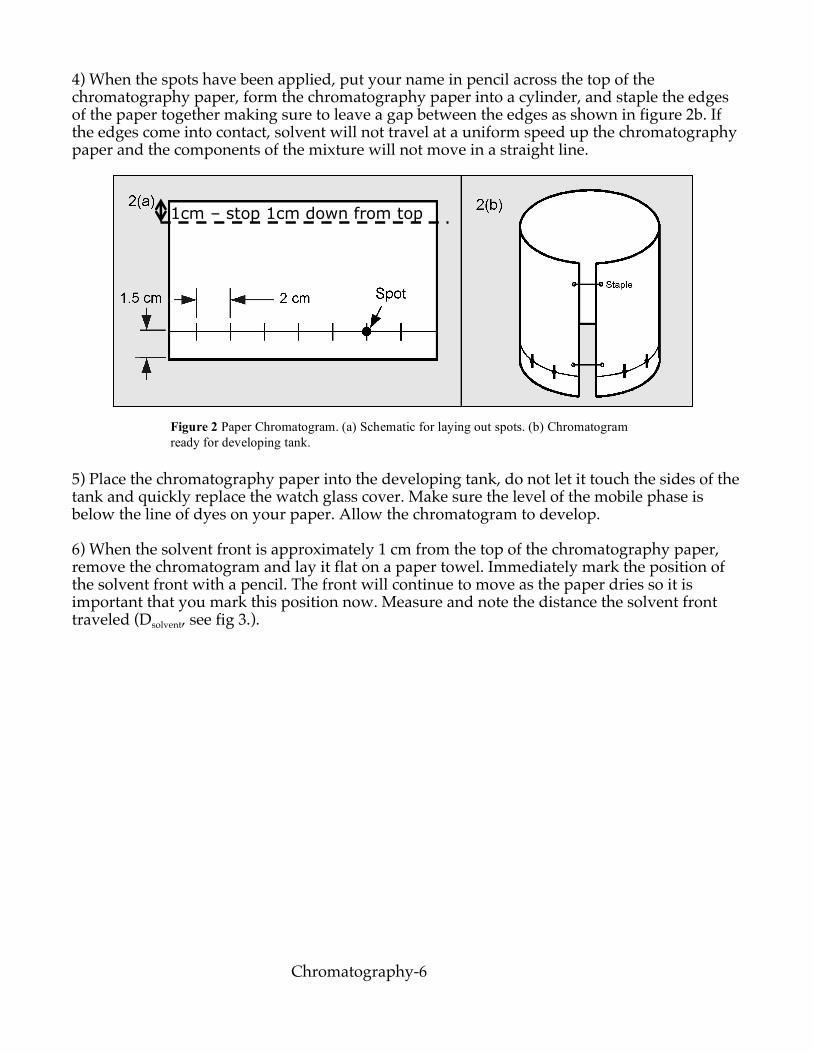
4) When the spots have been applied, put your name in pencil across the top of the chromatography paper, form the chromatography paper into a cylinder, and staple the edges of the paper together making sure to leave a gap between the edges as shown in figure 2b. If the edges come into contact, solvent will not travel at a uniform speed up the chromatography paper and the components of the mixture will not move in a straight line.
5) Place the chromatography paper into the developing tank, do not let it touch the sides of the tank and quickly replace the watch glass cover. Make sure the level of the mobile phase is below the line of dyes on your paper. Allow the chromatogram to develop. 6) When the solvent front is approximately 1 cm from the top of the chromatography paper, remove the chromatogram and lay it flat on a paper towel. Immediately mark the position of the solvent front with a pencil. The front will continue to move as the paper dries so it is important that you mark this position now. Measure and note the distance the solvent front traveled (Dsolvent, see fig 3.).
Figure 2 Paper Chromatogram. (a) Schematic for laying out spots. (b) Chromatogram ready for developing tank.
1cm – stop 1cm down from top

Chromatography-7
7) Draw an ellipse around each spot on the developed chromatogram and draw a horizontal line through the center of each spot. If a spot shows significant “tailing” make your horizontal line through the darkest part of the spot (see fig 3). Use the distance from the starting line (not the bottom of the paper!) to these horizontal lines to determine Ddye for each dye. Record distances and Rf values in your notebook. Recall:
Rf = Ddye/Dsolvent You will need to carry out several chromatograms and pool your class data to reach solid conclusions.
Figure 3 Developed Chromatogram. Immediately mark solvent front when paper is removed from the developing tank. The spot on the right exhibits significant tailing and the distance the spot has traveled has been correctly identified.

Chromatography-8
You may find the following information useful:
1) What kind(s) of interaction(s) can this part of a molecule make? Since it takes two items to make a bond, the bond couldn’t form without a “suitable partner.” Either explicitly or implicitly, this question assumes the existence of a suitable partner. For these, the following flowchart applies:
1) Does the part of the molecule have a full (+ or –) charge?
YES NO
This part of the molecule can make an ionic bond.
2) Does this part of the molecule have a hydrogen donor (OH or NH) or a
hydrogen acceptor (O: or N:)? YES NO
3) Can this part of the molecule make either an ionic bond or a hydrogen bond?
YES NO
This part of the molecule cannot make an ionic bond.
This part of the molecule can make a hydrogen bond.
This part of the molecule cannot make a hydrogen bond.
This part of the molecule is hydrophobic and therefore can be involved in hydrophobic interactions.
This part of the molecule is hydrophilic and therefore will not be involved in hydrophobic interactions.
Van der Waals interactions are always possible (they are just very weak).

Chromatography-9
2) What kind(s) of interactions are possible between these two (parts of) molecules? In this case, you have to determine whether the other molecule is a suitable partner. This is a slightly more restrictive question than (1). The flowchart below applies in this case. Note that the questions now ask about the other molecule(s).
1) Does one part have a full (+) charge and the other have
a full (–) charge? YES NO
These parts of the two molecules can make an ionic bond.
2) Does one part have a hydrogen donor (OH or NH) and the other have a hydrogen acceptor (O: or N:)?
YES NO
3) Can either part make either an ionic bond or a hydrogen bond?
YES NO
These parts of the two molecules cannot make an ionic bond.
These parts of the two molecules can make a hydrogen bond.
These parts of the two molecules cannot make a hydrogen bond.
These parts of the two molecules can be involved in hydrophobic interactions.
These parts of the two molecules will not be involved in hydrophobic interactions because one or both are hydrophilic.
Van der Waals interactions are always possible (they are just very weak).

Chromatography-10
Lab Report • Must be typed; handwritten reports will not be accepted. Hand-drawn chemical structures
are OK; it is also perfectly acceptable to refer to complex structures by their names. • Due during the week listed in the syllabus at the start of the lab session you are currently
in. This is a firm deadline. • Although you will perform these experiments as a group, each member of the group must
turn in an individual lab report and this report must be in your own words. Your lab report must include: A description of one place where one hypothesis and some data interacted to lead to a firm conclusion. You should not describe all the experiments you did; just one place where you were able to draw a firm conclusion. The conclusion can be positive (“My hypothesis was supported because…”) or negative (“My hypothesis was not supported because…”). This need not be an experiment you did, but it must have happened during your lab session. Your report should also contain a follow-up experiment as described below: 1) Hypothesis – the hypothesis being tested. You must pick a clear and specific hypothesis that can be clearly and decisively tested by the experiment(s) you describe below. Your hypothesis need not be correct. Your hypothesis must also include some theory – an explanation of why the molecule would behave the way it did.
For example, “A dye molecule with oxygen atoms will migrate farther than a dye without oxygen atoms because oxygen atoms interact strongly with water.” The hypothesis “A dye molecule with oxygen atoms will migrate farther than a dye without oxygen atoms.” lacks any theory and would not receive full credit. 2) Experiments – a description of the experiment(s) you tried that addressed the hypothesis. Do not include all your experiments; only those relevant to the hypothesis from part (1). These must clearly and decisively test your hypothesis. You do not need to describe the procedures from the lab manual – you can assume that we all know them – but you must provide a rationale for the dyes you chose. For example, “I chose Dye A and B because they contain oxygen atoms; I chose dyes C and D because they are do not.” You should be sure to include which mobile phase (NaHCO3 or HCl) you used in each chromatogram. 3) Results – descriptions of the results of the experiments. You can get these from your section’s data. You do not have to show chromatograms; presenting a table of relevant Rf values is sufficient. 4) Conclusions – do the data support the hypothesis or not. Explain your reasoning. You will be graded on the quality of your argument: how clearly you described your hypothesis, experiment(s), and result(s) as well as how clearly and completely your conclusions are explained. {See next page for further parts of the lab report}
Chromatography-11
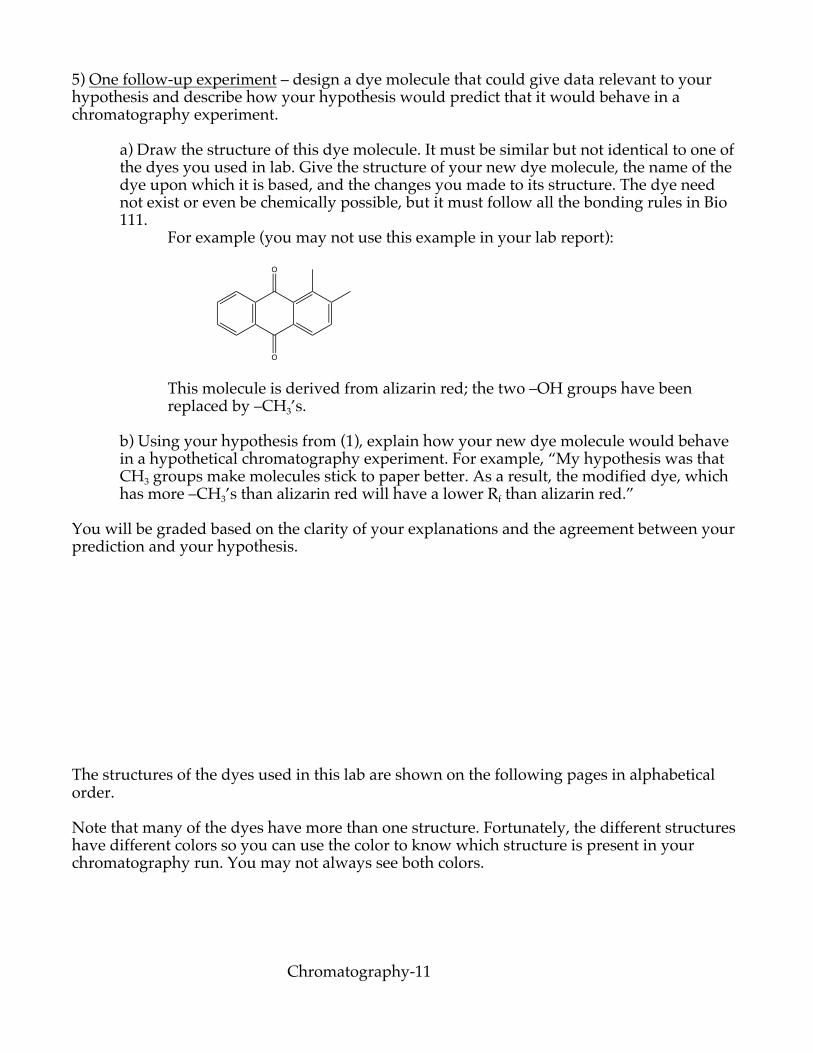
5) One follow-up experiment – design a dye molecule that could give data relevant to your hypothesis and describe how your hypothesis would predict that it would behave in a chromatography experiment.
a) Draw the structure of this dye molecule. It must be similar but not identical to one of the dyes you used in lab. Give the structure of your new dye molecule, the name of the dye upon which it is based, and the changes you made to its structure. The dye need not exist or even be chemically possible, but it must follow all the bonding rules in Bio 111.
For example (you may not use this example in your lab report):
This molecule is derived from alizarin red; the two –OH groups have been
replaced by –CH3’s. b) Using your hypothesis from (1), explain how your new dye molecule would behave in a hypothetical chromatography experiment. For example, “My hypothesis was that CH3 groups make molecules stick to paper better. As a result, the modified dye, which has more –CH3’s than alizarin red will have a lower Rf than alizarin red.”
You will be graded based on the clarity of your explanations and the agreement between your prediction and your hypothesis. The structures of the dyes used in this lab are shown on the following pages in alphabetical order. Note that many of the dyes have more than one structure. Fortunately, the different structures have different colors so you can use the color to know which structure is present in your chromatography run. You may not always see both colors.
O
O

Chromatography-12
OHOH
O
OO
O
O
OOHO
O
O
S
N
NH
H3CN
CH3
CH3
N
HN
N
CH3
O
CH3
SO
OO
SO
OO
CH3
N
HN
N
CH3
O
CH3
SO
OO
SO
OO
CH3
H
Alizarin red
(yellow) (red) (purple)
Azure B
Brilliant Blue G
ACIDALKALI
BOTH
(blue)
(green)
ACID
ALKALI

Chromatography-13
OS
Br
HOBr
Br
OH
BrO
O
OS
Br
HOBr
Br
O
BrO
O
OS
OHBr
Br
OH
H3C
H3C
CH3
H3C
O
O OS
OHBr
Br
O
H3C
H3C
CH3
H3C
O
O
OS
O
O OH
Cl
OHCl
OS
O
O O
Cl
OHCl
O
HOOH
OHOH O
OOHO O
O
O
CH3
HO
Bromophenol Blue
(yellow)(blue)
ACID ALKALI
Bromothymol blue
(yellow)(blue)ACID
ALKALI
Chlorophenol red
(yellow) (red)
Carmine (Alum lake)
(red)
BOTH
ACID
ALKALI

Chromatography-14
NN N
N
NH2
SO
OO
H2N
SO
O O
NN N
N
NH3
SO
OO
H3N
SO
O O
O
NH3C
NH3C
CH3
NH2
OO
O
OH
Br
Br
OHBr Br
OOO
O
Br
Br
OBr Br
(red)
(blue)
ACID
ALKALI
Congo Red
Cresyl Violet
(purple)
Eosin Y
(yellow)(red)
BOTH
ACID
ALKALI
Chromatography-15
N
CH3
SO
O
OSO
O O
OH
N
H3C
SO
O
O
NH3C CH3
NH3C
CH3
NCH3
CH3
H2N
SO
O
O
CH3
NH2
SO O
O
NH2
SO
O
O
NH3C CH3
NH3C
CH3
NCH3
CH3
H
N
N NN
NCH3
CH3
N
CH3
CH3
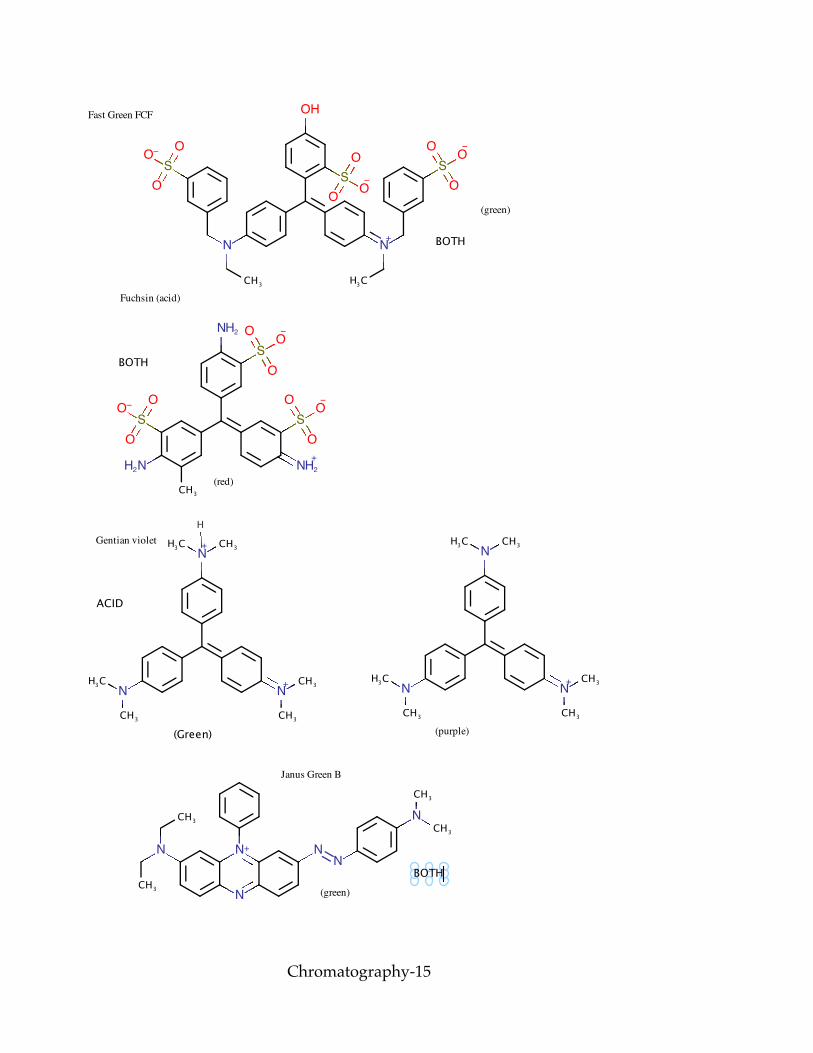
Fast Green FCF
(green)
Gentian violet
Fuchsin (acid)
(red)
BOTH
BOTH
(purple)(Green)
ACID
Janus Green B
(green)
BOTH

Chromatography-16
SO
O
O
NH
HN
SO
O
O
NH
SO
O
O
NH3C
CH3
NH3CCH3
CH3
NCH3
CH3
NHN S
O
OO
NH3C
H3CNN S
O
OO
NH3C
H3C
NH3C
CH3
NH3CCH3
CH3
NCH3
CH3
H
NH3C
H3CNN
OO
NH3C
H3CNHN
OO
Methyl blue
(blue)
Methyl green
(green)
Methyl orange
(red)
BOTH
(blue)
ALKALIACID
ACID ALKALI
(red/orange)
Methyl red
(yellow)(red)
ACID ALKALI

Chromatography-17
NH3C
H3C
NNN
H3C
H3C
NHN
S
N
NH3C
CH3
N
CH3
CH3
OH
NN N
NCH3
H3C
CH3
H3C
OS
OH
OH
O
O
OS
O
OH
O
O
N
NH3C
H2N
CH3
NH2
NN
OH
OH
NN N
N
OH
NN N
N
H3C
H3C
Methyl yellow
(red)(yellow)
ACID
ALKALI
Methylene blue
(blue)
Oil red
(red)
Phenol red
(pink)(yellow)
Safranin O
(red)
Sudan I
(orange)
BOTH
BOTH
ACIDALKALI
BOTH
BOTH
Sudan III Sudan IV
(red) (red)BOTH
BOTH

Chromatography-18
S
O
O
O
NH2
OH
NN N
N
H3C CH3
SO
O OS
O
OO
HOH2N
S
O
O
O
Trypan Blue
(blue)
BOTH