chromatographic assessment of a marketed ayurvedic...
TRANSCRIPT

Journal of Pharmacy Research | Vol 12 • Issue 6 • 2018 895
INTRODUCTIONAyurvedic medicines have gained a lot of popularity worldwide due to its curative properties and minimal side effects.[1] This is due to active constituents present in the formulation and is used as phytopharmaceutical agents.[2] Ayurvedic formulations are combinations of more than one herb that work synergistically to achieve greater therapeutic efficacy.[3] Hence, standardization of herbal formulation is essential to assure its safety, efficacy, and concentration of chemical constituents for their biopotency.[4]
Different ayurvedic formulations have been reported to treat various female reproductive disorders such as Pathadi Kwatha and Ashokaristha. Pushyanuga churna (PC) is one such ayurvedic polyherbal formulation composed of 25 plant ingredients and
one mineral described in Ayurvedic Formulary of India.[5] Ayurvedic texts prescribe it for various female reproductive disorders such as Ashwagandha (menorrhagia), Shweta pradara (leukorrhea), Rajodosa (menstrual disorders), Arsa (piles), and Yonidosa (disorders of female genital tract).[5] Due to its clinical efficiency, PC is being prepared and marketed by different manufacturers such as Dabur, Baidyanath, Arkashala, Dhootpapeshwar, Patanjali, and Kottakkal.[6]
As the formulation contains 25 plant ingredients, collection of authentic plant parts becomes difficult, also pre- and post-harvesting conditions, manufacturing process may affect its quality and this, in turn, may curtail its therapeutic potency.
Therefore, in the current research work, marketed formulations of Pushyanuga churna were subjected to quality evaluation in terms of physicochemical parameters, phytochemical evaluation, and chromatographic characterization in terms of its marker content. Polyherbal formulation PC may
Chromatographic assessment of a marketed ayurvedic formulation Pushyanuga churna: A modern approachSunita Shailajan*, Swati Singh, Yugandhara Patil
Research Article
ABSTRACT
Aim: Pushyanuga churna (PC) is an Ayurvedic formulation composed of twenty-five plant ingredients and one mineral described in AFI for its use in various female reproductive disorders. Owing to its therapeutic efficacy, it is prepared and marketed by different manufacturers. But, as there is paucity of scientific data on its standardization and quality control parameters which may lead to undesired quality and variation in its consistency, standardization of this formulation using modern bioanalytical techniques is required. Material and Methods: Pushyanuga churna (PC) was purchased from the market, manufactured by different companies subjected to quality control parameters. HPTLC-fingerprint for different marketed of PC was developed. Further, a simple, rapid, accurate and sensitive HPTLC method was developed for the estimation of two therapeutically potent biomarkers viz. gallic acid and bergenin simultaneously using a toluene: ethyl acetate: methanol: formic acid as mobile phase. The developed method was validated as per ICH guidelines. Results and Discussion: Preliminary phytochemical, physicochemical analysis and chromatographic fingerprint for different manufacturers of Pushyanuga churna were established. It was observed that all the marketed samples did not show uniformity in results. Quantitation of two bioactive markers were evaluated and the maximum content of gallic acid and bergenin were found in marketed Pushyanuga churna 2 (2.346 ± 0.026 mg/g) and marketed Pushyanuga churna 4 (2.283 ± 0.175 mg/g) respectively. Conclusion: The data obtained from scientific evaluation of PC can be adapted to lay down new pharmacopoeial standards for batch-to-batch consistency.
KEY WORDS: Bergenin, Gallic acid, High-performance thin-layer chromatography, Pushyanuga churna
Herbal Research Lab., Ramnarain Ruia Autonomous College, Matunga, Mumbai, Maharashtra, India
*Corresponding author: Sunita Shailajan, Herbal Research Lab., Ramnarain Ruia Autonomous College, Matunga, Mumbai, Maharashtra, India. E-mail: [email protected]
Received on: 17-03-2018; Revised on: 27-04-2018; Accepted on: 29-05-2018
Access this article online
Website: jprsolutions.info ISSN: 0974-6943
Sunita Shailajan, et al.
Journal of Pharmacy Research | Vol 12 • Issue 6 • 2018896
contain many secondary active metabolites such as ursolic acid, β-sitosterol, and lupeol[6] which are responsible for its therapeutic efficiency. Bergenin and gallic acid which are reported to possess various pharmacological activities have been quantitated from PC. The research data may provide substantial information to the manufacturers and help in scientific evaluation of the traditional formulation PC.
MATERIALS AND METHODSMarketed SamplesMarketed samples of PC were purchased from local medical shops of six brands coded as Marketed PC-1, Marketed PC-2, Marketed PC-3, Marketed PC-4, Marketed PC-5, and Marketed PC-6.
Chemicals and ReagentsChemicals of HPLC grade were purchased from Merck Specialties Pvt., Ltd., Mumbai. Reference standards, gallic acid (≥98% purity) was procured from Sigma-Aldrich, Steinheim, Germany, and bergenin (≥97.0% purity) was procured from Chengdu Biopurify Phytochemicals Ltd., China. 10% methanolic sulfuric acid as derivatizing reagent was prepared according to Reich and Schibli.[7]
Evaluation of Quality Control ParametersOrganoleptic evaluationThe organoleptic characters of the marketed formulations were carried out based on the method described by Wallis.[8] Organoleptic evaluation refers to the evaluation of the formulation by color, odor, taste, texture, etc. For determining the odor of an innocuous material, small portion of the sample was placed in the beaker of suitable size, examined by slow and repeated inhalation of the air over the material. If no distinct odor was perceptible, the sample was crushed between the thumb and index finger, using gentle pressure.[9]
Physicochemical evaluationPhysicochemical evaluation of marketed formulations were carried out using parameters such as pH, loss on drying, total ash, acid-insoluble and water-soluble ash content, and alcohol- and water-soluble extractive content using standard pharmacopeial method.[10]
Preliminary phytochemical screeningEthanolic extract of marketed formulations of PC was subjected to preliminary phytochemical screening for evaluation of some major phytoconstituents using reported method.[11]
Determination of physical characteristicsSamples were subjected to physical characteristic parameters such as bulk density, tap density, Hausner ratio, and Carr’s index as per the reported methods[12,13] and acceptance limits [Table 1] were taken as per USP.[14]
Bulk densityIt is the ratio of given mass of powder and its bulk volume. Marketed formulations of PC were added to a cylinder with the aid of a funnel for any loss. The initial volume was noted.
Bulk density = W/V0 g/mL
Where, W = Mass of the powder and V0 = Untapped volume
Tapped densityThe initial volume gave the value of bulk density, and the sample was then tapped until no further reduction in volume was noted giving the value of tapped density, respectively.[9,15]
Tapped volume = W/Vf g/mL,
Where, W = Mass of the powder and Vf = Tapped volume.
Hausner’s ratioIt indicates the flow properties of the powder. The ratio of tap density to the bulk density of the powder is called Hausner ratio.
Hausner’s ratio = Tapped density/bulk density
Carr’s index (percentage compressibility)It is the propensity of the powder to be compressed. The percentage compressibility of a powder is a direct measure of the potential powder arch or bridge strength and stability, and is calculated according to the following equation;
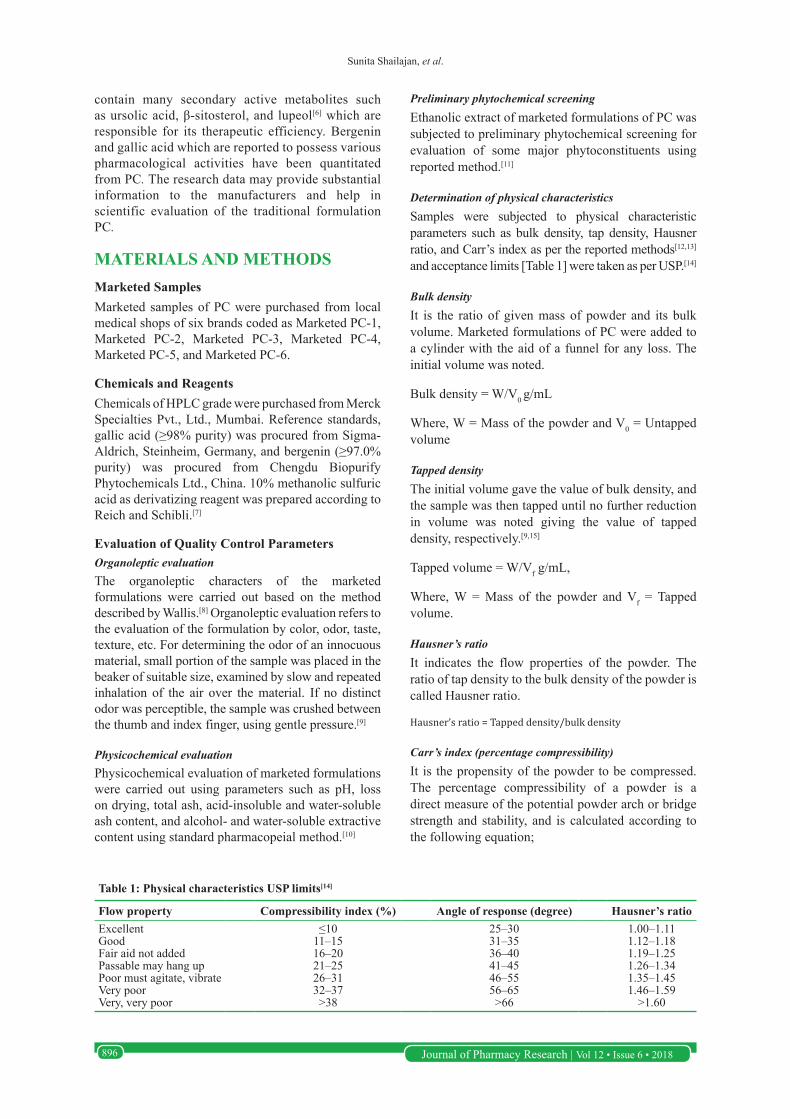
Table 1: Physical characteristics USP limits[14]
Flow property Compressibility index (%) Angle of response (degree) Hausner’s ratioExcellent ≤10 25–30 1.00–1.11Good 11–15 31–35 1.12–1.18Fair aid not added 16–20 36–40 1.19–1.25Passable may hang up 21–25 41–45 1.26–1.34Poor must agitate, vibrate 26–31 46–55 1.35–1.45Very poor 32–37 56–65 1.46–1.59Very, very poor >38 >66 >1.60

Sunita Shailajan, et al.
Journal of Pharmacy Research | Vol 12 • Issue 6 • 2018 897
% compressibility = [(Tapped density – bulk density)]/tapped density] ×100
Angle of responseAngle of response is a characteristic related to interparticulate friction or resistance to movement between particles. The fixed funnel method employs a funnel that is secured with its tip at a given height, which was taken 2.0 cm (H), above the graph paper that is placed on flat horizontal surface. Powder was carefully poured through the funnel until the apex of the conical pile just touched the tip of the funnel and is calculated according to the following equation;
tan (α) = height/0.5 base.
High-performance Thin-layer Chromatography (HPTLC) - Optimized ConditionsOptimization of extraction technique from different marketed formulations of PCExtraction of phytoconstituents from different marketed formulations of PC was optimized to achieve good fingerprint and also to resolve the marker compounds efficiently. To the accurately weighed 1 g of each marketed formulation, hydroalcohol was added in the ratio of 2:8 v/v, vortexed for 5 min, and kept standing overnight. Next day, it was filtered through Whatman filter paper No. 1 and the filtrate (10 µL) was then used for HPTLC analysis.
HPTLC fingerprintChromatographic separation was achieved on silica gel 60F254 precoated HPTLC plates. Samples were spotted using the CAMAG Linomat 5 sample spotter (CAMAG, Muttenz, Switzerland) equipped with syringe (Hamilton, 100 µL). For the development of fingerprints, plate was developed in a glass twin trough chamber (CAMAG) pre-saturated for 20 min with toluene:ethyl acetate:formic acid (8:2:1 v/v) as mobile phase. The plates were derivatized in 10% methanolic sulfuric acid. Densitometric scanning was performed using CAMAG TLC Scanner 4 at 254 nm and CAMAG Reprostar 3 was used for photodocumentation. Fingerprint plate was photodocumented before and after derivatization at 254 nm and 366 nm to visualize maximum number of phytoconstituents [Table 2].
Chromatographic evaluation of phytochemical markersFor simultaneous estimation of the biomarkers gallic acid and bergenin from marketed formulations of PC, a validated method as per ICH guidelines was used.[16] Toluene:ethyl acetate:methanol:formic acid (6:6:2:1 v/v) was used as mobile phase to resolve and quantitate the marker compounds from hydroalcoholic extract of different marketed formulations of PC [Table 3].
Statistical AnalysisThe statistical analysis of the results obtained was done using Microsoft Excel 2007.
RESULTSQuality evaluation of herbal formulations is imperative to justify their acceptability in modern system of medicine.[17]
Organoleptic evaluation of the marketed formulations of PC showed slight variation in its color and texture. Results have been summarized in Table 4.
All marketed formulations of PC were subjected to physicochemical evaluation and preliminary phytochemicals screening, and results were notified in Tables 5 and 6, respectively.
The Carr’s index of all the marketed formulations of PC were found to be in the range of 18–35, suggesting
Table 2: Optimized chromatographic conditions for fingerprint analysis of PC
Parameters SpecificationsStationary phase Merck silica gel 60F254 HPTLC
precoated platesSample applicator Camag Linomat 5Development distance 85 mmDerivatization 10% methanolic sulfuric acid
reagentDensitometric scanner Camag scanner 4
software winCATS planar chromatography manager software version 1.4.7 Lamp
Wavelength 366 nm, 254 nmPhotodocumentation Camag Reprostar 3HPTLC: High-performance thin-layer chromatography, PC: Pushyanuga churna
Table 3: Optimized chromatographic conditions for quantitation of biomarkers from marketed formulations of PC
Parameters SpecificationsStationary Phase Merck silica gel 60F254HPTLC precoated platesSample Applicator Camag Linomat 5Development distance 85 mmDensitometric scanner Camag scanner 4 software win CATS planar chromatography manager software version 1.4.7 LampWavelength 254 nmPhotodocumentation Camag Reprostar 3HPTLC: High-performance thin-layer chromatography, PC: Pushyanuga churna
Sunita Shailajan, et al.
Journal of Pharmacy Research | Vol 12 • Issue 6 • 2018898
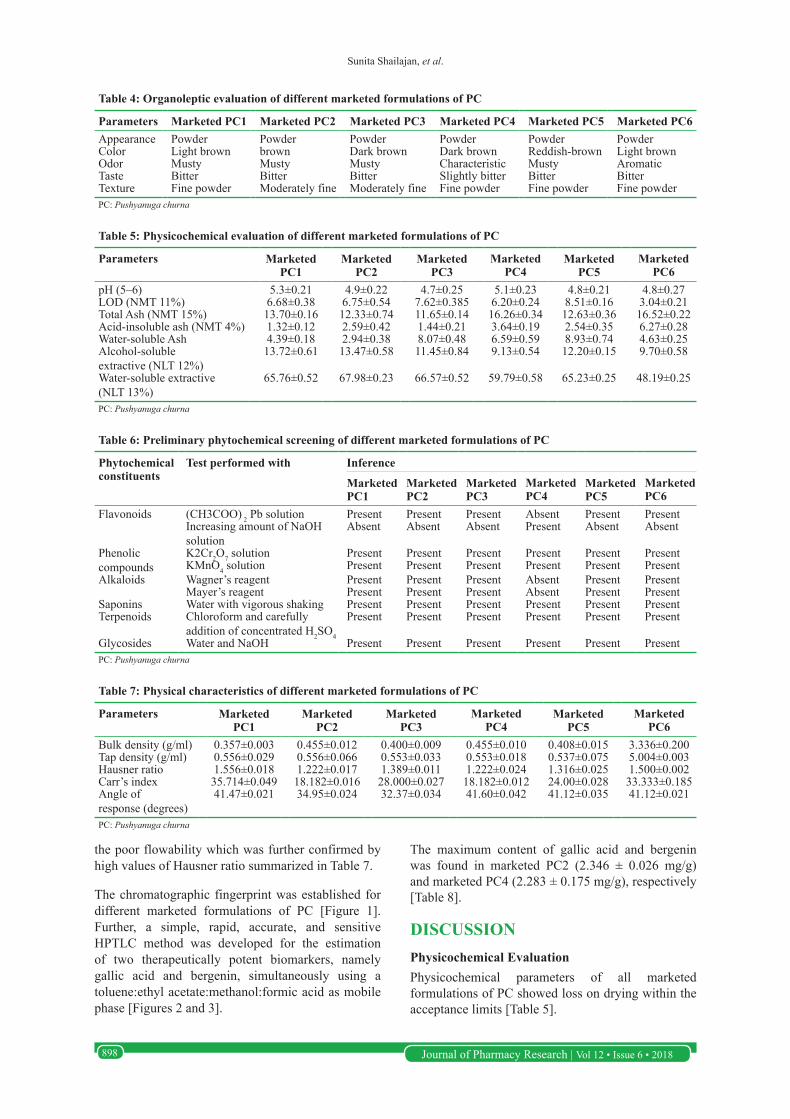
Table 4: Organoleptic evaluation of different marketed formulations of PC
Parameters Marketed PC1 Marketed PC2 Marketed PC3 Marketed PC4 Marketed PC5 Marketed PC6Appearance Powder Powder Powder Powder Powder PowderColor Light brown brown Dark brown Dark brown Reddish-brown Light brownOdor Musty Musty Musty Characteristic Musty AromaticTaste Bitter Bitter Bitter Slightly bitter Bitter BitterTexture Fine powder Moderately fine Moderately fine Fine powder Fine powder Fine powderPC: Pushyanuga churna
Table 5: Physicochemical evaluation of different marketed formulations of PC
Parameters Marketed PC1
Marketed PC2
Marketed PC3
Marketed PC4
Marketed PC5
Marketed PC6
pH (5–6) 5.3±0.21 4.9±0.22 4.7±0.25 5.1±0.23 4.8±0.21 4.8±0.27LOD (NMT 11%) 6.68±0.38 6.75±0.54 7.62±0.385 6.20±0.24 8.51±0.16 3.04±0.21Total Ash (NMT 15%) 13.70±0.16 12.33±0.74 11.65±0.14 16.26±0.34 12.63±0.36 16.52±0.22Acid-insoluble ash (NMT 4%) 1.32±0.12 2.59±0.42 1.44±0.21 3.64±0.19 2.54±0.35 6.27±0.28Water-soluble Ash 4.39±0.18 2.94±0.38 8.07±0.48 6.59±0.59 8.93±0.74 4.63±0.25Alcohol-soluble extractive (NLT 12%)
13.72±0.61 13.47±0.58 11.45±0.84 9.13±0.54 12.20±0.15 9.70±0.58
Water-soluble extractive (NLT 13%)
65.76±0.52 67.98±0.23 66.57±0.52 59.79±0.58 65.23±0.25 48.19±0.25
PC: Pushyanuga churna
Table 6: Preliminary phytochemical screening of different marketed formulations of PC
Phytochemical constituents
Test performed with Inference
Marketed PC1
Marketed PC2
Marketed PC3
Marketed PC4
Marketed PC5
Marketed PC6
Flavonoids (CH3COO) 2 Pb solution Present Present Present Absent Present PresentIncreasing amount of NaOH solution
Absent Absent Absent Present Absent Absent
Phenolic compounds
K2Cr2O7 solution Present Present Present Present Present PresentKMnO4 solution Present Present Present Present Present Present
Alkaloids Wagner’s reagent Present Present Present Absent Present PresentMayer’s reagent Present Present Present Absent Present Present
Saponins Water with vigorous shaking Present Present Present Present Present PresentTerpenoids Chloroform and carefully
addition of concentrated H2SO4
Present Present Present Present Present Present
Glycosides Water and NaOH Present Present Present Present Present PresentPC: Pushyanuga churna
Table 7: Physical characteristics of different marketed formulations of PC
Parameters Marketed PC1
Marketed PC2
Marketed PC3
Marketed PC4
Marketed PC5
Marketed PC6
Bulk density (g/ml) 0.357±0.003 0.455±0.012 0.400±0.009 0.455±0.010 0.408±0.015 3.336±0.200Tap density (g/ml) 0.556±0.029 0.556±0.066 0.553±0.033 0.553±0.018 0.537±0.075 5.004±0.003Hausner ratio 1.556±0.018 1.222±0.017 1.389±0.011 1.222±0.024 1.316±0.025 1.500±0.002Carr’s index 35.714±0.049 18.182±0.016 28.000±0.027 18.182±0.012 24.00±0.028 33.333±0.185Angle of response (degrees)
41.47±0.021 34.95±0.024 32.37±0.034 41.60±0.042 41.12±0.035 41.12±0.021
PC: Pushyanuga churna
the poor flowability which was further confirmed by high values of Hausner ratio summarized in Table 7.
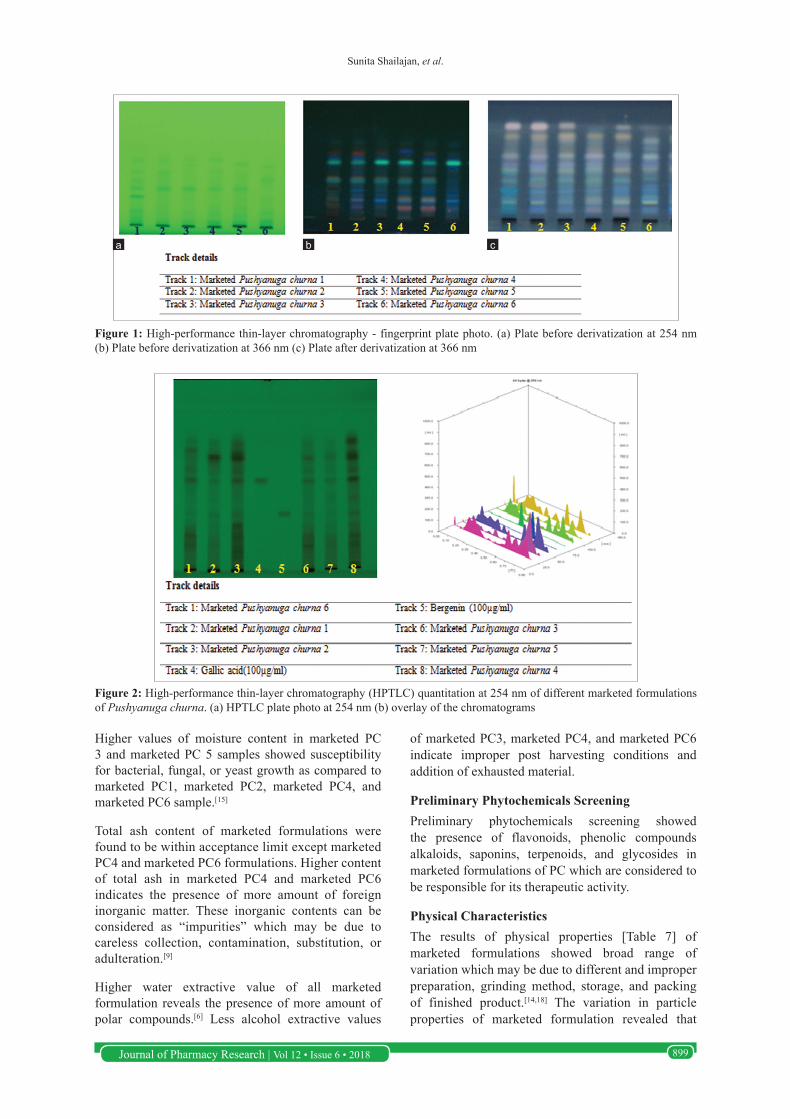
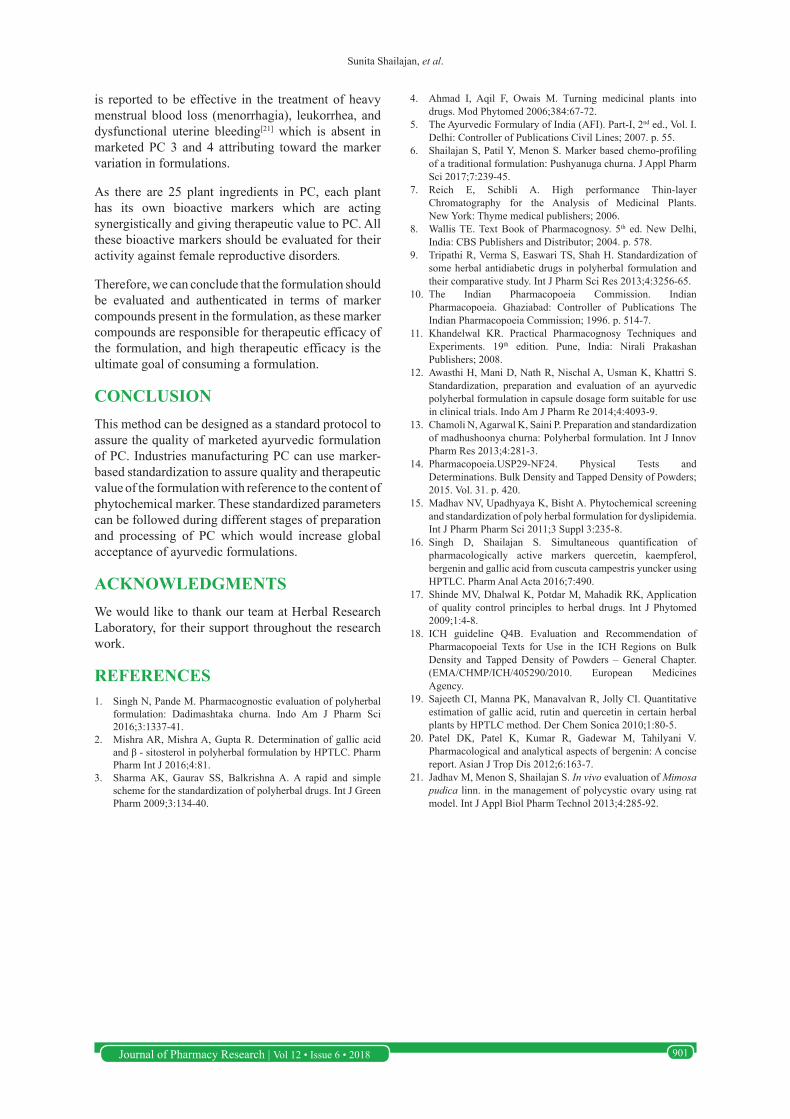
The chromatographic fingerprint was established for different marketed formulations of PC [Figure 1]. Further, a simple, rapid, accurate, and sensitive HPTLC method was developed for the estimation of two therapeutically potent biomarkers, namely gallic acid and bergenin, simultaneously using a toluene:ethyl acetate:methanol:formic acid as mobile phase [Figures 2 and 3].
The maximum content of gallic acid and bergenin was found in marketed PC2 (2.346 ± 0.026 mg/g) and marketed PC4 (2.283 ± 0.175 mg/g), respectively [Table 8].
DISCUSSIONPhysicochemical EvaluationPhysicochemical parameters of all marketed formulations of PC showed loss on drying within the acceptance limits [Table 5].
Sunita Shailajan, et al.
Journal of Pharmacy Research | Vol 12 • Issue 6 • 2018 899
of marketed PC3, marketed PC4, and marketed PC6 indicate improper post harvesting conditions and addition of exhausted material.
Preliminary Phytochemicals ScreeningPreliminary phytochemicals screening showed the presence of flavonoids, phenolic compounds alkaloids, saponins, terpenoids, and glycosides in marketed formulations of PC which are considered to be responsible for its therapeutic activity.
Physical CharacteristicsThe results of physical properties [Table 7] of marketed formulations showed broad range of variation which may be due to different and improper preparation, grinding method, storage, and packing of finished product.[14,18] The variation in particle properties of marketed formulation revealed that
Figure 2: High-performance thin-layer chromatography (HPTLC) quantitation at 254 nm of different marketed formulations of Pushyanuga churna. (a) HPTLC plate photo at 254 nm (b) overlay of the chromatograms
Higher values of moisture content in marketed PC 3 and marketed PC 5 samples showed susceptibility for bacterial, fungal, or yeast growth as compared to marketed PC1, marketed PC2, marketed PC4, and marketed PC6 sample.[15]
Total ash content of marketed formulations were found to be within acceptance limit except marketed PC4 and marketed PC6 formulations. Higher content of total ash in marketed PC4 and marketed PC6 indicates the presence of more amount of foreign inorganic matter. These inorganic contents can be considered as “impurities” which may be due to careless collection, contamination, substitution, or adulteration.[9]
Higher water extractive value of all marketed formulation reveals the presence of more amount of polar compounds.[6] Less alcohol extractive values
Figure 1: High-performance thin-layer chromatography - fingerprint plate photo. (a) Plate before derivatization at 254 nm (b) Plate before derivatization at 366 nm (c) Plate after derivatization at 366 nm
a b c

Sunita Shailajan, et al.
Journal of Pharmacy Research | Vol 12 • Issue 6 • 2018900
marketed PC 2, marketed PC 3, marketed PC 4 and marketed PC 5 have better flow properties and high solubility. Therefore, ease for administration and absorption of churna through oral route will be better in these marketed formulations.
Chromatographic FingerprintChromatographic fingerprint of hydroalcoholic extracts of the marketed formulations showed variation in fingerprint profile [Figure 1]. The observed variation might be due to the variation in the quality of ingredients or unavailability of the authentic ingredients. This variation can also be attributed to differences in their geographical distribution, different vernacular names of plant ingredients, lack of knowledge about authentic source and authentic plant, and improper post-processing methods utilized during the preparation of the formulation. These fingerprints can be used to prevent ingredient-based adulterations which might play a key role in the therapeutics of the formulation.
Gallic Acid and BergeninFor simultaneous estimation of gallic acid and bergenin from marketed formulations of PC, a validated method reported by our group was employed.[16]
Chromatographic evaluation using mobile phase toluene:ethyl acetate:methanol:formic acid gave the best resolution of bergenin and gallic acid from the other components of the hydroalcoholic extract of marketed formulations of PC.
Therapeutically important biomarkers gallic acid and bergenin have been reported to possess various pharmacological activities. Gallic acid possesses cytotoxicity against cancer cells, antioxidant, anti-inflammatory, hepatoprotective, neuroprotective, analgesic activity,[6,19] etc.
Bergenin is reported to possess biological activities such as antiulcerogenic, anti-HIV, antifungal, hepatoprotective, antiarrhythmic, neuroprotective, anti-inflammatory, immunomodulatory, and burn wound healing properties.[20] Furthermore, ursolic acid, β-sitosterol, and lupeol have been reported from PC.[6] Based on the concentration of bioactive markers, formulations can be selected having maximum content supporting its efficacy.
The variation in the marker content among the marketed formulations may be due to variation in climatic conditions of different geographical regions in India. It can be due to collection of plant material in different seasons, for example, collection of Myrica nagi bark in summer and winter. Furthermore, it may be due to the substitution of some plant material with related species or totally different plant with the same therapeutic value.
For example, in marketed PC 1, Bergenia ligulata has been substituted with Bergenia ciliata, similarly in marketed formulation 6, Cissampelos pareira has been substituted with Cyclea peltata. Mimosa pudica, one of the most important ingredients of PC,
Figure 3: Spectral analysis of marketed formulations of Pushyanuga churna for bergenin and gallic acid at 254 nm
Table 8: Content of bergenin and gallic acid in the marketed formulations of PC
Sample Gallic acid Bergenin
Concentration (mg/g) mean±SD, n=3Marketed PC1 0.537±0.108 0.801±0.109Marketed PC2 2.346±0.026 1.950±0.150Marketed PC3 0.945±0.017 0.922±0.028Marketed PC4 2.078±0.028 2.283±0.175Marketed PC5 0.417±0.019 0.016±0.027Marketed PC6 1.470±0.025 0.114±0.179PC: Pushyanuga churna
Sunita Shailajan, et al.
Journal of Pharmacy Research | Vol 12 • Issue 6 • 2018 901
is reported to be effective in the treatment of heavy menstrual blood loss (menorrhagia), leukorrhea, and dysfunctional uterine bleeding[21] which is absent in marketed PC 3 and 4 attributing toward the marker variation in formulations.
As there are 25 plant ingredients in PC, each plant has its own bioactive markers which are acting synergistically and giving therapeutic value to PC. All these bioactive markers should be evaluated for their activity against female reproductive disorders.
Therefore, we can conclude that the formulation should be evaluated and authenticated in terms of marker compounds present in the formulation, as these marker compounds are responsible for therapeutic efficacy of the formulation, and high therapeutic efficacy is the ultimate goal of consuming a formulation.
CONCLUSIONThis method can be designed as a standard protocol to assure the quality of marketed ayurvedic formulation of PC. Industries manufacturing PC can use marker-based standardization to assure quality and therapeutic value of the formulation with reference to the content of phytochemical marker. These standardized parameters can be followed during different stages of preparation and processing of PC which would increase global acceptance of ayurvedic formulations.
ACKNOWLEDGMENTSWe would like to thank our team at Herbal Research Laboratory, for their support throughout the research work.
REFERENCES1. Singh N, Pande M. Pharmacognostic evaluation of polyherbal
formulation: Dadimashtaka churna. Indo Am J Pharm Sci 2016;3:1337-41.
2. Mishra AR, Mishra A, Gupta R. Determination of gallic acid and β - sitosterol in polyherbal formulation by HPTLC. Pharm Pharm Int J 2016;4:81.
3. Sharma AK, Gaurav SS, Balkrishna A. A rapid and simple scheme for the standardization of polyherbal drugs. Int J Green Pharm 2009;3:134-40.
4. Ahmad I, Aqil F, Owais M. Turning medicinal plants into drugs. Mod Phytomed 2006;384:67-72.
5. The Ayurvedic Formulary of India (AFI). Part-I, 2nd ed., Vol. I. Delhi: Controller of Publications Civil Lines; 2007. p. 55.
6. Shailajan S, Patil Y, Menon S. Marker based chemo-profiling of a traditional formulation: Pushyanuga churna. J Appl Pharm Sci 2017;7:239-45.
7. Reich E, Schibli A. High performance Thin-layer Chromatography for the Analysis of Medicinal Plants. New York: Thyme medical publishers; 2006.
8. Wallis TE. Text Book of Pharmacognosy. 5th ed. New Delhi, India: CBS Publishers and Distributor; 2004. p. 578.
9. Tripathi R, Verma S, Easwari TS, Shah H. Standardization of some herbal antidiabetic drugs in polyherbal formulation and their comparative study. Int J Pharm Sci Res 2013;4:3256-65.
10. The Indian Pharmacopoeia Commission. Indian Pharmacopoeia. Ghaziabad: Controller of Publications The Indian Pharmacopoeia Commission; 1996. p. 514-7.
11. Khandelwal KR. Practical Pharmacognosy Techniques and Experiments. 19th edition. Pune, India: Nirali Prakashan Publishers; 2008.
12. Awasthi H, Mani D, Nath R, Nischal A, Usman K, Khattri S. Standardization, preparation and evaluation of an ayurvedic polyherbal formulation in capsule dosage form suitable for use in clinical trials. Indo Am J Pharm Re 2014;4:4093-9.
13. Chamoli N, Agarwal K, Saini P. Preparation and standardization of madhushoonya churna: Polyherbal formulation. Int J Innov Pharm Res 2013;4:281-3.
14. Pharmacopoeia.USP29-NF24. Physical Tests and Determinations. Bulk Density and Tapped Density of Powders; 2015. Vol. 31. p. 420.
15. Madhav NV, Upadhyaya K, Bisht A. Phytochemical screening and standardization of poly herbal formulation for dyslipidemia. Int J Pharm Pharm Sci 2011;3 Suppl 3:235-8.
16. Singh D, Shailajan S. Simultaneous quantification of pharmacologically active markers quercetin, kaempferol, bergenin and gallic acid from cuscuta campestris yuncker using HPTLC. Pharm Anal Acta 2016;7:490.
17. Shinde MV, Dhalwal K, Potdar M, Mahadik RK, Application of quality control principles to herbal drugs. Int J Phytomed 2009;1:4-8.
18. ICH guideline Q4B. Evaluation and Recommendation of Pharmacopoeial Texts for Use in the ICH Regions on Bulk Density and Tapped Density of Powders – General Chapter. (EMA/CHMP/ICH/405290/2010. European Medicines Agency.
19. Sajeeth CI, Manna PK, Manavalvan R, Jolly CI. Quantitative estimation of gallic acid, rutin and quercetin in certain herbal plants by HPTLC method. Der Chem Sonica 2010;1:80-5.
20. Patel DK, Patel K, Kumar R, Gadewar M, Tahilyani V. Pharmacological and analytical aspects of bergenin: A concise report. Asian J Trop Dis 2012;6:163-7.
21. Jadhav M, Menon S, Shailajan S. In vivo evaluation of Mimosa pudica linn. in the management of polycystic ovary using rat model. Int J Appl Biol Pharm Technol 2013;4:285-92.