four validated spectrophotometric methods for...
TRANSCRIPT

Journal of Pharmacy Research | Vol 12 • Issue 4 • 2018446
INTRODUCTIONIn common cold and cough treatment, it is necessary to design formulation with optimal efficiency for each active ingredient. Ambroxol (AMB), guaifenesin (GUA), and theophylline (THEO) Figure 1 are among the most commonly formulated active ingredients in such products.
AMB is an active metabolite of bromhexine used as mucolytic in productive cough and reduce the number of exacerbations,[1] AMB is trans-4-[(2-Amino-3,5-dibromobenzyl)amino]cyclohexanol hydrochloride.[2] GUA used for a productive cough as an expectorant to increase the volume and reduce the viscosity of tenacious sputum, this action facilitates removal of mucus and reduces irritation of bronchial tissue. It reduces cough reflux sensitivity in patients with upper respiratory tract infections.[1] GUA Chemically is (2RS)-3-(2-Methoxyphenoxy)propane-
1,2-diol.[2] THEO is a xanthine with a chemical name; 1,3-Dimethyl-3,7-dihydro-1H-purine-2,6-dione.[2] It is used as a bronchodilator for managing reversible airway obstruction in asthma.[1]
Literature survey revealed several methods which were reported for determination of AMB, GUA, and THEO, with other drugs or with each other as combination, including; High-performance liquid chromatography (HPLC) determination of AMB and GUA as a binary mixture,[3-9] thin-layer chromatography-densitometric, and multivariate calibration methods,[4] while GUA and THEO had been determined by HPLC,[10-12] chemometric spectrophotometric methods,[10,13] univariate spectrophotometric methods.[12,14] Only two reports were found for determination of AMB, GUA, and THEO as a ternary mixture; univariate spectrophotometric methods[15] and HPLC with multivariate calibration.[16]
Ternary mixtures always involve the complexity of quantitative determination using univariate spectrophotometric methods. The aim of this work is to apply some of these methods for resolution and quantitation of ternary mixture’s components.
Four validated spectrophotometric methods for determination of ambroxol, guaifenesin, and theophylline in their ternary mixture in bulk powder and dosage formShereen A. Boltia1, Ahmed S. Fayed1, Maha A. Hegazy1, Awadh Musaed2*
Review Article
ABSTRACT
The purpose of the present study was to develop and validate spectrophotometric methods for simultaneous determination of a ternary mixture of ambroxol HCl (AMB), guaifenesin (GUA) and theophylline (THEO) in pharmaceutical dosage forms. (a) Direct spectrophotometry (DS), (b) dual wavelength (DW), (c) first derivative of ratio spectra (1DD), and (d) absorption correction (AC). DS method was applied to determine AMB at its λmax (309.0 nm) without any interference of THEO and GUA. Both THEO and GUA were determined as a binary mixture after removal of AMB contribution from the ternary mixture by ratio subtraction technique. DW method was applied to determine GUA by measuring the difference in absorbance at 224.5 nm and 255.0 nm. 1DD was used to determine THEO at 295.4 nm and GUA at 236.5 nm using 14.0 μg/mL GUA and 14.5 μg/mL THEO as divisors, respectively. AC was applied after the second derivative for determination of GUA at 239.5 nm and THEO at 239.5 nm and 266.0 nm. The methods were accurate, specific, and successfully applied for the determination of the three drugs in laboratory prepared mixtures and their combined dosage form.
KEY WORDS: Ambroxol, Derivative, Dual wavelength, Guaifenesin, Ratio subtraction, Theophylline
1Department of Analytical Chemistry, Faculty of Pharmacy, Cairo University, Cairo 11562, Egypt, 2Department of Analytical Chemistry, Faculty of Pharmacy, Aden University, Yemen
*Corresponding author: Awadh Musaed, Kar Al-aini Street, 11562, Cairo, Egypt. Phone: 00201100616138. E-mail: [email protected]
Received on: 03-01-2017; Revised on: 26-01-2018; Accepted on: 25-02-2018
Access this article online
Website: jprsolutions.info ISSN: 0974-6943

Shereen A. Boltia, et al.
Journal of Pharmacy Research | Vol 12 • Issue 4 • 2018 447
THEORY OF ABSORPTION CORRECTION (AC) METHODFor a mixture of two components (X and Y), the concentration of X (THEO) could be determined at λ1 where no interference of Y (GUA), by:
CA
a bX
X
X
λλ
λ1
1
1
=
While at λ2, the concentration is the sum of CX and CY,
CTλ2=CXλ2+CYλ2
The absorbance of X (THEO) at λ1, AXλ1 is converted to its corresponding absorbance at λ2, AXλ2 as follows:
Since:
CXλ1=CYλ2,
A
a b
A
a b
X
X
X
X
λ
λ
λ
λ
1
1
2
2
=
Therefore:
AA
a ba b
X
X
X
Xλλ
λλ2
1
1
2=
Hence, the concentration of Y (GUA) can be determined at λ2 as follows:
A A AT X Y 2 2 2
= +
A C a C aT X X Y Yλ λ λ λ λ2 2 2 2 2
= × + ×( ) ( )
CA C a
aY
T X X
Y
λλ λ λ
λ2
2 2 2
2
= − ×[ ( )]
Where A, AT, are the absorbance, of X (THEO) and Y (GUA) at λ1 (266) and λ2 (239.5nm), respectively. CX, CY, CT are the concentrations of X (THEO), Y (GUA) and the total concentration of both, respectively. aX, aY, are the absorptivity of X (THEO) and Y (GUA).[17]
EXPERIMENTALInstruments and SoftwareA SHIMADZU double beam ultraviolet (UV)-1800 spectrophotometer, with two 1cm path length quartz cuvettes, connected to pc computer with UV Probe v. 2.43 software was used for measurement and processing of data, scan was carried out in the range from 200 nm to 400 nm at 0.1 nm interval.
Pure Samples and Chemicals
• Pure AMB, GUA, and THEO samples were kindly supplied by GlaxoSmithKline S.A.E, El Salam City, Cairo, A.R.E., with certified purity of 99.9%, 99.7%, and 99.8, respectively, according to the manufacturer’s method.
• Methanol (SDFCL) of analytical-grade.
Pharmaceutical FormulationTrisolvin® capsules (B.N.A518682), manufactured by GlaxoSmithKline S.A.E., El Salam City, Cairo, A.R.E. labeled to contain 30 mg AMB, 100 mg GUA, and 60 mg THEO per capsule. They were purchased from local markets.
Standard SolutionsStock standard solutionsAll AMB, GUA, and THEO stock standard solutions were prepared separately by weighting 50.0 mg of each drug, transferred quantitatively to 50-mL volumetric flasks then the volumes were completed with methanol, a final concentration of 1 mg/mL was obtained.
Working standard solutionsBy transferring 10.0 mL from stock standard solution of each drug into 100-mL volumetric flask and completed with methanol to give a final concentration of 100.0 µg/mL.
Sample SolutionsTen Trisolvin®capsules were splitted with a clean sharp open blade into halves, then placed in 500-mL beaker the blade was washed with 100 mL of methanol, another 100 mL of methanol were added, then sonicated for 30 min. The supernatant liquid was filtered in 500-mL volumetric flask. A volume of 100 mL of methanol were added to shells and sonicated for another 30 min, then filtered to the same volumetric flask. The final portion of 100 mL of methanol was added, sonicated for 30 min and the remaining volume was completely filtered to 500-mL volumetric flask then the volume was completed with methanol to the mark. Finally, 5 mL was accurately transferred to 100-mL flask to be used as working solution.
PROCEDURESpectral Characteristics of AMB, GUA, and THEOThe absorption spectra of AMB (3.0–53.0 µg/mL), GUA (2.0–38.0 µg/mL), and THEO (2.0-27.0 µg/mL) were recorded in the range of 200–400 nm using methanol as blank.
LinearityAccurately measured aliquots of AMB, GUA, and THEO were transferred from their corresponding
Shereen A. Boltia, et al.
Journal of Pharmacy Research | Vol 12 • Issue 4 • 2018448
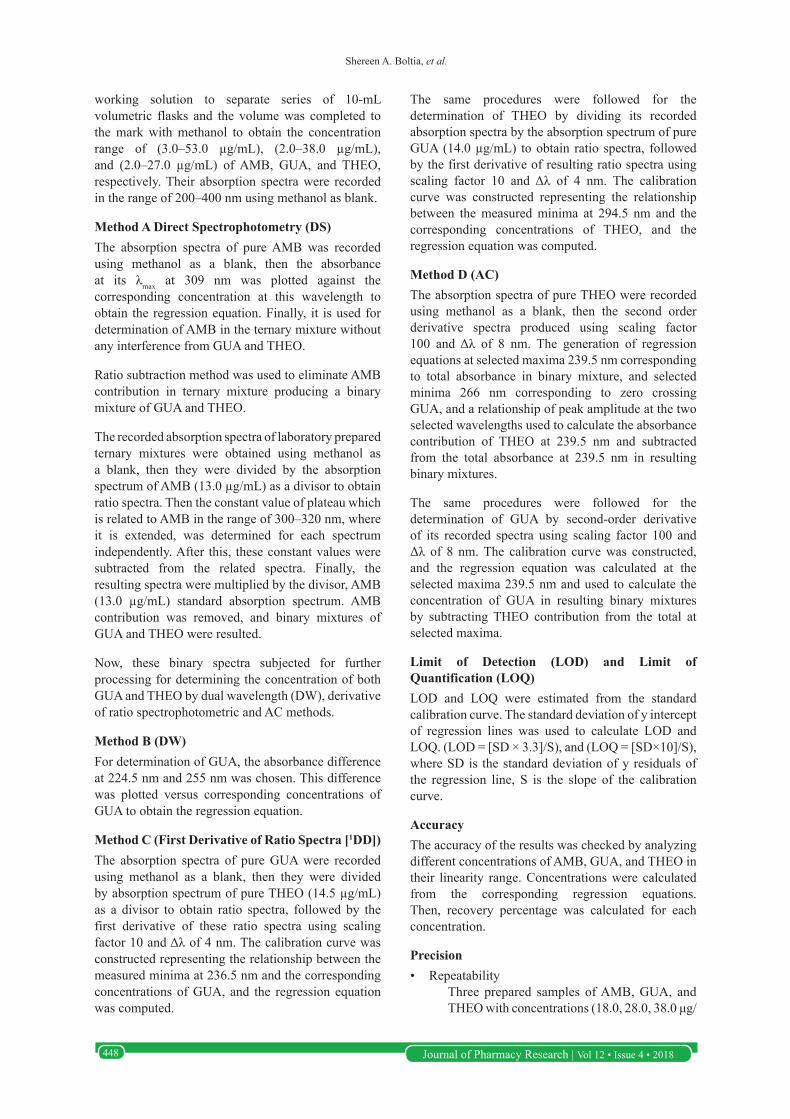
working solution to separate series of 10-mL volumetric flasks and the volume was completed to the mark with methanol to obtain the concentration range of (3.0–53.0 µg/mL), (2.0–38.0 µg/mL), and (2.0–27.0 µg/mL) of AMB, GUA, and THEO, respectively. Their absorption spectra were recorded in the range of 200–400 nm using methanol as blank.
Method A Direct Spectrophotometry (DS)The absorption spectra of pure AMB was recorded using methanol as a blank, then the absorbance at its λmax at 309 nm was plotted against the corresponding concentration at this wavelength to obtain the regression equation. Finally, it is used for determination of AMB in the ternary mixture without any interference from GUA and THEO.
Ratio subtraction method was used to eliminate AMB contribution in ternary mixture producing a binary mixture of GUA and THEO.
The recorded absorption spectra of laboratory prepared ternary mixtures were obtained using methanol as a blank, then they were divided by the absorption spectrum of AMB (13.0 µg/mL) as a divisor to obtain ratio spectra. Then the constant value of plateau which is related to AMB in the range of 300–320 nm, where it is extended, was determined for each spectrum independently. After this, these constant values were subtracted from the related spectra. Finally, the resulting spectra were multiplied by the divisor, AMB (13.0 µg/mL) standard absorption spectrum. AMB contribution was removed, and binary mixtures of GUA and THEO were resulted.
Now, these binary spectra subjected for further processing for determining the concentration of both GUA and THEO by dual wavelength (DW), derivative of ratio spectrophotometric and AC methods.
Method B (DW)For determination of GUA, the absorbance difference at 224.5 nm and 255 nm was chosen. This difference was plotted versus corresponding concentrations of GUA to obtain the regression equation.
Method C (First Derivative of Ratio Spectra [1DD])The absorption spectra of pure GUA were recorded using methanol as a blank, then they were divided by absorption spectrum of pure THEO (14.5 µg/mL) as a divisor to obtain ratio spectra, followed by the first derivative of these ratio spectra using scaling factor 10 and Δλ of 4 nm. The calibration curve was constructed representing the relationship between the measured minima at 236.5 nm and the corresponding concentrations of GUA, and the regression equation was computed.
The same procedures were followed for the determination of THEO by dividing its recorded absorption spectra by the absorption spectrum of pure GUA (14.0 µg/mL) to obtain ratio spectra, followed by the first derivative of resulting ratio spectra using scaling factor 10 and Δλ of 4 nm. The calibration curve was constructed representing the relationship between the measured minima at 294.5 nm and the corresponding concentrations of THEO, and the regression equation was computed.
Method D (AC)The absorption spectra of pure THEO were recorded using methanol as a blank, then the second order derivative spectra produced using scaling factor 100 and Δλ of 8 nm. The generation of regression equations at selected maxima 239.5 nm corresponding to total absorbance in binary mixture, and selected minima 266 nm corresponding to zero crossing GUA, and a relationship of peak amplitude at the two selected wavelengths used to calculate the absorbance contribution of THEO at 239.5 nm and subtracted from the total absorbance at 239.5 nm in resulting binary mixtures.
The same procedures were followed for the determination of GUA by second-order derivative of its recorded spectra using scaling factor 100 and Δλ of 8 nm. The calibration curve was constructed, and the regression equation was calculated at the selected maxima 239.5 nm and used to calculate the concentration of GUA in resulting binary mixtures by subtracting THEO contribution from the total at selected maxima.
Limit of Detection (LOD) and Limit of Quantification (LOQ)LOD and LOQ were estimated from the standard calibration curve. The standard deviation of y intercept of regression lines was used to calculate LOD and LOQ. (LOD = [SD × 3.3]/S), and (LOQ = [SD×10]/S), where SD is the standard deviation of y residuals of the regression line, S is the slope of the calibration curve.
AccuracyThe accuracy of the results was checked by analyzing different concentrations of AMB, GUA, and THEO in their linearity range. Concentrations were calculated from the corresponding regression equations. Then, recovery percentage was calculated for each concentration.
Precision• Repeatability
Three prepared samples of AMB, GUA, and THEO with concentrations (18.0, 28.0, 38.0 μg/

Shereen A. Boltia, et al.
Journal of Pharmacy Research | Vol 12 • Issue 4 • 2018 449
mL, 11.0, 20.0, 26.0 μg/mL, 12.0, 17.0, 22.0 μg/mL) of AMB, GUA, and THEO, respectively, were analyzed 3 times within the day. Relative SD (RSD) % values were then calculated.
• Intermediate precision.
The above-selected samples of AMB, GUA, and THEO were analyzed 3 times in three successive days. Then, RSD% values were calculated.
SpecificityLaboratory prepared mixtures containing AMB, GUA, and THEO in different ratios within the linearity ranges with the dosage form ratio were used for the evaluation of specificity of the developed methods. Recovery percentage and RSD were calculated.
Application of the Proposed Methods in Assay of Trisolvin® CapsulesExtracted capsules solution was prepared as mentioned under sample solutions, and the general procedures under linearity were followed.
RESULTS AND DISCUSSIONThe absorption spectra of AMB, GUA, and THEO, were found to be severely overlapped as shown in Figure 2, thus hider direct determination with the conventional zero-order spectrophotometry. AMB can be easily determined directly at its maximum wavelength (309.0 nm) without any practical interference from GUA and THEO [Figure 3]. While resolution and quantitation of GUA and THEO could be achieved by removing AMB by ratio subtraction method, then using three spectrophotometric methods to resolve the interference of each other.
Validation of the methods has been carried out according to the ICH guidelines.[18]
Method A (DS)AMB was determined directly through its maximum absorbance at 309.0 nm in the concentration range (3.0–53.0 µg/mL) without any practical interference with GUA and THEO as shown in Figure 3. The AMB absorbance at 309 nm was plotted against its corresponding concentration. AMB concentration could be determined in laboratory prepared mixtures from the regression equation at 309nm, as represented in Figure 4.
Ratio subtraction method was used to eliminate the contribution of AMB in the ternary mixture which simplifies the determination of GUA and THEO as a binary mixture.
For optimization of application of ratio subtraction method, several AMB divisors were tested as (8.0,
13.0, 18.0, and 23.0 µg/mL), the best results were obtained on using a standard spectrum of 13.0 µg/mL of AMB as a divisor. Dividing all ternary laboratory prepared mixtures spectra by 13.0 µg/mL AMB standard absorption spectrum, to obtain ratio spectra Figure 5a.
After subtracting the absorbance of AMB of the plateau at 300–320 nm for every spectrum independently Figure 5b, the obtained spectra were multiplied by spectrum of the divisor (AMB, 13.0 µg/mL). This will eliminate AMB and spectra of the ternary mixture
Figure 1: Structures of (a) ambroxol HCl, (b) guaifenesin, (c) theophylline
Figure 2: Ultraviolet absorption spectra of 18.0 µg/mL ambroxol, 20.0 µg/mL guaifenesin, 17.0 µg/mL theophylline
Figure 3: Ultraviolet absorption spectra of ambroxol in concentration range (3.0–53.0 µg/mL) using methanol as a blank
a
b c
Shereen A. Boltia, et al.
Journal of Pharmacy Research | Vol 12 • Issue 4 • 2018450
are converted to binary mixtures spectra of GUA and THEO only, Figure 5c.
Now the resulted spectra of a binary mixture of GUA and THEO were subjected to further processing to obtain the concentration of both GUA and THEO by DW, ratio derivative, and AC methods.
Method B (DW)DW method copes with the level of interference when the spectra are strongly overlapped. To optimize the method, different pairs of wavelengths were selected and tried to show zero absorbance difference for THEO. A pair of wavelengths, 224.5 nm, and 255.0 nm was chosen, at which the difference in absorption for pure GUA was directly proportional to its concentration while that for pure THEO regarded
as interferent was zero, Figure 6a and b. Then, the difference in absorbance at 224.5 nm and 255.0 nm was calculated and plotted against the corresponding concentration of GUA which was used for calculation of its concentration in laboratory mixtures, [Figure 6c].
Method C (1DD)1DD is a successful and widely used as an application of the derivative spectrophotometric method.[19]
It has been applied for the simultaneous determination of GUA and THEO in their binary mixture.
As shown in Figure 6b, the GUA and THEO spectra are overlapped and interfere with the direct determination of anyone in the presence of the other at their λmax. Derivative of ratio spectra method was established to achieve good resolution and remove interference. The main advantage of this method is that the whole spectrum of the interfering component is canceled.
For optimization of derivative of ratio spectra method for GUA determination, the spectra of different concentrations of THEO were tested as divisors (9.5, 12.0, 14.5, 17.0, and 19.5 µg/mL). The best results were obtained on using a standard spectrum of 14.5 µg/mL of THEO as a divisor. The absorption spectra of GUA in the concentration range of (2.0–38.0 µg/mL) were divided by the absorption spectrum of 14.5 µg/mL of THEO to obtain the ratio spectra [Figure 7a]. The first derivative of the obtained ratio spectra was calculated using Δλ = 4 and scaling factor = 10 as shown in Figure 7b.
1DD showed good linearity and reproducibility at minima 236.5 nm [Figure 7c]. The corresponding regression equation was used for calculating GUA concentration in the laboratory-prepared mixture.
For the determination of THEO, the same procedures were performed; the spectra of different concentrations of GUA were tested as divisors (11.0, 14.0, 17.0, and 20.0 µg/mL). The best results were obtained by using a standard spectrum of 14 µg/mL of GUA as a divisor. The absorption spectra of THEO in the concentration range of (2.0–27.0 µg/mL) were divided by the absorption spectrum of 14.0 µg/mL of GUA to obtain the ratio spectra Figure 7d. The first derivative of the obtained ratio spectra was calculated using Δλ = 4 and scaling factor = 10 as shown in Figure 7e.
1DD showed good linearity and reproducibility at minima 294.5 nm. The corresponding regression equation was used for calculating THEO concentration in the laboratory-prepared mixtures Figure 7f.
Method D (AC)AC method has been applied for the determination of GUA and THEO together by selecting two wavelengths,
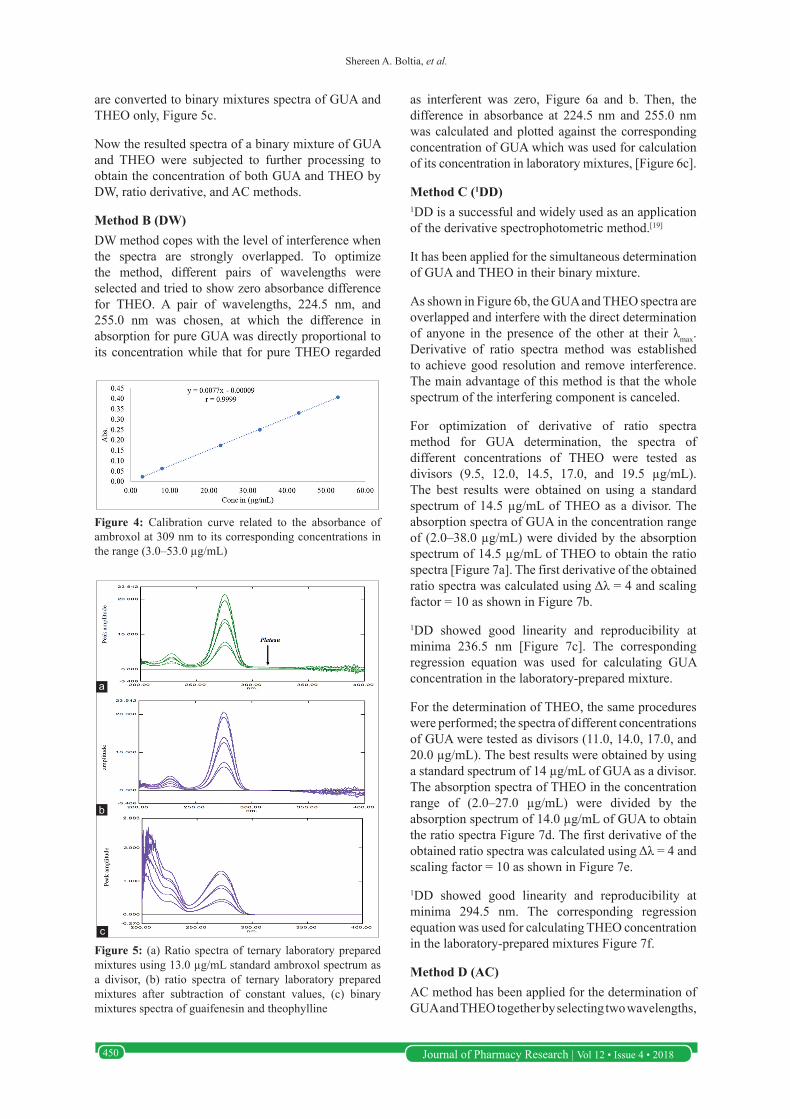
Figure 4: Calibration curve related to the absorbance of ambroxol at 309 nm to its corresponding concentrations in the range (3.0–53.0 µg/mL)
Figure 5: (a) Ratio spectra of ternary laboratory prepared mixtures using 13.0 µg/mL standard ambroxol spectrum as a divisor, (b) ratio spectra of ternary laboratory prepared mixtures after subtraction of constant values, (c) binary mixtures spectra of guaifenesin and theophylline
a
b
c

Shereen A. Boltia, et al.
Journal of Pharmacy Research | Vol 12 • Issue 4 • 2018 451
one of them was used for the determination of THEO only without the interference of GUA, and the otter wavelength for the determination of GUA in the total after subtraction of THEO contribution.
For the quantitative determination of GUA in the presence of THEO, from the binary mixture spectra Figure 5c, obtained previously, the second derivative
of pure GUA spectra was calculated using Δλ = 8 and scaling factor = 100, as shown in Figure 8a. A linear correlation obtained between the peak amplitude at 239.5 nm and GUA concentration in the range of (2.0–38.0 µg/mL), as shown in Figure 8b.
For the quantitative determination of THEO in the presence of GUA, from the binary spectra Figure 5c, obtained
Figure 6: (a) Ultraviolet (UV) absorption spectra of guaifenesin (GUA) in concentration range (2.0–38.0 µg/mL) in methanol, (b) UV absorption spectra of 35.0 µg/mL GUA (blue) and 14.5 µg/mL heophylline (red) in methanol, and application of dual wavelength, (c) linearity of absorbance difference of dual wavelength method to the corresponding concentrations of GUA (2.0–38.0 µg/mL) in methanol at 224.5 nm and 255 nm
c
ba
Figure 7: (a) Ratio spectra of guaifenesin (GUA) in concentration range (2.0–38.0 µg/mL) using 14.5 µg/mL standard theophylline (THEO) spectrum as a divisor, (b) first derivative of ratio spectra (1DD) of GUA in the concentration range (2.0–38.0 µg/mL) using 14.5 µg/mL standard THEO spectrum as a divisor ( ̵ • ̵ •), (c) linearity of GUA first ratio derivative spectra at 236.5 nm in concentrations range of (2.0–38.0 µg/mL) in methanol, (d) ratio spectra of THEO in concentration range (2.0–27.0 µg/mL) using 14.0 µg/mL standard GUA spectrum as a divisor, (e) 1DD of THEO in the concentration range (2.0–27.0 µg/mL) using 14.0 µg/mL standard GUA spectrum as a divisor ( ̵ • ̵ •), (f) linearity of THEO 1DD at 294.5 nm in the concentrations range of (2.0–27.0 µg/mL) in methanol
a b
c d
e f

Shereen A. Boltia, et al.
Journal of Pharmacy Research | Vol 12 • Issue 4 • 2018452
previously, the second derivative of pure THEO spectra was calculated using Δλ = 8 and scaling factor = 100, as represented in Figure 8c. A linear correlation obtained between the peak amplitude at 239.5 nm and 266 nm and THEO concentration in the range of (2.0–27.0 µg/mL), as shown in Figure 8d and e. A correlation between THEO peak amplitudes at 239.5 nm and 266 nm was calculated as shown in Figure 8f. While Figure 8g shows the overlapped second order spectra for both GUA and THEO with selected wavelengths. The same procedure was applied for binary mixture spectra.
AC method was also applied for the analysis of laboratory prepared mixtures. Peak amplitude at 239.5 nm was chosen for total determination of
both GUA and THEO, while peak amplitude at 266.0 nm, corresponding to zero crossing GUA, for determination of only THEO.
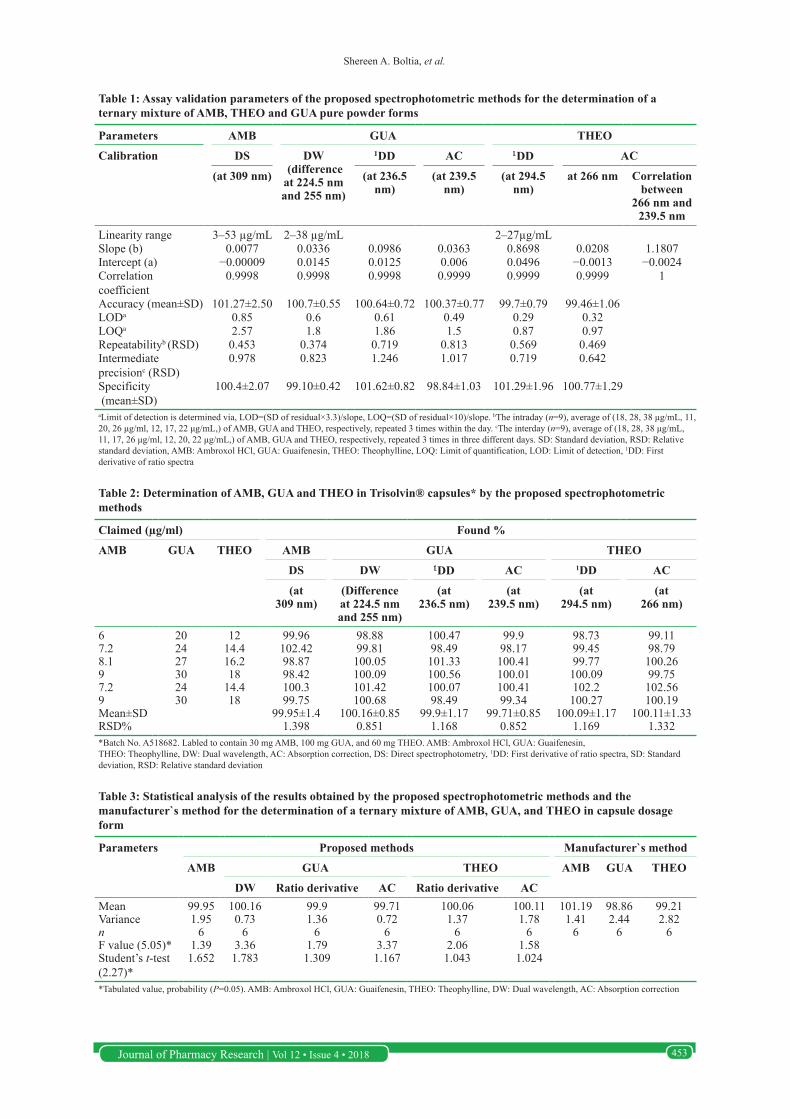
Validation parameters of the proposed spectrophotometric methods for the determination of a ternary mixture of AMB, GUA, and THEO in pure powder forms are shown in Table 1.
Application of the Proposed Methods in Assay of Pharmaceutical FormulationThe four proposed spectrophotometric methods have been successfully applied for the determination of AMB. GUA, and THEO inTrisolvin® capsules as summarized in Table 2.
Figure 8: (a) Second derivative of pure guaifenesin (GUA) in the concentration range (2.0–38.0 µg/mL), (b) linearity of GUA absorption correction method at 239.5 nm in the concentrations range of (2.0–38.0 µg/mL) in methanol, (c) second derivative of pure theophylline (THEO) in the concentration range (2.0–27.0 µg/mL), (d) linearity of THEO absorption correction method at 239.5 nm in the concentrations range of (2.0–38.0 µg/mL) in methanol, (e) linearity of THEO absorption correction method at 266 nm in the concentrations range of (2.0–38.0 µg/mL) in methanol, (f) correlation of linearity of peak amplitude of absorption correction method at 239.5 nm and 266 nm to the corresponding concentrations of THEO (2.0–38.0 µg/mL) in methanol, (g) overlapped second order spectra for both GUA and THEO showing selected wavelengths
ab
c d
ef
g
Shereen A. Boltia, et al.
Journal of Pharmacy Research | Vol 12 • Issue 4 • 2018 453
Table 1: Assay validation parameters of the proposed spectrophotometric methods for the determination of a ternary mixture of AMB, THEO and GUA pure powder forms
Parameters AMB GUA THEO
Calibration DS DW (difference at 224.5 nm and 255 nm)
1DD AC 1DD AC
(at 309 nm) (at 236.5 nm)
(at 239.5 nm)
(at 294.5 nm)
at 266 nm Correlation between
266 nm and 239.5 nm
Linearity range 3–53 µg/mL 2–38 µg/mL 2–27µg/mLSlope (b) 0.0077 0.0336 0.0986 0.0363 0.8698 0.0208 1.1807Intercept (a) −0.00009 0.0145 0.0125 0.006 0.0496 −0.0013 −0.0024Correlation coefficient
0.9998 0.9998 0.9998 0.9999 0.9999 0.9999 1
Accuracy (mean±SD) 101.27±2.50 100.7±0.55 100.64±0.72 100.37±0.77 99.7±0.79 99.46±1.06LODa 0.85 0.6 0.61 0.49 0.29 0.32LOQa 2.57 1.8 1.86 1.5 0.87 0.97Repeatabilityb (RSD) 0.453 0.374 0.719 0.813 0.569 0.469Intermediate precisionc (RSD)
0.978 0.823 1.246 1.017 0.719 0.642
Specificity (mean±SD)
100.4±2.07 99.10±0.42 101.62±0.82 98.84±1.03 101.29±1.96 100.77±1.29
aLimit of detection is determined via, LOD=(SD of residual×3.3)/slope, LOQ=(SD of residual×10)/slope. bThe intraday (n=9), average of (18, 28, 38 μg/mL, 11, 20, 26 μg/ml, 12, 17, 22 μg/mL,) of AMB, GUA and THEO, respectively, repeated 3 times within the day. cThe interday (n=9), average of (18, 28, 38 μg/mL, 11, 17, 26 μg/ml, 12, 20, 22 μg/mL,) of AMB, GUA and THEO, respectively, repeated 3 times in three different days. SD: Standard deviation, RSD: Relative standard deviation, AMB: Ambroxol HCl, GUA: Guaifenesin, THEO: Theophylline, LOQ: Limit of quantification, LOD: Limit of detection, 1DD: First derivative of ratio spectra
Table 2: Determination of AMB, GUA and THEO in Trisolvin® capsules* by the proposed spectrophotometric methods
Claimed (µg/ml) Found %
AMB GUA THEO AMB GUA THEO
DS DW 1DD AC 1DD AC
(at 309 nm)
(Difference at 224.5 nm and 255 nm)
(at 236.5 nm)
(at 239.5 nm)
(at 294.5 nm)
(at 266 nm)
6 20 12 99.96 98.88 100.47 99.9 98.73 99.117.2 24 14.4 102.42 99.81 98.49 98.17 99.45 98.798.1 27 16.2 98.87 100.05 101.33 100.41 99.77 100.269 30 18 98.42 100.09 100.56 100.01 100.09 99.757.2 24 14.4 100.3 101.42 100.07 100.41 102.2 102.569 30 18 99.75 100.68 98.49 99.34 100.27 100.19Mean±SD 99.95±1.4 100.16±0.85 99.9±1.17 99.71±0.85 100.09±1.17 100.11±1.33RSD% 1.398 0.851 1.168 0.852 1.169 1.332*Batch No. A518682. Labled to contain 30 mg AMB, 100 mg GUA, and 60 mg THEO. AMB: Ambroxol HCl, GUA: Guaifenesin, THEO: Theophylline, DW: Dual wavelength, AC: Absorption correction, DS: Direct spectrophotometry, 1DD: First derivative of ratio spectra, SD: Standard deviation, RSD: Relative standard deviation
Table 3: Statistical analysis of the results obtained by the proposed spectrophotometric methods and the manufacturer`s method for the determination of a ternary mixture of AMB, GUA, and THEO in capsule dosage form
Parameters Proposed methods Manufacturer`s method
AMB GUA THEO AMB GUA THEO
DW Ratio derivative AC Ratio derivative ACMean 99.95 100.16 99.9 99.71 100.06 100.11 101.19 98.86 99.21Variance 1.95 0.73 1.36 0.72 1.37 1.78 1.41 2.44 2.82n 6 6 6 6 6 6 6 6 6F value (5.05)* 1.39 3.36 1.79 3.37 2.06 1.58 Student’s t-test(2.27)*
1.652 1.783 1.309 1.167 1.043 1.024
*Tabulated value, probability (P=0.05). AMB: Ambroxol HCl, GUA: Guaifenesin, THEO: Theophylline, DW: Dual wavelength, AC: Absorption correction

Shereen A. Boltia, et al.
Journal of Pharmacy Research | Vol 12 • Issue 4 • 2018454
Statistical AnalysisResults obtained by the proposed spectrophotometric methods for the determination of the ternary mixture of AMB, GUA, and THEO were statistically compared with the manufacturer`s method.[20] No statistically significant difference with respect to accuracy and precision as represented in Table 3.
CONCLUSIONUnivariate spectrophotometric methods were successfully applied for the determination of three drugs in laboratory prepared mixtures and their combined dosage form. AMB needs no processing due to zero contribution of the other two drugs at its λmax (309 nm). While GUA and THEO were determined as a binary mixture after removal of AMB contribution by ratio subtraction method. DW, ratio derivative, and AC methods were used for resolution and quantification of GUA and THEO in their binary mixture.
REFERENCES1. Sweetman SC. Martindale: The Complete Drug Reference.
36th ed. London, England, UK: Pharmaceutical Press; 2009:2. Commission BP. British Pharmacopoeia. UK: Stationery
Office; 2011.3. Njaria PM, Abuga KO, Kamau KN, Chepkwony HK. A
versatile hplc method for the simultaneous determination of bromhexine, guaifenesin, ambroxol, salbutamol/terbutaline, pseudoephedrine, triprolidine, and chlorpheniramine maleate in cough–cold syrups. Chromatographia 2016;79:1507-14.
4. Abdelkawy M, Metwaly F, El Raghy N, Hegazy M, Fayek N. Simultaneous determination of ambroxol hydrochloride and guaifenesin by hplc, TLC-spectrodensitometric and multivariate calibration methods in pure form and in cough cold formulations. J Chromatogr Sep Tech 2011;2:112.
5. Dubey N, Sahu S, Singh G. Development of hplc method for simultaneous estimation of ambroxol, guaifenesin and salbutamol in single dose form. Indian J Chem Part B Organic Incl Med 2012;51:1633.
6. Maithani M, Sahu S, Chaudhary AK, Singh R. Development and validation of a novel Rp-Hplc method for simultaneous determination of salbutamol sulfate, guaifenesin, and ambroxol hydrochloride in tablet formulation. J Liq Chromatogr Relat
Technol 2012;35:1156-70.7. Kamatham SS, Kolli S, Joga DD, Vasa KR, Yanamadala BD.
Simultaneous estimation of salbutamol, ambroxol and guaifenesin in tablet dosage forms by using Rp-Hplc. Int J Pharm Res Bio Anal 2013;2:1-13.
8. Saleh OA, Yehia AM, El-Azzouny AA, Aboul-Enein HY. A validated chromatographic method for simultaneous determination of guaifenesin enantiomers and ambroxol Hcl in pharmaceutical formulation. RSC Adv 2015;5:93749-56.
9. Rao KL, Krishnaiah C, Babu KS, Reddy KP. Development and validation of a stability-indicating lc method for simultaneous determination of related compounds of guaifenesin, terbutaline sulfate and ambroxol hcl in cough syrup formulation. J Saudi Chem Soc 2014;18:593-600.
10. El-Gindy A, Emara S, Mostafa A. Application and validation of chemometrics-assisted spectrophotometry and liquid chromatography for the simultaneous determination of six-component pharmaceuticals. J Pharm Biomed Anal 2006;41:421-30.
11. Convention, U.S.P., Usp35 Nf30: U. S. Pharmacopoeia National Formulary. United States Pharmacopeial Convention; 2011.
12. Ansari M, Kazemipour M, Shahriar M. Simultaneous quantitation of theophylline and guaifenesin in syrup by hplc, derivative and derivative ratio spectrophotometry for quality control purposes. Iran J Pharm Ther 2006;5:67-72.
13. Zare-Shahabadi V, Shamsipur M, Hemmatenejad B, Akhond M. Simultaneous determination of guaifenesin and theophylline by chemometrics methods. Anal Lett 2010;43:687-700.
14. Hajian R, Shams N, Davarpanah Z. Combination of first derivative spectrophotometry and H-point standard addition method for simultaneous determination of guaifenesin and theophylline in cough syrup. J Chem 2011;8:966-76.
15. Abdelrahman MM, Abdelwahab NS. Superior spectrophotometric method for determination of a ternary mixture with overlapping spectra. Anal Methods 2014;6:509-14.
16. Abdelwahab NS. Determination of ambroxol hydrochloride, guaifenesin, and theophylline in ternary mixtures and in the presence of excipients in different pharmaceutical dosage forms. J AOAC Intern 2012;95:1629-38.
17. Patel K, Patel A, Dave J, Patel C. Absorbance correction method for estimation of telmisartan and metoprolol succinate in combined tablet dosage forms. Pharm Methods 2012;3:106-11.
18. Borman PE, David, Q2. (R1) Validation of Analytical Procedures. ICH Quality Guidelines: An Implementation Guide; 2017. p. 127.
19. Salinas F, Nevado JB, Mansilla AE. A new spectrophotometric method for quantitative multicomponent analysis resolution of mixtures of salicylic and salicyluric acids. Talanta 1990;37:347-51.
20. Pharco-Pharmaceuticals. Quality Control Manufacturer`S Method. Alexandria, Egypt: Pharco-Pharmaceuticals; 1984.