inhibitory spectra of isolated tannin-rich fraction and...
TRANSCRIPT

Drug Invention Today | Vol 9 • Issue 3 • 201774
Inhibitory spectra of isolated tannin-rich fraction and assessment of compounds using chromatographic techniquesRajeswari Anburaj1*, Vinoth jothiprakasam2
INTRODUCTIONTannins are defined as naturally occurring water-soluble polyphenols of varying molecular weight.[1] These phenolic compounds are found to be occurring in vascular plant tissues of leaves, seeds, and flowers. Tannins inhibit the growth of a number of microorganisms, resist microbial attack, and are recalcitrant to biodegradation.[2] According to their structures, they are categorized as hydrolysable tannins, condensed tannins, or complex tannins.[3] Hydrolysable tannins are the esters of 3, 4, 5-trihydroxyl benzoic acid (gallic acid). Condensed tannins (proanthocyanidins) are flavan-3-ol-based biopolymers that at high temperature alcohol solutions of strong mineral acid release anthocyanidins and catechins as end groups. Condensed tannins have
Research Article
1Department of Microbiology, MIET Arts and Science College, Affiliated to Bharathidasan University, Tiruchirapalli, Tamil Nadu, India, 2CAS in Marine Biology, Annamalai University, Parangipettai, Tamil Nadu, India
*Corresponding author: A. Rajeswari, Assistant Professor, MIET Arts and Science College, Department of Microbiology, Bharathidasan University, Tiruchirapalli - 620 024, Tamil Nadu, India. Phone: +91-9043835023. E-mail: [email protected]
Received on: 15-11-2017; Revised on: 20-12-2017; Accepted on: 18-01-2018
Access this article online
Website: jprsolutions.info ISSN: 0975-7619
attracted interest because of their antioxidant and other potentially health-promoting qualities.[4-6] However, the biological activity of plant condensed tannins depends on their chemical structure and concentration.[7] Gallotannins, the polygalloyl esters of glucose, are the simplest hydrolysable tannins. 1, 2, 3, 4, 6-penta-O-galloyl-β-D-glucose is a prototypical gallotannin and the central compound in the biosynthetic pathway of hydrolysable tannin has core structures in which a carbohydrate or quinic acid is galloylated at several hydroxyl groups. Gallotannins have been studied to exhibit diverse biological effects ranging from anti-inflammation to antioxidant effects.[8,9] Gallic acid molecules are esterified to a core polyol, and the galloyl groups may be further esterified or oxidatively cross-linked to form more complex structures. Chromatography is commonly used for the separation of both condensed and hydrolyzable tannins from simple phenolic compounds on a preparative scale.[10,11] Reverse phase-high-performance liquid chromatography (RP-HPLC)
ABSTRACT
Introduction: Tannins, secondary metabolites of plants, are mostly water-soluble phenolic compounds exhibit numerous biological and antibacterial-promoting and antioxidant effects. Objective: The aim of the study is to characterize the various classes of tannins and to screen their biological activity. Materials and Methods: Isolation of tannin-rich fraction was done by means of column chromatography and assessment of compounds was done using bioassay techniques. Characterization of compounds was analyzed by means of ultraviolet (UV)-visible, Fourier-transform infrared spectroscopy (FTIR), and reverse phase-high performance liquid chromatography (RP-HPLC). Results: Antimicrobial screening reveals that Syzygium aromaticum fraction 2 (21.6 mm) and 3 (18.3 mm) exhibit broad spectrum of activity followed by Candida glabrata (17.5 mm). Screening of tannin-rich fraction indicates that Escherichia coli, Proteus mirabilis, and C. glabrata remained sensitive toward the fraction, whereas Salmonella typhi, Aspergillus Parasiticus, and Fusarium solani remained resistant toward the fraction possessing least inhibition zone. UV absorption spectrum reveals the presence of condensed tannin, gallotannin, and ellagic acid (EA). FTIR spectrum denotes the presence of fingerprint region of hydrolysable tannin. RP-HPLC analysis indicates the presence of gallic acid, EA, epicatechin, and catechin. Conclusion: The plant materials such as S. aromaticum and Acorus calamus indicate the presence of hydrolysable, condensed, and gallotannins.
KEY WORDS: Antimicrobial screening, Fourier-transform infrared spectroscopy, Phenolic compounds, Reverse phase-high-performance liquid chromatography, Tannin
Rajeswari Anburaj and Vinoth Jothiprakasam
75Drug Invention Today | Vol 9 • Issue 3 • 2017
is an effective and accurate technique for the analysis of catechins and oligomeric procyanidins.[12-16]
In the present study, isolation of tannin-rich fraction was carried out in plants rich in bioactive components. Clove Syzygium aromaticum (L.) is a member of the family Myrtaceae. They are highly valued in medicine as a carminative and stimulant and are said to be a natural anthelmintic. In addition, the cloves are antimutagenic,[17] anti-inflammatory,[18] antioxidant,[19] antiviral,[20] antithrombotic,[21] and antiparasitic.[22] Essential components of clove oil include vanillin, crategolic acid, tannins, gallotannic acid, methyl salicylate, fflavanoids, eugenin, kaempferol, rhamnetin, eugenitin, and triterpenoids like oleanolic acid.
Acorus calamus Linn. (Family Araceae) commonly known as “sweet flag” is a well-known medicinal plant. The rhizomes of the plants are found to possess anti-spasmodic, antihelmintic properties and also used for the treatment of epilepsy, mental ailments, chronic diarrhea, dysentery, bronchial catarrh, intermittent fevers, and tumors. It is listed as an insecticide, an antifungal agent, an antibacterial agent, and a fish toxin.[23] The present study describes the isolation of tannin-rich fraction, and application of chromatography techniques to elucidate the bioactive compounds.
MATERIALS AND METHODSChemicalsThe chemicals used in the study were purchased from Sigma-Aldrich. All the solvents ethanol, acetone, ethyl acetate, methanol, acetic acid, silica gel, gallic acid and media including nutrient agar, Rose Bengal agar, Sabouraud Dextrose agar, and antibiotic discs were purchased from Hi-media. The chemicals and solvents used were of analytical grade.
Plant MaterialThe plant materials such as S. aromaticum and A. calamus were selected for the study. The fruits of S. aromaticum and rhizome of A. calamus were collected from in and around Madurai region, Tamil Nadu, India. The plants were washed thoroughly, shade dried, and homogenized to a fine powder using electrical blender and stored in airtight containers.
Extraction of PlantA total of 50 g of plant material were packed into a thimble and extracted with 250 mL of different solvents separately. Solvents used were of ethanol and acetone. The process of extraction continues for 2 days or till the solvent in Siphon tube of an extractor become colorless. After that, the extract was taken in a beaker and kept on a hot plate and heated at 30–40°C till all the solvent got evaporated. Dried extract was kept in a freezer at 4°C for their future use.
Column ChromatographyThe crude phenolic extract (2 g) dissolved in 20 mL of ethanol was applied on a column (2.5 cm × 60 cm) packed with Sephadex G-25 or G-50 (Sigma-Aldrich Chemical Co.) and eluted with 50% (v/v) acetone. Fractions (4 mL) were collected using a fraction collector. Ethanol (1 L), used as first eluent, allowed removing low molecular weight phenolic compounds. Then, 600 mL of 50% acetone (v/v) was used to elute tannins. Solvent from tannin fractions was removed using rotary evaporator, and water was removed during lyophilization.
Fourier Transform Infrared Spectroscopy (FTIR)FT-IR was used to study the functional groups and molecular structure of the extracts. The experiment was determined using Nexus 870 FT-IR instrument. Tannins (0.2 mg) were added into KBr powder (30 mg), mixed and grinded to powder in which the diameter reached 2 µm, and then pressed to a small piece sample in a press machine. Elemental analyses were obtained on a Perkin Elmer 240°C microanalyzer.
Identification of Phenolics using RP-HPLCPhenolic compound analysis was carried out using an Agilent Technologies 1100 series liquid chromatography (RP-HPLC) coupled with an ultraviolet-visible (UV-Vis) multiwavelength detector using the same protocol previously described by Trabelsi et al., 2010.[24] 5 µg of the extract was diluted in 1 mL of methanol (HPLC grade). The separation was carried out on 250 × 4.6 mm, 4 µm Hypersil ODS C18 reversed-phase column at ambient temperature. The mobile phase consisted of acetonitrile (solvent A) and water with 0.2% sulfuric acid (Solvent B). The flow rate was kept at 0.5 mL/min. The gradient program was as follows: 15% A/85% B 0–12 min, 40% A/60% B 12–14 min, 60% A/40% B 14–18 min, 80% A/20% B 18–20 min, 90% A/10% B 20–24 min, and 100% A 24–28 min. The injection volume was 20 µl and peaks were monitored at 280 nm. Filtration of samples was done through a 0.45 µm membrane filter before injection. The experiment was repeated twice and the peaks were identified by congruent retention times compared with standards.
MicroorganismsThe microbial cultures of ATCC, Escherichia coli 433, Citrobacter freundii 8128, Klebsiella pneumoniae 432, methicillin-resistant Staphylococcus aureus (MRSA), Pseudomonas aeruginosa 1934, Serratia ficaria 8930, Staphylococcus aureus 1473, Salmonella typhi 733, Aspergillus flavus 9064, Aspergillus niger 10130, Aspergillus parasiticus 6777, Fusarium oxysporum 4356 and Fusarium verticillioides 3322, Candida albicans 3018, and Candida glabrata 3019 were procured from the Microbial Type Culture Collection,

Rajeswari Anburaj and Vinoth Jothiprakasam
Drug Invention Today | Vol 9 • Issue 3 • 201776
Institute of Microbial Technology, Chandigarh, India. The bacterial cultures were maintained on nutrient agar slants at 4°C and the fungal cultures were maintained on potato dextrose broth at 25°C.
Preparation of InoculumThe bacterial cultures were inoculated into nutrient broth and incubated for 24 h at 37°C. The growth was compared with 0.5 McFarland; the turbidity of the medium indicates the growth of organisms while the fungal cultures were inoculated into potato dextrose broth and allowed to incubate at 25°C for 48 h.[25]
Antimicrobial AssayThe agar well diffusion method was employed for the determination of antimicrobial activity of the extracts.[26] The test organism such as bacteria and fungi was, respectively, lawn cultured on nutrient agar and Rose Bengal agar using sterile cotton swabs. The wells (6 mm in diameter) were cut from the agar plates using a cork borer. 60 μl of the extracts (16 mg/mL) were poured into the well using a sterile micropipette. The plates were incubated at 37°C for 24 h for bacteria and 25°C at 48 h for fungi. After incubation, the zone of inhibition was measured by standard scale (Hi-media) in millimeter.
RESULTS AND DISCUSSIONTannins are defined as naturally occurring water-soluble polyphenols exhibiting biological and pharmacological activities. They reveal binding activities toward proteins and other substances and appreciable antioxidant activities.[27-29] Ethanol can elute low-molecular weight phenolics together with sugars. Condensed tannins are available to be eluted with the system acetone: water (1:1; v/v). Therefore, the high content of phenolic compounds in the extract can be caused by the content of sugars in the crude extract.[30] Some mechanism of tannin toxicity to rumen microorganism have been suggested, i.e., enzyme inhibition, substrate deprivation, action on biological membrane, and metal ion deprivation.[31-33]
Antibacterial ScreeningIn vitro antimicrobial screening of fractions was represented in Table 1. Maximum inhibitory effect was recorded in S. aromaticum fraction 2 (21.6 mm) and 3 (18.3 mm) against E. coli followed by fraction 3 against Proteus mirabilis (17.3 mm) and K. pneumonia (17 mm). The inhibitory activity of clove is due to the presence of several constituents, mainly eugenol, β-caryophyllene,[19] α-humulene, methyl salicylate, methyl-eugenol,[22] phenylpropanoids, dehydrodieugenol, trans-conferyl aldehyde, biflorin, kaempferol, rhamnetin, myricetin, gallic acid, ellagic acid (EA), and oleanolic acid.[34] Maximum inhibition
was found in fraction 2 against S. aureus (16.1 mm), ATCC (15.6 mm), and K. pneumonia (15.3 mm) compared to fraction 1. Fraction 4 possesses maximum inhibition against K. pneumoniae (14.8 mm) and P. aeruginosa (15 mm), whereas minimum inhibition was found in MRSA (10 mm) and S. typhi (10.3 mm). A role in antimicrobial defence has often been implicated for hydrolysable tannins; for example, durable eucalyptus and oak heartwoods are rich in ellagitannins.[35]
Due to their size and charge, gallotannins are unlikely to penetrate bacterial membranes and can thus be expected to preferentially interact with cell wall protein or membrane protein. Penta, hexa, hepta, octa, nona, and deca-O-galloylglucose exhibited a selective inhibitory action.[36-40] A. calamus fraction 2 and 1 possess maximum inhibition against E. coli (20 mm, 18.8 mm), followed by S. aureus (17.1 mm), MRSA (16.3 mm), and S. ficaria (16 mm) against fraction 2. Moderate level of inhibition was observed in MRSA (15.5 mm), P. mirabilis (15.3 mm), K. pneumoniae (14.6 mm), and S. ficaria (14 mm) against fraction 1. ATCC (11.8 mm) and C. freundii (11.6 mm) was found to be resistant toward Punica granatum fraction 1. The previous study reported that the extracts showed maximum activity against E. coli, Enterobacter aerogenes, and Alcaligenes faecalis.[41]
Antifungal ScreeningC. glabrata (17.1 mm, 17.5 mm) and C. albicans (17 mm) remained sensitive toward S. aromaticum fraction 3 and 4. Previous results reported that the major constituent of clove oil and related compounds show antifungal effects against Candida species.[42] The action of the hydrolysable tannin against yeast cells possesses antifungal activity by disrupting the structure of the cell membrane and inhibiting the normal budding process due to the destruction of the membrane integrity.[43]
The alcoholic extract and the essential oil of A. calamus have been reported to possess in vitro antimicrobial properties and antiulcer activity.[44] The inhibitory effect was found to be moderate in C. albicans (11 mm) and F. verticillioides (10 mm) against A. calamus fraction 2, followed by C. albicans (9.5 mm) and C. glabrata (8.8 mm) against fraction 1. The large spectrum of fungicidal activity of clove oil and eugenol was reported on Candida, Aspergillus, and dermatophytes, and the mechanism of action was attributed to the lesions of the cytoplasmic membrane.[45] The inhibition level was found to be minimum in A. parasiticus (5.5 mm) and Fusarium solani (4.8 mm). Some heartwood ellagitannins found to possess antifungal activities, including ellagitannin D-6 and D-13 from Eucalyptus species.[46]

Rajeswari Anburaj and Vinoth Jothiprakasam
77Drug Invention Today | Vol 9 • Issue 3 • 2017
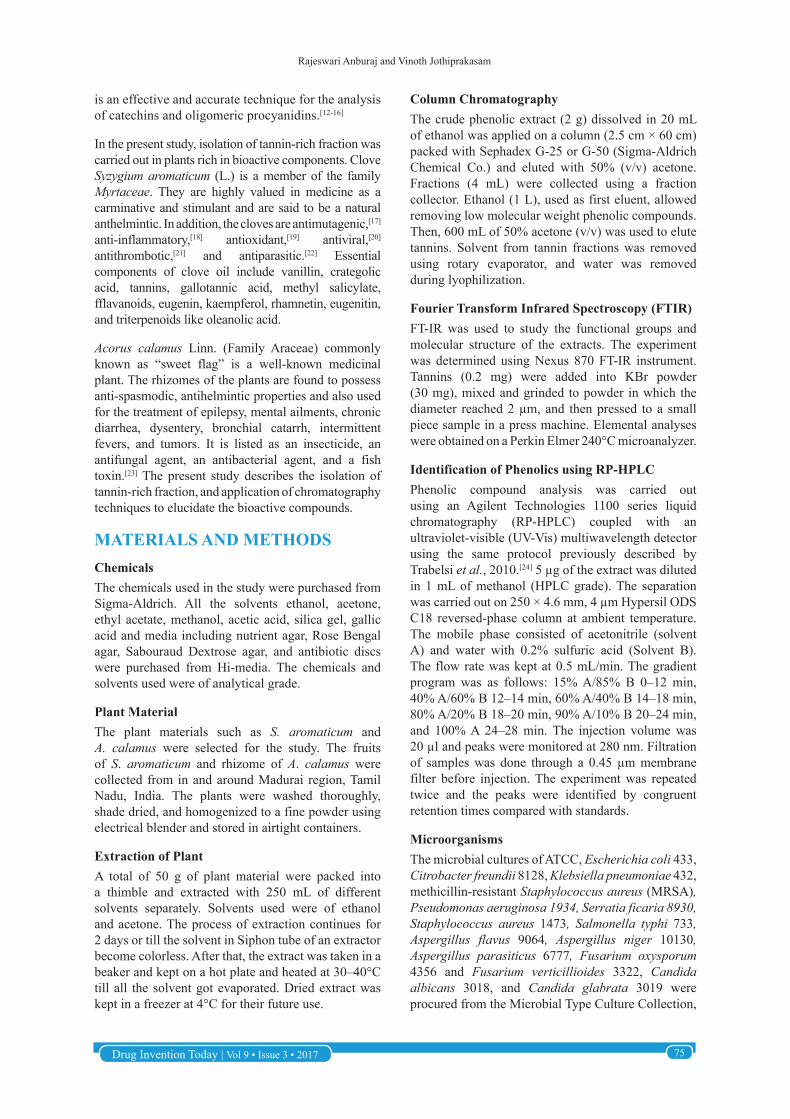
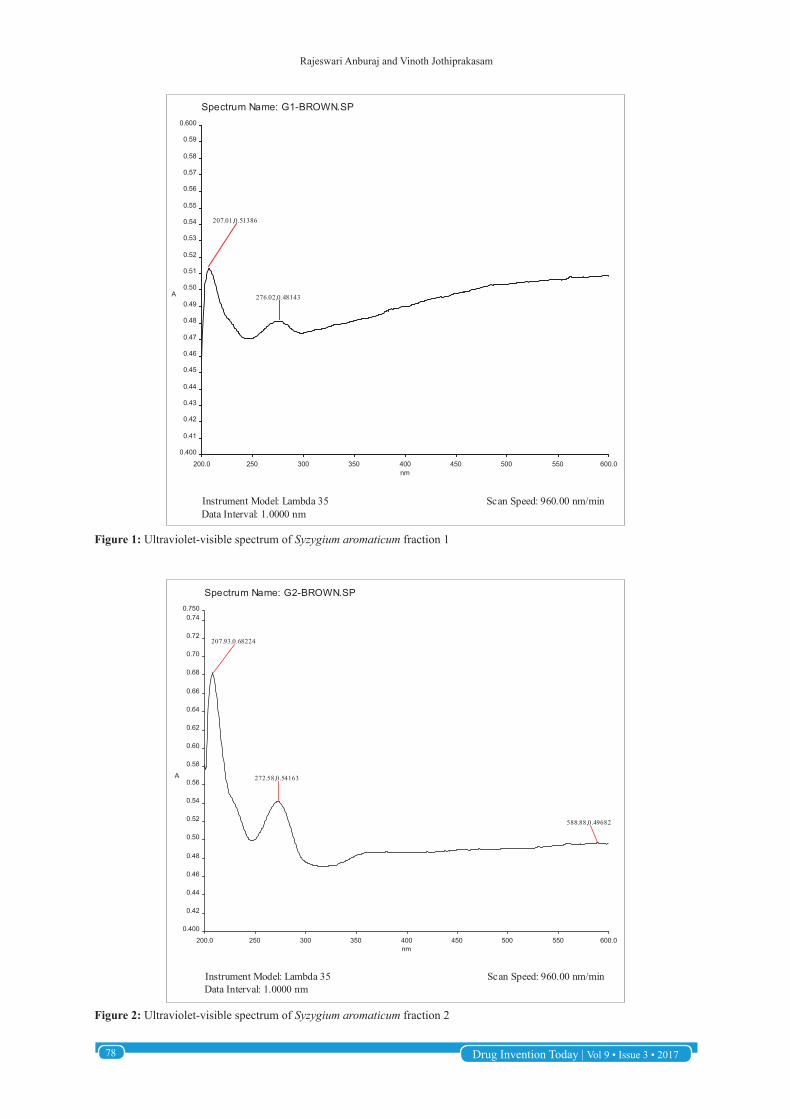
UV-Vis AnalysisUV-Vis spectrum of tannin-rich fractions was represented in Figures 1-6. In the UV region (250–2000 nm), the diffuse reflection marks out the 332 and 370 nm bands by structures with extended conjugate; hence, the yellowish color[47] S. aromaticum fraction 1–276 nm, 2–272 nm, and 4–275 nm represents the characteristic absorption spectrum of gallotannins. The fractions confirm positive results for the presence of EA from 206 to 213 nm. Initial peak originating in fraction 1 and 2 was in the range of 207 nm, similar peaks were obtained in fraction 3 and 4 - 209 nm. S. aromaticum and A. calamus represent an strong absorption, an inflection point between 258 and 281 nm, confirming the presence of condensed tannins. The UV-Vis spectrum for TA in solution presents two bands at 213 and 276 nm, both assigned for π→π* transitions given by aromatic units and C=O groups in UV-Vis-region (200–500 nm).[48,49] The UV-Vis peak obtained at A. calamus fraction 1–273 nm and 2–280 nm reveals the presence of gallotannin. The plant sample confirms the presence of EA at 207 nm and 208 nm in fraction 1 and 2. Therefore, UV absorption spectrum represents the presence of condensed tannin, gallotannin, and EA.
FTIR AnalysisFTIR spectrum of tannin-rich fractions was represented in Figures 7-12. The wide peak in the region of 3550–3100/cm is characteristic of the OH stretching vibration of benzene nucleus and methylol group of tannin. Existing study indicates the presence of similar peaks in S. aromaticum fraction 2–3510/
cm, 3–3397.85/cm, 3211.59/cm, 4–3341.10/cm, 3488.21/cm, and 3219.95/cm. The peaks obtained at 1500–950/cm are called fingerprint region for FTIR spectra of tannins. The functional assignments obtained at fraction 1–1310.71/cm, 1224.67/cm, 2–1295.73/cm, 1164.15/cm, 962.97/cm, 3–1225.4/cm, 4–1236.14/cm, 1071.41/cm, and 986.17/cm indicate the presence of hydrolysable tannins. Small peak around 2900/cm is due to aromatic CH stretching vibration of both methyl and methylene groups.[50-52] S. aromaticum fraction 1, 2, and 3 indicates the stretch around 2900/cm. The peak at 1285/cm in the spectrum of pine tannin is a characteristic feature for the flavonoid-based tannins.[53] Similar results were correlated with the emergence of peak in S. aromaticum fraction 2. The peaks around 910–740/cm in all spectra are deformation vibrations of the C-H bond in the benzene rings.[51,54,55] The wavenumber obtained in fraction 3–801.33/cm and 4–801.27/cm indicates the presence of C-H bond. In the spectrum of the untreated nylon 6 fabric, the peaks at 3432/cm, 3401/cm, 3418/cm, and 3419/cm confirm the presence of (OH) corresponding to the broad intermolecular hydrogen bond (OH) between the phenolic hydroxyl groups of tannic acid and carboxyl groups of the dye molecule and dye complex.[56] The stretches obtained in the fraction 3 (3397/cm) and 4 (3341/cm) suggest the presence of phenolic hydroxyl groups of tannic acid. The wavenumber of tannic acid represents specific bands for –OH associated groups (νOH at 3388/cm), C=O groups (νC=O at 1715/cm), and for etheric groups at 1198 – 1025/cm. In the existing study, the peak obtained in fraction 2 (1164.15/cm)
Table 1: Antimicrobial screening of bioassay-guided fractionation of plant samples
Bacteria Organism Plant samples
S. aromaticum A. calamus
1 2 3 4 1 2ATCC 12±0.8 15.6±1.5 15.3±0.5 13.6±0.5 11.8±0.2 12.3±0.4E. coli 11.3±0.9 21.6±0.5 18.3±1.1 13.6±0.5 18.8±0.2 20±0C. freundii 9.6±0.7 11.5±0 12.5±0.8 13.8±0.2 11.6±0.2 13.5±0K. pneumoniae 13.5±0.5 15.3±0.5 17±1.0 14.8±0.7 14.6±0.2 14.8±0.6MRSA 11.8±0.28 10.8±0.7 11.8±0.2 10±0 15.5±0.4 16.3±0.2P. mirabilis 12±1.0 14.6±1.1 17.3±0.5 14.3±1.1 15.3±0.2 15.8±0.6P. aeuroginosa 12.8±0.7 14±0 13.3±0.5 15±1 12.6±0.6 14.1±0.2S. aureus 11±0 16.1±0.2 15±0 14.6±0.5 16.5±0.4 17.1±0.2S. ficaria 11.8±0.7 11±0 12±1 14±0.8 14±0 16±0S. typhi 11.3±1.1 10.3±0.5 11.6±0.5 10.3±0.5 12.5±0 13.3±0.2
Fungi A. niger 10.3±0.2 8.1±0.2 9.5±0.5 11.3±0.2 6.3±0.2 8±0A. flavus 8.3±0.2 9±0 10±0 10.8±0.7 7±0.8 8.1±0.5A. parasiticus 12.5±0.5 8.6±0.5 9.3±0.2 12.1±0.2 5.5±0 6.8±0.7C. albicans 14±0 15.8±0.2 17±0 13.6±0.5 9.5±0 11±0.8C. glabrata 14.6±0.5 16±0 17.1±0.2 17.5±0 8.8±0.5 10±0F. oxysporum 8.3±0.2 8.6±0.2 9.3±0.2 9.5±0 6.6±0.2 8.6±0.7F. solani 6±0 6.3±0.2 6.6±0.2 7±0 4.8±0.2 6±0.8F. verticillioides 7.5±0 8.3±0.2 8.5±0.5 10.3±0.2 8±0.8 10±0
*Values are mean±standard deviation, n=3 ATCC: Staphylococcus aureus, E. coli: Escherichia coli 433, C. freundii: Citrobacter freundii 8128, K. pneumoniae: Klebsiella pneumoniae 432, MRSA: Methicillin‑resistant Staphylococcus aureus, P. aeuroginosa: Pseudomonas aeuroginosa 1934, S. ficaria: Serratia ficaria 8930, S. aureus: Staphylococcus aureus 1473, S. typhi: Salmonella typhi 733, A. flavus: Aspergillus flavus 9064, A. niger: Aspergillus niger 10130, A. parasiticus: Aspergillus parasiticus 6777, F. oxysporum: Fusarium oxysporum 4356, F. verticillioides: Fusarium verticillioides 3322, C. albicans: Candida albicans 3018, C. glabrata: Candida glabrata 3019
Rajeswari Anburaj and Vinoth Jothiprakasam
Drug Invention Today | Vol 9 • Issue 3 • 201778
Data Interval: 1.0000 nm
Spectrum Name: G1-BROWN.SP
Instrument Model: Lambda 35 Scan Speed: 960.00 nm/min
200.0 250 300 350 400 450 500 550 600.0
0.400
0.41
0.42
0.43
0.44
0.45
0.46
0.47
0.48
0.49
0.50
0.51
0.52
0.53
0.54
0.55
0.56
0.57
0.58
0.59
0.600
nm
A276.02,0.48143
207.01,0.51386
Figure 1: Ultraviolet-visible spectrum of Syzygium aromaticum fraction 1
Data Interval: 1.0000 nm
Spectrum Name: G2-BROWN.SP
Instrument Model: Lambda 35 Scan Speed: 960.00 nm/min
200.0 250 300 350 400 450 500 550 600.0
0.400
0.42
0.44
0.46
0.48
0.50
0.52
0.54
0.56
0.58
0.60
0.62
0.64
0.66
0.68
0.70
0.72
0.740.750
nm
A
588.88,0.49682
272.58,0.54163
207.93,0.68224
Figure 2: Ultraviolet-visible spectrum of Syzygium aromaticum fraction 2

Rajeswari Anburaj and Vinoth Jothiprakasam
79Drug Invention Today | Vol 9 • Issue 3 • 2017
Data Interval: 1.0000 nm
Spectrum Name: G3-BRWN.SP
Instrument Model: Lambda 35 Scan Speed: 960.00 nm/min
200.0 250 300 350 400 450 500 550 600.0
0.500
0.52
0.54
0.56
0.58
0.60
0.62
0.64
0.66
0.68
0.70
0.72
0.74
0.76
0.78
0.800
nm
A
376.99,0.67553272.10,0.66015
209.92,0.69380
Figure 3: Ultraviolet-visible spectrum of Syzygium aromaticum fraction 3
Data Interval: 1.0000 nm
Spectrum Name: G4-BRWN.SP
Instrument Model: Lambda 35 Scan Speed: 960.00 nm/min
200.0 250 300 350 400 450 500 550 600.0
0.900
0.92
0.94
0.96
0.98
1.00
1.02
1.04
1.06
1.08
1.10
1.12
1.14
1.16
1.18
1.200
nm
A
382.16,1.0740
377.24,1.0707
275.93,1.0638
209.14,1.0646
Figure 4: Ultraviolet-Visible spectrum of Syzygium aromaticum fraction 4

Rajeswari Anburaj and Vinoth Jothiprakasam
Drug Invention Today | Vol 9 • Issue 3 • 201780
Data Interval: 1.0000 nm
Spectrum Name: G3-PRUP.SP
Instrument Model: Lambda 35 Scan Speed: 960.00 nm/min
200.0 250 300 350 400 450 500 550 600.0
0.400
0.45
0.50
0.55
0.60
0.65
0.70
0.75
0.80
0.85
0.90
0.95
1.00
1.05
1.10
1.15
1.200
nm
A
576.17,0.48019
273.00,0.63806
207.64,1.1418
Figure 5: Ultraviolet-visible spectrum of Acorus calamus fraction 1
Data Interval: 1.0000 nm
Spectrum Name: G4-PURP.SP
Instrument Model: Lambda 35 Scan Speed: 960.00 nm/min
200.0 250 300 350 400 450 500 550 600.0
0.500
0.52
0.54
0.56
0.58
0.60
0.62
0.64
0.66
0.68
0.70
0.72
0.74
0.76
0.78
0.80
0.82
0.84
0.86
0.88
0.900
nm
A
562.32,0.58234
437.95,0.59953
280.11,0.60290
208.47,0.80913
Figure 6: Ultraviolet-visible spectrum of Acorus calamus fraction 2

Rajeswari Anburaj and Vinoth Jothiprakasam
81Drug Invention Today | Vol 9 • Issue 3 • 2017
Figure 7: Fourier transform infrared spectroscopy analysis of Syzygium aromaticum fraction 1
Spectrum Name: PU-G2-Brown.sp
PU-G2-Brown.pk
PU-G2-~1.SP 3601 4000.00 400.00 27.41 168.53 4.00 %T 10 1.00
REF 4000 97.29 2000 74.51 6003601.87 33.17 3510.78 32.58 3074.24 28.42 2232.41 74.47 1990.88 74.03 1873.60 62.83 1640.04 27.41 1295.73 36.90 1164.15 39.48 962.97 42.79 510.85 93.29 436.31 89.71
4000.0 3000 2000 1500 1000 400.00.0
10
20
30
40
50
60
70
80
90
100.0
cm-1
%T
3601.87
3510.783074.24
2232.411990.88
1873.60
1640.04
1295.731164.15
962.97
510.85436.31
Figure 8: Fourier transform infrared spectroscopy analysis of Syzygium aromaticum fraction 2

Rajeswari Anburaj and Vinoth Jothiprakasam
Drug Invention Today | Vol 9 • Issue 3 • 201782
Spectrum Name: PU-G3-Brown.sp
PU-G3-Brown.pk
PU-G3-~1.SP 3601 4000.00 400.00 15.98 99.92 4.00 %T 10 1.00
REF 4000 98.17 2000 88.22 6003397.85 16.38 3211.59 15.98 2235.23 88.91 1991.30 88.00 1873.30 80.18 1626.17 20.74 1225.44 22.21 801.33 33.58 668.68 62.27 598.60 45.41 501.99 48.83 440.63 47.26
4000.0 3000 2000 1500 1000 400.00.0
10
20
30
40
50
60
70
80
90
100.0
cm-1
%T
3397.853211.59
2235.231991.30
1873.30
1626.171225.44
801.33
668.68
598.60501.99
440.63
Figure 9: Fourier transform infrared spectroscopy analysis of Syzygium aromaticum fraction 3
Spectrum Name: PU-G4-Brown.sp
PU-G4-Brown.pk
PU-G4-~1.SP 3601 4000.00 400.00 27.15 116.11 4.00 %T 10 1.00
REF 4000 99.90 2000 93.29 6003488.21 31.95 3341.10 30.58 3219.95 29.31 3092.15 28.59 2233.35 92.62 1989.72 93.12 1873.09 88.16 1632.03 34.18 1236.14 27.15 1071.41 34.23 986.77 34.21 801.27 43.43 668.60 49.10
4000.0 3000 2000 1500 1000 400.00.0
10
20
30
40
50
60
70
80
90
100.0
cm-1
%T
3488.21
3341.10
3219.953092.15
2233.351989.72
1873.09
1632.03
1236.14
1071.41986.77
801.27
668.60
Figure 10: Fourier transform infrared spectroscopy analysis of Syzygium aromaticum fraction 4

Rajeswari Anburaj and Vinoth Jothiprakasam
83Drug Invention Today | Vol 9 • Issue 3 • 2017
Spectrum Name: PU-G4.sp
PU-G4.pk
PU-G4.sp 3601 4000.00 400.00 15.87 99.90 4.00 %T 10 1.00
REF 4000 87.16 2000 75.53 6003201.76 15.87 2474.17 85.26 2257.26 73.62 1984.57 74.76 1874.36 65.81 1631.24 21.06 1251.19 25.74 803.34 41.02 667.99 73.23 596.98 63.95 427.17 79.76
4000.0 3000 2000 1500 1000 400.00.0
10
20
30
40
50
60
70
80
90
100.0
cm-1
%T
3201.76
2474.17
2257.261984.57
1874.36
1631.241251.19
803.34
667.99
596.98
427.17
Figure 11: Fourier transform infrared spectroscopy analysis of Acorus calamus fraction 1
Spectrum Name: PU-CA-3-Brown.sp
PU-CA-3-Brown.pk
PU-CA-~2.SP 3601 4000.00 400.00 38.47 367.45 4.00 %T 10 1.00
REF 4000 97.09 2000 87.31 6003190.23 38.67 2242.15 86.64 1988.69 87.00 1874.10 78.97 1630.65 38.47 1249.09 43.10 807.33 53.10 664.21 77.99 596.33 72.03 432.37 96.02
4000.0 3000 2000 1500 1000 400.00.0
10
20
30
40
50
60
70
80
90
100.0
cm-1
%T
3190.23
2242.151988.69
1874.10
1630.65
1249.09
807.33
664.21
596.33
432.37
Figure 12: Fourier transform infrared spectroscopy analysis of Acorus calamus fraction 2
Rajeswari Anburaj and Vinoth Jothiprakasam
Drug Invention Today | Vol 9 • Issue 3 • 201784
and fraction 4 (1071.41/cm) denotes the presence of etheric groups. The functional assignment obtained in fraction 3–1640/cm and 4–1626/cm confirms the presence of amide group (N-C=O) and the stretching vibration of C=O and C-N group. Therefore, it is denoted that the tannic acid contains some aromatic esters due to the signal characteristic bands of carbonyl groups: C-O at 1100–1300/cm.[57,58] The wavenumber obtained at fraction 1 - 1310.77/cm and 1224.67/cm, fraction 2 - 1295.73/cm and 1164.15/cm, fraction 3 - 1225.44/cm, and fraction 4 -1236.14/cm and 1071.41/cm indicates the presence of carbonyl groups.
The wavenumber obtained at A. calamus fraction 1 - 3201.76/cm and 2 - 3190.23/cm indicates the methyloyl group of tannin. The peaks at 1620–1636/cm represent carbonyl groups from polyphenols such as catechin gallate, epicatechin gallate, epigallocatechin, epigallocatechin gallate, gallocatechin gallate, and theaflavin; the results suggest that molecules have free and bound amide groups.[59] In the present study, the peak obtained at fraction 1 (1631.24/cm) and 2 (1630.65/cm) indicates the presence of amide groups. The functional groups at fraction 1 - 1251.19/cm and 2 - 1249.09/cm reveal the presence of hydrolysable tannin. The existence of a peak at 803.34/cm and 807.33/cm indicates the presence of deformation vibrations of the C-H bond in the benzene rings. Therefore, it is denoted that the tannic acid contains some aromatic esters due to the signal characteristic bands of carbonyl groups: C-O at 1100-1300/cm. In the present study, the peak obtained at fraction 1 (1251.19/cm) and fraction 2 (1249.09/cm) reveals the presence of carbonyl groups.
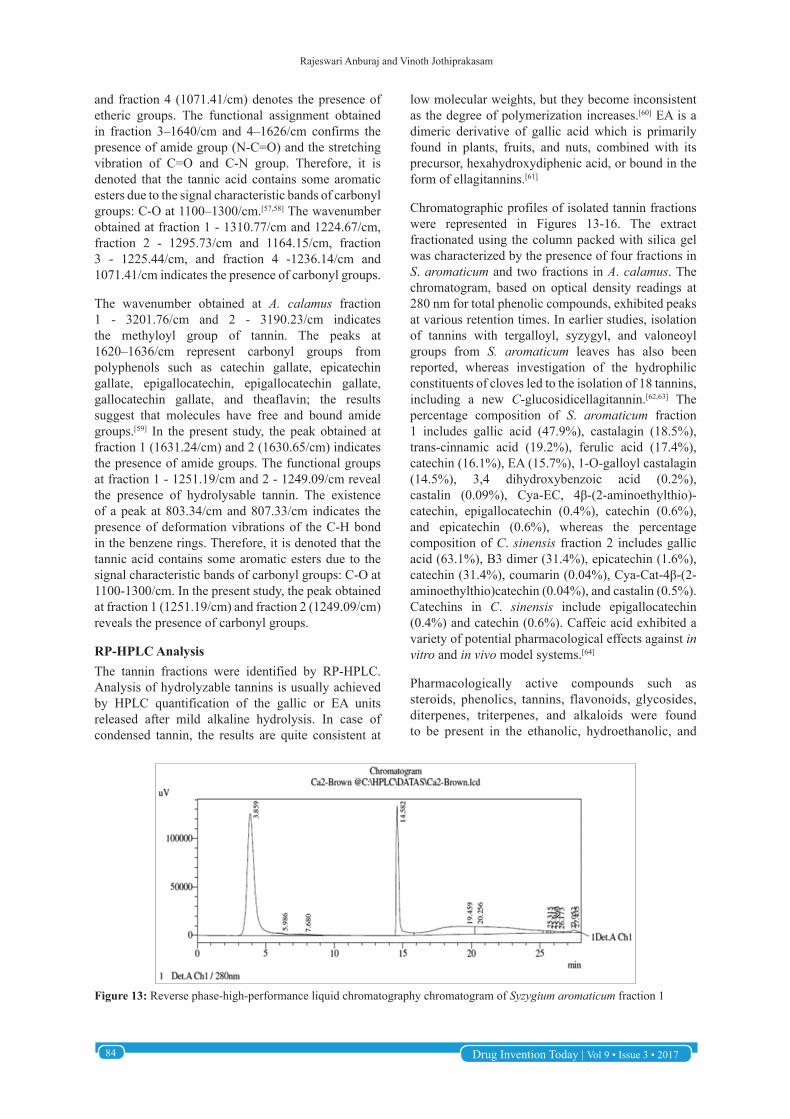
RP-HPLC AnalysisThe tannin fractions were identified by RP-HPLC. Analysis of hydrolyzable tannins is usually achieved by HPLC quantification of the gallic or EA units released after mild alkaline hydrolysis. In case of condensed tannin, the results are quite consistent at
low molecular weights, but they become inconsistent as the degree of polymerization increases.[60] EA is a dimeric derivative of gallic acid which is primarily found in plants, fruits, and nuts, combined with its precursor, hexahydroxydiphenic acid, or bound in the form of ellagitannins.[61]
Chromatographic profiles of isolated tannin fractions were represented in Figures 13-16. The extract fractionated using the column packed with silica gel was characterized by the presence of four fractions in S. aromaticum and two fractions in A. calamus. The chromatogram, based on optical density readings at 280 nm for total phenolic compounds, exhibited peaks at various retention times. In earlier studies, isolation of tannins with tergalloyl, syzygyl, and valoneoyl groups from S. aromaticum leaves has also been reported, whereas investigation of the hydrophilic constituents of cloves led to the isolation of 18 tannins, including a new C-glucosidicellagitannin.[62,63] The percentage composition of S. aromaticum fraction 1 includes gallic acid (47.9%), castalagin (18.5%), trans-cinnamic acid (19.2%), ferulic acid (17.4%), catechin (16.1%), EA (15.7%), 1-O-galloyl castalagin (14.5%), 3,4 dihydroxybenzoic acid (0.2%), castalin (0.09%), Cya-EC, 4β-(2-aminoethylthio)-catechin, epigallocatechin (0.4%), catechin (0.6%), and epicatechin (0.6%), whereas the percentage composition of C. sinensis fraction 2 includes gallic acid (63.1%), B3 dimer (31.4%), epicatechin (1.6%), catechin (31.4%), coumarin (0.04%), Cya-Cat-4β-(2-aminoethylthio)catechin (0.04%), and castalin (0.5%). Catechins in C. sinensis include epigallocatechin (0.4%) and catechin (0.6%). Caffeic acid exhibited a variety of potential pharmacological effects against in vitro and in vivo model systems.[64]
Pharmacologically active compounds such as steroids, phenolics, tannins, flavonoids, glycosides, diterpenes, triterpenes, and alkaloids were found to be present in the ethanolic, hydroethanolic, and
Figure 13: Reverse phase-high-performance liquid chromatography chromatogram of Syzygium aromaticum fraction 1

Rajeswari Anburaj and Vinoth Jothiprakasam
85Drug Invention Today | Vol 9 • Issue 3 • 2017
aqueous extracts of A. calamus. The percentage composition of A. calamus fraction 1 includes gallic acid (84.7%), EA (10.5%) epicatechin (3.3%), Cya-Cat-4β-(2-aminoethylthio)catechin (0.2%), epigallocatechin gallate (0.3%), 3, 4-,dihydroxyphenylacetic acid (0.19%), caffeic acid, and dimer (0.18%). The percentage composition of A. calamus fraction 2 includes gallic acid (55.5%), 1-O-Galloyl castalagin (33%) catechin (0.05%), EA
(10.3%), epigallocatechin gallate (0.8%), caffeic acid (0.04%), and epicatechin, 3,4 dihydroxyphenylacetic acid (0.01%). Epicatechin is the main extension unit of condensed tannins consisting of procyanidin and prodelphinidin. 1-O-galloyl castalagin, which was found in samples, might be originated from the esterification of castalagin or vescalagin with a gallic acid residue. Catechins are one of the powerful antioxidants from plant sources and known to reduce
Figure 16: Reverse phase-high-performance liquid chromatography chromatogram of Acorus calamus fraction 2
Figure 14: Reverse phase high performance liquid chromatography chromatogram of Syzygium aromaticum fraction 2
Figure 15: Reverse phase-high-performance liquid chromatography chromatogram of Acorus calamus fraction 1

Rajeswari Anburaj and Vinoth Jothiprakasam
Drug Invention Today | Vol 9 • Issue 3 • 201786
the risk of ischemic heart diseases by reducing oxidation of low-density lipoproteins.
CONCLUSIONTannins are polyphenols found in vascular tissues of leaves and stems found to exhibit pharmacological and biological activities. Antimicrobial studies reveal that S. aromaticum fraction 2 (21.6 mm) and 3 (18.3 mm) exhibit broad spectrum of activity followed by C. glabrata (17.5 mm). E. coli, P. mirabilis, and C. glabrata remained sensitive toward the fraction, whereas S. typhii, A. parasiticus, and F. solani remained resistant toward the fraction possessing least inhibition zone. UV-Vis analysis indicates the presence of condensed tannin, gallotannin, and EA. FTIR spectrum denotes the presence of fingerprint region of hydrolysable tannin. The functional assignments indicate that hydrolysable tannin was found in S. aromaticum and A. calamus. The described RP- HPLC method represents a reliable procedure for detection, separation, and quantification of gallic acid.
ACKNOWLEDGMENTThis work was supported by the analytical instrument facilities provided by St. Joseph’s College, Affiliated to Bharathidasan University, Trichy.
REFERENCES1. Bhat TK, Singh B, Sharma OP. Microbial degradation of
tannins-a current perspective. Biodegradation 1998;9:343-57.2. Field J, Lettinga G. Biodegradation of tannins. In: Sigel H,
editors. Metal Ions in Biological Systems. Degradation of Environmental Pollutants by Microorganisms and their Metalloenzymes. New York: Marcel Dekker; 1992. p. 61-97.
3. Yoshida T, Hatano T, Ito H. High molecular weight plant polyphenols (tannins): Prospective functions. Rec Adv Phytochem 2005;39:163-90.
4. Alasalvar C, Karamać M, Kosińska A, Rybarczyk A, Shahidi F, Amarowicz R, et al. Antioxidant activity of hazelnut skin phenolics. J Agric Food Chem 2009;57:4645-50.
5. Da Silva JM, Darmon N, Fernandez Y, Mitjavila S. Oxygen free radical scavenger capacity in aqueous models of different procyanidins from grape seeds. J Agri Food Chem 1991;39:1549-52.
6. Prior RL, Gu L. Occurrence and biological significance of proanthocyanidins in the American diet. Phytochemistry 2005;66:2264-80.
7. Monagas M, Quintanilla-López JE, Gómez-Cordovés C, Bartolomé B, Lebrón-Aguilar R. MALDI-TOF MS analysis of plant proanthocyanidins. J Pharm Biomed Anal 2010;51:358-72.
8. Hagerman AE, Riedl KM, Rice RE. Tannins as biological antioxidants. Basic Life Sci 1999;66:495-505.
9. Feldman KS, Sahasrabudhe K, Lawlor MD, Wilson SL, Lang CH, Scheuchenzuber WJ, et al. In vitro and in vivo inhibition of LPS-stimulated tumor necrosis factor-alpha secretion by the gallotannin beta-D-pentagalloylglucose. Bioorg Med Chem Lett 2001;11:1813-5.
10. Kantz K, Singleton VL. Isolation and determination of polymeric polyphenols using Sephadex LH-20 and analysis of grape tissue extracts. Am J Enol Virtic 1990;41:223-8.
11. Hagerman AE, Klucher KM. Chemistry of tannin-protein
complexation. In: Cody V, Middleton E, Harborne J, editors. Plant Flavonoids in Biology and Medicine: Biochemical, Pharmacological, and Structure-Activity Relationships. New York: Alan R. Liss, Inc; 1986. p. 67-76.
12. Kovac V, Alonso E, Revilla E. The effect of adding supplementary quantities of seeds during fermentation on the phenolic composition of wines. Am J Enol Vitic 1995;46:363-7.
13. Revilla E, Alonso E, Kovac V. The content of catechin and procyanidins in grapes and wines as affected by agroecological factors and technological practices. In: Editor. Wine: Nutritional and Therapeutic Benefits. Washington, DC: American Chemical Society; 1997. p. 69-80.
14. Fuleki T, Ricardo da Silva JM. Catechin and procyanidin composition of seeds from grape cultivars grown in Ontario. J Agric Food Chem 1997;45:1156-60.
15. Oszmianski J, Sapis JC. Fractionation and identification of some low molecular weight grape seed phenolics. J Agric Food Chem 1989;37:1293-7.
16. Ricardo da Silva JM, Rigaud J, Cheynier V, Cheminat A, Moutounet M. Procyanidin dimers and trimers from grape seeds. Phytochem 1991;30:1259-64.
17. Miyazawa M, Hisama M. Antimutagenic activity of phenylpropanoides from clove (Syzygium aromaticum). J Agric Food Chem 2003;51:6413-22.
18. Kim HM, Lee EH, Hong SH, Song HJ, Shin MK, Kim SH, Shin TY. Effect of Syzygium aromaticum extract on immediate hypersensitivity in rat. J Ethnopharm 1998;60:125-31.
19. Chaieb K, Zmantar T, Ksouri R, Hajlaoui H, Mahdouani K, Abdelly C, et al. Antioxidant properties of essential oil of Eugenia caryophyllata and its antifungal activity against a large number of clinical Candida species. J Myco 2007b;50:403-6.
20. Hussein G, Miyashiro H, Nakamura N, Hattori M, Kakiuchi N, Shimotohno K. Inhibitory effects of Sudanese medical plant extracts on hepatitis C virus (HCV) protease. J Phytother Res 2000;14:510-6.
21. Srivastava KC, Malhotra N. Acetyl eugenol, a component of oil of cloves (Syzygium aromaticum L.) inhibits aggregation and alters arachidonic acid metabolism in human blood platelets. Prostaglandins Leukot Essent Fatty Acids 1991;42:73-81.
22. Yang YC, Lee SH, Lee WJ, Choi DH, Ahn YJ. Ovicidal and adulticidal effects of Eugenia cryophyllata bud and leaf oil compounds on Pediculus capitis. J Agric Food Chem 2003;51:4884-8.
23. Anonymous. Thai Herbal Pharmacopoeia. Vol. II. Bangkok, Thailand: Department of Medical Sciences, Ministry of Public Health, Prachachon Co., Ltd; 2000.
24. Trabelsi N, Megdiche W, Ksouri R, Falleh H, Oueslati S, Soumaya B, et al. Solvent effects on phenolic contents and biological activities of the halophyte Limoniastrummono petalum leaves. LWT Food Sci Technol 2010;43:632-9.
25. Min BR, Pinchk WE, Merkel R, Walker S, Tomita G, Anderson RC. Comparative antimicrobial activity of tannin extracts from perennial plants on mastitis pathogens. Sci Res Essays 2008;3:66-73.
26. Nohynek LJ, Alakomi HL, Kähkönen MP, Heinonen M, Helander IM, Oksman-Caldentey KM, et al. Berry phenolics: Antimicrobial properties and mechanisms of action against severe human pathogens. Nutr Cancer 2006;54:18-32.
27. Yoshida T, Mori K, Hatano T, Okumura T, Uehara I, Komagoe K, et al. Radical-scavenging effects of tannins and related polyphenols on 1,1-diphenyl-2-picrylhydrazyl radical. Chem Pharm Bull 1989;37:1919-21.
28. Okuda T, Yoshida T, Hatano T. Hydrolyzable tannins and related polyphenols. Fortschr Chem Org Naturst 1995;66:1-17.
29. Okuda T. Structure-activity relationship of antioxidant and antitumor polyphenols. In: Ohigashi H, Osawa T, Terao J, Watanabe S, Yoshikawa T, editors. Food Factors for Cancer Prevention. Springer-Verlag: Vienna, Austria; 1997. p. 280-5.
30. Karamac M, Kosinska A, Rybarczyk A, Amarowicz R. Extraction and chromatographic separation of tannin fractions from tannin-rich plant material. Pol J Food Nutr Sci 2007;57:471-4.

Rajeswari Anburaj and Vinoth Jothiprakasam
87Drug Invention Today | Vol 9 • Issue 3 • 2017
31. Scalbert A. Antimicrobial properties of tannin. Phytochem 1991;30:3875-83.
32. Mc Sweeney CS, Palmer B, Bunch R, Krause DO. Microbial interactions with tannins: Nutritional consequences for ruminants. Anim Feed Sci Technol 2001;91:83-93.
33. Goel G, Puniya AK, Aguilar CN, Singh K. Interaction of gut microflora with tannins in feed. Nat Sci 2005a;92:497-503.
34. Cai L, Wu CD. Compounds from Syzygium aromaticum possessing growth inhibitory activity against oral pathogens. J Nat Prod 1996;59:987-90.
35. Scalbert A. Tannins in woods and their contribution to microbial decay prevention. In: Plant polyphenols: Synthesis, Properties, Significance. New York: Plenum; 1992. p. 935-52.
36. Abdalla AE, Darwish SM, Ayad EH, El-Hamahmy RM. Egyptian mango by-products: Antioxidant and antimicrobial activities of extract and oil from mango seed kernel. 2007. Food Chemy 2007;103:1141-52.
37. Cho JY, Sohn MJ, Lee J, Kim WG. Isolation and identification of pentagalloylglucose with broad-spectrum antibacterial activity from Rhustrichocarpa Miquel. Food Chem 2010;123:501-6.
38. Engels CM, Ganzle MG, Schieber A. Fractionation of gallotannins from mango (Mangifera indica L.) kernels by high-speed counter-current chromatography (HSCCC) and determination of their antibacterial activity. J Agri Food Chem 2010;58:775-80.
39. Kabuki T, Nakajima H, Arai M, Ueda S, Kuwabara Y, Dosako SI. Characterization of novel antimicrobial compounds from mango (Mangifera indicaL.) kernel seeds. Food Chem 2000;71:61-6.
40. Tian F, Li B, Ji B, Zhang G, Luo J. Identification and structure activity relationship of gallotannins separated from Gallachinensis. LWT Food Sci Technol 2009;42:1289-95.
41. Suresh K, SaravanaBabu S, Harisaranraj R. Studies on in vitro antimicrobial activity of ethanol extract of Rauvolfia tetraphylla. Ethnobot Leaf 2008;12:586-90.
42. Nozaki A, Takahashi E, Okamoto K, Ito H, Hatano T, Zasshi Y. Antifungal activity of essential oils and their constituents against Candida sp. and their effects on activity of amphotericin B. J Pharm Soc Jpn 2010;130:895-902.
43. Kim KJ, Woo SS, Bo KS, Moon SK, Choi JS, Dong, GL. Activity and mode of action of silver nano-particles on Candida albicans. Biometals 2009;22:235-42.
44. Elaya RA, Vijayalakshmi M, Devalarao G. Acorus calamus Linn: Chemistry and biology research. Res J Pharm Technol 2009;2:256-61.
45. Eugenia P, Luis VS, Carlos C, Lıgia S. Antifungal activity of the clove essential oil from Syzygium aromaticum on Candida, Aspergillus and dermatophyte species. J Med Microbiol 2009;58:14, 54-62.
46. Hart JH, Hillis WE. Inhibition of wood-rotting fungi by stilbenes and other polyphenols in Eucalyptus sideroxylon. Phytopathol 1974;64:939-48.
47. Badilescu I, Badilescu S. Hydrogen bonds, Ed. Scientific Encyclopedia; 1981.
48. Balaban AT, Banciu M, Pogany I. Applications of metodelorfizice în chimica organica, ed. Scientific and Encyclopedia; 1983.
49. Albu MG, Ghica MV, Giurginca M, Trandafir V, Popa L,
Cotrut C. Spectral characteristics and antioxidant properties of tannic acid immobilized on collagen drug-delivery systems. Rev Chim 2009;60:667-72.
50. Ping L, Pizzi A, Guo ZD, Brosse N. Condensed tannins from grape pomace: Characterization by FTIR and MALDI TOF and production of environment friendly wood adhesive. Ind Crops Prod 2012;40:13-20.
51. Kim S, Joongkim H. Curing behavior and viscoelastic properties of pine and wattle tannin-based adhesives studied by dynamic mechanical thermal analysis and FT-IR, ATR spectroscopy. J Adhes Sci Technol 2003;17:1369-83.
52. Ozacar M, Soykan C, Sengil IA. Studies on synthesis, characterization, and metal adsorption of mimosa andvalonia tannin resins. J Appl Pol Sci 2006;102:786-97.
53. Edelmann A, Lendl B. Toward the optical tongue: Flow-through sensing of tannin-protein interactions based on FTIR spectroscopy. J Am Chem Soc 2002;124:14741-7.
54. Ooa CW, Kassima MJ, Pizzi A. Characterization and performance of Rhizophora apiculata mangrove polyflavonoid tannins in the adsorption of copper (II) and lead (II). Ind Crops Prod 2009;30:152-61.
55. Ozacar M, Ayhan I, Engil S, Turkmenler H. Equilibrium and kinetic data and adsorption mechanism for adsorption of lead onto Valonia tannin resin. Chem Eng J 2008;143;32-42.
56. El-Gabry LK, El-Zawahry MM. Effect of tannic acid on the dyeing process of nylon 6 fabric with cationic dye. Res J Text App 2008;12:4.
57. Silverstein RM, Bassler GC, Morrill TC. Spectrometric Identification of Organic. Compounds. 7th ed. USA: John Wiley & Sons Inc.,; 1981. p. 95-8.
58. Stuart BH. Experimental Methods in Infrared Spectroscopy: Fundamentals and Applications. Chichester, UK: John Wiley & Sons, Ltd.; 2005. p. 76-7.
59. Kumar V, Yadav SC, Yadav SK. Syzygium cumini leaf and seed extract mediated biosynthesis of silver nanoparticles and their characterization. J Chem Technol Biotechnol 2010;85:1301-9.
60. Nonier MF, Absalon C, Vivas N, Vivas-de-Gaulejac N. Application of off-line size-exclusion chromatographic fractionation-matrix assisted laser desorption ionization time of flight mass spectrometry for proanthocyanidin characterization. J Chromatogr 2004;1033:291-7.
61. Klein G, Kim J, Himmeldirk K, Cao Y, Chen X. Antidiabetes and anti-obesity activity of Lagerstroemia speciosa. Evid Based Comp Alter Med 2007;4:401-7.
62. Tanaka T, Orii Y, Nonaka G, Nishioka I, Kouno I. Carbohydrate chemistry. Phytochem 1996;43:1345.
63. Tanaka T, Orii Y, Nonaka G, Nishioka I. Tannins and related compounds Chromone, acetophenone and phenylpropanoid glycosides and their galloyl and hexahydroxydiphenoyl esters from the leaves of Syzygium aromaticum. Chem Pharm Bull 1993;41:1232-12.
64. Arts IC, Hollman PC, Feskens EJ, Bueno-de-Mesquita HB, Kromhout D. Catechin intake might explain the inverse relation between tea consumption and ischemic heart disease: The Zutphen Elderly Study. Am J Clin Nutr 2001;74:227-32.
Source of support: Nil; Conflict of interest: None Declared