choosi clutter report · choosi: clutter report 1 key findings are australian households becoming...
TRANSCRIPT

CHOOSI
CLUTTER REPORT
OCTOBER 2017

Choosi: Clutter Report
1
KEY FINDINGS
Are Australian households becoming more or less cluttered?
• The large majority of Australians have a cluttered home and some admit they cannot stand the clutter, although many claim their home is less cluttered compared to the past and compared to most other Australian households.
• However, there is also a widely held view that Australian households are becoming more cluttered with things compared to the past, driven by a more consumerist/materialistic culture. Only a small minority believe Australian households are becoming more minimalist.
Clutter can pose problems, particularly during the festive season
• Emotional and sentimental value attached to treasured items is is a key contributor to the amount of clutter in Australian households.
• While arguments, complaints or disagreements about clutter don’t occur too frequently, some Australians claim that excess clutter has caused tension with other household members, including serious long-term toll on relationships.
• Furthermore, Australians don’t always consider the clutter they already have at home when buying new items, with mixed views on the impact of clutter on buying habits.
• This is a particular problem during the festive season. Although the large majority agree that Christmas/festive season gifts are great way to express their love for family and friends, the majority also agree that buying Christmas/festive season gifts can be a waste of money.
• Many also agree that they often buy Christmas/festive season gifts out of a sense of obligation or admit that they struggle to be able to afford paying for all the Christmas/festive season gifts bought each year.
• While many resell or re-gift unwanted gifts or have gifting practices that avoid excess gifts, many invariably are stored and end up as clutter.
Australians are looking to de-clutter
• Given the problems that clutter can pose, the majority of Australians claim to have at least a ‘reasonable’ desire to declutter their home.
• This is driven by a desire to avoid wasting money on things that are unnecessary, a desire for more simplified living and aesthetic preferences among the most important motivations to declutter.
• Many also proactively clear clutter from their home, which seems to have a positive emotional impact in feeling refreshed, happier or relieved.
But letting go can be hard
• Apart from sporadic cleaning efforts, the annual spring cleaning is a common ritual in Australian households, with most saying they love the process or find it cathartic.
• However, many also claim to hate the spring cleaning process or find it stressful, with some admitting to have trouble deciding what to get rid of or actually throwing things out, even after finding ‘skeletons’.
• Giving things away to charity or using the second hand economy online to sell or trade items are other common ways that Australians declutter.

Choosi: Clutter Report
2
MAIN FINDINGS
SCREENING How would you best describe the home you currently live in?
Two in five (40.3%) respondents currently live in a medium sized house, while close to a third (31.9%) describe their dwelling as large sized. One in seven (14.2%) are in medium sized apartments and the rest are distributed among small and large apartments as well as small houses and other types of dwellings (13.5%).
5.5%
14.2%
1.0%
6.4%
40.3%
31.9%
0.6%
Small apartment(Studio or one bedroom only)
Medium sized apartment(2-3 bedrooms)
Large apartment(More than 3 bedrooms)
Small house(1-2 bedrooms)
Medium sized house(2-3 bedrooms)
Large house(More than 3 bedrooms)
Other
Source: CoreData Happy Home Survey (October 2017)Question: How would you best describe the home you currently live in?

Choosi: Clutter Report
3
Do you have any of the following in your home?
The majority of respondents have a garden (79.6%) or a garage (68.6%) in their homes. Fewer have spare rooms (58.9%), a shed (52.9%) or general/shared storage areas (32.0%).
79.6%
68.6%
58.9%
52.9%
32.0%
6.3%
4.5%
Garden
Garage
Spare room
Shed
General/shared storage area
Attic
None of the above
% Yes
Source: CoreData Happy Home Survey (October 2017)Question: Do you have any of the following in your home?
*Multiple answers allowed

Choosi: Clutter Report
4
How would you describe the neighbourhood that you live in?
The majority (63.9%) of respondents live in suburban areas, while around one in 10 are situated in the inner city (10.9%), country town (9.5%) or coastal (9.1%) areas. A smaller proportion (6.1%) are located in the rural areas.
63.9%
10.9%
9.5%
9.1%
6.1%
0.5%
Suburban
Inner city
Country town
Coastal
Rural
Other
Source: CoreData Happy Home Survey (October 2017)Question: How would you describe the neighbourhood that you live in?

Choosi: Clutter Report
5
HOW MUCH CLUTTER DO WE REALLY HAVE? • The large majority of Australians have a cluttered home and some admit they cannot stand
the clutter, although many claim their home is less cluttered compared to the past and compared to most other Australian households.
• General odds and ends and clothing and footwear, as well as old appliances and electronics and other ‘ridiculous’ items contribute the most to the level of clutter.
• Australians most commonly see themselves and other household members as the ‘recycler’ or the ‘over sentimentalist’ and most admit to have had disagreements about clutter with other household members.
• Emotional and sentimental value attached to treasured items, including photo album, jewellery and other collectibles, contribute to the amount of clutter.
We often have many things in our homes we don’t use all the time but how much of these can be really considered as unwanted and unnecessary clutter?
Which of the following best describes the situation in your home?
Close to half (46.3%) of respondents describe their home as reasonably cluttered but they do not mind it, while more than one in six (17.1%) are in the same situation but cannot stand the clutter. One in 10 (9.8%) say their home is extremely cluttered, with 7.3% saying they cannot stand it. Interestingly, more than a quarter (26.8%) describe their home as minimalist.
2.5%
7.3%
46.3%
17.1%
26.8%
Extremely cluttered but I don’t mind
Extremely cluttered and I can’t stand it
Reasonably cluttered but I don’t mind
Reasonably cluttered and I can’t stand it
Minimalist
Source: CoreData Happy Home Survey (October 2017)Question: Which of the following best describes the situation in your home?

Choosi: Clutter Report
6
Is your home more or less cluttered now than in the past?
Similar proportion of respondents say their home is less cluttered now compared to five years (45.3%) or 10 years ago (45.9%). However, a quarter (25.6%) say their home is more cluttered now than five years ago and close to three in 10 (29.2%) share the same sentiment when comparing it to 10 years ago. Some respondents say the clutter in their home is about the same compared to five years ago (29.1%) or 10 years ago (24.9%).
14.0%
Muchmore now
19.4%
15.2%
A bitmore now
29.1%
24.9%
About thesame
23.1%
18.1%
A bitless now
22.2%
27.8%
Muchless now
Source: CoreData Happy Home Survey (October 2017)Question: Is your home more or less cluttered now than in the past?
5 years ago
10 years ago

Choosi: Clutter Report
7
How do you think the state of clutter in your home compares to most other Australian households?
Close to half (45.9%) of respondents believe their home is less cluttered compared to most other Australian households, while one in five (20.7%) believe theirs is more cluttered. One third (33.3%) think the clutter in their home is about the same as most other Australian households.
19.1%
26.8%
33.3%
15.9%
4.8%
Much less cluttered
A bit less cluttered
About the same
A bit more cluttered
Much more cluttered
Source: CoreData Happy Home Survey (October 2017)Question: How do you think the state of clutter in your home compares to most other Australian households?

Choosi: Clutter Report
8
Do you think that Australian households in general are more or less cluttered now than in the past?
Close to a quarter of respondents think Australian households in general are less cluttered now compared to five years ago (23.4%) or 10 years ago (24.2%). However, close to two in five think the typical Australian household is more cluttered now compared to five years ago (38.9%) or 10 years ago (42.5%). Some say the clutter in Australian households is about the same compared to five years ago (37.8%) or 10 years ago (33.3%).
7.4%
14.5%
Muchmore now
31.5%
28.0%
A bitmore now
37.8%
33.3%
About thesame
15.5%
14.6%
A bitless now
7.9%
9.6%
Muchless now
Source: CoreData Happy Home Survey (October 2017)Question: Do you think that Australian households in general are more or less cluttered now than in the past?
5 years ago
10 years ago

Choosi: Clutter Report
9
Why do you think there has been this change?
Among those who think Australian households have more or less clutter compared to five or 10 years ago, the majority (62.3%) attribute this change to trends in materialism. Other factors that are seen to have contributed to this change include the size of homes (49.7%), general social trends (44.0%), expense of buying things (34.1%) and availability of storage solutions (33.1%).
62.3%
49.7%
44.0%
34.1%
33.1%
6.2%
Trends in materialism
Size of homes
General social trends
Expense of buying things
Available storage solutions
Other
% Yes
Source: CoreData Happy Home Survey (October 2017)Question: Why do you think there has been this change?
*Multiple answers allowed

Choosi: Clutter Report
10
What are the things that tend to cause the most clutter in your home?
The most common things that tend to cause the most clutter are general odds and ends (58.1%), clothing and footwear (50.4%) and paper (42.2%). These are followed by books and records/CDs (39.6%), materials for hobbies and interests (38.9%), appliances and kitchenware and technology products (both 33.4%).
58.1%
50.4%
42.2%
39.6%
38.9%
33.4%
33.4%
27.5%
26.5%
21.8%
General odds and ends
Clothing and footwear
Paper (e.g. bills, receipts, etc.)
Books and records/CDs
Materials for hobbies and interests
Appliances and kitchenware
Technology products
Kids' toys
Work materials (e.g. paperwork and/orequipment)
Movies/home videos
% Yes
Source: CoreData Happy Home Survey (October 2017)Question: What are the things that tend to cause the most clutter in your home?
*Top 10 answers only*Multiple answers allowed

Choosi: Clutter Report
11
What’s the most ridiculous item you store?
Close to one in five (19.5%) respondents consider old appliances and electronics as the most ridiculous items they store. Other items listed include clothing and accessories (12.8%), papers (12.3%) and activity gear (8.5%).
19.5%
12.8%
12.3%
8.5%
7.0%
6.2%
6.1%
5.7%
5.4%
3.8%
3.5%
9.3%
Old appliances and electronics
Clothing and accessories
Papers (e.g. magazines, newspapers, etc.)
Activity gear (i.e. gear for sports, hobbies, etc)
Toys
Boxes and containers
Books
Useless stuff (i.e. empty, broken, unused, etc.)
Stuff for the house (i.e. tools, furniture, etc.)
Preowned stuff from family members
Artworks, crafts and collectibles
Other
Source: CoreData Happy Home Survey (October 2017)Question: What's the most ridiculous item you store?

Choosi: Clutter Report
12
"Sometimes we go through cupboards and realise we've been storing empty boxes and old empty
packaging. Also kids clothes cos we're not sure if we're having another baby or not." (Female, 31
years old, WA)
"Cardboard boxes for the time in the future when we intend to change the carpet and will need to
store stuff while the furniture gets moved." (Male, 63 years old, VIC)
"Boxes that have gone through a couple of moves that are labelled "junk" but I won't throw out till I
have time to go through them." (Female, 52 years old, QLD)
"Empty beer bottles because one day my husband will brew his own! Even worse they aren't even his,
a friend gave them to him!" (Female, 58 years old, NSW)
"Too many clothes, more than I can wear. Having difficulty getting rid of them, just in case I might
want to wear it but | don't." (Female, 78 years old, NSW)
"A large paper mache giant reindeer and I will probably end up with the same sized elephant and
giraffe at some stage soon lol." (Female, 53 years old, NSW)
"Things that have never been used and I know I won't use, but keep due to the expense I made (e.g.
brand new electric blanket)." (Female, 23 years old, WA)
"Old paint and home renovation stuff that we have had in our laundry for 17 years now and it has not
moved off the shelves." (Female, 49 years old, VIC)
"Musical instruments I will never be able to play, it's called "Musical instrument acquisition
syndrome". One day ....." (Female, 67 years old, NSW)
"Old electronic equipment picked up at radio club auctions and held in case I someday acquire the
skills to repair." (Male, 67 years old, QLD)
"Not by choice, it's having our daughter living with us with a toddler and baby and everything
associated with them." (Male, 60 years old, NSW)
"A canoe we never use because it used to belong to my elderly father and we don't have the heart to
sell it." (Female, 58 years old, SA)
"A crawling battery operated toy soldier that has not worked since 5 minutes after it was bought in
China." (Female, 72 years old, NSW)
"A slide projector and screen that belonged to my parents and we ended up with when the family
home sold." (Female, 58 years old, VIC)
Choosi: Clutter Report
13
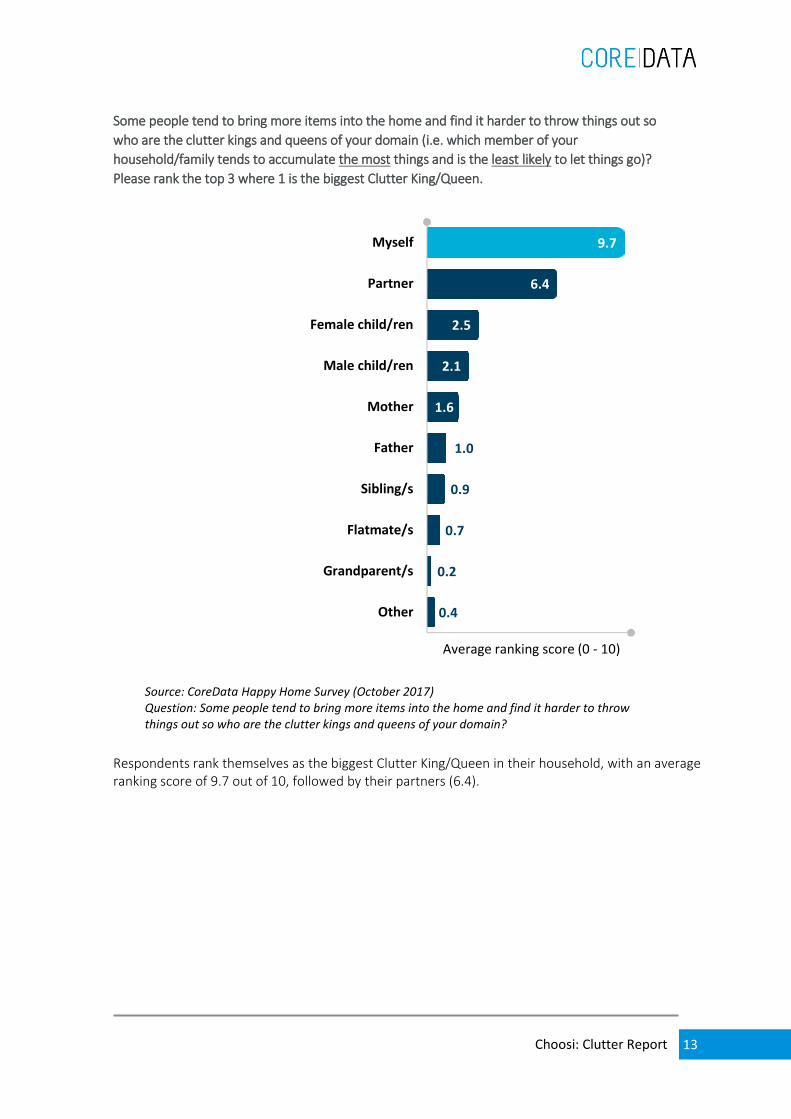
Some people tend to bring more items into the home and find it harder to throw things out so
who are the clutter kings and queens of your domain (i.e. which member of your
household/family tends to accumulate the most things and is the least likely to let things go)?
Please rank the top 3 where 1 is the biggest Clutter King/Queen.
Respondents rank themselves as the biggest Clutter King/Queen in their household, with an average ranking score of 9.7 out of 10, followed by their partners (6.4).
9.7
6.4
2.5
2.1
1.6
1.0
0.9
0.7
0.2
0.4
Myself
Partner
Female child/ren
Male child/ren
Mother
Father
Sibling/s
Flatmate/s
Grandparent/s
Other
Average ranking score (0 - 10)
Source: CoreData Happy Home Survey (October 2017)Question: Some people tend to bring more items into the home and find it harder to throw things out so who are the clutter kings and queens of your domain?

Choosi: Clutter Report
14
Can you relate yourself or anyone in your household with the following archetypes that personify common cluttering (or lack of) behaviours?
More than one in five respondents can relate themselves or someone from their household as the ‘recycler’ (22.5%) or the ‘over sentimentalist’ (21.7%). Close to one in seven (13.4%) consider themselves or a member of their household as the ‘minimalist’, while more than one in 10 consider themselves or a member of their household as the ‘hobbyist’ or the ‘shopaholic’ (both 10.9%).
The Recycler – You just never know when that ‘whats-a-mi-jig’ is going to come in handy and can't help but feeling you will need something the day after you throw it away
22.5%
The Over Sentimentalist – Gifts, cards or anything reminiscent of a loved one or a time in life must be kept for all eternity
21.7%
The Minimalist – The less the better, they are highly disciplined at fighting the clutter
13.4%
The Hobbyist – Whether collecting records/CDs, spare parts or model kits their passions can consume the home
10.9%
The Shopaholic – Whether it's retail therapy or just being convinced they can’t let that deal get away they tend to buy more things than they can use
10.9%
The Researcher –A thirst for information see them accumulate books and magazines, etc.
7.1%
The Tech Collector –
They seem to love basking in the glow of multiple screens and surrounding themselves with the latest gadgets
6.8%
The Collectibles Collector – From star
wars to stamps they missed their calling as a museum curator
6.7%
Source: CoreData Happy Home Survey (October 2017)Question: Can you relate yourself or anyone in your household with the following archetypes that personify common cluttering (or lack of) behaviours?

Choosi: Clutter Report
15
Do you have disagreements about the clutter in your home with other household members?
More than half (55.3%) of respondents claim to have disagreements at least occasionally with other members of their household about the clutter in their home. Gen Ys are the most likely to get into disagreements regarding the clutter in their homes (64.3%), while by state, NSW respondents are the most likely to (61.6%).
Source: CoreData Happy Home Survey (October 2017)Question: Do you have disagreements about the clutter in your home with other household members?
Yes,occasionally
No
Yes, frequently
10.1%
45.2%
44.8%

Choosi: Clutter Report
16
How much extra clutter, rarely used or unwanted possessions would you estimate you currently have in your house? How much of a typically sized room could you likely fill?
More than a third (34.8%) of respondents estimate they can fill ¼ of a typically sized room with the extra clutter they have in their house, while more than a quarter (26.2%) say they can fill about ½ of a room. Close to one in five (18.8%) think they can fill about one room, while close to one in 10 (8.7%) think they can fill about 1 ½ to more than two rooms. However, one in nine (11.5%) do not have extra clutter or rarely used or unwanted possessions in their house. This extra clutter translates to approximately 6 cubic metres per household or 52,527,886 m3 Australia-wide. If we put a box of clutter along every inch of coastline in Australia, we will go around Australia about 6 times or 210,112 kilometres.
11.5%
34.8%
26.2%
18.8%
2.5%
4.4%
1.8%
None
Fill about ¼ room
Fill about ½ room
Fill about one room
Fill about 1½ rooms
Fill about 2 rooms
Fill more than 2 rooms
Source: CoreData Happy Home Survey (October 2017)Question: How much extra clutter, rarely used or unwanted possessions would you estimate you currently have in your house? How much of a typically sized room could you likely fill?

Choosi: Clutter Report
17
What’s the most cluttered space currently in your home?
Close to one in three respondents say the most cluttered spaces in their homes are the garage/shed (32.0%) or spare rooms (30.9%). One in 10 (10.6%) point to communal spaces, while fewer cite the main bedrooms (6.6%) or the kids’ rooms (5.6%).
32.0%
30.9%
10.6%
6.6%
5.6%
4.6%
1.8%
1.4%
0.7%
0.6%
5.2%
Garage/shed
Spare room
Communal spaces
Main bedroom
Kids' rooms
Shared storage
Office/study
Bathroom
Garden
Attic
Other
Source: CoreData Happy Home Survey (October 2017)Question: What's the most cluttered space currently in your home?

Choosi: Clutter Report
18
Have you specifically built a space for your clutter?
One in 10 (10.1%) respondents have built a space specifically for their clutter. Please explain your answer.
"We have one storage cupboard under the stairs and also a section of roof space accessible to be
used as storage. Both are extremely disorganised and cluttered." (Female, 23 years old, WA)
"There are several shelving units in our separate laundry, where we store a variety of things like
tools, cleaning supplies, & other things which don't fit." (Female, 36 years old, QLD)
"We have a pull-down ladder that gives us access to our rather large roof area. I have lined parts
of the roof with flooring to store stuff up there. Mostly." (Male, 59 years old, WA)
"Front section has become the place for storing clutter and goods like toilet paper and things I
buy on sale to use we don't have attic." (Female, 33 years old, WA)
"We built a wall of cupboards for games, photos, hobbies, DVDs, pantry, medicines, picnic
equipment, puzzles and toys for grandchildren." (Female, 66 years old, NSW)
"I mainly store my clutter/collectibles in 55 lidded boxes stacked on top of one another along the
wall of the garage." (Female, 57 years old, WA)
"We have a section of the bench which is called the "dumping ground" which is where a lot of
junk is just placed." (Female, 24 years old, NSW)
Source: CoreData Happy Home Survey (October 2017)Question: Have you specifically built a space for your clutter?
No
Yes
10.1%
89.9%

Choosi: Clutter Report
19
What would you estimate is the total financial value of the clutter currently in your home (i.e.
considering the cost of purchasing these things in the first place)?
On average, respondents say the total financial value of the clutter currently in their home is approximately $6,623. This translates to $59,361,949,000 worth of clutter Australia-wide.
Source: CoreData Happy Home Survey (October 2017)Question: What would you estimate is the total financial value of the clutter currently in your home (i.e. considering the cost of purchasing these things in the first place)?

Choosi: Clutter Report
20
It has been said that "one person’s trash is another person’s treasure" and the value of anything can be relative. How strong is the emotional/sentimental value of the clutter in your home?
Close to two in five (38.7%) respondents say the clutter in their home have strong or very strong emotional/sentimental value, while close to half (45.6%) say these have some but minimal emotional/sentimental value. Interestingly, close to one in six (15.7%) claim the clutter in their home have little to no emotional/sentimental value.
10.5%
28.2%
45.6%
15.7%
Very strongemotional/sentimental value
Strong emotional/sentimentalvalue
Some but minimalemotional/sentimental value
Little to noemotional/sentimental value
Source: CoreData Happy Home Survey (October 2017)Question: It has been said that "one person's trash is another person's treasure" and the value of anything can be relative. How strong is the emotional/sentimental value of the clutter in your home?

Choosi: Clutter Report
21
Including all members of your household, how many of the following items do you have?
On average, respondents have two televisions, two computers and four other screened devices in their household. They also have an average of 139 books, 24 pairs of shoes, four suitcases and five drawers filled with miscellaneous clutter.
TVs
2Computers
2Other
screened devices
4
Books
139Pairs of shoes
24
Drawersfilled with
miscellaneousclutter
5Suitcases
4
Source: CoreData Happy Home Survey (October 2017)Question: Including all members of your household, how many of the following items do you have?

Choosi: Clutter Report
22
What is your most valued household item?
More than one in five (21.9%) respondents say photo albums are the most valued household item they have, while one in six cite jewellery (17.9%) or sentimental collectibles (16.9%).
21.9%
17.9%
16.9%
10.2%
9.9%
9.7%
3.2%
2.4%
7.8%
Photo album
Jewellery
Sentimental collectible
Furniture
TV
Mobile phone
Gadgets and electronics
Paperwork
Other
Source: CoreData Happy Home Survey (October 2017)Question: What is your most valued household item?

Choosi: Clutter Report
23
Why is this household item so important to you?
Respondents most commonly consider their most valued household item as important to them due to the emotional/sentimental value (47.7%) or that it is irreplaceable (39.6%). They also cite the expense it would entail to replace (30.5%), as well as its practical/functional value (25.4%).
47.7%
39.6%
30.5%
25.4%
1.8%
Emotional/sentimental value
Irreplaceable
Expensive to replace
Practical/functional value
Other
% Yes
Source: CoreData Happy Home Survey (October 2017)Question: Why is this household item so important to you?
*Multiple answers allowed

Choosi: Clutter Report
24
WHAT CAUSES THE CLUTTER • Australians don’t always consider the clutter they already have at home when buying new
items, with mixed views on the impact of clutter on buying habits.
• This is a particular problem during the festive season. Although the large majority agree that Christmas/festive season gifts are great way to express their love for family and friends, the majority also agree that buying Christmas/festive season gifts can be a waste of money.
• Many also agree that they often buy Christmas/festive season gifts out of a sense of obligation or admit that they struggle to be able to afford paying for all the Christmas/festive season gifts bought each year.
• While many resell or re-gift unwanted gifts or have gifting practices that avoid excess gifts, many invariably are stored and end up as clutter.
What do you feel are the greatest reasons for clutter in your household?
Close to two in five respondents say the greatest reasons for clutter in their household are sentimental value of the items (39.0%) or there is more accumulation than culling of things (37.9%). They also cite special interests and hobbies (28.5%), not tidying up often enough (28.1%) and not having enough storage (26.7%) as other reasons for the clutter in their home.
39.0%
37.9%
28.5%
28.1%
26.7%
21.7%
19.0%
10.1%
4.9%
Sentimental value of items
More accumulation than culling things
Special interests and hobbies
We don't tidy up often enough
We don't have enough storage
Shopping habits that lead to clutter
One word - 'children'
Resident clutter 'Kings' or 'Queens'
Other
% Yes
Source: CoreData Happy Home Survey (October 2017)Question: What do you feel are the greatest reasons for clutter in your household?
*Multiple answers allowed

Choosi: Clutter Report
25
Pre Boomers are the most likely to cite the sentimental value of items as a reason for clutter (57.7%), while Gen Ys are the most likely to say it is because of not having enough storage (32.5%) or having shopping habits that lead to clutter (31.8%). When buying new items, do you consider the clutter you already have at home?
Close to three in five (57.1%) respondents consider the clutter they already have at home when buying new items. Does this impact your buying habits?
The impact of clutter on buying habits is mixed, with a little over half (51.0%) of respondents saying it impacts their buying habits while the rest (49.0%) say otherwise.
Source: CoreData Happy Home Survey (October 2017)Question: When buying new items, do you consider the clutter you already have at home?
No Yes
57.1%
42.9%
Source: CoreData Happy Home Survey (October 2017)Question: Does this impact your buying habits?
No Yes
51.0%49.0%

Choosi: Clutter Report
26
How do you store your clutter?
More than half of respondents say they store their clutter in cupboards (54.4%) or storage boxes (52.8%). A small proportion (9.2%) store their clutter in garbage bags or in shelves. However, more than one in five (21.6%) say their clutter is not organised and just dumped somewhere. Nationally, these translate to 2,926,538 cubic metres of clutter in garbage bags, 19,238,541 m3 in storage boxes, 19,831,974 m3 in cupboards and 428,950 m3 in cupboards, while unorganised and dumped clutter is 7,857,017 m3. Is your clutter organised?
54.4%
52.8%
8.0%
1.2%
21.6%
6.2%
In cupboards
Storage boxes
Garbage bags
In shelves
It's not organised, just dumped
Other
% Yes
Source: CoreData Happy Home Survey (October 2017)Question: How do you store your clutter?
*Multiple answers allowed
Source: CoreData Happy Home Survey (October 2017)Question: Is your clutter organised?
No Yes
67.4%
32.6%

Choosi: Clutter Report
27
In line with the previous question, more than two-thirds (67.4%) of respondents say their clutter is organised, while the remainder admit otherwise (32.6%). With Christmas and other festive shopping seasons fast approaching how much would you agree with the following statements?
The large majority (76.2%) of respondents agree that Christmas/festive season gifts are great way to express their love for family and friends, although the majority (65.9%) also agree that they sometimes feel buying Christmas/festive season gifts is a waste of money. Many also agree that they often buy Christmas/festive season gifts out of a sense of obligation (57.8%) or admit that they struggle to be able to afford paying for all the Christmas/festive season gifts bought each year (48.3%).
Source: CoreData Happy Home Survey (October 2017)Question: With Christmas and other festive shopping seasons fast approaching, how much would you agree with the following statements?
22.5%
20.4%
12.8%
13.5%
53.7%
45.5%
45.0%
34.8%
16.3%
19.6%
14.9%
76.2%
65.9%
57.8%
48.3%
26.0%
24.8%
19.5%
Christmas/festive season gifts are greatway to express my love for family and
friends
I sometimes feel buyingChristmas/festive season gifts is a waste
of money
I often buy Christmas/festive seasongifts out of a sense of obligation
I sometimes struggle to be able to affordpaying for all the Christmas/festive
season gifts bought each year
I don't buy presents
I sometimes buy Christmas/festiveseason gifts just to 'keep up with the
Joneses'
I don't buy presents and prefer to giveto charity
Strongly agreeAgreeSUM

Choosi: Clutter Report
28
Some do not buy Christmas/festive season presents at all (26.0%) or admit that they sometimes buy Christmas/festive season gifts just to 'keep up with the Joneses' (24.8%). One in five (19.5%) say instead of buying present, they prefer to give to charity. What do you tend to do with gifts you don’t really want/need?
When asked what they do with gifts they do not really want or need, close to half (49.4%) of respondents say they store them and around two in five either re-gift (41.3%) or give them to charity (40.4%). Others sell or swap these through second-hand economy (21.6%) or garage sales (10.4%), while close to one in seven (13.7%) just throw them out.
49.4%
41.3%
40.4%
21.6%
13.7%
10.4%
2.6%
2.8%
Store them
Re-gift
Give to charity
Sell/swap it through second-handeconomy
Throw them out
Sell through garage sales
Give them back to the gift-giver
Other
% Yes
Source: CoreData Happy Home Survey (October 2017)Question: What do you tend to do with gifts you don't really want/need?
*Multiple answers allowed

Choosi: Clutter Report
29
How much would you estimate your household spend on Christmas/festive season gifts each year (Including gifts bought for others not living in your household e.g. relatives, friend and colleagues)?
Respondents say their household spends an average of $963 on Christmas/festive season gifts each year, including gifts bought for others not living in their household. This translates to $8,063,084,502 spent annually on Christmas/festive season gifts Australia-wide. How much would you estimate the value of unwanted gifts you and your family receive at Christmas time?
Respondents say their household receives an average of $620 worth of unwanted gifts at Christmas time. This translates to $4,407,968,952 worth of unwanted gifts at Christmas time Australia-wide.
$963Source: CoreData Happy Home Survey (October 2017)Question: How much would you estimate your household spend on Christmas/festive season gifts each year (Including gifts bought for others not living in your household e.g. relatives, friend and colleagues)?
Source: CoreData Happy Home Survey (October 2017)Question: How much would you estimate the value of unwanted gifts you and your family receive at Christmas time?

Choosi: Clutter Report
30
Thinking of the Christmas/festive season gifts received in your household each year, excluding food and perishables, how much would you estimate of this is not being used by the following year (whether thrown away, re-gifted, resold or just becoming unwanted clutter)?
In terms of the Christmas/festive season gifts received in their household each year excluding food and perishables, respondents estimate an average of $346 worth of items are resold the following year. They also estimate an average of $218 worth of items are re-gifted, $185 worth of items become unwanted clutter and $120 worth of items are thrown away. These in turn translate to a total of $869 worth of Christmas/festive season gifts received but not used per household. Nationally, these translate to $3,098,263,928 of items being resold, $1,950,275,991 re-gifted, $1,077,386,318 are thrown away and $ 1,659,134,311 becoming unwanted clutter or a total of $7,785,060,549.
$346
$218$185
$120
Resold Re-gifted Becoming unwantedclutter
Thrown away
Source: CoreData Happy Home Survey (October 2017)Question: Thinking of the Christmas/festive season gifts received in your household each year, excluding food and perishables, how much would you estimate of this is not being used by the following year (whether thrown away, re-gifted, resold or just becoming unwanted clutter)?

Choosi: Clutter Report
31
Do you and your household, family, friends or colleagues have any traditions to help avoid excess of unwanted gifting practices?
More than a third (35.2%) of respondents say their household agree on gifts for immediate family only to help avoid excess of unwanted gifting practices and a further three in 10 (30.7%) say they agree on gifts for the kids only. Some also agree on a spending limit or number of gifts (26.1%), no gifts at all (19.5%) or do Secret Santa to avoid multiple gifts (16.4%). However, a quarter (25.6%) do not practice any traditions to help avoid excess of unwanted gifting practices.
35.2%
30.7%
26.1%
19.5%
16.4%
5.6%
25.6%
4.8%
Gifts for immediate family only
Gifts for kids only
Agreed spending limits or number of gifts
Agree on no gifts
Secret Santa to avoid multiple gifts
Charitable donations in lieu of gifts
Don’t practice any traditions to help avoid excess of unwanted gifting practices
Other
% Yes
Source: CoreData Happy Home Survey (October 2017)Question: Do you and your household, family, friends or colleagues have any traditions to help avoid excess of unwanted gifting practices?
*Multiple answers allowed

Choosi: Clutter Report
32
HOW DO WE DECLUTTER? • While arguments, complaints or disagreements about clutter don’t occur too frequently,
some Australians claim that excess clutter has caused tension with other household members, including serious long-term toll on relationships.
• It is therefore unsurprising that many proactively clear clutter from their home, which seems to have a positive emotional impact in feeling refreshed, happier or relieved.
• Apart from sporadic cleaning efforts, the annual spring cleaning is a common ritual in Australian households, with most saying they love the process or find it cathartic.
• However, many also claim to hate the spring cleaning process or find it stressful, with some admitting to have trouble deciding what to get rid of or actually throwing things out, even after finding ‘skeletons’.
• Giving things away to charity or using the second hand economy online to sell or trade items are other common ways that Australians declutter
How often do you, or a house member, complain about the clutter in your home?
Close to three in 10 (27.6%) respondents say they or other members of the household complain about the clutter in their home daily or weekly, while a further one in five (20.8%) say these complaints come on a monthly basis. Close to two in five (37.0%) do not often complain about the clutter in their home, while one in seven (14.6%) say such complaints never occur.
7.3%
20.3% 20.8%
37.0%
14.6%
Daily Weekly Monthly Not often Never
Source: CoreData Happy Home Survey (October 2017)Question: How often do you, or a house member, complain about the clutter in your home?
Choosi: Clutter Report
33
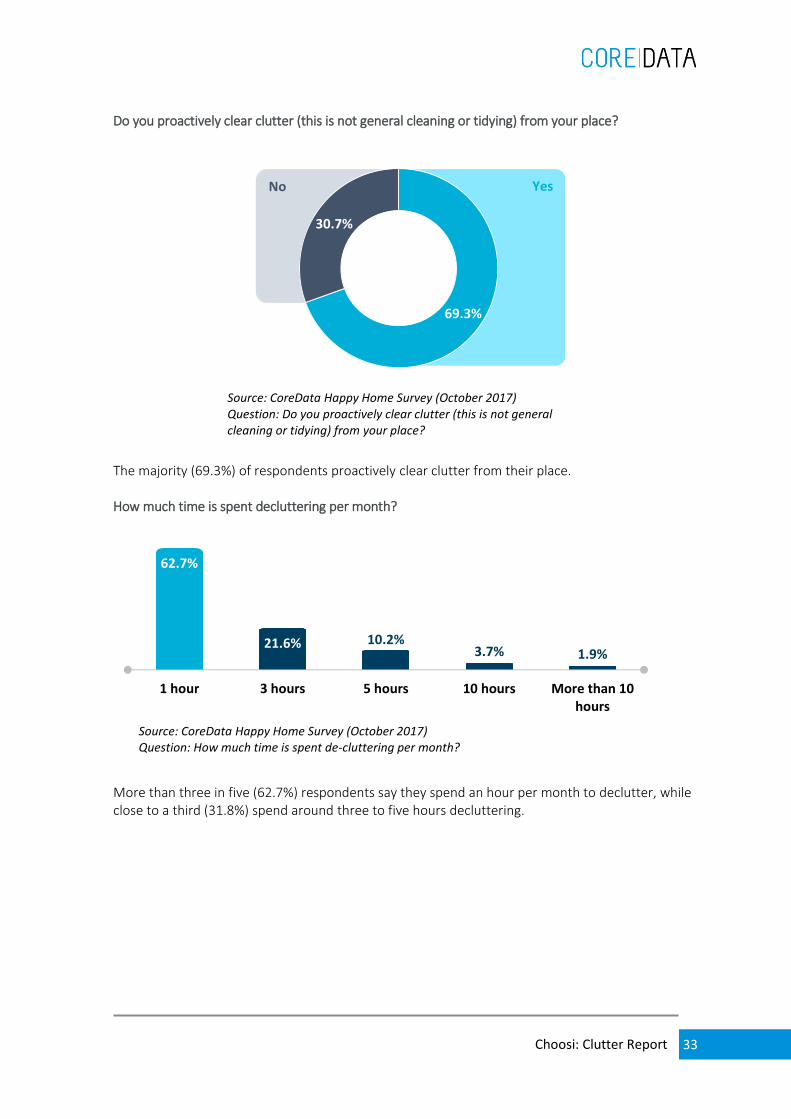
Do you proactively clear clutter (this is not general cleaning or tidying) from your place?
The majority (69.3%) of respondents proactively clear clutter from their place. How much time is spent decluttering per month?
More than three in five (62.7%) respondents say they spend an hour per month to declutter, while close to a third (31.8%) spend around three to five hours decluttering.
Source: CoreData Happy Home Survey (October 2017)Question: Do you proactively clear clutter (this is not general cleaning or tidying) from your place?
No Yes
69.3%
30.7%
62.7%
21.6% 10.2%3.7% 1.9%
1 hour 3 hours 5 hours 10 hours More than 10hours
Source: CoreData Happy Home Survey (October 2017)Question: How much time is spent de-cluttering per month?

Choosi: Clutter Report
34
Have you ever had an argument about clutter in your home?
More than two in five (44.3%) respondents admit to having had arguments about clutter in their home.
Source: CoreData Happy Home Survey (October 2017)Question: Have you ever had an argument about clutter in your home?
No Yes
44.3%
55.7%

Choosi: Clutter Report
35
Where do you store your clutter once you’ve decided to get rid of it?
When asked where they store their clutter once they have decided to get rid of it, close to three in 10 (28.1%) point to their spare rooms. Similar proportions store their to-be-rid-of clutter in the same place as it was originally stored (21.6%), by the front door (19.6%) or in the cupboard (17.2%).
28.1%
21.6%
19.6%
17.2%
13.9%
9.5%
9.1%
5.4%
2.4%
7.7%
Spare room
Same place as it wasoriginally stored
By the front door
In the cupboard
In your car boot
Under the bed
Garage/shed
Throw into the trashbin/garbage dump
Donate to charity
Other
% Yes
Source: CoreData Happy Home Survey (October 2017)Question: Where do you store your clutter once youve decided to get rid of it?
*Multiple answers allowed

Choosi: Clutter Report
36
What impact does clutter have on your life?
A quarter (25.4%) of respondents say clutter creates stress or anxiety in their lives, while less than one in five respondents even admit that clutter causes them to not want have friends or family coming over (17.5%) or that it impacts their happiness negatively (16.5%). Similar proportions say clutter decreases their sense of self-control (14.9%) or creates a sense of shame in them (13.9%).
25.4%
17.5%
16.5%
14.9%
13.9%
10.9%
9.5%
7.3%
52.6%
Creates stress/anxiety
Don't want friends or family comingover
Negative impact on happiness
Decreases sense of self control
Creates sense of shame
Negative impact on relationshipswith other members of the household
Negative impact on self-esteem
Negative impact on health
It doesn't really have an impact
% Yes
Source: CoreData Happy Home Survey (October 2017)Question: What impact does clutter have on your life?
*Multiple answers allowed

Choosi: Clutter Report
37
How does clearing the clutter in your home make you feel?
Many respondents say clearing the clutter in their home makes them feel refreshed (49.0%) or happier (44.3%). They also commonly say they feel relieved (38.4%) or less stressed (28.9%) after decluttering. However, one in six (16.6%) respondents claim clearing clutter in their homes has no impact on them.
49.0%
44.3%
38.4%
28.9%
16.6%
2.9%
Refreshed
Happier
Relieved
Less stressed
It has no impact on me
Other
% Yes
Source: CoreData Happy Home Survey (October 2017)Question: How does clearing the clutter in your home make you feel?
*Multiple answers allowed

Choosi: Clutter Report
38
How do you feel excess clutter can impact relationships in your household?
Close to two in five (37.1%) respondents say having excess clutter in their household leads to disagreements about congested living space. They also have disagreements about discarding of possessions (33.4%) or about new purchases (23.6%) due to excess household clutter. Many also admit that excess clutter has caused emotional distress over parting with possessions (27.0%) or over compulsive shopping or collecting behaviours (14.0%).
37.1%
33.4%
27.0%
23.6%
14.0%
14.6%
4.0%
Disagreements about congestedliving space
Disagreements about discarding ofor parting with their possessions
Emotional distress over parting withpossessions
Disagreements about new purchases
Emotional distress over compulsiveshopping/collecting behaviours
It doesn't impact
Other
% Yes
Source: CoreData Happy Home Survey (October 2017)Question: How do you feel excess clutter can impact relationships in your household?
*Multiple answers allowed

Choosi: Clutter Report
39
How often does clutter cause tension between the people you live with?
Close to three in five (56.4%) respondents say clutter causes tension between the people they live with at least some of the time. Has issues with clutter ever had a serious long term toll on any of your relationships?
Although the vast majority (88.1%) of respondents say issues with clutter have not had a serious long term toll on any of their relationships, one in nine (11.9%) claim that it has, ranging from ongoing tension or arguments to separation/divorce.
3.0%6.2%
47.2% 43.6%
All of the time Most of the time Some of the time Never
Source: CoreData Happy Home Survey (October 2017)Question: How often does clutter cause tension between the people you live with?
7.8%
2.8%
1.3%
88.1%
Yes, ongoing tension/arguments
Yes, deciding not to live with eachother
Yes, separation or divorce
No
% Yes
Source: CoreData Happy Home Survey (October 2017)Question: Has issues with clutter ever had a serious long term toll on any of your relationships?

Choosi: Clutter Report
40
Does your household have any rituals to help cleanse your home of clutter?
When asked if their household has any rituals to help cleanse their home of clutter, close to three in 10 (29.6%) respondents say they have sporadic cleaning efforts when things get a bit out of control. More than one in five say they have a spring cleaning ritual (23.7%) or the great purge, which occurs every few years (21.8%). However, close to a third (32.7%) say their household does not have any rituals to help cleanse their home of clutter.
29.6%
23.7%
21.8%
16.4%
13.2%
11.3%
7.9%
7.4%
6.5%
2.7%
32.7%
1.2%
Sporadic cleaning efforts when things geta bit out of control
Spring cleaning ritual
The great purge - every few years
Regular cleaning schedules
Regularly selling things through garagesales or through share economy
House policies about things that cannot beleft lying around
A 'minimalist enforcer' who regularlykeeps everyone in line
Personal policies around how long you cankeep something that has not been used
Following tactics such as one item in, oneitem out
Calling in outside cleaning help
No
Other
% Yes
Source: CoreData Happy Home Survey (October 2017)Question: Does your household have any rituals to help cleanse your home of clutter?
*Multiple answers allowed

Choosi: Clutter Report
41
Is there a specific time each year when you are most likely to try and declutter your home?
More than a third (36.4%) of respondents say they are most likely to declutter their home during spring, while one in seven (14.2%) do this during the summer. More than a third (35.3%) say it is a monthly affair. What month do you tend to do your ‘spring clean’?
Among those who have spring cleaning rituals or declutter their home during spring, close to two in five either do it in October (41.4%) or September (37.3%). More than one in five (21.3%) do their spring cleaning later in the season in November.
36.4%
14.2%3.2%
5.7%
35.3%
5.1%
Spring Summer Autumn Winter It’s a monthly affair
Other
Source: CoreData Happy Home Survey (October 2017)Question: Is there a specific time each year when you are most likely to try and declutter your home?
37.3%41.4%
21.3%
September (early) October (mid) November (late)
Source: CoreData Happy Home Survey (October 2017)Question: What month do you tend to do your 'spring clean'?

Choosi: Clutter Report
42
What is the biggest trigger for your household’s spring clean?
The most commonly cited triggers for spring cleaning are the accumulation of clutter (47.3%), that it is a seasonal ritual (23.8%) and being more likely to entertain others at home and putting on the best face (20.0%).
47.3%
23.8%
20.0%
15.1%
13.4%
8.2%
4.6%
3.5%
8.9%
Accumulation of clutter
Seasonal ritual
More likely to entertain others athome so putting on best face
Setting a good example for othersin my household
Making way for new things comingin festive season
Positive Feng Shui
Influence from social media,documentaries and podcasts aboutthe important of reducing clutter
No real trigger
Other
% Yes
Source: CoreData Happy Home Survey (October 2017)Question: What is the biggest trigger for your household’s spring clean?
*Multiple answers allowed

Choosi: Clutter Report
43
How do you feel about the spring cleaning process?
More than half (52.9%) of respondents love the spring cleaning process, while more than a third (36.5%) feel the opposite. Close to three in five (56.9%) find the entire process cathartic as opposed to a third (33.2%) who feel it is stressful. Interestingly, similar proportions feel the spring cleaning process is an enjoyment (47.8%) or an obligation (45.9%).
Source: CoreData Happy Home Survey (October 2017)Question: How do you feel about the spring cleaning process?
9.8%
10.6%
6.3%
33.2%
36.5%
45.9%
56.9%
52.9%
47.8%
Stressful
Hate it
Obligation
Cathartic
Love it
Enjoyment
Choosi: Clutter Report
44
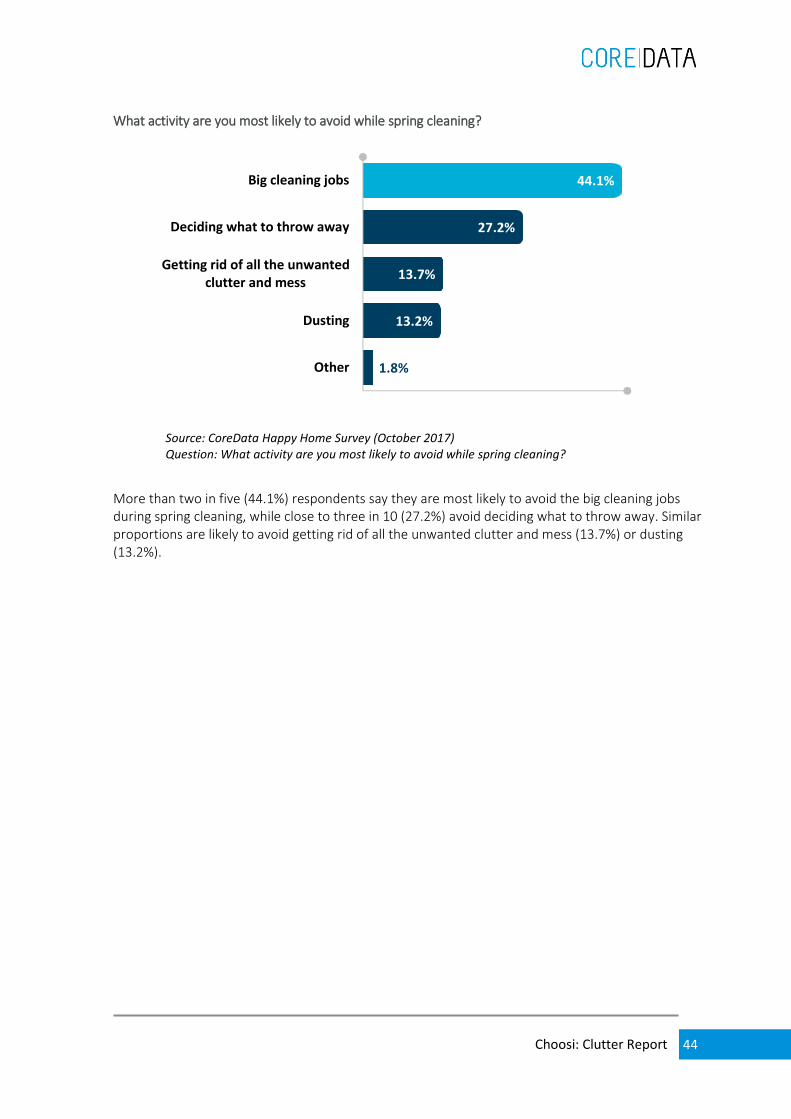
What activity are you most likely to avoid while spring cleaning?
More than two in five (44.1%) respondents say they are most likely to avoid the big cleaning jobs during spring cleaning, while close to three in 10 (27.2%) avoid deciding what to throw away. Similar proportions are likely to avoid getting rid of all the unwanted clutter and mess (13.7%) or dusting (13.2%).
44.1%
27.2%
13.7%
13.2%
1.8%
Big cleaning jobs
Deciding what to throw away
Getting rid of all the unwantedclutter and mess
Dusting
Other
Source: CoreData Happy Home Survey (October 2017)Question: What activity are you most likely to avoid while spring cleaning?

Choosi: Clutter Report
45
What do you tend to have the most trouble throwing out when you are ‘spring cleaning’?
When asked which items they tend to have the most trouble throwing out during spring cleaning, more than a third (35.7%) cite clothing and footwear while similar proportions cite general ends and odds (31.8%) or books and records/CDs (30.4%). Some also have trouble getting rid of materials for hobbies and interests (24.8%), technology products (24.6%), paper (23.2%) or antiques or collectibles (22.6%).
35.7%
31.8%
30.4%
24.8%
24.6%
23.2%
22.6%
15.4%
14.7%
14.5%
Clothing and footwear
General odds and ends
Books and records/CDs
Materials for hobbies and interests
Technology products
Paper (e.g. bills, receipts, etc.)
Antiques and collectibles
Movies/home videos
Kid's toys
Work materials (e.g. paperworkand/or equipment)
% Yes
Source: CoreData Happy Home Survey (October 2017)Question: What do you tend to have the most trouble throwing out when you are 'spring cleaning'?
*Top 10 answers only*Multiple answers allowed

Choosi: Clutter Report
46
Are there any typical ‘skeletons’ you tend to find in the closet when spring cleaning?
Around a third of respondents find unfiled papers or unused gadgets and technology in the closet when they are spring cleaning (33.5% and 33.4% respectively). Other typical ‘skeletons’ they tend to find in the closet include evidence of hobbies that have fallen by the wayside (30.1%) and embarrassing or unused fashion items (29.1%).
33.5%
33.4%
30.1%
29.1%
11.8%
9.3%
2.2%
Unfiled papers
Unused gadgets and technology
Evidence of hobbies or new intereststhat have fallen by the wayside
Embarrassing or unused fashion items
Sporting or exercise equipment
None
Other
% Yes
Source: CoreData Happy Home Survey (October 2017)Question: Are there any typical ‘skeletons’ you tend to find in the closet when spring cleaning?
*Multiple answers allowed

Choosi: Clutter Report
47
Does coming across these tend to make you get rid them?
The vast majority (83.8%) of respondents say coming across these typical ‘skeletons’ in the closet tend to make them get rid of the items. How much clutter do you think you get rid of every year from your home (whether thrown out, given away or sold)? How many large bin bags would you estimate you could fill?
Respondents estimate getting rid of an average of 6.8 large bin bags worth of clutter every year or a total of 60,948,400 bin bags Australia-wide annually.
Source: CoreData Happy Home Survey (October 2017)Question: Does coming across these tend to make you get rid them?
Yes,sometimes
Never Yes, always
13.8%
70.0%
16.2%
6.8Source: CoreData Happy Home Survey (October 2017)Question: How much clutter do you think you get rid of every year from your home (whether thrown out, given away or sold)? How many large bin bags would you estimate you could fill?

Choosi: Clutter Report
48
How much of a typically sized room could you likely fill with this disposed-off clutter?
Close to half (49.4%) of respondents say they are likely to fill about ¼ of a typically sized room with this disposed-off clutter, while close to three in 10 (28.4%) say they can fill about ½ to one typically sized room. This disposed-off clutter translates to approximately 4 cubic metres per household or 36,279,943 m3 Australia-wide. If we put a box of clutter along every inch of coastline in Australia, we will go around Australia about 4 times or 145,120 kilometres.
17.9%
49.4%
18.2%
10.2%
1.4%
2.1%
0.9%
None
Fill about ¼ room
Fill about ½ room
Fill about one room
Fill about 1½ rooms
Fill about 2 rooms
Fill more than 2 rooms
Source: CoreData Happy Home Survey (October 2017)Question: How much of a typically sized room could you likely fill with this disposed of clutter?

Choosi: Clutter Report
49
How do you tend to store your in-home clutter?
When asked how they tend to store their in-home clutter, close to half (48.4%) of respondents place them in cupboards and drawers, while more than two in five (44.9%) say they are relegated to the shed, garage or spare room.
48.4%
44.9%
22.4%
19.0%
9.7%
4.2%
18.7%
2.3%
Cupboards and drawers
Relegated to shed, garage or spareroom
Standard storage buckets, etc.
Under beds
Clever storage solutions (e.g. spacesavers and vacuum-pack bags)
Car boot
Do not really store that much
Other
% Yes
Source: CoreData Happy Home Survey (October 2017)Question: How do you tend to store your in-home clutter?
*Multiple answers allowed

Choosi: Clutter Report
50
Please specify what clever storage solution/s do you mean. Low sample, data indicative only.
By far the most commonly cited clever storage solution is vacuum-pack bags (56.6%).
56.6%
14.1%
8.1%
7.1%
3.0%
3.0%
8.1%
Vacuum-pack bags
Boxes
Tubs
Stackable containers
Bookshelves
Cupboards
Other
Source: CoreData Happy Home Survey (October 2017)Question: Please specify what clever storage solution/s do you mean.

Choosi: Clutter Report
51
"Have a large shed, however items you wish to keep must be properly bagged or boxed
otherwise damage would occur." (Female, 78 years old, NSW)
"Coat hangers that can hang multiple items. Bags that you suck out the excess air with the
vacuum. Airtight large." (Female, 40 years old, SA)
"Vacuum packed bags can be used to store out-of-season clothes, storage bins and purpose-built
storage cupboards." (Female, 62 years old, NSW)
"Dedicated tubs and plot drawers. But if it's stored like that it's not clutter, is it?" (Female, 70
years old, NSW)
"Vacuum seal bags that can be deflated once clothes are in, so you can put bag on bag."
(Female, 37 years old, QLD)
"Large plastic boxes with lids, wheels, and they can be stacked on top of each other." (Male, 67
years old, QLD)
"Vacuum seal bags for clothes/Manchester, storage tubs for other "things"." (Female, 40 years
old, SA)
"Spare blankets for visitors are in vacuum packs and cupboards." (Female, 66 years old, NSW)
"Vacuum seal bags and plastic storage containers with lids." (Female, 57 years old, QLD)
"I added a piece of flatwood in my hallway which was handy." (Male, 38 years old, ACT)
"Unused suitcases in attic. Hard-to-reach top cupboards." (Female, 34 years old, SA)
"Purchased storage containers or whatever from IKEA, etc." (Female, 22 years old, VIC)
"Clear storage boxes so you can see what is in them." (Female, 38 years old, QLD)
"Making book shelves, with boxes in them, and labelled." (Female, 58 years old, NSW)
"Plastic storage boxes stacked 2/3 to the ceiling." (Female, 65 years old, NSW)
"Put things in vacuum bags and store under beds." (Female, 60 years old, NSW)
"Vacuum pack bags and plastic bins with wheels." (Female, 50 years old, NSW)
"DIY shelving, stackable containers and boxes." (Female, 55 years old, TAS)
"Purpose built cupboards with big shelves." (Male, 66 years old, TAS)

Choosi: Clutter Report
52
Do you rely on outsourced storage?
Where do you outsource your storage?
Low sample, data indicative only.
Source: CoreData Happy Home Survey (October 2017)Question: Do you rely on outsourced storage?
No
Yes
4.0%
96.0%
47.2%
34.6%
27.6%
11.5%
5.3%
Paid storage options
Friend's place
Mum and dad's house
Other storage facilities (i.e.warehouse, containers, etc.)
Other
% Yes
Source: CoreData Happy Home Survey (October 2017)Question: Where do you outsource your storage?
*Multiple answers allowed

Choosi: Clutter Report
53
How much money is spent on outsourced storage per month? Low sample, data indicative only.
Only very few (4.0%) respondents rely on outsourced storage, close to half (47.2%) of whom use paid storage options. They also cite their friends’ (34.6%) or parents’ (27.6%) places. Among these respondents, more than a third (35.5%) spend less than $100 per month, while close to a quarter (23.1%) estimate they spend $350 per month. Close to three in 10 (29.3%) claim their outsourced storage comes at no cost. On average, a total of $586,739,274 is spent annually on outsourced storage Australia-wide.
29.3%
35.5%
23.1%
1.3%
10.7%
No cost
Less than $100
$350 per month
$600 per month
$1000 per month
Source: CoreData Happy Home Survey (October 2017)Question: How much money is spent on outsourced storage per month?

Choosi: Clutter Report
54
How long do you usually actually keep your clutter stored somewhere once you’ve packed it up to get rid of it?
More than a quarter (26.1%) of respondents say they get rid of their stored clutter immediately once they have packed it up. Others say they actually keep their stored clutter for days (25.9%) or weeks (19.4%) before they get rid of it. However, similar proportions admit it takes them months (14.5%) or even years (14.1%) before getting rid of clutter they have already packed up.
26.1%
25.9%
19.4%
14.5%
14.1%
Get rid of it immediately
Days
Weeks
Months
Years
Source: CoreData Happy Home Survey (October 2017)Question: How long do you usually actually keep your clutter stored somewhere once you’ve packed it up to get rid of it?

Choosi: Clutter Report
55
Have you bought a storage device/solution in the last few years to help reduce clutter that you have not actually got around to using?
For respondents who tend to store their in-home clutter in standard storage buckets or clever storage solutions, close to a third (32.3%) have bought at least one storage device or solution in the last few years to help reduce clutter but have not actually gotten around to using them.
Source: CoreData Happy Home Survey (October 2017)Question: Have you bought a storage device/solution in the last few years to help reduce clutter that you have not actually got around to using?
Yes,at least one
No Yes, several
13.1%
19.2%
67.7%

Choosi: Clutter Report
56
Do you buy furniture because of storage facilities it offers (e.g. sofas that have storage space under cushions)?
More than a third (34.6%) of respondents say they buy furniture because of storage facilities it offers at least sometimes.
Source: CoreData Happy Home Survey (October 2017)Question: Do you buy furniture because of storage facilities it offers (e.g. sofas that have storage space under cushions)?
Yes, sometimes
No
Yes, all the time
4.3%
30.3%
65.4%

Choosi: Clutter Report
57
What is the most important way you have found to help declutter your home?
Close to a third (32.0%) of respondents find giving things to charity as the most important way of decluttering their home, while more than a quarter (26.3%) point to throwing things away. Close to one in five (19.2%) say it is being strict about what is actually being accumulated in their home. Fewer cite selling or swapping things (11.3%) and storage solutions (8.5%) as important ways of decluttering their home.
32.0%
26.3%
19.2%
11.3%
8.5%
2.7%
Giving things to charity
Throwing things away
Being strict about what isactually being accumulated
Selling or swapping things
Storage solutions
Other
Source: CoreData Happy Home Survey (October 2017)Question: What is the most important way you have found to help declutter your home?

Choosi: Clutter Report
58
Have you ever used the second hand economy online to sell or trade items you have come to consider as clutter (e.g. trading and community market social media pages/websites/apps)?
Close to half (45.2%) of respondents have used the second hand economy online to sell or trade items they consider as clutter. If so, which one?
Among those who have used the second hand economy online to sell or trade items they consider as clutter, close to half (49.8%) say they utilised Gumtree, while others cite eBay (28.2%) and Facebook (17.4%).
Source: CoreData Happy Home Survey (October 2017)Question: Have you ever used the second hand economy online to sell or trade items you have come to consider as clutter (e.g. trading and community market social media pages/websites/apps)?
Yes,sometimesNo
Yes, regularly
12.5%
32.7%54.9%
49.8%
28.2%
17.4%4.6%
Gumtree eBay Facebook Other
Source: CoreData Happy Home Survey (October 2017)Question: If so, which one?
Choosi: Clutter Report
59
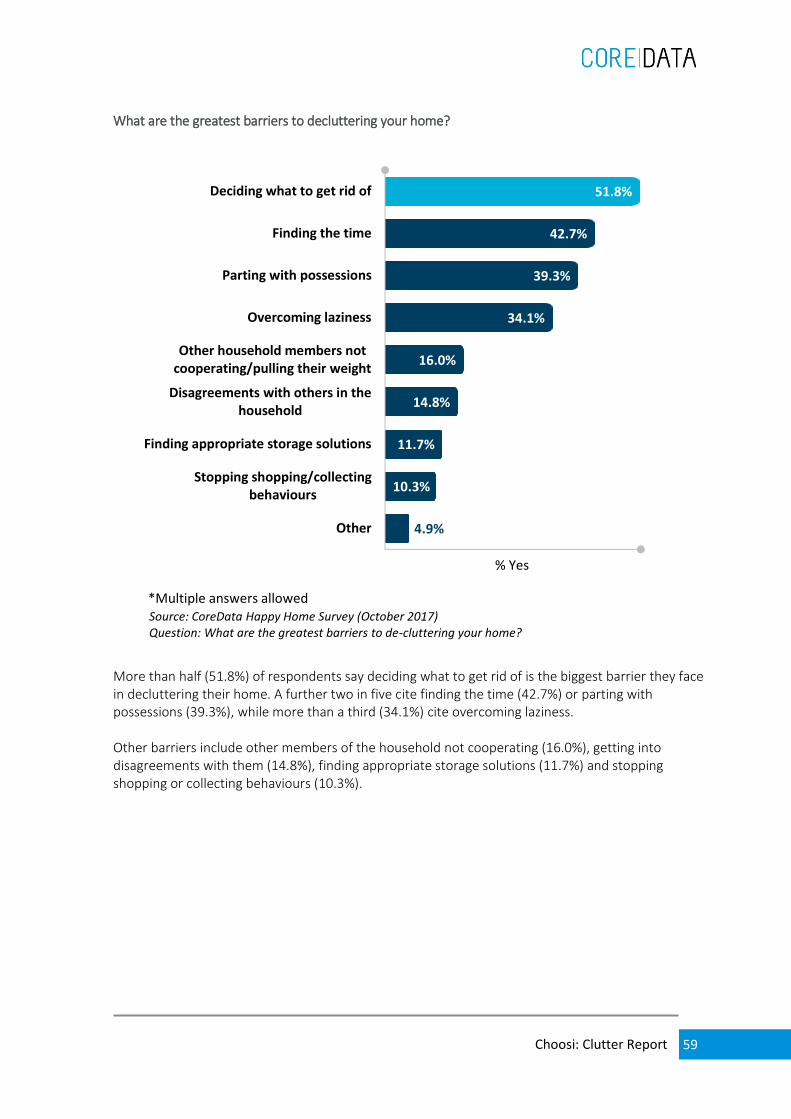
What are the greatest barriers to decluttering your home?
More than half (51.8%) of respondents say deciding what to get rid of is the biggest barrier they face in decluttering their home. A further two in five cite finding the time (42.7%) or parting with possessions (39.3%), while more than a third (34.1%) cite overcoming laziness. Other barriers include other members of the household not cooperating (16.0%), getting into disagreements with them (14.8%), finding appropriate storage solutions (11.7%) and stopping shopping or collecting behaviours (10.3%).
51.8%
42.7%
39.3%
34.1%
16.0%
14.8%
11.7%
10.3%
4.9%
Deciding what to get rid of
Finding the time
Parting with possessions
Overcoming laziness
Other household members notcooperating/pulling their weight
Disagreements with others in thehousehold
Finding appropriate storage solutions
Stopping shopping/collectingbehaviours
Other
% Yes
Source: CoreData Happy Home Survey (October 2017)Question: What are the greatest barriers to de-cluttering your home?
*Multiple answers allowed
Choosi: Clutter Report
60
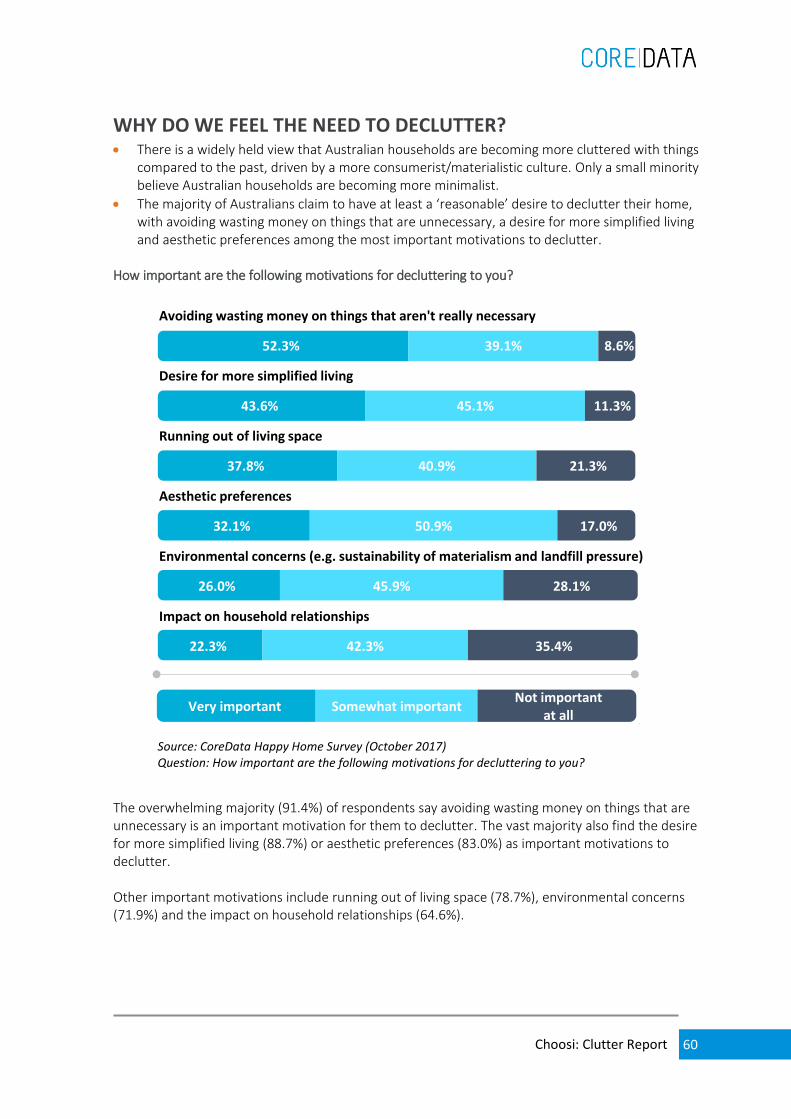
WHY DO WE FEEL THE NEED TO DECLUTTER? • There is a widely held view that Australian households are becoming more cluttered with things
compared to the past, driven by a more consumerist/materialistic culture. Only a small minority believe Australian households are becoming more minimalist.
• The majority of Australians claim to have at least a ‘reasonable’ desire to declutter their home, with avoiding wasting money on things that are unnecessary, a desire for more simplified living and aesthetic preferences among the most important motivations to declutter.
How important are the following motivations for decluttering to you?
The overwhelming majority (91.4%) of respondents say avoiding wasting money on things that are unnecessary is an important motivation for them to declutter. The vast majority also find the desire for more simplified living (88.7%) or aesthetic preferences (83.0%) as important motivations to declutter. Other important motivations include running out of living space (78.7%), environmental concerns (71.9%) and the impact on household relationships (64.6%).
52.3%
43.6%
37.8%
32.1%
26.0%
22.3%
Very important
39.1%
45.1%
40.9%
50.9%
45.9%
42.3%
Somewhat important
8.6%
11.3%
21.3%
17.0%
28.1%
35.4%
Not important at all
Avoiding wasting money on things that aren't really necessary
Desire for more simplified living
Running out of living space
Aesthetic preferences
Environmental concerns (e.g. sustainability of materialism and landfill pressure)
Impact on household relationships
Source: CoreData Happy Home Survey (October 2017)Question: How important are the following motivations for decluttering to you?

Choosi: Clutter Report
61
Do any of these concerns actually impact your buying behaviours?
Among those who believe these concerns are important motivations for decluttering, close to three in five (58.5%) say these actually impact their buying behaviours. Which of the following statements do you agree with most?
Close to half (49.0%) of respondents agree that Australian households are becoming more cluttered with things compared to the past, while only one in eight (13.3%) say Australian households are becoming more ‘minimalist’.
Source: CoreData Happy Home Survey (October 2017)Question: Do any of these concerns actually impact your buying behaviours?
Yes, tosome extent
No,not really
Yes, significantly
11.8%
46.7%
41.5%
37.7%49.0% 13.3%
Australian households are becoming more
cluttered with things compared
to the past
Australian households are becoming more ‘minimalist’ compared to the past
Australian households are about the same in terms or clutter these
days compared to the past

Choosi: Clutter Report
62
Why do you think this is? [more cluttered]
Why do you think this is? [more minimalist]
49.8%
17.0%
12.4%
9.6%
8.4%
2.9%
More consumerist/materialistic culture
Cheaper goods
More social pressures to buy
More cool stuff to buy
More money to spend
Other
Source: CoreData Happy Home Survey (October 2017)Question: Why do you think Australian households are becoming more cluttered?
46.8%
19.7%
16.6%
9.7%
7.3%
Style trends
Aesthetic preferences
Societal expectations
Increasingly entertaining others inthe home
Other
Source: CoreData Happy Home Survey (October 2017)Question: Why do you think Australian households are becoming more minimalist?

Choosi: Clutter Report
63
Among those who think Australian households are becoming more cluttered with things compared to the past, close to half (49.8%) attribute this to a more consumerist or materialistic culture. Other reasons include cheaper goods (17.0%) and more social pressures to buy (12.4%). Among those who think Australian households are becoming more ‘minimalist’ compared to the past, close to half (46.8%) think this is due to the current style trends. Other reasons include aesthetic preferences (19.7%) and societal expectations (16.6%). How strongly do you currently desire to declutter your home?
More than a third (34.3%) of respondents express a strong to extreme desire to declutter their home, while a similar proportion (37.8%) have a reasonable desire to do so. However, more than a quarter (26.9%) claim to have minimal to no desire at all.
10.6%
23.7%
37.8%
20.1%
6.8%
0.9%
Extreme desire
Strong desire
Reasonable desire
Minimal desire
No desire
Other
Source: CoreData Happy Home Survey (October 2017)Question: How strongly do you currently desire to declutter your home?

Choosi: Clutter Report
64
DEMOGRAPHICS
Female 52.7%
Male 47.3%
TOTAL 100.0%
29 years old & below 18.7%
30 - 39 years old 18.5%
40 - 49 years old 18.0%
50 - 59 years old 16.9%
60 years old & above 27.9%
TOTAL 100.0%
Generation Y 32.0%
Generation X 26.0%
Baby Boomers 35.1%
Pre-Boomers 6.9%
TOTAL 100.0%
Single 26.0%
Living with partner/married 60.9%
Separated/divorced/widowed 12.3%
Other 0.8%
TOTAL 100.0%
Living alone (never had children) 11.0%
Living with flatmate(s) (never had children) 5.0%
Living with parents/siblings (never had children) 10.5%
Living with partner only (never had children) 11.6%
Living with your children (under 18 years) at home 23.6%
Living with your children (over 18 years) at home 8.3%
Living with your children (both over and under 18 years) at home 2.1%
Children have all left home 23.4%
Other 4.5%
TOTAL 100.0%
Living Arrangements
Marital Status
Gender
Age Banded
Age Generation

Choosi: Clutter Report
65
ACT 2.8%
NSW 20.8%
NT 0.1%
QLD 18.3%
SA 13.0%
TAS 3.2%
VIC 21.7%
WA 20.1%
TOTAL 100.0%
The capital city of my state/territory 64.1%
A regional centre 25.8%
A rural area 10.1%
TOTAL 100.0%
Primary 0.6%
Part of high school 11.3%
Completed high school 17.9%
Diploma or certificate qualification 34.4%
Degree qualification 21.5%
Postgraduate qualification 14.4%
TOTAL 100.0%
Full-time paid employment 29.9%
Part-time paid employment 14.7%
Self-employed 5.1%
Casual employment 5.9%
Transitioning to retirement and working part-time 0.9%
Fully retired 19.6%
Full-time home duties 7.2%
Maternity leave 0.7%
Unemployed / not in paid employment 7.2%
Student 4.6%
On a disability pension 4.1%
TOTAL 100.0%
State
Work Status
Area
Educational Attainment

Choosi: Clutter Report
66
Business owner 7.3%
Manager 11.3%
Professional 30.0%
Technician 3.6%
Trades worker 3.8%
Community and personal service worker 3.8%
Clerical and administrative worker 21.0%
Sales worker 7.9%
Machinery operators and driver 1.9%
Labourer 5.2%
Other 4.2%
TOTAL 100.0%
$20,000 or less 28.5%
$20,001 to $30,000 19.6%
$30,001 to $40,000 10.8%
$40,001 to $50,000 6.8%
$50,001 to $60,000 8.3%
$60,001 to $70,000 4.8%
$70,001 to $80,000 4.4%
$80,001 to $90,000 3.7%
$90,001 to $100,000 4.1%
$100,001 to $125,000 4.1%
$125,001 to $150,000 2.8%
$150,001 to $200,000 1.3%
More than $200,000 0.8%
TOTAL 100.0%
Occupation
Personal Income

Choosi: Clutter Report
67
$50,000 or less 39.5%
$50,001 to $75,000 19.0%
$75,001 to $100,000 14.9%
$100,001 to $125,000 9.6%
$125,001 to $150,000 7.1%
$150,001 to $200,000 6.6%
$200,001 to $250,000 2.0%
$250,001 to $350,000 1.1%
$350,001 or more 0.4%
TOTAL 100.0%
I have no investments 42.8%
$50,000 or less 14.4%
$50,001 to $150,000 10.8%
$150,001 to $250,000 8.6%
$250,001 to $350,000 6.6%
$350,001 to $450,000 3.4%
$450,001 to $550,000 3.0%
$550,001 to $650,000 3.0%
$650,001 to $750,000 1.8%
$750,001 to $1 million 2.6%
More than $1 million to $3 million 2.7%
More than $3 million to $5 million 0.2%
More than $5 million 0.2%
TOTAL 100.0%
Mass Market 60.5%
Mass Affluent 28.7%
Core Affluent 8.3%
HNW 2.5%
TOTAL 100.0%
Investment Portfolio
Household Income
Wealth Segment

Choosi: Clutter Report
68
COREDATA ABOUT US
CoreData Research is a global specialist financial services research and strategy consultancy.
CoreData Research understands the boundaries of research are limitless and with a thirst for
new research capabilities and driven by client demand; the group has expanded over the past
few years into the Americas, Africa, Asia, and Europe.
CoreData Group has operations in Australia, the United Kingdom, the United States of America,
Brazil, Singapore, South Africa and the Philippines. The group’s expansion means CoreData
Research has the capabilities and expertise to conduct syndicated and bespoke research
projects on six different continents, while still maintaining the high level of technical insight and
professionalism our repeat clients demand.
With a primary focus on financial services CoreData Research provides clients with both
bespoke and syndicated research services through a variety of data collection strategies and
methodologies, along with consulting and research database hosting and outsourcing services.
CoreData Research provides both business-to-business and business to- consumer research,
while the group’s offering includes market intelligence, guidance on strategic positioning,
methods for developing new business, advice on operational marketing and other consulting
services.
The team is a complimentary blend of experienced financial services, research, marketing and
media professionals, who together combine their years of industry experience with primary
research to bring perspective to existing market conditions and evolving trends.
CoreData Research has developed a number of syndicated benchmark proprietary indexes
across a broad range of business areas within the financial services industry.
• Experts in financial services research
• Deep understanding of industry issues and business trends
• In-house proprietary industry benchmark data
• Industry leading research methodologies
• Rolling benchmarks
The team understands the demand and service aspects of the financial services market. It is
continuously in the market through a mixture of constant researching, polling and mystery
shopping and provides in-depth research at low cost and rapid execution. The group builds a
picture of a client’s market from hard data which allows them to make efficient decisions which
will have the biggest impact for the least spend.

Choosi: Clutter Report
69
www.coredata.com.au
AUSTRALIA
SYDNEY
CoreData Pty Limited Suite 7, Level 9, 66 Hunter St Sydney, NSW, 2000
T: +61 2 9376 9600
PERTH
CoreData Pty Limited 191 St Georges Terrace, Perth WA 6000
T: +61 8 6500 3216
PHILIPPINES
CoreData Research Services Inc. Unit E-1608 Philippine Stock Exchange Centre, Exchange Rd, Ortigas, Pasig City, 1605
T: +63 2 667 3996
E: [email protected] oredataresearch.com
UK
CoreData Research Ltd 6 Foster Lane, London ECV 6HH United Kingdom
T: +44 (0) 207 600 5555
US
CoreData Research LLC 15 Court Square, #450 Boston, 02108
T: +1 (857) 239 8398