chlorophyll-a and pheopigments as tracers of ... - icm … et al... · chlorophyll-a and...
TRANSCRIPT

Pergamon Geochimica et Cosmochimica Acta, Vol. 61, No. 21, pp. 4605-4619, 1997
Copyright 0 1997 Elsevier Science Ltd Printed in the USA. All rights reserved
0016-7037/97 $17.00 + .oO
PI1 SOO16-7037( V) 00358-X
Chlorophyll-a and pheopigments as tracers of labile organic carbon at the central equatorial Pacific seafloor
MARK P. STEPHENS,’ DAVID C. KADKO,' CRAIG R. SMITH,* and MIKEL LATASA*
‘Division of Marine and Atmospheric Chemistry, Rosenstiel School of Marine and Atmospheric Science, University of Miami, Miami, Florida 33149, USA
*Department of Oceanography, University of Hawaii, Honolulu, Hawaii 96822, USA
(Received September 12, 1996; accepted in revised form July 21, 1997)
Abstract-High rates of primary production and fast sinking rates lead to the deposition of phytodetritus and highly reactive organic matter to the sediments of the central equatorial Pacific. These substances are responsible for driving important chemical fluxes and fueling benthic organisms. Chloropigments have proven useful as tracers of similar highly reactive organic carbon components in lacustrine and near- shore marine sediments. In this study we investigate the degradation of chlorophyll-a and pheopigments-a at four abyssal sites on the JGOFS equatorial Pacific transect along 14O”W and explore the usefulness of these chloropigments as tracers of the most-reactive component of the deep-sea particulate organic carbon (POC) rain.
First-order reaction rate constants (k = l-75 yr -’ , half-life 3-250 d) and relative reactivities (chloro- phyll-a > allomer and pheophorbide-a > pheophytin-a) derived from most of the sedimentary profiles are similar to those found in laboratory and other field (lake and coastal marine) studies. However, in some profiles, the rate constants determined by fitting data below 0.5 cm are slower by up to 3 orders of magnitude despite an apparent abundance of bacteria, macrofauna, and porewater oxygen. Model results assuming multi-G kinetics suggest that these chloropigments degrade as two components: one, which accounts for at least 99% of the degradation and l l-57% of the sediment inventory, degrades with a half-life of 4- 120 days. The other component degrades with a half-life of up to 440 years. These results suggest that some otherwise labile POC may be protected and escape rapid degradation near the sediment-water interface. If phytodetritus is deposited continuously throughout the year, our model- calculated chlorophyll-a fluxes indicate that it could account for 25-100% of the annual POC flux at sites close to the equator. Copyright 0 1997 Elsevier Science Ltd
1. INTRODUCTION
The rain of particulate organic carbon (POC) from the ocean surface is the main source of energy and raw material fueling benthic organisms. Predominately of planktonic origin (in open ocean regions), POC is composed of a multitude of compounds with different reactivities, but a majority of the POC reaching the deep-seafloor degrades within the upper l-2 cm of sediment with lifetimes of a few months (Reim- ers, 1989). The flux of this very reactive carbon might be as much as 100 times that of slowly degrading material, but because of its reactivity, it only comprises a small fraction of the bulk sedimentary organic carbon pool.
The equatorial Pacific, because of its size and the magni- tude of the vertical carbon flux, has a significant role in the global carbon cycle (e.g., sea air CO2 exchange and new production estimates; Chavez and Barber, 1987; Tans et al., 1990). The region is also a major zone of POC flux to and remineralization at the seafloor (Murray and Grundmanis, 1980; Bemer, 1982; Jahnke and Jackson, 1992). Observa- tions made during the JGOFS equatorial Pacific (EqPac) benthic cruise (November-December 1992) suggest that transport of POC from the surface to the seafloor is rapid (Honjo et al., 1995), allowing substantial quantities of reac- tive, organic carbon-rich phytoplankton remains (phytodetri- tus) to blanket the sediment surface (Hoover, 1995; Smith et al., 1996). Results from fine-scale porewater O2 profiles indicate that 70-90% of the carbon remineralization at the
sites with the most phytodetrital coverage involves material that degrades with half-lives of less than six months (mean rate constant, k = 14.9 + 5.8 yr-I, Hammond et al., 1996).
Theoretically, the most labile component of sedimentary organic carbon could be investigated using profiles of total organic carbon and multicomponent diagenetic models in which carbon is grouped into several pools according to reactivity (i.e., the multi-G models; Bemer, 1980). In prac- tice there are several difficulties with this approach. First, if the extremely labile component is responsible for only 10% of the decrease in the total organic carbon concentration and it degrades within the upper 1 cm of sediment (Hammond et al., 1996)) then the resolution and accuracy required of the measurements to detect this fraction in solid-phase carbon profiles are close to the analytical capabilities. Natural vari- ability in the total organic carbon concentration caused by patchiness in fluxes and bioturbation can totally obscure the decrease associated with the labile fraction. Also, since the POC rain is composed of compounds covering a wide spec- trum or near continuum of reactivities (Middleburg, 1989), grouping these into discrete sets is problematic. Finally, fluxes of phytodetritus can occur as seasonal pulses (Billett et al., 1983)) and bioturbation might not be strictly diffusive. This further obscures the signal of the most labile carbon and hinders efforts to model it.
Highly reactive organic carbon is better studied by focus- ing on one or more of its individual components. Chloropig-
4605

4606 M. P. Stephenh et al
ments have been utilized as tracers of mixing processes and organic matter diagenesis in lakes and coastal marine sedi- ments (Furlong and Carpenter, 1988; Sun et al., 1991 ). This suggests that chloropigments may also be suitable tracers in deep-sea regions having substantial POC and phytodetrital fluxes (such as the equatorial Pacific ).
One of the primary goals of this study was to determine the degradation rates of chlorophyll-a and pheopigments-a in central equatorial Pacific sediments. Using sediment mixing rates determined from ““Th and ““Pb profiles. we applied one-dimensional models to obtain the chloropigment degra- dation rates from sediment profiles. We also investigated the use of these chloropigments as sedimentary tracers of the labile carbon. Since they are intimately associated with phy- toplankton and were detected in phytodetritus, chloropig- ments can provide information concerning the flux, mixing, and degradation of the most reactive component of POC to reach the seafloor. The use of both chlorophyll-a and pheopigments allows material at different stages of degrada- tion and covering a range of reactivities to be included.
2. STUDY AREA AND METHODS
2.1. Study Area and Sample Collection
The coring sites, which were occupied during November-Decem- ber 1992. are located in the central equatorial Pacific along 14O”W at 0”N. 2”N. YN. and 9”N (Appendix; Table Al ). Bottom water oxygen concentration ( 17 I- 175 ,dM) and temperature (2°C ) vary by no more than 6% over the entire transect (Hammond et al.. 1996). In contrast, there are strong latitudinal gradients in primary productivity, biogenic flux to the deep-sea, and benthic remineraliza- tion rate. Peak values for each of these parameters typically occur near the center of equatorial upwelling. but significant intraannual variations in both the magnitudes and latitudinal distributions associ- ated with the seasonal and ENS0 cycles have been observed ( Petia et al.. 1990: Martin et al.. 1991; Murray et al.. 1994: Honjo et al.. 1995: Hammond et al., 1996). During the lirst half of 1992. for example. El Nitio conditions prevailed, and primary productivity at sites close to the equator was lower than later in the year after cold upwelling had resumed (Murray et al., 1994).
Cores were collected with a multiple corer and a USNEL-type box corer on the JGOFS EqPac benthic leg aboard R/V Thomas G. Thompson, The multiple corer (Bamett et al., 1984), which collects sediment in eight individual core liners ( dia. IO cm) and is capable of collecting sediment with undisrupted surface assemblages of phy- todetritus, was the source of all samples for chloropigment analyses. Cores were sectioned shipboard and stored in plastic sample bags until analysis on land. Samples for pigment analyses were frozen in liquid nitrogen and stored in the dark at -80°C (see Smith et al.. 1996, and Stephens. 1996 for further details ).
2.2. Radionuclides and Porosity
LZITh (t,,: = 24.1 d) and ““Pb (f,,2 = 22.3 yr) are produced in the water column by the radioactive decay of “‘U and (ultimately) “hRa, respectively. While “% and “‘Ra are soluble in seawater. “4Th and “‘Pb are scavenged by settling particles. This leads to excesses of ““Th and “‘“Pb with respect to ?I and Z’hRa in the sediment. The excesses and known decay rates make them useful as tracers of sediment mixing. ‘?‘Th can be used to describe mixing of particles deposited within the past 100 days, while ““Pb, because of its longer half-life, is largely associated with older particles.
Sediment samples were weighed, dried to constant weight at 60°C. and reweighed to determine porosity and dry bulk density ( p). L7JTh and “‘U were measured from dry sediment samples of 5-10 g, which were spiked with 22XTh/“‘U and then completely dissolved in concentrated hydrofluoric, nitric, and hydrochloric acids, The ra- dionuclides were separated by ion exchange (Bhat et al.. 1969) and
then extracted using thenyltriAuoroacetone/benzene solutions. The solutions were evaporated onto stainless steel planchets. Total “‘Th activity was determined by beta counting, followed by alpha count- ing of “‘Th ( for chemical yield determination ) The supported activ- ity equaled that determined for ‘%I by alpha spectrometry.
Total ““Pb activity was determined by measuring its granddaugh- ter. ““PO (r,,? = 138 d). Samples of 0.2-2.0 g were spiked with ‘“‘PO and then completely dissolved in a series of acids (concentrated HF, HNO1, and HCI 1. The PO was subsequently plated from 1 .S N HCl onto silver disks. which were then placed in an alpha spectrome- ter (Flynn, 1968). The supported activity of “‘Pb was found by measuring the Z’hRa activity, either by the 2ZZRn emanation method ( Mathieu et al.. 1988) or by counting the gamma ray emissions of “‘Pb and “‘Bi (Michel et al.. 1981 ). Further details of the radionu- elide analyses are given by Stephens ( 1996)
2.3. Pigments
Pigments analyzed consisted of chlorophyll-a, an allomer of chlo- rophyll-a, pheophytin-a, chlorophyllide-a, and pheophorbide-a. Chlo- rophyll-a allomer is formed by chemical or enzymatic oxidation (allomerization) of the cyclopentenone ring of chlorophyll-a. Pheo- phytin-a (formed by removal of the central Mg from chlorophyll- a ) is produced as a result of cell lysis. prolonged exposure of cells to darkness. and herbivorous digestion (Daley. 1973; Daley and Brown, 1973: Bianchi et al., 1988). Chlorophyllide-a production (resulting from hydrolysis of the phytol group) is associated with chlorophyllase activity and cell senescence (Jeffrey, 1974). Pheoph- orbide-a ( loss of the central Mg and hydrolysis of phytol ) is appar- ently produced exclusively as a result of herbivorous digestion. Con- sequently. it has been used as an indicator of grazer activity (Loren- zen. 1967; Daley and Brown, 1973; Bianchi et al., 1988).
Analytical procedures for pigment analyses are given by Smith et al. ( 1996 ) Very briefly, pigments were extracted in IO08 acetone using the methods of Sun et al. ( 1991) and then analyzed with reverse-phase high pressure liquid chromatography using the meth- ods of Wright et al. ( 1991).
2.4. Model
Profiles of excess “‘Th and ““Pb were utilized to quantify sedi- ment mixing rates. The steady-state distribution of excess “‘Th or ““Pb within a bioturbated sediment column can be described by the following:
dAldT = D,(tl’Ali):‘) - S(tiAl&) - AA = 0 0)
where A is the activity concentration (dpm/cm’), t is time (yr). ; is depth (cm) in sediment. D,, is the bioturbation coefficient (cm?yr- ’ ). S is the sedimentation rate (cm/yr), and A is the rate constant (yr-’ I of radioactive decay (after Guinasso and Schink, 1975; Bemer, 1980). The model assumes that biohubation is analogous to diffusion and that Dh is constant in the upper sediment. Additional terms can be added to Eqn. 1 to account for nondiffusive forms of mixing (Robins, 1986; Smith et al.. 1986/87: Pope et al.. 1996).
Application of boundary conditions: A(z) = A,, at ; = 0. and A --t 0 as ; + SC. leads to the following solution to Eqn. 1:
4 = A,,exp( -(I;) (1)
where (2 -’ is the 1 /e penetration depth of radionuclide (the depth at which the concentration decrease is 1 /e), which can be determined from curve fits to the radionuclide profiles. The term a is related to Db. S. and A by the following:
ti = [S-(S’+4ADD,)“‘]lZD, (3)
Sediments of the central equatorial Pacific accumulate at a rate ( S ) on the order of 0.1-3 cm/ky (Kadko. 1983; DeMaster and Pope, 1994: Stephens, 1996; Paytan et al., 1996). The range of Db reported for the region is from <O.l to 11 cm*yr-’ (Cochran. 1985; Pope et al., 1996). Therefore, the upper limit of the bioturbation peclet number, Pe. is 0.4 (Pe = SL/Dh. where L is the depth scale of
Degradation of chlorophyll-a 4607
2s’?h (dprnkm3) 2yh (dprnkm’)
0 1 2 3 4 0 1 2 3 4
TTo13-077 &o.es
2s?h (dpmkr?) 2?h (dpm/cm3)
0 1 2 3 4 0 1 2 3 4
/
t
f t
t
50N TTol3-103
D&X37 &o.m
0.0
0.5
.g 1.0
s 1.5
N 2.0
2.5
3.0 I
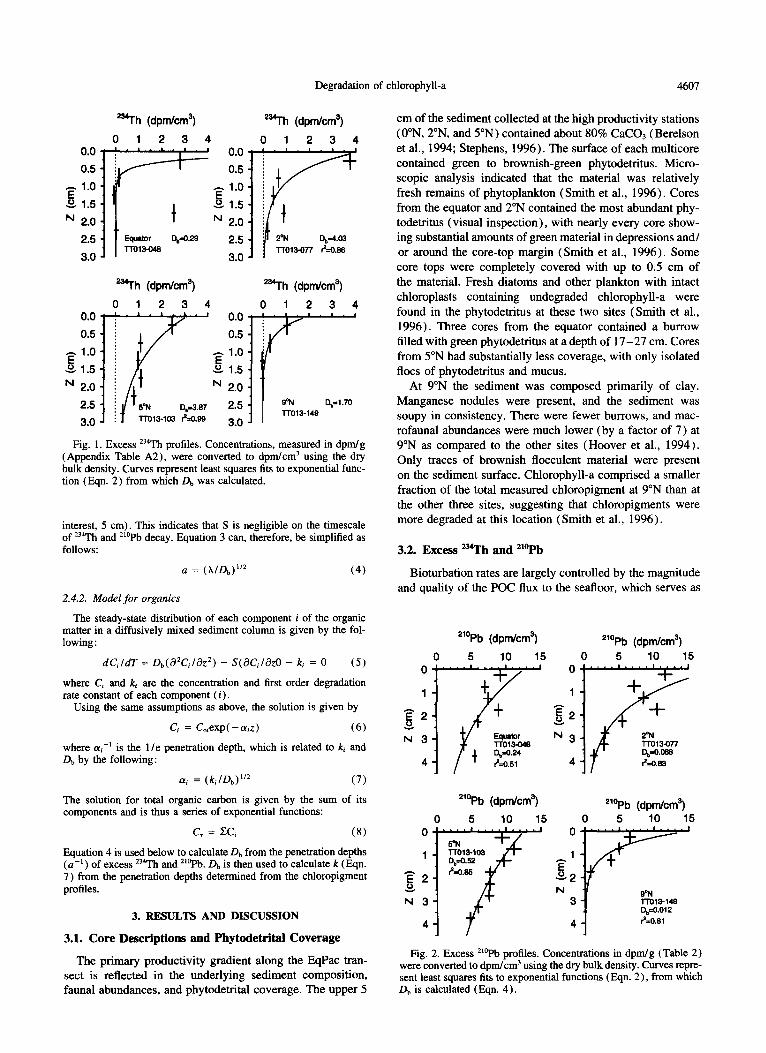
Fig. 1. Excess *34Th profiles. Concentrations, measured in dpm/g (Appendix Table A2), were converted to dpm/cm’ using the dry bulk density. Curves represent least squares fits to exponential func- tion (Eqn. 2) from which Db was calculated.
interest, 5 cm). This indicates that S is negligible on the timescale of ?‘h and 2”‘F’b decay. Equation 3 can, therefore, be simplified as follows:
a = (h/&)1’* (4)
2.4.2. Model for organics
The steady-state distribution of each component i of the organic matter in a diffusively mixed sediment column is given by the fol- lowing :
dCildT = Db(8*Ci18z2) - S(X,l&O - k, = 0 (5)
where C, and k, are the concentration and first order degradation rate constant of each component (i) .
Using the same assumptions as above, the solution is given by
C, = C,,exp( -cwiz) (6)
where (Ye-’ is the l/e penetration depth, which is related to k, and D,, by the following:
(Y{ = (k;lDb)“’ (7)
The solution for total organic carbon is given by the sum of its components and is thus a series of exponential functions:
c, = Xi (8)
Equation 4 is used below to calculate Db from the penetration depths (a -’ ) of excess ?h and *iopb. Db is then used to calculate k (Eqn. 7) from the penetration depths determined from the chloropigment profiles.
3. RESULTS AND DISCUSSION
3.1. Core Descriptions and Phytodetrital Coverage
The primary productivity gradient along the PqPac tran- sect is reflected in the underlying sediment composition, fauna1 abundances, and phytodetrital coverage. The upper 5
cm of the sediment collected at the high productivity stations (O”N, 2”N, and S’N) contained about 80% CaC03 (Berelson et al., 1994; Stephens, 1996). The surface of each multicore contained green to brownish-green phytodetritus. Micro- scopic analysis indicated that the material was relatively fresh remains of phytoplankton (Smith et al., 1996). Cores from the equator and 2”N contained the most abundant phy- todetritus (visual inspection), with nearly every core show- ing substantial amounts of green material in depressions and/ or around the core-top margin (Smith et al., 1996). Some core tops were completely covered with up to 0.5 cm of the material. Fresh diatoms and other plankton with intact chloroplasts containing undegraded chlorophyll-a were found in the phytodetritus at these two sites (Smith et al., 1996). Three cores from the equator contained a burrow filled with green phytodetritus at a depth of 17-27 cm. Cores from 5”N had substantially less coverage, with only isolated floes of phytodetritus and mucus.
At 9”N the sediment was composed primarily of clay. Manganese nodules were present, and the sediment was soupy in consistency. There were fewer burrows, and mac- rofaunal abundances were much lower (by a factor of 7) at 9”N as compared to the other sites (Hoover et al., 1994). Only traces of brownish flocculent material were present on the sediment surface. Chlorophyll-a comprised a smaller fraction of the total measured chloropigment at 9”N than at the other three sites, suggesting that chloropigments were more degraded at this location (Smith et al., 1996).
3.2. Excess u*rh and “?‘b
Bioturbation rates are largely controlled by the magnitude and quality of the POC flux to the seafloor, which serves as
“‘Pb (dpmkm’) “‘Pb (dpmkm3)
0 5 10 15 0 5 10 15
0
1
g2
N3
4
0
1
5 N3
4
I....,....,....,
I -L + ’ + !F 29rl
-t-r013-077 Dpx55 ho.33
210Pb (dpmkm’) “‘Pb (dpmkm3) 0 5 10 15 0 5 10 15
5% l-r018103 DpO.52
Ao.35 isF” 0
1 P s2 N
3
4
r [
994 l-r015143 Dpo.012 bO.31
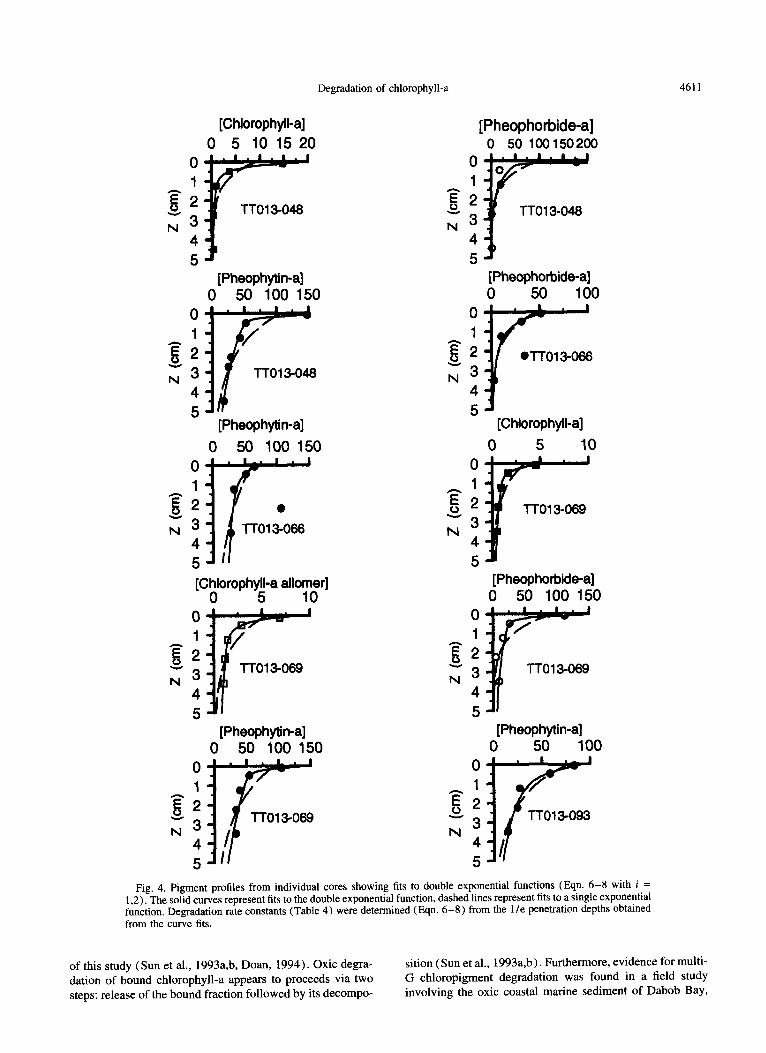
Fig. 2. Excess “%‘b profiles. Concentrations in dpm/g (Table 2) were converted to dpm/cm” using the dry bulk density. Curves repre- sent least squares fits to exponential functions (Eqn. 2)) from which D,, is calculated (Eqn. 4).

4608 M. P. Stephens et al.
Table 1. Summary of “JTh and ““Pb results.
North Lat. Core
& (cm’ yr ‘)
“‘Th ““Pb
Inventory %Non-diffusive R. Dh (dpm cm-‘) inventory (yr- 1 (cm’ yr- ‘1
TTOl3-048 ‘ITOl3-065 TT013-066 (P) TTOl3-069 TT013-070 (P) TTo13-071 (P) 0”N Mean
0.29 +
0.36 - 1.64 0.12
0.60 2 0.60
TT013-076 TTOl3-077 TT013-091 (P) TTo13-093 (P) lTOl3-098 (P) 2”N Mean
1.03 2.00 I .74 0.87
2.16 ? 1.34
TT013-103 3.87 TTo13-112 (P) 9.5 TTOl3-116 (P) 10.8 TT013-122 16.9 TT013-127 (P) 4.3 5’N Mean 9.07 -+ 5.35
TT013-143 TT013-144 (P) TT013-148 (P) T-r013-149 9”N Mean
<O.l <O.l
1.70 <0.63
2.07 i 0. I7 29 2.20 ? 0.18 1.67 -c 0.27 I9
10
2.44 -t 0.1 I 22.8 I3 1.80 +- 0.14 17.3 -I 2.04 -+ 0.31 22.0 + 5.lY 824
2.Yh k 0.31 I5 2.14 -t 0.12 16.3 2.77 i- 0.34 24.8 2.85 ” 0.15 32.6 2.68 t 0.37 22.2 ? x.2
2.94 +- 0.19 0 1.97 + 0.09 0 1.21 t- 0.09 0 3.38 -t 0.23 0 4.16 i 0.44 0 2.73 i- 1.16 0
-. 0. I7 + 0.03 19.9 0.32 i- 0.05 14.5 0.67 i 0.1.5 0 0.39 5 0.26 11.5 k 10.3
0.24
I2 IO 16 I8
-It4
0 0
0 0 0
3 7
0 2t2
0.19
0.25
0.32 0.068
0.63 0.34
0.52
0.17
ox
0.015
0.012 0.0135
Z’4Th results for cores labeled (P) are from Pope et al. ( 1996). R: were estimated from the relationships between the non-diffusive inventories. R;. and Dh given by
Pope et al. (1996; their Fig. 5). * D, were not calculated for core -065 due to large subsurface peaks.
the food source for the sedimentary macrofaunal community (Smith, 1992). Db values were calculated from excess ‘j“Th and *‘?b data profiles (Fig. 1 and 2, Tables 1 and A2 in Appendix). The sediment at the EqPac sites, which had substantial inputs of phytodetritus (Smith et al., 1996), and macrofaunal abundances that were among the largest mea- sured in the abyssal ocean (Hoover et al.. 1994), had ‘j’Th bioturbation rates ( Db = <O. l- 16.9 cm’/yrr’, Table I ) that were similar to those found at some hemipelagic sites but lower than at some coastal sites. For example. the mean *?‘h Db value found at the HEBBLE site (Nova Scotian continental rise) was 13 cm’yr-’ (DeMaster et al., 19851, and a mean of 30 cm’yr-’ was obtained from cores taken from the Panama Basin and the northwest Atlantic continen- tal rise (Aller and DeMaster, 1984). Bioturbation rates for coastal sites in Long Island Sound ( 14 m) ranged from 37.8 to 110 cm’yr --’ (Aller and Cochran. 1976).
The distribution of 234Th Db values and inventories along the EqPac transect reflected the pattern of recent POC flux (for the period 100 days prior to core collection, Pope et al.. 1996). POC flux and Db values were both greatest at S’N and least at 9”N (fluxes from Honjo et al., 1995). The mean Db value for 5”N (9.07 cm’yrr’) was more than an order of magnitude greater than that at 0”N and 9”N (mean Db values of 0.60 and <0.63 cm*yr _I, respectively, Table 1) and ap- proximately a factor of four greater than that at 2”N ( 2.16
cm’yr -’ ). The inventory of excess “‘Th followed a pattern similar to Db between sites but with a smaller range of values. The higher productivity sites all had greater inventories than the 9”N site (Table 1 )
The bioturbation rates based on excess ““Pb profiles ( Fig. 2. Table 1 ) were up to 2 orders of magnitude less than those based on ‘34Th but comparable to those found in other investigations involving “‘Pb in deep-sea sediment (see Smith et al., 1993 for compilation). Smith et al. ( 1993 ), noting similar disparity between 23JTh and ““Pb mixing rates at several ocean areas, hypothesized that this discrepancy reflects age-dependent mixing. whereby ‘j4Th is associated with more recently deposited material, which is ingested and mixed faster by deposit feeders because it is a better food source.
Subsurface peaks (or spikes), which were common in the radionuclide profiles from the 0”N and 2”N sites (Figs. 1 and 2)) suggest that nondiffusive mixing processes affected the distributions of excess ‘34Th and “‘Pb (these peaks were not included when we determined the diffusive mixing rates from the “‘Th profiles). The nondiffusive mixing rate can be assessed by consideration of the fraction of the excess jj4Th inventory that was present in the subsurface peaks and a model in which ?lr is removed from the surface and redeposited within the sediment (i.e., it is nondiffusively exchanged among depths; Pope et al.. 1996). For a single

Degradation of chlorophyll-a 4609
Table 2. Results of one-component chloropigment model for mean pigment profiles.
Full-profile fits Fits to upper 1.5 cm
Site (Y-’ r= k tm a-’ r= k tm
Chlorophyll-a
0”N 1.2 0.67 0.39 1.8 0.45 0.9 2.9 0.24 2”N 0.48 0.87 9.5 0.07 0.23 0.99 39 0.02 5”N 0.65 0.92 22 0.03 0.35 0.99 75 0.01 9”N 1.5 0.10 0.27 2.6 0.20 0.97 16 0.04
Chlorophyll-a allomer
0”N 1.1 0.15 0.50 1.4 0.55 0.96 2.0 0.34 2”N 0.48 0.28 9.3 0.07 0.27 0.97 29 0.02 5”N 1.0 0.10 8.4 0.08 0.38 0.99 64 0.01 9”N _ _ _ _ _ _ _ _
Pheophorbide-a
0”N 0.97 0.80 0.63 1.1 0.51 0.89 2.3 0.31 2”N 0.64 0.79 5.2 0.13 0.35 0.90 18 0.04 5”N 0.87 0.74 12 0.06 0.43 0.83 50 0.01 9”N 0.70 0.24 1.3 0.54 0.35 0.91 5.2 0.13
Pheophytin-a
O”N 2.3 0.61 0.11 6.3 1.0 0.92 0.60 1.2 2”N 1.1 0.56 1.7 0.40 0.59 0.92 6.2 0.11 5”N 1.9 0.38 2.5 0.28 1.1 0.93 7.7 0.09 9”N 1.5 0.74 0.28 2.4 0.76 0.98 1.1 0.64
Units: cy-l (cm). k (yr-‘), tl/Z (yr).
peak, the rate of nondiffusive removal from the surface sedi- ment (and redeposition at depth z) is equal to R,*A( 1). where R, is the nondiffusive removal (or exchange) rate constant (yr-‘) and A( 1) is the activity of excess 23?h in the surface sediment. Cores from 0”N and Z”N, and 9”N had similar nondiffusive inventories (Table 1) , with somewhat greater rates at 0”N and 2”N as compared with 9”N. There were no subsurface peaks, and hence no evidence of nondif- fusive mixing, in the 234Th profiles from S’N (Table 1, Fig. 1, and Pope et al., 1996).
3.3. Pigments
3.3.1. First-order degradation rate constants: The single-G model
First-order single-G model degradation rate constants and half-lives for each chloropigment were calculated from curve fits to the mean concentration profiles from each site (Table 2; profiles for 0”N only are shown in Fig. 3). The chloropig- ment l/e penetration depths ((u-l) ranged from 0.48 cm to 2.3 cm (Table 2). Application of the model (Eqn. 7) using these values for cy, and the 234Th-based bioturbation rates gave chloropigment degradation half-lives of from 11 days to 6.3 yr, a range of over 2 orders of magnitude (Table 2).
The results from previous studies of chloropigment and phytoplankton degradation can be used to assess the validity of our results and compare findings from different environ- ments. The range of rate constants found in the earlier studies
(Table 3, using the more labile component where a multi- G model was applied, but excluding the release rate given by Sun et al., 1993a) was about 1 order of magnitude, and the half-lives ranged from 5 to 46 days (0.014-0.13 y). Additionally, the temperature dependence of chlorophyll-a degradation was examined by Sun et al. (1993a) who found a fourfold decrease in k over a 20°C decrease in temperature (half-life of 30.7 days at 5°C). Since bottom water tempera- tures above equatorial Pacific sediments are 2”C, rate con- stants at the low end of the range shown in Table 3 may he expected for chloropigments and the most reactive organic matter in EqPac sediments. The results obtained in a study using porewater oxygen profiles from the same PqPac sites as in the present study confirm that a fraction of the sedimen- tary organic matter degrades with rate constants of that order. For example, the penetration depths for the most labile or- ganic carbon fraction obtained from the porewater study were 0.4 2 0.1 cm, and the degradation half-lives were 12- 28 days (Hammond et al., 1996, Table 3).
The chloropigment degradation rate constants obtained from the full-profile fits to the data from the 2”N and 5”N sites (Table 2) are in good agreement with those given by the other studies (Table 3)) but lower k values were obtained from the sites at 0”N and 9”N. The slow rate constants at 0”N are troubling because there was evidence for the presence of very reactive organic carbon in the sediment at 0”N (pore- water results of Hammond et al., 1996)) and there was abun- dant oxygen, bacteria, and macrofauna within the sediment (Dobbs and Selph, 1994; Smith et al., 1994; Hoover, 1995). In contrast, porewater profiles from the 9”N site yielded no evidence of the very reactive organic matter (Hammond et al., 1996), and the macrofaunal and bacterial abundances
[Chlorophyll-a] [Chlorophyll-a allomer]
0 3 6 9 12 15 0 2 4 6 6 0 0
1 1
F2 F2 S 3 Y 3 N N
[Phaophorbide-a] [Phaophytin-a]
0 50 100 150 200 0 50 100 150 200
Fig. 3. Mean chloropigment profiles (ng/cm’) for the 0”N site. Concentrations measured in rig/g (Table A3) were converted to ngl cm3 by using the dry bulk densities. Dashed lines represent least- squares curve fits to full profiles for a single exponential function. Solid lines are fits to upper 1.5 cm data only.

4610 M. P. Stephens et al.
Table 3. Degradation rate constants of phytoplankton, chloropigments. and organic matter in oxic marine environments. Two rate constants are given where multi-G degradation was detected.
Component Location/medium/duration k (yr-‘)
1. Fresh plankton
2. Chlorophyll-a
3. Chlorophyll-a
Diatoms
4. Pheophorbide-a & Total Pheopig. 5. Organic matter
Laboratory/seawater (20-22”C)/2 years k, = 24 2 4 0.025-0.035 kL = 1.4 ? 0.7 0.33-0.99
Laboratory/Sediment (5-25”C)/-30 days k, = 219-1460 o.o005-0.003 k,j = 7.3-30.7 0.023-0.095
Laboratory/Sediment (22”C)/80 days k, = 32.8-51.1 0.014-0.021 kr < 1.10 >0.63 k, = 23.7-33.6 0.021-0.029 kz = 0.69-1.39 0.50- 1.0
Dabob Bay, WA/Sediment ( 184 m)/solid-phase profiles k = 5.5-6.31 0.11-0.13 Eq. Pacific/Sediment pore water Oz profiles k, = 14.9 2 5.8 0.033-0.076
kz = 0.013 -i- 0.002 46.2-63.0
rlt2 Or)
References and notes: 1. Westrich and Berner, 1984. 2. Sun et al., 1993a. k, is for release of bound chlorophyll-a, kd is for degradation of free chlorophyll-a. 3. Doan, 1994. 4. Furlong and Carpenter, 1988. k might be underestimated because Db is based based on “‘Pb profiles. Low concentrations of chlorophyll-a persisted to a depth corresponding to - 1000 years of deposition. 5. Hammond et al., 1996. k, is based OII 224Th Dh. k2 on 210Pb Dh
were lower than at the other sites (Dobbs and Selph, 1994:
Smith et al., 1994). Derivation of k at 9”N was complicated by choice of an appropriate D,,. The k values listed in Table 2 were obtained using a Db of 0.63 cm’/yr (the mean from three 23?h profiles), but two of the three profiles had much lower Dh values (<O.l cm*/yr; Pope et al., 1996). Thus, considerably smaller k values were possible at 9”N.
Chlorophyll-a has been found to be more reactive than pheophytin-a (Sun et al., 1993b). Our results suggest similar relative reactivities for chloropigments within EqPac sedi- ment. For example, chlorophyll-a rate constants from O”N, 2”N, and S’N were at least a factor of three greater than those for pheophytin-a.
Many of the chloropigment profiles used in this study exhibit a change in gradient between the upper 0.5 cm (sharp gradient) and below, with nonzero chloropigment concentra- tions persisting downcore. This suggests that the use of a single first-order rate constant is an oversimplification. The full-profile curve fits generally underestimate the gradient near the surface and overestimate it downcore (Fig. 3). Curve fits to only the upper 1.5 cm yield k values that are greater, by a factor of three to over an order of magni- tude, than those based on the full-profile fits (Fig. 3 and Table 2 )
There are several possible explanations for the apparent decreases in k values downcore that can be explored using data from the 0”N site. First, multi-G degradation, which was suggested for chloropigments by the results of labora- tory studies (Table 3), could result if a fraction of the chlo- ropigments were less reactive or protected from degradation. Second, other factors may affect the degradation rates (such as variations in the concentration of oxygen and other metab- olites, bacterial numbers and activity, macrofaunal abun- dance, and mixing rates ) . The effects of nondiffusive mixing implied by the 234Th results and the assumption of steady- state are also examined below.
3.3.2. Multicomponent degradation
Application of the diffusive-mixing model for two-com- ponent multi-G degradation involves curve fitting the pig-
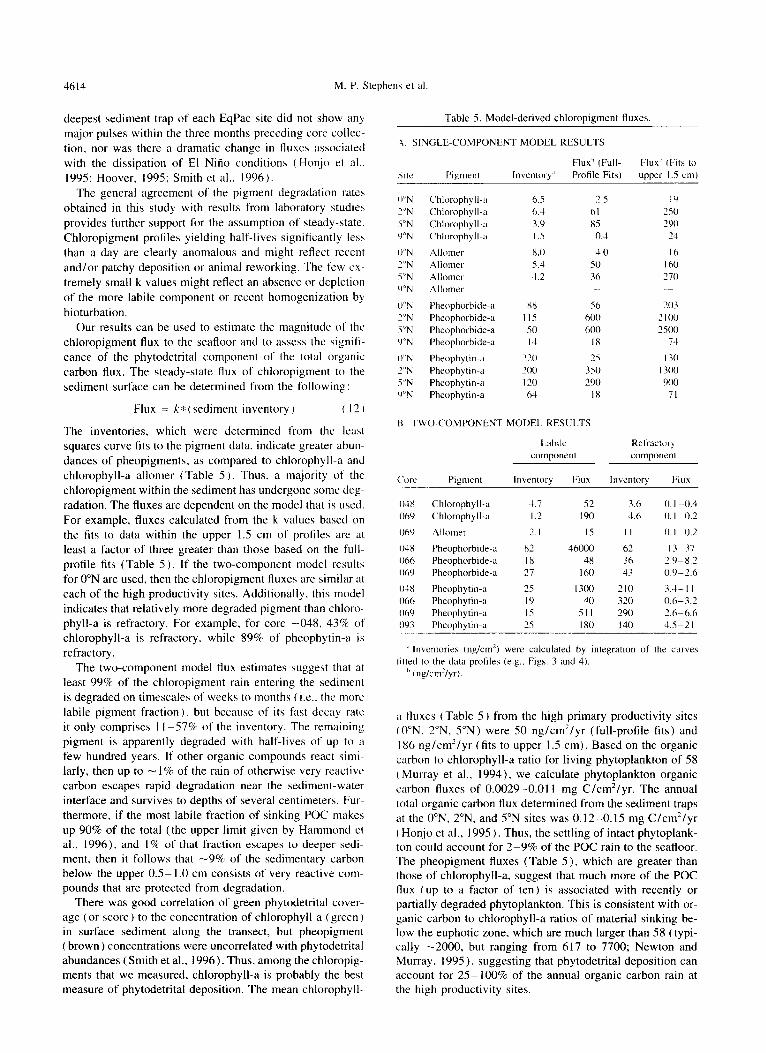
ment data with a double exponential function (Eqn. 6 with i = 1.2 ) in order to determine the penetration depths of each component (e.g., Hammond et al., 1996). Only those profiles that are free of subsurface peaks or from which the effects of nondiffusive mixing can be removed (i.e., peak in core -066) are suitable for this method. Thus there are a total of ten profiles (Fig. 4, Table 4) to which the multi-G model was directly applied.
The improvement in fitting the data by using the two- component equation as opposed to one-component (Fig. 4) varies from only slight for cores with more gentle gradients near the surface (e.g., pheophorbide-a in core -066) to very significant for profiles with more severe near-surface gradi- ents (e.g. core -048). The appropriateness of applying the two-component multi-G model can be assessed by using the F-test to evaluate the statistical significance of the improve- ment in fitting the data to a double exponential function as opposed to the single exponent (Anderson, 1987). Accord- ingly, five of the ten profiles (Table 4) were significantly better fit by the double exponential functions.
The penetration depths obtained using the dual exponen- tial function were 0.03-0.53 cm for the more labile compo- nent and 1.6- 12 cm for the more refractory component ( Ta- ble 4 ) . These penetration depths yielded degradation half- lives of 0.4 days to 0.33 years for the more labile component (based on the 234Th Db values) and I-440 y for the more refractory component (based on both the *?h and “‘Pb values). A majority of the rate constants for the more labile component are in good agreement with those from the other studies (Table 3).
Multicomponent degradation of individual chloropig- ments suggests that a fraction of each compound is protected from reaction. It has been established that organic com- pounds are adsorbed by minerals and organic matrices, which leads to protection of labile material within marine sediments (Hedges and Hare, 1987; Cowie and Hedges, 1992; Keil et al., 1994; Mayer, 1994a,b). Laboratory studies have shown that sedimentary chlorophyll-a degradation pro- ceeds according to multi-G kinetics, with k values for the more refractory component in general agreement with those
Degradation of chlorophyll-a 4611
[Chlorophyll-a] [Pheophotbide-a] 0 5 10 15 20 0 50 100150200
[Pheophytin-a] 0 50 100 150
[Pheophorbide-a] 0 50 100
[Pheophytin-a]
0 50 100 150 r 0
TTO15066
I
[Cproph$-a ally11
0
a: G3
4 5
[Pheophytin-a] [Pheophytin-a] 0 50 100 150 0 50 100
0
a: G3 l-f++ TTOl3-069
4 I 5'
[Chlorophyll-a]
[Pheophorbide-a] 0 50 100 150 / II+=- l-To13469
Fig. 4. Pigment profiles from individual cores showing fits to double exponential functions (Eqn. 6-8 with i = 1.2). The solid curves represent fits to the double exponential function, dashed lines represent fits to a single exponential function. Degradation rate constants (Table 4) were determined (Eqn. 6-8) from the 1 le penetration depths obtained from the curve fits.
of this study (Sun et al., 1993a,b, Doan, 1994). Oxic degra- dation of bound chlorophyll-a appears to proceeds via two steps: release of the bound fraction followed by its decompo-
sition (Sun et al., 1993a,b). Furthermore, evidence for multi- G chloropigment degradation was found in a field study involving the oxic coastal marine sediment of Dabob Bay,

4612 M. P. Stephens et al.
Table 4. Results of single and two-comnonent models for individual profiles
Two component model” One component model
(Labile Fraction) (More Refractory Fraction) Core o( ’ ).? x fl/T u ( x III2 u ’ !i fl/L rJ F testh
048 0.90 0.74 0.74 0.94 0.73 069 I.4 0.77 0.31 2.2 0.72
069 1.s 0.79 0.27 2.6 0.28
048 0.82 0.63 0.90 0.77 0.03 066 I.1 0.78 0.49 I.3 0.48 069 0.92 0.96 0.72 0.96 0.1 I
048 1.9 0.71 0.16 4.4 ().I I 066 3.4 0.7 I 0.05 1.3 o.s3 069 2.3 0.96 1.3 0.52 0.13 093 I.9 0.92 0.63 I.1 0.47
Chlorophyll-a
I I O.Oh 2.3 12 0.06 3.5
Chlorophyll-a-allomer
7.4 0.093 6.2
Pheophorbide-a
560 0.00 I I .o 2.6 0.26 I .6 6.0 0.1 I 3.1
Pheophytin-a
51 0.01 3.7 2.1 0.32 I I.7
35 0.07 5.0 7.3 0.09 3.2
0.04-0.12 5.8-17 0.99 0.0 17-0.048 14-40 0.99
0.006-0.016
0.2 l-0.59 1.2-3.3 0.98 Y 0.08-0.23 3.1-8.5 0.99 N 0.02-0.06 12-31 0.99 N
0.016-0.05 15-44 0.99 Y 0.002-0.01 I IS-440 0.98 N 0.009-0.023 31-81 0.99 N 0.032-o. 15 4.6-22 0.98 N
-14- 120 0.99
Y
Units: (Y ’ (cm), k (yr ‘). I,,~ (yr). Inventory (ngkm’). Flux (ng/cm’/yr). * The range for the more refractory fraction (two camp. model) represents values calculated using “‘Th and ““Pb mixing rates, h Those profiles better fit by the two-component model, as determined from the F-test, are indicated by Y. Profiles and fits with insufticient
degrees of freedom were tested assuming that the more-refractory component does not degrade (i.e.. kz = 0): this does not significantly alter the two-component fits.
Washington (Furlong and Carpenter, 1988 ). Although pheo- oxygen concentration can not explain a decrease in k by pigment degradation half-lives of -40 days were obtained I -3 orders of magnitude downcore. Oxic and anoxic decay from data within the upper sediment. low concentrations rates for chlorophyll-a are similar (Sun et al., 1993a). persisted to a depth corresponding to - 1000 yr of sedimenta- so such a dependence on the oxygen concentration seems tion. unlikely.
3.33. Higher-order dependent degrudution
An additional cause for the degradation rate constant to decrease with depth is that the degradation rate is dependent on other factors in addition to the pigment concentration. Uncertainties associated with the effects of the oxygen con- centration, microbial and macrofaunal abundances, and sedi- ment mixing on chloropigment degradation are difficult to assess. While the effects cannot be precisely quantified, here we discuss their possible importance.
There were sharp gradients in the porewater oxygen con- centration profiles. but there was sufficient OZ throughout the upper 5 cm of sediment for organic matter remineral- ization. At the equator and 2”N the oxygen concentration was 17 1 - 175 PM at the sediment-water interface and de- creased to -5.5 PM at 4 cm depth (Hammond et al., 1996). This decrease should have an insignificant effect on sedi- mentary POC remineralization (Rabouille and Gaillard, 1991) Although chloropigments may degrade largely to colorless compounds rather than through remineralization (Sun et al., 1993b), the amount of available oxygen within the upper five centimeters of sediment should not limit this process either. Barring a high-order dependence. the
Bacterial biomass also decreased about threefold over the upper 4 cm in the sediment at the EqPac sites (Dobbs and Selph. 1994). Smith et al. ( 1992) suggest that organic matter degradation could be modeled more accurately by including the abundance of bacteria in diagenetic models. In a pseudo- G model, which couples bacterial activity with carbon remin- eralization, the degradation of otherwise more refractory or- ganic matter can be enhanced by the higher metabolic activ- ity that occurs in the presence of other more labile carbon ( Canfield, 1994). This would suggest that chloropigment degradation could be enhanced in the presence of other very labile material, such as is found near the sediment-water interface.
Macrofauna were also more concentrated at the surface, and bioturbation rates are likely higher there as well (Smith et al.. 1994). However, for mixing rates of O-6 cm’/yr. bioturbation did not have a significant effect on the degrada- tion rate of chlorophyll-a or diatom detritus in laboratory experiments (Doan, 1994). However, chloropigment degra- dation can be mediated by animal ingestion, which was not accounted for in the mechanically mixed laboratory studies. Another factor, which we are unable to assess with our data, is the availability of the enzymes involved in chloropigment degradation.

Degradation of chlorophyll-a 4613
[Pigment] 0 20 40 60 60 100
Fig. 5. Model-generated pigment profiles indicating the depen- dence of subsurface peak inventory on k. The model of Pope et al. ( 1996) was used (see text for explanation and parameters). Concen- trations are scaled to 100 at maximum.
3.3.4. The inJluence of nondifisive mixing on the chloropigment projiles
While the diffusive mixing rate found for the equatorial site ( Db = 0.6 cm’/yr) cannot account for a significant flux of excess 234Th to depths deeper than l-l.5 cm, between 1 I 6 and l/3 of the excess 23m inventory in cores from the equator appears to have been transported to depths of l-4 cm by nondiffusive processes (Pope et al., 1996; and Table 1 of this study). Pope et al. ( 1996) showed that for a given Db and k value (or A) there is a positive relationship between R, and the fraction of inventory displaced by nondiffusive mixing. Conversely, for a given Db and R, there is a negative relationship between k and the nondiffusive inventory. In this section the model described by Pope et al. (1996; also briefly described above) is applied to examine the possible effects of nondiffusive mixing on the pigment profiles. Spe- cifically, we examine whether the persistence of nearly con- stant nonzero chloropigment concentrations downcore in some profiles can be attributed to nondiffusive mixing, or if a more refractory chloropigment component (i.e., the multi- G model) is necessary to produce these features.
Model-derived profiles for pigments with different k (sin- gle-component degradation) but subject to equal Db and R, were generated (Fig. 5). The degradation rate constants were chosen to span the range found in this study and the other studies discussed above (Tables 2-4). To generate the pro- files, the sediment was divided into 0.1 cm intervals, with the concentrations in each calculated based on the model of Pope et al. ( 1996). Nondiffusive mixing transfers pigment from the 0.0-0.1 cm interval (j = 1) to the 2.4-2.5 cm interval (j = 25) according to the exchange rate constant, R,, of 8 yr-’ (the mean found from excess 23?h profiles at the equator, Table 1) . The diffusive mixing rate ( Db) applied was 0.60 cm2/yr (also the equatorial mean). The model was run to steady-state.
The concentration in the top interval ( j = 1) is governed by the following:
Ac( 1) = {I + D,[C(2) - C(l)]/
2= - kc(l) - R,C(l)] At (9)
where C(j) is the concentration in the j interval, and I is the pigment rain rate.
The concentration in the 2.4-2.5 cm interval (j = 25) is governed by the following:
AC(25) = { Db[C(24) - 2C(25) + C(26)]/
Z2 - kC(25) + R,C( 1)) At (10)
Concentrations in the remaining intervals are governed by the following :
AC(j) = {DJC(j - 1) + 2C(j) - C(j + l)]/
Z2 - kc(j)} At (11)
In this single-component model, for k = 100 yr-’ (t = 3 days, the maximum k found in this study was 75 yr-‘) only about 2% of the inventory has been transported by nondiffu- sive mixing and lies deeper than 1 cm (Fig. 5). For k = 10 yr-’ (t = 25 days), 20-25% of the pigment is deeper than 1 cm. For k = 1 yr-’ (t = 253 days), a majority of the pigment is deeper than 1 cm, and pigment penetration to depths greater than 5 cm occurs.
Thus, if chloropigments in equatorial Pacific sediments degrade with rate constants derived from laboratory studies (Table 3), and from curve fits to the upper l- 1.5 cm of the equatorial data profiles (Table 2), then only up to -30% of the chloropigment inventories should lie below 1 cm. However, in eight out of ten of the profiles considered in Fig. 4, from 38% to 70% of the pigment inventory is at depths greater than 1 cm (the exceptions were chlorophyll- a and pheophorbide-a from core -048). This indicates that a smaller rate constant than those from the laboratory studies and the fits to the upper 1.5 cm portions of individual profiles is required for a fraction of the chloropigments, which sup- ports the evidence for the existence of two-component multi- G degradation kinetics.
3.3.5. Steady-state fluxes
The sediment profiles are snapshots of the pigment distri- butions. Since neither chloropigment nor phytodetrital fluxes were measured from the JGOFS deep sediment traps, we cannot explicitly demonstrate that the profiles represent steady-state distributions. In other regions, such as the north- east Atlantic, phytodetritus is deposited as a seasonal pulse associated with phytoplankton blooms (Billett et al., 1983; Lampitt, 1985). Seasonal productivity fluctuations at the equatorial Pacific are less pronounced, but it is possible that the resurgence of cold upwelling and tropical instability waves in July 1992 following the dissipation of El Niflo could have led to enhanced or pulse-like phytodetrital depo- sition (Smith et al., 1996).
If chloropigments degrade with half-lives of a few days to one month, then steady-state profiles would be established within only a few weeks or months. Several lines of evidence suggest that the fluxes persisted for at least 2-3 months prior to core collection. For example, biogenic fluxes at the
4614 M. P. Stephens et al
deepest sediment trap of each EqPac site did not show any major pulses within the three months preceding core collec- tion, nor was there a dramatic change in fluxes associated with the dissipation of El NiiIo conditions (Honjo et al.. 1995: Hoover. 1995; Smith et al.. 1996).
The general agreement of the pigment degradation rates obtained in this study with results from laboratory studies provides further support for the assumption of steady-state. Chloropigment profiles yielding half-lives significantly less than a day are clearly anomalous and might reflect recent and/or patchy deposition or animal reworking. The few ex- tremely small k values might reflect an absence or depletion of the more labile component or recent homogenization by bioturbation.
Our results can be used to estimate the magnitude of the chloropigment flux to the seafloor and to assess the signili- cance of the phytodetrital component of the total organic carbon flux. The steady-state flux of chloropigment to the sediment surface can be determined from the following:
Flux = k+( sediment inventory ) (12,
The inventories, which were determined from the lcast squares curve fits to the pigment data. indicate greater abun- dances of pheopigments. as compared to chlorophyll-a and chlorophyll-a allomer (Table 5 ). Thus. a majority of the chloropigment within the sediment has undergone some deg- radation. The fluxes are dependent on the model that is used. For example, fluxes calculated from the k values based on the fits to data within the upper 1.5 cm of profiles are at least a factor of three greater than those based on the full- profile fits (Table 5 ). If the two-component model results for 0”N are used, then the chloropigment fluxes are similar at each of the high productivity sites. Additionally, this model indicates that relatively more degraded pigment than chloro- phyll-a is refractory. For example, for core --04X, 43% ot chlorophyll-a is refractory. while 89% of pheophytin-a is refractory.
The two-component model flux estimates suggest that at least 99% of the chloropigment rain entering the sediment is degraded on timescales of weeks to months ( i.e.. the more labile pigment fraction ). but because of its fast decay rate it only comprises I I-57% of the inventory. The remaining pigment is apparently degraded with half-lives of up to a few hundred years. If other organic compounds react simi- larly, then up to - 1% of the rain of otherwise very reactive carbon escapes rapid degradation near the sediment-water interface and survives to depths of several centimeters. Fur- thermore. if the most labile fraction of sinking POC makes up 90% of the total (the upper limit given by Hammond et al.. 1996), and I% of that fraction escapes to deeper sedi- ment. then it follows that -9% of the sedimentary carbon below the upper O.S- I .O cm consists of very reactive com- pounds that are protected from degradation.
There was good correlation of green phytodetrital cover- age (or score ) to the concentration of chlorophyll-a (green ) in surface sediment along the transect, but pheopigment (brown) concentrations were uncorrelated with phytodetrital abundances (Smith et al.. 1996). Thus, among the chloropig- ments that we measured. chlorophyll-a is probably the best measure of phytodetrital deposition. The mean chlorophyll-
Table 5. Model-derived chloropigment fluxes.
,A. SINGLE-COMPONENT MODEL RESULTS
SllC
tl”N
7”N
5”N
Y”N
O’N
7”N
S ‘N
c,‘N
0’ N
7”N
5”N
‘)‘N
O’N
2”N
S”N
Y”N
Fluxh (Full- Fluxh IFIt& to
Pigment Inventory” Profile Fits) upper I.5 cm)
Chlorophyll-;I 6.5 2.5 IY
Chlorophyll-a 6.4 61 7.50
Chlorophyll-a 3.Y 85 290
Chlorophyll-a I .s 0.4 24
Allomrr 8.0 4.0 I6
.4llomel 5.1 so I 60
Allome~ 1.2 36 270
Allomer
Pheophorbide-a xx 56 303
Pheophorbide-a I IS Is00 2 IO0
Pheophorbide-a SD 600 1SOO
Pheophorbide-a IA IX 71
Pheophytin-a 710 2s I30
Pheophytin-a 200 350 1300
Pheophytin-a I 10 200 900 Pheophytin-a 64 IX 71
N. TWO-COMPONENT MODEL RESULTS
Labile Ret’ractorq
component component
C‘orc Pigment Inventory Flux Inventory Flux
0-w Chlorophyll-u 1.7 52 3.6 0. I-O.4
069 Chlorophyll-a 1.2 190 4.6 0. I a.2
069 Allomr1 2.1 IS II 0. I -0.2
04x Pheophorbide-a x2 46000 62 13-37
06h Pheophorbide-a IX 48 36 ‘.9%8.2
Oh’) Pheophorbide-a 27 I60 43 0.9-2.6
01x Pheophytin-n ‘5 I300 210 3.G I I
066 Pheophytin-n 19 40 320 0.6-3.2
06’) Pheophytin-a IS Sll 190 2.6-6.6
093 Pheophytin-a 2.5 I x0 I40 1.5-21
Inventories (nglcm”) were calculated by integration of the curves
litted to the data protiles (e.g.. Figs. 3 and 4).
” tnglcm’lyr).
a fuxes (Table 5 ) from the high primary productivity sites tO”N. 2”N, YN) were 50 ng/cm2/yr (full-profile fits) and I86 ng/cm”/yr (fits to upper I .5 cm). Based on the organic carbon to chlorophyll-a ratio for living phytoplankton of 58 ( Murray et al.. 1994), we calculate phytoplankton organic carbon fluxes of 0.0029-0.01 I mg C/cm*/yr. The annual total organic carbon flux determined from the sediment traps at the 0”N. 2”N. and S’N sites was 0.12-0.15 mg C/cm”/yr ( Honjo et al., 1995 ). Thus, the settling of intact phytoplank- ton could account for 2-9% of the POC rain to the seafloor. The pheopigment fluxes (Table 5), which are greater than those of chlorophyll-a, suggest that much more of the POC flux (up to a factor of ten) is associated with recently or partially degraded phytoplankton. This is consistent with or- ganic carbon to chlorophyll-a ratios of material sinking be- low the euphotic zone. which are much larger than 58 (typi- cally -2000, but ranging from 617 to 7700; Newton and Murray, 1995). suggesting that phytodetrital deposition can account for 25- 100% of the annual organic carbon rain at the high productivity sites.

Degradation of chlorophyll-a 4615
4. CONCLUSIONS
A single-component diffusive-mixing model was applied to chloropigment profiles from four sites in the central equa- torial Pacific. The degradation rate constants for chlorophyll- a were generally greater and those for pheophytin-a lower than those of the other pigments included in this study. The rate constants obtained from curve fits to the full pigment profiles at 2”N and 5”N (k = 1.7-22 yr-‘) were in good agreement with results from laboratory and other field stud- ies, but those calculated using the data from 0”N and 9”N were lower (k = 0.1 l- 1.3 yr -’ ), because of the slower sediment mixing rates (&) used and the persistence of nearly-constant nonzero concentrations downcore. Rate con- stants obtained from fits to the upper 1.5 cm at 0”N and 9”N (k = 0.6-16 yr-‘) were in better agreement with the other sites and studies.
Differences in chloropigment concentration gradients be- tween the upper 1.5 cm (sharp gradient) and below in many of the profiles suggests that the material degrades rapidly near the sediment-water interface but much more slowly below. This suggests that chloropigments degrade according to multi-G kinetics, although uncertainties regarding the ef- fects of the depth gradients of bacterial and macrofaunal abundances and oxygen concentration on pigment degrada- tion warrant further investigation. Five out of ten profiles analyzed for multi-G chloropigment degradation were sig- nificantly better fit by a two-component multi-G model as opposed to the single-component model. The rate constants for the more labile component, which accounts for at least 99% of the POC flux and l l-57% of the inventory, are k = 2.6-5 1 yr -’ (ignoring one anomalously high value). The more refractory component had rate constants of 0.002-0.59 yr-‘. This suggests that up to 10% of the organic matter at depths below 0.5 - 1 .O cm within the sediment might consist of very reactive material that is protected from degradation.
The correlation of chlorophyll-a concentration with phyto- detrital coverage (Smith et al., 1996) suggests that chlo- ropigments can be utilized as tracers of the labile phytoplank- ton detritus reaching the seafloor. Based on the model-calcu- lated chlorophyll-a flux, sediment trap POC flux (Honjo et al., 1995 ) , and organic carbon to chlorophyll-a ratio of living phytoplankton, 2-9% of the POC flux to the seafloor could be due to the fall of nearly-intact phytoplankton. However, because pheopigment fluxes are much larger than chloro- phyll-a fluxes, 25- 100% of the annual POC flux to the seafloor may be associated with phytodetritus.
Acknowledgments-We are grateful to Shawn Doan, who obtained and made available some of the pigment data used in this study. We thank the captain and crew of the R.V. Thompson, the JGOFS EqPac benthic leg scientific party, and Margaret Leinen who served as chief scientist. Burton Dixon provided laboratory assistance. This work was supported by National Science Foundation grants OCE-9024378 to D. Kadko, OCE-9022116 to C. Smith, and OCE-9022321 to Rob- ert Bidigare who provided HPLC facilities. This is contribution 382 from the US JGOFS program.
REFERENCES
Aller R. C. and Co&ran J. K. (1976) *3?h/238U disequilibrium in near-shore sediment: Particle reworking and diagenetic time scales. Earth Planet. Sci. Lett. 29, 37-50.
Aller R. C. and DeMaster D. J. (1984) Estimates of particle flux and reworking at the deep-sea floor using 23?h/238U disequilib- rium. Earth Planet. Sci. Letr. 67,308-318.
Anderson R. L. ( 1987) Practical Statistics for Analytical Chemists. Van Nostrand Reinhold Co.
Bamett P. R. 0.. Watson J., and Connelly D. (1984) A multiple corer for taking virtually undisturbed samples from the shelf, bat- hyal, and abyssal sediments. Ocean. Acta 7,399-408.
Berelson W. M., Hammond D. E., McManus J., and Kilgore T. E. (1994) Dissolution kinetics of calcium carbonate in equatorial Pacific sediments. Global Biogeochem. Cycles 8,219-235.
Bemer R. A. (1980) Early Diagenesis: A Theoretical Approach. Princeton Univ. Press.
Bemer R. A. (1982) Burial of organic carbon and pyrite in the modem ocean: Its geochemical and environmental significance. Amer. J. Sci. 282, 451-473.
Bhat S. G., Krishnaswamy S., Lal D., Rama, and Moore W. S. (1969) ?~-I/~~*U ratios in the ocean. Earth Planet. Sci. Lett. 5, 483-491.
Bianchi T. S., Dawson R., and Sawangwong P. (1988) The effects of macrobenthic deposit-feeding on the degradation of chloropig- ments in sandy sediments. J. Exper. Mar. Biol. Ecol. 122, 243- 255.
Billett D. S. M., Lampitt R. S., Rice A. L., and Mantoura R. F. C. (1983) Seasonal sedimentation of phytoplankton to the deep-sea benthos. Nature 302,520-522.
Canfield D. E. (1994) Factors influencing organic carbon preserva- tion in marine sediments. Chem. Geol.114, 315-329.
Chavez F. P. and Barber R. T. ( 1987) An estimate of new production in the equatorial Pacific. Deep-Sea Res. 34, 1129-1243.
Co&ran J. K. (1985) Particle mixing rates in sediments of the east- em equatorial Pacific: Evidence from “?b, 23’.% and 13’Cs distributions at MANOP sites. Geochim. Cosmochim. Acta 49, 1195-1210.
Cowie G. L. and Hedges J. I. (1992) Sources and reactivities of amino acids in coastal marine environment. Limnol. Ocean. 37, 703-724.
Daley R. J. ( 1973) Experimental characterization of lacustrine chlo- rophyll diagenesis. II. Bacterial viral and herbivore grazing effects. Arch. Hydrobiol. 72, 409-439.
Daley R. J. and Brown S. R. (1973) Experimental characterization of lacustrine chlorophyll diagenesis. I. Physiological and environ- mental effects. Arch. Hydrobiol. 72, 277-304.
DeMaster D. J. and Pope R. H. (1994) C-14 chronologies, biogenic accumulation rates, and sediment mixing coefficients along the equatorial Pacific transect. Ocean. Sot. Pacific Basin Mtg., 53 (abstr).
DeMaster D. J., McKee B. A., Nittrouer C. A., Brewster D. C., and Biscaye P. E. ( 1985) Rates of sediment reworking at the HEBBLE site based on measurements of Th-234, Cs-137, and Pb-210. Mar. Geol. 66, 133-148.
Doan S. E. ( 1994) Decay of “‘C labeled diatom detritus in diffusively mixed vs. unmixed sediment. M.S. Thesis, Univ. Hawaii.
Dobbs F. C. and Selph K. E. (1994) Bacterial densities and micro- biological biomass along the equatorial Pacific transect. Eos 75, 021F-6 (abstr.) .
Flynn W. W. (1968) The determination of low levels of polonium- 210 in environmental materials. Anal. Chim. Acta 43,221-227.
Furlong E. T. and Carpenter R. (1988) Pigment preservation and remineralization in oxic coastal marine sediments. Geochim. Cos- mochim. Acta 52, 87-99.
Guinasso N. L. and Schink D. R. ( 1975) Quantitative estimates of biological mixing rates in abyssal sediments. J. Geophys. Res. 80, 3032-3043.
Hammond D. E., McManus J., Berelson W., Kilgore T., and Pope R. ( 1996) Early diagenesis of organic material in equatorial Pacific sediments: Stoichiometrv and kinetics. Deeu-Sea Res. II43,1365- 1380.
Hedges J. I. and Hare P. E. (1987) Amino acid adsorption by clay minerals in distilled water. Geochim. Cosmochim. Acta 51, 255- 259.
Honjo S., Dymond J., Collier R., and Manganini S. J. ( 1995) Export production of particles to the interior of the equatorial Pacific

4616 M. P. Stephens et al
ocean during the 1992 EqPac Experiment. Deep-Sea Rrs. II 42, 831-870.
Hoover D. .I. ( 1995) Burrowing urchins in abyssal equatorial Pacific: Sediment reworking rates estimated using two independent tracer techniques. M.S. Thesis. Univ. Hawaii.
Hoover D. J.. Smith C. R., Garner S. P.. Doan S. E., and DeMaster D. J. ( 1994) Macrofaunal and megafaunal contributions to biotur- bation along the JGOFS EqPac transect. Ocean. Sot. Pacific Basin Mtg., 53 (abstr).
Jahnke R. A. and Jackson G. A. ( 1992 ) The spatial distribution of sea floor oxygen consumption in the Atlantic and Pacific oceans. In Deep-Sea Food Chains and the Global Carbon Cycle. NATO Advanced Science Institutes Series (ed. G. T. Rowe and V. Pa- riente). pp. 295-307. Kluwer Academic Pub].
Jeffrey S. W. (1974) Profiles of photosynthetic pigments in the ocean using thin-layer chromatography. Mar. Biol. 26, 101 -I IO.
Kadko D. ( 1983) A multitracer approach to the study of erosion in the northeast equatorial Pacific. Earth Planet.Sci.Lett. 63, 13-33.
Keil R. G., Montluqon D. B., Prahl F. G.. and Hedges J. I. ( 1994 ) Sorptive preservation of labile organic matter in marine sediments. Nature 370, 549-552.
Lampitt R. S. ( 1985 ) Evidence for the seasonal deposition of detritus to the deep-sea floor and its subsequent resuspension. Deep-Sea Res. 32, 885-897.
Lorenzen C. J. ( 1967 ) Vertical distribution of chlorophyll and pheo- pigments: Baja, California. Deep-Sea Res. 14, 735-745.
Martin W. R., Bender M., Leinen M.. and Orchard0 J. (1991) Ben- thic organic carbon degradation and biogenic silica dissolution in the central equatorial Pacific Deep-Sea Res. 38, 148 I - 15 16.
Mathieu G. G.. Biscaye P. E.. and Lupton R. A. ( 1988) System for measurement of ***Rn at low levels in natural waters. Health Phys. 55,989-992.
Mayer L. M. ( 1994a) Surface area control of organic carbon accu- mulation in continental shelf sediments. Geochim. Cosmochim. Acta 58, 1271-1284.
Mayer L. M. ( 1994b) Relationship between mineral surfaces and organic carbon concentrations in soils and sediments. C/tern. Geol.114, 347-363.
Michel J., Moore W. S.. and King P. T. ( 1981) y-Ray spectrometry for determination of Radium-228 and Radium-226 in natural wa- ters. Anal. Chem. 53, 1885- 1889.
Middleburg J. J. (1989) A simple rate model for organic matter decomposition in marine sediments. Geochim. Cosmochim. Acttr 53, 1577-1581.
Murray J. W. and Grundmanis V. ( 1980) Oxygen consumption in pelagic marine sediments. Science 209, 1527- 1530.
Murray J. W.. Barber R. T., Roman M. R., Bacon M. P., and Feely R. A. ( 1994) Physical and biological controls on carbon cycling in the equatorial Pacific. Science 266, 58-65.
Newton J. and Murray J. ( 1995) Particulate carbon, nitrogen, and chlorophyll pigments sediment trap samples. USJGOFS Data System.
Paytan A., Moore W. S.. and Kastner M. (1996) Sedimentation rate as determined by Z2hRa activity in marine barite. Geochim. Cosmochim.Acta 60, 4313-43 19.
Pefia M. A.. Lewis M. R.. and Harrison W. G. ( 1990) Primary pro- ductivity and size structure of phytoplankton biomass on a transect of the equator at 135” in the Pacific Ocean. Deep-Sea Rex 37, 295-315.
Pope R. H.. DeMaster D. J., Smith C. R.. and Seltmann H.. Jr. ( 1996) Rapid biogenic particle mixing in equatorial Pacific sedi- ments: Evidence from excess ‘j4Th measurements. Deep-Sea Res. II 43, 1339-1364.
Rabouille C. and Gaillard J.-F. ( 1991 ) A coupled model representing the deep-sea organic carbon mineralization and oxygen consump- tion in surficial sediments. J. Geophys. Res. 96, 2761-2776.
Reimers C. E. ( 1989) Controls of benthic fluxes by particulate sup- ply. In Productivity of the Ocean: Present and Past(ed. W. H. Berger et al.). pp. 217-233. Wiley.
Robins J. A. ( 1986) A model for particle-selective transport of trac- ers in sediment with conveyer belt deposit feeders. J. Geophys. Rex 91, 8542-8558.
Smith C. R. ( 1992) Factors controlling bioturbation in deep-sea sedi- ments and their relation to models of carbon diagenesis In Deep- Sea Food Chains and the Global Carbon Cycle (ed. G. T. Rowe and V. Pariente). pp. 375-393. Kluwer Academic Pub].
Smith C. R., Walsh I. D., and Jahnke R. A. ( 1992) Adding biology to one-dimensional models of sediment-carbon degradation: The multi-B approach. In Deep-Sea Food Chains and the Global Car- bon Cycle (ed. G. T. Rowe and V. Pariente). pp. 395-400. Kluwer Academic Publ.
Smith C. R., Pope R. H., DeMaster D. J., and Magaard L. ( 1993) Age-dependent mixing of deep-sea sediments. Geochim. Cos- mochim. Acta 57, 1473- 1488.
Smith C. R., Garner S. P., Hoover D., and Pope R. H. ( 1994) Macro- benthos, mechanisms of bioturbation, and carbon-flux proxies at the abyssal seafloor along the JGOFS equatorial Pacific transect. Eos 75, 02lF-4 ( abstr.).
Smith C. R. et al. ( 1996) Phytodetritus at the abyssal seafloor across 10” of latitude in the central equatorial Pacific. Deep-Sea Res. II 43, 1309-1337.
Smith J. N., Boudreau B. P., and Noshkin V. (1986/87) Plutonium and ““Pb distributions in northeast Atlantic sediments: subsurface anomalies caused by nonlocal mixing. Earth Planet. Sci. Lett. 81, 15-28.
Stephens M. P. ( 1996) A study of several aspects of the marine carbon cycle: 1. Sea-air flux of CO? in the North Pacific using shipboard and satellite data, 2. Chloropigments and labile organic carbon at the equatorial Pacific seafloor and 3. Late Holocene CaCOi dissolution from the equatorial Pacific seafloor. Ph.D. dis- sertation, Univ. Miami.
Sun M.-Y., Aller R. C.. and Lee C. (1991) Early diagenesis of chlorophyll-a in Long Island Sound sediments: A measure of car- bon flux and particle reworking. J. Mar. Res. 49, 379-401.
Sun M.-Y.. Lee C., and Aller R. C. ( 1993a) Laboratory studies of oxic and anoxic degradation of chlorophyll-a in Long Island Sound sediments. Geochim. Cosmochim. Acta 57, 147- 157.
Sun M.-Y., Lee C., and Aller R. C. ( 1993b) Anoxic and oxic degra- dation of “C-labeled chloropigments and a ‘“C-labeled diatom in Long Island Sound sediments. Limnol. Ocean. 38, 1438- 1451.
Tans P. P., Fung I. Y., and Takahashi T. ( 1990) Observational con- straints on the global atmospheric COz budget. Science 247, 143 l- 1438.
Westrich J. T. and Bemer R. A. ( 1984) The role of sedimentary organic matter in bacteria1 sulfate reduction: The G mode1 tested. Limnol. Ocean. 29, 236-249.
Wright S. W. et al. ( 199 1) Improved HPLC method for the analysis of chlorophylls and carotenoids from marine phytoplankton. Mar. Ecol. Prog. Ser. 77, 183-196.

Degradation of chlorophyll-a 4617
APPENDIX
Table Al. Site locations for cores indicating the analyses performed on each.
Core Latitude Longitude Depth (m) Data
‘lTO13-048 0’07.20’N 139”44.1O’W TTO13-065 0%.40’N 139”44.1O’W ‘lTO13-066 0%. 16’N 139’43.98’W lTO13-069 O”O6.70’N 139”43.4O’W lTo13-070 O”O6.86’N 139”43.37’W TTo13-071 Ov6.86’N 139”45.OO’W
4307 4308 4304
‘ITO13-076 2”03.94’N 140”08.94’W 4414 TTo13-077 2’03.44’N 140”08.55’W 4412 TTo13-091 2”0.380’N 140”07.9O’W 4408 T-r013-093 2’03.30’N 140”08.60’w 441 TTO13-098 2”03SO’N 140”08.6O’W 4413
‘?Y “‘Pb Pigments 23m 21GPb 234Thb Pigments
““Pb Pigments 234fhb
?hb Pigments
““Pb ‘?ha *“Pb Pigments ‘?hb =rhb Pigments ?hb “%‘b
l-r013-103 Y04.OO’N 139”38.9O’W 4447 234f.l.ra 210Pb
TTO13-108 Y04.21’N 139”38.18’W 4422 Pigments TTO13-112 5’04.70’N 139”38.3O’W 4418 23mb
‘ITO13-116 5”08.OO’N 139”38.5O’W 4320 23mb
TTO13-122 5”05.OO’N 139”38.4O’W 4349 ‘?T *“‘Pb Pigments TTO13-127 5’04.80’N 139”36.82’W 4342 ?hb Pigments
l-r013-143 8’55.50’N 139”52.18’W 4993 lTo13-144 8”55.80’N 139”52.3O’W 4991 ‘ITO13-148 8”55.6O’N 139”52.3O’W 4991 T-r013-149 8”55.70’N 139”51.8O’W 4993
“‘Pb 23Q,b
23%b Pigments ?ha *“Pb Pigments
a_2341n results from this study. b-*3?h results from Pope et al. (1996).
Table A2. Excess ““Th, *‘%‘b, and dry bulk density (p) data.
North Lat. Core
Depth (cm) 23- (dp~g) *‘% (dpm/g)
P (g/cm’)
0 TTO13-048 0.0-0.5 0.5-1.0 1.0-1.5 1.5-2.0 2.0-2.5 2.5-3.0 3.0-3.5 3.5-4.0
0 TTO 13-065 0.0-0.5 0.5-1.0 1.0-1.5 1.5-2.0 2.0-2.5 2.5-3.0 3.0-3.5 3.5-4.0
0 TTO13-069 0.0-0.25 0.25-0.5
0.5-0.75 0.75- 1.0
1.0-1.5 1.5-2.0 2.0-2.5 2.5-3.0 3.0-3.5 3.5-4.0
2 TTO13-076 0.0-0.5 0.5-1.0 1.0-1.5 1.5-2.0 2.0-2.5 2.5-3.0 3.0-3.5 3.5-4.0 4.0-4.5
7.99 2 0.36 0.32 k 0.11
-0.08 ? 0.12 2.51 2 0.16 0.02 2 0.10
-
3.16 -e 0.22 4.90 + 0.32 2.24 k 0.15 0.25 2 0.09
-
-
26.349 k 2.549 15.238 2 1.096 15.531 2 1.204 18.902 t 1.146 11.504 k 0.998 7.011 2 0.568
7.011 + 0.762 9.764 + 0.453 17.539 k 1.860 15.362 lr 1.752 19.006 k 1.823 22.319 ? 1.918 18.302 2 1.536 17.276 2 1.607 10.057 2 1.426 5.936 2 0.796
31.981 k 1.505 16.266 + 1.211 14.181 5 1.152 12.612 + 1.101 10.308 ? 1.013 9.152 of: 0.962
10.895 2 1.037 6.663 + 0.824 6.992 2 0.845 5.857 2 0.768
59.816 -t 3.841 32.903 2 2.440 24.979 2 2.135 30.883 k 2.355 28.868 t 2.278 20.342 2 1.795 12.854 ? 1.135 12.000 ? 1.200 10.505 t- 1.289
0.350 0.456 0.480 0.473 0.517 0.540 0.557 0.561 0.364 0.446 0.428 0.445 0.479 0.501 0.522 0.535
-
-
-
- -
0.243 0.368 0.416 0.419 0.442 0.491 0.531 0.552 0.557

4618 M. P. Stephens et al.
Table A2. (Continued)
North Lat. COR
Depth (cm) - “Th (dpm/g) ““Pb (dpm/g)
P &/cm’)
2 TTOl3-077
TTOl3-09X
5
9
TTO 13. IO3
TTO13-127
TTO13-143
9 TT013-149
I I.56 I 0.93 I.53 2 0.07 0.99 i 0.07 1.99 ? 0.08 0.37 t 0.09
_
x.44 -t 0.34 3.37 -c 0.20 I.29 -t 0.14 0.50 -c 0.1 I
-_ _
- s.73 I 0.36 1.98 t 0.14 1.70 2 0.12 1.94 i 0.14 I.41 i 0.15 0.50 2 0. IO
-.
. _~
_ 6.72 2 0.88 I.72 k 0.31
-0.03 2 0.06 0.00 k 0.10
35.747 ? 2.948 16.599 + 2.037 19.495 i 2.110 23.858 ? 2.348 10.979 ? 1.139 5.450 t 0.665 4.920 + 0.594 2.325 ? 0.806
28.831 -c 1.470 27.338 ? 1.364 17.771 t- 1.009 16.294 -t 1.026 16.618 k 1.120 23.996 k 1.312 20.907 k I. I97 12.583 k 0.882 11.221 k 0.904 7.932 5 0.784
24.873 2 2.644 22.091 -+ 1.215 17.689 ? 1.087 13.539 rf- 0.957 12.896 t I .024 12.685 2 0.850 9.536 k 0.798 7.392 t- 0.899
22.351 + 1.868 9.298 k 1.760 7.648 k 0.984 9.271 + 1.048
17.337 +- I.418 5.811 2 0.930 3.465 k 0.466 4.830 +- 1.019
95.546 t 4.693 44.764 -c 3.289 18.979 -c 2.457 13.730 -’ 2.136 12.291 -+ 3.294 10.364 k 2.910
-3.400 k 2.761
0.516 + 2.597 4 I.990 ?I 4.952 ‘8.217 2 2.784 19.727 + 2.486 3.91 I + 2.509
-2.548 k 2.098
0.326 0.434 0.437 0.441 0.502 0.548 0.572 0.585 0.288 0.363 0.418 0.437 0.445 0.429 0.463 0.509 0.544 0.568 0.379 0.502 0.544 0.566 0.589 0.591 0.619 0.639 0.43 I 0.548 0.578 0.573 0.565 0.642 0.738 0.664 0.113 0.137 0.143 0.153 0.164 0.182 0.198 0.210 0.28 I 0.154 0.176 0.192 0.209 0.221 0.228

Core Pigment 0.0-0.2
Degradation of chlorophyll-a 4619
Table A3. Pigment data (rig/g)))
Depth Interval (cm)
0.4-0.6 1.0-1.5 1.5-2.0 2.0-2.5 2.5-3.0 3.0-4.0 4.0-5.0
Tro13-048 Chl-a 50. 9. 2. allomer 31. 10. 1. Pb-a 604. 45. 43. Pt-a 503. 129. 93.
- -
-
0.9 0.7 1.6 0.6 9.5 3.5
58.1 47.8
lTO13-066 Chl-a 16. 0. 3. allomer 6. 0. 1. Pb-a 175. 78. 22. Pt-a 221. 128. 71.
-
-
5.7 - 9.1 -
68.5 - 210.4 -
TTO13-069 Chl-a 15.5 4.2 2.0 - 1.2 - allomer 23.0 7.1 3.1 - 2.3 - Pb-a 371.9 64.1 33.4 - 9.6 - Pt-a 366.1 135.0 85.8 - 67.1 -
l-r013-071 Chl-a 16. 0. 0. allomer 7. 0. 0. Pb-a 254.0 48. 30.6 Pt-a 250. 114. 32.
- -
- -
-
- - - -
Tro13-077 Chl-a 104. 11. 0. - 2.8 - allomer 51. 6. 0. - 9.1 - Pb-a 1268. 67. 23. - 68.5 - Pt-a 1120. 138. 55. - 210.4 -
T-r013-093 Chl-a 18. 0. 0. - 1.2 allomer 9. 0. 0. - 3.2 Pb-a 451.2 71. 16. - 27.3 Pt-a 368. 161. 61. - 49.2
7TO13-108 Chl-a 6. 6. 0. allomer 0. 0. 0. Pb-a 199. 47. 64. Pt-a 142. 85. 72.
-
0.7 1.2 3.2
38.4
- - - -
0.4 1.4 7.9
39.6
TTO13-122 Chla 10. 5. allomer 5. 4. Pb-a 163.6 20. Pt-a 144. 66.
0. 0. 4.
15.
1. 0. 1.
19.
0. 0.
10. 57.
0. 0. 0.
37.
- 0.8 - 1.7 - 6.0 - 40.7
TTO13-127 Chl-a 26. 0. allomer 13. 0. Pb-a 229. 5. Pt-a 192. 39.
- - -
0.5 1.8
11.1 41.2
‘ITO13-148 Chl-a 0. 0. allomer 0. 0. Pb-a 128. 19. Pt-a 335. 237.
2.2 1.4 4.4 2.8
18.9 8.0 92.7 76.6
- - - -
- - - -
- - - -
- - - -
TTo13-149 Chl-a 14.0 0. 1.3 -
allomer 0.0 0. 2.4 -
Pb-a 125.0 0. 13.2 -
Pt-a 364.0 85. 79.0
Chl-a = Chlorophyll-a; allomer = Chlorophyll-a allomer; Pb-a = Pheophorbide-a; Pt-a = Pheophytin-a.
- - - -
0.9 1.4 4.8
51.0
1.0 1.9
18.7 62.0
- -
- - - -
0.3 0.6 2.5
27.3
-
-
- - - -
0.4 20.0
5.2 25.7
-
- -
0.7 0.9 3.5
33.4
- - -
- - - -
- -
-
- -
-
- -
- - - -
- - - -
- - - -
-
-