chipping away at - the australia institute 15 chipping away at tasmanias... · chipping away at...
TRANSCRIPT

Institute Paper
Chipping away at Tasmania’s future Alternatives to subsidising the forestry industry
Institute Paper No. 15 December 2013 ISSN 1836-8948
Andrew Macintosh

2


ii
Acknowledgments
The author would like to acknowledge Richard Denniss, David Richardson and Serena Rogers of The Australia Institute for providing comments on an early draft of this paper and for their assistance in finalising the paper.
© The Australia Institute 2013
This work is copyright. It may be reproduced and communicated to the public for the purposes of fair dealing as provided by the Copyright Act 1968. The author maintains their moral rights in this work. Requests and inquiries should be directed to The Australia Institute.
iii
Chipping away at Tasmania’s future
Contents
Summary 1
1 Introduction 7
2 Overview of the Tasmanian economy 12
3 Public perceptions of the Tasmanian economy 16
4 Decline of the native forest sector in recent years 17
5 The TFA process and the lack of economic diversification 23
6 Strategic economic options for Tasmania’s forests 29
6.1 Biomass burning 29
6.2 Carbon credits 39
7 Where should governments target their support? 43
8 Conclusion 46
References 48


1
Chipping away at Tasmania’s future
Summary
For several decades, Tasmania’s economic performance has been significantly below the rest of Australia. In 2012-13, Tasmania’s gross state product (GSP) was the second lowest of all states and territories behind the Northern Territory, its per capita GSP and average weekly total earnings were the lowest in the country and the unemployment rate was the highest in the country. On most major economic indicators, Tasmania performs below relevant national averages and, over time, the gap between Tasmania and the rest of Australia has been widening (Figure S1).
Figure S1 Ratio of Tasmanian per capita GSP and Australian per capita GDP, 1990 to 2013, with trend line (current prices)
Source: ABS (2013a), Australian National Accounts: State Accounts, Cat. No. 5220.0; and ABS (2013b), Australian Demographic Statistics, Cat. No. 3101.0.
A central part of the story of the Tasmanian economy since the 1990s has been the declining significance of manufacturing. For much of the last half century, manufacturing has been Tasmania’s dominant industry. Over the period 1990 to 2004, it accounted for roughly 15-16 per cent of GSP, more than double its nearest ‘rival’. Since the mid-2000s, increasing international and interstate competition has seen its position in the economy slide away.
The structural change occurring in Tasmania provides an opportunity to rethink the economic strategy for the state. In the past, there has been an emphasis in federal and state government policy on primary industries and related downstream processing. Much of the associated policy development and public debate has focused on the forestry industry—both native forestry and plantations—and the repeated attempts to ‘value add’ by subsidising capital investment in the processing of Tasmanian wood products. The recent
0.66
0.68
0.7
0.72
0.74
0.76
0.78
0.8
1990 1992 1994 1996 1998 2000 2002 2004 2006 2008 2010 2012
2
Tasmanian Forests Intergovernmental Agreement (IGA) and Tasmanian Forest Agreement (TFA) are the latest manifestation of this approach.
This paper argues that the ongoing emphasis on forestry is misplaced and counterproductive, economically, socially and environmentally. With conditions in the forestry sector likely to remain depressed, at least in the short- to medium-term, there is a need for policy makers to broaden the strategic options for Tasmania. Part of this shift should include a staged wind-down of native forest harvesting, coupled with the use of the native forest estate to generate carbon credits. The revenue from the carbon credits could then be used to help diversify the Tasmanian economy and build a more resilient community.
Perceptions of the forestry industry’s importance
The forestry industry is only a small part of the Tasmanian economy. Forestry and forest product manufacturing accounts for approximately two per cent of GSP, roughly half of which is attributable to native forestry. Current employment in the forestry industry is unlikely to be much over 2,000, with the total in native forestry probably below 1,000, meaning native forestry accounts for less than 0.5 per cent of total employment in Tasmania.
While the statistics paint a picture of a relatively small industry at the periphery of the state economy, the Tasmanian community appears to believe forestry is one of the state’s major industries. A survey conducted as part of this research project found that the average Tasmanian believes forestry makes up almost 30 per cent of GSP, a quarter of the workforce and more than 1/3rd of exports. In truth, at the time of the survey, it was responsible for around two per cent of GSP, 1.5 per cent of employment and five per cent of exports.
Scale of the assistance to the forestry industry
For decades, federal and state governments have provided substantial subsidies to the forestry industry to ensure its ongoing survival. Since the late 1980s, government efforts to support the industry have often been coupled with conservation measures. Prior to the IGA/TFA, there were three previous major attempts to restructure the industry and simultaneously expand the reserve estate: the Helsham Agreement (1989), Tasmanian Regional Forest Agreement (1997) and the Tasmanian Community Forest Agreement (2005). In these previous agreements the Australian government provided funding to the forestry industry on the pretext it would help put it on a financially sustainable footing: it received $42 million under the Helsham Agreement, $110 million through the Regional Forest Agreement and $203 million via the Tasmanian Community Forest Agreement. The sacrifice for the industry that was made in exchange for the funding was lost production forests, which were transferred to reserves.

3
Chipping away at Tasmania’s future
The IGA/TFA has followed the same general structure. Large capital and operating subsidies have been coupled with an expansion of conservation reserves. The headline conservation figure that is often quoted is that the IGA/TFA will result in an additional 504,012 hectares (ha) of conservation reserves. However, the projected reduction in production areas (the areas targeted for harvesting for wood products) as a result of the IGA/TFA is approximately 190,000 ha.
In return for these conservation outcomes, the industry has or will receive $250 million of the total $420 million IGA/TFA funding package. Separately, the Tasmanian government has undertaken to provide $100 million to keep Forestry Tasmania (the state forestry agency) solvent over the period 2013-17, which comes on top of $110 million in funding the corporation received under the Tasmanian Community Forest Agreement of 2005. In 2012, Norske Skog, the owners of the Boyer Mill outside Hobart, also received a $28 million grant from the Australian government and $13 million loan from the Tasmanian government to help it modify its machinery so it can produce coated paper grades outside of the IGA/TFA process.
Almost $160 million of the funding provided to the forestry industry under the IGA/TFA package has been for industry buyouts and structural adjustment, although there are questions surrounding whether the industry adjustment objectives have been achieved. An added concern about the buyout and structural adjustment aspects of the IGA/TFA package is that they came on the back of two separate Australian government structural adjustment programs for the Tasmanian native forest sector in 2010-11. Almost $17 million was spent on the Tasmanian Forest Contractors Exit Assistance Program and a further $5.4 million was spent helping other contractors remain in business.
Few industries receive such generous assistance when market conditions turn against them. In this case, in the space of three years, more than $180 million has been spent on buyouts and structural adjustment assistance for the forestry industry, which equates to approximately $140,000-$280,000 per worker ‘removed’ from the industry over this time.
As with the assistance provided to the Boyer Mill, most of the subsidies under the IGA/TFA have been for new equipment for downstream forestry businesses. Ta Ann, a Malaysian timber company that operates in Tasmania through a subsidiary, Ta Ann Tasmania Pty Ltd, has been one of the main beneficiaries. Under the Tasmanian Community Forest Agreement, it received $10 million to help it build its rotary veneer mill near Smithton. As part of the IGA/TFA process, the Australian government will provide Ta Ann $26 million as compensation for reducing its contracted peeler log supply and $7.5 million to help it build a plywood mill in northern Tasmania. In addition to the direct Commonwealth subsidies, Ta

4
Ann has received Tasmanian government assistance in selecting the site for its mills, planning and approvals, and it is rumoured to have received subsidised electricity.
The return on the taxpayers’ investment in Ta Ann is small. Since commencing operations in 2006, Ta Ann Tasmania Pty Ltd has recorded a profit in only two years, 2009 and 2011, of $400,000 and $1.8 million respectively. Its aggregate net loss over the period 2006-2012 was $26.3 million, its current liabilities exceed current assets by $26 million and it only remains solvent because of a line of credit from its immediate parent company. As a foreign company, even if it made a profit most of the associated economic benefits would accrue to the foreign owners, not Australian taxpayers. Further, due to the extent of its accumulated losses, it has paid no income tax. Because of its financial structure and the subsidies received from the Australian and Tasmanian governments and Forestry Tasmania, the only material return to taxpayers from Ta Ann Tasmania Pty Ltd’s operations is in the form of compensation to employees. In 2012, it had 82 employees and its total personnel expenses, including payroll and fringe benefit tax, were $6.6 million.
The Ta Ann story is indicative of the problems associated with the historic approach to Tasmania’s forestry industry. Governments appear to see forestry as inherently good for Tasmania, irrespective of the sector’s economic performance, the opportunity cost of the capital, labour and natural resources used in the operations, and the broader environmental and social impacts. This has resulted in a tendency for governments to provide extensive subsidies to the sector, even when the operations are manifestly uneconomic.
Should the forestry industry continue to receive subsidies?
Governments usually justify the provision of subsidies to industry on the grounds they create employment and enhance social welfare. Although this is sometimes true, there is significant risk with all subsidy programs that they will have the opposite effect, lowering social welfare by incentivising rent seeking and diverting labour and capital to less productive activities. Due to these risks, conventional economics cautions against the provision of subsidies and suggests they should only be provided where there is persuasive evidence they will generate net benefits to society.
In the case of the forestry industry, there are several issues that suggest it is a poor target for further government support, including:
relevant domestic and international wood fibre and product markets are highly competitive and most of the competition is based on price rather than quality;
the industry is highly cyclical, experiencing sharp downturns every 10-15 years;

5
Chipping away at Tasmania’s future
the long-term history of the industry has illustrated that it generates low returns relative to other industries and is likely to require ongoing government assistance; and
the industry is not labour intensive, meaning it generates fewer jobs per dollar of government assistance than many other industries.
The last of these points is illustrated in Table S1, which shows the number of jobs per $1 million in income in forestry and logging, wood product manufacturing and pulp and paper manufacturing, compared to the equivalent figure from selected service industries. Generally, forestry is less labour intensive (or more capital intensive) than most service industries, meaning it is likely to create fewer jobs per dollar of government assistance.
Table S1 Labour intensity of selected industries
Industry Jobs per $1 million in sales and services income, 2011-
12
Forestry and logging 4.8
Wood product manufacturing 3.8
Pulp and paper manufacturing 1.9
Accommodation and food services 11.0
Professional, scientific and technical services 5.7
Education and training (private) 19.5
Health care and social assistance (private) 14.1
Arts and recreational services 7.2
Source: ABS (2013f), Australian industry, 2011-12, Cat. No. 8155.0.
If governments are going to provide subsidies, they are likely to get better returns from other industries that are more labour intensive and have better long-term prospects. Three of the fastest growing segments of the Tasmanian economy in the past five years have been professional, scientific and technical services (8 per cent per annum since 2008), education and training (7 per cent per annum) and health care and social assistance (6 per cent per annum). Although they attract relatively little public attention, these are the types of areas where, if further assistance is to be provided, governments should be concentrating on.
Alternative uses for Tasmania’s forests
Central to the realisation of the IGA/TFA’s aim of ensuring a ‘strong, sustainable and certain future’ for the forestry industry is finding an alternative market for low

6
grade logs, particularly pulpwood. The Tasmanian government and forestry industry are currently considering several options, the major one being the use of forest biomass for energy production (burning trees to generate electricity or heat).
In the abstract, reorientating the hardwood forestry sectors toward bioenergy production looks like it might yield both economic and environmental benefits. The use of pulplogs and other residues to produce energy would provide a substitute for the export woodchip market, while simultaneously increasing renewable energy generation and lowering greenhouse gas emissions (or so the argument goes). Although appealing in the abstract, the claimed benefits of this strategy are likely to be illusory.
Where the biomass is derived from plantations, bioenergy production could offer both environmental and economic benefits. By providing an additional market for pulpwood, it could help incentivise the retention and even expansion of the plantation estate and, in doing so, reduce Australia’s net greenhouse gas emissions and, in some cases, even provide biodiversity and other environmental benefits. However, notwithstanding the potential climate and environmental benefits, the greatest obstacle to plantation-based bioenergy projects is that they are not financially viable. They are already eligible for assistance under the LRET but have not occurred because of the economic obstacles.
In the case of native forest-based bioenergy projects, they offer neither environmental nor economic benefits. They are unlikely to increase the amount of renewable energy generation or reduce greenhouse gas emissions, and are less economically viable than those based on plantation feedstock.
The most profitable use of the public native forest estate is likely to be conservation, where the forests are used to generate carbon credits. Preserving the remaining 350,000 ha of native production forests could provide the Tasmanian government with 6.7-9.5 million carbon credits per year over the period 2014-2033, worth an estimated $0.9-$1.4 billion in 2014 dollars. The revenues from the sale of carbon credits from native forests could be used to expand and diversify the remainder of the Tasmanian economy.
A staged withdrawal from native forestry could help revive Tasmania’s fortunes. There would be obvious biodiversity, heritage and climate benefits but the real attraction of this option lies in the economic realities. Continued harvesting will bring further financial losses for the state. In contrast, using the forests to generate carbon credits will provide much needed revenues for the government, which could be used to restructure the economy and revitalise the state.

7
Chipping away at Tasmania’s future
1 Introduction
For decades, Tasmania has been regarded as an economic laggard; the jurisdiction that weighed down an otherwise strong national economy. The reason for the reputation is reflected in the statistics on its economic performance. In 2012-13, its gross state product (GSP) was $24.2 billion, the second lowest of all states and territories behind the Northern Territory. Its per capita GSP was the lowest in the country; 29 per cent below Australia’s per capita gross domestic product (GDP) (Figure 1). Average weekly total earnings were similarly the lowest in the country, 15 per cent below the national average (Figure 2), and the unemployment rate was the highest in the country.
On most major economic indicators, Tasmania performs significantly below relevant national averages. Over time, the gap between Tasmania and the rest of Australia has also been widening. This is evident in the ratio between Tasmanian per capita GSP and Australian per capita GDP (Figure 3). For most of the past twenty years, Tasmania has been falling further and further behind the rest of the country.
For a period in the early- to mid-2000s, the disparity in performance between Tasmania and the rest of Australia moderated. The state experienced relatively rapid growth over this time, fuelled mainly by private spending. To a large extent, this mini-boom was attributable to house price increases brought on by interstate investment in, and migration to, Tasmania. Higher house prices increased consumer confidence, prompting an increase in household spending and debt. This, in turn, stimulated increased construction and demand for related services, as well as an increase in state government revenue and spending. The onset of the global financial crisis pricked the bubble, particularly after the Australian government wound back its stimulus package. Since 2010, the Tasmanian economy has all but stagnated while the rest of the Australian economy has continued to grow at near trend levels.

8
Figure 1 Australia per capita GDP and state and territory per capita GSP, 2012-13
Source: Australian Bureau of Statistics (ABS) (2013a), Australian National Accounts: State Accounts, Cat. No. 5220.0; and ABS (2013b), Australian Demographic Statistics, Cat. No. 3101.0.
Figure 2 Average total weekly earnings, Australia and by state/territory, 2012-13
Source: ABS (2013c), Average Weekly Earnings, Cat. No. 6302.0; and ABS (2013b), Australian Demographic Statistics, Cat. No. 3101.0.
$0 $20,000 $40,000 $60,000 $80,000 $100,000 $120,000
NSW
VIC
QLD
SA
WA
TAS
NT
ACT
Aust
$0 $200 $400 $600 $800 $1,000 $1,200 $1,400 $1,600
NSW
VIC
QLD
SA
WA
TAS
NT
ACT
Aust

9
Chipping away at Tasmania’s future
Figure 3 Ratio of Tasmanian per capita GSP and Australian per capita GDP, 1990 to 2013, with trend line (current prices)
Source: ABS (2013a), Australian National Accounts: State Accounts, Cat. No. 5220.0; and ABS (2013b), Australian Demographic Statistics, Cat. No. 3101.0.
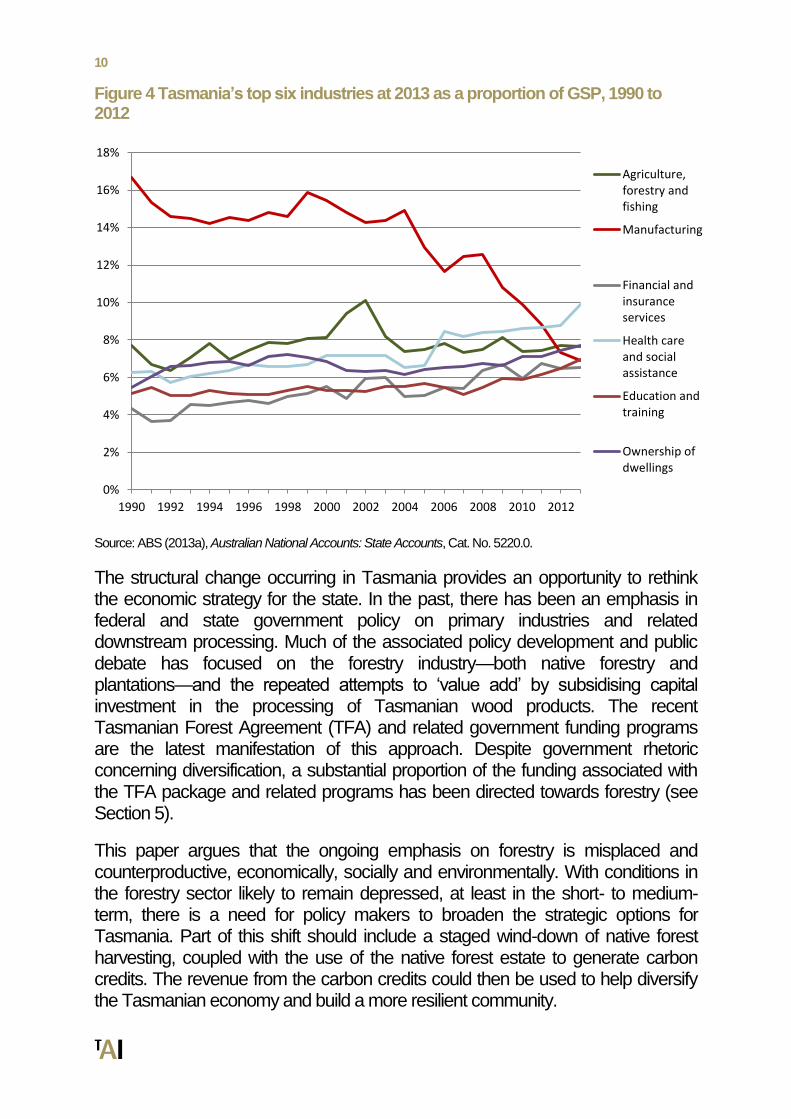
A central part of the story of the Tasmanian economy since the 1990s has been the declining significance of manufacturing. For much of the last half century, manufacturing has been Tasmania’s dominant industry. Over the period 1990 to 2004, it accounted for roughly 15-16 per cent of GSP, more than double its nearest ‘rival’. Since the mid-2000s, increasing international and interstate competition has seen its position in the economy slide away. By 2013, gross value added from manufacturing constituted less than seven per cent of GSP (Figure 4). Initially, the decline was a product of a slowing growth rate. Since the onset of the global financial crisis in 2008, gross value added from manufacturing has fallen by almost 10 per cent per annum.
0.66
0.68
0.7
0.72
0.74
0.76
0.78
0.8
1990 1992 1994 1996 1998 2000 2002 2004 2006 2008 2010 2012
10
Figure 4 Tasmania’s top six industries at 2013 as a proportion of GSP, 1990 to 2012
Source: ABS (2013a), Australian National Accounts: State Accounts, Cat. No. 5220.0.
The structural change occurring in Tasmania provides an opportunity to rethink the economic strategy for the state. In the past, there has been an emphasis in federal and state government policy on primary industries and related downstream processing. Much of the associated policy development and public debate has focused on the forestry industry—both native forestry and plantations—and the repeated attempts to ‘value add’ by subsidising capital investment in the processing of Tasmanian wood products. The recent Tasmanian Forest Agreement (TFA) and related government funding programs are the latest manifestation of this approach. Despite government rhetoric concerning diversification, a substantial proportion of the funding associated with the TFA package and related programs has been directed towards forestry (see Section 5).
This paper argues that the ongoing emphasis on forestry is misplaced and counterproductive, economically, socially and environmentally. With conditions in the forestry sector likely to remain depressed, at least in the short- to medium-term, there is a need for policy makers to broaden the strategic options for Tasmania. Part of this shift should include a staged wind-down of native forest harvesting, coupled with the use of the native forest estate to generate carbon credits. The revenue from the carbon credits could then be used to help diversify the Tasmanian economy and build a more resilient community.
0%
2%
4%
6%
8%
10%
12%
14%
16%
18%
1990 1992 1994 1996 1998 2000 2002 2004 2006 2008 2010 2012
Agriculture,forestry andfishing
Manufacturing
Financial andinsuranceservices
Health careand socialassistance
Education andtraining
Ownership ofdwellings

11
Chipping away at Tasmania’s future
The remainder of this report seeks to establish the case for this proposal. Section 2 provides an overview of the Tasmanian economy and forestry’s place in it. Section 3 presents analysis on the perceptions of the significance of forestry in the Tasmanian economy. Section 4 evaluates the state of the native forestry industry and reasons for its decline. Section 5 looks at the TFA and how it has sought to diversify the Tasmanian economy. Section 6 evaluates the strategic options for Tasmania’s forests, focusing on using forests to produce energy (biomass burning) or conserving them in order to generate carbon credits. Section 7 looks at where, if industry subsidies are going to be provided, they should be targeted and Section 8 concludes.

12
2 Overview of the Tasmanian economy
There is a widely held perception that the Tasmanian economy is dependent on primary industry, particularly forestry, agriculture and mining. This image is a product of Tasmania’s history and how it has been marketed by governments and industry. Agriculture, fishing (sealing, onshore whaling and native oysters) and mining were the mainstays of the economy in the early part of the 19th century. After the rapid expansion of apple orchards and exports in the late 1800s, Tasmania became known as the ‘Apple Isle’, a name still used despite the diminutive size of the apple sector. More recently, along with the ‘Holiday Isle’ slogan, it has been sold to the world as a ‘clean and green’ agricultural producer. At the same time, political debate within and about Tasmania has been dominated by the ‘forest wars’,1 giving the impression that forestry is of central importance to the health of the state’s economy.
Despite the image and its origins, the Tasmanian economy is more diversified, and less dependent on primary industry, than commonly believed. The two largest industries, by industry gross value added, are now health care and social assistance, and ownership of dwellings (Table 1). Agriculture, forestry and fishing is the state’s third largest industry contributing eight per cent of GSP but forestry makes up only a small proportion of this. Over the period 2005-2012, the gross value added from forestry and logging (confined to growing, maintaining and harvesting native and plantation forests) averaged a little over $200 million per year, or a mere one per cent of GSP.2 Mining also plays a relatively minor part in the economy, contributing just 1.4 per cent to GSP in 2013 and an average of 1.3 per cent between 2005 and 2013.
1 Adjani J (2007), The Forest Wars.
2 Derived from Australian Bureau of Agricultural and Resource Economics and Sciences (ABARES) (2013),
Australian Forest and Wood Products Statistics.

13
Chipping away at Tasmania’s future
Table 1 Tasmanian industry gross value added and proportion of GSP, 2013, current prices
Industry Gross value added
(million $) Proportion of GSP (per
cent)
Health care and social assistance 2,416 10
Ownership of dwellings 1,876 8
Agriculture, forestry and fishing 1,857 8
Education and training 1,698 7
Manufacturing 1,685 7
Financial and insurance services 1,585 7
Public administration and safety 1,541 6
Transport, postal and warehousing 1,512 6
Retail trade 1,483 6
Construction 1,345 6
Electricity, gas, water and waste services 1,117 5
Professional, scientific and technical services
805 3
Wholesale trade 705 3
Accommodation and food services 628 3
Information media and telecommunications
572 2
Administrative and support services 508 2
Rental, hiring and real estate services 472 2
Other services 431 2
Mining 334 1
Arts and recreation services 161 1
All industries 22,732 93
Taxes less subsidies on products 1,626 7
GSP 24,360 100
Source: ABS (2013a), Australian National Accounts: State Accounts, Cat. No. 5220.0.
A similar tale is told by the employment statistics (Figure 5). None of the primary industries rank in the top eight employers in the state. The state’s largest employer

14
is health care and social assistance (14 per cent), followed by retail (11 per cent) and education and training (10 per cent). Agriculture, forestry and fishing is the ninth largest employer (5 per cent), while mining is the sixteenth (2 per cent).
Figure 5 Tasmania’s ten largest industries, by proportion of total state employment in 2013
Source: ABS (2013d), Labour Force, Australia, Detailed, Cat. No. 6291.0.55.003.
These statistics hide some of the linkages and dependencies between industries. For example, forestry supplies wood fibre for the manufacture of sawnwood, woodchips, wood-based panels and paper products, and employs road and transport contractors. Of course all industries help to ‘create’ jobs in other industries. For example, the healthcare industry ‘creates’ jobs in construction and business services and the retail industry ‘creates’ transport jobs. In the case of forestry, even when these linkages are accounted for, it is still a small part of the Tasmanian economy. In 2011, forestry and forest product manufacturing was responsible for approximately three per cent of GSP.3 The gross value added from native forestry (excluding softwood and hardwood plantations but including native forest product manufacturing) was roughly 1.7 per cent of the state total.4 Similarly, as at May 2011, the forestry industry as a whole (covering forest managers, processors, silviculture contractors, nurseries, harvest and haulage contractors, and other related service providers) employed 3460 full- and part-time
3 ABARES (2013), Australian Forest and Wood Products Statistics.
4 Derived from ABARES (2013), Australian Forest and Wood Products Statistics.
0%
2%
4%
6%
8%
10%
12%
14%
16%

15
Chipping away at Tasmania’s future
workers (3,260 full-time equivalents).5 Of these, 1,678 were employed in the native forest sector (Figure 6). Since 2011, the industry has contracted considerably. The contribution to GSP in 2012 is likely to have been around two per cent, and one per cent for native forestry. Current employment in the forestry industry is unlikely to be much over 2,000, with the total in native forestry probably below 1,000, out of a total Tasmanian workforce of almost 230,000, meaning native forestry accounts for less than 0.5 per cent of employment.6
Figure 6 Employment in Tasmania’s forestry industry, by sector, May 2011
Source: Schirmer et al (2011), Socioeconomic Impacts of Forest Industry Change: A Baseline Study of the Tasmanian Forest Industry.
5 Schirmer J, Dunn C, Loxton E and Dare M (2011), Socioeconomic Impacts of Forest Industry Change: A
Baseline Study of the Tasmanian Forest Industry. 6 ABARES (2013), Australian Forest and Wood Products Statistics; Schirmer, et al (2011), Socioeconomic
Impacts of Forest Industry Change: A Baseline Study of the Tasmanian Forest Industry; and ABS (2013d), Labour Force, Australia, Detailed. Cat. No. 6291.0.55.003.
1678
478
810
494 Native forest
Hardwood plantation
Softwood plantation
Unknown

16
3 Public perceptions of the Tasmanian economy
In 2012, The Australia Institute conducted a representative, internet-based survey of 543 Tasmanians on what role they thought forestry played in the state economy. Table 2 shows the average results on key questions regarding these perceptions.
Table 2 Tasmanian perceptions of the importance of the forestry industry
Question Average Estimated actual
What percentage of the Tasmanian workforce do you think is directly employed in forestry and logging?
19% 0.4%
What percentage of GSP do you think the forestry and logging directly accounts for?
27% 0.5%
All up, what percentage of the Tasmanian workforce do you think is employed in forestry and forest products industries?
24% 1.5%
All up, what percentage of GSP do you think is accounted for by forestry and forest products industries?
28% 2.0%
What percentage of all Tasmanian exports do you think are produced by the Tasmanian forestry and logging industry?
36% 5.1%
Source: The Australia Institute (2013), unpublished data.
What is evident from the results in Table 2 is that public perceptions differ markedly from reality. The Tasmanian community appears to believe forestry is one of the state’s major industries, making up almost 30 per cent of GSP, a quarter of the workforce and more than 1/3rd of exports. In truth, at the time of the survey, it was responsible for around two per cent of GSP, 1.5 per cent of employment and five per cent of exports.7 Since then, the industry has contracted further, making it even less significant.
A possible explanation for these results is that, after 20 years of conflict over forest management, the community has conflated the size of the political fight with the size of industry. The forestry industry also has considerable influence in Tasmanian politics and, in order to secure this influence, often exaggerates its role in the Tasmanian economy. Whatever the underlying causes, the forestry industry’s part in the state is misunderstood. It is a relatively minor industry in decline.
7 Tasmanian Department of Economic Development, Tourism and the Arts (2013), Tasmania’s International
Exports: 2012 – 2013; Schirmer, et al (2011), Socioeconomic Impacts of Forest Industry Change: A Baseline Study of the Tasmanian Forest Industry; and ABS (2013d), Labour Force, Australia, Detailed, Cat. No. 6291.0.55.003; ABS (2013a), Australian National Accounts: State Accounts, Cat. No. 5220.0.

17
Chipping away at Tasmania’s future
4 Decline of the native forest sector in recent years
Australia’s forest sector has experienced a significant contraction over the past five years, with Tasmania being the worst affected state. The extent and nature of the downturn in Tasmania are reflected in the patterns in log production in the four major sub-sectors: public native forests, private native forests, hardwood plantations and softwood plantations (Figures 7-10).
Figure 7 Tasmania public native forest roundwood removals, 1997 to 2013 (m3)
Source: Forestry Tasmania (2001-2008). Annual Reports; Forestry Tasmania (2009-2012). Stewardship Reports; Forestry Tasmania (2007-2008). Sustainable Forest Management Reports.
0
500000
1000000
1500000
2000000
2500000
3000000
3500000
1997 1999 2001 2003 2005 2007 2009 2011 2013
m3
Sawlog (Cat. 1&3 + veneer) Pulplog (Cat. 2&8 + peeler + pulp) Special species log

18
Figure 8 Tasmania private native forest roundwood removals, 1997 to 2013 (m3)
Source: Private Forests Tasmania (2001-2013), Annual Reports.
Figure 9 Tasmania hardwood plantation roundwood removals, 1997 to 2012 (m3)
Source: ABARES (2013), Australian Forest and Wood Products Statistics.
0
500000
1000000
1500000
2000000
2500000
1997 1999 2001 2003 2005 2007 2009 2011 2013
m3
Sawlog, veneer and ply Pulpwood Minor log products
0
200000
400000
600000
800000
1000000
1200000
1400000
1997 1998 1999 2000 2001 2002 2003 2004 2005 2006 2007 2008 2009 2010 2011 2012
m3
Sawlog Pulplog Other

19
Chipping away at Tasmania’s future
Figure 10 Tasmania softwood plantation roundwood removals, 1997 to 2012 (m3)
Source: ABARES (2013), Australian Forest and Wood Products Statistics.
What is evident from the trends in log production in Figures 7-10 is that the hardwood sector, both native and plantations, has borne the brunt of the downturn. Softwood roundwood removals have declined in recent years because of the impact of the global financial crisis. Most of this decline is in sawlog production where the four year average over the period 2009-2012 is 25 per cent below the four years 2005-2008. The extent of the decrease is due the surge in construction, particularly detaching housing construction, in the mid-2000s and subsequent decline in the wake of the economic slowdown. Over the same period, softwood pulpwood product has increased by almost 20 per cent.
The data on the hardwood sectors (Figures 7, 8 and 9) highlights three important issues. The first is the extent of the sector’s dependence on pulpwood for the woodchip export market, mostly for paper and paperboard production in Japan (and increasingly China). The pulplog category in Figure 7 combines pulpwood (for woodchips) with low grade sawlogs (category 2 & 8) and peeler (rotary veneer) logs. When low grade sawlogs and peelers are excluded, pulpwood still makes up the bulk of log removals from Tasmania’s public native forests. Over the period 2000 to 2010, pulpwood for woodchips compromised 80 per cent of roundwood removals from public native forests and more than 70 per cent of the mill door landed value of logs produced. In private native forests, the pulpwood proportion over the same period was 94 per cent. Despite claims about woodchips being a ‘by-product’ of native forestry, woodchips have in fact been the
0
200000
400000
600000
800000
1000000
1200000
1400000
1600000
1997 1998 1999 2000 2001 2002 2003 2004 2005 2006 2007 2008 2009 2010 2011 2012
m3
Sawlog Pulplog Other

20
mainstay of the sector since the 1970s, initially for domestic pulp and paper production and, more recently, almost exclusively for export.8
The second notable issue is the sharp decline in pulpwood production that started in 2001 in private native forests, 2004 in public native forests and 2008-09 in hardwood plantations. These trends are attributable to several factors. After the introduction of the Tasmanian Regional Forest Agreement and relaxation of the woodchip export controls, pulpwood production from public native forests almost doubled, squeezing out private native forest producers. The public native forest sector went through a similar experience in the mid- to late-2000s as the short-rotation eucalypt plantations, incentivised by tax concessions (mainly Managed Investment Schemes (MIS)), reached harvest age. The plantation sector was able to capture market share from native forests because of an increasing market preference for plantation-sourced woodchips (they have a higher pulp yield and are seen as more sustainable) and rising harvesting and haulage costs in the native forest sector.9
Making matters worse for native producers was the fact they were facing increasing competition in Asian export markets from plantation hardwood chip exporters from developing countries in South East Asia, Africa and South America.10 The capacity of the native forest sector to hold its position against these producers has been eroded by the high Australian dollar. The other major contributor to the drop in native pulpwood production has been the state of the Japanese pulp and paper industry, which is the primary source of demand for Australian woodchips. Japanese pulp and paper production has been stagnant from the early 2000s and dropped sharply after the onset of the global financial crisis. While production has recovered more recently—after been disrupted in 2011 by the Tōhoku earthquake and tsunami—it has not rebounded to pre-global financial crisis levels and looks unlikely to do so.11 Japanese demand for Australian woodchips is in decline and, to date, the growing Chinese market has not filled the gap. Another causal factor in the decline in native woodchip production has been the closure of the Triabunna woodchip mill. In early 2011, Gunns Ltd, who then owned the mill, ‘temporarily’ closed it because of the lack of demand for its woodchips. The mill was then sold cheaply ($10 million) to entrepreneurs Jan Cameron and Graeme Wood, who subsequently permanently closed and dismantled it. At the time of writing, the site was being redeveloped for a tourism venture.
The international and domestic market factors that have adversely affected native forest woodchip producers have had a similar impact on the hardwood plantation 8 Dargavel J (1995), Fashioning Australia’s Forests; Ajani (2007), The Forest Wars.
9 Macintosh A (2013), The Australian native forest sector: causes of the decline and prospects for the future.
10 Ibid.
11 Ibid.

21
Chipping away at Tasmania’s future
sector. Pulpwood production from Tasmanian hardwood plantations peaked in 2008 and has since declined rapidly. These trends are partly due to the situation in Japan and partly due to policy-induced deficiencies in the structure of many plantation businesses. Strains in the plantation sector began to show in the years leading up to the global financial crisis. Many forestry MISs had high cost structures that were designed to maximise tax deductions for investors.12 Pressures within the financial services market had also resulted in the adoption of forestry MIS arrangements where investors made upfront payments to cover establishment costs but no annual contributions to cover ongoing management costs.13 This left MIS operators with cash flow problems, which were exacerbated by the fact that a significant proportion of the schemes had built their long-term viability on unrealistic yield predictions.14 By 2007-2008, many forestry MISs were experiencing financial difficulties. The onset of the global financial crisis magnified the pressures on the sector and resulted in a number of operators going into receivership, including the Great Southern Group, Timbercorp and Forestry Enterprises Australia. Gunns Ltd also managed 150,000 hectares of hardwood plantations in Tasmania, half as MIS projects, and went into receivership in September 2012.
The third issue that is evident from Figures 7 and 8 is decline in high quality sawlog production from native forests that commenced in the mid-2000s (Tasmania’s hardwood plantations are almost exclusively for woodchips). This downward trend is due to several issues, most notably increased competition from domestic plantation softwoods in the structural timber market (Figure 10), weak demand in the structural timber market, increased competition from domestic and imported engineered wood products, and rising harvest and haulage costs.15 The sector has faced falling demand, stagnant or decline real prices and increasing costs; a combination that has led to reduced output.
Figures 7, 8 and 9 tell only part of the story of the decline of the Tasmanian hardwood sector. Forestry Tasmania, the state-owned entity responsible for the management of the public native forest estate, recorded an aggregate net loss before tax and other items of $122 million over the four year period 2010-2013, $30 million a year. In the most recent financial year, 2012-13, it lost (before tax and other items) $48 million and only remained solvent through $15 million in ‘deficit financing’ from the state government. Due to the state of the forestry sector and
12
Parliamentary Joint Committee on Corporations and Financial Services (2009), Aspects of agribusiness managed investment schemes.
13 Parliamentary Joint Committee on Corporations and Financial Services (2009), Aspects of agribusiness
managed investment schemes; Senate Select Committee on Agricultural and Related Industries (2010). Food production in Australia.
14 Parliamentary Joint Committee on Corporations and Financial Services (2009), Aspects of agribusiness
managed investment schemes; Senate Select Committee on Agricultural and Related Industries (2010). Food production in Australia.
15 Macintosh A (2013), The Australian native forest sector: causes of the decline and prospects for the future.
22
the corporation’s finances, the government has budgeted to provide a further $25 million each year in 2014, 2015 and 2016, and $10 million in 2017, to ensure Forestry Tasmania remains a going concern.16 This $100 million from Tasmanian taxpayers is on top of the $110 million Forestry Tasmania has received since 2006 as part of the Tasmanian Community Forest Agreement. In 2013, it also received $1.7 million as part of the TFA process. The ongoing government financial support for Forestry Tasmania, and extent of the corporation’s losses, highlight how the state and federal governments are keeping the native forestry sector alive by providing subsidised logs. Forestry Tasmania sells logs to wood processors at prices that do not cover its costs and the losses are then transferred to taxpayers. Without this subsidy, the sector would collapse.
16
Forestry Tasmania (2013), Stewardship Report.

23
Chipping away at Tasmania’s future
5 The TFA process and the lack of economic diversification
In August 2011, the Australian and Tasmanian governments signed the Tasmanian Forests Intergovernmental Agreement (IGA 2011), the aim of which was to:
… support the restructuring of the [forestry] industry towards future sustainability based on both public and private resource, create a significant conservation benefit by reserving and protecting High Conservation Value forest areas, and strengthen the partnership between the two Governments and other stakeholders to develop and diversify the Tasmanian economy, creating new sources of prosperity and opportunity for all Tasmanians.17
This was the fourth such agreement since 1989, the three predecessors being the Helsham Agreement (1989), Tasmanian Regional Forest Agreement (1997) and the Tasmanian Community Forest Agreement (2005). In these previous agreements the Australian government provided funding to the forestry industry on the pretext it would help put it on a financially sustainable footing: it received $42 million under the Helsham Agreement, $110 million through the Regional Forest Agreement and $203 million via the Tasmanian Community Forest Agreement. The sacrifice for the industry that was made in exchange for the funding was lost production forests, which were transferred to reserves.
The IGA followed the same general structure. The Australian government agreed to provide $234 million under the IGA 2011, comprising:
between $14-$25 million for employment and training support for redundant forest workers;
$1 million for counselling (shared with the Tasmanian Government);
$45 million for a haulage, harvest and silvicultural contractor exit program;
$43 million to help the Tasmanian Government implement the agreement, $15 million of which was earmarked for a voluntary sawmill exit program and $5 million for community consultation; and
$20 million in 2011-12 and $100 million over the following 14 years ‘to fund regional development projects which meet rigorous criteria for improving the productivity and income-earning capacity of the Tasmanian economy’.
It also undertook to provide $7 million in 2011-12 for reserve management and a further $7 million per year (plus inflation) thereafter if additional forest areas were given formal protection.
17
Australian Government and Tasmanian Government (2011). Tasmanian Forests Intergovernmental Agreement.

24
Responsibility for identifying and agreeing on the additional reserves and associated resource access issues was given to a self-selected collection of industry, union and environment groups, whose deliberations were informed by an ‘Independent Verification Group’ led by Jonathan West. The end outcome of the negotiations between these groups was the TFA,18 which was finalised in November 2012. It contains a number of elements, the most important of which are the support for the creation of 504,012 hectares (ha) of conservation reserves, a reduction in the high quality sawlog guarantee from 300,000 to 137,000 cubic metres (m3) per year and a restructuring package for the forestry industry. The Tasmanian government subsequently agreed to the TFA and, on 30 April 2013, the Tasmanian Forests Agreement Act 2013 was passed by the Tasmanian Parliament.
Only days later, on 2 May, the Australian and Tasmanian governments signed the Tasmanian Forests Intergovernmental Agreement 2013 (IGA 2013) to formalise the commitments concerning the implementation of the TFA and associated structural adjustment and diversification package.19 The stated aims of the IGA 2013 (in conjunction with the TFA) are:
to ensure the Tasmanian forestry industry has a ‘strong, sustainable and certain future’ 20
the protection and management of the 504,012 ha of reserves; and
the diversification of the Tasmanian economy.
In total, the Australian and Tasmanian governments have committed $420 million to the IGA/TFA. Table 3 summarises the government funding provided under the IGA/TFA, and the respective contributions from the two governments.
18
Australian Conservation Foundation et al (2012). Tasmanian Forest Agreement 2012. 19
Australian government and Tasmanian government (2013). Tasmanian Forests Intergovernmental Agreement. 20
Ibid.

25
Chipping away at Tasmania’s future
Table 3 Combined Australian and Tasmanian government financial commitments under the IGA 2011 and IGA 2013
Funding item Total
commitment ($ millions)
Australian government
contribution
($ millions)
Tasmanian government
contribution
($ millions)
Exit payments, buyouts and structural adjustment
Contractor exit program
Peeler billet contract buyback
High quality sawlog contract buyback
Employment, training and relocation support
Regional sawmiller structural adjustment
Support payments for workers and contractors
Transitional support for workers impacted by Gunns Ltd exit from native forest processing
Counselling services
Sub-total
45
26
15
25
10
20
15
2
158
45
26
15
25
10
20
0
1.5
142.5
0
0
0
0
0
0
15
0.5
15.5
Harvest rescheduling assistance
Transitional funding for Forestry Tasmania for roading, rescheduling and woodchip transport
Harvest reschedule subsidy – $4.8 m pa (three year cost)
15
14
0
0
15
14
Assistance to Tasmanian government
IGA implementation assistance
Reserve management – $7 m pa in 2012 and 2014, $9 m pa from 2015 (indexed to CPI) (four year cost)
28
32
28
32
0
0
World Heritage planning 1.5 1.5 0
FSC certification, Special Council and IGA/TFA communications
7
3.5
3.5
Forest industry innovation subsidies
Study on use of harvest and processing residues
Special species timber study
‘Residue solution’ subsidy
Plantation sawlog and processing subsidy
1
2
12.5
24
1
2
12.5
16
0
0
0
8
Regional development and economic diversification (Tasmanian Jobs and Growth Plan)
124
124
0
Total 419 363 56 Source: Australian government and Tasmanian government (2013). Tasmanian Forests Intergovernmental Agreement.
The rhetoric around the IGA/TFA was that, in contrast to the previous forestry agreements, this time the emphasis would be on diversifying the Tasmanian

26
economy. However, as in the past, most of the government funding has been directed towards the forestry industry. Almost $160 million of the IGA/TFA package has been spent on industry buyouts and structural adjustment, although there are questions surrounding whether the industry adjustment objectives have been achieved. The IGA Contractors Voluntary Exit Grants Program was supposed to reduce the native forest harvest and haulage capacity by 1.5 million tonnes. Yet, despite spending $44 million, only 865,628 tonnes of harvest capacity and 973,713 tonnes of haulage capacity were removed through the program.21 Further, immediately after the program closed in 2012, Forestry Tasmania recontracted 200,000 tonnes of harvest and haulage capacity on the pretext of improving the viability of the remaining contractors.22 Evidence has also emerged that some operators accepted exit payments under the program but stayed in the industry.23
An added concern about the buyout and structural adjustment aspects of the IGA/TFA package is that they came on the back of two separate Australian government structural adjustment programs for the Tasmanian native forest sector in 2010-11. Almost $17 million was spent on the Tasmanian Forest Contractors Exit Assistance Program, which was a buyout scheme for native forest harvest and haulage contractors, and a further $5.4 million was spent helping other contractors remain in business.24 Few industries receive such generous assistance when market conditions turn against them.
The government support to the forestry industry under the IGA/TFA was also not confined to structural adjustment assistance. Almost $30 million of the package was provided for harvest rescheduling and $0.5 million to help Forestry Tasmania gain Forest Stewardship Council certification for its operations. Of the $124 million provided for the Tasmanian Jobs and Growth Plan, which was supposed to be for economic diversification, $23 million went to forestry projects (Table 4). A further $39.5 million has been provided for forestry ‘innovation’, most of which is intended to subsidise ‘solutions’ for harvest and processing residues and the hardwood plantation sector. All up, out of the total $420 million IGA/TFA package, $250 million has or will go to the forestry industry as either restructuring assistance or standard production subsidies. It is also worth noting that in 2012, Norske Skog, the owners of the Boyer Mill outside Hobart, received a $28 million grant from the Australian government and $13 million loan from the Tasmanian government to
21
Australian National Audit Office (2013a), Administration of the Tasmanian Forests Intergovernmental Agreement Contractors Voluntary Exit Grants Program.
22 Senate Standing Committee on Rural and Regional Affairs and Transport (2013), Auditor-General's reports
on Tasmanian Forestry Grants Programs. 23
Australian Broadcasting Corporation (ABC) (2013), Family loophole lets contractors back in native forests (http://www.abc.net.au/7.30/content/2013/s3783692.htm).
24 Australian National Audit Office (2013b), Senate Rural and Regional Affairs and Transport References
Committee Inquiry into Tasmanian Forestry Grants Programs – Submission.

27
Chipping away at Tasmania’s future
help it modify its machinery so it can produce coated paper grades (i.e. magazine-quality coated paper). This capital subsidy was provided outside of the IGA/TFA.
Table 4 Forestry industry projects funded under the Tasmanian Jobs and Growth Plan*
Recipient Grant ($ millions)
Britton Brothers Pty Ltd
Dovetail Timbers Pty Ltd
McKee & Co General Engineering Pty Ltd
The Maclaine Family Trust
Dorset Renewable Industries Pty Ltd Integrated processing facility
Ta Ann plywood mill
Britton Timbers Pty Ltd new timber moulding line
SFM Forest Management harvesting of flooded special timbers
Oakdale Industries Timber Lamination Production Facility
Tasmanian Wood Panels energy reduction project and reopening of particle board plant
Tasmania Regional Sawmills study
Total
0.7
0.1
0.1
0.1
2.8
7.5
1.2
5.0
4.0
1.3
0.1
22.9
Source: Australian Government (2013a), Tasmanian Jobs and Growth Plan; AusIndustry (undated), Tasmania Innovation and Investment Fund: List of applicants to be offered funding.
As with the assistance provided to the Boyer Mill, most of the subsidies under the IGA/TFA have been for new equipment for downstream forestry businesses. Ta Ann, a Malaysian timber company that operates in Tasmania through a subsidiary, Ta Ann Tasmania Pty Ltd, has been one of the main beneficiaries. It was also a major beneficiary from the funding provided under the Tasmanian Community Forest Agreement of 2005.
In 2007, Ta Ann received almost $8 million from the Tasmanian Community Forest Agreement package to help it build its rotary veneer mill near Smithton. Soon after the Rudd Government took office, it decided to bolster all of the Tasmanian Community Forest Agreement industry development grants, which resulted in Ta Ann receiving an additional $2 million.25 As part of the IGA/TFA process, the Australian government will provide Ta Ann $26 million as compensation for reducing its contracted peeler log supply from 265,000 to 157,000 m3 per year. It is also scheduled to receive $7.5 million to help it build a plywood mill in northern Tasmania as part of the Tasmanian Jobs and Growth Plan (Table 4).
25
Australian National Audit Office (2008), Tasmanian Forest Industry Development and Assistance Programs; and Ernst & Young (2011), Evaluation of the Tasmanian Community Forest Agreement Industry Development Program.
28
In addition to the direct Commonwealth subsidies, Ta Ann has received Tasmanian Government assistance in selecting the site for its mills, planning and approvals, and it is rumoured to have received subsidised electricity. Forestry Tasmania also provided the company with a long-term deal for the supply of subsidised peeler logs, part of which has now been bought back by the Australian Government.
The return on the taxpayers’ investment in Ta Ann is small. Since commencing operations in 2006, Ta Ann Tasmania Pty Ltd has recorded a profit in only two years, 2009 and 2011, of $400,000 and $1.8 million respectively. Its aggregate net loss over the period 2006-2012 was $26.3 million, its current liabilities exceed current assets by $26 million and it only remains solvent because of a line of credit from its immediate parent company.26 As a foreign company, even if it made a profit most of the associated economic benefits would accrue to the foreign owners, not Australian taxpayers. Further, due to the extent of its accumulated losses, it has paid no income tax.27 Because of its financial structure and the subsidies received from the Australian and Tasmanian Governments and Forestry Tasmania, the only material return to taxpayers from Ta Ann Tasmania Pty Ltd’s operations is in the form of compensation to employees. In 2012, it had 82 employees and its total personnel expenses, including payroll and fringe benefit tax, were $6.6 million.28
The Ta Ann story and financial performance of Forestry Tasmania are indicative of the problems associated with the historic approach to Tasmania’s forestry industry. Governments appear to see forestry as inherently good for Tasmania, irrespective of the sector’s economic performance, the opportunity cost of the capital, labour and natural resources used in the operations, and the broader environmental and social impacts. This has resulted in a tendency for governments to provide extensive subsidies to the sector, even when the operations are manifestly uneconomic.
26
Ta Ann Tasmania Pty Ltd (2006-2012), Annual Financial Reports. 27
Ibid. 28
Ibid.

29
Chipping away at Tasmania’s future
6 Strategic economic options for Tasmania’s forests
6.1 Biomass burning
Central to the realisation of the IGA/TFA’s aim of ensuring a ‘strong, sustainable and certain future’ for the forestry industry is finding an alternative market for low grade logs, particularly pulpwood. As the experience over the past five years has demonstrated, without a market for pulpwood, the hardwood sector is unviable. The Tasmanian government and forestry industry are currently considering several options, the major one being the use of forest biomass for energy production (burning trees to generate electricity or heat).
In the abstract, reorientating the hardwood forestry sectors toward bioenergy production looks like it might yield both economic and environmental benefits. The use of pulplogs and other residues to produce energy would provide a substitute for the export woodchip market, while simultaneously increasing renewable energy generation and lowering greenhouse gas emissions (or so the argument goes). Although appealing in the abstract, the claimed benefits of this strategy, like the claimed benefits of further support for logging more generally, are likely to be illusory.
From an economic perspective, the major stumbling block to forest biomass energy projects is that, without substantial government support, they are unlikely to be financially viable. The most obvious source of government assistance for these projects is the federal Large-scale Renewable Energy Target (LRET) scheme, which mandates that a prescribed amount of electricity must be obtained from renewable sources each year through to 2030.29 Plantation-sourced bioenergy production is currently eligible for Large-scale Generation Certificates (LGCs) under the LRET. Yet to date, there has been only one registered wood waste generator in Tasmania, Forestry Tasmania’s Tahune Woodgas power station, which has produced one certificate (in 2007).30 The fact there is such limited uptake of this option highlights how financially unviable plantation-based bioenergy production currently is. The use of native forests for bioenergy production is even less economic, primarily because harvest and haulage costs are significantly higher in native forests than plantations. The option of using native forest biomass for energy also faces a regulatory barrier; bioenergy projects involving the use of native forest biomass are not eligible for LGCs under the scheme regulations.
Even if these regulations are changed, with current policy settings, the use of biomass from native forests and plantations to produce energy is unlikely to yield any renewable energy or climate benefits. Because of the LRET, and the fact it
29
Renewable Energy (Electricity) Act 2000 (Cth). 30
Renewable Energy Certificate (REC) Registry (https://www.rec-registry.gov.au/home.shtml) (29 November 2013).

30
sets a mandatory amount of renewable electricity that must be generated each year, the use of forest biomass to generate electricity cannot increase renewable energy unless the relevant generators forgo the LGCs they qualify for. If the projects receive LGCs, they will merely displace other forms of renewable generation. That is, the wind, hydro, solar or bagasse that would have generated the electricity and received LGCs will be replaced by forest bioenergy while the total amount of renewable energy provided under the LRET remains the same. The outcome will be the same amount of renewable electricity generation and the same emissions from the electricity sector; the only difference being that there will be a switch in the type of generation. In order for forest bioenergy projects to displace fossil-based generation and reduce greenhouse gas emissions from the electricity sector, they would have to operate outside the LRET or the LRET target would have to be increased on account of their generation.
In the event that forest bioenergy projects did operate outside the LRET or the LRET target was raised, the emission intensity of the electricity sector would fall. However, Australia’s net greenhouse gas emissions should not change. This is a product of the fact Australia has annual caps (or limits) on its emissions under the Kyoto Protocol. The caps (called ‘quantified emission limitation and reduction objectives’) represent Australia’s emission allocation for the relevant commitment period, the second of which runs from 1 January 2013 through to the end of 2020. If Australia’s emissions exceed this allocation, it is required under international law to purchase offset credits from other countries, thereby ensuring its ‘net’ emissions are within the cap. If Australia’s emissions are below the allocation, it is entitled to carry the surplus into any future commitment period and use it to meet the associated mitigation obligations. This is what happened in the first commitment period (2008-2012); Australia’s cumulative emissions over this period are likely to be approximately 110-120 Mt CO2-e below Australia’s target. This surplus will be carried forward and used to meet Australia’s obligations in the second commitment period.
This feature of the Kyoto Protocol (which is typically seen as a virtue because it provides environmental certainty) ensures that any reductions in energy emissions that are attributable to forest bioenergy projects should not reduce Australia’s net emissions, they will merely alter where and/or when emissions occur. Conversely, any increase in emissions that arise from forest harvesting should not increase Australia’s net emissions, they will merely mean reductions must be found elsewhere in the economy (or overseas).
The positive and negative climate effects of forest harvesting and biomass use raise questions about their net effects if they are made additional to the LRET and thereby displace fossil-fuel energy production. In these circumstances, does forest harvesting leave Australia with a carbon debt or credit? To answer this question, modelling was undertaken using the Australian Government’s forest carbon

31
Chipping away at Tasmania’s future
model (FullCAM) and the harvested wood products model described in Macintosh (2012).31 Two representative 1 hectare forest plots were created in FullCAM, one Eucalyptus nitens (shining gum) plantation and a native tall eucalypt forest. It was assumed that the E. nitens plantation was established on cleared agricultural land (reforestation) and was harvested on 19-year rotations, producing 297 m3 of pulplogs in each harvest. In the absence of forest bioenergy production, all of the pulplogs were assumed to be chipped and exported for pulp and paper. If bioenergy production is available, 60 per cent of the harvested pulplogs were assumed to be used for energy, with the remainder going to pulp and paper.
The native tall eucalypt FullCAM forest plot was based on Forestry Tasmania data in Rothe (2013).32 The forest was assumed to be harvested on 80 year rotations, producing 191 m3 of pulplogs, 73 m3 of sawlogs and 48 m3 of peelers on harvest. Fifty per cent of the pulplogs were assumed to be allocated to bioenergy production, with the remainder being chipped for pulp and paper. A further 63 m3 of sub-pulpgrade logs and 16 m3 of solid dead wood was also used for bioenergy, in accordance with the assumptions in Rothe (2013). The proportion of live stem wood at the time of harvest allocated to sawlogs, peelers, pulplogs, bioenergy and deadwood with and without forest biomass generation is provided in Table 5. All rotten stem wood, branches, bark, leaves and roots were assumed to be left onsite post-harvest and not used for bioenergy production. Soil carbon was not modelled due to the associated uncertainties.
Table 5 Proportion of live stem wood at harvest allocated to sawlogs, peelers, pulplogs, bioenergy and deadwood
Allocation (per cent)
No bioenergy Bioenergy
Sawlog 18 18
Peelers 12 12
Pulplog 48 24
Bioenergy 0 40
Deadwood 22 6
Source: Rothe A (2013), Forest Biomass for Energy: Current and Potential Use in Tasmania and a Comparison with European Experience.
Where forest biomass energy production was undertaken, it was assumed to be additional to the LRET. Further, due to the characteristics of the Tasmanian
31
Macintosh A (2012), Tasmanian Forests Intergovernmental Agreement: An assessment of its carbon value. 32
Rothe A (2013), Forest Biomass for Energy: Current and Potential Use in Tasmania and a Comparison with European Experience.

32
electricity market, most particularly the high proportion of hydroelectric generation, it was conservatively assumed that the associated forest bioenergy production displaces electricity that would have been imported from Victoria. Victoria’s dependence on brown coal means the average carbon intensity of the imported electricity is currently 1.17 kg CO2-e per kilowatt hour (kWh), well above Tasmania’s average of 0.20 kg CO2-e/kWh.
There is uncertainty surrounding how the carbon intensity of the electricity grid might change in the future. To account for this, two scenarios were used: a ‘static technology’ scenario (where the carbon intensity of the displaced electricity remains unchanged throughout the projection period) and the ‘decarbonisation scenario’ (where the carbon intensity of the displaced electricity falls by 80 per cent over the next 50 years and then to almost zero beyond 2100).
E. nitens plantation
Reforestation increases the carbon stored in the live biomass, debris and harvested wood product pools and, in doing so, results in removals (credits) being recorded in Australia’s greenhouse accounts. The carbon stocks in the onsite and harvested wood product carbon pools in the E. nitens plantation without forest bioenergy production are shown in Figure 11. Figure 12 shows the associated cumulative credits recorded in the accounts over the first 200 years after the plantation is established (in the following figures, removals (credits) are shown as negatives, emissions (debits) as positives).
Figure 11 Carbon stocks in onsite and harvested wood product carbon pools, E. nitens plantation, first 200 years
0
20
40
60
80
100
120
140
1 8
15
22
29
36
43
50
57
64
71
78
85
92
99
10
6
11
3
12
0
12
7
13
4
14
1
14
8
15
5
16
2
16
9
17
6
18
3
19
0
19
7
t C
ha
Year C mass of trees C mass of debris HWP

33
Chipping away at Tasmania’s future
Figure 12 Cumulative carbon credits from E. nitens plantation, without forest bioenergy production, first 200 years
Using plantation-sourced forest biomass to produce energy provides additional abatement in this hypothetical by avoiding emissions from fossil fuel-based electricity generation (Figure 13). However, the magnitude of the abatement benefit depends on the assumptions regarding the carbon intensity of the electricity that is displaced. If fossil fuels remain the dominant source of electricity, the carbon benefits from plantation-sourced forest biomass generation increase through time. In the more realistic decarbonisation scenario, where renewable and other low- and zero-emission technologies gradually replace fossil fuels, there are still significant carbon benefits but they stabilise within three rotations (50-60 years).
-600
-500
-400
-300
-200
-100
0
0 7
14
21
28
35
42
49
56
63
70
77
84
91
98
10
5
11
2
11
9
12
6
13
3
14
0
14
7
15
4
16
1
16
8
17
5
18
2
18
9
19
6
t C
O2-
e
Year

34
Figure 13 Cumulative carbon benefit from E. nitens plantation, with forest bioenergy production, first 200 years
Native tall eucalypt forest harvesting
The carbon stocks in the onsite and harvested wood product carbon pools in the native tall eucalypt forest without forest bioenergy production over the first 500 years after the initial harvest event (six rotations) are shown in Figure 14 (the initial harvest event is also assumed to occur in an 80 year old forest).
Figure 14 Carbon stocks in onsite and harvested wood product carbon pools, first 500 years
-6000
-5000
-4000
-3000
-2000
-1000
0
0 7
14
21
28
35
42
49
56
63
70
77
84
91
98
10
5
11
2
11
9
12
6
13
3
14
0
14
7
15
4
16
1
16
8
17
5
18
2
18
9
19
6
t C
O2-
e
Year
Static scenario Decarbon scenario
0
50
100
150
200
250
300
350
400
450
1
18
35
52
69
86
10
3
12
0
13
7
15
4
17
1
18
8
20
5
22
2
23
9
25
6
27
3
29
0
30
7
32
4
34
1
35
8
37
5
39
2
40
9
42
6
44
3
46
0
47
7
49
4
tC h
a
Year C mass of live trees and dead stem woodC mass of debris (ex dead stem wood)HWP

35
Chipping away at Tasmania’s future
In contrast to the reforestation event, where the relevant land unit is initially in a non-forest state, the starting point of the analysis with the native forest plot is a standing tall eucalypt forest, which is then chopped down. This results in a large and immediate emission pulse. Ongoing decay of debris from harvesting and the release of carbon in short-lived wood products ensure there are also net emissions for roughly 20 years after the initial harvest event. Beyond 20 years, the effects of forest regrowth begin to dominate, providing a small annual removal until the time of the next harvest. The net outcome from the harvesting of the native forest is a ‘carbon debt’ (or net emissions), which is repaid when the cumulative removals over time equal the emissions from harvest. In this case, without forest bioenergy production, the carbon debt is not repaid over the rotation. The debt falls in the latter part of the cycle but is never quite reduced to zero (Figure 15).
Figure 15 Cumulative carbon debt from harvesting tall eucalypt forest, without forest bioenergy production, first 500 years
The use of a proportion of the forest biomass to produce energy changes the profile of the carbon debt. This is illustrated in Figure 16, which shows the carbon debt from the harvest event under the static technology and decarbonisation scenarios.
0
200
400
600
800
1000
1200
1400
1600
1800
0
17
34
51
68
85
10
2
11
9
13
6
15
3
17
0
18
7
20
4
22
1
23
8
25
5
27
2
28
9
30
6
32
3
34
0
35
7
37
4
39
1
40
8
42
5
44
2
45
9
47
6
49
3
t C
ha
Year
36
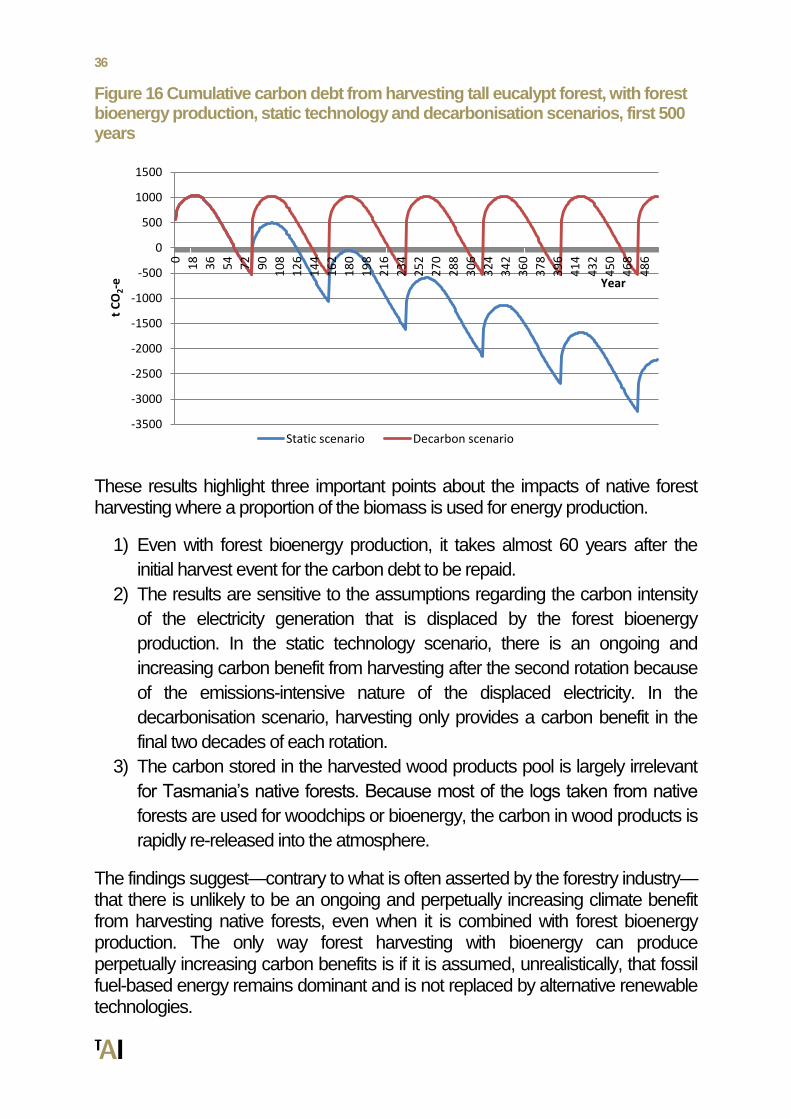
Figure 16 Cumulative carbon debt from harvesting tall eucalypt forest, with forest bioenergy production, static technology and decarbonisation scenarios, first 500 years
These results highlight three important points about the impacts of native forest harvesting where a proportion of the biomass is used for energy production.
1) Even with forest bioenergy production, it takes almost 60 years after the
initial harvest event for the carbon debt to be repaid.
2) The results are sensitive to the assumptions regarding the carbon intensity
of the electricity generation that is displaced by the forest bioenergy
production. In the static technology scenario, there is an ongoing and
increasing carbon benefit from harvesting after the second rotation because
of the emissions-intensive nature of the displaced electricity. In the
decarbonisation scenario, harvesting only provides a carbon benefit in the
final two decades of each rotation.
3) The carbon stored in the harvested wood products pool is largely irrelevant
for Tasmania’s native forests. Because most of the logs taken from native
forests are used for woodchips or bioenergy, the carbon in wood products is
rapidly re-released into the atmosphere.
The findings suggest—contrary to what is often asserted by the forestry industry—that there is unlikely to be an ongoing and perpetually increasing climate benefit from harvesting native forests, even when it is combined with forest bioenergy production. The only way forest harvesting with bioenergy can produce perpetually increasing carbon benefits is if it is assumed, unrealistically, that fossil fuel-based energy remains dominant and is not replaced by alternative renewable technologies.
-3500
-3000
-2500
-2000
-1500
-1000
-500
0
500
1000
15000
18
36
54
72
90
10
8
12
6
14
4
16
2
18
0
19
8
21
6
23
4
25
2
27
0
28
8
30
6
32
4
34
2
36
0
37
8
39
6
41
4
43
2
45
0
46
8
48
6
t C
O2-e
Year
Static scenario Decarbon scenario

37
Chipping away at Tasmania’s future
The above analysis ignores the international accounting rules by assuming that all emissions and removals associated with the management of native forests are recorded in Australia’s greenhouse accounts. Under the Kyoto Protocol, emissions and removals from the accounting sector known as ‘forest management’, which includes public native forests that are subject to harvest, are accounted for using a baseline-and-credit system. Essentially, if a native forest would have been harvested under a historically determined forest management reference case—based on national harvesting levels over the period 2002 to 2009—the associated emissions and removals are not recorded. Australia only makes a forest management entry in its accounts if there is a deviation from the reference case. For example, if a forest that would have been harvested in the reference case is left standing, Australia will receive forest management credits for a period of 10-30 years that can be used to offset emissions from other sectors (provided another forest is not harvested as a result of conserving the first forest), followed by small annual debits until the time of the next harvest.33 The debits arise because, in avoiding a harvesting event, you also forgo the removals that would have arisen from the regrowth of the harvested forest. Figure 16 shows the forest management entries that would be made if the tall eucalypt forest was conserved, assuming the reference case does not include forest bioenergy production. Australia would receive 2,055 t CO2-e of forest management credits over the first 29 years after the initial harvest event and would then record 1,213 t CO2-e of debits over the remaining 51 years in the harvest cycle, leaving it with a net credit of 842 t CO2-e for the rotation.
Figure 16 Forest management credits and debits from conserving the tall eucalypt forest, without forest bioenergy production, first 500 years
33
This analysis assumes the existing forest management accounting rules apply beyond 2020.
-1200
-1000
-800
-600
-400
-200
0
200
1
19
37
55
73
91
10
9
12
7
14
5
16
3
18
1
19
9
21
7
23
5
25
3
27
1
28
9
30
7
32
5
34
3
36
1
37
9
39
7
41
54
33
45
1
46
9
48
7
t C
O2-
e
Years

38
The net credits that could be generated by conserving native forests constitutes the true carbon cost (the opportunity cost in carbon terms) of harvesting. Figure 17 shows the carbon debt from harvesting when it is calculated against the credits that would arise if the forest was left standing (called the ‘effective carbon debt’), both with and without forest bioenergy production, under the decarbonisation scenario. The use of forest biomass for energy production does not have a material impact on the forest management entries associated with harvesting. However, by displacing electricity generation from other sources, it reduces the energy emissions that are recorded in Australia’s accounts. The effective carbon debt results in Figure 17 incorporate these displacement effects.34
Figure 17 Cumulative ‘effective carbon debt’ from harvesting tall eucalypt forest, with and without forest bioenergy production, decarbonisation scenario, first 500 years
Whether or not forest biomass is used for energy production, the harvesting of native forests results in a large and enduring ‘effective carbon debt’. In the scenario without bioenergy production, the effective debt is 842 t CO2-e over the first rotation and 893 t CO2-e in subsequent rotations. The use of some of the forest biomass for energy lowers the effective debt; to 300 t CO2-e in the first rotation and 339 t CO2-e in the later rotations. However, because of the size of the emission pulse from harvesting and associated opportunity to generate credits, native forest harvesting will almost always result in an effective carbon debt
34
Other project-related fossil emissions were omitted from the analysis (e.g. emissions associated with harvesting, haulage and log processing).
0
500
1000
1500
2000
2500
3000
1
18
35
52
69
86
10
3
12
0
13
7
15
4
17
1
18
8
20
5
22
2
23
9
25
6
27
3
29
0
30
7
32
4
34
1
35
8
37
5
39
2
40
9
42
6
44
3
46
0
47
7
49
4
t C
O2-
e
Year No bioenergy Bioenergy
39
Chipping away at Tasmania’s future
throughout each rotation. The only major exception to this is if the harvesting is combined with bioenergy production and the electricity that is displaced by the biomass production continues to be fossil-intensive.
The other notable implication of these results is that, because of the profile and magnitude of the effective carbon debt, harvesting native forests is likely to impose a significant carbon-related financial cost on taxpayers. If it is assumed the equivalent carbon price in 2014 is $10 (e.g. the average cost of abatement under the Abbott Government’s Emissions Reduction Fund) and increases by three per cent (real) per annum, the net present value of the carbon cost from harvesting over the first 80 year rotation is $16,611 per hectare (real 2014 dollars) if there is no bioenergy production (using the Australian government’s preferred real discount rate of 7 per cent). With bioenergy production, the cost is reduced but is still $11,259 per hectare.
6.2 Carbon credits
Given the diminutive returns from native forestry, the magnitude of the effective carbon debt, and the other environmental costs of native forest harvesting, there is a strong case that the most economic use of the public native forest estate that is available for harvest after the TFA is for carbon credits. As the above analysis shows, the cessation of harvesting would result in forest management offset credits being recorded in Australia’s greenhouse accounts. These credits would only provide a direct financial benefit to the Australian government. For the Tasmanian government to benefit from the cessation of harvesting, an avoided native forest harvesting offset project would have to be created under the Carbon Farming Initiative (or Emissions Reduction Fund if it replaces the Carbon Farming Initiative).
The Carbon Farming Initiative is a project-based, baseline-and-credit offset scheme that operates in a manner similar to the accounting rules for forest management. For each project, a baseline is determined, which is supposed to reflect the net emissions from the activity in the absence of the abatement project. If the actual net project emissions are below the baseline, the project proponent receives offset credits (known as Australian carbon credit units or ACCUs) that can be sold into compliance or voluntary carbon markets. If the Gillard Government’s carbon pricing scheme is not repealed, the primary source of demand for any ACCUs generated by an avoided native forest harvesting project would be polluters (liable entities) under the scheme, who can use the credits to meet their liabilities. In the event that the carbon pricing scheme is terminated and replaced with the Emissions Reduction Fund, it is anticipated that ACCUs will be able to be sold to the Australian Government through the fund.

40
To evaluate how many ACCUs could be generated by ending native forest harvesting in the public native forest estate that is available for harvest after the TFA, a further modelling exercise was undertaken, again using FullCAM and the harvested wood products model described Macintosh (2012). The estimated forest type characteristics of the remaining production areas in the Tasmanian public estate are shown in Table 6. Two broad representative forest plots were used to model harvest events and subsequent regrowth in the estate. These plots were designed to reflect a low eucalypt and tall eucalypt forest, with the characteristics described in Rothe (2013). Based on harvest statistics from the period 2009-2013, it was estimated that the ‘net area’ subject to harvest each year in the baseline was 5,184 ha, of which 63 per cent was tall eucalypt forest. The remainder was assumed to be low eucalypt forest (rainforest and other native forest were modelled as low eucalypt). Forests were assumed to be harvested between 70-90 years in all years, with a mean rotation length of 80 years.
Table 6 Tasmania public native forest production areas remaining after the TFA
Forest type Area (ha)
Tall eucalypt 222,300
Low eucalypt 83,200
Rainforest 44,200
Other native forest 4,550
Total 353,600
Source: CO2 Australia Ltd (2012), Tasmanian Forest Carbon Study; Rothe, A (2013), Forest Biomass for Energy: Current and Potential Use in Tasmania and a Comparison with European Experience.
Under the rules of the Carbon Farming Initiative, all sequestration projects like avoided native forest harvest are subject to a five per cent risk of reversal buffer. Deductions may also be required to account for leakage (the potential for increased forest harvesting elsewhere in Australia as a result of the conservation of a forest). In this case, in addition to the five per cent deduction for the risk of reversal, a further five per cent was deducted for leakage.
There is currently no methodology for avoided native forest harvesting projects under the Carbon Farming Initiative. This creates uncertainty about exactly how the credits will be allocated and over what timeframe. To account for this uncertainty, the results are presented in three formats: (a) in accordance with the way forest management credits are recorded in Australia’s greenhouse accounts; (b) the average stock difference over 100 years in each forest plot, assuming only one harvest event can be avoided, all plots would have been harvested in 2014 and the credits are allocated over 40 years; and (c) the average stock difference over 100 years across the estate, assuming only one harvest event can be

41
Chipping away at Tasmania’s future
avoided, 5,184 ha is harvested each year through to 2082 (i.e. when the entire productive area would have been harvested once) and the credits are allocated over 40 years. The results are presented in Table 7.
Table 7 Carbon credits for Tasmania from stopping harvesting on the remaining estate
Credits (million ACCUs)
As forest management credits are recorded
2014-2033 total 133.3
2014-2033 mean 6.7
Stock difference when all plots harvested in 2014
Total 379.8
2014-2033 mean 9.5
Stock difference when plots progressively harvested over 2014-2082
Total 297
2014-2033 mean 7.4
The value of the credits was estimated using the equivalent carbon price path described above (a starting price of $10 in 2014, increasing by 3 per cent (real) per annum through to the end of the projection period). The net present value of the credits over the period 2014-2033 was calculated using a seven per cent real discount rate. The results are presented in Table 8.
Table 8 Net present value of carbon credits, 2014-2033
Allocation method NPV (real 2014 $ millions)
As forest management credits are recorded
919
Stock difference when all plots harvested in 2014
1,355
Stock difference when plots progressively harvested over 2014-2082
1,059
The results from this modelling exercise suggest the Tasmanian Government could earn a considerable financial return from stopping harvesting in the remaining productive areas of the public native forest estate. Depending on the allocation method, the credits are likely to amount to between 6.7-9.5 million per

42
year over the period 2014-2033. The net present value of these credits, with a seven per cent real discount rate, was estimated at between $900 million and $1.4 billion. These returns would far outstrip any likely direct financial benefits to the Tasmania government from harvesting and processing native logs, and could even match the industry gross value added from native forestry (growing, maintaining, harvesting and processing native forest products), before accounting for the flow-on benefits from the expenditure of the carbon revenues and reallocation of labour and capital resources.
These results are subject to several caveats. Before the project could proceed, avoided public native forest harvesting projects would have to be made eligible to participate in the Carbon Farming Initiative (or the Emissions Reduction Fund) and a methodology would have to be developed. The representative forest plots used here are based on broad forest type averages. A more detailed method derived from on a more complete forest dataset could produce higher or lower credit estimates. It is also possible the Australian Government may require a declining baseline to account for the state of the native forest sector and possibility it could continue to contract.
A further complication is that, during the second commitment period of the Kyoto Protocol (2013-2020), forest management credits are subject to a 3.5 per cent cap, which equates to a limit of approximately 15.4 Mt CO2-e per annum. Due to the demise of the native forest sector nationally, there is a possibility this cap will be reached or exceeded, particularly if native forest harvesting in Tasmania is stopped immediately. If the cap was exceeded, any ACCUs generated by the proposed project above the cap would not be able to be counted towards Australia’s mitigation obligations and it is unlikely they would be eligible for sale into the Emissions Reduction Fund. To avoid this, the Tasmanian government could structure the project to allow for a staged withdrawal from native forests. This would allow it to generate some credits in the short-term to facilitate the required structural change, while ensuring the majority of the credits accrue after 2020 when the cap is unlikely to apply.

43
Chipping away at Tasmania’s future
7 Where should governments target their support?
Governments usually justify the provision of subsidies to industry on the grounds they create employment and enhance social welfare. Although this is sometimes true, there is significant risk with all subsidy programs that they will have the opposite effect, lowering social welfare by incentivising rent seeking and diverting labour and capital to less productive activities. Due to these risks, conventional economics cautions against the provision of subsidies and suggests they should only be provided where there is persuasive evidence they will generate net benefits to society.
In the case of the forestry industry, there are several issues that suggest it is a poor target for further government support, including:
relevant domestic and international wood fibre and product markets are highly competitive and most of the competition is based on price rather than quality;
the industry is highly cyclical, experiencing sharp downturns every 10-15 years;
the long-term history of the industry has illustrated that it generates low returns relative to other industries and is likely to require ongoing government assistance;
the industry is not labour intensive, meaning it generates fewer jobs per dollar of government assistance than many other industries;
there are significant externalities associated with forestry; and
as demonstrated in Section 6, there is a viable alternative use for native forests that is likely to generate significant positive financial returns.
There are also a number of alternatives for where government resources could be directed that are likely to yield greater social benefits than continuing to subsidise the forestry industry. One option would be to improve public services like education. Similar to the case with its economic performance, Tasmania lags behind the rest of Australia on education outcomes. Recent findings from the Programme for International Student Assessment indicate that Tasmanian students perform significantly below the national average in mathematical, scientific and reading literacy, and that student outcomes have declined over the past decade.35 Data compiled by the International Association for the Evaluation of Educational Achievement, in conjunction with the Australian Council for Educational Research, in late 2012 found similar results.36 Consistent with these findings, Tasmania scores below the national average on socio-economic
35
Thomson S et al (2013), PISA 2012: How Australia Measures Up. 36
Thomson S et al (2012), Highlights from TIMSS & PIRLS 2011 from Australia’s Perspective.

44
indices,37 and the relationship between socio-economic background and educational achievement is stronger in Tasmania than any other Australian jurisdiction with the exception of the Northern Territory.38 While the Australian government has recently undertaken to increase its investment in Tasmania’s schools, there appears to be scope for more resources to be made available for education and training, including at the tertiary level.
Another alternative to providing continued forestry subsidies is to direct the resources to other industries that have better long-term prospects. Targeted assistance could be provided to parts of the service sector, for example. Three of the fastest growing segments of the Tasmanian economy in the past five years have been professional, scientific and technical services (8 per cent per annum since 2008), education and training (7 per cent per annum) and health care and social assistance (6 per cent per annum).39 Although they attract relatively little public attention, these are the types of areas where, if further assistance is to be provided, governments should be concentrating on.
In the case of education and training, Tasmania has a number of characteristics that are likely to appeal to overseas students wanting to study in Australia, including affordable accommodation, compact cities (Hobart and Launceston), and a unique natural environment. The same attributes could also draw a large number of retirees to Tasmania, which in turn could create substantial employment in services industries. Tourism is another services alternative. In recent times, Tasmania’s tourism industry has been adversely affected by the post-GFC economic slowdown and high Australian dollar. Yet it is likely to have better long-term prospects than forestry and is unlikely to require the same levels of ongoing government support.
One of the most appealing aspects of the services sector in the context of subsidies is that it is relatively labour intensive. This is illustrated in Table 9, which shows the number of jobs per $1 million in income in forestry and logging, wood product manufacturing and pulp and paper manufacturing, compared to the equivalent figure from selected service industries. Generally, forestry is less labour intensive (or more capital intensive) than most service industries, meaning it is likely to create fewer jobs per dollar of government assistance.
37
ABS (2013e), Socio-economic Indexes for Areas (SEIFA), Australia, 2011, Cat. No. 2033.0.55.001. 38
Thomson S et al (2013), PISA 2012: How Australia Measures Up. 39
ABS (2013a), Australian National Accounts: State Accounts, Cat. No. 5220.0.

45
Chipping away at Tasmania’s future
Table 9 Labour intensity of selected industries
Industry Jobs per $1 million in sales and services income, 2011-
12
Forestry and logging 4.8
Wood product manufacturing 3.8
Pulp and paper manufacturing 1.9
Total manufacturing 2.3
Agriculture 6.9
Accommodation and food services 11.0
Professional, scientific and technical services 5.7
Education and training (private) 19.5
Health care and social assistance (private) 14.1
Arts and recreational services 7.2
Source: ABS (2013f), Australian industry, 2011-12, Cat. No. 8155.0.

46
8 Conclusion
For decades, Tasmania has suffered a kind of resource curse, in which the state’s policy makers have placed undue emphasis on primary industries, particularly forestry, at the expense of the broader economy. Consistent with various institutional explanations of resource curse, a dependent relationship has developed between the Tasmanian political class and the forestry industry that has entrenched poor policies.40 The forestry industry has received significant public subsidies as a result of this relationship, often under the pretext of value adding to wood production. Despite this support, including through the IGA/TFA, the industry has contracted and is likely to continue to decline in the foreseeable future.
The debate around the degree of taxpayer support for the forestry industry in Tasmania has generally ignored the opportunity costs associated with the subsidies. That is, what are the likely economic returns from alternative uses of the resources that are devoted to forestry? This tendency is evident in the current interest among Tasmanian policy makers with forest bioenergy production. Using biomass from plantations and native forests for energy production is seen as solution to the forestry sector’s malaise. Where the biomass is derived from plantations, bioenergy production could offer both environmental and economic benefits. By providing an additional market for pulpwood, it could help incentivise the retention and even expansion of the plantation estate and, in doing so, reduce Australia’s net greenhouse gas emissions and, in some cases, even provide biodiversity and other environmental benefits. However, notwithstanding the potential climate and environmental benefits, the greatest obstacle to plantation-based bioenergy projects is that they are not financially viable. They are already eligible for assistance under the LRET but have not occurred because of the economic obstacles.
In the case of native forest-based bioenergy projects, they offer neither environmental nor economic benefits. They are unlikely to increase the amount of renewable energy generation or reduce greenhouse gas emissions, and are less economically viable than those based on plantation feedstock.
The most profitable use of the public native forest estate is likely to be conservation, where the forests are used to generate carbon credits. The analysis presented in Section 6 suggests preserving the remaining 350,000 ha of native production forests could provide the Tasmanian Government with 6.7-9.5 million carbon credits per year over the period 2014-2033, worth an estimated $0.9-$1.4 billion in 2014 dollars.
40
Van der Ploeg F (2011), Natural Resources: Curse or Blessing?

47
Chipping away at Tasmania’s future
The revenues from the sale of carbon credits from native forests could be used to expand and diversify the remainder of the Tasmanian economy. Professional, scientific and technical services, and education and training, have both grown by in excess of seven per cent per annum since 2008. These are the types of areas where Tasmania has the capacity to generate sustainable growth. Tourism and food production are also obvious strengths. In 2011-12, expenditure on tourism was broken down into the type of experiences people had. Just over 50 per cent was food and wine, and roughly a quarter each for nature-based and then culture and heritage. The tourist sector and Tasmania’s food industry feed off each other and, while both have been negatively affected by the high Australian dollar, they are likely to have a positive future. This is in stark contrast to the native forest sector, which is facing shrinking markets and large accumulated loses.
A staged withdrawal from native forestry could help revive Tasmania’s fortunes. There would be obvious biodiversity, heritage and climate benefits but the real attraction of this option lies in the economic realities. Continued harvesting will bring further financial losses for the state. In contrast, using the forests to generate carbon credits will provide much needed revenues for the government, which could be used to restructure the economy and revitalize the state.
Forestry has been at the heart of Tasmania’s political debates for decades but, as the data presented above makes clear, these industries are peripheral to the Tasmanian economy. If policy makers continue to place the interests of the dwindling forestry industry at the heart of their plans for Tasmania’s economy then the gap between the Tasmanian economy and the mainland economy will only continue to grow. The question that should be top of mind for federal and state policy makers is not ‘do we want a forestry industry or don’t we’ but, if we were going to invest hundreds of millions of dollars in an industry, which industry would create the most jobs and the most economic growth? It is clear that the answer to the second question is not forestry.

48
References
Ajani (2007), The Forest Wars, Melbourne University Press, Melbourne.
AusIndustry (undated), Tasmania Innovation and Investment Fund: List of applicants to be offered funding, Commonwealth of Australia, Canberra.
Australian Broadcasting Corporation (ABC) (2013), ‘Family loophole lets contractors back in native forests’, available at: http://www.abc.net.au/7.30/content/2013/s3783692.htm.
Australian Bureau of Agricultural and Resource Economics and Sciences (ABARES) (2013), Australian Forest and Wood Products Statistics, Commonwealth of Australia, Canberra.
Australian Bureau of Statistics (ABS) (2013a), Australian National Accounts: State Accounts. Cat. No. 5220.0, Commonwealth of Australia, Canberra.
Australian Bureau of Statistics (ABS) (2013b), Australian Demographic Statistics, Cat. No. 3101.0, Commonwealth of Australia, Canberra.
Australian Bureau of Statistics (ABS) (2013c), Average Weekly Earnings. Cat. No. 6302.0, Commonwealth of Australia, Canberra.
Australian Bureau of Statistics (ABS) (2013d), Labour Force, Australia, Detailed. Cat. No. 6291.0.55.003, Commonwealth of Australia, Canberra.
ABS (2013e), Socio-economic Indexes for Areas (SEIFA), Australia, 2011, Cat. No. 2033.0.55.001, Commonwealth of Australia, Canberra.
ABS (2013f), Australian industry, 2011-12, Cat. No. 8155.0, Commonwealth of Australia, Canberra.
Australian Conservation Foundation et al (2012), Tasmanian Forest Agreement 2012, Commonwealth of Australia, Canberra.
Australian Government (2013a), Tasmanian Jobs and Growth Plan, Commonwealth of Australia, Canberra.
Australian Government (2013b), Budget Measures: Budget Paper No. 2, Commonwealth of Australia, Canberra.
Australian Government (2013c), Australia’s Federal Relations: Budget Paper No. 3, Commonwealth of Australia, Canberra.
49
Chipping away at Tasmania’s future
Australian Government (2013d), Portfolio Budget Statements 2013-14: Budget Related Paper 1.1, Agriculture, Fisheries and Forestry Portfolio, Commonwealth of Australia, Canberra.
Australian Government (2013e), Portfolio Budget Statements 2013-14: Budget Related Paper 1.17, Sustainability, Environment, Water, Population and Communities Portfolio, Commonwealth of Australia, Canberra.
Australian Government (2013f), Portfolio Budget Statements 2013-14: Budget Related Paper 1.12, Industry, Innovation, Climate Change, Science, Research, and Tertiary Education Portfolio, Commonwealth of Australia, Canberra.
Australian Government and Tasmanian Government (2011), Tasmanian Forests Intergovernmental Agreement, Commonwealth of Australia, Canberra.
Australian National Audit Office (2008), Tasmanian Forest Industry Development and Assistance Programs, Commonwealth of Australia, Canberra.
Australian National Audit Office (2013a), Administration of the Tasmanian Forests Intergovernmental Agreement Contractors Voluntary Exit Grants Program.
Australian National Audit Office (2013b), Senate Rural and Regional Affairs and Transport References Committee Inquiry into Tasmanian Forestry Grants Programs – Submission.
CO2 Australia Ltd (2012), Tasmanian Forest Carbon Study, Tasmanian Government, Hobart.
Crean S (2012), Stronger Regions, Stronger Nation, Commonwealth of Australia, Canberra.
Dargavel J (1995), Fashioning Australia’s Forests, Oxford University Press, Melbourne.
Ernst & Young (2011), Evaluation of the Tasmanian Community Forest Agreement Industry Development Program, Commonwealth of Australia, Canberra.
Forestry Tasmania (2001-2008), Annual Reports. Forestry Tasmania, Hobart.
Forestry Tasmania (2009-2013), Stewardship Reports. Forestry Tasmania, Hobart.
Forestry Tasmania (2007-2008), Sustainable Forest Management Reports. Forestry Tasmania, Hobart.

50
Macintosh A (2012), Tasmanian Forests Intergovernmental Agreement: An assessment of its carbon value, Commonwealth of Australia, Canberra.
Macintosh A (2013), The Australian native forest sector: causes of the decline and prospects for the future, The Australia Institute, Canberra.
Parliamentary Joint Committee on Corporations and Financial Services (2009), Aspects of agribusiness managed investment schemes, Commonwealth of Australia, Canberra.
Private Forests Tasmania (2001-2013), Annual Reports. Private Forests Tasmania, Hobart.
Rothe A (2013), Forest Biomass for Energy: Current and Potential Use in Tasmania and a Comparison with European Experience, University of Applied Sciences, Weihenstephan.
Schirmer J, Dunn C, Loxton E and Dare M (2011), Socioeconomic Impacts of Forest Industry Change: A Baseline Study of the Tasmanian Forest Industry, CRC for Forestry, Hobart.
Senate Select Committee on Agricultural and Related Industries (2010), Food production in Australia, Commonwealth of Australia, Canberra.
Senate Standing Committee on Rural and Regional Affairs and Transport (2013), Auditor-General's reports on Tasmanian Forestry Grants Programs, Commonwealth of Australia, Canberra.
Ta Ann Tasmania Pty Ltd (2006-2012), Annual Financial Reports, Tasmania.
Tasmanian Department of Economic Development, Tourism and the Arts (2013), Tasmania’s International Exports: 2012 – 2013, Tasmanian Government, Hobart.
Thomson S et al (2012), Highlights from TIMSS & PIRLS 2011 from Australia’s Perspective, Australian Council for Educational Research, Camberwell, Victoria.
Thomson S, De Bortoli L and Buckley S (2013), PISA 2012: How Australia Measures Up, Australian Council for Educational Research, Camberwell, Victoria.
Van der Ploeg F (2011), ‘Natural Resources: Curse or Blessing?’, Journal of Economic Literature, vol. 49(2), pp. 366-420.

51
Chipping away at Tasmania’s future


53
Chipping away at Tasmania’s future
About TAI
The Australia Institute is the country’s most influential progressive think tank. Based in Canberra, it conducts research on a broad range of economic, social and environmental issues in order to inform public debate and bring greater accountability to the democratic process.
The Institute is funded by memberships, donations from philanthropic trusts and individuals, and commissioned research. With no formal political or commercial ties, the Institute is in a position to maintain its independence while advancing a vision for a fair and progressive Australia.
Our philosophy
With new dilemmas confronting our society and our planet, a better balance is urgently needed. Unprecedented levels of consumption co-exist with extreme poverty. Technology has connected humanity as never before, yet civic engagement is declining. Environmental neglect continues despite heightened ecological awareness. If genuine progress is to be achieved, conscience, equity and concern for the future must be the guiding principles of our democracy. Socially just, environmentally responsible and economically viable solutions are possible but only if insightful questions are combined with excellent research.
Who is The Australia Institute?
The Australia Institute’s board represents a range of views and priorities, and its staff includes policy experts from fields as diverse as economics, public health and law. What unites us is a belief that, through a combination of research and creativity, we can develop the new ideas and practical policy solutions that a progressive Australia needs.
Support the work of The Australia Institute
With your support we will be able to expand our influential program of research that matters.
You can offer your support via the website www.tai.org.au or by contacting our office on 02 6130 0530.

54
Papers available from The Australia Institute
Fear, J., Denniss, R., What you don’t know can hurt you: How market concentration threatens internet diversity, August 2011.
Hoisington, C., Rough trade: How Australia’s trade policies contribute to illegal logging in the Pacific Region, October 2010.
Fear, J., Denniss, R. and Richardson, D., Money and Power: The case for better regulation in banking, August 2010.
Richardson, D, The impact of the recession on women, August 2009.
Fear, J and Denniss, R, Zero-sum game? The human dimensions of emissions trading, August 2009.
Collett, L, A fair-weather friend: Australia’s relationship with a climate-changed Pacific, July 2009.
Fear, J, Go Away Please: The social and economic impact of intrusive marketing, December 2008.
Fear, J and Pace, G, Choosing Not to Choose: Making superannuation work by default, November 2008.
Saddler, H and King, H, Agriculture and Emissions Trading: The Impossible Dream? October 2008.
Harris Rimmer, S, The Dangers of Character Tests, October 2008.
Edgar, G, Agreeing to disagree: Maintaining dissent in the NGO sector, August 2008.
Fear, J, Choice Overload: Australians coping with the new financial order, May 2008.
Hamilton, C, Downie, C and Lu, Y, The State of the Australian Middle Class, October 2007.
Macintosh, A, Climate Change and Australian Coastal Shipping, October 2007.
Fear, J, Under the Radar: Dog-Whistle Politics in Australia, September 2007.
Hamilton, C and Downie, C, University Capture: Australian universities and the fossil fuel industries, June 2007.
Macintosh, A and Downie, C, A Flight Risk? Aviation and climate change in Australia, May 2007.