china's changing land
TRANSCRIPT
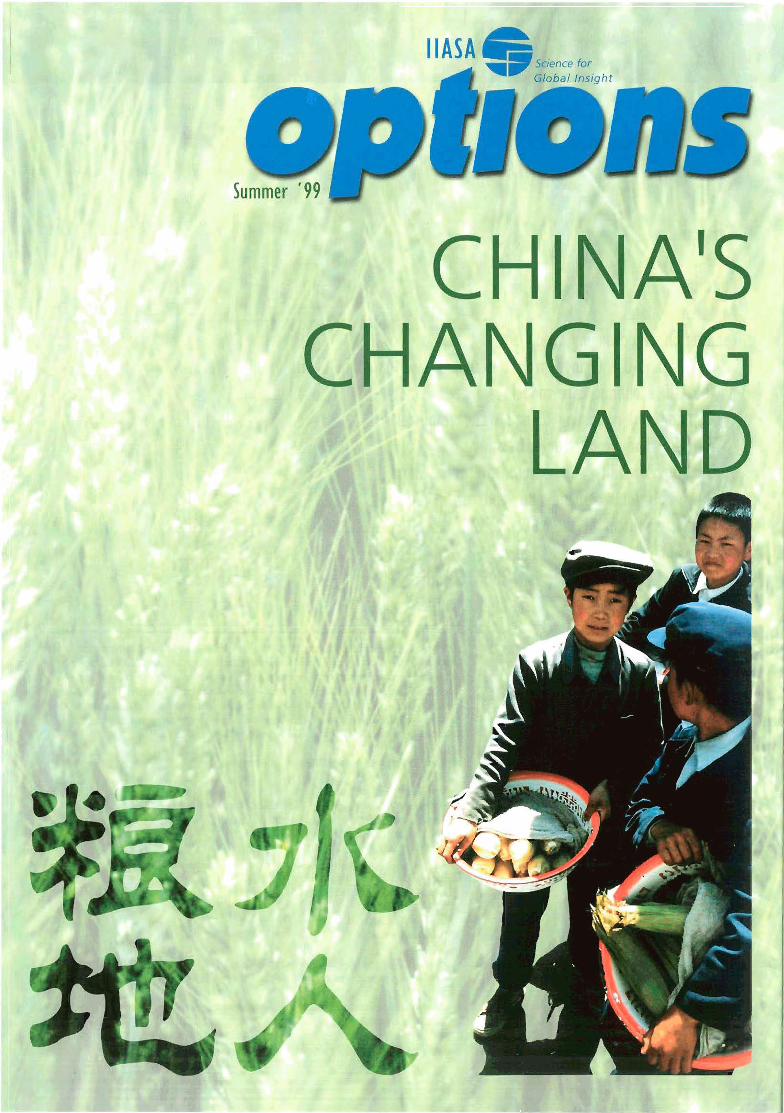
CHINA'S CHANGING
LAND -
Options Summer 1999
Contents
... back cover
..... 3. 4
..........6. 9
.. 11141618
. .. .21..22
ChinaChina
Editorial ..Research UpdatesFeature: China's changing land
IIASA's Land-Use Change project examines land issues In ChinaThe LUC economic core model .Planning and managing China's water resourcesThe LUC land productivity assessmentClimatic variability and extreme events In
Population, food demand and land use In
Human resources of the LUC project.. ..Inside IIASACan China feed itself? Order new IIASA CD-ROM
Opliolls is a llJ:lgazin{' reaturing the <lctivilies of the Internaiiol1<l1 Institute forApplied Systems Analysis O)ASA), located in Laxenburg. Austria. IIASA is an interdisciplinary, nongovernmental resea,n:h institution sponsored by a consortium ofNational Member Organizations in Asia. Europe and North America. The Institute'sresearch focuses on suslflinability and the human dimensions of global change. Thestudies arc inlerniltional and interdisciplinary, providing timely and relevantinsights for the scientific community. policynwkers .md the public.
Optio1lS is prepared by the Office of Information.
Editor: Mary Ann WilliamsContributing Editors: Margtlrel Mtlc;Donald. CYllthi<l EnzlllPrgf'rDesign: Vander Week Graphics/Gatlfried HinkerPrinted by Holzhausen. ViennaCopyright CI 1999
IIASA A-2361 Laxenburg. AustriaPhone: +43 2236 807Fax: +43 223671313E-mail: [email protected]: www.iiasa.ac.at
Sections or 0/)/;0115 may be reproduced with acknowledgment 10 IlASA. Please senda copy of ,my reproduced material to the Office of Informatioll.
The views and opinions expressed herein do not necessarily represent the positionsof IIASA or its Sllpporting organizations.
Primcd on chlorine-free. rCl"yclahlc paper Cover photo: GUnther Fischer
2

Editorial
A major challenge affecting the useful- ness of policy-oriented analyses is to communicate results in a way that effectively provides policymaken and their advisors with helpful insights. Traditionally, policymakers learn of research results through printed docu- ments or briefing sessions. Most of them prefer the latter means which allow them to interact verbally with analysts in a nonlinear way that is not possible with printed materials, and to explore a wide range of policy options with the experts. However, the limited number of policy analysts available to hold these briefing sessions reduces the opportuni- ty for this preferred, helpful means of
changes in the country's population, the diet preferred by that population, the rate of urbanization, agricultural and economic policies, and changes in tech- nology. The CD-ROM includes charts, diagrams, maps, and satellite images, together with the analysis, organized into a web of thousands of links. A number of questions regarding various sectors of the Chinese economy provide the underlying organization of the pre- sentation. What are the major trends in a particular sector? What is the impact of these trends on China's food security? How reliable are the empirical data? How large is the error that can be expected from projecting current trends
Gordon J. MacDonald. Director
interaction. over 50 years? Can policy measures This issue of Options focuses on the affect these trends? What are the costs research conducted by IlASA's LUC pro-
As the complexity of issues facing soci- of such policy interventions? ject. LUC's study of China's land and ety increases, researchen must explore water use, food prospects, and economy new and more effective means of com- The analysis and presentation empha- is key to understanding sustainability in municating the results of their policy- size the many sides of the food equation a world region that comprises huge land driven work. IIASA's project on as well as the reliability of the data. The masses and a large portion of the world's Modeling Land-Use and Land-Cover impact of innovations in technologies population (almost one-fourth), and that Changes in Europe and Northern Asia and improvements in management has reached a critical stage in its rapid [LUC) has pioneered an innovative receive particular attention. socioeconomic, environmental, and example of an interactive, nonlinear political development. The project's way to meet this need. LUC researcher LUC's new CD-ROM serves as an excel- broad activities in this region of immense Gerhard Heilig has developed a CD-ROM lent example of how researchers can importance are key to analyzing both based on his and his colleagues' and should take advantage of the rapid- regional driving forces and regional research on China's future food ly evolving electronic revolution to pro- implications of global process . prospects, a complex topic of serious vide alternative. useful means of com- political concern. In essence, the CD- munication between analysts and deci- ROM is a h y p e r l i e d document that sion makers. In the future, LlASA will draws attention to the multi-dimensional continue to explore new ways of nature of China's food security problems. enhancing this interaction, building on Whether China can feed itself depends Heilig's innovative approach. not only on the availability of arable land and water resources, but also on
Options Summer 1999

I Research Updates
Accession to the EU: A Continuation of or a Departure from Transition Reforms?
Since the start of the political and eco- nomic transition in Central and Eastern Europe, much of the transformation was embedded in the process of leaving the Eastern alliance and joining the Western pan of Europe. However, the changes associated with EU accession conflict in many ways with the pattern of the transformations these countries went through in the early 1990s. How much of a problem is this change in the pat- tern of transformation? The challenges associated with EU accession are dii- cussed in a recent IlASA Interim Report titled Accession to the EU: A Continuation of or a Departure Jmm Transition ReJom?
The next reforms are less autonomous and more externally guided than the previous round. However, EU member- ship means not only obedience to rules imposed from the outside, but also new opportunities for co-decision within the Union. In addition, many of the future reforms, including strictly EU-related ones, still leave a certain autonomy for the candidate countries.
The transformation of the reform agen- da into a planned and scheduled process in the candidate countries is unavoid- able, and the strict program of the insti- tutionalized pre-accession negotiations and evaluations provides a good base for such a process. A special problem in the candidate countries is how to sepa- rate EU-related reforms from the elec- toral cycle. This issue remains signifi- cant even though in most candidate countries all meaningful political parties endorse EU membership.
According to IIASA's research, one of the most difficult tasks of accession will be the establishment of reliable, profession- al bureaucracies (in the Weberian sense) to perform the tasks associated with negotiations and EU-related administra- tion. Given the immense ignorance con- cerning EU-related issues in Central and Eastern European countries, these bureaucracies must also educate politi- cians, business, and the population. The success of this governmental resbuctur- ing enterprise hinges not only on suffi- cient financing and training (in which EU support will play a role), but also on the ability of the nations to ensure that the resulting administration does not become a self-perpetuating monolith, but instead consists of well qualified individuals who will neither misuse their power nor be vulnerable to corruption.
IIASA's research concludes that although cooperation among candidate countries is not essential, they could benefit From it. There is little hope, how- ever, that such cooperation will emerge, because in recent years the accession process has developed more into a con- test among the applicants than into col- laboration. Still, some modest initiatives in the direction of cooperation have recently taken place, both in official politics and in non-official circles. As for controlling the emerging criticism and delaying maneuvers in certain EU
I countries, various EU institutions could probably play a role, perhaps by distrib- uting the necessary information and providing appropriate settings for dis- cussions among those nations or con- stituencies that feel threatened by the enlargement process.
The Interim Report (number 99-002) and others on EU accession by IIASA's Economic Transition and Integration project can be found on the Institute's web site at www.iiasa.ac.at/Publications/Catalog/ PUB-PROJEU-ETI.html For more information, contact: Jinos Gics e-mail: [email protected]
. - . visit the Institute's Publications web site at
www.iiasa.ac.at/docs/IIASA~Publications.html
h Good Deeds May Go I Unpunished
I As functioning societies demonstrate, natural selection must somehow favor the development of cooperative rela- tionships among individuals in a popu- lation. Hitherto, theories to explain such behavior have relied on direct reciproci- ty, hut this concept assumes repeated : interactions between the same individu-
' als and has few implications for rela- I I
tions within a larger group. Recent stud- ies by ADN staff member Karl Sigmund have introduced the cancept of indirect reciprocity into wolutionary game the-
I ory to examine how such cooperation m may have developed. In this case, a
helpful action may be returned, not by the beneficiary of that action, hut by a third party. Providing help entails costs (i.e., a lowered payoff or fitness) but raises the wcial standing of the helper. Strategies consist of providing help whenever the potential beneficiary has a standing higher than some strategy-spe- ci& threshold. These results provide a basis for understanding how social agents capable of exchanging benefits may choose compromise and coopera- tion over continued confrontation.
Sigmund used repeated computer simu- lations, where finite automata represent different strategies of cooperation or defection, to demonstrate the implica- tions of the theory. The simulations showed that over the long tern [about 150 generations of interactions), the most profitable strategy is for players to cooperate with all other players who have provided help at least as often as they have refused. This strategy reduces the number of noncooperators-hasical- ly those who have such a high threshold that it is never met-from the game. The simulations introduced the effect of mutations by inserting a small probabil- ity that an offspring will follow the opposite example from its parent. This creates an endless cycle in which long periods of cooperation are interspersed with short bouts of defection. Essentially, discriminating cooperators are slowly inched out by nondiscrimi- nate altruists (whose threshold is so low that they help everyone); this allows the defectors to take over, hut then the dis- criminators come to the fore and rein- troduce cooperation. It should be noted that discriminating is costly, since pun- ishing a defmor reduces the discrimina- tor's own standing.
Indirect reciprocity depends upon a player's ability to estimate the standing of a potential recipient. The simulations showed that even if a player has incom- plete knowledge, cooperative behavior produces greater benefits (in the form of a higher score) over the longer term than does defection, provided the infor- mation about the recipient exceeds a certain hound. This mirrors actual human behavior, where an action need not he based on personal knowledge of a potential recipient, hut can depend on information received from a third party. The minimalistic model of indirect reci-
procation appears in a paper titled Evolution of Indirect Reciprocity by Image Scoring, coauthored by Sigmund and Martin Nowak of Oxford University, in the 11 June 1998 issue of Nature.
For more information, contact Karl Sigmund e-mail: [email protected]
- - q- - c - I - - w . - - - - - - - . II 'Options Summer 1999.'
L- - A -- - . - - 5

IIASA's Land-Use Change project examines land issues in China
Giinther Fischer
I Changes in land use and land cover are among the issues central to the study of global environmental change. In addi- tion to their cumulative long-term glob- al dimensions, such changes can have
1 profound regional environmental impli- cations during the life span of cunent
I generations, such as the lowering of groundwater tables. problems of land and water contamination, reduced land
Recognizing the importance of this topic, and the need for an innovative and inter- disciplinary approach to study the nature of land-use and land-cover changes, has prompted IIASA to establish its project on Modeling Land-Use and Land-Cover Changes in Europe and Northern Asia (LUC). The project has two main goals: first, to develop new concepts that address the methodological challenges of projea- ing complex human-environment sys- tems; and second, to apply these concepts within a science-based assessment of eco- nomically viable options for land use and food policy in China.
work the land and how vegetation and soils are affected during this process. Land-uselcover changes alter how the Earth's system functions by modifying:
Biogeochemical cycles: deforestation accounts for about half the carbon released to the atmosphere since pre- industrial times; the other half comes from the burning of fossil fuels. Currently land-cover changes con- tribute about one-fifth of annual car- bon dioxide releases. Nitrous oxide generated by applications of fertilizer, such as the large amounts of low- grade and highly volatile ammonium
productivity due to soil degradation. The importance of land-use/ and reduced biodiversity. Thus, a better cover dynamics for global change understanding of land and water use dynamics over the next 30 to 50 years is The term land cover denotes the natural central to the debate of sustainability. or artificial objects on the Earth's sur-
face. It is closely related to land use, which refers to why and how people
bicarbonate fertilizers used in China, is an important factor, as is methane released From rice paddies, ruminant livestock, and landfills; Radiation balance: land-cover changes modify the Earth's surface characteris- tics, such as albedo and surface rough- ness, thereby altering heat fluxes; Ecological complexity: intensifying land use has generally brought with it a simplification of ecosystems and a reduction of biodiversity. Important causes and disturbances are deforesta- tion. Fragmentation of ecosystems. regulation of water streams, monocul- tures, selective breeding, abandoning of traditional crop varieties and live- stock breeds, and excessive applica- tion of agrochemicals.

The role of land-use systems in managing sustainable transitions
Human systems depend critically on the state of the environment. Managing a sustainable evolution of land-use sys- tems at the regional scale concerns var- lous themes of vital importance:
To achieve food security, agricultural production must he expanded and intensified in harmony with demo- graphic, soc~oeconomic and techno- logical changes This requires prudent land management to maintam healthy
agro-ecosystems; Land-use/cover changes affect the hydrological cycle both qualitatively and quantitatively by influencing how precipitation is intercepted, evapo- transpired, and retained in soils, whlch in turn determines the amount and speed of runoff. Land-cover change also influences local soil ero- sion and nutrient losses. At the scale of river basins, it determ~nes water availability and the intensity and fre- quency of flooding; Ecosystems and land in general store waste materials and provide crit~cally important purification functions. The ability to provide these services is threatened by pollution and land degradation due to inappropriate land use, or over-exploitation that trans- gresses capaclty thresholds.
Geographical focus and time horizon of LUC
LUC selected northern Eurasia as a geo- graphical focus for several key reasons. The area comprises huge land masses, n likely to experience major impacts due to global warming, is home to roughly one-fourth of the world's population, and has reached a critical stage in its rapid socioeconomic, environmental, and polihcal development.
Issues of global change concern the long term, as do questions of resource devel- opment and investment planning. Current demographic and socioeconomic trends suggest that the next 30 to 50
years will be decisive for managing eco- nomically viable transitions toward sus- tainable land-use systems. For instance, China's population growth will most likely come to a halt around 2030, and pressures on the food system will ease. The LUC project therefore concenbates ~ t s analysis on the period up to 2050. However, certain analyses [such as those of possible climate impacts) extend beyond that.
Project activities
Land use represents a critical intersec- tion O F the economy and the environ- ment, hecause changes result primarily from economic decisions. This recogni- tion has prompted LUC to choose an economic framework as the organizing principle of its research. A broad set of project activities are geared toward pro- viding a biophysical basis to the repre- sentation of land-based sectors in the economy. LUC's research includes inte- gratlon of dlverse statahcal and geo- graphical data sets within a geographi- cal ~nformation system (GIs), statist~cal analyses, model-based appraisal of land resources, novel approaches for inte- grating land and water components, and development of decision tools for evalu- ating policy options and development
A lack of readily accessible and consis- tent data has hindered a better under- standing of the processes that drive diverse land-use systems around the world. Yet there has also been a deficit in transdisciplinary research, and this,
until now, has permitted only modest advances in closing the gap between environmental and economic analysis. LUC has been aiming to fill this niche with a balanced research effort that includes the following activities:
LUC's strategy has been to explore a hierarchy of modeling approaches, each well established within its own discipline, which could enrich and pro- vide information to the formulation of a land-use model based on dynamic welfare optimization. In this research, LUC has benefited greatly from collab- oration with the Cenhe for World Food Studies a t the Free University in Amsterdam, The Netherlands. In collaboration with the Food and Agriculture Organization (FAO), and Marek Makowski of IIASA's Risk, Modeling and Policy [RMP) project, LUC has been developing and apply- ing software tools for multi-criteria model analysis related to agricultural land use. The model provides insights into the nature of nadeoffs among conflicting objectives, informed by a strong biophysical basis. In the appli- cation to China, the multi-criteria model is being extended to include water supply and use in the decision analysis. LUC has been widening the implemen- tation of a set of land evaluation tech- niques known as Agro-Ecological Zoning (AEZ). LUC compiled detailed results for the territory of the former Soviet Union, Mongolia, and China, employing the most recent digital data- bases on climate, soils, and terrain. LUC also quantified agricultural production risks based on historical climate vari- ability and possible impacts of climate
Options Summer 1999

change. These results have been embed- ded in LUC's estimates of China's agri- culhlral pmductlon relationships. The broad and spatially complete coverage of agriculture and grassland areas using the AEZ methods has been comple- mented by detailed crop modeling stud- ies that examine input-output relation- ships and environmental effects over a range of production conditions. A water assessment that generates in- depth information on availability and demand is indispensable, particularly when projecting land use and food sys- tem prospects for China. Geographical detail is essential, given the countly's heterogeneous environmental condi- tions and the vastly unequal distribu- tion of rainfail and surface water. L i e the project's AEZ land component and crop modeling activities, the hydrologi- cal assessment provides the biophysical backbone for parameter levels and rela- tionships within the water sector corn- ponent of the LUC economic model. LUC also analyzed various human dri- ven of land-use change in China. such as past and future demographic trends, the prospects for urbanization. and the high population concentration in eastern agricultural areas. This I includes research into political and economic factors that determine China's internal migration patterns and the distinction between agricul- tural and non-agricultural population. Since food demand has greatly influ- enced agricultural land-use change, LUC has investigated China's system of food supply, in particular how dietary changes might affect the country's overall grain demand. Led by collaborating researchers from Japan, the project included statistical analyses using multivariate methods [such as canonical correlation analy- sis) to empirically measure the contri- bution of various biophysical and
socioeconomic factors to explaining observed land-use patterns and changes in Japan and China. An important component of the pro- ject was collaboration with researchers in China who undeltook detailed case studies for smaller areas. Finally, LUC researchers analyzed the rich integrated database compiled by the project in order to answer a hotly debated question: can China feed itself? The results are available as a multimedia CD-ROM system for eval- uation of policy options (see back cover for more information).
The LUC project also spearheads efforts within the international Land Use and Cover Change [LUCC) core project, joint- ly implemented by the International Geosphere-Biosphere Program [IGBP) and the International Human Dimensions Program on Global Environmental Change (IHDP). In this context, U S A is hosting the LUCC Focus 3 office, con- cerned with developing a new frame- work for integrative land studies at regional and global scales.
New insights from LUC activities
Through its data activities, LUC has gen- erated new materials on Russia and the territory of the former Soviet Union. LUC research has contributed to a better understanding of the magnitude and dis- tribution of China's Farmland as well as land change processes occurring over the last decades. The application of novel estimation procedures has resulted in a spatially explicit set of production rela- tionships of China's agriculture sector. This has led to a more realistic appraisal of the opportunities and constraints of China's current agriculture in the context of limited land availability, water scarci- ty, and climatic vulnerability. Based on these results, the project will now con- centrate on policy assessment. More work is necessary to document and com- plete these activities.
LUC has brought together scientists from North America, Europe, Russia, China, and Japan. Their diverse backgmunds- in economics, agronomy, grassland ecol- ogy, forestry, water engineering, soil sci- ence, rural planning, geography, demog- raphy, economics, sociology, and mathe- matin-have enriched the project and added new dimensions to the research experience of all the project participants.
IIASA's interdisciplinary and multicul- tural approach is ideally suited to deal- ing with issues concerning land and water. LUC research combines a global perspective with a regional focus, enabling collaboration and cross-com- munication with other IIASA projects in areas of forestry, air pollution, popula- tion, and energy systems. The project's orientation toward modeling has pro- vided ample opportunities to involve and apply IIASA's advanced method- ological research. The articles on the following pages provide more detail on project activities.

' ! . F , I * f yip$, .k, \ * * 3 . \
China's ihanging land w q 4
The LUC economic core model Laixiang Sun
LUC's economic model sets out to estah- lish a dynamic integration between var- ious socioeconomic and biophysical fac- tors that drive land-use and land-cover change. and to analyze their spatial and intertemporal interactions. From an eco- nomic perspective, interactions between climate, land resources, and vegetation largely depend on how those resources and capital stocks are transformed and managed in terms of human activity. The establishment of a land-use change model, therefore, poses a number of methodological challenges, and involves many interacting agents.
dynamic welfare optimum model asses- es impacts of certain policy options on land-use changes, for instance, policy modifications to food import restlidions.
Four phenomena make this application to China especially important: (I) China's per capita income is still low, and thus, dietary patterns may respond greatly to income increases. For instance, demand for meat may increase greatly. (2) Chinese economic dwelop- ment is strong, and per capita income is increasing fast. (3) China's population will increase hy another 20 percent amidst scarcity of water and suitable land for crop production. (4) Chinese policy severely limits food imports.
Two distinct components are important in establishing desirable integration: a dynamic general equilibrium model containing optimum elements of social welfare (the welfare optimum model), and a well-specified agricultural pro- duction function. The agricultural pro- duction function must be capable of integrating biophysical and geographi- cal factors with socioeconomic vari- ables. It should also provide behavioral and technical parameters for the welfare optimum model, thus creating an inno- vative and interdisciplinary approach to the study of land-use and land-cover change.
The welfare optimization framework
soils, and land forms. Regionalization permits the model to illustrate spatial aspects of land-use changes within China during the country's period of economic development, and to discuss important topics such as infrastructure development, regional specialization, and water scarcity and transfers among regions.
Initially, the model assesses the impact of modifications to the policy of food import restrictions on land-use changes. The results will be analyzed for their sensitivity to changes in population pro- jections, rural-urban migration patterns, economic growth, and climate change scenarios.
The dynamic welfare optimum model identifies, simulates, and projects social- ly desirable and economically efficient scenarios of future investment and resource uses. These scenarios are obtained by solving a multi-period opti- mization problem, which aims to maxi- mize the well-being of the public, suh- ject to various constraints and policy options. When applied to China, the
1 IlASA LUC
Figure I : Stmcture of agricultural production relations.
What development options for policy exist, and are they sufficient to resolve these conflicts?
In the LUC model, China is partitioned into eight economic regions. These regions are distinguished not only by differences in their economic character- istics, but also by differences in envi- ronmental conditions such as climate,
The integrated agricultural production function
A key issue in establishing an integrat- ed agricultural production function is the incorporation of properly defined land-use types into the function specifi- cation. It should allow consistent aggre- gation over farm models within each economic region. Once the optimal solu-
Options Summer 1999

tion has been determined in the regional complete set of data becomes available approach to assess the impact of climate economic model, it should then allow for for other years (or indeed for other couo- change on China's agriculture. a disaggregation of the results to the tries), then the same estimation strategies basic sub-regional (county) level. The could be pursued with only minor modi- Table I reports some relatively intuitive specification of the LUC agricultural pro- fications. results from the input response function duction function intends to meet all of estimation for seven of the eight LUC these requirements. The parameter estimations of both output economic regions in China, where the
and input response functions are deliber- number of qualified observations was Figure I summarizes the basic structure ately conducted in the form of primal largeenough (between 166 to 497 obser- of the stipulated agricultural production regressions, even though estimating non- vations) for this type of nonlinear regres- relations. The output index is a quantita- linear problems in a primal form can be sion. The calculated output elasticities' of tive aggregation of crops produced using difficult from a numerical perspective. the various inputs are very plausible, and a standard aggregating rule in econom- The estimation procedures and corre- reflect the comparative scarcity of land, ics. For input response, production is co- sponding significance tests are imple- imgation water, labor, and other inputs determined by the biophysical potential mented in the GAMS (General Algebraic across the regions. of land, and by the level of factor inputs. Modeling System) language through Potential output is based on results gen- elaborating step-wise programming and Much of the structural information was erated by LUC's enhanced AEZ model proper loop structures. Thii strategy may revealed by the cross-section regression (see page 18). The rationale behind this be of general interest in solving compli- within each region. Using statistical ter- specification is that the observed actual cated nonlinear problems. minology, the explanatory power of the crop output level represents a certain estimation results is impressively high. fraction of the biophysical potential. The primal estimation provides a indeed, the representation of natural
methodological advantage in tenns of conditions and biophysical land produc- The input response function is based on modeling farmers' behavior in a dual- tivity characteristics in the model has a generalization of a complex, but popu- track pricing and marketing economy, in essentially contributed to the success of
l
iar, yield function in agronomic literature which the statistical data on prices are this spatially explicit estimation. The I
known as the Mitscherlich-Baule yield scanty. The primal estimation is based results strongly support the view that it is function. This procedure determines the only on the physical quantities of out- both possible and worthwhile to inte- 1 magnitude of the realized fraction by the puts and inputs. The resulting economi- grate information from biophysical and Factor input levels per unit of land, and cally meaningful marginal signals are biogeocbemical process models within an by the technology employed. calculated and termed "shadow prices." economic model. I
The specification captures farmers' adap- Output and input response functions tation to variations in nah.ual conditions 'Output elastirib' here measures the percent-
were estimated and tested for China's and incorporates detailed agronomic age change in the output divided by the per- centage change in the input.
cropping agriculture in 1990. Once a knowledge, also providing an ideal
,dble 1: Output elasticity of pmduciion inputs at the respecrive mean for the men qualified regioas in China? -9 6
Input Noah East Sauth Centnl N o m t Noahwcst Soufhwcst irlcn
epl: Labdr 0.0509 0.0544 0.1W 0.0188 0.1%7 0.2189 0.1744 !.*' egz: Machinery 0.1891 0.1830 0.2263 0.3Wti 0,2335 0.2165 0.1252 ep3: Draught animals en,: Chemical fertilizer 0.2W 0,3534 0.2706 0.3367 0.2028 c 03408
La: Oq$anic fertilizer 0.0587 0,0661 0.0449 C 0.0548
.A: Land 0.4015 0.3606 0.3712 0.3787 0.4469 C 0.2665 Sum of above 1.0000 1.0175 1.0130 1.0348 1.0319 1 0.9617 : Mgation ratio 0.4650 0.6281 0.4468 0.2298 0.0409 0.5560

Planning and managing China's water resources Dnvid Wiberg
Whether China is able to feed itself in the
future depends largely on the country's water resources being sufficient to cope with the rapid rate of development. Water is vital for personal consumption, for current and future agricultural demands, and for industrial growth that will ensure the country's economic advancement. China's per capita water availability is only one-third of the world's average; this availability will drop as the popula- tion continues to increase. Demand for water increases faster than population growth, just as it does when people move from rural to urban areas. Indoor plumb- ing, increased industrial activities, and irrigated crops add to that demand. Water availability varies greatly according to season and region and is affected by cli- mate change and changes in land use.
How much water is available?
Water supply planning requlres know- ing how much water is available in a region and if the source is reliable. When data is scarce, mathematical mod- els can be used to provide good esti- mates of the amounts and occurrence of water flows. Models have the added advantage of being able to predict effects of changes in climate and man- agement practices. One such model is CHARM [Climate and Human Activities
balances the water in the "soil moisture zone" with that entering as precipita- tion, while subtracting the amount that runs off above and below the surface or evaporates. The calculations are done for 5- by 5-km grid cells. Results are then aggregated over a river basin, or applied to specially designed hydro-eco- nomic regions, defined as smaller water- shed divisions consistent with LUC's geographic delineation of China's eco- nomic regions.
What is the current water situation?
The model provides a clear picture of the challenges facing China's water supply. Figure 2 compares runoff in nine major watershed regions and the seasonal fluctuation in those flows. The central line for each region represents the sim- ulated average monthly flow, with one standard deviation plotted on each side, computed from year-by-year simula- tions for 1958 to 1988.
Water quantities vary dramatically between regions. The average per capita water availability in China is 2,300 cub~c meters per year. However, in the
North Chinaplain, water availability per
-sensitive Runoff Model) developed by i
the LUC project.
CHARM is a mass balance rainfall- runoff model designed to quantify sur- I
capita drops to a staggeringly low 225 cubic meters per year, while in south- eastern coastal China i t is as much as 32,000 cubic meters.
Temporal variability is also stliking, as most of the year's rainfall occurs during summer months. Some rivers provide very little water for the rest of the year. China's Huang He, or Yellow River, can deliver a maximum flood flow of 22,000 cubic meters per second during the mon- soon months. In winter this can drop to
only 250 cubic meters per second, a flow that does not reach the sea during that period. Runoff in a wet year can be five to six times that of a dry year.
Construction of dams-more than 18.000 over 15 meters high duling the past 50 years-has helped overcome temporal variability. The country now has more than 83,000 dams. However, China's rivers cany large silt loads that diminish reservoir storage.
Using CHARM, LUC researchers have discovered that even under ideal condi- tlons-where enough reservoirs exist and there are no water or capacity losses due to evaporation, seepage, or silt build-up-some regions do not have
Precipllallon
Surface Runofl
face water resources and variations. Figure 1 indicates the structure of the sub-surface RU"OR
model. Most rainfall hits the soil and either drains into and Figure I : Approximating reality: An illustration of how CHARM calculates runoff from rainfall by rivers or filters into the soil. CHARM calculating a water balance in the sod and summing up the itidividual cells over a liver basin.
Options Summer 1999

enough water to meet demand. Figure 3
indicates that to achieve the final incre- mental yield requires huge capital investments in additional storage. Some of China's dly regions have already reached this crucial point.
The rapid expansion of city areas places additional stress on China's water resources. Water supply and distribution systems are expanding, but they cannot
puts unsustainable pressure on ground- water resources. Groundwater levels in the North China plain have been drop- ping I to 2 meters per year. Near Tianjin, the groundwater table has dropped by more than 60 meters. Over-pumping has also resulted in land subsidence. Nevertheless, according to the Nanjing Institute of Hydrology and Water Resources, China's demand for water will increase by 21 percent from 2000 to 2010.
ment of large, complex irrigation sys- tems would reduce consumption. Water conservation campaigns could help to cut China's water consumption, as would repairing older water supply systems and updating facilities to be more efficient.
Charges for urban water use should reflect the true cost of supply, including capital, operating, maintenance, and depreciation costs. lndushies could he
keep pace with exploding urbanization and its higher water consumption. Industrial use of water almost doubled in the period between 1980 and 1993 and industry now consumes 17 percent of China's total water supply. In 75 percent of Chinese cities, the demand for water exceeds the supply.
In some areas, a lack of surface water
How t o mitigate water shortages?
Many options exist to increase water supply and reduce shortages. Irrigation, the major water user, operates at only 30 percent efficiency in China. Repairing and upgrading existing facilities. l~n ing canals, and piping water could result in dramatic improvements. Better manage-
charged for the treatment of polluted water.
Such steps may not he enough to avert the need for more drastic measures. Unless people could he persuaded to move ro areas where water is plentiful (this process may be aided by increasing water prices in areas where it is scarce), developing expensive schemes to trans- port water from the southern parts of China to the north appears the only alternative. Desalination is too costly for widespread use, but it could be consid- ered to a limited extent in coastal areas.
China faces considerable challenges in supplying the water it needs to develop its current and future economy. If these challenges are not met, water scarcity could be a serious constraint to develop- ment and to Food security.

Average Monthly Runoff of Watershed Regions in China
Figure 2: Spatial and intra-annual variability in China: The center line of each plot represents the average monthly runoff in the region, showing the great variability in flows throughout the year. One standard deviation is plotted on each side of the average. Each horizontal line represents 25 billion cubic meters.
Watershed Storage-Yield Curves and Current Storage Levels
P-
F~gure 3: Watershed storage-y~eld curves: Required storage (cubic meters1 is shown on the horizontal axis, with veld [ruble meters Der month1 . . . shown on the vertical axis. In dry areas, efficient storage capacity has already been built. Additional storage capacity in these areas will come at a high price. On the other hand, wet regions have no need for large storage capacity, unless water will be transferred to the dry regions.
Options Summer 1999

. ' I . \q. . 4 \ J*
China's changing land.. 4 -
The LUC land productivity assessment Gunther Fischer
Summary of the AEZ methodology
Y L L -
Land Use Data
The LUC land productivity assessment provides an environmental characteriza- tion of land with regard to agricultural uses. Key objectives for its development included the compilation of geographi- cally explicit information that could be embedded in LUC's economic model of China (see page 13), to provide a bio- physical basis for the estimation of spa- tially explicit agricultural production relations, and to allow consistent link- age to the project's modeling of the
I water sector (see page 15).
Determining potential agricultural use under current and future conditions
LUC has recently completed a new imple- mentation of a series of land evaluation steps originating at the FA0 and widely known as the Agro-Ecological Zones (AEZ) methodology. In applying this methodology to the territory of the former Soviet Union (FSU), Mongolia, and China. LUC has extended the AEZ from tropical and sub-tropical conditions to the season- al temperate climate zones, working with the most recent digital databases to quan- tify agricultural production risks as expressed by historical variability and possible impacts of climate change.
1 LUC uses the AEZ methodology within its land productivity component because AEZ follows an environmental approach and provides a geographic framework for establishing a spatial inventory and a database on land resources and cmplgrassland production potential. AEZ data requirements are sufficiently limited to enable full coverage of countries as large as Russia or China. Also. AEZ makes maximum use of readily available data and provides a comprehensive picture of factors affecting the production potential.
Agro-ecological zoning involves the inventory, characterization, and classifi- cation of land resources for assessing the potential of agricultural production sys- tems. It includes components of climate, soils, and land form, which are critical for the provision of water, energy, nutri- ents, and physical support to plants.
The land-resources inventory of China comprises 375,000 grid cells measuring 5 by 5 km. As part of the agro-climatic characterization. LUC employs a water- balance model in each grid cell, based on monthly historical data From 1 9 5 8 to 1988 , to simulate when, and for how long, water is available to sustain crop growth. LUC uses soil moisture condi- tions, together with other climate char- acteristics [radiation and temperature
i Land
Utilization
I
BiomassNield Calculation - --
Matching of LUT 1 Requim~ents with
Land Raourca
I Cmp Suitability
1 Land Productivity
Figure I: Conceptual framework of the AEZ methodology.
calculating potential yields, matching crop/LUT environmental requirements
profiles), in a simple crop growth model (by land unit and grid cell) with the to calculate potential biomass produc- tion and yield. Then LUC combines this potential yield in a semi-quantitative manner with several reduction factors directly or indirectly related to climate (e.g.. pests and diseases) and/or soil and terrain conditions. The reduction factors vary according to crop type, the specific environment of a grid cell, and assump- tions about the level of inputs and man- agement. The final results consist of attainable crop yields under various production circumstances. To ensure
respective environmental characteristics available in the land resources database.
The results for China, FSU, and Mongolia have been grouped into five basic suit- ability classes according to attainable yield ranges: very suitable (VS: 80-1133
percent of maximum attainable yield), suitable IS: 60-80 percent), moderately suitable (MS: 40-60 percent), marginally suitable (mS: 20-40 percent), and not suitable (NS: 0-20 percent).
that the results relate to sustainable pro- For each crop type and grid cell, the pro- duction, LUC imposes fallow periods, cedures determine the optimum starting and excludes terrain slopes and soils too and ending dates of growth cycles to susceptible to topsoil erosion. ensure best possible crop yields for both
rain-fed and irrigated conditions. This In its simplest form, the AEZ framework also guarantees maximum adaptation in contains three elements (see Figure 1): simulations with year-by-year historical selected agricultural production systems weather conditions. or under climate dis- with defined input/output relationships, tortions when analyzing different cli- termed land utilization types (LUTI; geo- mate change scenarios. Implementing referenced land resources data (climate, the AEZ procedures in this way simulates soil and terrain data); and procedures for 'smart' adaptive farmers.

Exploitation of climatic potentials for agriculture and maintenance of land productivity depends mostly on soil fer- tility and management of soils, as cap- tured by the AEZ agro-edaphic suitabil- ity classification. FA0 and other organi- zations have used the soil rating scheme intensively at various scales, and in numerous countries and regions. It has passed through several international expert consultations and constitutes the most recent consolidation of expert knowledge, providing suitability classi- fications for each soil unit and for indi- vidual crops at defined levels of inputs and management circumstances.
Finally, the terrain slope suitability clas- sification accounts for risks of erosion through defining permissible slopes for cultivation of various crop/LUTs by set- ting upper slope limits. It also calculates likely yield reduction (due to losses of fertilizer and fertile topsoil) for slopes within the permissible range and takes into consideration farming practices, from manual cultivation to fully mecha- nized cultivation.
Results of the crop suitability analysis have been aggregated over crops and summarized in tabular and map form. For instance, each 5- by 5-km grid cell has an associated suitability index reflecting the level of suitability of the suitable part of each grid cell, and the percentage suitable in that particular grid cell. LUC's analysis confirms that for China, the suitability index is highly correlated with the observed distribution and usage intensity of farmland. The results for China, assuming an interme- diate level of management and input conditions, are shown in Figure 2,
Another important characteristic of China's agriculture is the complexity and widespread practice of multiple cropping systems. The capability to
Figure 2: Land suitability for rain-fed and irrigated cereal production.
grow two or even three crops within one year depends primarily on the thermal regime of a location. Under rain-fed conditions, soil moisture can be limiting as well. The AEZ procedures include an assessment of suitability for multiple cropping both for rain-fed and irrigated conditions. A classification of China's cultivated land in terms of multiple cropping potential applicable to irriga- tion conditions is presented in Figure 3.
A major conclusion of LUC's AEZ assessment is that with application of best current technologies. China has enough arable land and water to meet fuhlre cereal food and feed demand of a projected 1.48 billion population in 2025. The calculations assume that 25 percent of the suitable land would be used for crops other than cereals, and take into account land needed for infra- structure, housing, and industry.
Figure 3: Thermal suitability of China's cropland For multiple cropping.
O~tions Summer 1999
. . I i
I ' d j *:*, China's hangingl land^+^ Climatic variability and extreme events in China
Syltiiu Prieler
The high level of climatic variability in China has Frequently resulted in major damage to important agricultural regions and densely populated areas. Recent incidents include the 1998 flood, or the dry years of 1996 and 1997, when the lower reaches of the Yellow River dried out to an extent that it failed to reach the sea for a period of between 100-200 days.
Although station measurement histories are available for a few hundred locations. many studies require spatially interpolat- ed climatic variables, which can be linked in a meaningful way with other informa- tion to perform a spatially explicit analy- sis on topics such as agricultural produc-
tion potential and availability of water polated throughout China using the resources. or to evaluate the risks related Mollifier method (see box on next page). to flooding, droughts, or yield variability. The anomaly surfaces were then linked
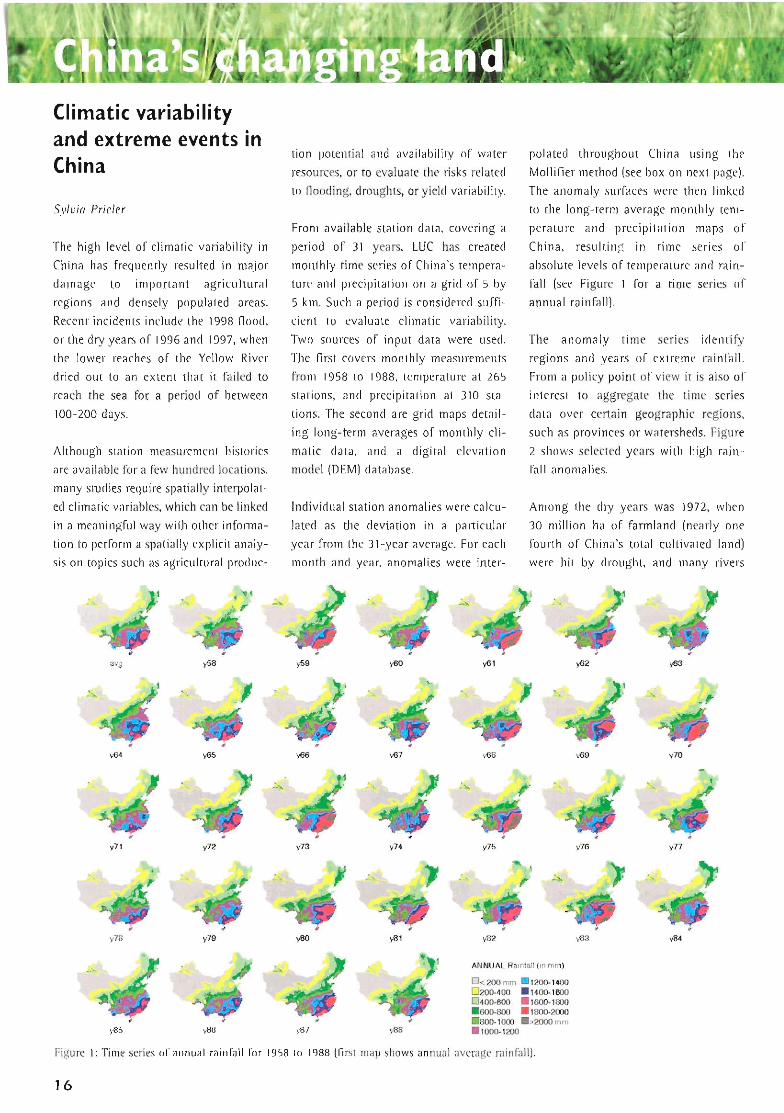
to the long-term average monthly tem- From available station data, covering a perature and precipitation maps of period of 31 years, LUC has created China, resulting in time series of monthly time series of China's tempera- absolute Iwels of temperature and rain- ture and precipitation on a grid of 5 by fall (see Figure 1 for a time series of 5 km. Such a period is considered suffi- annual rainfall). cient to evaluate climatic variability. Two sources of input data were used. The anomaly time series identify The first coven monthly measurements regions and years of extreme rainfall. from 1958 to 1988, temperature a t 265 From a policy point of view it is also of stations, and precipitation at 310 sta- interest to aggregate the time series tions. The second are grid maps detail- data over certain geographic regions, ing long-term averages of monthly cli- such as provinces or watersheds. Figure matic data, and a digital elevation 2 shows selected years with high rain- model (DEM) database. fall anomalies.
Individual station anomalies were calcu- Among the dry years was 1972, when lated as the deviation in a particular 30 million ha of farmland (nearly one year from the 31-year average. For each fourth of China's total cultivated land) month and year, anomalies were inter- were hit by drought, and many rivers
ANNUM Ra1nl.U (ln mm)
Figure I: Time series of annual rainfall for 1958 to 1988 (first map shows annual avenge rainfall).
16

experienced unprecedented low water In 1980, disastrous flooding occurred. hires are now ava~lahle for China's tem-
levels. In this year the Yellow River dried Rainfall observed at stations in the mid- tory on a 5- by 5-km grid. Some results
up for the first time [for 15 days) before dle and lower reaches of the Changjiang were linked with population data, allow-
reaching the sea. River dunng August registered amounts ing the explorahon of what share of the
of 200 to 500 mm, compared to an aver- population is affected by certain climatic
The honthly data o r e n a comprehensive age of 100 to 200 mm. risks. Based on average climatic data and
Insight into seasonal differences in 1990 population, about 40 m~llion people
regional variability. While the agricultur- The climatic time series were recently [i.e., some 3 percent of total population)
al product~on areas of the North China input to LUC's enhanced AEZ model, live in regions experiencing less than 400
plain show h ~ g h variability during spring which assesses the vanability of potential mm annual rainfall. During the dry year
months, the middle and lower reaches of crop production in China. Time senes of 1965 the percentage increased to over
the Changjiang rlver basin experience concerning length of growing period, I2 percent (see Figure 31.
extremes in summer. Flood events are potential yields of crops and grassland,
also reflected in the monthly time senes. crop water deficits and many other fea-
North Nartheart 60 40 20
^Kegions and Provinces: 0 North (Beijing, Tianjin, Hebei, Shanxi. Shandong), Northeast (Liaoning, -M
.40 Jilin, Heilongjiang). Central Uiangxi. Hubei, Hunan), East (Shanghai, Central Jiangsu, Anhui. Zhejiang), South (Fujian, Hainan, Guangdong,
20 Hongkong). Southwest [Guangxi, Sichuan, Guizhou, Yunnan), Northwest
-20 (Inner-Mongolia. Ningxia. Xinjiang) and Plateau (Xizang. Qinghai) -20
-40 -40 ~~ - .,
>aurnwert 40 ~~ ~~ ~ ~~ ~~~ ~~ - ~~ 2 2;
The bars represent [from left to right) the following years: 0 1959, 1962, 1963, 1964, 1965, 1966, 1967, 1968, 1971,
-20 -20 1972, 1973, 1975, 1977, 1978, 1980, 1983, 1986 -40 4 0
Narthwest, Plateau 40 The charts show percentage deviations from the 31-year average annual rainfall in a particular year and
"j -4 province. For a geographic region' the province with the maximum deviation is selected. Only years -20 were included when deviations of more than 20 percent occumd in at least three regions. Deviations are .40 calculated from the interpolated time series which were averaged over the provinces.
F~gure 2: Percentage devlarion of annual ramfall in selected dry and wet years dunng 1958 and 1988
1 The Mdmier method: The MoWifier metbad uses a statistical approach to nan-parametric intetpola- tion-i.e, in tk staWcal sense, interpo- lation is viwed as The tion on of an mpzred due. The bMiti& interpgletion was applied for Wka grids c o w n g all of China. The gwgsaphic wrdhstes and altitude of approziwtdy 94,M)f) grid eds, as well a the rempemmrelpoedpita- tian anomalies at 0:bswvation pints, were all W f e n e d to the Mollifier program ~ d w e l O ~ ~ at the forWnrld Figure 3- Share of population affected by different amounts of annual rainfall from 1958 to Studies, Amterdm), Mere t h n 8M) 1988 (the first bar shows average climatic cond~t~ons). inwp01anw were perfamed e k u l a a g temperature and ralofall surfaces for each manth and year 1958 to 1988.
Options Summer 1999

Population, food demand and land use in China
Gerhord K . Heilig
China's land-use changes directly affect the country's capacity to generate suffi- cient food supplies. Losses of arable land due to natural disasters, agricultural restructuring, and infrastructure expan- sion might lead to food production deficits in the future.
China's food prospects, however, are also of geostrategic and geopolitical rele- vance to the West. Food deficits in China
What are the major trends in China's land-use changes?
There are few places in the world where people have changed the land so inten- sively, and over such a long period, as in China. The Loess Plateau of Northern China, for instance, was completely deforested in pre-industrial times. The Chinese started systematic land reclama- tion and irrigation schemes, converting large areas of natural land into rice pad- dies, as far back as the early Han Dynasty, in the fourth and third centuries BC. This process, which was scientifically planned and coordinated by subsequent
land-cover data for China. This informa- tion includes statistical data, mapped information and remote sensing data. Table I presents some results from LUC's analyses of the most recent trends, based on new surveys from the Chinese State Land Administration:
Conversion of cropland into horticul- ture was the most important factor in land-use change in China in recent years. Between 1988 and 1995 farm- ers converted some 1.2 million hectares (ha] of cropland into horti- culture. This conversion is a positive trend, indicating a growing market orientation of Chinese agriculture.
might destabilize the country and jeop- ardize the process of economic and polit- ical reform. Despite China's strong com- mitment to self-sufficiency, the country may become a major importer of (feed) grain. This is of great economic interest to large grain exporters such as the United States, France, or Australia.
There is also the danger that climate change might affect China's vegetation cover-especially the large grasslands, which are important for the country's livestock production. An increased fre- quency of catastrophic weather events could trigger massive floods or extend- ed droughts that would affect major agricultural areas in various parts of China. These trends pose serious risks for the country's future food security.
dynastic bureaucracies, reached its first climax in the 11th and 12th centuries. Another period of massive land modifi- cation followed in the second half of the 18th and first half of the 19th century.
The LUC project, however, deals with a more recent phase-approximately since the foundation of the People's Republic of China in 1949-and in particular the period since economic reforms began in 1978. Although there has been wide- spread speculation in the scientific liter- ature about losses of cultivated land in China due to pollution and urban expansion, very little hard data was available when the LUC project started. Through its collaboration with Chinese partners and other sources, LUC has received highly detailed land-use and
Gtinthcr Fischcr photo
Manifold construction activities (roads, settlements, industry and mining) diminished China's cultivated land by 980,000 ha beween 1988 and 1995. The third most important type of land-use change was reforestation, diverting almost 970,000 ha of previ- ously cultivated land. Between 1988 and 1995, China also lost some 850,000 ha due to natural diias- ters-mainly flooding and droughts
These data clearly indicate that anthropogenic factors are mainly respon- sible for recent land-use changes in China. The growing demand for meat, fish, fruit, and vegetables drives much of the agricultural restructuring, such as conversion to horticultural land and fish- ponds. Environmental programs are pro-

able I: Increase, decrease and net-change of cultivated land in China by reg
. - , i ,n , & Jl"srasse r, Converrlon
Reuse of Con" from - Decrease to a to to Recta abandoned agricultural ~ ~ ~ ~ t ~ ~ ~ t to forest grass fsh- Net- matlon Dralnage and land ( 1 1 hortltuliure land land ponds Dismterr Change .
North 289.733 18.223 106028 41,080 .229.825 298.595 -1 11.895 -41.215 ,7979 105.535 -340020 Northeast 396.867 21.991 39,957 25.852 -109,662 -87.417 156.501 -90.631 -9.426 250871 -219.842 East 43.250 21.147 34.284 M.628 242.824 178.677 24.761 -1.416 -45.624 29.328 379.324 Central 79.943 7.665 13.159 26.569 -91.802 -101 858 -111.782 -2.689 -61.519 41.456 -283.771 South 320.001 22686 18.870 96.681 117,023 116.966 8 1 465 -10.361 -87.096 16.534 11,206 Southwest 358 704 8 687 40 260 90450 92 583 114235 161 770 93864 7902 132915 105 169 Plateau 28M4 980 3 135 3935 7.927 163 163 11.874 1 486 15.281 Northwest 681 902 19.798 93 428 84.270 "" -*" .2 --- --- TOTAL 'ZT98.444 121.177 ?%9.121 4 1 3 . e 111 .1
Source: Slate Land Administration, Statirtica Information on the Land of China In 1995. Beijing, 1996. And equvalenr reports for 1988 to 1994
moting reforestation, and the expansion Income growth. By all measures, China Urbanization. Although China still has of infrastructure is a Function of rapid had spectacular economic growth rates a large agricultural population, most economic development and urbanization. in recent yean. The number of people in experts predict a rapid increase in the
povelty declined by some 200 million. number and size of towns and cities in
What are important drivers of land-use change in China?
Proximate determinants, such as those discussed above, are just the last step in a chain of causation that triggers land- use change in China. There are, howev- er, three fundamental factors behind these trends:
Population growth. Most recent pro- jections from the United Nations Population Division [see Figure I )
assume that China's population will increase to some 1.49 billion people by 2025 and then slowly decline to I .48 by 2050.
the future. This urbanization is associ-
1 ated w ~ t h changes in labor-force par- ticipation and lifestyle.
Population growth increases the demand for food and thus leads to intensification of ag.cuIbre and expansion of culti- vated land. However, as the LUC analy- sis shows, there is a high error range in projecting China's population For more than 20 to 30 years. Its huge initial size amplifies even very small changes in
-lo,.IR1."#lmnlMXVYm,
fertility and mortality. For instance, between estimates made in 1994 and
g g g g g i ; g l % i 1998, the United Nations Population Figure I : Population projection for China. Division had to revise its population
Options Summer 1999

projection for China for the year 2050 by 128 million. This uncertainty is unavoidable, and must be taken into account in predicting food demand and other population-related changes.
There is also considerable uncertainty concerning China's future economic development. Current trends indicate that China will experience a rapid tran- sition from an agricultural to an indus- trial and service society. This would lead to expansion of infrastructure and areas of settlement, encroaching on valuable cropland, especially around urban- industrial agglomerations in coastal provinces.
An increase of productivity in both industly and agriculture could also lead to massive unemployment-particularly among the agricultural population. China already has an excess agricultur- al labor force of at least 120 million. which will increase the potential for ~ ra l -u rban migration. Policy measures could probably slow down urbanization to some extent, but most projections assume a massive increase in urban population From the current 370 million to 800 million people. All these trends would-directly or indirectly-influence land use in China. With growing income and urban lifestyle. for instance, Chinese consumen will further change their diet (see Figure 2).
According to FA0 estimates, there was already a massive increase in the domestic supply of meat from 6.6 to 47.9 million metric tons between the mid-1960s and the mid-1990s-with a significant effect on crop production patterns. The harvest of maize (the major feed crop) increased from 25 to 113 million tons between the mid-1960s and mid-1990s. Use of cereals for feed- ing animals grew from 12 million tons in 1964-66 to 107 million tons in 1994-96.
Figure 2: Per capita food consumption by commodiry.
Similar trends can be observed with other food commodities. Between the mid-1960s and mid-1990s, China's veg- etable production increased from 37.9 to 182.7 million tons, and the production of fish increased from 3.3 to 24.3 mil- lion tons. These consumer-driven changes in agricultural production caused most of the land-use change in China during the last few decades.
Some general observations resulting from LUC's research
LUC's various models and analyses indi- cate that China is certainly facing a critical phase of its development during the next three decades. In that period, the demo- graphic momentum will inevitably lead to further population growth, in the order of some 260 million people. Their demand for food, water, and shelter will greatly increase pressure on China's land and water resources. The country's urbaniza- tion and economic development will amplify this pressure. Without effective control of pollution and farmland loss, China faces serious problems of land degradation and pmductiviv decline that might threaten the counmy's food security.
The LUC project has analyzed how glob- al climate change might affect natural vegetation, agriculture, and water man- agement systems in China. This is essen- tial for a long-term water and land resource strategy. China will only be able to cope with its serious problems of flooding and drought if it takes into account the interactions between human and natural factors. For instance, flood damage bas increased in recent years because farmers moved into areas that should have been reserved for flood control. The serious water deficit in downstream areas of the Yellow River is amplified by a massive increase in (rather inefficient) agricul- tural water consumption upstream. As
the LUC analysis on Human Impact on Yellow River Water Management (IIASA IR 98-016) has shown. China will need intense water management activities to secure a reliable water supply.
Despite recent progress, great data deficits and uncertainties still exist con- cerning both biophysical and socioeco- nomic conditions and trends. While LUC was able-with the help of Chinese col- leagues-to improve, cross-check, and update several (georeferenced) data sets on China (climate, soils, water, cultivat- ed land, grassland, natural vegetation, population, etc.), project staff still see the need for additional sources of informa- tion. In particular, remote sensing data could improve land-use analyses and planning for certain regions. Due to the rapid change in China, available statisti- cal or mapped data are not always up to date. For instance, the conversion of arable land due to infrastmch~re expan- sion and urban sprawl in recent years could be analyzed more accurately with satellite images.

Human Resources of the LUC Project
A team of SIX in-house researchers is currently developing the various model components of the project "Modeling Land-Use and Land-Cover Changes in Europe and Northern Asia," the Land Use Change (LUC) project. Since its inception in 1995, the expertise and support of an extensive international and interdisciplinary network of alumni, visiting researchers, and collaborating national and international organizations, has strengthened the LUC core reseuch at the Institute. A distinguished international steenng cornminee guided the project through its formative years. Between the summers of 1995-1998, the LUC project also drew on the participation of eighteen young scientists who joined the project within the framework of IIASA's Young Seientists Summer Program (YSSP). Current in-house staff: Giinther Fischer, Project Leader, mathematician (Austria); Gerhard Heilig, demographer (Germany); Sylvia
Prieler, GIs specialist (Austria); Laixiang Sun, economist (China); David Wiberg, water engineer (USA); Ping Xiao, geographer (China); Cynthia Enzlberger, administrative asststant (UKIAust~ia).
Alumni and close collaborators (contributing more than 6 months to IIASA LUC research): Peter Albersen. Center for World Food Studies, Free Univ., Amsterdam (Netherlands); Akio Bito, Yamanashi Univ., Kofu, [Japan); Satoshi Hoshino, Okayama Univ., (Japan); Ana Iglesias, Ciudad Univ., Madrid (Spain); Michlel Keyzer, Center for World Food Studies, Free Univ., Amsterdam (Netherlands); Svetiana Krmts (ne6 Rojkoval, Dokuchaev Soil Institote, Moscow (Russia); Milan Knbat, (Czech Rep.); Xiubin Li. Institute of Geography, Chime Academy of Sciences (China); Hidenori Morita, Kagawa Univ. (Japan); Nikita Pisnyachevski, Moscow State University (Russia); Cynthia Roseozweig, NASAIGoddard Institute for Space Studies, (USA); Charles Rossmann, (USA); Kenneth Strzepek, U ~ N . of Colorado, Boulder, (USA); Vladimir Stolbovoi Dokuchaw Soil Institute (Russia); Huinan Sun, Institute of Geography, Cbinese Academy of Sciences (China); Ferenc T&th, Potsdam Institute for Climate Impact Research (Germany); Tom van Buren, (USA); Jelle van Minnen, Univ. of Kassel (Germany); Harry van Velthuizen, Netherlands); Mingcha Zhao. Institute of Geography, Chinese Academy of Sciences (China).
Alumni and dose collaborators (contributing less than 6 months to U S A LUC research): Niels Batjes, International Soil Reference and Information Centre, Wageningen [Netherlands); Lothar Beckel, GEOSPACE, Salzhurg (Austria); Xavier Baulies, (LUCC). lnstitut Canogrhfic de Cataluyaa (Spain), Wolfgang Cramer, Potsdam Institute for Climate Impact Research (Germany); Zdz~slaw Kawmuek, Inst. of Geophysics, Warsaw (Poland); Freddy Nachtergaele, FAD, Rome (Italy); Dennis Ojima, Colorado State University, Boulder (USA); Kiyoshi Takahashi, National Institute for Environmental Studies (Japan); Zhenyuan Zheng, State Laud Administration (China).
Steering Committee 1995-1997: Martin Claussen, Potsdam Institute for Climate Impact Research (Germany]; Teitaro Kitamura, Tokyo Uluv. of Agticultwe [Japan); Vladimir Kotiyakov, Inst. of Geography, Russian Acad. of Sciences, Moscow [Russia); Yanhua Liu, State Commission of Science and Technology, Beijing [China); Martin Pany, (Chair) Jackson Environment Inst., London (UK); Wouter T i , Centre for World Food Studies, Free Univ., Amsterdam (Netherlands); Billie Turner U. George Perkins Marsh Institute, Clark Univ. (USA).
YSSP 1995-1938: Oma Perrin Bowling (USA]; Anna Bnsmar [Sweden); Sara Bmgaanl (Sweden); Yufeng Chen (China); Plamena Gaydarova (Bulgaria); Xiaoshuang He (China); Shuying Leng (China); DmiM Liouri (Russia); Natalia Novikova (Russia); lgor Savin (Russia); Gleb Schepaschenko Russia); Yo Shimizu (Japan); Martin Spitzer (Austria); Pavel Tcherkashii (Russia); Gergely Toth (Hungary); Q~ang Wang (China); Ming Zhang (China); Yaaqi Zhang (China/Filand).
LUC on the Web:
The project's home page provides further information on:
LUC activities
Publications
Staff
LUC's Geographic Information System
Options Summer 1999

Inside IIASA
IIASA Days in Ukraine
From March 17 to 19. 1999, IIAsA stalTand representatives from several of the
institute's National Member Organizations
lllet in Kyiv, Ukraine, at the Great
Conference Hall of the National Academy
of Sciences of Ukraine (NAsU) for an
international "IlAsA Days in Ukraine."
The meeling. organized by the NationalCommittee for Systems Analysis and
IIASA, was designed to increase aware
ness of IIAsA's research and of theYoung Scientists Summer Program
(yssPj in Ihe Ukraine, as well as to pro
male cooperation between the Swedish,
Polish, and Ukrainian NMOs and scienlif
ic organizations of these countries.
The Mixed Blessing ofFinancial InflowsTRANSITION COUNTRIES INCOMPARATIVE PERSPECTIVE
Edited by Janos Gacs, IIASA, Raben
Holzmann. World Bank, Michael L.
Wyzan, IlASAISBN 1-84064-038-3
Edward Elgar Publishing( 55
The successful macroeconomic stabiliza
tion in Central and Eastern European
countries has encouraged inflows of for
eign c"pital badly needed to promoteeconomic development. Strikingly, thesecountries have found capital innows in
their various fOfms to be a mixed blessing. threatening the macroeconomic balance that they have recently achieved.
22
The meeting was opened by the Presidentof NAsU and Chairman of the National
Commiltee for Systems Analysis Borys
Paton, whose welcoming address underlined the importance of cooperation withIlASA for the Ukrainian scientific community and governing institutions. Theopening session was followed by sixworking sessions, covering application ofsystems analysis methodology to different spheres of human activity: socialsecurity reform; risk. modeling and policy; forest resources and land use; environmentally compatible energy strategies; and IIAsA's YSSP.
In total, JJ presentations were given byrepresentatives from seven countries
These countries have learned that it isnot easy to continue to attract foreigncapital and simultaneously to reduce itsadverse efrects on innation, theexchange ralC and the current account,and to contain disturbances resultingfrom reversals of the flows. This bookinvestigates recent experience in Centraland Eastern Europe, contrasts it with thatof Latin America and Easl Asia, and suggests appropriate policies and lessons to
be learned. The aUlhors conclude that
many features of, and policy dilcmmasfaced by, formerly centrally planned
economics in Europe are similar to thosein other emerging economics. However,certain uniquc characteristics. such asdat" limitations and the fragility of the
banking and financiul syslems, compound the problems faced by poJicymakcrs in Central and Eastern Europe.
This book will prove invaluable to poli
cymakers and scholars inlerested in andresponsible For international finance intransition economics.
IGermany, Poland. Russia, Sweden.Ukraine. USA, Yugoslavia). Two spe"kers
from inrcmation<ll development insLitutions (the Harvard Institute rorInternational Development and theCarnegie Endowment for [IllcrnarionalPeace) <1lso contributed to the event.Representatives from 28 Ukrainianresearch institutions and universilies,eight ministries and governmental agencies, and the Ukrainian Federation ofTrade Unions attended the meeting.
Participalion of foreign delegates w"sfinanced by the Swedish Council for
Planning and Co-ordination of Researchand Ihe Systems Research Institute of thePolish Academy of Sciences.
The Mixed Blessingof Financial Inflows
TRANSITION COUNTRIESIN COMPARATIVE
PERSPECTIVE
EDITED BY
Janos Gaes . Robert HolzmannMichael L. Wyzan
I~TEH~4TIOItAl. r~STITUTE roH 41'f'UED $YSTEM$ ANAlYSIS~
LUDWIG 1I00TZM.UiN rlnTlTUTE fOR ECONOMIC POUC'I 41tAl.~IS
To order, COIllClCt:Edward Elgar Publishing
Glens"nda House, Montpellier ParadeCheltenham, Glos, GL50 1UA, UK
Tel: +44 [oj 1242 226934Fax: +44 (0) 1242262111
Email: [email protected]
hltp://www.e-elgar.co.uk
Awards
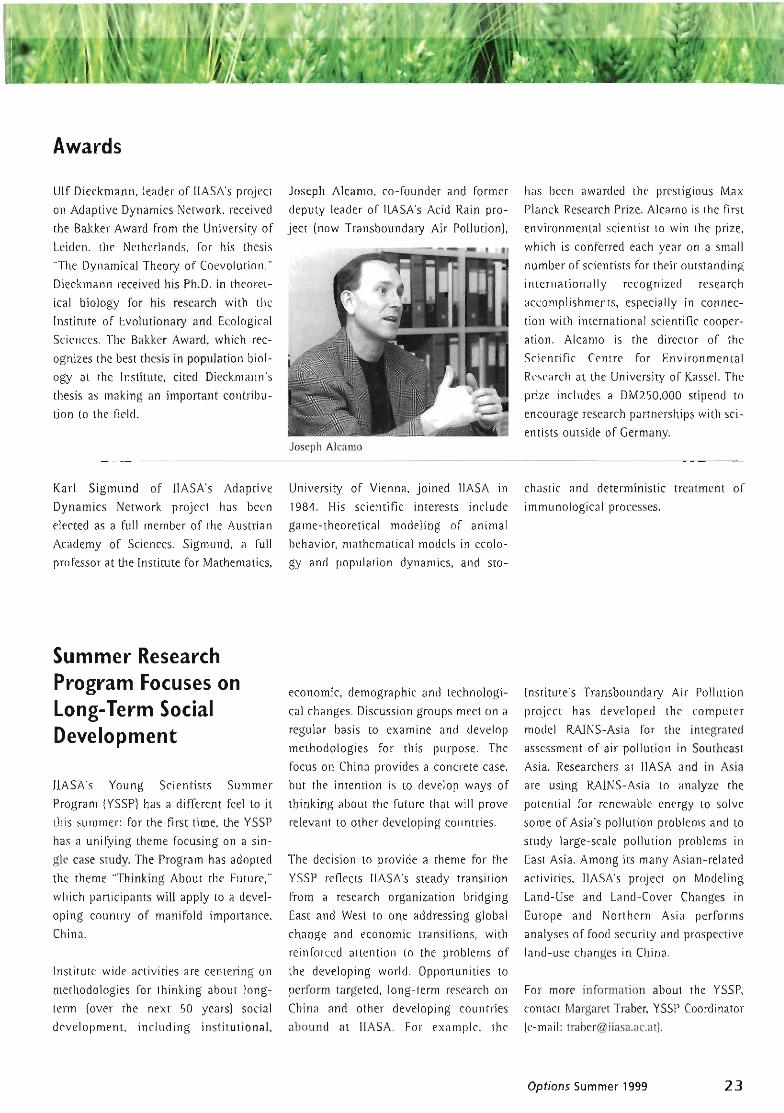
Ulf Dieckmann, leader of IIASA's project Joseph Alcamo, co-founder and former has been awarded the prestigious Max on Adaptive Dynamics Network, received deputy leader of IlASA's Acid Rain pro- Planck Research Prize. Alcamo is the first the Bakker Award h m the University of ject (now Transboundary Air Pollution), environmental scientist to win the prize, kiden, the Netherlands, for his thesis "The Dynamical Theory of Coevolution." Dieckmann received his Ph.D. in theoret- ical biology for his research with the Institute of Evolutionary and Ecological Sciences. The Bakker Award, which rec- ognizes the best thesis in population biol- ogy at the Institute, cited Dieckmann's thesis as making an important contribu- tion to the field.
which is conferred each year on a small number of scientists for their outstanding internationally recognized research accomplishments, especially in connec- tion with international scientific cooper- ation. Alcamo is the director of the Scientitic Centre for Environmental Research a t the Universify of Kassel. The prize includes a DM250.000 stipend to encourage research partnerships with sci- entists outside of Germany.
Karl Sigmund of IIASA's Adaptive University of Vienna, joined llASA in chastlc and deterministic treatment of Dynamics Network project has been 1984. His scientific interests include immunological processes. elected as a full member of the Austrian game-theoretical modeling of animal Academy of Sciences. Sigmund, a full behavior, mathematical models in ecnlo- professor at the Institute for Mathematics, gy and population dynamics, and sto-
Summer Research Program Focuses on Long-Term Social Development
IIASA's Young Scientists Summer Program (YSSP) has a different feel to it this summer: for the first time, the YSSP has a unifying theme focusing on a sin- gle case study. The Program has adopted the theme 'Thinking About the Future." which participants will apply to a devel- oping country of manifold importance, China.
Institute-wide activities are centering on methodologies for thinking about long- term (over the next 50 years) social development, including institutional,
economic, demographic and technologi- cal changes. Discussion groups meet on a regular basis to examine and develop methodologies for this purpose. The focus on China provides a concrete case. but the intention is to develop ways of thinking about the future that will prove relevant to other developing countries.
The decision to provide a theme for the YSSP reflects IIASA's steady transition From a research organization bridging East and West to one addressing global change and economic transitions, with reinforced attention to the problems of the developing world. Opportunities to perform targeted, long-term research on China and other developing countries abound at IIASA. For example, the
Institute's Transboundary Air Pollution project has developed the computer model RAINS-Asia for the integrated assessment of air pollution in Southeast Asia. Researchers at IlASA and in Asia are using RAINS-Asia to analyze the potential for renewable energy to solve some of Asia's pollution problems and to study large-scale pollution problems in East Asia. Among its many Asian-related activities. IMSA's project on Modeling Land-Use and Land-Cover Changes in Europe and Northern Asia performs analyses of food security and prospective land-use changes in China.
For more information about the YSSP, contact Margaret Traber, YSSP Coordinator (e-mail: [email protected]).
Options Summer 1999

1!ASA, ~r~· P<>pulahon== ,_.<_._....._<0,_
J ~ ~ ~._.--~--- '-_.~'-- ...._~-
~
~..._._._._.--
provides one-step access to background
information and analyses essential for a
balanced and policy-relevant aSsess
ment or China's food prospects. It may
also be lIsed as a reference LOoJ in
research and higher education.
Hardware requirements:
TIle ChinaFood CD-ROM can be used on
any PC. Mac or UNIX workstation. pro
vided the system has a new-generation
web browser installed (such as Netscape
CommunicalOr 4.0 or MS-Intcrnct
Explorer 4.0).
Order information:The CD-ROM is available from IIASA for a
shipping and handling eharge of US$ 39.
Please lise the Interner order rorm at:
www.iiasa.ae.at/Research/LUC/
You can also send an e-mail or rax the
order form below LO:
Gerhard K. Heilig
IIASA, LUC Project.
Schlossplatz I.
A-2361 Laxenburg, Austria
Fax: 1+43-2236) 71313
(.-mail: heilig@iias;:l.ac.at, [email protected]
.1... .. .__I, •. I., Ill.". I" I
ChinaFood is tl highly interactive. new
type of electronic publication-a hyper
linked documelll-organized like a dclla
base of facts, analyses, weblinks, and
visuals such as charts. maps, diagrams.
and sarellitc images. These elements are
organized into a web of thousands of
links. Users may "jump" from one argu
mel11 to another or to a related table.
They can follow links to corresponding
chans, maps, and bibliographical refer
ences or "jump" to related Internet
resources throughout the world.
'_<_•._,",_<__ c_ ..c_. """""'~_._.----tl~ Da'~· 011'1 Ch.1n
term equation, which also includes
demogrJphic, economic, social. cultural
and political elements. The ChinaFood
application was developed by Gerhard K.
Heilig. based on his and his colleagues'
research undenaken in IIASA·s Modeling
Land-Use and Land-Cover Changes in
Europe and Northern Asia ILUCj project.
What is special about thisCD·ROM?
Who are the target groups?
The ChinaFood CD-ROM was mainly
designed as a decision-suppon applica
tion For pl;mners and policymakers. It
(II ~ ... ~ ... t'\l.." ""_,,,__ Ii .- ••
ChinaFood CD·ROMCan China feed itself?
What is on the CD-ROM?
The ChinaFood CD-ROM hrings together
new data from various sources, argu
ments, and in-depth analyses that show
that China·s farmers will only be able to
feed the projected 1.48 billion population
by 2025 if certain policy measures are
taken now. Drawing attention to the
multi-dimensional nature of China's
food problems. the application shows
that food security is not only a resource
problem. The scarcity of water and land
arejusl two important factors in a multi-
China's food prospects h,wc heen a sub
ject of serious political concern and
numeroLis scientific studies. Today,
China faces the challenge of feeding its
22 percent share of the global popula
tion on only 9 percelli of the world's
arable land. Recent projections aSsume
that the population will increase by
another 260 million people during lhe
neX( 25 years. If China will not he ahle
to feed itself, the country·s massively
increasing import demand could desta
bilize world grain markets.
1A.\.1§
'~~ Can China Feed Itself?..::: ~~J'l""""h"_fIlPo"'rClE>DoM
-::: OfGo<....H ......... ,_.-
Exp. Date [ 0
Total Amount IUS$) I--
Addr("s~: Slrttt, City. ZIP Cod~, Country
Addrr~5: S1r.'~l. City, ZIP Cooe. Country
Signature
l.ast (Family Namr)
Quantity I_-=~I US$ 39 p<r CD-ROM
VlSA 0 MasterCard 0 Check 0DODD DODD DODD DODD
First Name
MailingAddress
Cardholder
Card Number
~oCl:•Q
E"""lo."Co 0
..... 0lo. .....QI nsc:
"C .-lo..c:
0"",,