chasing the high school graduation rate - ets home · 2016-05-09 · chasing the high school...
TRANSCRIPT

Chasing the High School Graduation Rate:Getting the Data We Need and Using It Right
by Paul E. Barton
Policy Information PERSPECTIVE

Additional copies of this report can be
ordered for $10.50 each (prepaid) from:
Policy Information Center
Mail Stop 19-R
Educational Testing Service
Rosedale Road
Princeton, NJ 08541-0001
(609) 734-5949
e-mail: [email protected]
Copies can be downloaded for free at:
www.ets.org/research/pic
Copyright © 2009 by Educational Testing Service. All rights reserved. ETS, the ETS logo and LISTENING. LEARNING. LEADING. are registered trademarks of Educational Testing Service (ETS). Educational Testing Service is an Affirmative Action/Equal Opportunity Employer. 10912
February 2009

Table of Contents
Preface....................................................................................................................................2
Acknowledgments...................................................................................................................2
Introduction.and.Overview....................................................................................................3
Needed:.A.High-Quality.National.Survey.of.the.High.School.Graduation.Rate.....................5
Making.the.Most.of.What.We.Have:.Expanding.and.Improving.Current.Federal..Data.Collection.Efforts.to.Report.High.School.Graduation.Rates....................................... 10
Longitudinal.Student.Tracking.Systems:.Some.Issues.and.Concerns.................................... 16
The.Use.of.High.School.Graduation.Rates.in.Sanctions-Based.Accountability.Systems........20
What.We.Know.Now.About.the.High.School.Graduation.Rate........................................24
Summary.and.Conclusions.................................................................................................. 29
Appendix............................................................................................................................... 31

2 • Chasing the High School Graduation Rate
Acknowledgments
Preface
Among.the.ingredients.of.successful.K.–.12...education.are.supportive.family.and.home.
environments,.high-quality.instruction.in.the.schools,.and.completion.of.and.graduation.from.high.school..As.for.measuring.the.latter.ingredient,.the.United.States.has.relied.on.longstanding.and.routine.statistical.reports.from.the.U.S..Census.Bureau.to.report.the.percentage.of.high.school.students.who.complete.high.school.and.earn..a.diploma..
Yet.in.the.era.of.the.No.Child.Left.Behind.Act.(NCLB),.little.in.K – 12.education.has.remained.routine,.including.the.process.of.tracking.graduation.rates..In.addition.to.test.scores,.NCLB.now.requires.states.to.report.graduation.rates.to..the.U.S..Department.of.Education..Under.the..law,.schools.with.low.graduation.rates.risk.a.variety.of.consequences..Several.researchers.have.found.the.accuracy.of.the.reports.filed.by.the.states.to.be.problematic..Researchers.also.have.challenged.the.accuracy.of.the.Census.Bureau’s.graduation.rates,.leaving.new.uncertainty.and.prompting.contentious.dispute.over.three.critical.questions.about.the.graduation.rates.and.trends:.Are.high.school.graduation.rates.high.and.rising,.as.some.contend?.Or.are.they.low.and.stable,.as.others.argue?.Or.are.they.falling,.as.yet.other.analysts.assert?
Half.a.dozen.years.into.the.debate,.Paul.Barton.has.surveyed.the.scene.and,.in.this.report,.presents.a.summary.of.where.we.now.stand.with.regard.to.a.valid.measure.of.the.high.school.graduation.rate,.what.that.metric.tells.us,.and.what.more.we.need.in.order.for.the.statistics.to.become.a.more.accurate.reflection.of.reality..Barton.argues.that.one.single.metric.of.the.high.school.graduation.rate.is.insufficient.for.the.different.uses.that.are.typically.made.of.the.statistic..More.data.are.needed,.he.says,.both.from.what.the.Department.of.Education.collects.from.the.states.and.beyond.the.one.survey.question.on.educational.attainment.that.the.Census.Bureau.uses.to.collect.data.for.its.reports.
Gathering.credible.measures.is.one.essential.aspect.of.the.equation..So.is.using.those.measures.constructively,.especially.if.the.rates.are.to.be.used.in.education.accountability.systems..It.is.not.obvious.that.we.are.headed.in.that.direction,.Barton.says,.or.that.the.correct.rates.are.being.used.for.the.right.purposes..We.are,.he.maintains,.still.“chasing.the.high.school.graduation.rate,”.along.with.ways.to.make.productive.use.of.it... . .. . Michael.T..Nettles.. . Senior.Vice.President.. . Policy.Evaluation.and.Research.Center
The.author.wishes.to.acknowledge.those.who.reviewed.the.report.and.provided.valuable.
assistance:.Emerson.Elliott,.National.Council.for.the.Accreditation.of.Teacher.Education.(NCATE);.Richard.Kazis.and.Cheryl.Almeida,.Jobs.For.the.Future;.and.Kurt.Bauman,.U.S..Bureau.of.the.Census..Not.all.reviewers.agreed.
with.all.the.conclusions.reached.in.the.report..Others.were.helpful.in.responding.to.questions.and.providing.information..The.report.was.edited.by.Richard.Coley.and.Richard.Pliskin..The.cover.was.designed.by.Marita.Gray.and.Martin.Fedowitz.provided.desktop.publishing..Errors.of.fact.or.interpretation.are.those.of.the.author..n
Chasing the High School Graduation Rate • 3
Introduction and Overview
“In.America,”.said.Daniel.Patrick.Moynihan,.“we.only.do.what.we.measure.”.Those.words,.
spoken.to.me.many.years.ago.when.I.worked.for.him,.are.apt.with.regard.to.the.high.school.dropout.rate.today..We.are.not.likely.to.have.the.resolve.or.the.data.to.address.the.dropout.problem.if.we.do.not.have.the.resolve.and.the.data.to.measure.it.accurately.
The.matter.has.never.been.more.important..There.has.been.considerable.warning.over.the.years.about.the.dangers.of.leaving.school.without.a.diploma,.for.after.decades.of.decline.in.job.opportunities.in.manufacturing,.and.the.rise.of.lower-paid.jobs.in.service.industries,.job.opportunities.have.become.increasingly.scarce.for.young.people.starting.their.adulthood.without.a.high.school.diploma..The.proportion.of.teenagers.without.a.diploma.who.have.jobs.has.fallen,.and.the.wages.of.those.who.do.get.jobs.has.fallen,.both.absolutely.and.relative.to.those.who.have.better.education.credentials.
Beyond.the.hardship.to.those.who.leave.school.without.a.diploma.are.the.consequences.for.society.—.dropouts.pay.less.in.taxes,.are.more.likely.to.depend.on.subsidized.health.care.and.public.assistance,.and.are.more.likely.to.be.incarcerated.1.None.of.this.is.news.to.the.American.public,.as.much.of.the.research.and.many.of.the.warnings.have.been.reported.by.the.national.and.local.media.
And.yet.despite.the.attention.and.coverage,.we.still.are.unable.to.produce.the.statistics.that.would.give.us.accurate.data.on.the.percentage.of.students.who.enter.high.school.and.graduate.each.year,.and.the.percentage.of.population.groups.—.such.as.20-.to.24-year-olds.—.who.have.high.school.diplomas..There.are,.of.course,.plenty.of.numbers.out.there,.and.reporters.eagerly.use.them.for.their.stories..The.only.question.is.whether.these.numbers.are.remotely.accurate,.or.whether.they.
add.up.to.anything.meaningful.for.policymakers.in.their.efforts.to.address.the.dropout.rate.
The.high.school.dropout.rate.gained.urgency.after.the.passage.of.the.federal.No.Child.Left.Behind.Act.(NCLB),.which.requires.that.each.state.report.its.high.school.completion.rate.each.year..With.more.importance.being.assigned.to.key.education.indicators.in.an.era.of.school.accountability,.such.numbers.were.getting.an.ever-closer.look.by.organizations.such.as.the.Education.Trust,.think.tanks.such.as.the.Urban.Institute,.and.a.growing.number.of.university-based.researchers..The.dropout.rates.these.researchers.produce.did.not.jibe.with.other.published.numbers,.nor.was.there.consistency.among.the.estimates..Nor.were.there.any.official,.current,.state-by-state.national.statistics.on.the.high.school.graduation.rate.beyond.the.dated.data.that.appeared.in.the.decennial.census..And.while.the.numbers.published.in.the.annual.Census.Bureau’s.Current.Population.Survey.(CPS).had.long.been.relied.upon,.researchers.looking.more.closely.were.raising.questions.about.the.data’s.validity,.particularly.since.the.Census.numbers.were.higher.than.those.produced.by.any.of.the.independent.researchers.
At.the.beginning.of.this.decade,.sources.and.analysts.reported.that.the.high.school.completion.rate.was.high.and.rising,.or.that.it.was.low.and.stable,.or.that.it.was.moderate.and.falling..In.that.period.the.numbers.published.in.various.places.ranged.from.67.to.90.percent..The.accompanying.policy.and.data.debates.produced.a.murky.picture.of.rates.and.trends..These.debates.focused.on.the.strengths.and.weaknesses.of.the.available.data.2
At.this.juncture,.it.would.be.helpful.to.offer.some.suggestions.on.how.to.improve.the.data.system.and.provide.some.judgments.on.what.the.best.estimates.are.of.the.level.and.trends.in.graduation.rates,.as.well.as.information.on.
1..For.an.overview.of.the.costs.and.social.consequences.of.dropping.out.of.high.school,.see.Clive.R..Belfield.and.Henry.M..Levin.(eds.),.The Price We Pay: Economic and Social Consequences of Inadequate Education,.Washington,.DC:.Brookings.Institution.Press,.2007.
2.For.a.summary.of.some.of.this.debate,.see.Jay.Matthews,.“Dropout.Data.Raise.Questions.on.2.Fronts,”.The Washington Post,.May.23,.2006..

4 • Chasing the High School Graduation Rate
gaps.among.racial.and.ethnic.subgroups..It.is.also.helpful.to.state.an.important.caveat:.It.is.unrealistic.to.think.that.we.will.be.able.to.obtain.actual.counts.of.those.who.get.diplomas.among.those.who.started.high.school.as.accurately.as,.say,.a.banker.can.ascertain.how.many.dollars.are.in.the.vault..But.we.can.and.should.strive.for.a.standard.similar.to.the.national.unemployment.rate,.which.is.also.an.estimate,.albeit.a.very.reliable.one..It.is.also.the.case.that.a.single.graduation.rate.will.not.meet.all.of.our.information.needs,.for,.among.other.reasons,.how.that.rate.is.calculated.will.depend.on.the.purpose.for.which.it.is.used..Will.it.be.used.to.monitor.the.status.of.the.education.system?.Will.it.be.used.for.accountability?
A.primary.use,.of.course,.is.to.reveal.the.magnitude.of.the.problem.we.face,.at.all.levels,.and.whether.and.where.we.are.improving.....or.not..Most.recently,.policymakers.have.begun.considering.using.the.graduation.rate.in.the.school.accountability.system.—.at.both.federal.and.state.levels..Should.such.a.policy.take.a.place.alongside.standardized.achievement.tests.in.accountability.systems?.This.report.advances.some.of.the.major.factors.that.should.be.taken.into.account.in.consideration.of.such.a.policy.
The.overall.conclusion.is.that.we.need.much.more.of.an.investment.in.the.national.Census.Bureau.survey.that.tells.us.what.percentage.of.the.population.has.graduated.from.high.school,.for.different.age.groups.and.different.subgroups.of.the.population..We.also.need.to.improve.the.data.collected.from.the.states.and.maintained.by.the.National.Center.for.Education.Statistics.(NCES).on.enrollment.and.diplomas.awarded..We.should.reinstate.a.long-available.publication.series.on.graduation.rates.based.on.the.ratio.of.diplomas.issued.to.the.size.of.the.cohort.that.enters.high.school,.again.using.Census.Bureau.data..These.improvements.need.to.take.place.even.as.many.states.are.beginning.to.develop.longitudinal.student.tracking.systems..
With.regard.to.the.use.of.the.graduation.rate.for.accountability.purposes.and.sanctions,.the.report.urges.that.the.considerable.research.on.the.reasons.for.dropping.out.of.school,.and.the.antecedents.of.doing.so,.be.reviewed.to.ascertain.what.schools.can.and.cannot.control.once.the.student.enters.the.ninth.grade..And.finally,.the.report.includes.what.the.author.thinks.are.the.best.estimates.now.available.of.graduation.rates.and.trends.for.states.and.for.the.nation.
The.first.section.of.the.report.discusses.obtaining.reliable.national.survey.data.on.the.graduation.status.of.young.adults.and.of.the.population.as.a.whole..The.second.section.makes.the.case.for.the.need.to.expand.and.improve.the.point-in-time.data.on.high.school.students.in.the.NCES.Common.Core.of.Data.(CCD).system.and.the.use.of.that.database.for.estimating.graduation.rates..This.recognizes.how.much.easier.it.should.be.to.count.students.who.are.in.school.at.any.point.versus.tracking.the.same.students.over.many.years..
The.third.section.discusses.the.longitudinal.tracking.approach.put.forward.by.the.National.Governors.Association.and.others,.an.approach.that.requires.tracking.the.same.students.from.entry.into.high.school.through.graduation.or.school.leaving..The.report.provides.examples.of.past.experiences.in.longitudinal.designs,.the.problems.encountered.and.addressed,.and.the.unique.requirements.of.using.data.for.school.accountability.compared.with.other.approaches,.such.as.those.addressed.in.sections.one.and.two.that.strive.to.learn.how.many.people.do.not.graduate regardless of why they dropped out.
The.fourth.section.discusses.the.knowledge.base.about.the.antecedents.of.dropping.out.of.school.and.its.importance.in.making.decisions.about.using.a.graduation.rate.in.a.sanctions-based.accountability.system..The.fifth.section.provides.an.assessment.of.what.is.presently.known.about.high.school.graduation.rates.and.the.changes..that.have.occurred.over.the.past.40.years..Finally,.the.report.provides.a.short.summary.of.the.principal.conclusions.

Chasing the High School Graduation Rate • 5
The.long-standing.national.survey.on.the.high.school.completion.rate.has.been.provided.by.
the.Current.Population.Survey.(CPS).conducted.by.the.U.S..Bureau.of.the.Census..The.results.of.this.survey.are.reported.in.newspapers.every.year,.and.its.data.were.used.to.track.our.national.education.goal.of.having.a.90.percent.high.school.graduation.rate.by.2000..NCES.has.used.the.CPS.results.annually.to.report.what.it.calls.the.“status”.graduation.rate:.the.percentage.of.a.young-adult.age.group.that.has.graduated.from.high.school..The.NCES.results.are.reported.for.the.nation.and.for.the.50.states..In.2008,.as.will.be.pointed.out.later.in.this.section,.the.Census.Bureau.switched.the.collection.of.educational.attainment.data.to.the.American.Community.Survey.(ACS),.which.has.a.broader.population.coverage.and.provides.data.for.smaller.geographic.areas.than.does..the.CPS.
To.calculate.an.estimated.high.school.graduation.rate,.a.half.dozen.or.so.independent.researchers,.including.this.author,.have.used.these.NCES.state-reported.data.on.enrollments.and.diplomas..We.found.much.lower.graduation.rates,.and.a.larger.gap.between.majority.and.minority.populations,.than.was.commonly.reported.by.the.Census.Bureau.and.by.the.states.themselves..We.criticized.the.CPS.data.for.a.variety.of.short-comings..However,.Lawrence.Mishel.and.Joydeep.Roy.of.the.Economic.Policy.Institute.refused.to.write.off.the.national.survey.and.conducted.a.groundbreaking.analysis.of.the.data,.placing.it.under.a.magnifying.glass.for.the.first.time.3.They.examined.the.data.intensely.and.adjusted.it.for.such.factors.as.the.CPS.including.GED.certificates.received.and.not.including.military.or.prison.populations.in.its.sample.4.Although.their.
adjustments.left.the.CPS.graduation.rate..still.higher.than.that.reported.by.other.researchers,.and.the.differences.continued.to.be.debated,.Mishel.and.Roy.established.this.basic.point:.The.graduation.rates.coming.from.the.CPS.cannot.be.used.to.track.the.national.graduation.rate.without.making.some.complex.statistical.and.analytical.adjustments.
We.learned.more.about.the.complexity.of.the.issues.regarding.the.high.school.graduation.rate.from.the.next.team.to.work.on.it..The.discussions.and.debates.were.a.positive.development.and.gained.the.attention.of.James.J..Heckman,.a.Nobel.Prize.winner.in.economics.from.the.University.of.Chicago,.and.his.colleague.Paul.A..LaFontaine.of.the.American.Bar.Foundation..They.designed.and.conducted.a.statistically.complex.analysis.on.all.of.the.sources.of.national.graduation.rate.estimates,.which.resulted.in.the.report.The American High School Graduation Rate: Trends and Levels.5.The.findings.themselves.were.as.startling.as.the.report’s.title.is.prosaic.
Heckman.and.LaFontaine.found.the.CPS.graduation.estimates.much.too.high.and.the.reported.gap.between.majority.and.minority.students.much.too.low..They.also.concluded.that.the.lowest.graduation.estimates.made.by.the.independent.researchers.were.lower.than.they.should.be.—.or.at.least,.any.in.the.study.that.used.the.available.ninth-grade.enrollment.as.the.starting.point.as.an.estimate.of.how.many.students.entered.the.ninth.grade..In.contrast.to.the.CPS-reported.graduation.rate.of.about.90.percent.over.the.past.several.decades,.and.much.progress.in.closing.the.gap.between.majority.and.minority.students,.Heckman.and.LaFontaine.summarized.their.findings.as.follows:.
Needed: A High-Quality National Survey of the High School Graduation Rate
3.Lawrence.Mishel.and.Joydeep.Roy,.Rethinking High School Graduation Rates and Trends, Economic.Policy.Institute,.Washington,.DC,.2006.4.The.GED,.or.General.Education.Development.Tests,.is.a.long-standing.high.school.equivalency.system.operated.by.the.American.Council.on.Education.5..James.J..Heckman.and.Paul.A..LaFontaine,.The American High School Graduation Rate: Trends and Levels,.NBER.Working.Papers.13670,.National.Bureau.
for.Economic.Research,.Inc.,.2007.

6 • Chasing the High School Graduation Rate
This paper uses multiple data sources and unified methodology to estimate the trends and levels of the U.S. high school graduation rate. Correcting for important biases that plague previous calculations, we establish that (a) the true high school graduation rate is substantially lower than the official rate ... ; (b) it has been declining over the past 40 years; (c) majority/minority graduation rate differentials are substantial and have not converged over the past 35 years; (d) the decline in high school graduation rates occurs among native populations and is not solely a consequence of increasing proportions of immigrants and minorities in American society; (e) the decline in high school graduation explains part of the recent slowdown in college attendance; and (f ) the pattern of the decline of high school graduation rates by gender helps to explain the recent increase in male-female college attendance gaps.
Statistical.experts.may.debate.these.conclusions,.which.will.likely.startle.many,.and.we.may.learn.more.as.the.chase.for.the.true.graduation.rate.continues..The.problem.is.large.and.real,.and.the.attention.it.is.now.receiving.is.fully.justified..What.is.needed.is.a.substantially.improved.Census.Bureau-type.survey.to.track.progress.over.time.
By.applying.expertise.in.statistics.and.knowledge.of.the.inner.structures.of.the.various.national.statistical.series,.Heckman.and.LaFontaine.have.demonstrated.the.adjustments.to.the.CPS.data.that.are.necessary.
• Data.on.GED.certificates.earned.must.be.taken.out.of.the.CPS,.although.they.are.important.and.should.be.tracked.separately.
• Data.on.the.prison.population.must.be.added.
• Data.on.immigrants.who.did.not.go.to.school.in.the.United.States.must.be.removed,.although.if.we.are.interested.in.workforce.education.levels,.the.data.should.be.tracked.for.that.purpose.
• Data.on.the.military.population.should.be.included,.although.this.will.make.only.a.small.difference.in.overall.rates.
• Any.undercounts.of.hard-to-find.subgroups.of.the.population.must.be.recognized..Heckman.and.LaFontaine.found.that.the.CPS.misses.a.third.of.Black.males,.ages.20.–.296,.compared.with.the.census..Notably,.although.the.census.has.largely.eliminated.its.well-known.population.undercount,.the.2000.census.still.missed.somewhere.between.6.5.and.8.1.percent.of.Black.males.aged.18.–.297.—.a.fact.not.pointed.out.by.Heckman.and.LaFontaine.
In.2008,.the.Bureau.of.the.Census.took.a.major.step.forward.by.transferring.the.collection.of.these.status.graduation.rates.from.the.CPS.to.the.ACS,.which.includes.the.prison.and.military.populations.and.attempts.to.locate.hard-to-enumerate.populations..This.survey.also.collects.information.on.the.year.of.entry.into.the.country,.making.it.possible.to.estimate.those.educated.outside.the.country..The.question.remains.as.to.how.much.closer.this.survey.will.come.to.finding.the.third.of.Black.males.aged.20.–.29.who.were.missed.by.the.CPS.—.and.the.additional.Black.males.missed.by.the.2000.census,.to.which.CPS.coverage.was.compared.
6.Heckman.and.LaFontaine,.p..12.7.J..Gregory.Robinson,.Accuracy and Coverage Evaluation: Demographic Analysis Results, U.S..Bureau.of.the.Census,.Table.7,.March.2001.

Chasing the High School Graduation Rate • �
Another.problem.with.accepting.these.estimates.of.the.high.school.graduation.rate,.whether.from.the.CPS.or.the.ACS,.is.the.way.the.information.is.collected..These.surveys.largely.rely.on.telephone.calls.in.which.a.caller.reads.the.questions.to.one member.of.the.household,.who.answers.for.all members..The.responding.individual.may.not.give.the.correct.answer,.not.necessarily.by.intention.to.mislead,.but.because.he.or.she.does.not.have.complete.knowledge.about.all.members.of.the.household.
Distinguishing.types.of.certifications.that.might.be.thought.of.as.a.high.school.diploma.on.the.part.of.those.who.answer.the.telephone.from.the.Census.Bureau.is.not.as.simple.as.it.sounds,.and.it.is.becoming.more.complex..For.example,.a.student.may.complete.12.grades.of.school.but.not.obtain.a.graduation.diploma..The.respondent.should.report.it.this.way.but.may.not.do.so..Some.states.award.a.“completion.certificate.”.While.such.a.certificate.is.not.equivalent.to.a.high.school.diploma,.the.respondent.may.not.understand..the.difference.
Some.states.—.among.them.New.Jersey.—.give.a.regular.high.school.diploma.to.a.person.who.is.awarded.a.GED.certificate..In.2007,.28.states.awarded.“alternative.credentials”.for.those.not.meeting.all.standard.requirements.for.high.school.graduation..This.practice.may.cause.confusion.about.who.has.graduated.and.who.has.not..For.example,.in.New.Mexico,.a.student.could.be.disqualified.from.receiving.a.high.school.diploma.by.failing.the.high.school.exit.exam.while.meeting.all.of.the.other.requirements..Increasingly,.online.high.schools.award.different.kinds.of.diplomas.that.may.or.may.not.be.recognized.by.a.state.education.system.8.
Distinguishing.among.this.variety.of.certificates.is.not.easy,.for.either.the.respondent.or.the.Census.Bureau.trying.to.elicit.accurate.information.
Another.indication.of.the.difficulties.is.that.since.the.early.1990s,.if.the.respondent.reports.that.a.person.has.graduated.from.high.school,.the.CPS.has.asked.whether.the.person.was.awarded.a.regular.diploma.or.a.GED.certificate..However,.the.CPS.stopped.reporting.the.results.of.this.question.because.it.did.not.have.confidence.in.the.answers.received.—.which.raises.doubt.about.other.distinctions.perceived.by.survey.respondents.as.to.what.constitutes.a.valid.diploma.
Some.preliminary.field.work.identifying.and.keeping.track.of.current.practices.will.be.required.to.enable.the.classification.of.different.kinds.of.high.school.certificates..Perhaps.the.composition.of.the.total.graduation.rate.will.need.to.be.disaggregated.into.components.that.recognize.different.kinds.of.diplomas.and.tracks.trends.
Next,.there.is.the.additional.—.and.major.—.problem.of.relying.on.one.question.in.the.CPS,.and.for.that.matter,.the.decennial.census.and.the.ACS.as.well..That.one.question.asks.for.the highest level of educational attainment, not.for.the.completion level.of.a.particular.rung.on.the.education.ladder.
I.have.seen.no.comment.about.this.distinction.in.any.of.the.analyses.of.the.problems.with.measuring.the.high.school.graduation.rate,.even.though.a.high.school.diploma.may.or.may.not.be.required.to.enter.a.postsecondary.institution,.or.particular.programs.in.a.postsecondary.school..Community.colleges.increasingly.accept.dropouts,.particularly.for.remedial.courses..A.well-known.person.in.a.large.foundation.told.me.some.time..
8.See.Sam.Dillon,.“Online.Schooling.Grows,.Setting.Off.a.Debate,”.New York Times, February.1,.2008.

� • Chasing the High School Graduation Rate
ago.that.he.had.not.finished.high.school.but.went.to.college,.and.he.had.not.finished.college.but.went.to.graduate.school.
For.the.person.who.has.not.graduated.from.high.school.but.has.enrolled.in.a.community.college.for.three.months,.the.appropriate.choice.among.those.offered.in.these.surveys.is.“some.college.”.When.the.data.are.reported,.that.person.has.to.be.counted.as.having.completed.high.school,.since.nothing.else.is.known.about.their.level.of.attainment..Or.a.person.may.attend.one.of.the.many.GED.programs.offered.by.community.colleges,.and.the.household.member.who.answers.the.survey.questions.for.the.household.may.report.that.person.as.having.“some.college.”.Dual.enrollment.programs.may.result.in.reporting.high.school.students.as.having.“some.college,”.and.such.programs.are.growing..No.other.information.is.available,.since.there.are.no.follow-up.questions.
Of.course,.we.do.not.know.how.many.non-high.school.graduates.are.reported.as.having.some.college,.or.whether.the.number.is.growing,.or.whether.it.varies.among.population.subgroups..But.that.is.the.point:.we don’t know..One question.will.provide.only.very.gross.information.
All.that.we.do.know.about.trends.in.high.school.completion/graduation.for.a.particular.age.group.or.cohort.of.the.population.is.based.on.this.single.question,.read.over.the.phone,.to.one.member.of.a.household,.to.learn.about.all.other.members.of.the.household..I.have.located.no.field.studies.on.the.validity.of.the.answers,.or.on.the.posing.of.different.or.more.questions,.or.on.whether.getting.responses.from.each.member.of.the.household.might.change.or.improve..the.estimates.
The.data.resulting.from.this.one.question.about.the.highest.level.of.education.attainment.have.been.subjected.to.sophisticated.statistical.analyses..However,.no.such.analysis.will.make.a.silk.purse.out.of.information.coming.from.that.single.question..It.is.highly.unlikely.that.the.Census.Bureau.and.NCES.can.do.better.with.the.current.budget.allocation.for.collection.of.data.on.high.school.completion,.given.that.additional.resources.would.be.required.for.the.necessary.field.testing.and.experimentation..The.increasing.level.of.attention.given.to.the.high.school.dropout.rate.and.advocacy.efforts.to.lower.it.has.not.resulted.in.concrete.efforts.to.create.a.national.statistical.indicator.that.would.yield.confidence.in.showing.the.proportion.of.any.population.group.with.a.diploma..While.the.recent.transfer.of.data.from.the.CPS.to.the.ACS.will.be.helpful.on.some.fronts.regarding.population.coverage,.the.survey.will.still.rely.on.one.telephone.question.
There.are.instructive.examples,.however,.in.other.parts.of.government..The.Monthly.Report.on.the.Labor.Force.(MRLF).is.a.model.of.what.can.happen.when.the.need.for.a.reliable.high-quality.indicator.is.considered.necessary.as.part.of.reaching.an.important.national.policy.objective..The.MRLF.is.a.statistical.survey.program.carried.out.as.a.partnership.between.the.Bureau.of.the.Census.and.the.Bureau.of.Labor.Statistics.(BLS).
The.MRLF.has.long.been.the.combined.result.of.an.ongoing.data.collection.program.and.a.research.and.development.effort.to.refine.and.improve.it.—.and.one.responsive.to.concerns.raised.about.it..For.example,.in.the.research.effort,.key.questions.have.been.changed.and.monitored.to.see.how.the.responses.would.change..During.the.1950s.and.1960s,.when.debates.erupted.over.

Chasing the High School Graduation Rate • 9
whether.the.employment.rate.was.understated.because.people.were.classified.as.out.of.the.labor.force.when.they.had.become.too.discouraged.to.look.for.work,.the.BLS.conducted.a.research.program.to.find.the.best.way.to.measure.“discouraged.workers.”
The.BLS.has.one.“official”.measure.of.the.unemployment.rate..However,.as.an.outgrowth.of.controversy,.research,.and.responsiveness.to.criticism,.every.month.it.publishes.six.“alternative.measures.of.labor.underutilization”.in.addition.to.the.official.measure.of.the.unemployment.rate.9.This.is.not.to.suggest.that.an.alternative.measure.of.the.graduation.rate.is.needed,.although.it.may.make.sense.to.separately.identify.the.different.kinds.of.certifications.referred.to.as.“high..school.diplomas.”
Sometimes.such.changes.have.been.the.result.of.the.appointment.of.a.prestigious.national.commission,.such.as.the.President’s.Committee.to.Appraise.Employment.and.Unemployment.Statistics.in.1962..The.establishment.of.a.similar.commission.would.be.a.good.start.on.a.serious.effort.to.create.a.real.program.for.measuring.high.school.completion/graduation,.as.well.as.other.levels.of.school.completion..Such.an.effort.would.need.to.be.implemented.through.a.partnership.of.NCES.and.the.Census.Bureau,.and.presumably.would.be.carried.out.through.the.ACS.with.the.counsel.of.outside.advisory.groups..It.would.require.the.oversight.of.the.Office.of.Statistical.Standards.in.the.Office.of.Management.and.Budget,.as.that.office.has.done.over.the.years.in.the.case.of.the.MRLF.
9.See.Table.A12.of.the.monthly.MRLF.release.for.December.2007.(www.bls.gov/news.release/emlit.t12.htm).downloaded.1/28/2008.
10 • Chasing the High School Graduation Rate
The.data.currently.collected.by.schools,.districts,.and.states,.and.provided.to.NCES,.
can.be.used.to.estimate.school.graduation.rates.if.the.data.are.used.correctly,.if.there.are.quality.controls,.and.if.some.additional.data.are.collected.
For.many.years,.NCES.has.collected.data.from.state.education.departments.on.enrollments.by.grade.and.on.high.school.diplomas.awarded,.and.has.continually.worked.to.improve.the.reporting..The.Constitution.gives.the.responsibility.for.education.to.the.states.and.not.to.the.federal.government..It.is.not.surprising,.therefore,..that.the.states.report.data.in.different.ways..and.that.efforts.toward.standardization.have..had.to.be.negotiated.
Until.recently,.the.only.estimates.NCES.made.of.the.percentage.of.a.cohort.of.students.graduating.from.high.school.within.the.age.range.of.typical.graduation.was.the.ratio.of.high.school.diplomas.(from.the.CCD.system).granted.to.the.number.of.17-year-olds.in.the.population.(obtained.from.the.Census.Bureau).10.And.until.recently,.this.“graduation.rate”.was.issued.for.every.year,.extending.the.data.back.to.the.late.1800s..This.statistic.has.been.useful.in.tracing.the.steady.increase.in.the.graduation.rate.to.a.peak.of.77.percent.in.the.late.1960s,.dropping.to.70.percent.by.2000,.and.then.turning.up.since,.although.not.reaching.the.previous.high..
Although.students.graduate.from.high.school.at.different.ages,.the.total.of.17-.or.18-year-olds.is..a.reasonable.proxy.for.the.population.expected..to.have.the.opportunity.to.graduate.from..high.school.
Although.one.might.wonder.about.the.accuracy.of.school-reported.enrollment.data.given.that.definitions.can.vary.across.states.—.and.even.within.states.and.districts.—.it.is.reasonable.to.expect.that.reports.of.the.number.of.official documents, such.as.high.school.diplomas.issued.by.schools.and.school.districts,.would.be.accurate..Moreover,.the.use.of.official.census.data.on.the.number.of.17-year-olds.(as.the.denominator.in.the.calculation).avoids.any.debate.over.the.quality.of.that.number..Thus,.this.longstanding.series.should.continue.to.be.made.available.11.This.measure.has.the.advantage.of.including.graduation.from.both.public.and.private.schools.and.provides.a.picture.of.the.educational.attainment.of.all.of.a.population.of.high.school.graduation.age,.wherever.they.might.have.come.from.or.gone.to.school.12
Outside Researchers and Task ForcesSeveral.years.ago,.a.half.dozen.or.more.
researchers.began.making.independent.estimates.of.public.high.school.graduation.rates.by.using.the.enrollment.and.diploma.data.from.the..CCD.collected.from.each.state.and.published.
Making the Most of What We Have: Expanding and Improving Current Federal
Data Collection Efforts to Report High School Graduation Rates
10..A.program.started.in.the.early.1990s.recorded.annual.“school.leaver”.rates,.with.procedures.to.establish.a.total.leaver.rate.over.a.four-year.period..NCES.does.not.consider.it.a.graduation.rate,.and.for.the.latter.purpose,.has.recently.created.an.indicator.it.calls.the.Averaged.Freshman.Graduation.Rate.discussed.later.in.this.report..These.leaver.rates,.summed.up.over.four.years,.continue.to.be.reported.by.many.states.as.a.graduation.rate.
11..Accuracy.also.depends.on.the.population.estimates.for.17-year-olds.projected.by.the.Bureau.of.the.Census.for.each.year..In.my.2004.report,.One Third of a Nation, I.used.1990.and.2000.census.data.to.reach.estimates.of.the.graduation.rates.for.those.years,.finding.a.slight.decline.from.1990.to.2000..I.also.made.estimates.for.each.state,.using.both.17-.and.18-year-olds.at.the.time.of.graduation.that.year.as.determined.by.aging.the.data.from.the.12th.grade.NAEP.assessment.conducted.in.the.spring.to.get.17-.and.18-year-olds.in.their.appropriate.proportions.
12..The.current.focus.is.on.a.measure.to.use.for.public.school.accountability..However,.we.also.need.to.know.how.well.all.our.young.population.—.the.future.workforce.—.is.prepared..Both.the.“second.chance”.system.and.the.regular.school.system.are.involved.

Chasing the High School Graduation Rate • 11
by.NCES..The.early.estimates.that.became.most.widely.known.at.the.time.were.those.of.Jay.Greene.and.the.joint.efforts.of.Christopher.Swanson.and.Duncan.Chaplin..Although.the.different.researchers.went.about.their.work.in.somewhat.different.ways,.all.focused.on.using.the.best.data.available.to.estimate.how.many.students.entered.high.school.and.how.many.diplomas.were.issued.four.years.later..The.researchers.were.limited.to.using.CCD.data,.for.no.other.data.were.available.
Their.calculations.resulted.in.headlines.revealing.that.these.new.estimates.were.typically.lower.than.the.rates.that.the.states.were.reporting,.and.particularly,.they.were.lower.than.those.rates.being.reported.under.the.requirements.of.the.NCLB..This.requirement.in.NCLB.spurred.efforts.to.get.better.state-level.data,.and.two.task.forces.were.appointed.to.identify.problems.and.propose.remedies..One.task.force.was.created.by.the.National.Institute.of.Statistical.Science.at.the.request.of.NCES.in.2004;.the.other.was.created.by.the.National.Governors.Association.(NGA),.which.reported.in.2005.
Both.task.forces.recommended.tracking.individual.students.over.time.—.over.years,.in.fact.—.and.that.has.become.a.large-scale.effort.in.a.growing.number.of.states..This.is.discussed.in.detail,.beginning.on.page.17..While.data.that.emerge.from.longitudinal.tracking.systems.will.be.important,.we.also.need.to.build.on.the.existing.CCD.data.system,.since.we.need.the.estimates.made.with.those.data.as.well.
Over.the.last.several.years,.discussion.and.debate.have.continued.about.the.best.way.to.estimate.graduation.rates.using.the.available.
enrollment.and.diploma.data.13.Some,.including.this.author,.have.criticized.the.use.of.ninth-grade.enrollment.(as.an.estimate.of.the.number.of.students.who.enter.ninth.grade).as.reported.by.the.states.to.NCES.because.of.a.development.over.the.last.decade..As.efforts.to.curtail.social.promotion.gain.ground.and.as.standardized.testing.comes.into.use.for.promotion.purposes,.more.and.more.students.are.being.held.back.in.the.ninth.grade..The.result.is.that.we.are.seeing.a.growing.ninth-grade.“bulge,”.making.that.number.no.longer.suitable.as.an.estimate.of.how.many.entered.the.ninth.grade..If.this.inflated.ninth-grade.enrollment.is.used.for.the.base.year.in.calculating.graduation.rates.based.on.diplomas.issued.four.years.later,.it.inflates.the.denominator.in.the.calculation.and.produces.a.graduation.rate.lower.than.the.real.rate..And.as.the.bulge.grows,.it.throws.off.the.measurement.of.trends.in.graduation.rates.
Of.course,.the.ninth-grade.enrollment.rate.has.always.comprised.students.held.back.and.has.never.been.an.accurate.measure.of.those.entering.the.ninth.grade..Also,.there.are.dropouts.during.the.ninth.grade..Since.the.bulge.varies.considerably.by.states,.there.is.a.differential.effect.on.the.state.graduation.estimates.when.ninth-grade.enrollment.is.used.as.the.denominator..Recognizing.these.problems,.Jay.Greene.adopted.the.approach.of.averaging.eighth-,.ninth-,.and.10th-grade.enrollments.as.the.best.way.to.estimate.the.number.of.students.entering.the.ninth.grade.
The.U.S..Department.of.Education.and.NCES.used.a.similar.approach.in.responding.to.the.need.to.produce.state.estimates.useful.for.checking.what.the.states.were.reporting.under.
13..An.extensive.analysis.of.the.CCD.and.its.uses.in.estimating.graduation.rates.has.been.done.by.Larry.Mishel.and.Joydeep.Roy.and.was.published.as.this.report.was.being.completed..Those.interested.in.the.subject.can.see.“Using.Administrative.Data.to.Estimate.Graduation.Rates:.Challenges,.Proposed.Solutions,.and.Pitfalls,”.Education Policy Analysis Archives,.June.4,.2008.

12 • Chasing the High School Graduation Rate
NCLB.and.to.offer.states.an.estimated.rate.they.could.use..Recently,.NCES.constructed.its.own.estimates.using.the.enrollment.and.diploma.data,.and.averaged.the.eighth-,.ninth-,.and.10th-grade.enrollment.—.a.method.called.the.Averaged.Freshman.Graduation.Rate.(AFGR).—.with.estimates.somewhat.similar.to.Greene’s.and..higher.than.Swanson’s.
Because.of.the.ninth-grade.bulge,.another.approach.was.developed..Heckman.and.LaFontaine.decided.to.use.eighth-grade.enrollment,.making.no.comment.about.the.fact.that.others,.including.NCES,.had.settled.on.an.average.of.the.three.grades,.and.that.this.produced.rates.between those.obtained.by.using.only.the.eighth.or.ninth..grades..Heckman.and.LaFontaine,.then,.used..the.grade.that.produced.the.highest.graduation.rate.estimates.
But.is.using.eighth-grade.enrollment,.as.adopted.by.Heckman.and.LaFontaine,.the.best.way.to.go?.I.believe.there.is.a.problem.with.using.the.eighth.grade.as.the.best.estimate.of.how.many.students.enter.public.high.school.in.the.ninth.grade..In.2007,.based.on.National.Assessment.of.Educational.Progress.(NAEP).data,.9.percent.of.all.eighth.graders.were.in.private.schools..Since.a.proportion.of.private.school.students.switch.to.public.schools.for.high.school.in.ninth.grade,.using.eighth-grade.public.school.enrollment.data.as.the.starting.point.may.produce.a.higher.public.school.graduation.rate.four.years.later.than.would.using.the.number.entering.public.school.at.the.beginning.of.the.ninth.grade,.and.there.would.be.great.variation.among.the.states.in.transfers.from.public.to.private.schools.14
Even.before.this.ninth-grade.bulge.appeared.in.the.1990s,.there.had.long.been.about.5.percent.more.ninth.graders.than.eighth.graders.the.year.before,.making.eighth-grade.enrollment.inappropriate.for.use.as.an.estimate.of.how.many.entered.the.ninth.grade.(see.Table.1).
The.national.and.state-by-state.results.of.using.the.three.principal.approaches.discussed.above.are.shown.in.the.Appendix..One.uses.eighth-grade.enrollment.as.an.estimate.of.entering.ninth-grade.students;.one.is.taken.from.Education Week’s “Diplomas.Count”.report,.which.uses.the.ninth-grade.enrollment.as.the.starting.point;.and.one.uses.the.NCES.AFGR..The.rates.are.for.the..class.of.2005.
At.the.national.level,.the.rates.range.from.78.3.(eighth.grade).to.70.6.(ninth.grade).to.74.7.(averaged).15.In.some.states,.like.Indiana,.the.differences.among.the.three.approaches.are.fairly.small..In.others,.like.Arizona,.the.District.of.Columbia,.and.Nevada,.there.are.large.differences.
14..Using.2004.public.school.eighth-grade.enrollment.data.from.NCES.would.mean.that.3,824,670.were.enrolled.in.public.schools.and.another.378,264.were.enrolled.in.private.schools..NCES.reports.only.the.total.private.school.enrollments.for.K.–.8.and.the.total.for.high.school.
15..As.this.report.was.going.to.press,.the.National.Center.for.Education.Statistics.issued.a.new.report.for.the.school.year.2005.–.06..The.report.shows.a.decline.in.the.Averaged.Freshman.Graduation.Rate.(AFGR).from.74.7.percent.for.2004.–.05.to.73.4.percent.for.2005.–.06..See.Robert.Stillwell.and.Lee.Hoffman,.Public School Graduates and Dropouts from the Common Core of Data,.(NCES.2008-353),.National.Center.for.Education.Statistics,.2008.

Chasing the High School Graduation Rate • 13
.Given.the.problems.discussed.above,.and.knowing.that.a.longitudinal.tracking.system.was.being.pursued,.NCES.undertook.an.exhaustive.study.of.the.best.way.to.make.estimates.of.graduation.rates.using.the.data.available.in.the.CCD..It.examined.each.of.the.methods.using.different.approaches..One.approach.was.to..choose.two.states.with.fully.developed.methods..of.tracking.each.individual.student.who.entered.the.ninth.grade.—.the.gold-standard.way.—..and.compare.the.results.from.several.methods.available.to.the.rate.coming.from.longitudinal.tracking..NCES.concluded.that.the.method.that.worked.best.was.the.AFGR,.using.enrollment.data.for.the.eighth,.ninth,.and.10th.grade.to.estimate.the.entering.enrollment.in.the.ninth.grade..NCES.makes.a.clear.case.for.using.this.approach,.based.on.the.data.now.available.16
But.the.best approach.would.be.for.the.states.to.report.how many new students enrolled at the beginning of.the.ninth.grade,.especially.if.the.high.school.graduation.rate.is.to.be.used.for.purposes.
of.school.accountability,.and.to.get.additional.data.through.the.CCD.system.to.make..better.estimates.
Another.issue.is.the.need.for.an.“on.time”.graduation.rate,.meaning.that.a.student.graduated.in.four.years..However,.the.states.report.one number.for.all.diplomas.issued.by.public.schools.for.the.year..That.includes.those.graduating.early.at.age.15.or.16,.those.graduating.at.the.typical.age.of.17.and.18,.and.those.graduating.at.19.and.older..This.can.be.taken.as.the.number.of.diplomas.earned.—.at.any.time.—.by.the.cohort.of.students.who.enter.high.school.in.a.particular.year,.but.not.as.the.particular.year.they.received.their.diploma..In.the.case.of.the.population.of..17-year-olds.and.the.diploma.rates.discussed.above,.this.also.can.be.taken.as.the.graduation.rate.for.a.cohort.of.students.entering.high.school,.regardless.of.when.they.graduated..Consequently,.on-time.graduation.estimates.could.be.made.only.if.states.reported.diploma.data.broken.down.by.the.year.of.high.school.entry.17
Table 1: Public School Enrollment in Grade 8 and Grade 9 (1 Year Later)
Year Grade 8 Grade 9 (1.Year.Later) Percent Difference
1955.–.56 2,357 2,368 --1960.–.61 3,083 3,156 +2%Fall.1965 3,186 3,318 +4%Fall.1970 3,601 3,781 +5%Fall.1975 3,636 3,825 +5%Fall.1980 3,086 3,286 +6%Fall.1985 2,982 3,256 +9%Fall.1991 3,020 3,352 +11%Fall.1995 3,356 3,801 +13%Fall.2000 3,538 4,012 +13%Fall.2003 3,809 4,281 +12%
Source.of.data.for.1955.–.1985,.Digest of Education Statistics, National.Center.for.Education.Statistics,.1992,.Table.10.Source.of.data.for.1991.–.2003,.Digest of Education Statistics, National.Center.for.Education.Statistics,.2006,.Table.10.
16..National.Center.for.Education.Statistics,.User’s Guide to Computing High School Graduation Rates, Volumes.1.and.2,.NCES.2006.–.604..and.605,.August.2006.
17.Or.at.least,.the.distribution.by.year.of.entry.could.be.checked.from.time.to.time.on.a.sample.basis.

14 • Chasing the High School Graduation Rate
Next StepsWhat.steps.can.be.taken.to.greatly.improve.
graduation.rate.estimates.using.data.collected..by.the.states.on.enrollment.and.diplomas..granted,.through.the.NCES.CCD.program?..The.needs.include:
• Having schools report the number of students entering the ninth grade at the beginning of the year..This.would.eliminate.the.concern.about.the.ninth-grade.bulge18.and.the.need.to.average.enrollments.for.grades.8,.9,.and.10..These.data.are.already.collected.by.schools.so.they.can.report.their.Average.Daily.Attendance.
• Having states, in addition to reporting enrollments by whether students are classified as freshmen, sophomores, juniors, or seniors, report whether they are first-, second-, third-, fourth-, fifth-, or sixth-year students..Russell.Rumberger.has.suggested.this,.and.it.would.help.not.only.with.graduation.rate.estimates,.but.also.would.help.show.a.pattern.of.progression.through.high.school.and.changes.in.the.pattern.over.time..Again,.this.is.only.a.count.of.the.records.existing.within.a.particular.school..Not.all.schools.will.have.records.of.attendance.at.other.high.schools,.which.would.require.successful.tracking.of.students.over.time.
• Having states break down the number of diplomas issued each year by the number of years the student was enrolled in that high school and what the student has reported about previous enrollment in other high schools..It.also.is.desirable.to.know.whether.the.diplomas.went.to.students.who.dropped.out.but.re-entered.a.particular.
school,.or.to.students.in.public.adult.education.programs,.or.to.students.who.had.obtained.a.GED.certificate..Of.course,.student.tracking.data.are.not.typically.available.for.this,.except.in.states.using.the.longitudinal.system,.and.school.reports.would.be.based.on.the.records.they.have..All.that.is.reported.and.available.now.is.the.total.number.of.diplomas.issued.
• Identifying diplomas by type, since more and more types have come into play..Some.diplomas.have.different.rankings,.such.as.“standard”.or.“advanced.recognition,”.and.some.alternative.diplomas.may.not.meet.the.traditional.definition.of.a.high.school.diploma..It.also.would.be.good.to.know.how.many.graduates.are.“completers”.who.do.not.get.a.certificate..It.will.be.difficult.to.establish.a.standardized.set.of.classifications.that.the.states.can.follow,.and.that.will.be.possible.only.after.we.know.all.the.kinds.of.certificates.being.issued.19
• Assuring that the data collected on gender, race, and ethnicity are of sufficient quality to disaggregate the estimate..No.system.is.complete.without.such.estimates..Also,.a.comprehensive.report.should.be.published.annually.with.detail.down.to.the.smallest.geographical.classification.permitted.by.the.data..The.NCES.has.long.published.a.congressionally.required.and.annual.comprehensive.report.on.“status”.and.“event”.dropout.rates..Recently,.the.AFGR.has.been.included..However,.this.report.provides.only.aggregated.data.at.the.state.level.on.completion.rates,.and.nothing.by.race/ethnicity.and.gender.20.Also,.in.July.2007,.NCES.published.a.separate.report.in.which.the.AFGR.provided.
18..This.is.a.simple.point-in-time.count.of.the.number.of.students.who.appear.in.a.school.at.the.beginning.of.the.year.and.a.summation.of.these.reports.at.the.state.level,.not.the.result.of.tracking.individual.students.over.time..A.school,.not.having.a.record.of.any.prior.enrollment,.may.not.know.whether.this.was.a.first-time.enrollment.in.any.high.school..States.that.have.student.tracking.systems.will.already.have.a.true.count.of.entering.ninth.graders,.which.could.be.used.in.estimates.in.conjunction.with.other.CCD.information.
19..It.would.be.useful.to.know.how.many.credits.are.required.for.graduation,.as.this.varies.considerably.among.the.states..A.diploma.in.one.state.does.not.represent.the.same.education.requirements.as.in.another.(see.Mishel.and.Roy,.2008).
20..While.this.report.was.going.to.press,.NCES.issued.its.annual.report.for.the.2005.–.06.school.year.in.which.disaggregated.data.by.race/ethnicity..are.included.

Chasing the High School Graduation Rate • 15
aggregate.data.on.the.state.level,.but.nothing.on.a.disaggregated.basis..State.estimates,.available.by.race.and.ethnicity.in.the.CCD,.are.online.at.www.nces.ed.gov/ccd/table/freshman_03.asp.21.No.estimates,.nationally.or.for.states,.are.provided.by.gender,.however,.as.NCES.has.never.required.it..While.most.states.do.report.gender,.it.is.not.subject.to.the.same.quality.controls.as.are.the.required.data.
While.Heckman.and.LaFontaine.used.the.existing.CCD.data.in.their.analysis,.they.encountered.problems.with.this.database..When.they.disaggregated.their.national.estimates.by.race/ethnicity,.they.had.to.exclude.eight.states.“due.to.missing.enrollment.or.diploma.counts.”.Enrollment.counts.by.race/ethnicity.in.some.states.were.missing.values.and.the.counts.“were.imputed.using.a.linear.estimate.based.on.previous.and.future.enrollment.counts.by.race.in.that.state.”22.Mishel.and.Roy.analyze.the.data.systems.and.also.provide.references.to.other.studies.outlining.limitations.of.the.CCD.database.23.The.case.for.improving.the.CCD.database.is.clear..Doing.so.will.require.resources.
These.needs.may.seem.onerous.to.states.and.a.challenge.for.NCES.to.take.on,.efforts.requiring.additional.funding.and.staffing..However,.high.school.graduation.rates.are.now.entering.the.arena.of.school.accountability.with.high.stakes.attached,.and.discussions.are.occurring.about.even.higher.stakes,.such.as.using.such.rates.in.state.and.federal.accountability.systems.on.a.par.with.test.scores..
These.data.are.important.to.the.management.of.a.state.education.system,.as.well.as.for.informing.national.policymakers,.and.to.administering.accountability.requirements.24.These.data.are..also.useful.in.understanding.what.is.happening..in.other.aspects.of.the.education.system,.in.addition.to.providing.a.basis.for.calculating.graduation.rates.
The.current.NCES-estimated.graduation.rates.tell.a.story.that.is.important.and.different.from.the.longitudinal.tracking.systems..They.tell.us.how.many.diplomas.were.awarded.compared.with.how.many.students.started.high.school.four.years.earlier.—.for.whatever.reason.students.may.not.have.continued. In.contrast,.longitudinal.tracking.systems.subtract.the.school.leavers.not.considered.a.responsibility.of.the.school.system,.as.that.system.is.designed.to.hold.school.systems.accountable..The.two.measures.are.different.and.both.are.important..Both.could.be.standardized.to.achieve.uniformity.among.the.states..The.difficulty.will.be.to.standardize.the.quality.of.the.data.used.in.the.calculations.
21.Downloaded.June.12,.2008..See.tables.1.through.4.22.Heckman.and.LaFontaine,.Figure.VII.23.Mishel.and.Roy,.2008.24..While.I.have.concluded.that.the.NCES.averaged.approach.produces.the.best.estimates.with.the.CCD.data.now.available,.if.we.had.data.on.the.number.
entering.the.ninth.grade,.it.could.be.used.in.the.Swanson.method..I.have.not.made.a.judgment.that.the.method.itself.is.not.appropriate.

16 • Chasing the High School Graduation Rate
Longitudinal.research.collects.data.on.individuals.at.different.points.of.time..For.
example,.the.Chicago.Longitudinal.Study.is.one.of.the.largest.and.most.extensive.studies.of.the.effects.of.early.childhood.intervention..This.21-year.project.is.tracking.the.effects.of.early.childhood.intervention.on.later.life.outcomes,.including.delinquency.and.crime,.educational.attainment,.family.outcomes,.and.so.forth..Such.approaches.pose.unique.challenges,.which.policymakers.must.address.in.using.this.approach.to.measure.the.dropout.rate..Although.the.concept.is.clear,.a.longitudinal.student.tracking.system.is.complex.and.difficult.to.implement.and.the.feasibility.is.uncertain,.at.least.for.many.states.
Tracking.students.over.long.periods,.record-keeping,.and.data.analysis.will.be.demanding..Deciding.on.how.to.deal.with.students.who.fall.out.of.the.tracking.system,.and.determining.how.to.measure.that.impact.on.the.dropout.rates.to.be.reported,.also.pose.challenges.
A.major.effort.to.address.some.of.these.issues.is.now.under.way,.the.result.of.the.NCES.and.NGA.task.forces.referred.to.earlier.25.As.a.start,.the.majority.of.states.are.now.engaged.in.assigning.a.“student.identifier”.for.tracking.all.students.over.time,.even.when.they.transfer.to.other.schools..Assigning.such.an.identifier.is.a.necessary.first.step.in.establishing.a.longitudinal.approach.to.measuring.the.dropout.rate..As.of.2008,.16.states.have.established.student.tracking.systems.and.are.reporting.graduation.rates.consistent.with.the.NGA.formula.26
Several.national.longitudinal.surveys.carried.out.by.NCES.over.the.last.four.decades.are.highly.regarded.and.have.been.a.rich.source.of.information..Researchers’.experience.with.them.can.be.instructive.in.designing.systems.to.track.school.completion..One.such.survey,.the.National.Education.Longitudinal.Study.of.1988,.or.NELS:88,.covered.a.sufficiently.long.period.to.provide.estimates.of.school.completion,.starting.in.1988.when.students.were.in.eighth.grade.and.continuing.through.12th.grade.and.beyond..Surveys.were.made.every.two.years,.and.response.rates.were.respectable.at.about.90.percent..On.the.other.hand,.this.means.that.about.10.percent.of.the.original sample.was.lost.in.each.new.survey.
The.nonresponse.rate.is.dealt.with.in.traditional.statistical.ways..For.NELS:88,.there.is.a.reweighting.of.the.sample.after.each.survey.to.bring.the.sample.back.in.line.with.the.composition.of.the.original.sample,.principally.in.terms.of.race,.ethnicity,.gender,.school.type,.region,.and.urbanicity.27
While.this.approach.works.well.in.NELS:88,.there.are.special.circumstances.that.apply.in.tracking.students.to.determine.school.completion.rates..The.key.correlates.of.dropping.out.of.school.include.coming.from.one-parent.families,.lower.levels.of.family.income,.low.grades,.and.frequent.school.changing;.students.in.these.categories.are.among.the.hardest.to.track..We.can.have.confidence.in.the.reliability.of.high.school.completion.rate.statistics.only.when.we.know..that.the.method.of.dealing.with.nonresponse.
25.See.State Approaches to More Reliable and Uniform Dropout and Graduation Data, National.High.School.Center,.August.2007.(www.betterhighschools.org).26.National.Governors.Association,.Implementing Graduation Counts: State Progress to Date,.2008.27.Methodology Report, National Education Longitudinal Study, 1994 – 1998,.National.Center.for.Education.Statistics,.March.1996,.pp..5.5.and.5.6.
Longitudinal Student Tracking Systems: Some Issues and Concerns

Chasing the High School Graduation Rate • 1�
recognizes.the.special.importance.of.the.major.factors.that.are.related.to.dropping.out.of.school.28
The.tracking.systems.that.are.now.being.established.to.track.the.same.students.over.many.years.likely.will.be.plagued.by.this.problem.and.others,.including.cost.29.These.systems.may.yield.completion.rates.that.underestimate.the.dropout.rate.for.low-income.and.minority.students..This.can.happen.when.students.who.started.high.school.become.untrackable.and.will.not.be.included.in.the.calculation..Such.individuals.will.disproportionately.be.minority.and.low-income..
Beyond.the.problem.of.losing.students.in.longitudinal.tracking.systems,.there.also.are.opportunities.for.more.deliberate.distortions..Campbell’s.Law.states.that.the.more.any.quantitative.social.indicator.is.used.for.social.decision.making,.the.more.subject.it.will.be.to.corruption.pressures.and.the.more.apt.it.will.be.to.distort.and.corrupt.the.social.processes.it.is.intended.to.monitor..Recognizing.this,.the.NCES-created.task.force.of.scientists.was.clear..in.its.warning:
Inevitably, accountability considerations lead to comparisons among different institutions and, therefore, to incentives on institutions that may be “perverse” relative to the scientific purposes of the indicators. To illustrate, suppose that ... schools are not held responsible in computation of graduation indicators for students who transfer to other schools. Then care must be exercised to be sure that schools do not classify dropouts as transfers, because this distorts
the indicators. A more subtle incentive, not preventable by data definitions alone, would be for schools to pressure students who are in danger of not graduating to transfer, or even transfer them involuntarily. As discussed ... multiple indicators for graduation and transfer are a means of at least detecting these kinds of behaviors.30
Because.of.these.“perverse.incentives,”.the.task.force’s.first.recommendation.is.“that.no.single.....indicator.can.serve.all.purposes.”
For.anyone.deeply.interested.in.implementing.a.longitudinal.student.tracking.system.to.measure.high.school.completion.rates,.it.could.be.illuminating.to.look.in.depth.at.a.state.with.substantial.experience.with.such.systems..What.are.the.on-the-ground.implementation.problems,.how.are.they.dealt.with,.what.can.be.learned,.and.what.questions.remain?
Texas.is.one.such.state;.it.now.has.completion.rates.based.on.a.longitudinal.student.tracking.system.that.yields.data.for.grades.9.–.12.beginning.with.the.graduating.class.of.1996.31.The.last.report,.Secondary School Completion and Dropouts in Texas Public Schools, 2005 – 2006,32.was.issued.by.the.Texas.Education.Agency.in.August.2007.
The.total.cohort.of.students.who.began.the.ninth.grade.or.transferred.into.the.school.system.later.was.358,182..However,.the.calculation.of.completion.rates.for.this.class.of.2006.involves.a.total.of.283,698.as.the.denominator,.composed.of.four.categories.of.students:.those.who.graduated,.continued.to.be.enrolled,.received.a.
28..A.different.longitudinal.survey,.the.National.Longitudinal.Youth.Survey,.sponsored.by.the.U.S..Labor.Department,.provides.instruction.for.reweighting.the.sample.for.nonresponse.on.a.customized.basis,.depending.on.the.factors.being.investigated..It.takes.a.lot.of.statistical.sophistication.to.do.this,.of.course.
29..New.York.state.is.now.in.a.start-up.mode,.and.as.of.July.2008,.has.not.been.able.to.report.graduation.rates.for.the.class.of.2007,.causing.considerable.consternation.in.the.state..The.cost.is.expected.to.be.$39.4.million.over.the.next.six.years..See.Elissa.Goodman,.“Crucial.Data.on.Graduates.Elusive,”.New York Times, July.15,.2008.
30.National.Institute.of.Statistical.Science/Education.Statistics.Service.Institute.Task.Force.Report,.p..7.31.Texas.also.has.a.tracking.system.that.begins.with.the.seventh.grade.and.goes.through.the.12th.32.Available.from.the.Texas.Education.Agency,.Department.of.Assessment,.Accountability,.and.Data.Quality,.Division.of.Accountability.Research.

1� • Chasing the High School Graduation Rate
GED,.or.“dropped.out.”.The.graduation.rate.is.calculated.at.80.4.percent33.—.the.227,975.who.graduated.divided.by.the.283,698.(the.total.of.the.four.categories).34.Of.the.24,292.classified.as.continuing.to.be.enrolled,.we.don’t.know.how.many.will.eventually.graduate,.and.the.report.says.nothing.further.about.them..It.is.graduation.in.four.years.that.is.reported.
That.leaves.74,484.of.those.in.the.cohort.unaccounted.for,.including:
• 65,877.classified.as.school.leavers
• 6,608.classified.as.data.errors
This.means.that.21.percent.of.the.cohort.is.not.in.the.denominator.in.determining.graduation.or.dropout.status..The.“data.error.rate”.has.been.dropping..Even.as.late.as.2001,.it.was.31,298,.or.9.percent.of.the.cohort..Identification.errors.had.been.much.higher.in.1998,.so.huge.progress.has.been.made..But.it.will.be.a.number.of.years.before.a.state.starting.such.a.system.can.get.up.to.speed.in.this.regard,.and.its.graduation.rates.will.be.overstated.until.then.
Thus,.for.2005.–.2006,.Texas.was.faced.with.accounting.for.the.65,877.“school.leavers”.who.were.not.in.the.denominator..The.staff.administering.the.tracking.system.was.faced.with.the.problem.of.determining.the.status.to.be.assigned.to.these.school.leavers..They.used.13.“leaver.codes”.to.classify.the.students.who.left..A.few.examples.will.illustrate.the.types.of.situations.that.can.arise:
• student.withdrew.to.enter.home.schooling,.as.indicated.by.a.“parent/guardian,.or.qualified.student”
• student.removed.by.Child.Protective.Services
• student.withdrew.to.enter.a.private.school,.as.indicated.by.the.“parent/guardian.or.qualified.student”
• student.was.determined.to.leave.with.the.intent.of.enrolling.in.a.public.school.outside.of..Texas
• student.was.expelled.from.school
• student.was.withdrawn.because.was.found.to.be.a.nonresident.at.the.time.of.enrollment,.or.had.falsified.information
Other.reasons.not.listed.in.the.rest.of.the.codes.include.students.recorded.as.withdrawn.from.school.because.he.or.she.had.stopped.attending.for.unknown.reasons.
None.of.the.students.classified.as.school.leavers.are.in.either.the.numerator.or.denominator.for.calculating.completion,.graduation,.or.dropout.rates..All.of.these.cases,.student.by.student,.must.be.resolved.and.decisions.made.about.who.remains.in.the.computations.and.who.does.not.
Other.states.will.face.similar.problems.and.are.likely.to.deal.with.them.similarly..While.Texas.now.has.considerable.experience.with.student.tracking.systems,.this.experience.provides.little.confidence.in.the.feasibility.of.dividing.a.population.of.students.into.neat.and.defensible.categories..This.lack.of.confidence.becomes.more.important.within.an.accountability.system.in.which.comparisons.among.states.are.made.and.sanctions.are.imposed..Whether.determined.by.federal.or.state.law,.pages.of.rules.defining.who.to.include.and.who.to.exclude.will.have.to.guide.those.who.must.determine.how.to.classify.students.in.a.longitudinal.tracking.system.—.a.huge.challenge.when.carried.out.with.the.best..of.intentions.
33..The.Texas.report.also.includes.the.NCES.AFGR..This.series.shows.a.public.school.graduation.rate.of.74.5.percent.for.2004.–.2005,.compared.to.84.percent.for.the.class.in.the.longitudinal.rate.—.a.10-point.difference.
34.Texas.also.reports.a.“completion”.rate.that.includes.those.who.continued.their.enrollment.(88.9.percent).and.those.getting.a.GED.(82.1.percent).

Chasing the High School Graduation Rate • 19
And.even.with.the.best.of.intentions,.the.opportunities.for.controversy.loom.large..Start.with.the.“other”.category.for.students.who.simply.stop.showing.up.for.school,.either.at.the.beginning.of.or.during.the.school.year..What.are.the.characteristics.of.these.students?.How.many.are.minority.or.low-income?35.How.many.“qualified.students”.who.say.they.are.withdrawing.to.be.home.schooled.end.up.being.home.schooled?.Is.there.an.increase.in.the.number.of.problem.students.being.expelled?.Are.incentives.being.used.to.increase.test.scores.and.improve.graduation.rates?.These.classification.problems.and.reasons.for.removing.students.from.the.denominator.of.the.graduation.rate.calculation.have.been.recognized.by.the.staff.of.the.NGA.in.their.monitoring.of.state.progress.36
Some.problems,.or.differences.of.opinion.on.the.appropriate.classification.of.students,.can.occur.because.of.the.dual.objectives.or.uses.of.the.graduation.rates..On.the.one.hand,.accurate.statistics.are.needed.on.real.graduation.rates.so.the.magnitude.of.the.problem.can.be.determined.along.with.whether.or.not.the.situation.is.improving,.whoever.may.be.considered.to.be.responsible..On.the.other.hand,.where.there.are.consequences.for.schools,.districts,.and.states.in.accountability.systems,.there.is.the.question.of.whether.the.school.system.should.be.held.responsible.for.students.in.particular.situations,.as.in.cases.in.which.misbehavior.results.in.expulsion..The.consequences.that.may.be.attached.can.color.the.decisions,.creating.a.pressure.to.remove.categories.of.students.from.the.calculation..There.may.be.good.reasons.why.some.school.leavers.are.not.“charged”.to.the.school.for.accountability.
purposes,.but.we.still.want.to.know.what.happened.to.them..We.need.measures.that.serve.both.purposes.—.one.based.on.the.longitudinal.approach.for.school.accountability,.and.one.based.on.the.point-in-time.administrative.data.collected.by.NCES.in.its.CCD.system.
The.best.approach.is.to.improve.the.administrative.data.now.collected.and.used.by.NCES.to.establish.district,.state,.and.national.completion.rates,.until.(and.if ).we.get.a.satisfactory.national.longitudinal.system..When.the.right.data.are.in.the.CCD.system,.they.can.provide.a.perspective.to.put.alongside.the.perspective.gained.through.use.of.longitudinal.tracking.systems..The.two.sets.of.indicators.tell.different.stories,.and.both.are.important.
35..Students.who.are.picked.up.on.the.roster.of.another.school.will.re-enter.the.system..Although.the.report.did.not.provide.demographic.information..on.the.composition.of.“school.leavers,”.it.is.available.in.the.system..The.report.does.say.that.Black.students.are.over-represented.in.“student..identification.errors.”
36..Discussion.of.these.problems.is.very.useful.in.understanding.the.issues.that.face.states..See.National.Governors.Association,.Implementing Graduation Counts,.2008.

20 • Chasing the High School Graduation Rate
In.the.debate.over.reauthorization.of.NCLB,.much.discussion.has.taken.place.about.going.
beyond.the.use.of.test.scores.for.sanctions.to.using.multiple.measures..One.additional.measure.being.considered.is.the.high.school.graduation.rate..NCLB.requires.states.to.report.their.“on-time”.graduation.rates.—.that.is,.those.who.graduate.in.four.years.
The.matter.took.on.a.new.dimension.in.April.2008.when.Secretary.of.Education.Margaret.Spellings.announced.that.the.administration.will.propose.rules.requiring.states.to.use.a.uniform.graduation.rate.by.the.2012.–.2013.school.year..“I.will.take.administrative.steps.to.ensure.that.all.states.use.the.same.formula.to.calculate.how.many.students.graduate.from.high.school.on.time,”..she.said.37
This.section.will.address.the.use.of.such.measures.for.accountability.purposes..Using.a.graduation.rate.for.sanctions-based.accountability.purposes.is.fraught.with.difficulties..This.is.not.to.say.that.graduation.rates.should.not.be.measured,.reported,.and.improved,.for.they.definitely..are.needed,.and.successful.efforts.can.play..an.important.role.in.raising.educational.attainment.levels.
The.problem.is.how.to.use.graduation.rates.to.increase.the.number.of.students.who.graduate.from.high.school..There.is.at.least.some.parallel.here.to.the.ongoing.debate.about.how.to.use.test.scores.in.sanctions-based.accountability.systems..One.issue.is.that.the.present.test-based.accountability.system.is.based.mostly.on.the.use.of.end-of-year.scores.that.reflect.all.of.the.cognitive.development.and.achievement.accumulated.since.birth.—.not.just.in.the.school.year.in.which.the.test.is.given..The.evolving.
consensus.has.been.toward.finding.a.measure.of.learning.that.is.more.reflective.of.the.learning.that.occurs.in.the.school.during.that.school.year.
Similarly,.in.holding.schools.accountable.for.graduation.rates,.we.are.faced.with.isolating.the.effect.of.the.actions.of.the.high.school.on.whether.students.stay.enrolled.and.graduate.from.all.of.the.other.influences.and.experiences.at.work,.both.before.high.school.and.outside.of.the.classroom..A.credible.measure.of.a.high.school’s.success.must.be.perceived.by.teachers.and.administrators.as.being.reasonable.and.within.their.control..It.would.be.unfortunate.indeed.to.start.down.a.track.that.leads.to.the.same.kind.of.morass.as.did.the.track.based.only.on.end-of-year.test.scores.
Finding.the.right.track.requires.some.understanding.of.why.students.drop.out,.recognizing.that.what.happens.both.in.and.out.of.school.affects.students’.lives.and.experiences..The.question.is.not.whether,.but.how,.to.have.the.most.useful.measures.of.school.completion..This.includes.recognition.that.seeking.the.right.measures.and.using.them.properly.is.not.merely.an.exercise.in.creating.excuses.for.schools..Below.is.a.summary.of.what.research.has.revealed.about.the.correlates.of.early.school.leaving.
Over.many.decades,.surveys.have.been.carried.out.in.which.students.were.asked.why.they.left.school.before.graduating..While.there.have.been.some.differences.in.the.way.the.question.was.worded,.the.results.have.been.consistent..Reasons.include.such.issues.as.getting.pregnant,.falling.behind.in.school,.not.liking.school,.and.wanting.or.needing.to.go.to.work..The.reasons.given.are.only.proximate;.experiences.that.have.taken.place.over.many.years.of.students’.lives.contribute.to.the.act.of.leaving.school.
37.“Spellings:.States.Will.Have.to.Follow.Uniform.Graduation-Rate.Formula,”.Education Week,.April.1,.2008.
The Use of High School Graduation Rates in Sanctions-Based Accountability Systems

Chasing the High School Graduation Rate • 21
In.a.study.reported.in.2002,.the.U.S..General.Accounting.Office.synthesized.the.body.of.research.on.dropping.out,.summing.up.the.results.as.follows:
Research has shown that multiple factors are associated with dropping out, and that dropping out of school is a long-term process of disengagement that occurs over time and begins in the earliest grades. NCES and private research organizations have identified two types of factors — those associated with families and those related to an individual’s experience in school — that are related to dropping out. For example, students from low income, single-parent, and less educated families often enter school less prepared than children from more affluent, better educated families, and subsequently drop out at a much higher rate than other students do.
Factors related to an individual’s experiences in school often can be identified soon after a child begins school. These factors, such as low grades, absenteeism, disciplinary problems, frequently changing schools, and being retained two or more grades, are all found at a much higher than average rate in students that drop out. Study of the long-term process of dropping out may provide insight into ways to identify earlier potential dropouts.38.
A.recent.report.from.the.ETS.Policy.Information.Center.looked.at.the.extent.to.which.several.variables.were.associated.with.the.considerable.differences.among.the.states.in.their.graduation.rates..
The.factors.were:• socio-economic.status,.using.income,..
. education,.and.occupation• percentage.of.two-parent.families• extent.of.changing.schools
These.three.factors.combined.explained.about.three-fifths.of.the.variation.among.the.states.in.their.graduation.rates,.with.the.strongest.factor.being.the.percentage.of.two-parent.families.
The.correlation.was.then.used.to.predict.the.completion.rate.in.each.state,.and.the.predicted.rate.was.compared.with.the.actual.rate..The.predicted.rate.was.very.close.to.the.actual.rate.in.many.states..In.24.states,.the.actual.rate.was.within.plus.or.minus.4.percentage.points.of.the.predicted.rate.39
Recent.studies.on.why.students.drop.out.include.one.by.Robert.Balfanz.of.Johns.Hopkins.University.and.Elaine.Allensworth,.Co-Director.of.the.Consortium.on.Chicago.School.Research,.and.another.one.by.Achieve,.Inc..These.studies.represent.a.growing.body.of.research.that.demonstrates.that.such.things.as.attendance,.attention.in.class,.and.grades.in.reading.and.basic.math.in.the.years.before.and.after.entering.high.school,.are.predictors.of.dropping.out..In.talking.about.successfully.dealing.with.the.problems.that.are.identified.as.precursors.to.dropping.out,.Balfanz.says:.“If.we.only.fix.the.middle.schools,.they’ll.bleed.out.in.the.high.schools..And.if.we.only.fix.high.schools,.they’ll.be.overwhelmed.when.the.kids.come.in.three.grade.levels.behind,.with.bad.attendance.and.bad.behavior..We.have.to.fix.both.”40
38..SCHOOL DROPOUTS: Education Could Play a Stronger Role in Identifying and Disseminating Promising Prevention Strategies, United.States.General.Accounting.Office,.GAO-02-240,.February.2002.
39..Paul.E..Barton,.One Third of a Nation: Rising Dropout Rates and Declining Opportunities,.Policy.Information.Report, ETS.Policy.Information.Center,.February.2004.
40.As.reported.by.Sarah.D..Sparks,.“Educators.Comb.Indicators.of.Early.Signs.of.Dropout,”.Education Daily, January.29,.2008.

22 • Chasing the High School Graduation Rate
A.high.school.in.a.poor.urban.area.has.a.higher.percentage.of.mobile.families.than.do.other.schools.—.families.relocating.to.find.jobs,.or.to.find.affordable.housing,.or.to.find.a.caregiver.for.the.children..In.areas.of.high.teenage.birth.rates,.there.are.students.who.drop.out.to.work.and.care.for.children..In.high-crime.areas,.some.students.disappear.into.the.criminal.justice.system.for.long.or.short.periods..These.factors.obviously.will.have.a.large.impact.on.the.high.school.graduation.rate.
In.high-income.suburban.schools,.the.reasons.for.and.the.circumstances.of.dropping.out.of.school.may.be.relatively.easy.to.identify,.and.the.schools’.retention.records.may.be.relatively.straightforward..However,.it.is.difficult.to.see.how.a.uniform.standard.for.a.graduation.rate,.expressed.in.quantitative.terms,.can.be.set.to.apply.to.all.schools.in.a.state..It.is.also.problematic.to.compare.schools.on.the.basis.of.these.fixed.standards,.and.it.is.difficult.to.justify.how.such.a.standard.can.be.a.basis.for.imposing.sanctions.on.particular.schools..What.can.be.sought.is.some.quantitative.method.of.judging.success.that.recognizes.what.has.been.learned.from.the.body.of.research.that.is.available..The.focus.should.be.on.what.practices.the.school.is.or.is.not.using.to.attain.the.best.possible.graduation.rate.—.practices.that.have.been.demonstrated.by.research.to.be.effective.
Statisticians.could.devise.a.rate.calculation.or.formula.that.“adjusts”.for.the.level.of.school.handicap.or.the.different.circumstances.of.dropouts..Such.statistical.black.boxes,.however,.are.opaque.and.are.suspect.when.they.produce.adjusted.numbers..Some.states.have.experience.in.adjusting.test.scores.in.this.way,.as.in.comparing.scores.among.schools.in.a.category.established.to.
reflect.common.characteristics..But.much.of.this.remains.uncharted.territory,.particularly.regarding.graduation.rates,.where.the.issue.of.judging.why.students.leave.school.is.problematic.to.begin.with.
These.issues.and.factors.are.similarly.relevant.in.measuring.the.graduation.rate.across.the.states,.making.it.difficult.to.judge.how.many.of.the.differences.in.graduation.rates.are.due.to.differences.in.the.quality.of.the.state.school.system’s.efforts.to.retain.students.or.its.competence.in.doing.so.
A.major.challenge.is.to.recognize.what.research.has.shown.and.apply.it.by.creating.ways.to.improve.schools.and.hold.the.education.system.accountable.in.a.manner.that.is.both.rational.and.constructive..It.is.not.enough.to.be.tough..The.efforts.have.to.be.informed.by.available.knowledge,.and.reasoned.actions.taken.based.on.that.knowledge..
On-Time GraduationAn.added.dimension.of.measuring.the.
graduation.rate.is.the.use.of.a.standard.for.“on-time”.graduation.in.four.years..All.the.factors.that.affect.high.school.graduation.are.also.likely.to.affect.the.ability.of.schools.to.graduate.students.in.four.years..What.is.the.rationale.for.setting.a.four-year.standard?.Why.should.a.school.be.penalized.for.graduating.a.student.in.five.years.instead.of.four?.The.idea.that.all.secondary.school.students.should.graduate.at.the.same.time.is.peculiarly.American,.as.is.the.emerging.idea.that.all.should.take.the.same.rigorous.academic.curriculum.to.qualify.them.to.take.credit.courses.when.they.enter.college..In.Europe,.it.is.common.to.have.many.paths.to.certification,.with.

Chasing the High School Graduation Rate • 23
students.permitted.to.continue.until.they.reach.certification.standards.41
Any.standard.should.be.thought.of.in.terms.of.graduation.as.soon.as.possible,.based.on.students.meeting.the.requirements.for.graduation..If.it.takes.one.more.year.and.the.school.can.retain.the.student.for.one.more.year,.the.school.should.be.praised,.not.penalized..There.is.a.cost.dimension,.of.course,.to.spending.more.than.four.years.in.high.school,.but.schools.should.not.be.discouraged.by.the.accountability.system.
The.ultimate.goal.should.be.to.get.students.through.to.graduation.and.to.create.incentives.for.schools.to.accomplish.this..What.is.not.needed.is.an.incentive.for.schools.to.shuffle.struggling.students.out.the.door.and.off.of.their.plate.of.responsibility..One.strategy.schools.have.used.is.to.transfer.students.to.GED.programs,.sometimes.without.checking.that.the.students.enroll.in.them..An.example.that.received.national.attention.several.years.ago.was.a.court.case.involving.Park.Lane.High.School.in.New.York.City,.which.pushed.high.school.students.into.adult.education.programs..The.mayor.settled.the.case.out.of.court.and.ordered.the.school.to.readmit.the.students.
In.addition,.the.data.are.clear.that.the.labor.market.generally.is.not.ready.for.17-.and.18-year-olds.for.adult-type.jobs,.whether.they.are.dropouts.or.graduates.42.Another.year.may.add.to.a.level.of.maturity.that.employers.value.highly..Employers.also.value.“soft.skills”.that.can.be.obtained.through.community.service.experience,.internships,.and.cooperative.education-type.arrangements.with.employers..Such.programs.can.show.students.that.what.they.do.in.school.is.
relevant.to.the.world.of.work.and.can.be.used.to.entice.students.at.risk.of.dropping.out.to.remain.in.school.
High.schools.are.receiving.different.signals..They.are.getting.the.message.to.reduce.social.promotion.with.test.scores.used.to.determine.who.is.promoted..Consequently,.ninth.graders.are.being.held.back.in.increasing.numbers,.creating.a.ninth-grade.bulge..Presumably,.the.idea.is.to.make.sure.students.measure.up.before.going.on.to.10th.grade,.so.that.if.they.improve.and.make.it,.they.will.stay.in.school.and.graduate.—.late..But.if.they.succeed,.they.will.also.bulge.the.fifth-year.enrollment.and.show.up.as.students.who.do.not.graduate.on.time.
41..For.an.excellent.discussion.of.these.“multiple-path”.arguments,.and.contrast.with.current.U.S..expectations,.see.Intergovernmental Approaches for Strengthening K – 12 Accountability Systems, Edited Transcript, pp..22 – 24,.The.Nelson.A..Rockefeller.Institute.of.Government,.2008.
42.See.Paul.E..Barton,.High School Reform and Work: Facing Labor Market Realities, Policy.Information.Report,.ETS.Policy.Information.Center,.2007.

24 • Chasing the High School Graduation Rate
The.best.information.now.available.on.graduation.rates.is.the.new.NCES.series.
that.uses.the.AFGR.and.the.ratio.of.diplomas.awarded.to.the.population.of.17-year-olds.from.the.decennial.census..This.series,.now.abandoned,.should.be.reinstated..As.explained.earlier,.the.number.of.17-year-olds.in.the.population.can.represent.the.size.of.the.cohort.that.can.potentially.graduate,.even.though.not.all.potential.graduates.will.be.in.that.age.cohort..This.measure.uses.the.administrative.data.for.the.diploma.count.but.does.not.rely.on.the.school.enrollment.count;.rather,.it.uses.Census.data..The.series.extends.to.the.19th.century.for.both.population.counts.and.the.number.of.diplomas.awarded..If.NCES.obtains.reports.from.the.states.on.how.many.students.enter.the.ninth.grade,.other.methods.could.be.considered.for.use..This.section.
summarizes.what.these.data.reveal.about.trends..in.the.high.school.graduation.rate,.nationally.and..by.state.
Figure.1.shows.trends.in.the.high.school.graduation.rate.using.both.measures..The.AFGR.approach.shows.a.graduation.rate.of.73.7.percent.in.1990.–.1991,.falling.to.a.low.of.71.percent.by.1995.–.1996,.and.then.recovering.to.74.3.percent.by.2003.–.2004,.the.last.year.for.which.data.are.provided..The.ratio.approach.results.in.graduation.rates.a.couple.of.percentage.points.lower,.until.2001.–.2002,.but.parallels.the.AFGR.rate.in.the.trend.over.the.period.43.The.ratio.approach.is.based.on.both.public.and.private.school.diplomas.awarded,.and.the.17-year-old.population.includes.those.who.did.not.attend.high.school.in.the.United.States,.since.it.includes.immigrants,.some.of.whom.would.not.have.attended.U.S..schools.
What We Know Now About the High School Graduation Rate
43..The.graduation.rates.produced.by.the.AFGR.approach.is.about.three.percentage.points.lower.than.the.rates.produced.using.the.eighth-grade.enrollments.as.a.proxy.for.the.number.of.students.entering.ninth.grade,.and.are.several.points.higher.than.those.resulting.from.using.ninth-grade.enrollment.as.the.proxy..However,.the.differences.will.be.considerably.more.or.less.in.individual.states.

Chasing the High School Graduation Rate • 25
Table 2: Averaged Freshman Graduation Rate Estimates by Racial/Ethnic Group, 2004 – 05
Percent
White ..80.4%
Black.Non-Hispanic 60.3
Hispanic 64.2
Asian/Pacific.Islander 90.5
American.Indian 67.2
Source:.www.nces.ed/gov/ccd/tables/freshman_03.asp,.downloaded.6/12/2008..
Table.2.compares.the.graduation.rates.of.population.subgroups.to.the.White.rate.and.shows.very.large.gaps.—.20.percentage.points.for.the.Black.Non-Hispanic.population,.16.percentage.points.for.the.Hispanic.population,.and.13.percentage.points.for.the.American.Indian.population..The.AFGR.for.the.Asian.population.is.10.percentage.points.higher.than.the.rate.for.the.White.population..Such.gaps.in.the.graduation.rate.will.likely.be.about.the.same,.irrespective.of.which.grade.or.combination.of.grades.is.used.to.represent.the.number.of.entering.ninth.graders,.even.though.the.level.of.the.rates.will.be.different..At.the.state.level,.however,.there.could.be.important.differences.
These.AFGR.estimates.also.are.available.by.race.and.ethnicity.for.each.state..These.disaggregated.rates.are.not.included.in.the.NCES.annual.report.on.dropout.and.graduation.rates..However,.they.can.be.found.in.the.CCD.system;.see.Table.3.for.the.school.year.2003.–.2004...NCES.explains.each.instance.in.which.data.are.not.provided..These.data.should.be.a.part.of..this.annual.report.that.has.long.been.required..by.Congress.

26 • Chasing the High School Graduation Rate
Table 3: High School Completion Rates 2003 – 2004 (NCES Averaged Freshman Graduation Rate Method)
State Total White Black Hispanic Asian
Alabama 65.0 70.5 57.2 59.9 94.1
Alaska 67.2 71.3 51.5 27.6 75.0
Arizona 66.8 88.8 88.0 76.9 --
Arkansas 76.8 76.9 69.5 79.6 --
California 73.9 80.6 64.4 65.6 91.5
Colorado 78.7 82.1 68.9 59.6 96.0
Connecticut 80.7 86.2 68.0 62.9 99.6
Delaware 72.9 77.3 64.4 62.4 --
District.of.Columbia 68.2 81.7 70.4 49.9 69.2
Florida 66.4 70.2 51.8 62.7 90.6
Georgia 61.2 66.6 52.4 51.2 87.9
Hawaii 72.6 71.9 67.5 71.5 76.4
Idaho 81.5 -- -- -- --
Illinois 80.3 87.5 58.6 66.9 --
Indiana 73.5 76.3 52.2 63.7 96.9
Iowa 85.8 87.7 69.0 73.2 99.0
Kansas 77.9 81.6 66.6 60.1 87.4
Kentucky 73.0 76.8 69.9 91.0 --
Louisiana 69.4 72.2 54.1 71.9 88.3
Maine 77.6 78.0 91.7 97.3 --
Maryland 79.5 83.5 71.1 78.6 98.3
Massachusetts 79.3 82.7 68.0 56.5 87.7
Michigan 72.5 79.0 50.5 55.8 90.9
Minnesota 84.7 89.1 62.1 65.1 86.3
Mississippi 62.7 66.6 59.7 69.0 89.8
Missouri 80.4 82.9 67.5 86.4 --
Montana 80.4 84.0 61.6 84.4 87.9
Nebraska 87.6 91.0 63.0 76.3 --
Nevada 57.4 62.4 42.7 41.8 76.7
New.Hampshire 78.7 -- -- -- --

Chasing the High School Graduation Rate • 2�
State Total White Black Hispanic Asian
New.Jersey 86.3 88.7 72.5 78.1 --
New.Mexico 67.0 73.4 64.3 60.7 90.8
New.York -- 79.1 45.8 43.8 76.1
North.Carolina 71.4 76.4 65.7 66.9 90.3
North.Dakota 86.1 89.3 96.2 75.7 84.2
Ohio 81.3 83.6 61.3 71.3 --
Oklahoma 77.0 77.9 68.2 71.3 --
Oregon 74.2 74.9 58.4 65.2 93.5
Pennsylvania 82.2 86.3 66.2 66.2 --
Rhode.Island 75.9 80.2 76.4 71.0 76.2
South.Carolina 60.6 -- -- -- --
South.Dakota 83.7 86.4 79.3 70.5 --
Tennessee 66.1 71.0 59.8 69.4 91.5
Texas 76.7 81.5 68.6 66.3 96.4
Utah 83.0 87.5 68.0 59.5 84.2
Vermont 85.4 79.1 92.1 -- 86.3
Virginia 79.3 82.3 69.0 76.7 --
Washington 74.6 76.6 63.3 63.1 86.5
West.Virginia 76.9 77.4 69.5 -- --
Wisconsin -- 91.8 52.6 70.9 91.5
Wyoming 76.0 78.8 69.6 64.6 91.3
Source:.The.total.rate.is.from.The Averaged Freshman Graduation Rate for Public High Schools from the Common Core Data: School Years 2002 – 2005 and 2003 – 2004, National.Center.for.Education.Statistics,.table.3,.June.2007..The.rates.by.race.and.ethnicity.are.from.Tables.2.through.5.of.the.NCES.Common.Core.Data.Base,.http//nces.ed.gov/ccd/freshman_05.asp..Original.sources.explain.reasons.for.missing.data,.which.include.no.report.from.state,.missing.data.in.report,.or.very.small.populations.

2� • Chasing the High School Graduation Rate
Figure.1.provides.one.perspective,.from.the.standpoint.of.how.many.students.who.enter.high.school.after.completing.the.eighth.grade.graduate..Another.important.perspective.on.graduation.rates.is.the.proportion.of.any.population.age.group,.and.the.population.as.a.whole,.who.achieve.a.high.school.diploma,.whatever.their.age..This.is.referred.to.as.a.“status.rate.”.This.is.the.number,.usually.for.20-.to.24-year-olds,.that.makes.the.newspapers.every.year..This.number.comes.originally.from.the.Census.Bureau’s.CPS,.and.its.accuracy.has.been.challenged.over.the.past.half.dozen.years,.as.discussed.earlier..Up.until.2000,.the.best.single.measure.we.have.of.the.status.rate.is.from.the.decennial.census,.as.adjusted.by.Heckman.and.LaFontaine,.for.the.years.1970,.1980,.1990,.and.2000..It.is.important.to.keep.in.mind,.however,.that.their.overall.conclusions.about.levels.and.trends.are.based.on.their.combined.analysis.of.several.different.data.sources..It.is.also.important.to.point.out.the.issue.
raised.earlier.about.the.adequacy.of.an.estimate.that.is.based.on.a.single.question.asked.in.the.census..Figure.2.shows.trends.in.this.rate.for..20-.to.24-year-olds,.as.calculated.by.Heckman.and.LaFontaine.
In.their.analysis.of.other.sources,.Heckman.and.LaFontaine.find.that,.after.appropriate.adjustments,.there.is.reasonably.close.agreement.among.all.the.sources.
For.all.20-.to.24-year-olds.in.1970,.we.see.an.81.percent.graduation.rate,.falling.to.79.percent.by.2000..The.gap.between.the.minority.and.White.population.has.bounced.around.a.little,.but.in.a.fairly.narrow.range..The.gap.in.2000.was.about.14.percentage.points.for.Blacks.and.21.for.Hispanics,.not.including.recent.immigrants..Looking.at.all.the.statistical.sources,.Heckman.and.LaFontaine.concluded.that.the.gaps.have.not.narrowed.over.the.last.35.years.
Chasing the High School Graduation Rate • 29
• Getting an accurate national graduation rate. A.joint.effort.is.needed.on.the.part.of.the.Census.Bureau.and.NCES.to.provide.accurate.high.school.graduation.rate.data.on.the.status.of.20-.to.24-year-olds.—.and.other.age.groups..The.effort.needs.to.be.funded.adequately.to.ensure.that.the.survey.design.and.implementation.are.guided.by.the.necessary.research.and.validation.studies..The.data.coming.from.the.Census.Bureau’s.CPS.has.been.found.to.be.inadequate..While.the.recent.switch.to.using.the.ACS.will.improve.coverage,.the.problems.go.much.beyond.coverage..The.single.question.used.now.in.the.survey.about.the.highest.level.of.education.attained.cannot.yield.the.information.needed.
• Making the best possible state and local estimates — now. Given.the.data.currently.available.in.the.NCES.CCD.system,.the.new.state.estimates.called.the.Averaged.Freshman.Graduation.Rate.(AFGR).represent.the.best.approach.among.the.several.being.used,.and.its.choice.is.based.on.an.in-depth.technical.study..However,.several.more.pieces.of.information.that.could.greatly.improve.it.have.been.suggested..The.most.immediate.need.is.to.have.reports.from.the.states.on.the.number.of.entering.freshmen..These.data.are.much.simpler.to.record.and.collect.than.is.tracking.the.same.students.over.a.period.of.years,.and.they.provide.a.necessary.summary.estimate.of.how.many.of.those.who.enter.high.school.graduate,.whatever.may.be.the.reason.for.others.not.graduating..Also,.the.publication.of.the.ratio.of.high.school.diplomas.awarded.to.the.number.of.17-year-olds.in.the.population,.available.going.back.to.the.late.1880s,.should.be.reinstated.in.NCES.reports.to.provide.a.companion.measure.that.includes.diplomas.from.both.public.and..private.schools.
• Understanding the challenges of tracking students over long periods of time for school accountability purposes..Much.attention.and.investment.has.been.focused.on.efforts.to.calculate.a.graduation.rate.by.tracking.individual.students.from.the.time.they.enter.the.ninth.grade.or.earlier.through.the.time.they.graduate.from.or.drop.out.of.high.school..While.the.complexity.involved.in.tracking.students.is.generally.recognized,.it.is.underestimated.by.some.advocates.and.by.those.who.have.implemented.such.systems..The.problems.confronted.in.Texas,.for.example,.are.illustrative..The.question.is.which.students.should.be.taken.out.of.the.denominator.in.calculating.a.graduation.rate.that.is.used.for.accountability.purposes..For.example,.should.students.who.are.expelled.from.school.be.excluded.from.the.calculation,.as.is.done.in.Texas?.A.drawback.in.using.such.a.rate,.however,.is.the.limited.use.of.the.measure.for.providing.a.more.comprehensive.view.of.how.many.students.out.of.the.total.entering.cohort.actually.graduated..As.an.example.of.such.a.difference,.the.NCES-calculated.graduation.rate.for.Texas.in.2004.–.05.(based.on.the.AFGR.approach).was.10.percentage.points.lower.than.the.rate.Texas.reported.that.year.using.its.longitudinal.approach..Another.concern.is.that.many.of.the.students.who.will.disappear.from.the.tracking.system.will.disproportionately.be.minority.and.lower.income..These.longitudinal.tracking.systems.will.gain.traction.in.more.states.and.are.likely.to.be.ubiquitous.in.the.future..While.the.logic.behind.these.systems.can.be.compelling,.the.devil.will.be.in.the.details:..How.many.students.can.actually.be.tracked.over.the.years.and,.especially,.how.many.of.those.who.leave.school?.How.many.students.will.be.excluded.from.the.graduation.rate.calculations?
Summary and Conclusions

30 • Chasing the High School Graduation Rate
• Standardized measures and standards for accountability..Using.an.improved.AFGR,.or.just.a.Freshman.Graduation.Rate.when.we.get.a.count.of.entering.freshmen,.and.a.rate.based.on.longitudinal.tracking.of.individual.students.—.at.least.for.federal.reporting.purposes.—.can.be.standardized.to.make.results.comparable.from.place.to.place..That.assumes.the.necessary.quality.data.will.be.collected.and.that.there.is.uniformity.in.which.students.are.excluded.in.the.denominator.of.the.calculation..However,.this.report.has.raised.questions.about.whether.a.single.graduation.rate.standard.at.the.state.or.national.level.can.be.applied.to.all.schools,.districts,.and.states.—.for.accountability.purposes.—.given.the.way.different.student.populations.vary.in.the.degree.to.which.prior.school.achievement.and.life.experiences.and.conditions.make.them.more.or.less.likely.to.drop.out.of.school..The.report.also.discusses.
the.implications.involved.in.using.graduation.in.four.years.as.the.standard.for.accountability,.and.asks.why.there.should.be.penalties.for.taking.five.years.if.the.student.needs.them.to.meet.graduation.requirements..And.when.we.“catch”.the.true.graduation.rate,.a.lot.of.thought.needs.to.be.given.to.using.it.correctly.
• The Infrastructure..While.graduation.rate.calculations.can.be.carefully.specified.and.standardized,.their.accuracy.is.dependent.on.the.quality.of.the.infrastructure.that.provides.and.verifies.the.data.—.from.individual.schools,.to.school.districts,.to.states..An.infrastructure.that.produces.high-quality.data.will.require.sufficient.resources,.qualified.staff,.and.effective.quality.control.systems..Quality.national.data.on.“status”.rates,.such.as.the.graduation.rate.for.20-.to.24-year-olds,.will.not.come.without.the.kind.of.substantial.investments.that.have.been.made.in.calculating.a.national.unemployment.rate.
*.*.*.*.*.*.*
Over.the.last.eight.years.or.so,.much.work.has.been.done.to.further.the.position.of.the.country.in.making.an.assault.on.the.high.school.dropout.rate.and.reducing.the.unacceptable.gaps.by.race/ethnicity.and.income..However,.although.the.nation.has.been.alerted,.and.although.estimates.based..on.currently.available.data.have.been.made,.we.are.very.far.from.having.the.measurement.system.that.we.need.
A.major.test.of.our.resolve.to.increase.the.graduation.rate.will.be.how.serious.we.are.about.measuring.it.at.regular.intervals.—.so.we.can.reach.the.stage.of.actually.“addressing.what.we.measure.”.And.after.developing.such.a.measure,.we.must.succeed.in.applying.it.in.thoughtful.and.constructive.ways.that.help.increase.high.school.graduation.rates.
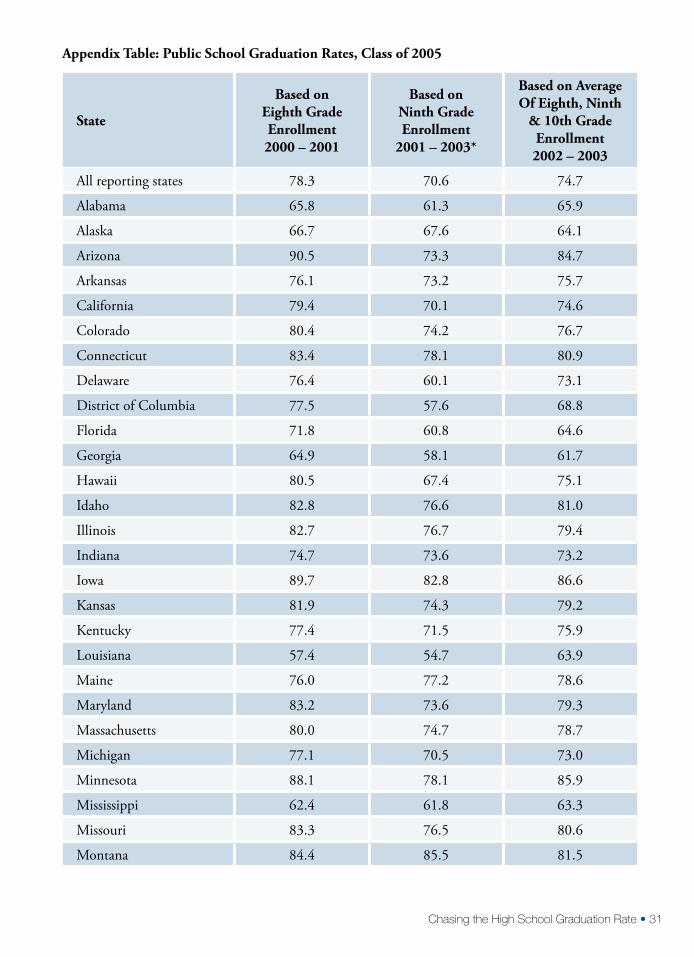
Chasing the High School Graduation Rate • 31
State
Based onEighth Grade Enrollment 2000 – 2001
Based onNinth Grade Enrollment
2001 – 2003*
Based on AverageOf Eighth, Ninth
& 10th Grade Enrollment2002 – 2003
All.reporting.states 78.3 70.6 74.7
Alabama 65.8 61.3 65.9
Alaska 66.7 67.6 64.1
Arizona 90.5 73.3 84.7
Arkansas 76.1 73.2 75.7
California 79.4 70.1 74.6
Colorado 80.4 74.2 76.7
Connecticut 83.4 78.1 80.9
Delaware 76.4 60.1 73.1
District.of.Columbia 77.5 57.6 68.8
Florida 71.8 60.8 64.6
Georgia 64.9 58.1 61.7
Hawaii 80.5 67.4 75.1
Idaho 82.8 76.6 81.0
Illinois 82.7 76.7 79.4
Indiana 74.7 73.6 73.2
Iowa 89.7 82.8 86.6
Kansas 81.9 74.3 79.2
Kentucky 77.4 71.5 75.9
Louisiana 57.4 54.7 63.9
Maine 76.0 77.2 78.6
Maryland 83.2 73.6 79.3
Massachusetts 80.0 74.7 78.7
Michigan 77.1 70.5 73.0
Minnesota 88.1 78.1 85.9
Mississippi 62.4 61.8 63.3
Missouri 83.3 76.5 80.6
Montana 84.4 85.5 81.5
Appendix Table: Public School Graduation Rates, Class of 2005

32 • Chasing the High School Graduation Rate
State
Based onEighth Grade Enrollment 2000 – 2001
Based onNinth Grade Enrollment
2001 – 2003*
Based on AverageOf Eighth, Ninth
& 10th Grade Enrollment2002 – 2003
Nebraska 91.2 79.6 87.8
Nevada 62.0 45.4 55.8
New.Hampshire 79.7 77.1 80.1
New.Jersey 87.2 83.3 85.1
New.Mexico 69.8 54.1 64.1
New.York 71.4 68.0 65.3
North.Carolina 75.5 67.0 72.6
North.Dakota 87.3 79.2 86.3
Ohio 83.1 75.9 80.2
Oklahoma 77.9 70.8 76.9
Oregon 76.6 70.4 74.2
Pennsylvania 86.3 80.4 82.5
Rhode.Island 82.3 71.1 78.4
South.Carolina 62.8 55.6 60.1
South.Dakota 83.2 75.6 82.3
Tennessee 71.1 65.4 68.5
Texas 78.7 68.5 74.0
Utah 85.5 78.6 84.4
Vermont 89.3 80.2 86.5
Virginia 83.9 72.9 79.6
Washington 79.2 68.8 75.0
West.Virginia 78.1 72.8 77.3
Wisconsin 93.1 80.5 86.7
Wyoming 77.1 74.2 76.7
*Cumulative.Promotion.Index.Method-.-.-.-.-.-.-.-.-.-.-.-.-.-.-.-.-.-.-.-.-.-.-.-.-.-.-.-.
Column.1.is.calculated.from.enrollment.and.regular.diplomas.issued.as.provided.in.Common.Core.of.Data.(CCD)...See.NCES.2007-352,.Table.4,.2007.Column.2.is.from.Diplomas Count 2008, a.report.by Education Week and.the.Editorial.Projects.in.Education.Research.Center,..page.34..The.method.used.is.the.Cumulative.Promotion.Index.developed.by.Christopher.Swanson.Column.3.is.from.the.same.table.as.Column.1,.and.uses.the.NCES-developed.Averaged.Freshman.Graduation.Rate.Method,.in.which.eighth,.ninth,.and.10th.grade.enrollments.are.averaged.to.estimate.the.number.of.students.who.enter.the.freshman.year.

