cohort graduation rate: compared to leaver rate
DESCRIPTION
Cohort Graduation Rate: Compared to Leaver Rate. Muscogee County School District April 2012. Purpose of the Change. Why is a new graduation rate being reported ? - PowerPoint PPT PresentationTRANSCRIPT
Cohort Graduation Rate:Compared to Leaver Rate
Muscogee County School DistrictApril 2012
Purpose of the Change
• Why is a new graduation rate being reported?▫ The U.S. Department of Education is requiring all states to begin
publicly reporting comparable high school graduation rates using its new four-year adjusted cohort rate calculation method. In October 2008, a regulation by the U.S. Department of Education [section 1111(h) of ESEA] was amended, which included a requirement for all states and local educational agencies (LEAs) receiving Title I funds (money for schools with a certain percentage of low-income students) to begin calculating and reporting the more uniform rate beginning with 2010-2011 data.
▫ Historically, states have calculated graduation rates using varying methods, creating inconsistent data from one state to the next. The transition to a uniform high school graduation rate requires all states to report the percentage of freshmen students who graduate in four years with a regular high school diploma. This rate will reflect a uniform method for reliable comparisons among states.
• The same number of students are graduating. Not all students will be counted as graduates.
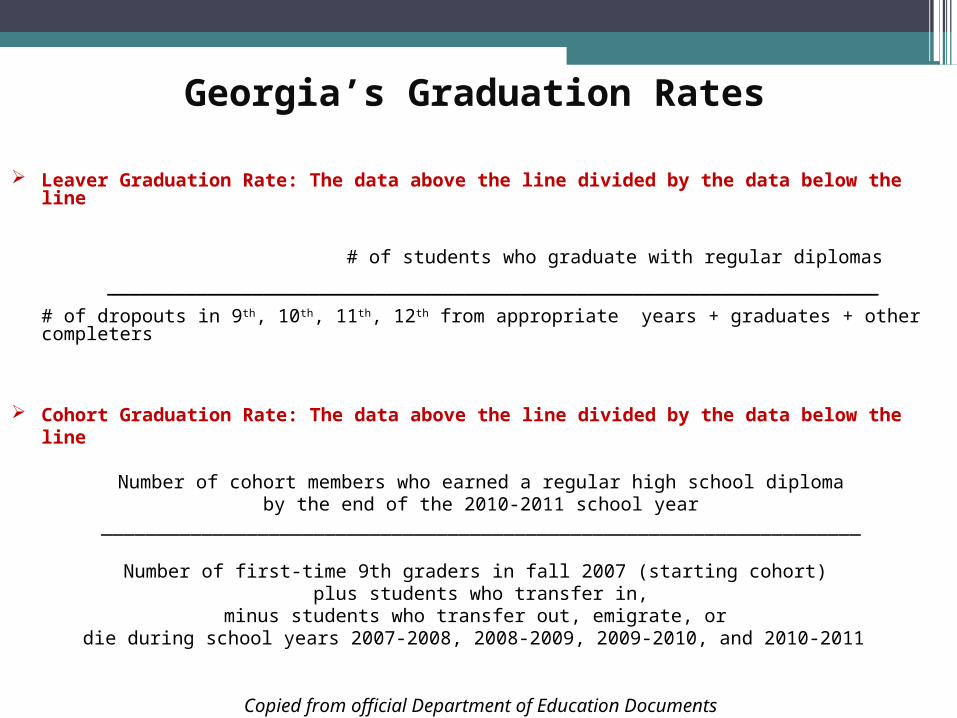
Georgia’s Graduation Rates
Leaver Graduation Rate: The data above the line divided by the data below the line
# of students who graduate with regular diplomas
_____________________________________________________________________
# of dropouts in 9th, 10th, 11th, 12th from appropriate years + graduates + other completers
Cohort Graduation Rate: The data above the line divided by the data below the line
Number of cohort members who earned a regular high school diplomaby the end of the 2010-2011 school year
____________________________________________________________________
Number of first-time 9th graders in fall 2007 (starting cohort) plus students who transfer in,
minus students who transfer out, emigrate, or die during school years 2007-2008, 2008-2009, 2009-2010, and 2010-2011
Copied from official Department of Education Documents
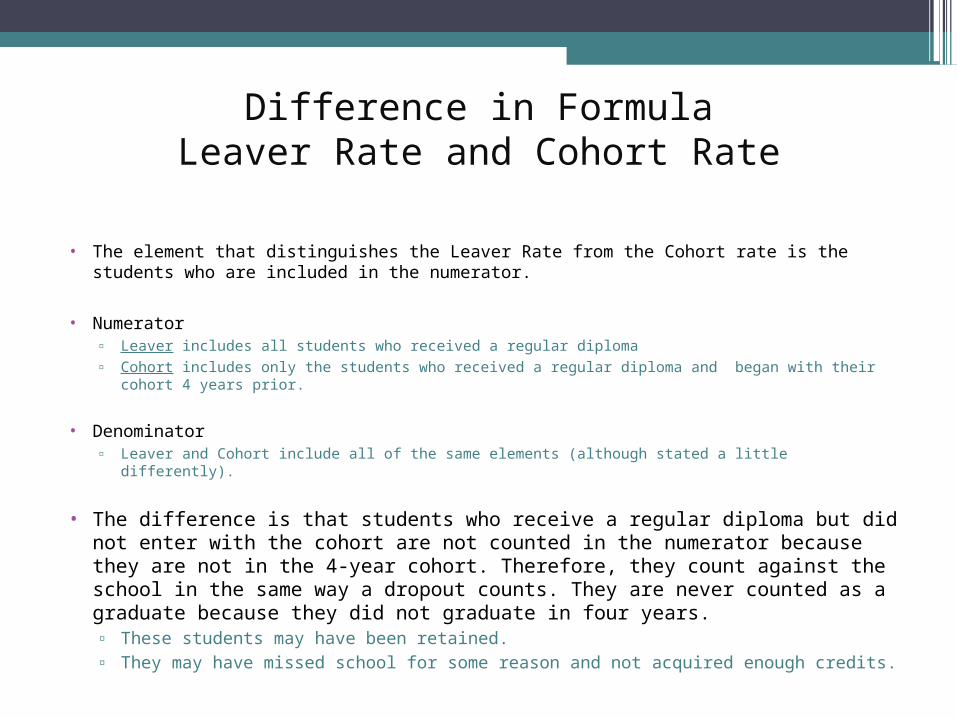
Difference in FormulaLeaver Rate and Cohort Rate
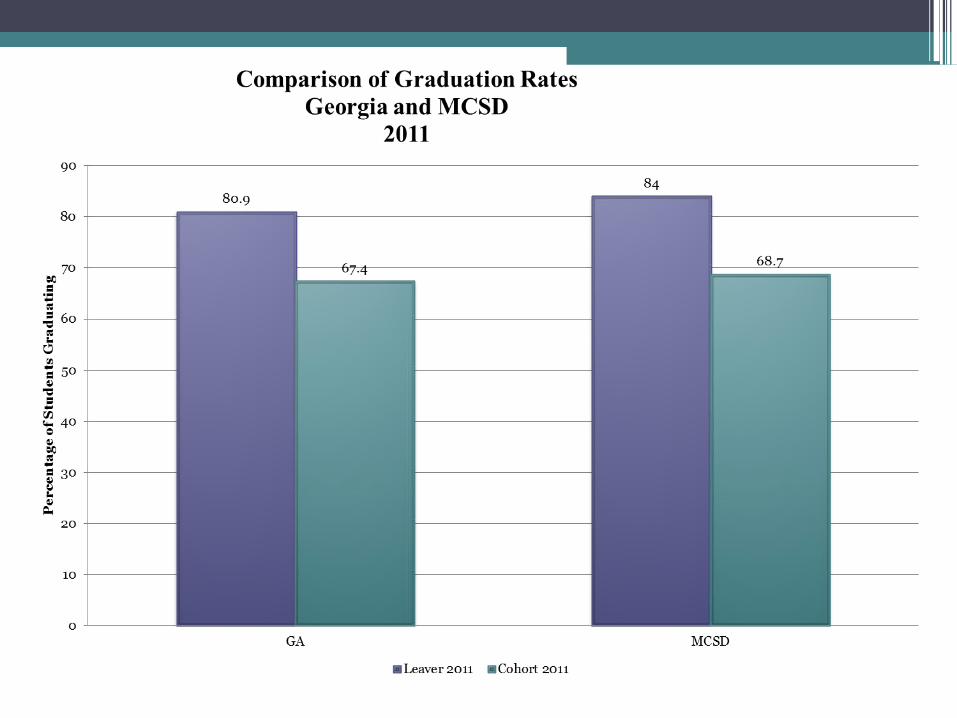
• The element that distinguishes the Leaver Rate from the Cohort rate is the students who are included in the numerator.
• Numerator▫ Leaver includes all students who received a regular diploma▫ Cohort includes only the students who received a regular diploma and began with their cohort
4 years prior.
• Denominator▫ Leaver and Cohort include all of the same elements (although stated a little differently).
• The difference is that students who receive a regular diploma but did not enter with the cohort are not counted in the numerator because they are not in the 4-year cohort. Therefore, they count against the school in the same way a dropout counts. They are never counted as a graduate because they did not graduate in four years.▫ These students may have been retained.▫ They may have missed school for some reason and not acquired enough credits.
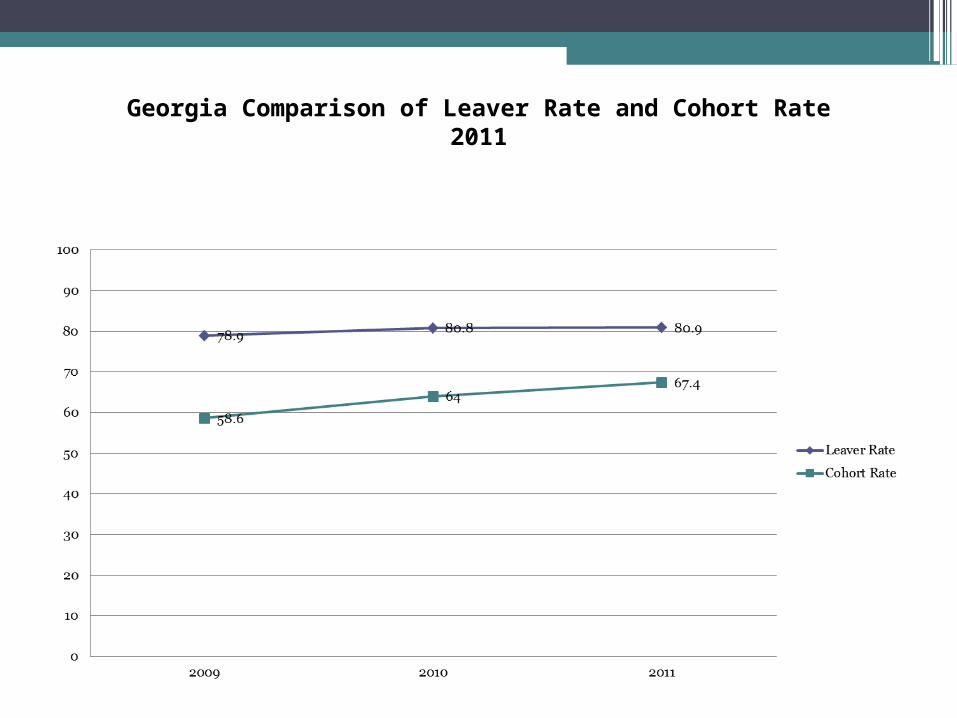
Georgia Comparison of Leaver Rate and Cohort Rate2011
Impact of Change
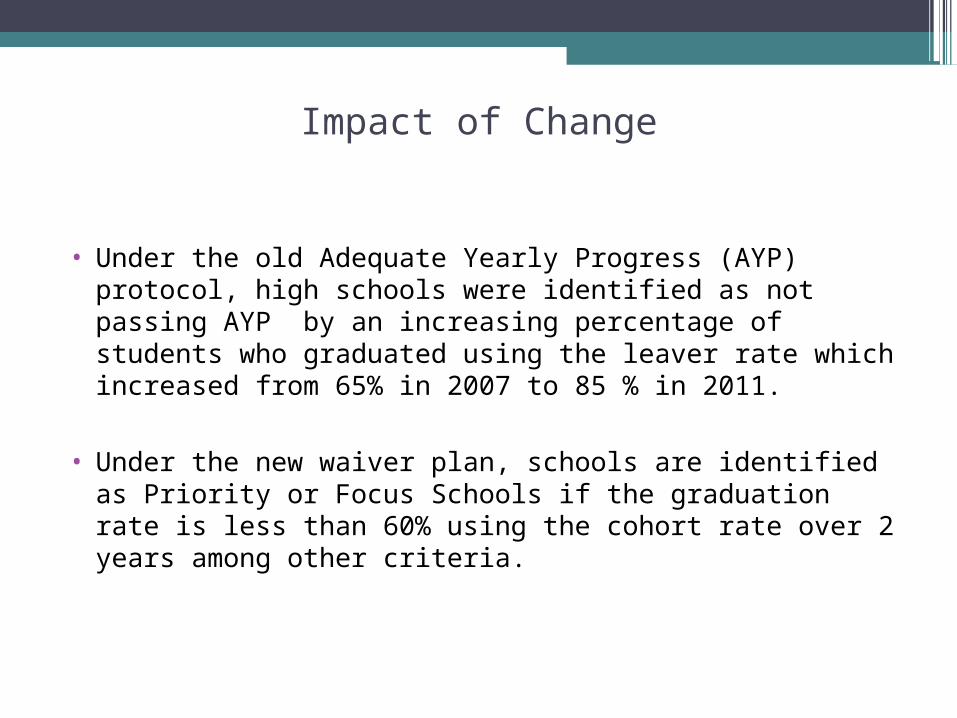
• Under the old Adequate Yearly Progress (AYP) protocol, high schools were identified as not passing AYP by an increasing percentage of students who graduated using the leaver rate which increased from 65% in 2007 to 85 % in 2011.
• Under the new waiver plan, schools are identified as Priority or Focus Schools if the graduation rate is less than 60% using the cohort rate over 2 years among other criteria.
Data Review
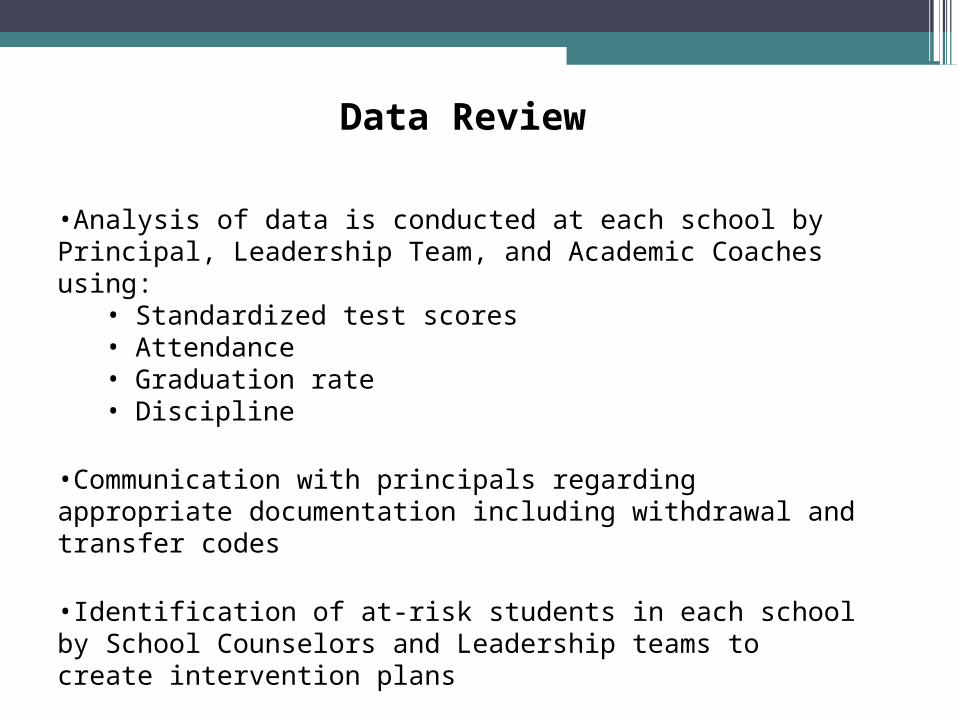
•Analysis of data is conducted at each school by Principal, Leadership Team, and Academic Coaches using:
• Standardized test scores • Attendance • Graduation rate • Discipline
•Communication with principals regarding appropriate documentation including withdrawal and transfer codes
•Identification of at-risk students in each school by School Counselors and Leadership teams to create intervention plans
Increased Learning Time
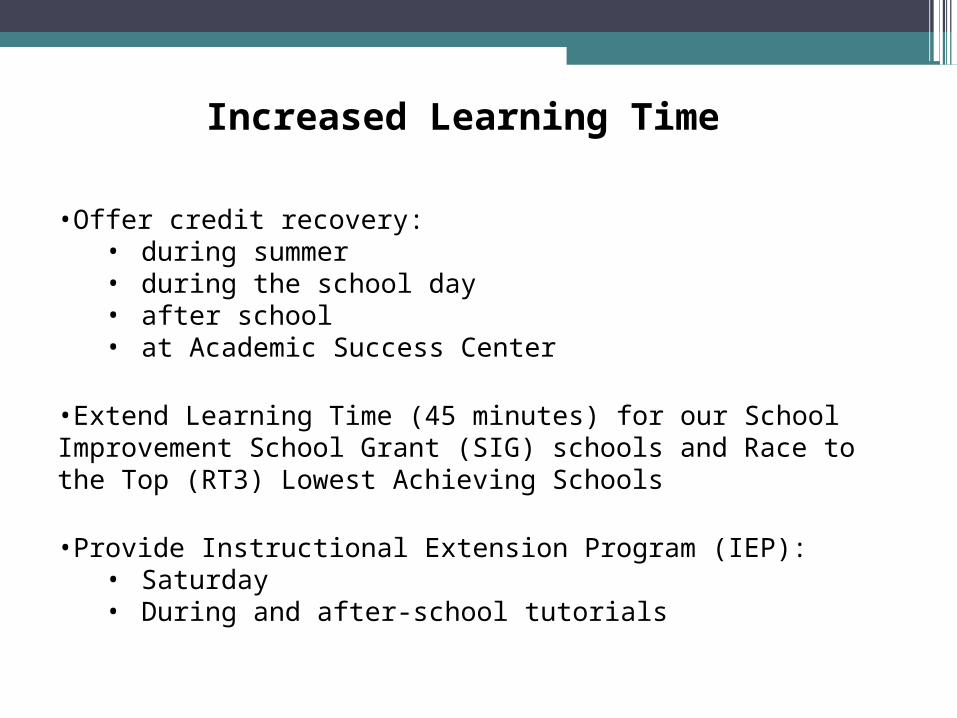
•Offer credit recovery: • during summer• during the school day• after school• at Academic Success Center
•Extend Learning Time (45 minutes) for our School Improvement School Grant (SIG) schools and Race to the Top (RT3) Lowest Achieving Schools
•Provide Instructional Extension Program (IEP): • Saturday • During and after-school tutorials
Instructional Tools Meet Learner Needs
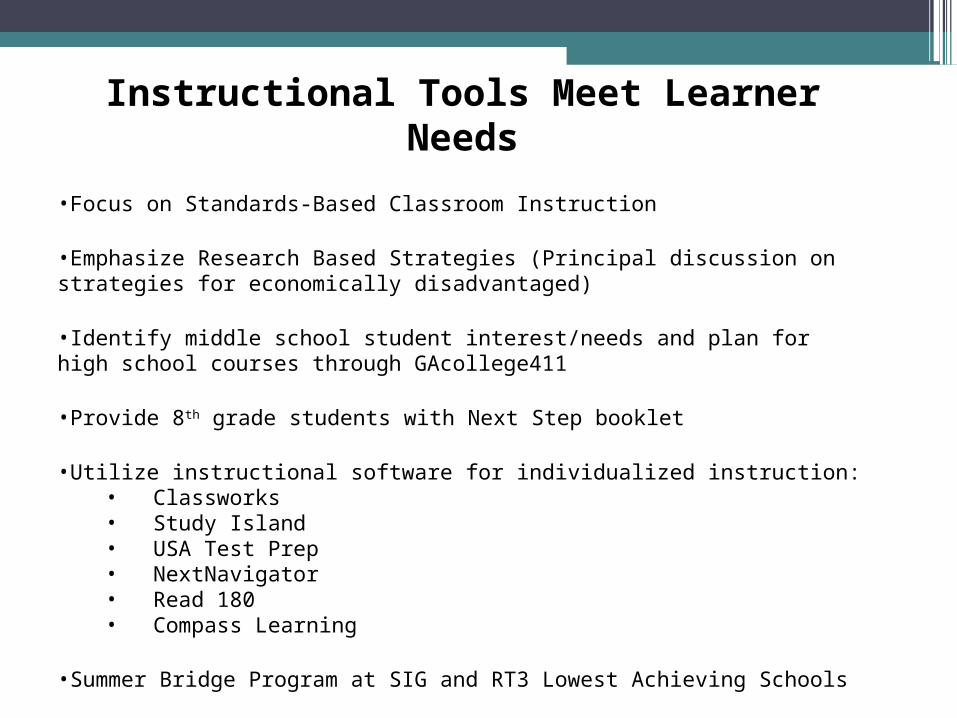
•Focus on Standards-Based Classroom Instruction
•Emphasize Research Based Strategies (Principal discussion on strategies for economically disadvantaged)
•Identify middle school student interest/needs and plan for high school courses through GAcollege411
•Provide 8th grade students with Next Step booklet
•Utilize instructional software for individualized instruction: • Classworks • Study Island • USA Test Prep • NextNavigator• Read 180 • Compass Learning
•Summer Bridge Program at SIG and RT3 Lowest Achieving Schools
•Creation of District common assessment, with principal input, provides instructional data to monitor student progress
Professional Development
•Increase professional development opportunities to address the new standards Common Core Georgia Performance Standards (CCGPS)
•Provide professional development opportunities with RT3 funding:
• inquiry-based learning • common assessments • instructional rigor• co-teaching• differentiated instruction
•Offer workshops with a focus on students with disabilities, economically disadvantaged and implement specific programs to provide support to students