chasing hard to get cases in panel surveys – is it worth it? nicole watson, university of...
TRANSCRIPT

Chasing hard to get cases in panel surveys – is it worth it?
Nicole Watson, University of MelbourneMark Wooden, University of Melbourne

www.melbourneinstitute.com
Acknowledgements
This paper uses unit record data from the Household, Income and Labour Dynamics in Australia (HILDA) Survey. The HILDA Project was initiated and is funded by the Australian Government Department of Families, Housing, Community Services and Indigenous Affairs (FaHCSIA) and is managed by the Melbourne Institute of Applied Economic and Social Research (Melbourne Institute).
The findings and view reported in this paper, however, are those of the authors and should not be attributed to either FaHCSIA or the Melbourne Institute.

www.melbourneinstitute.com
Research Questions
1. Are hard-to-get cases (that are interviewed) noticeably different from other interviewed cases?
2. Do the cases that require a lot of effort in one survey wave require a lot of effort in all waves?
3. Are hard-to-get cases in one wave simply going to attrit at the next wave?
4. Is data quality inversely associated with effort?

www.melbourneinstitute.com
Data: The HILDA Survey
National household panel survey– Nationally representative household sample (7682 hhs)– Started in 2001; annual interviewing– Face-to-face interviews (mostly) w all persons 15+ yrs– New household members added each wave
Response– W1 hh response rate = 66%– Re-interview rates: w2 = 87%, rising to 95%+ by w6
Sample size (unbalanced panel, 11 waves)*– N = 143,812; i =22,019

www.melbourneinstitute.com
Defining “Hard-to-Get”
Measure based on:
Examples of previous research HILDA measure
1. Call attempts
Fitzgerald & Fuller (1982); Cottler et al. (1987); Lin & Schaeffer (1995); Lynn et al. (2002); Yan et al. (2007); Heerwegh et al (2007); Hall et al. (2011)
(i) 13+ calls vs fewer(ii) 7+ calls vs fewer
2. Time to final outcome
Yan et al. (2004); Haring et al. (2009) (i) Responded in initial FW phase vs Later
(ii) Prior to end of year vs Post New Year
3. Initial refusal
Robins (1963); Smith (1984); Lin & Schaeffer (1995); Cohen et al (2000); Lynn et al. (2002); Yan et al. (2004); Billiet et al. (2005); Kaminska et al (2010); Hall et al. (2011)
Initial refusal vs No refusal
4. Respond’t cooperation
Kaminska et al (2010) Ivwr assessed cooperation: Very poor / Poor / Fair vs Excellent / Good

www.melbourneinstitute.com
How Many Cases are Hard-to-Get?
1 2 3 4 5 6 7 8 9 10 110
5
10
15
20
25
LateInitial refusal13+ calls7+ callsUncooperativePost NY
Survey wave
% o
f in
terv
iew
s

www.melbourneinstitute.com
Who are Hard-to-Get Cases Most Like?
Tests of joint significance from MNL predicting response type at time t (P)
Characteristics at t-1
Late Initial refusal 13+ calls
Easy NR Easy NR Easy NR
Age 0.062 0.000 0.000 0.003 0.000 0.000
Female 0.194 0.047 0.038 0.009 0.000 0.000
LF status x Hours 0.000 0.010 0.000 0.029 0.000 0.000
Home ownership 0.230 0.399 0.812 0.097 0.000 0.006
Country of birth 0.000 0.001 0.000 0.001 0.000 0.043
Education 0.064 0.000 0.000 0.000 0.070 0.000
Marital status 0.000 0.056 0.604 0.283 0.000 0.013
Region 0.000 0.611 0.000 0.244 0.000 0.000
# adults in hh 0.000 0.000 0.000 0.022 0.000 0.004
# children in hh 0.368 0.064 0.028 0.003 0.089 0.072
Eq. hh income 0.000 0.000 0.002 0.002 0.032 0.009
LT health condition 0.048 0.047 0.027 0.021 0.004 0.004
HH moved 0.000 0.007 0.000 0.063 0.000 0.144

www.melbourneinstitute.com
Are Hard-to-Get Cases Always Hard to Get? (I)
Late
Initia
l ref
usal
13+
calls
Uncoo
pera
tive
Post N
ew Y
ear
0
5
10
15
20
25
Easy to get at tHard to get at t
Ave
rag
e %
of c
ase
s th
at a
re h
ard
to g
et a
t t+
1

www.melbourneinstitute.com
Are Hard-to-Get Cases Always Hard to Get? (II)

www.melbourneinstitute.com
Do Hard-to-Get Cases Exit at Next Wave?
w1-w2
w2-w3
w3-w4
w4-w5
w5-w6
w6-w7
w7-w8
w8-w9
w9-w10
w10-w11
0
5
10
15
20
25
30
35
40
Easy (Initial refusal)Hard (initial Refusal)Hard (Late)Hard (13+ calls)
% o
f re
spo
nd
en
ts a
t t-1
tha
t do
n’t
resp
on
d a
t t

www.melbourneinstitute.com
Impact of Interview Status at t-1 on Response Outcomes at t
Early
Late
Non-re
sp
No re
fusa
l
Initia
l ref
usal
Non-re
sp
<13
calls
13+
calls
Non-re
sp0
20
40
60
80
100
Average predicted probabilities from MNL model
Easy at t-1Hard at t-1
www.melbourneinstitute.com
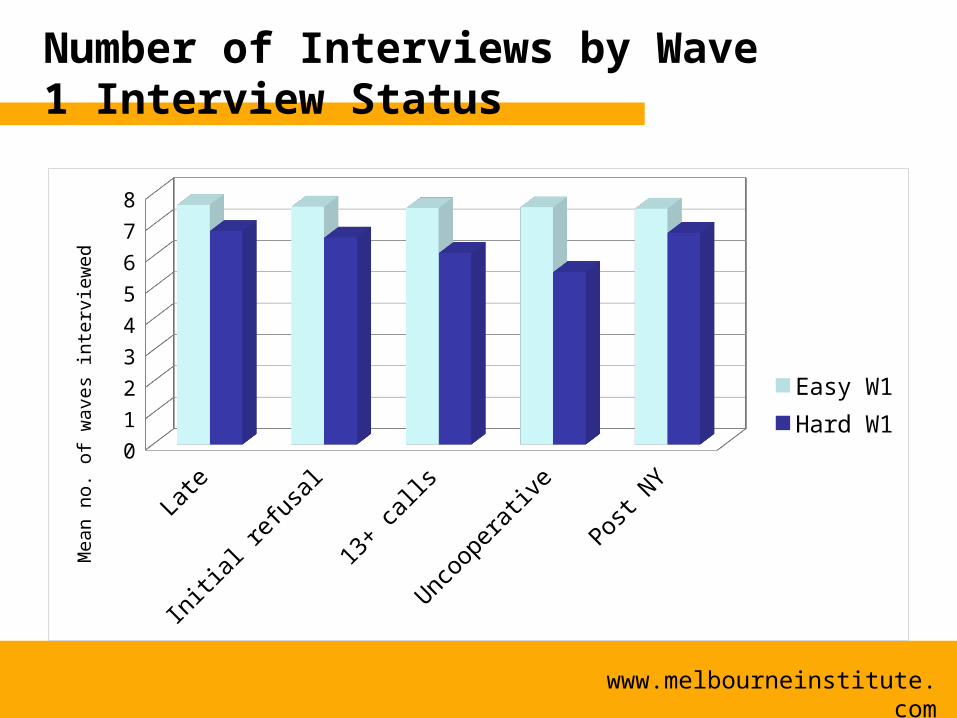
Number of Interviews by Wave 1 Interview Status
Late
Initia
l ref
usal
13+
calls
Uncoo
pera
tive
Post N
Y0
1
2
3
4
5
6
7
8
Easy W1Hard W1
Me
an
no
. of w
ave
s in
terv
iew
ed

www.melbourneinstitute.com
Do Hard-to-Get Cases Deliver Lower Quality Data?
Late Initial refusal 13+calls
Easy Hard Easy Hard Easy Hard
Response set bias: Satisfaction 1.2 1.3 1.2 1.3 1.2 1.4
Response set bias: Job satisfaction 2.5 2.9* 2.5 3.0* 2.5 2.8
Item NR: FY wages 5.0 8.2** 5.2 8.8** 5.1 9.3**
Item NR: FY pensions 1.8 3.2** 1.9 3.7** 1.9 4.0**
Rounding: FY wages (nearest $000) 67.8 72.5** 68.1 72.5** 68.1 72.7**
Rounding: FY pensions (nearest $000) 10.3 10.3 10.2 14.1* 10.2 17.3**
Phone interview 4.4 24.9** 5.4 27.0** 5.0 36.8**
Returned SCQ
If phone respondent 68.5 53.8** 66.7 48.4** 69.2 44.9**
If F2F respondent 93.2 80.3** 92.7 78.3** 92.7 78.3**

www.melbourneinstitute.com
Summary
Size of hard to get (H2G) group is definition dependent.
H2G are distinct from both easy-to-get cases and non-respondents.
Most H2G cases (P=70-73%) will be E2G at next survey wave.
H2G more likely to attrit (P=12-17%), but most don’t.
There may be some implications for data quality.