characterizing soybean meal value variation across the us ... · characterizing soybean meal value...
TRANSCRIPT

Characterizing soybean meal value variation across the US:
a swine case-study
Journal: Agronomy Journal
Manuscript ID Draft
Manuscript Type: Article
Topic Areas: 2. Crop Ecology and Physiology
Keyword: Soybean, Seed quality, Crop ecology, Crop quality, Case studies, experimental approaches
Agronomy Journal, ASA, 5585 Guilford Rd., Madison WI 53711
Agronomy Journal

Characterizing soybean meal value variation across the US: a swine case-study 1
2
ABSTRACT 3
Soybean [Glycine max (L.) Merr.] is the most important oilseed crop in the USA, 4
however, the quality characteristics of the soybean meal (SBM) produced from soybean grown in 5
various regions can vary significantly, often leading to region-specific commodity price 6
differentials. Currently, a fast, cost-effective, and accurate estimation method of SBM value does 7
not exist. Our objectives were to (i) develop a model using existing data that precisely estimates 8
SBM value targeted for swine nutrition, (ii) quantify the swine-specific SBM value variability 9
within and among states and (iii) evaluate the predictive effectiveness of the model for 10
estimating SBM value. The compositional characteristics of 8,282 soybean samples from 2013 to 11
2016 in 29 states were determined. Considering meal protein content and the concentrations of 12
four essential amino acids (lysine, methionine, tryptophan and isoleucine) from these samples, a 13
model that precisely estimates swine-specific SBM value was developed. Within each state, $17 14
to $66 Mg-1 SBM value range was estimated. A model-based on combined and maturity group-15
specific analysis of the 8,282 samples showed that using a simple base-line seed content of >350 16
g kg-1 for protein and >190 g kg-1 (13% water basis) for oil to identify high-quality cultivars can 17
be misleading and that the proposed model can estimate swine-specific SBM value more 18
precisely, both locally and regionally. This method can also be used for other, economic 19
important, animal diets (e.g., poultry) which could help US soybean producers choose high-20
yielding cultivars that are more likely to produce seed with increased ration-specific SBM value. 21
22
Abbreviations: AA, amino acids; MG, maturity group; SBM, soybean meal 23
Page 1 of 26
Agronomy Journal, ASA, 5585 Guilford Rd., Madison WI 53711
Agronomy Journal

24
INTRODUCTION 25
Soybean [Glycine max (L.) Merr.] is the most important oilseed crop in the USA, grown 26
mainly as a protein and oil source for animal and human consumption. In the USA, soybean 27
production increased by 60% from 1996 to 2016 arising from a 30% increase in planted area, and 28
to continual adoption by soybean producers of higher-yielding cultivars, and improved crop 29
management practices (Specht et al., 2014; USDA-NASS, 2017). Despite the substantial historic 30
seed yield increases, US soybean producers constantly explore opportunities to optimize cultivar 31
selection and crop management to increase soybean seed yield and thereby maximize net profit. 32
Upon seed delivery, elevators do not typically analyze soybean seed for quality; however, 33
end-user processors do. The quality characteristics of soybean meal (SBM) can ultimately affect 34
the local soybean per bushel price offered to soybean producers after soybean processors begin 35
to receive and valuate the new crop soybean seed. Soybean meal is commonly used as feed 36
source for non-ruminant species due to its high protein concentration, excellent amino acid (AA) 37
profile and adequate supply (Kim et al., 1999; Cromwell, 2000). However, substantial variation 38
in SBM composition has been observed among meals produced in different countries or areas 39
(Karr-Lilienthal et al., 2004; van Kempen et al., 2006; Ravindran et al., 2014). Soybean seed 40
harvested in the northern USA Corn Belt states is consistently lower in protein compared to that 41
in southern USA (Rotundo et al., 2016). Hurburgh et al. (1990) found significant spatial and 42
inter-annual variability for soybean seed protein in that seed produced in Northern USA 43
contained 15-20 mg kg-1 less protein and 2-5 mg kg-1 more oil than seed produced in the South 44
and Southeastern USA. The location of USA production thus appears to have a great influence 45
on seed and therefore by extension to meal composition as well. 46
Page 2 of 26
Agronomy Journal, ASA, 5585 Guilford Rd., Madison WI 53711
Agronomy Journal
Region-specific agricultural management, in-season weather conditions, and their 47
interactions greatly affect soybean seed yield and composition (Mourtzinis et al., 2017b), which 48
in turn can affect SBM composition. An important region-specific management practice is 49
producer selection of maturity group (MG) cultivars with photoperiod adaptation to their region. 50
In a recent study seven MG zones were identified based on using soybean yield as the criteria for 51
local adaptation (Mourtzinis et al., 2017a). Planting date is a key management practice, with 52
early planting typically resulting in higher yield than late planting and can also affect seed 53
composition (Mourtzinis et al., 2017b). For example, in Minnesota and Wisconsin, the 54
combination of a MG 2 with early planting (late April to early May) resulted in the highest yield, 55
oil, and oleic acid potential; however, late planting (late June) led to a reduction in seed yield but 56
resulted in the highest seed protein and essential AA content (Mourtzinis et al., 2017b). The AA 57
profile also varies among seeds with different protein content. It has been observed that soybeans 58
with lower crude protein had a higher proportion of the five critical essential AAs of lysine, 59
cysteine, methionine, threonine, and tryptophan (Thakur and Hurburgh, 2007; Medic et al., 2014; 60
Garvin and Naeve, 2016). The relative proportion of these AAs, present in the seed protein is 61
also dependent on the selected cultivar and planting date (Mourtzinis et al., 2017b). 62
Many underlying weather and environmental factors have been suggested to explain this 63
variation, including in-season temperature variance (Thomas et al., 2003; Wilson, 2004; Yaklich 64
and Vinyard, 2004). The effect of temperature on seed composition is especially pronounced 65
during seed fill (Kane et al., 1997), and particularly so from R5 to R8 (Mourtzinis et al., 2017b). 66
Wolf et al. (1982) reported increased protein, oil and oleic acid content, and decreased linolenic 67
and linoleic acids as the temperature during seed fill was increased. Naeve and Huerd (2008) 68
found that oil concentrations increased by 6.6 g kg-1 oC-1 during seed fill in Minnesota, but 69
Page 3 of 26
Agronomy Journal, ASA, 5585 Guilford Rd., Madison WI 53711
Agronomy Journal

protein was not affected. Additionally, Specht et al., (2001) observed that irrigation significantly 70
altered soybean seed protein and oil content. Obviously, compositional differences, as shaped by 71
environmental and management factors, ultimately affect seed and meal composition and AA 72
balance. The resultant SBM value will thus vary and can potentially affect the per bushel price 73
offered locally, regionally, and nationally each year. 74
For USA producers to better compete in the world soybean market by responding to 75
intrinsic or explicit pricing premiums/discounts offered by soybean seed purchasers, they would 76
need to know which cultivars produce higher yields and higher quality SBM. Most animal 77
nutritionists use ration formulation software that compares many feed ingredients simultaneously 78
to generate a ration to optimize animal weight gain relative to feed cost. Due to the 79
aforementioned genetic × environment effect on soybean seed composition, the need to identify 80
cultivars that produce meal with desirable composition, but with no concurrent reduction in yield 81
is essential. However, doing so requires analysis of a large number of samples each year in each 82
locality but such estimation would be costly and time-consuming. We argue that a fast, precise, 83
and cost-effective method of estimation would be valuable for producers, nutritionists, local 84
elevators and regional soybean processors. Therefore, using SBM for swine nutrition as a case-85
study, our objectives in this study were to (i) develop a model that precisely estimates SBM 86
value specific for optimizing swine nutrition based on synthetic or hypothetical SBM derived 87
from soybean quality parameters, (ii) quantify the swine-feeding-specific SBM value variability 88
within and among all soybean-producing states, and (iii) evaluate the predictive effectiveness of 89
the model for estimating SBM value. 90
91
MATERIALS AND METHODS 92
Page 4 of 26
Agronomy Journal, ASA, 5585 Guilford Rd., Madison WI 53711
Agronomy Journal

Data description and compositional analysis 93
Data collection and compositional analysis were described by Rotundo et al., (2016). 94
Briefly, from 2013 to 2016, a total of 8,282 soybean samples were collected from USA soybean 95
producers who indicated the zip code of the town closest to the farm where the soybeans were 96
grown. Based on the zip code information, each sample was then assigned to a state. The 97
developed database included data from 29 states (Iowa, Kansas, Minnesota, Missouri, Nebraska, 98
North Dakota, South Dakota, Illinois, Indiana, Michigan, Ohio, Wisconsin, Delaware, Maryland, 99
New Jersey, New York, Pennsylvania, Virginia, Arkansas, Kentucky, Louisiana, Mississippi, 100
Oklahoma, Tennessee, Texas, Alabama, Georgia, North Carolina, and South Carolina). 101
Soybean seed samples were analyzed for protein (g kg-1) and oil (g kg-1), for seven 102
essential amino acids (AAs g kg-1) which were lysine, cysteine, methionine, threonine, 103
tryptophan, isoleucine, and valine, and for moisture content (g kg-1). The analyses were 104
conducted via near-infrared spectroscopy technology using a Perten DA7250 diode array 105
instrument (Perten Instruments) equipped with calibration equations developed by the University 106
of Minnesota in cooperation with Perten Instruments. Protein, oil, and AA data were adjusted to 107
the standard of 13 g kg-1 seed moisture base for use in the subsequent analyses. 108
109
Soybean sample valuation based on animal diet-specific SBM value 110
A monetary value was placed on each soybean sample by creating a modeled soybean 111
meal for all soybean seed samples based on the resulting nutrient matrix for the soybean meal 112
derived from the Dalex least cost formulation program (Dalex Livestock Solutions, LLC). A diet 113
specification, representative of a typical mid-finishing swine diet, was common to all 114
comparisons, as were the prices for other ingredients needed in that diet formulation. Nutrient 115
Page 5 of 26
Agronomy Journal, ASA, 5585 Guilford Rd., Madison WI 53711
Agronomy Journal
specifications for that common swine diet are shown in Table 1, with the ration ingredients and 116
the set prices used in this study shown in Table 2. The modeled soybean meal was created using 117
the United Soybean Board (USB) Estimated Processed Value (EPV) calculator (Brumm and 118
Hurburgh, 1990). This calculator simulates the process of soybean processing (i.e., soy oil 119
extraction, hull removal etc.), with the output being a nutrient matrix for soybean meal that is 120
very representative of common soybean meal, but based on the nutrient content of the single 121
sample of soybean inputted in the calculator. In this formulation exercise, only AA values varied 122
from sample to sample. It was assumed that oil content, and hull removal/addition was similar 123
across each simulated soybean meal (Brumm and Hurburgh, 1990). Furthermore, to estimate AA 124
concentration in SBM, it was assumed that each AA’s concentration, as percent of protein 125
content, remains constant after processing. Thus, the concentration in the meal was based on the 126
change of protein content from whole soybean seed to meal. 127
A separate soybean meal “ingredient” was created for each of the 8,282 soybean samples 128
and used in the least cost formulation program to determine the least cost mix of ration 129
ingredients based on the specifications (Tables, 1, 2 and 3). The output used for further statistical 130
modeling in this project was total value per metric ton of the common diet ($ Mg-1). This swine-131
diet-specific SBM value then became a common descriptor for relative comparisons of the 8,282 132
soybean samples. 133
134
RESULTS AND DISCUSSION 135
Model to estimate soybean meal value 136
The current major challenge in the soybean commodity sector is the lack of a single 137
variable that would best describes SBM quality. Although it is widely accepted that the greater 138
Page 6 of 26
Agronomy Journal, ASA, 5585 Guilford Rd., Madison WI 53711
Agronomy Journal
the protein content the better the quality of the meal (i.e., greater value), it is not clear as to how 139
oil content and the relative proportions of the seven essential AAs (lysine, cysteine, methionine, 140
threonine, tryptophan, isoleucine, and valine) affect SBM value. To overcome this problem, we 141
used principal component analysis (PCA), which is a multivariate dimension reduction 142
technique, to combine the information of all the sample-specific constituents (protein, oil, AA) of 143
the synthetic/hypothetical SBM into one variable (Y_pca). Eight principal components were used 144
to capture ca. 98% of constituent variability, with the Y_pca value calculated by summing the 145
results of each principal component. We hypothesized that the greater the Y_pca value, the 146
greater the SBM value. Indeed, Y_pca was strongly and positively correlated (i.e., >0.70) with 147
protein, isoleucine, valine, sum of 5, and sum of 7 essential AAs in SBM (Table 4). Correlations 148
of Y_pca with the rest of the seed constituents were moderate, except for oil content which was 149
very low. 150
The 8,282 samples were then ranked in descending Y_pca value. A subset (n=145) was 151
specifically selected for calibration of a best-fit model. The selected samples included 40 seed 152
samples with the highest Y_pca and 40 seed samples with the lowest Y_pca values. These 80 153
samples served as constraining boundaries for model calibration. In addition, 30 other seed 154
samples were randomly selected from the (8,282-80=) 8,202 remaining samples. The SBM value 155
($ ton-1) for these 110 samples was then estimated as described in the methods section. 156
To develop a model that precisely estimates SBM value ($ ton-1), multiple linear 157
regression was applied to the 110 samples for model calibration. An additional 35 samples were 158
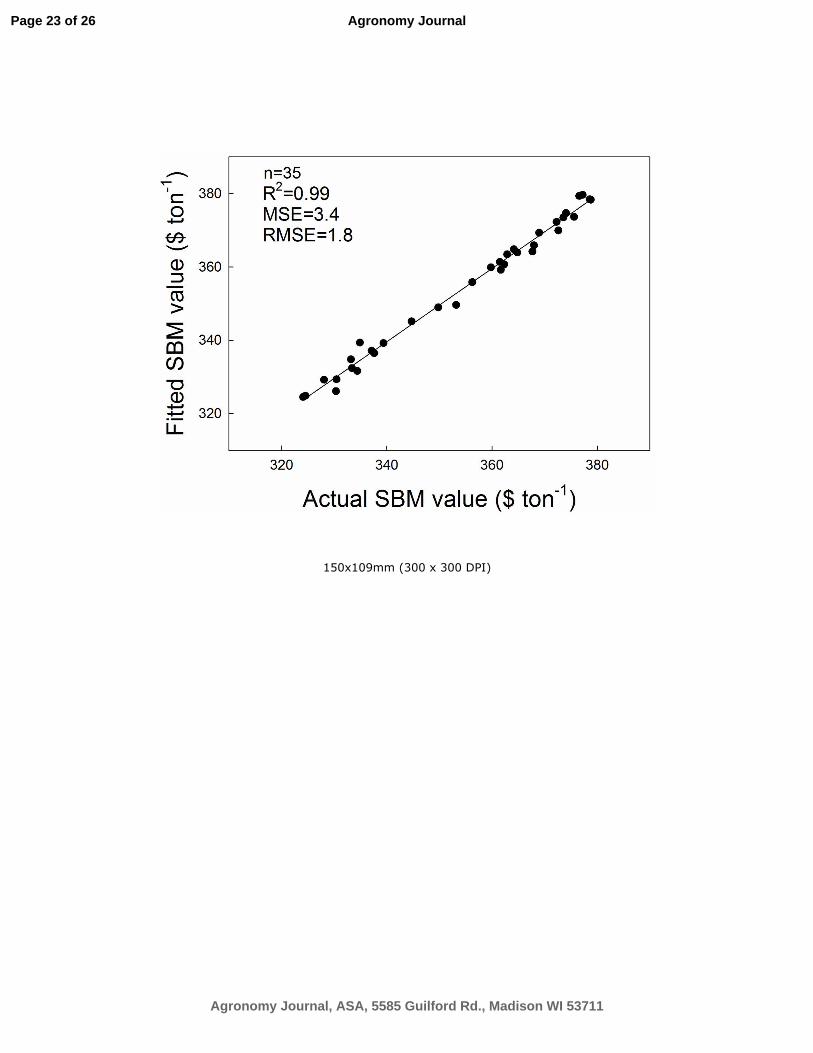
selected randomly for an independent validation test of the model. Protein, oil, lysine, cysteine, 159
methionine, threonine, tryptophan, isoleucine, and valine meal concentrations were used as 160
independent variables. The most parsimonious model, in which all independent variables were 161
Page 7 of 26
Agronomy Journal, ASA, 5585 Guilford Rd., Madison WI 53711
Agronomy Journal
significant (P<0.05) was selected. Statistical criteria such as coefficient of determination (R2), 162
adjusted R2, mean square error (MSE), root mean square error (RMSE), and coefficient of 163
variation (CV), were used for the final selection decision as described by Mourtzinis et al., 164
(2013). 165
The final model (equation 1) included protein, lysine, methionine, tryptophan and 166
isoleucine as the five independent variables. That model provided a good fit to data of the 110 167
cultivar samples in view of the calibration R2 and adjusted R2=0.991, MSE=3.1, RMSE=1.76 168
and CV=0.5. 169
170
Value of SBM ton-1 = 72.16361 + 1.65587 × Protein + 27.24420 × Lysine + 57.25507 × 171
Methionine + 84.56061 × Tryptophan + 21.80598 × Isoleucine (1) 172
173
The five variables in this model exhibited small variance inflation factors (VIF<5), which 174
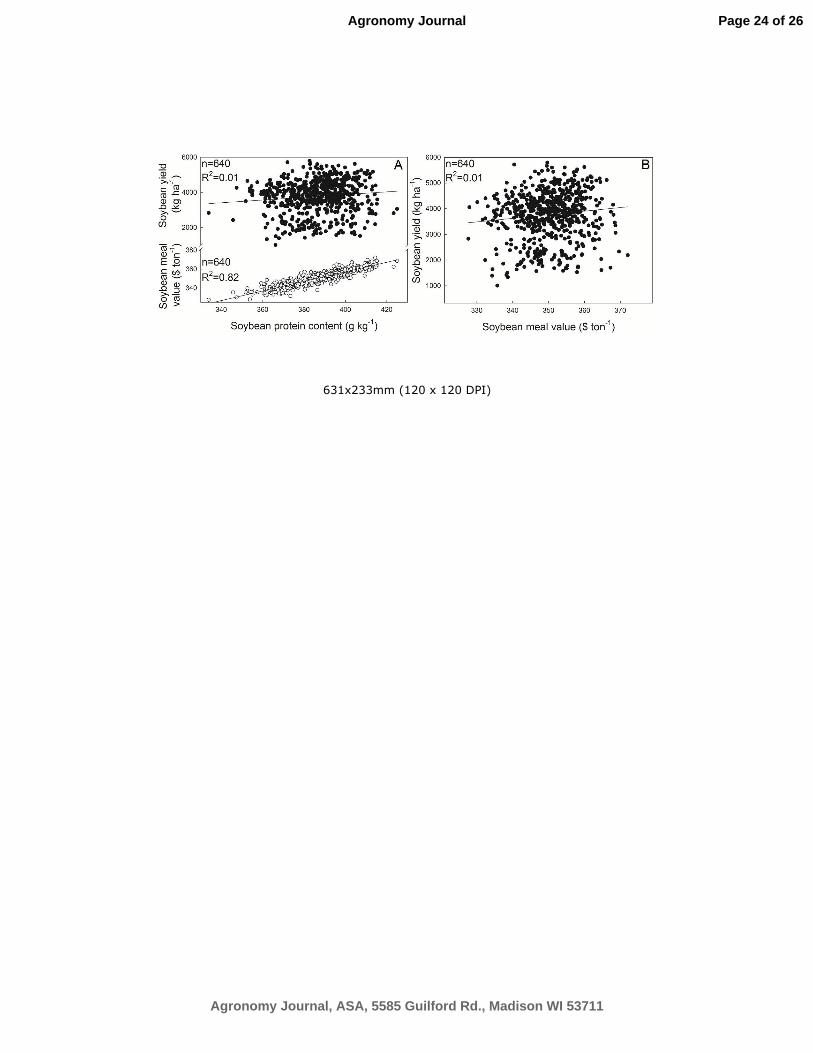
suggest that there was no multicollinearity among them, although that is usually a problem in 175
explanatory, but not in predictive, models we argue here in this case. 176
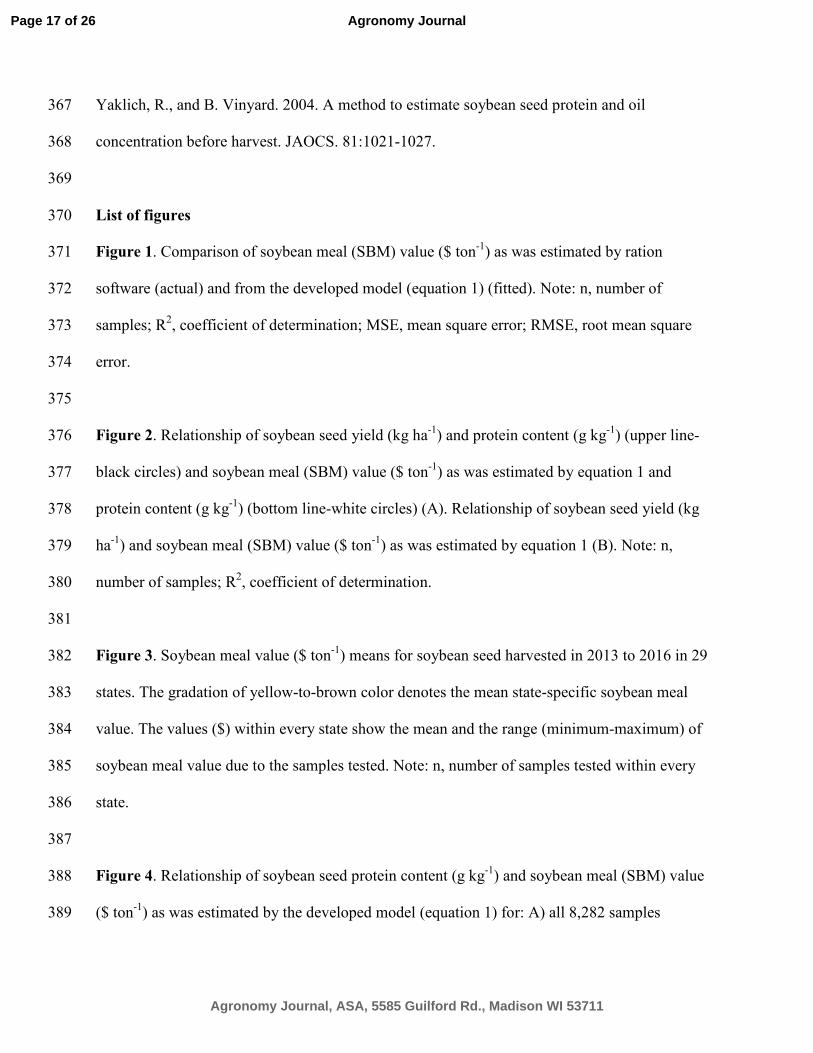
The predictive reliability of the model was evaluated using the 35 samples (Fig. 1) that 177
were not included in the model calibration process. Actual versus fitted values were closely 178
correlated with R2=0.99 and MSE and RMSE reaching 3.4 and 1.8, respectively. These 179
validation results suggested that the calibrated model can precisely estimate SBM value of seed 180
soybean produced by cultivars grown in any year and in any locality in the USA based on fixed 181
ingredient prices, thereby precluding the need to use expensive and time-consuming ration 182
software analysis after seed harvest. It should be noted that the three AAs that we did not include 183
in the model (cysteine, threonine, and valine) are still important for swine diet value. The only 184
Page 8 of 26
Agronomy Journal, ASA, 5585 Guilford Rd., Madison WI 53711
Agronomy Journal
reason for their exclusion from the final model (equation 1) is that the model adequately captured 185
most of swine-based SBM value variability in the 8,282 samples without them. 186
To examine the relationship between soybean seed yield and hypothetical SBM value, we 187
used compositional and seed yield data from an independent data set (from Mourtzinis et al., 188
2017b). Results show that there is no strong relationship between seed yield and protein content 189
but there is a strong relationship between protein and SBM value (Fig 2 A). Additionally, there is 190
no practically important relationship between soybean seed yield and SBM value (Fig 2 B), 191
which shows that cultivar selection for increased SBM value among the highest-yielding 192
cultivars can maximize a farmer’s profit. 193
Farmers typically select cultivars among those that seed companies promote and 194
advertise as the highest-yielding. Application of our simple model (equation 1), allows any 195
producer, elevator, or processor to estimate the value based on fixed ingredient prices of swine-196
based SBM for any specific soybean seed sample. Additionally, cultivars can be compared for 197
their hypothetical SBM values, which can aid the producer when selecting cultivars to plant in a 198
given year and elevators and processors to offer a premium or discount based on the estimated 199
SBM value. This same technique, based on fixed ingredient prices, can be applied by plant 200
breeders during the selection phase of cultivar breeding and release programs. 201
202
Estimating soybean meal value variability 203
The location where a soybean cultivar is grown is known to affect the quality of the seed 204
which impacts SBM quality (Karr-Lilienthal et al., 2004; van Kempen et al., 2006), and therefore 205
can affect its value. Indeed, mapping the SBM values ($ Mg-1), as estimated by applying our 206
model (equation 1), revealed substantial monetary differences among the 29 states (Fig. 3). On 207
Page 9 of 26
Agronomy Journal, ASA, 5585 Guilford Rd., Madison WI 53711
Agronomy Journal

average, soybean seed harvested in northern states produced SBM values up to $15 Mg-1 lower 208
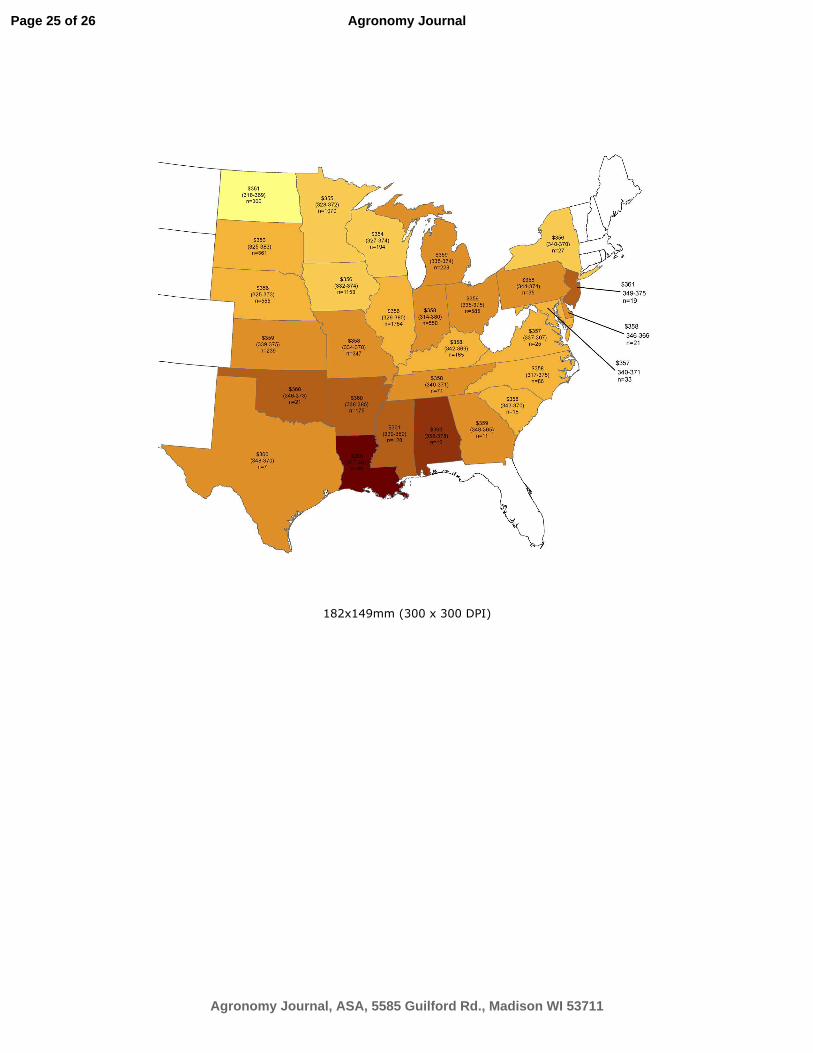
than in southern states. Our model confirms that Southern USA producers harvest soybean seeds 209
with greater SBM quality than Northern USA producers do as has been documented in the prior 210
literature. 211
Another important finding is the large SBM value range within each state, which was 212
attributed to genetic, management and environmental differences (Fig. 3). Based on the 8,282 213
samples, within each state, the minimal range was $17 in Georgia versus a maximal range of $66 214
in Indiana. The wider value range associated with the northern states could possibly be due to the 215
larger number of samples tested there compared with southern states. Another reason could be 216
the result of years of genetic improvement of cultivars targeted for the Corn Belt, due to its 217
importance as an agricultural region. For example, breeding-mediated improvement in MG 2, 3, 218
and 4 cultivars for increased yield is invariably the overarching goal which has resulted over 219
time in lower seed protein content (Rincker et al., 2014). 220
Notably, state-to-state mean differences in SBM value and the wide SBM value range 221
within each state, highlight the importance of local soybean producer cultivar selection. The 222
authors fully recognize the north-to-south and east-to-west variation in cultivar seed 223
composition; however, these results show the potential of individual producers to maximize their 224
profit by identifying high-yielding cultivars, among those advertised by seed companies, which 225
perform better locally, in terms of SBM value, than others in the same local. Furthermore, seed 226
companies could potentially utilize this simple model based on fixed ingredient prices to select, 227
evaluate, and promote cultivars with superior seed quality characteristics. Regardless for both 228
domestic and export markets, increasing the SBM value of the seed or meal product is a desired 229
goal. 230
Page 10 of 26
Agronomy Journal, ASA, 5585 Guilford Rd., Madison WI 53711
Agronomy Journal
231
Evaluating the predictive effectiveness of the model for estimating SBM value 232
Seed yield potential is the foremost criterion in which soybean breeders have selected 233
cultivars for advancement. Only after this criterion is met are other traits such as compositional 234
quality considered. Until recently the quest for increased seed quality has been primarily focused 235
on seed protein and oil content as cut-off criteria for choosing which of the high-yielding 236
breeding lines have seed protein contents closer to the desired levels. To that fact soybean 237
producer organizations promote the use of a cut-off value for protein seed content >350 g kg-1 238
(35%) and for oil content >190 g kg-1 (19%) (13% moisture basis) when possible, based on the 239
perception that doing so would potentially increase SBM value. However, by focusing only on 240
protein and oil content minimum criteria, other important compositional information is not 241
simultaneously considered, such as the AA profile, which could affect the animal feeding ration 242
based SBM value in unpredictable ways. Here, we have shown that the model (equation 1) we 243
developed based on 4-year, 29-state set of 8,282 samples, was a reliable predictor of SBM value 244
for evaluating SBM-specific for a desired swine ration. 245
When using protein and oil content limits [protein seed content >350 g kg-1 (35%), and 246
oil content >190 g kg-1 (19%)] as the only SBM value indicator for “high-quality” cultivars, only 247
ca. 50% of SBM value variability could be modeled (Fig. 4 A). Note that for seed samples 248
produced by “high-quality” cultivars (white circles) the red-line-delineated SBM value range 249
was $43 ton-1. Seed samples produced by cultivars that did not meet the “high-quality” criteria 250
(black circles) were also within the same value range and some exhibited an even greater value. 251
The same response was observed when repeating the analysis by disaggregating the 8,282 252
samples into MG based sub-sample sets (Fig 4 B-H). Thus, one can infer from this graphical 253
Page 11 of 26
Agronomy Journal, ASA, 5585 Guilford Rd., Madison WI 53711
Agronomy Journal

presentation that with only protein/oil content serving as a “high-quality” criteria important 254
compositional information is not considered. 255
These results suggest that using minimum protein and oil content as the only criteria for 256
SBM value indicator, a large proportion in value variability remains unexplained. Adding other 257
seed quality constituents, such as essential AAs that also contribute to SBM value, as we do in 258
our model (equation 1), will better target high SBM value cultivars, compared to just targeting 259
cultivars meeting just a simple standard of protein and oil content greater than 350 and 190 g kg-260
1, respectively. This is also clearly evident in the MG-specific graphs (Fig. 4 B-H). We therefore 261
believe that the foregoing data is evidence supporting the inclusion of AA profile, and along with 262
a protein content profile provides a more reliable estimate of SBM value, particularly when 263
modeling SBM for soybean meal destined to be used in animal feeding rations. 264
265
CONCLUSIONS 266
The work presented here has important implications for soybean cultivar selection and 267
breeding efforts across the US. Using swine diet as a case-study, we showed that by considering 268
meal protein content and the concentrations of four essential AAs (lysine, methionine, 269
tryptophan and isoleucine), a precise estimate of SBM value can be obtained. A simple model 270
based on fixed ingredient prices was presented that allows soybean producers, elevators, and 271
processors to estimate the relative cultivar-specific SBM value for swine nutrition. This method 272
can also be replicated for other, economic important, diets (e.g., poultry) and help US soybean 273
producers to select appropriate cultivars, among those promoted by seed companies as the 274
highest-yielding, for production of greater SBM quality. Ultimately, the US as a whole could 275
Page 12 of 26
Agronomy Journal, ASA, 5585 Guilford Rd., Madison WI 53711
Agronomy Journal
improve its position in the world soybean market due to the increased seed quality 276
characteristics. 277
278
ACKNOWLEDGEMENTS 279
The authors wish to thank John Gaska for his technical support, US Soybean Export Council, 280
Wisconsin Soybean Marketing Board, and Illinois Soybean Association for partially funding this 281
work. 282
283
REFERENCES 284
Brumm, J.T., and C.R. Hurburgh. 1990. Estimating the processed value of soybeans. J. Am. Oil 285
Chem. Soc. 65; 302-307. 286
287
Cromwell, G. L. 2000. Utilization of soy products in swine diets. Pages 258–282 in Soy in 288
Animal Nutrition. J. K. Drackley, ed. Fed. Anim. Sci. Soc., Savoy, IL. 289
290
Garvin, M. J., and S. L. Naeve. 2016. United States Food Soybean Quality – Annual report: 291
https://ussec.org/wp-content/uploads/2016/11/2016-US-Food-Soybean-Quality-Report-292
November.pdf (accessed July 20 2017). 293
294
Hurburgh, C., Jr., T. Brumm, J. Guinn, and R. Hartwig. 1990. Protein and oil patterns in U.S. 295
and world soybean markets. JAOCS. 67:966-973. 296
297
Page 13 of 26
Agronomy Journal, ASA, 5585 Guilford Rd., Madison WI 53711
Agronomy Journal

Kane, M.V., C.C. Steele, L.J. Grabau, C.T. MacKown, and D.F. Hildebrand. 1997. Early-298
maturing soybean cropping systems: III. Protein and oil contents and oil composition. Agron. J. 299
89:464-469. 300
301
Karr-Lilienthal, L. K., N. R. Merchen, C. M. Grieshop, M. A. Flahaven, D. C. Mahan, N. D. 302
Fastinger, M. Watts, and G. C. Fahey Jr. 2004. Ideal amino acid digestibilities by pigs fed 303
soybean meals from five major soybean-producing countries. J. Anim. Sci. 82:3198–3209. 304
305
Kim, I. H., J. D. Hancock, D. B. Jones, and P. G. Reddy. 1999. Extrusion processing of low-306
inhibitor soybeans improves growth performance of early-weaned pigs. Asian-australas. J. Anim. 307
Sci. 12:1251–1257. 308
309
Mourtzinis, S., F. J. Arriaga, K. S. Balkcom, and B. V. Ortiz. 2013. Corn grain and stover yield 310
prediction at R1 growth stage. Agron. J. 105:1045-1050 doi: 10.2134/agronj2012.0393. 311
312
Mourtzinis, S., and S. P. Conley. 2017a. Delineating soybean maturity groups across the US. 313
Agron. J. 109:1–7. doi:10.2134/agronj2016.10.0581. 314
315
Mourtzinis, S., A. Gaspar, S. Naeve, and S. P. Conley. 2017b. Planting date, maturity, and 316
temperature effects on soybean seed yield and quality. Agron. J. 109:1–10. 317
doi:10.2134/agronj2017.05.0247. 318
319
Medic, J., C. Atkinson, and C.R. Hurburgh Jr. 2014. Current knowledge in soybean 320
Page 14 of 26
Agronomy Journal, ASA, 5585 Guilford Rd., Madison WI 53711
Agronomy Journal

composition. J. Am. Oil Chem. Soc. 91:363-384. 321
322
Naeve, S.L. and S.C. Huerd. 2008. Year, region, and temperature effects on the quality of 323
Minnesota’s soybean crop. Agron. J. 100:690-695. 324
325
Ravindran, V., M. R. Abdollahi, and S. M. Bootwalla. 2014. Nutrient analysis, metabolizable 326
energy, and digestible amino acids of soybean meals of different origins for broilers. Poult. Sci. 327
93:2567-2577 http://dx.doi.org/ 10.3382/ps.2014-04068. 328
329
Rincker, K., R. Nelson, J. Specht, D. Sleper, T. Cary, S. Clanzio et al. 2014. Genetic 330
improvement of US soybean in Maturity Groups II, III, and IV. Crop Sci. 54:1-14 331
doi:10.2135/cropsci2013.10.0665. 332
333
Rotundo, J.L., J.E. Miller, and S.L. Naeve. 2016. Regional and temporal variation in soybean 334
seed protein and oil across the United States. Crop Sci. 56:797–808. 335
336
Specht, J.E., K. Chase, M. Macrander, G. L. Graef, J. Chung, J. P. Markwell, M. Germann, J. H. 337
Orf, and K. G. Lark. 2001. Soybean Response to Water: A QTL Analysis of Drought Tolerance. 338
Crop Sci. 41:493–509. 339
340
Specht, J.E., B.W. Diers, R.L. Nelson, J. Francisco Ferraz de Toledo, J.A. Torrion, and P. 341
Grassini. 2014. Yield Gains in Major U.S. Field Crops. CSSA Special Publication 33. 5585 342
Guilford Rd., Madison, WI 53711-5801, USA. doi:10.2135/cssaspecpub33.c12. 343
Page 15 of 26
Agronomy Journal, ASA, 5585 Guilford Rd., Madison WI 53711
Agronomy Journal
344
Thakur, M. and C.R. Hurburgh. 2007. Quality of US soybean meal compared to the quality of 345
soybean meal from other origins. J. Am. Oil Chem. Soc. 84:835-843. 346
347
Thomas, J.M.G., K.J. Boote, L.H. Allen, M. Gallo-Meagher, and J.M. Davis. 2003. Elevated 348
temperatures and carbon dioxide effects on soybean seed composition and transcript abundance. 349
Crop Sci. 43:1548-1557. 350
351
USDA-NASS. (2017) USDA-National Agricultural Statistics Service (NASS), Crop production 352
summary: http://usda.mannlib.cornell.edu/usda/current/CropProdSu/CropProdSu-01-12-2017.pdf 353
(accessed Nov. 03 2017). 354
355
van Kempen, T. A., E. van Heugten, A. J. Moeser, N. S. Muley, and V. J. H. Sewalt. 2006. 356
Selecting soybean meal characteristics preferred for swine nutrition. J. Anim. Sci. 84:1387–1395. 357
358
Wilson, R.F. 2004. Seed composition. In: Boerma, H.R., and Specht, J.E. editors, Soybeans: 359
Improvement, production, and uses. American Society of Agronomy, Crop Science Society of 360
America, Soil Science Society of America, Madison, WI. p. 621–677. 361
362
Wolf, R.B., J.F. Cavins, R. Kleiman and L.T. Black. 1982. Effect of temperature on soybean 363
seed constituents: Oil, protein, moisture, fatty acids, amino acids and sugars. JAOCS. 59: 230-364
232. 365
366
Page 16 of 26
Agronomy Journal, ASA, 5585 Guilford Rd., Madison WI 53711
Agronomy Journal
Yaklich, R., and B. Vinyard. 2004. A method to estimate soybean seed protein and oil 367
concentration before harvest. JAOCS. 81:1021-1027. 368
369
List of figures 370
Figure 1. Comparison of soybean meal (SBM) value ($ ton-1) as was estimated by ration 371
software (actual) and from the developed model (equation 1) (fitted). Note: n, number of 372
samples; R2, coefficient of determination; MSE, mean square error; RMSE, root mean square 373
error. 374
375
Figure 2. Relationship of soybean seed yield (kg ha-1) and protein content (g kg-1) (upper line-376
black circles) and soybean meal (SBM) value ($ ton-1) as was estimated by equation 1 and 377
protein content (g kg-1) (bottom line-white circles) (A). Relationship of soybean seed yield (kg 378
ha-1) and soybean meal (SBM) value ($ ton-1) as was estimated by equation 1 (B). Note: n, 379
number of samples; R2, coefficient of determination. 380
381
Figure 3. Soybean meal value ($ ton-1) means for soybean seed harvested in 2013 to 2016 in 29 382
states. The gradation of yellow-to-brown color denotes the mean state-specific soybean meal 383
value. The values ($) within every state show the mean and the range (minimum-maximum) of 384
soybean meal value due to the samples tested. Note: n, number of samples tested within every 385
state. 386
387
Figure 4. Relationship of soybean seed protein content (g kg-1) and soybean meal (SBM) value 388
($ ton-1) as was estimated by the developed model (equation 1) for: A) all 8,282 samples 389
Page 17 of 26
Agronomy Journal, ASA, 5585 Guilford Rd., Madison WI 53711
Agronomy Journal

collected during 2013 to 2016 for cultivar maturity groups (MG) in 29 states, B) only MG 0, C) 390
MG 1, D) MG 2, E) MG 3, F) MG 4, G) MG 5, and H) MG 6. White circles denote the cultivars 391
with a protein content >350 g kg-1 (35%) and an oil content > 190 g kg-1 (19%) in each graph 392
panel, whereas black circles denote cultivars that do meet either the protein or the oil criterion 393
(or both). The red horizontal and blue vertical lines demark the limiting maximum and minimum 394
SBM values that correspond to the aforementioned protein and oil content criteria. Note: R2, 395
coefficient of determination, and n, sample number in chart. 396
397
398
399
400
401
402
403
404
405
406
407
408
409
410
411
412
Page 18 of 26
Agronomy Journal, ASA, 5585 Guilford Rd., Madison WI 53711
Agronomy Journal

Table 1. Nutrient specifications of the common diet. 413
Nutrient Unit Minimum Maximum
Metabolizable energy Kcal/kg 3,222 - Calcium % 0.60 0.71 Available phosphorus % 0.35 - †SID Lysine % 0.85 - SID Methionine+Cysteine % of SID lysine 0.57 - SID Isoleucine % of SID lysine 0.55 - SID Threonine % of SID lysine 0.63 - SID Tryptophan % of SID lysine 0.18 - SID Valine % of SID lysine 0.65 -
† Standardized Ileal digestibility 414
415 416 417 418 419 420 421 422 423 424 425 426 427 428 429 430 431 432 433 434 435 436 437 438 439 440 441 442 443 444 445 446 447 448
Page 19 of 26
Agronomy Journal, ASA, 5585 Guilford Rd., Madison WI 53711
Agronomy Journal

Table 2. Ingredient specifications of the common diet. 449
Ingredient Price/ton, $ Minimum, kg/ton Maximum, kg/ton
Corn 115.00 - - Soybean meal 315.00 - - Calcium carbonate 50.56 - - Mono-calcium phosphate 570.00 - - Salt 88.80 3.6 3.6 VTM 2,000.00 2.3 2.3 L-Threonine 1,869.00 - 1.4 L-Lysine 1,586.00 - 4.1 L-Tryptophan 7,984.00 - 0.9 DL-Methionine 4,000.00 - 1.4 L-Valine 6,530.00 - 0.9
450 451 452 453 454 455 456 457 458 459 460 461 462 463 464 465 466 467 468 469 470 471 472 473 474 475 476 477 478 479 480 481 482
Page 20 of 26
Agronomy Journal, ASA, 5585 Guilford Rd., Madison WI 53711
Agronomy Journal

Table 3. Description of key formulation nutrients of soybean meal. 483
Nutrient Unit Value
Protein % Varied by sample Total of individual amino acid % Varied by sample Metabolizable energy Kcal/kg 3,333
Standardized Ideal Digestibility Coefficients of Amino Acids Lysine % 90 Methionine % 91 Cysteine % 87 Threonine % 87 Tryptophan % 90 Isoleucine % 89 Valine % 88
484
Page 21 of 26
Agronomy Journal, ASA, 5585 Guilford Rd., Madison WI 53711
Agronomy Journal

Table 4. Pearson correlations of Y_pca (combined information of all the variety-specific constituents using principal component analysis) and all measured soybean meal constituents from 8,282 samples across years and locations.
† Sum of lysine, cysteine, methionine, threonine, tryptophan, isoleucine, and valine ‡ Sum of lysine, cysteine, methionine, threonine, and tryptophan Note: *** denote significant correlations at alpha=0.001.
Y_pca Protein Oil Lysine Cysteine Methionine Threonine Tryptophan Isoleucine Valine †Sum of 7 AAs ‡Sum of 5 AAs
Y_pca 1 0.8533*** 0.2129*** 0.4652*** 0.6433*** 0.5899*** 0.4889*** 0.5281*** 0.7495*** 0.6959*** 0.8810*** 0.8246***
Protein 1 -0.0971*** 0.3966*** 0.5129*** 0.4533*** 0.4513*** 0.1982*** 0.7967*** 0.8006*** 0.7992*** 0.6314***
Oil 1 0.0709*** 0.0017*** -0.0520*** -0.1281*** 0.3845*** 0.0646*** -0.0657*** 0.0504*** 0.0859***
Lysine 1 0.1531*** 0.1025*** 0.4569*** 0.1745*** 0.4491*** 0.2719*** 0.6943*** 0.8227***
Cysteine 1 0.7023*** 0.1246*** 0.3060*** 0.4665*** 0.5377*** 0.6050*** 0.5572***
Methionine 1 -0.0775*** 0.4282*** 0.4259*** 0.6617*** 0.5889*** 0.4915***
Threonine 1 -0.1615*** 0.4635*** 0.1321*** 0.5032*** 0.5753***
Tryptophan 1 0.3368*** 0.3466*** 0.4586*** 0.4553***
Isoleucine 1 0.7509*** 0.8662*** 0.6868***
Valine 1 0.7842*** 0.5362***
Sum of 7 AAs 1 0.9328***
Sum of 5 AAs 1
Page 22 of 26
Agronomy Journal, ASA, 5585 Guilford Rd., Madison WI 53711
Agronomy Journal
150x109mm (300 x 300 DPI)
Page 23 of 26
Agronomy Journal, ASA, 5585 Guilford Rd., Madison WI 53711
Agronomy Journal
631x233mm (120 x 120 DPI)
Page 24 of 26
Agronomy Journal, ASA, 5585 Guilford Rd., Madison WI 53711
Agronomy Journal
182x149mm (300 x 300 DPI)
Page 25 of 26
Agronomy Journal, ASA, 5585 Guilford Rd., Madison WI 53711
Agronomy Journal

648x244mm (120 x 120 DPI)
Page 26 of 26
Agronomy Journal, ASA, 5585 Guilford Rd., Madison WI 53711
Agronomy Journal