nutritional evaluation of fermented soybean meal...
TRANSCRIPT

NUTRITIONAL EVALUATION OF FERMENTED SOYBEAN MEAL FED TO WEANLING PIGS
BY
OSCAR JAVIER ROJAS MARTINEZ
THESIS
Submitted in partial fulfillment of the requirements for the degree of Master of Science in Animal Sciences
in the Graduate College of the University of Illinois at Urbana-Champaign, 2012
Urbana, Illinois
Adviser:
Professor Hans Henrik Stein

ii
ABSTRACT
Three experiments were conducted to determine P, AA, and energy digestibility in
fermented soybean meal (FSBM), conventional soybean meal (SBM-CV), and fish meal. Three
growth performance experiments were also conducted using the values for the digestibility of P,
AA, and energy determined in the initial 3 experiments to formulate diets. The objective of Exp.
1 was to determine the apparent total tract digestibility (ATTD) and the standardized total tract
digestibility (STTD) of P without or with the addition of microbial phytase (Optiphos 2000,
Enzyvia, Sheridan, IN) in FSBM and SBM-CV. Four diets were formulated to contain FSBM or
SBM-CV and either 0 or 800 units/kg of microbial phytase. The only sources of P in these diets
were FSBM and SBM-CV. A P-free diet that was used to estimate basal endogenous losses of P
was also formulated. The ATTD and STTD of P were greater (P< 0.01) in FSBM than in SBM-
CV if no phytase was used, but that was not the case if phytase was added to the diet (soybean
meal × phytase interaction: P< 0.01). The objectives of experiments 2 and 3 were to determine
the standardized ileal digestibility (SID) and the concentration of DE, ME, and NE in FSBM,
SBM-CV, and fish meal, respectively. In Exp. 2, 3 cornstarch-based diets were formulated with
FSBM, SBM-CV, or fish meal as the only source of AA in each diet. A N-free diet that was used
to estimate basal endogenous losses of CP and AA was also formulated. The SID of all
indispensable AA except Lys, Thr, and Trp was greater (P< 0.01) in FSBM than in fish meal.
The SID of Met and Val were also greater (P< 0.05) in FSBM than in SBM-CV, but for the
remaining indispensable AA, no differences between FSBM and SBM-CV were observed. In
experiment 3, a corn-based diet consisting of 96.4% corn and vitamins and minerals was
formulated. Three additional diets containing corn and each of the experimental ingredients
(FSBM, SBM-CV, and fish meal, respectively) were also formulated. The concentrations of DE,

iii
ME, and NE in SBM-CV were 4,553, 4,137, and 3,193 kcal/kg DM. These values were greater
(P < 0.01) than the DE, ME, and NE in FSBM (4,296, 3,781, and 2,951 kcal/kg DM), corn
(3,951, 3,819, and 2,864 kcal/kg DM), and fish meal (3,827, 3,412, and 2,626 kcal/kg DM).
However, FSBM contained more DE, ME, and NE(P < 0.01) than fish meal and more DE than
corn(P < 0.01). The objective of Exp. 4, 5, and 6 was to test the hypothesis that FSBM can
replace animal protein sources in diets fed to weanling pigs during the initial 28 d post-weaning.
Results from the 3 experiments indicated that inclusion of 10%FSBM may replace fish meal,
chicken meal (CM), or poultry by-product meal (PBM) without impacting ADG, ADFI, or final
BW of the pigs. However, in 1 of the 3 experiments, it was observed that G:F was less for pigs
fed FSBM than for pigs fed fish meal, but it was also observed that during the first week post-
weaning, FSBM could not replace protein plasma and whey powder without negatively
impacting pig growth performance. In conclusion,FSBM contains more digestible P than SBM-
CV, which reduced the need for inclusion of inorganic P in diets containing FSBM. Likewise,
fermentation of SBM-CV reduces DE, ME, and NE, but does not affect AA digestibility and
FSBM may replace fish meal, CM, and PBM in diets fed to pigs during the initial 28 d post-
weaning without affecting pig growth performance except that G:F may be reduced.
Key words: amino acid digestibility, energy, fermented soybean meal, phosphorous digestibility,
pigs, soybean meal.

iv
ACKNOWLEDGEMENTS
This is the end of a chapter in my life that could not have been accomplished without the
support of many people that directly or indirectly helped me to successfully complete this work.
I would like to express my gratefulness to my advisor Dr. Hans H. Stein. He is the person
who gave me the opportunity to show my potential as a graduate student and more importantly as
a scientist. I will be truly thankful all my life for your guidance and support and for giving me
this amazing opportunity to be a part of your lab. I hope that some day, I can establish a second
Stein Nutrition Lab in another part of the world.
I would also like to thank my committee members, Dr. Robert A. Easter and Dr. Elvira de
Mejia for agreeing to be on my committee.
I would like to express my gratitude to my colleagues Dr. Beob G. Kim, Dr. Amer A.
Pahm, Dr. Sarah K. Cervantes-Pahm, Dr. Rommel C. Sulabo, Dr. Grant I. Petersen, Dr. Pedro E.
Urriola, Dr. Dong Y. Kill, Ferdinando N. Almeida, J. Caroline Gonzales, Tanawong Maison,
Nestor A. Gutierez, Jin Yoon, Neil Jaworski, Diego Rodriguez, Jung W. Lee, John Mathai, Kate
L. Horsman and Scott R. Baker for their support and help when I most needed it.
I would like also to extent my gratitude to all of the professors and laboratory personnel
in the Department of Animal Sciences, the crews at the Swine Research Centre and at the
Imported Swine Research Laboratory, the feed mill crew, and to HiDee Ekstrom, our super-
efficient secretary. You all were for willing to and ready to help me when I needed it and I
greatly appreciate that.
I also thank my brothers William, Mario, Andres, Alex, Camilo, and my sister Xiomara
for all your unconditional support, care, and love though the years.

v
To my father Angel and my mothers Ruth and Camila, I only can say thank you. You all
gave me the love, passion, encouragement, and tools to be a good son and a good human being. I
am really proud to be your son.
Last but no least, to my girlfriend, Lia V. Guardiola: My deepest appreciation for all the
support, time, and love that you have shared with me though the years I have been in
Champaign-Urbana. I recognize how important you are in my life and also what you mean to me.
Lo logramos cresta !!!

vi
TABLE OF CONTENTS
CHAPTER 1: INTRODUCTION ............................................................................................ 1
LITERATURE CITED ............................................................................................................... 3
CHAPTER 2:WEANING OF PIGS: LITERATURE REVIEW.......................................... 4
INTRODUCTION....................................................................................................................... 4
PHYSIOLOGICAL AND ANATOMICAL CHANGES AT WEANING................................. 6
CHARACTERISTICS OF DIETS FED TO WEANLING PIGS............................................... 9
ALTERNATIVE PROTEIN INGREDIENTS.......................................................................... 11
CONCLUSIONS....................................................................................................................... 13
LITERATURE CITED ............................................................................................................. 15
CHAPTER 3: DIGESTIBILITY OF PHOSPHOROUS IN FERMENTED AND
CONVENTIONAL SOYBEAN MEAL WITHOUT AND WITH MICROBIAL
PHYTASE BY WEANLING PIGS ....................................................................................... 25
ABSTRACT.............................................................................................................................. 25
INTRODUCTION..................................................................................................................... 26
MATERIALS AND METHODS.............................................................................................. 27
RESULTS.................................................................................................................................. 30
DISCUSSION ........................................................................................................................... 32
LITERATURE CITED ............................................................................................................. 37

vii
CHAPTER 4: DIGESTIBILITY OF ENERGY, DRY MATTER, AND NUTRIENTS
AND CONCENTRATION OF DIGESTIBLE METABOLIZABLE, AND NET
ENERGY IN FERMENTED SOYBEAN MEAL, CONVENTIONAL SOYBEAN MEAL,
AND FISH MEAL FED TO WEANLING PIGS ................................................................. 49
ABSTRACT.............................................................................................................................. 49
INTRODUCTION..................................................................................................................... 50
MATERIALS AND METHODS.............................................................................................. 51
RESULTS.................................................................................................................................. 56
DISCUSSION ........................................................................................................................... 59
LITERATURE CITED ............................................................................................................. 63
CHAPTER 5: EFFECTS OF REPLACING FISH MEAL, CHICKEN MEAL, OR
POULTRY BY-PRODUCT MEAL WITH FERMENTED SOYBEAN MEAL IN PHASE
1, PHASE 2, AND PHASE 3 DIETS FED TO WEANLING PIGS.................................... 83
ABSTRACT.............................................................................................................................. 83
INTRODUCTION..................................................................................................................... 84
MATERIALS AND METHODS.............................................................................................. 85
RESULTS.................................................................................................................................. 90
DISCUSSION ........................................................................................................................... 92
LITERATURE CITED ............................................................................................................. 95
CHAPTER 6: CONCLUSIONS........................................................................................... 123

1
CHAPTER 1
INTRODUCTION
Conventional soybean meal (SBM-CV) is the most important vegetable protein source
fed to pigs because it contains an excellent balance of indispensable AA. However, SBM-CV
contains anti-nutritional factors such as antigens, lectins, trypsin inhibitors, and oligosaccharides
that decrease nutrient availability and affect growth performance of young pigs (Li et al., 1991;
Hong et al., 2004). Therefore, use of SBM-CV as the sole source of AA in weanling pigs diets is
not recommended (Dunsford, 1989). On the other hand, animal proteins such as fish meal,
chicken meal (CM), and poultry by-product meal (PBM) are often used in these diets because
these ingredients have a high digestibility of nutrients and are free of anti-nutritional factors
(Kim and Easter, 2001; Pierce et al., 2005). It is believed that fermented soybean meal(FSBM)
may replace fish meal in diets fed to weanling pigs without reducing growth performance (Jones
et al., 2010; Kim et al., 2010) because many of the anti-nutritional factors and in SBM-CV may
be eliminated if SBM-CV is fermented (Hong et al., 2004; Cervantes-Pahm and Stein, 2010).
Recently, production of FSBM was initiated in the United States, but there are no data on
the digestibility of P, energy and AA in this source of FSBM. Likewise, it is not know if FSBM
can replace CM and PBM in diets fed to weanling pigs. There are also no data on inclusion of
more than 10% FSBM in diets fed to weanling pigs, and there are no data on effects of replacing
fish meal, CM, or PBM by FSBM during the initial 7 d post-weaning. Therefore, the objectives
of this thesis are:
1) To determine apparent total tract digestibility and standardized total tract
digestibility of P in FSBM without and with microbial phytase and to test the
hypothesis that the ATTD and STTD of P in FSBM are greater than in SBM-CV.

2
2) To determine the concentration of DE, ME, and NE and the ileal digestibility of AA
in FSBM.
3) To test the hypothesis that FSBM can replace all animal proteins in diets fed to
weanling pigs during the initial 28 d post-weaning.

3
LITERATURE CITED
Cervantes-Pahm, S. K., and H. H. Stein. 2010. Ileal digestibility of amino acids in conventional,
fermented, and enzyme-treated soybean meal and in soy protein isolate, fish meal, and
casein fed to weanling pigs. J. Anim. Sci. 88:2674-2683.
Dunsford, B. R., D. A. Knabe, and W. E. Haensly. 1989. Effect of dietary soybean meal on the
microscopic anatomy of the small intestine in the early-weaned pig. J. Anim. Sci.
67:1855-1863.
Hong, K. J., C. H. Lee, and S. W. Kim. 2004. Aspergillus oryzae GB-107 fermentation improves
nutritional quality of food soybeans and feed soybeanmeals. J. Med. Food. 7:430-436.
Jones, C. K., J. M. DeRouchey, J. L. Nelssen, M. D. Tokach, S. S. Dritz, and R. D. Goodband.
2010. Effects of fermented soybean meal and specialty animal protein sources on nursery
pig performance. J. Anim. Sci. 88:1725-1732.
Kim, S. W., and R. A. Easter. 2001. Nutritional value of fish meals in the diet for young pigs. J.
Anim. Sci. 79:1829-1839.
Kim, S. W., E. Van Heugten, F. Ji, C. H. Lee, and R. D. Mateo. 2010. Fermented soybean meal
as a vegetable protein source for nursery pigs: I. Effects on growth performance of
nursery pigs. J. Anim. Sci. 88:214-224.
Li, D. F., J. L. Nelssen, P. G. Reddy, F. Blecha, R. Klemm, and R. D. Goodband. 1991.
Interrelationship between hypersensitivity to soybean proteins and growth performance in
early-weaned pigs. J. Anim. Sci. 69:4062-4069.
Pierce, J. L., G. L. Cromwell, M. D. Lindemann, L. E. Russell, and E. M. Weaver. 2005. Effects
of spray-dried animal plasma and immunoglobulins on performance of early weaned
pigs. J. Anim. Sci. 83:2876-2885.

4
CHAPTER 2
WEANING OF PIGS: LITERATURE REVIEW
INTRODUCTION
The weaning process is a complex stage in the pigs’ life where young pigs are subjected
to many changes in a short period of time. In nature, pigs are weaned at an age of approximately
13 weeks post-partum (Lalles et al., 2006), when the transition from the liquid to a solid diet is
completed. However, the modern pig industry requires more efficiency and weaning is usually
done when pigs are 3 - 4 weeks old. The small intestine of the pig has not yet adapted to a solid
diet at this time, which sometimes results in poor digestion and low absorption of nutrients
(Pluske et al., 1997).
The first feed that the newborn pig receives is called colostrum and is produced by the
sow during the first 24 h after farrowing (Devillers et al., 2004). Colostrum provides a
concentrated source of energy and also maternal antibodies to provide immunity to the newborn
pig. During the first hours of life, one of the biggest issues is the change of temperature and the
lack of energy for the pig. Therefore, the newborn pig uses glycogen stored in the liver as the
main source of energy after birth to stay warm and to provide energy to get access to the udder
(Le Dividich et al., 1994). Colostrum has greater concentration of DM and CP and less
concentration of fat and lactose than milk (Le Dividich et al., 1997; Lin et al., 2009). However,
the biggest difference between colostrum and milk is the greater concentration of
immunoglobulin G in colostrum than in milk. After 24 h, colostrum changes to milk and the
main immunoglobulins are immunoglobulin A and immunoglobulin M (Klobasa et al., 1987).
Immunoglobulins provide passive immune protection against pathogens such as Colibacillosis

5
and Escherichia coli (E. coli) until the pig’s immune system is mature (Johnson et al., 1992;
Rooke and Bland, 2002).
Weaning at 3-4 weeks is often associated with digestive disorders that may negatively
affect the morphology of the small intestine and reduced villous height and increased crypt depth
are often observed during the immediate post-weaning period. This may result in post-weaning
diarrhea (Dunsford, 1989). To maintain the structure of the small intestine, diets fed to weanling
pigs need to stimulate voluntary feed intake (Pluske et al., 1997). Therefore, diets fed to newly
weaned pigs are composed of ingredients with high levels of digestible protein such as whey
powder, spray dried plasma, fish meal, and blood meal (Kim and Easter, 2001). Usually, these
animal protein ingredients are more expensive than vegetable protein sources such as
conventional soybean meal (SBM-CV), but they are free of anti-nutritional factors (ANF) and,
therefore, better tolerated by young pigs than vegetable protein sources.
During the weaning process, littermates are relocated and mixed with pigs from other
litters, which produces aggressive behavior to establish the hierarchy inside the pen (McGlone
and Curtis, 1985). This behavior results in wasting of energy and a reduction of feed intake and
growth performance is negatively affected. Ogunbameru et al. (1992) reported that pigs weaned
during the evening consumed more feed and grew faster than pigs weaned in the morning. The
reason for this observation may be that weaning in the evening positively impacts diurnal eating
behavior (Ogunbameru et al., 1992).
The combination of all the changes that take place when pigs are weaned results in a
condition called the weaning lag, which is a result of the nutritional, environmental, and
behavioral stress that pigs are exposed to at weaning. One of the major challenges in modern

6
swine production is to reduce the impact of the weaning lag and to make sure that neonatal pigs
recover from the weaning lag as fast as possible after weaning.
PHYSIOLOGICAL AND ANATOMICAL CHANGES AT WEANING
The immune system of the unweaned pig is developed after consumption of
immunoglobulins that are present in the sow’s colostrum and milk (called passive immunity), but
these immunoglobulins protect only against the antigens that the sow has developed immunity
against (Van Berrs-Schreurs and Bruininx, 2002). Immunoglobulin A provides a barrier against
pathogens in the gastric and intestinal mucosa and immunoglobulin G provides immunity against
antigens (Bailey et al., 2001). However, after weaning, sow’s milk is no longer consumed, which
results in a decrease in passive immunity and weanling pigs do not develop their own immune
system (called active immunity) until 1 to 3 weeks after weaning (Gaskins and Kelley, 1995).
Weaning of pigs involves removal of maternal antibodies, mixing stress, exposure to new
environmental pathogens, and changes in gut morphology (Bailey et al., 2001).At weaning, pigs
are also exposed to antigens that are present in dietary ingredients such as conglycinin and β-
conglycinin in SBM-CV (Li et al., 1991) that were not present in the milk. Pigs may also get
exposed to new pathogens such as E. Coli. The antigens may produce transient hypersensitivity
in the small intestine, which affects the digestion and absorption of nutrients (Li et al., 1991) and
E. coli may cause diarrhea because of the low levels of active and passive immunity that the pig
has at this time (Kelly and King, 2001).
The transition from a liquid diet to solid feed at weaning disrupts the capacities for
digestion and absorption in the gastrointestinal tract (GIT). Therefore, the objective of the GIT is
to adapt as soon as possible to the new diet. This adaptation is a complex process and is

7
influenced by numerous interacting factors such as immunological status, presence of pathogens,
weight at weaning, and digestibility of ingredients in the new diet (Fan, 2003).
The stomach, small intestine, pancreas, and liver cooperate to digest and absorb the
nutrients in the diet. The small intestine and the stomach increase their weight during the initial
21 d post-weaning relative to total pig BW (Cera et al., 1988a; Cranwell, 1995). The same is true
for the stomach, which may be a result of an increase of exocrine secretions such as proteolytic
enzymes, gastric lipase, and hydrochloric acid (Cranwell, 1995).
The amounts of enzymes that are secreted into the GIT are related to the type of feed that
is ingested by the pig. For instance, pancreatic secretion levels increase during the first 5 d after
weaning because feed intake increases (Rantzer et al., 1997). However, during the same period
of time, weanling pigs do not gain weight (Rantzer et al., 1997).
The exocrine pancreatic enzymes are secreted in the form of juice. This juice contains the
major exocrine pancreatic lipase, α-amylase, and proteases such astrypsin and chymotrypsin
(Fan, 2003). The enzyme activity of trypsin is not affected by the weaning process, but that is not
the case for chymotrypsin and amylase (Jensen et al., 1997). However, the activity of these
enzymes and the total gastric secretion capacity increase after one week post-weaning (Cranwell,
1995; Jensen et al., 1997).
The GIT of the unborn pig is free of any bacteria or pathogens. However, a few hours
after birth, the GIT is colonized by microorganisms (Fan, 2003). Both aerobe and anaerobe
microorganisms such as strains of E. coli, clostridia, lactobacilli, eubacteria, and bifidobacteria
are present in the GIT (Maxwell and Stewart, 1995).
The fundic region is one of the 4 regions in the stomach. In this region, hydrochloric acid
(HCL) is secreted from the parietal cells (Cranwell, 1995; Yen, 2001). Before weaning, bacterial

8
fermentation helps to mantein the pH low in the GIT, which allows the formation of milk clots in
the intestine of the neonatal pig (Yen, 2001). After weaning, gastric pH is between 3 and 4,
which is too high for complete digestion of proteins (Mavromichalis, 2006). Insuficient secretion
of HCL results in increased pH in the stomach, which may result in colonization by pathogens
such as E.coli (Yen, 2001).
The transition from a liquid to a solid diet reduces feed intake, which often is associated
with changes of the intestinal morphology (Pluske et al., 1996; Maxwell and Carter, 2001).
Villous height may, therefore, be reduced already 24 h after weaning, but reduction in villous
height continuous 4-5 d after weaning (Hampson, 1986). One of the reasons for the reduction in
villous height is that the production of crypt cells decreases during the first few days post-
weaning. Enterocytes on the villi may also be destroyed (Cera et al., 1988; Dunsford, 1989;
Bailey et al., 2001). The enterocytes that are present in the villus have an apical membrane that is
called the brush-border membrane (Fan, 2003). This membrane has a high lactase activity, but
after weaning, the lactase activity decreases and the activity of sucrase, maltase, and maltase-
glucoamylase increases (Cranwell, 1995).
The main function of the enterocytes is to absorb nutrients (Fan, 2003). Enterocytes are
synthesized in the intestinal crypts and migrate to the villus (Yen, 2001). When abrupt changes
happen in the morphology in the small intestine, the capacity for synthesis of new enterocytes is
reduced. Therefore, the capacity for digestion and absorption in the GIT decreases, which
increases indigestion of nutrients in the small intestine. As a consequence, more substrate will
reach the large intestine, which may result in microbial proliferation and subsequent diarrhea
(Mavromichalis, 2006). One of the main objectives of feeding weanling pigs in, therefore, to

9
maintain the structure of the villi in the small intestine and avoid the reduction is villus height
and crypt depth.
CHARACTERISTICS OF DIETS FED TO WEANLING PIGS
Different strategies have been used in the swine industry to ameliorate the negative
effects of the weaning lag. Nutritional strategies such as reduction of the level of protein in the
diets and also the use of animal protein ingredients (Chiba, 2001) are the most common
strategies used. Excess protein in the small intestine contributes to more substrate in the large
intestine, which increases the proliferation of pathogens such as E.coli, which is one of the
causes of diarrhea (Heo, et al., 2009).
One of the objectives of feeding weanling pigs is to stimulate voluntary feed intake
because weaned pigs often do not meet their energy and nutrient requirements due to insufficient
feed consumption (Maxwell and Carter, 2001). Therefore, inclusion of milk products such as
dried whey in weanling pig diets may improve the palatability of the diet and, therefore, increase
daily feed intake (Lepine et al., 1991). Other animal protein sources such as spray dried protein
plasma (SDPP), poultry by-product meal (PBM), and fish meal are also commonly used in
weanling pigs diets due to the high digestibility of nutrients in these ingredients (Grinstead et al.,
2000; Kim and Easter, 2001). However, the high cost of these ingredients limit their use, and the
increase in the costs of these ingredients during recent years has made it necessary to identify
alternatives to animal protein sources in diets fed to weanling pigs.
Spray dried protein plasmais commonly used in phase 1 and phase 2 diets (0 to 7 and 7 to
14 d, post-weaning, respectively) fed to weanling pigs because this ingredient stimulates feed
intake (Ermer et al., 1994). Van Dijk et al. (2001) reported that 6% SDPP in diets fed to

10
weanling pigs increased ADG and ADFI and the positive effect was more noticeable during wk 1
and 2 after weaning than in subsequent weeks. However, SDPP is relatively low in methionine.
Therefore, use of more than 6% SDPP usually is recommended only it DL-methionine is a added
to the diet (Kats et al., 1994). One of the reasons dietary SDPP improve growth performance of
weaning pigs is that the immunoglobulins in SDPP protect the pig against infections (Coffey and
Cromwell, 1995). Nutrient digestibility in SDPP is also excellent (Van Dijk et al., 2001), and
SDPP may help preserve the barrier function in the small intestine and decrease intestinal
inflammation when pigs are switched from a liquid to a solid diet at weaning (Campbell et al.,
2010).
Dried whey is another animal product that is used in weanling pigs starter diets. It
contains 65-70% lactose and 12-15% protein(Chiba, 2001) and it usually is used as a source of
lactose in weanling pigs diets (Cera et al., 1988). In a corn-soybean meal diet, the inclusion of
25% dried whey increased weight gain during the first 21 d post-weaning (Lepine et al., 1991),
and lactose appears to be an important compound of the diet during the first 2 weeks after
weanling. This is in agreement with data reported by Mahan (1993) who observed the same
weight gain of pigs fed a corn-soybean meal diet supplement with either lactose or dried whey.
Poultry by-product meal is produced from rendered parts of chickens (Kellems and
Church, 2009) and it has a concentration of AA that is similar to fish meal (Keegan et al., 2004).
However, the quality of PBM may be variable and depends on the type of processing and the
quality of the rendered parts to produce it (Dong et al., 1993). Keegan et al. (2004) and Zier et al.
(2004) reported that pigs fed diets containing PBM from d 0 to 28 post-weaning had similar
growth performance as pigs fed fish meal, blood meal, and SDPP. However, the concentration of
ash in PBM may impact growth performance of pigs (Keegan et al., 2004).

11
Fish meal is an animal protein that is used in diets fed to weanling pigs because of its
high digestibility and favorable AA composition (Kim and Easter, 2001). However, the quality
of fish meal is variable and may depend on the processing methods and the type of fish used to
produce the meal (Stoner et al., 1990; Kim and Easter, 2001). Fish meal usually is included by
less than 10% in diets fed to weanling pigs (Chiba, 2001) and it has been reported that the G:F
ratio increased linearly when fish meal is included in the diet (Bergstrom et al., 1997).
ALTERNATIVE PROTEIN INGREDIENTS
Conventional soybean meal is the most important vegetable protein source fed to pigs
because it contains an excellent balance of indispensable AA (Baker, 2000).Also, the low fiber
concentration in soybean meal results in a greater concentration of ME in SBM-CV than in other
oilseed meals (Stein et al., 2008). Attempts to replace some of the animal protein ingredients,
especially fish meal, in diets fed to weanling pigs have been made, but these attempts have
largely been unsuccessful because of the presence of ANF such as antigens, trypsin inhibitors,
and oligosaccharides in SBM-CV (Li et al., 1991; Jezierny et al., 2010). These ANF reduce the
absorption and digestion of nutrients and thus, reduce the growth performance (Li et al., 1991).
Therefore, inclusion of SBM-CV in wealing pig diets is limited (Dunsford et al., 1989; Hong et
al., 2004).
Trypsin inhibitors or protease inhibitors are chemicals that are present in SBM-CV at
concentration of approximately 2.70 mg/g (Hong et al., 2004). They inhibit the action of trypsin
and chymotrypsin, and therefore, reduce the digestion of proteins (Deak et al., 2010). Also,
SBM-CV contains antigenic proteins such as glycinin and β-conglycinin (Li et al., 1990). These
proteins produce hypersensitivity in the small intestine, which has negative impacts on the

12
morphology in the small intestine (decreased villus height and increased crypt depth; Cromwell,
2000) and cause malabsorption and digestive disorders. Antigenic proteins, therefore, have a
negative impact on growth performance in weanling pigs (Lalles, 2006). Oligosaccharides such
as raffinose, stachyose, and verbascose are also present in SBM-CV (Karr-Lilienthal et al.,
2005). Usually, the oligossacharide concentration in SBM-CV is around 8% of DM (Grieshop et
al., 2003). The oligosaccharides cannot be digested by pigs (Li et al., 1991) because pigs cannot
secrete α-galactosidase, which is the enzyme that breaks down the glycocidic bonds in
oligossacharides (Karr-Lilienthal et al., 2005). Therefore, oligosaccharides in diets fed to
weanling pigs results in diarrhea (Liying et al., 2003; Karr-Lilienthal et al., 2005). However, new
varieties of soybeans with low concentrations of oligosaccharides have been developed, but it is
unknown if these varieties can be used in diets fed to weanling pigs (Baker and Stein, 2009).
New technologies such as enzymatic treatment and fermentation have been developed to
remove the ANF in SBM-CV (Cervantes-Pahm and Stein, 2010). Enzymatic treatment of SBM-
CV is used to break down the glycosidic bonds in the carbohydrate fraction in soybean meal
(Middelbos and Fahey, 2008) and enzyme treated soybean meal contains less oligossacharides
than SBM-CV (Cervantes-Pahm and Stein, 2010; Goebel and Stein, 2011). Hamlet protein
(Horsens, Denmark) is a company that produces soybean meal by enzymatic treatment of SBM-
CV. This product has been developed to contain less antigens and oligosaccharides than SBM-
CV (Zhu et al., 1998; Goebel and Stein, 2011), and it is, therefore, expected that enzyme treated
soybean meal is better tolerated by weanling pigs than SBM-CV.
Fermented soybean meal (FSBM)is a fermented product that is produced by fermentation
of SBM-CV in the presence of fungal and bacterial strains (Aspergillus oryzae and Lactobacillus
subtilis, respectively). Fermentation is used to eliminate or reduce the concentration of ANF in

13
SBM-CV (Kaankuka et al., 1996; Hong et al., 2004; Cervantes-Pahm and Stein, 2010).
Therefore, FSBM may be included in greater concentrations than SBM-CV in diets fed to
weanling pigs because it is expected to be better tolerated by weanling pigs (Liu et al., 2007;
Yang et al., 2007). Indeed, FSBM may replace animal protein sources in weanling pigs diets
without negatively affecting pig growth performance (Jones et al., 2010; Kim et al., 2010). Song
et al. (2010) also reported that a diet fed to weanling pigs containing FSBM reduced the
incidence of diarrhea compared with a diet containing SBM-CV, which is likely a consequence
of pigs fed the diet containing FSBM ingesting less antigens than pigs fed SBM-CV. Weanling
pigs fed FSBM also had improved villous height and crypt depth after weaning compared with
pigs fed SBM-CV (Kim et al., 2007). Use of FSBM rather than SBM-CV increased trypsin,
lipase, and protease activity in the small intestine of broilers and also decreased crypt depth and
increased villus height in the jejunum (Feng et al., 2007). It is also believed that during
fermentation of SBM-CV, the size of the peptides decrease, which may improve AA digestibility
by newly weaned pigs (Hong et al., 2004; Min et al., 2004; Gilbert et al., 2008). However, this is
not always the case (Cervantes-Pahm and Stein, 2010). Likewise, the fermentation process may
result in hydrolysis of phytate and release of phytate-bound phosphorous. The bioavailability of
P in FSBM is therefore, expected to be greater than in conventional SBM (Ilyas et al., 1995), but
data for the apparent and standardized total tract digestibility of P in FSBM haven not been
reported.
CONCLUSIONS
Diets fed to weanling pigs need to be formulated in such a way that they protect the
intestinal tract from pathogenic colonization and at the same time support the integrity of the

14
intestinal tissue. However, this is relatively complicated because a number of ANF are present in
SBM-CV. Therefore, fish meal and other animal protein ingredients are commonly used in diets
fed to weanling pigs despite that the fact they are more expensive than vegetable protein sources.
However, recent technological developments have resulted in the opportunity to produce FSBM,
and recently, production of FSBM was initiated in the USA. There are, however, no data on the
digestibility of energy, P, and AA in this source of FSBM, and effects of replacing fish meal and
other animal protein sources with this source of FSBM has not been fully investigated.

15
LITERATURE CITED
Baker, D. H. 2000.Nutritional constraints to the use of soy products by animals.Pages 1-12 in
Soy in Animal Nutrition. J. K. Drackley, ed. Fed. Anim. Sci. Soc. Champaign, IL.
Baker, K. M., and H. H. Stein. 2009. Amino acid digestibility and concentration of digestible and
metabolizable energy in soybean meal produced from conventional, high-protein, or low-
oligosaccharide varieties of soybeans and fed to growing pigs. J. Anim. Sci. 87:2282-
2290.
Bailey, M., M. A Vega-Lopez, H. J. Rothkotter, K. Haverson, P. W. Bland, B. G. Miller, and C.
R. Stokes. 2001. Enteric immunity and gut health. Pages 207-222 in The Weaner Pig
Nutrition and Management. M. A. Varley and J. Wiseman, ed. CAB International,
Wallingford, Oxon, UK.
Bergstrom, J. R., J. L. Nelssen, M. D. Tokach, R. D. Goodband, S. S. Dritz, K. Q. Owen, and W.
B. Nessmith, Jr. 1997. Evaluation of spray-dried animal plasma and select menhaden fish
meal in transition diets of pigs weaned at 12 to 14 days of age and reared in different
production systems. J. Anim. Sci. 75:3004-3009.
Campbell, J. M., J. Polo, L. E. Russell, and J. D. Crenshaw. 2010. Review of spray-dried
plasma's impact on intestinal barrier function. Livest. Sci.133:239-241.
Cera, K. R., I. C. Mahan, and G. A. Reinbart. 1988. Effects of dietary dried whey and corn oil on
wesnling pigperformance, fat digestibility and nitrogen utilization. J. Anim. Sci. 66:1438-
1445.
Cera, K. R., D. C. Mahan, R. F. Cross, G. A. Reinhart, and R. E. Whitmoyer. 1988a. Effect of
age, weaning and postweaning diet on small intestinal growth and jejunal morphology in
young swine. J. Anim. Sci. 66:574-584.

16
Cervantes-Pahm, S. K., and H. H. Stein. 2010. Ileal digestibility of amino acids in conventional,
fermented, and enzyme-treated soybean meal and in soy protein isolate, fish meal, and
casein fed to weanling pigs. J. Anim. Sci. 88:2674-2683.
Chiba, L. I. 2001. Protein supplements. Pages 803-838 in Swine Nutrition. 2nd ed. A. J. Lewis
and L. L. Southern, ed. CRC Press, Washington, DC.
Coffey, R. D., and G. L. Cromwell. 1995. The impact of environment and antimicrobial agents
on the growth response of early-weaned pigs to spray-dried porcine plasma. J. Anim. Sci.
73:2532-2539.
Cromwell, G. L. 2000.Utilization of soy products in swine diets. Pages 258-282 in Soy in
Animal Nutrition. J. K. Drackley, ed. Fed. Anim. Sci. Soc., Champaign, IL.
Cranwell, P. D. 1995.Development of the neonatal gut and enzymes systems. Pages 99-154 in
The Neonatal Pig: Development and Survival. M. A. Varley, ed. CAB International,
Wallingford, Oxon, UK.
Deak, N. A., L. A. Johnson, E. W. Lusas, and K. C. Rhee. 2008. Soy protein products,
processing, and utilization. Pages 661 – 724 in Soybeans chemistry, production,
processing, and utilization. L. A. Johnson, P. J. White, and R. Galloway, ed. AOCS Press,
Urbana, IL.
Devillers, N., J. Van Milgen, A. Prunier, and J. Le Dividich. 2004. Estimation of colostrum
intake in the neonatal pig. Anim. Sci. 78:305-313.
Dong, F. M., R. W. Hardy, N. F. Haard, F. T. Barrows, B. A. Rasco, W. T. Fairgrieve, and I. P.
Forster. 1993. Chemical composition and protein digestibility of poultry by-product
meals for salmonid diets. Aquaculture. 116:149-158.

17
Dunsford, B. R., D. A. Knabe, and W. E. Haensly. 1989. Effect of dietary soybean meal on the
microscopic anatomy of the small intestine in the early-weaned pig. J. Anim. Sci.
67:1855-1863.
Ermer, P. M., P. S. Miller, and A. J. Lewis. 1994. Diet preference and meal patterns of weanling
pigs offered diets containing either spray-dried porcine plasma or dried skim milk. J.
Anim. Sci. 72:1548-1554.
Fan, M. Z. 2003. Growth and ontogeny of the gastrointestinal tract. Pages 31-60 in The Neonatal
Pig: Gastrointestinal Physiology and Nutrition. R. J. Xu and P. D. Cromwell, ed.
Nottingham University Press, Nottingham, UK.
Feng, J., X. Liu, Z. R. Xu, Y. P. Lu, and Y. Y. Liu. 2007. The effect of Aspergillus oryzae
fermented soybean meal on growth performance, digestibility of dietary components and
activities of intestinal enzymes in weaned piglets. Anim. Feed Sci. Technol. 134:295-303.
Gaskins, H. R., and K. W. Kelley. 1995. Immunology and neonatal mortality. Pages 39-55 in
The Neonatal Pig: Development and Survival. M. A. Varley, ed. CAB International,
Wallingford, Oxon, UK.
Gilbert, E. R., E. A. Wong, and K. E. Webb, Jr. 2008. BOARD-INVITED REVIEW: Peptide
absorption and utilization: Implications for animal nutrition and health. J. Anim. Sci.
86:2135-2155.
Goebel, K. P., and H. H. Stein, H. H. 2011. Phosphorus digestibility and energy concentration of
enzyme-treated and conventional soybean meal fed to weanling pigs. J. Anim. Sci.
89:764-772.

18
Grieshop, C. M., C. T. Kadzere, G. M. Clapper, R. L. Frazier, and G. C. Fahey, Jr. 2003.
Chemical and nutritional characteristics of United States soybeans and soybean meals. J.
Agric. Food Chem. 51:7684-7691.
Grinstead, G. S., R. D. Goodband, S. S. Dritz, M. D. Tokach, J. L. Nelssen, J. C. Woodworth,
and M. Molitor. 2000. Effects of a whey protein product and spray-dried animal plasma
on growth performance of weanling pigs J. Anim. Sci. 78:647-657.
Hampson, D. J. 1986.Alterations in piglet small intestinal structure at weaning. Res. Vet. Sci.
40:32-40.
Heo, J. M., J. C. Kim, C. F. Hansen, B. P. Mullan, D. J. Hampson, and J. R. Pluske.
2009. Feeding a diet with decreased protein content reduces indices of protein
fermentation and the incidence of postweaning diarrhea in weaned pigs challenged with
an enterotoxigenic strain of Escherichia coli. J. Anim. Sci. 87:2833-2843.
Hong, K. J., C. H. Lee, and S. W. Kim. 2004. Aspergillus oryzae GB-107 fermentation improves
nutritional quality of food soybeans and feed soybeanmeals. J. Med. Food 7:430-436.
Ilyas, A., M. Hirabayashi, T. Matsui, H. Yano, F. Yano, T. Kikushima, M. Takebe, and K.
Hakayaka. 1995. A note on the removal of phytate in soybean meal using Aspergillus
usami. Asian-australas. J. Anim. Sci. 8:135-138.
Jezierny, D. R., Mosenthin, and E. Bauer. 2010. The use of grain legumes as a protein source in
pig nutrition: A review. Anim. Feed Sci. Technol. 157:111-128.
Jensen, M. S., S. K. Jensen, and K. Jakobsen. 1997. Development of digestive enzymes in pigs
with emphasis on lipolytic activity in the stomach and pancreas. J. Anim. Sci. 75:437-
445.

19
Johnson, M. W., G. R. Fitzgerald, M. W. Weler, and C. J. Welter. 1992. The six most common
pathogens responsible for diarrhea in newborn pigs. Vet. Med. 87:382-386.
Jones, C. K., J. M. DeRouchey, J. L. Nelssen, M. D. Tokach, S. S. Dritz, and R. D. Goodband.
2010. Effects of fermented soybean meal and specialty animal protein sources on nursery
pig performance. J. Anim. Sci. 88:1725-1732.
Kaankuka, F. G., T. F. Balogun, and T. S. B. Tegbe. 1996. Effects of duration of cooking of full-
fat soya beans on proximate analysis, levels of anti-nutritional factors, and digestibility
by weanling pigs. Anim. Feed Sci. Technol. 62:229-237.
Karr-Lilienthal, L. K., C.T. Kadzere, C.M. Grieshop, G.C. Fahey, Jr. 2005. Chemical and
nutritional properties of soybean carbohydrates as related to nonruminants: A review.
Livest. Sci. 97:1-12.
Kats, L. J., J. L. Nelssen, M. D. Tokach, R. D. Goodband, J. A. Hansen and J. L. Laurin. 1994.
The effect of spray-dried porcine plasma on growth performance in the early-weaned. J.
Anim. Sci. 72:2075-2081.
Keegan, T. P., J. M. DeRouchey, J. L. Nelssen, M. D. Tokach, R. D. Goodband,and S. S. Dritz.
2004. The effects of poultry meal source and ash level on nursery pig performance. J.
Anim. Sci. 82:2750-2756.
Kellems, R. O., and D. C. Church. 2009. Supplemental protein sources. Pages 84-113 in
Livestock Feeds and Feeding. R. O. Kellems and D. C. Church, edPrentice Hall, Upper
Saddle River, NJ.
Kelly, D., and T. P. King. 2001. Digestive physiology and development in pigs. Pages 179-206
in The Weaner Pig Nutrition and Management. M. A. Varley and J. Wiseman, ed. CAB
International, Wallingford, Oxon, UK.

20
Kim, S. W., and R. A. Easter. 2001. Nutritional value of fish meals in the diet for young pigs. J.
Anim. Sci. 79:1829-1839.
Kim, S. W., E. van Heugten, F. Ji, C. H. Lee, and R. D. Mateo. 2010. Fermented soybean meal
as a vegetable protein source for nursery pigs: I. Effects on growth performance of
nursery pigs. J. Anim. Sci. 88: 214-224.
Kim, Y. G., J. D. Lohakare, J. H. Yun, S. Heo, and B. J. Chae. 2007. Effect of feeding levels of
microbial fermented soy Protein on the growth performance, nutrient digestibility and
intestinal morphology in weaned piglets. Asian-australas. J. Anim. Sci. 20:399-404.
Klobasa, F., and J. E. Butler. 1987. Absolute and relative concentrations of immunoglobulins G,
M and A, and albumin in the lacteal secretions of sows of different lactation numbers.
Am. J. Vet. Res. 48:176-182.
Lalles, J., P. Bosi, H. Smidt, and C. R. Stokes. 2006. Weaning: A challenge to gut physiologists.
Livest. Sci.108:82-93.
Le Dividich, J., P. Herpin, and R. M. Rosario-Ludovino. 1994. Utilization of colostral
energy by the newborn pig. J. Anim. Sci. 72:2082-2089.
Le Dividich, J., P. Herpin, E. Paul, and F. Strullu. 1997. Effect of fat content of colostrum on
voluntary colostrum intake and fat utilization in newborn pigs. J. Anim. Sci. 75:707-713.
Lepine, A. J., D. C. Mahan, and Y. K. Chung. 1991. Growth performance of weanling pigs fed
corn-soybean meal diets with or without dried whey at various L-lysine HCl levels. J.
Anim. Sci. 69:2026-2032.
Li, D. F., J. L. Nelssen, P. G. Reddy, F. Blecha, J. D. Hancock, G. L. Alle, R. D. Goodband, and
R. D. Klemm. 1990. Transient hypersensitivity to soybean meal in the early-weaned pig.
J. Anim Sci. 68:1790-1799.

21
Li, D. F., J. L. Nelssen, P. G. Reddy, F. Blecha, R. Klemm, and R. D. Goodband. 1991.
Interrelationship between hypersensitivity to soybean proteins and growth performance in
early-weaned pigs. J. Anim. Sci. 69:4062-4069.
Lin, C., D. C. Mahan, G. Wu, and S. W. Kim. 2009. Protein digestibility of porcine colostrum by
neonatal pigs. Livest. Sci. 121:182-186.
Liu, X., J. Feng, Z. Xu, Y. Lu, and Y. Liu. 2007. The effects of fermented soybean meal on
growth performance and immune characteristics in weaned piglets. Turkish J. Vet. Anim.
Sci. 31:341-345.
Liying, Z., D. Li, S. Qiao, E. W. Johnson, B. Li, P. A. Thacker, and I. K. Han. 2003. Effects of
stachyose on performance, diarrhea incidence and intestinal bacteria in weanling pigs.
Arch. Anim. Nutr. 57:1-10.
Mahan, D. C. 1993.Evaluating two sources of dried whey and the effects of replacing the corn
and dried whey component with corn gluten meal and lactose in the diets of weanling
swine. J. Anim. Sci. 71:2860-286.
Mavromichalis, I. 2006. Growth and development.Pages 1-32 in Applied Nutrition for Young
Pigs. I. Mavromichalis, ed. CAB International, Wallingford, Oxon, UK.
Maxwell, C. V., and S. D. Carter. 2001. Feeding the weaned pig. Pages 691-715 in Swine
Nutrition. 2nd ed. A. J. Lewis and L. L. Southern, ed. CRC Press, Washington, DC.
Maxwell, F. J., and C. S. Stewart. 1995. Microbiology of the gut and the role of probiotics. Pages
155-186 in The Neonatal Pig: Development and Survival. M. A. Varley, ed. CAB
International, Wallingford, Oxon, UK.
McGlone, J. J., and S. E. Curtis. 1985. Behavior and performance of weanling pigs in pens
equipped with hide areas. J. Anim. Sci. 60:20-24.

22
Middelbos, I. S., and G. C Fahey, Jr. 2008. Soybean carbohydrates. Pages 269-296 in Soybeans
Chemistry, Production, Processing, and Utilization. L. A. Johnson, P. J. White, and R.
Galloway, ed. AOCS Press, Urbana, IL.
Min, B. J., J. W. Hong, O. S. Kwon, W. B. Lee, Y. C. Kim, I. H. Kim, W. T. Chol, and J. H.
Kim. 2004. The effect of feeding processed soy protein on the growth performance and
apparent ileal digestibility in weanling pigs. Asian-australas. J. Anim. Sci. 17:1271-1276.
Ogunbameru, B. O., E. T. Kornegay, and C. M. Wood. 1992. Effect of evening or morning
weaning and immediate or delayed feeding on postweaning performance of pigs. J.
Anim. Sci. 70:337-342.
Pluske, J. R., D. J. Hampson, and I. H. Williams. 1997. Factors influencing the structure and
function of the small intestine in the weaned pig: a review. Livest. Sci. 51:215-236.
Pluske, J. R., I. H. Williams, and F. X. Aherne. 1996. Villous height and crypt depth in piglets in
response to increases in the intake of cows' milk after weaning. Anim. Sci. 62:145-158.
Rantzer, D., P. Kiela, M. J. Thaela, J. Svendsen, B. Ahren, S. Karlsson, and S. G.Pierzynowski.
1997. Pancreatic exocrine secretion during the first days after weaning in pigs. J. Anim.
Sci. 75:1324-1331.
Rooke, J. A., and I. M. Bland. 2002. The acquisition of passive immunity in the new-bornpiglet.
Livest. Prod. Sci. 78:13-23.
Song, Y. S., V. G. Perez, J. E. Pettigrew, C. Martinez-Villaluenga, and E. Gonzalez de Mejia.
2010. Fermentation of soybean meal and its inclusion in diets for newly weaned pigs
reduced diarrhea and measures of immunoreactivity in the plasma, Anim. Feed Sci.
Technol. 159: 41-49.

23
Stein, H. H., L. L. Berger, J. K. Drackley, G. C Fahey, Jr, D. C. Hernot, and C. M. Parsons.
2008. Nutritional properties and feeding values of soybeans and their coproducts. Pages
613 – 660 in Soybeans Chemistry, Production, Processing, and Utilization. L. A.
Johnson, P. J. White, and R. Galloway, ed. AOCS Press, Urbana, IL.
Stoner, G. R., G. L. Allee, J. L. Nelssen, M. E. Johnston, and R. D. Goodband. 1990. Effect of
select menhaden fish meal in starter diets for pigs. J. Anim. Sci. 68:2729-2735.
Van Berrs-Schreurs H. M. G., and E. M. A. M. Bruininx. 2002. Nutritional management to
precent disorders in post-weaning pig health. Pages 135-158 in Nutrition and Health of
the Gastrointestinal Health. M. C. Blok, H. A. Vahl, L. de Large, A. E. Van de Braak, G.
Hemke, and M. Hessing, ed. Wageningen academic publishers, Wageningen,
Netherlands.
Van Dijk, A. J., H. Everts, M. J. A. Nabuurs, R. J. C. F. Margry, and A. C. Beynen. 2001.
Growth performance of weanling pigs fed spray-dried animal plasma: a review. Livest.
Prod. Sci. 68:263-274.
Yang, Y. X., Y. G. Kim, J. D. Lohakare, J. H. Yun, J. K. Lee, M. S. Kwon, J. L. Park, J. Y.Choi,
and B. J. Chae. 2007. Comparative efficacy of different soy protein sources on growth
performance, nutrient digestibility and intestinal morphology in weaned pigs. Asian-
australas. J. Anim. Sci. 20:775-783.
Yen, J. T. 2001.Anatomy of the digestive system and nutritional physiology. Pages 31-63 in
Swine Nutrition. 2nd ed. A. J. Lewis and L. L. Southern, ed. CRC Press, Washington,
DC.
Zhu, X., D. Li, S. Qiao, C. Xiao, Q. Qiao, and C. Ji. 1998. Evaluation of HP 300 soybean protein
in starter pig diets. Asian-australas. J. Anim. Sci. 11:201-207.

24
Zier, C. E., R. D. Jones, and M. J. Azain. 2004. Use of pet food-grade poultry by-
product meal as an alternate protein source in weanling pig diets. J. Anim. Sci.82:3049-
3057.

25
CHAPTER 3
DIGESTIBILITY OF PHOSPHOROUS IN FERMENTED AND CONVENTIONAL
SOYBEAN MEAL WITHOUT AND WITH MICROBIAL PHYTASE BY WEANLING
PIGS
ABSTRACT
An experiment was conducted to test the hypothesis that the apparent total tract digestibility
(ATTD) and the standardized total tract digestibility (STTD) of P in fermented soybean meal
(FSBM) are greater than in conventional soybean meal (SBM-CV) when fed to weanling pigs.
Four diets were formulated to contain FSBM or SBM-CV and either 0 or 800 units/kg of
microbial phytase (Optiphos 2000, Enzyvia, Sheridan, IN). The only sources of P in these diets
were FSBM and SBM-CV. A P-free diet that was used to estimate basal endogenous losses of P
was also formulated. Thirty barrows (initial BW: 14.0 ± 2.28 kg) were placed in metabolism
cages and allotted to a randomized complete block design with 5 diets and 6 pigs per diet. Feces
were collected for 5 d after a 5 d adaptation period. All samples of ingredients, diets, and feces
were analyzed for P and values for ATTD and STTD of P were calculated. Results indicated that
the basal endogenous P losses were 187 mg/kg DMI. The ATTD and STTD of P increased (P<
0.01) from 60.9 to 67.5% and from 65.5 to 71.9% in pigs fed FSMB as phytase was added to the
diet. Likewise, addition of phytase to SBM-CV increased (P< 0.01) the ATTD and STTD of P
from 41.6 to 66.2% and from 46.1 to 71.4%, respectively. The ATTD and STTD of P were
greater (P< 0.01) in FSBM than in SBM-CV if no phytase was used, but that was not the case if
phytase was added to the diet (soybean meal × phytase interaction: P< 0.01). In conclusion, the
ATTD and STTD of P in FSBM is greater than in SBM-CV, if no microbial phytase is used, but

26
if phytase is added to the diets, no differences in ATTD and STTD of P between FSBM and
SBM-CV are observed.
Key Words: fermented soybean meal, phosphorus, phosphorus digestibility, phytase, pig,
soybean meal
INTRODUCTION
Most P in soybean meal (SBM) is bound in the phytate complex (Eeckhout and De
Paepe, 1994), which may contribute to environmental problems (Knowlton et al., 2004) and
contribute to increased diet costs. However, the phytase enzyme may hydrolyze P that is bound
in phytate and addition of microbial phytase increases the apparent total tract digestibility
(ATTD) and the standardized total tract digestibility (STTD) of P in SBM (Almeida and Stein,
2010).
It is likely that fermentation of SBM results in hydrolysis of phytate and release of
phytate-bound P because the concentration of phytate bound P in fermented corn products such
as distillers dried grains with solubles and high protein distillers dried grainsare less than in corn
(Almeida and Stein, 2010). The bioavailability of P in fermented SBM (FSBM) is, therefore,
expected to be greater than in conventional SBM (SBM-CV; Ilyas et al., 1995), but previous
research failed to demonstrate an increase in the bioavailability of P in FSBM compared with
SBM-CV (Hong et al., 2004). The global production of FSBM is likely less than 100,000 ton,
but the production has increased during recent years because FSBM is often used as a
replacement for fish meal in the swine and poultry industries. Historically, most of the
production has taken place in Asia, but a facility to produce FSBM in the United States was
established a few years ago.

27
The total amount of P in the diets as well as the excretion of P from pigs may be reduced
if diets are formulated based on values for STTD of P rather than on values for total P (Bünzen et
al., 2008; 2009). Values for STTD of P are calculated by correcting values for the ATTD of P for
the basal endogenous losses of P (EPL; Petersen and Stein, 2006). The reason for the reduced
excretion of P in diets formulated based on STTD of P rather than ATTD of is most likely that
values for STTD of P are additive in mixed diets, but this is not always the case for values for
ATTD of P (Fan et al., 2001).Values for ATTD and STTD of P have been reported for SBM-CV
without and with microbial phytase (Almeida and Stein, 2010), but that is not the case for
FSBM. Therefore, the objectives of this experiment were to determine ATTD and STTD of P in
FSBM without and with microbial phytase and to test the hypothesis that the ATTD and STTD
of P in FSBM are greater than in SBM-CV.
MATERIALS AND METHODS
The Institutional Animal Care and Use Committee at the University of Illinois reviewed
and approved the protocol for this experiment. Pigs used in the experiment were the offspring of
G-performer boars mated to F-25 gilts (Genetiporc, Alexandria, MN). The ingredients that were
used in the experiment (Table 1) included FSBM (PepSoyGen®, Nutra Ferma, North Sioux City,
SD) and SBM-CV (Solae, Gibson City, IL). PepSoyGen® is produced by aerobic fermentation of
SBM in the presence of Aspergillus oryzae and Lactobacillus subtilis.
Diets, Animals, and Experimental Design
Thirty growing barrows (initial BW: 14.0 ± 2.28 kg) were placed in metabolism cages
and allotted to a randomized complete block design with 5 diets and 6 replicate pigs per diet.
Each metabolism cage was equipped with a feeder and a nipple drinker.

28
Five diets were formulated (Table 2). Two diets contained 47.0% (as-fed basis) FSBM
and either 0 or 800 phytase units (FTU) of microbial phytase (Optiphos 2000, Enzyvia,
Sheridan, IN) per kilogram. Two additional diets contained 50.0% (as-fed basis) SBM-CV and
either 0 or 800 FTU/kg of phytase. The only sources of P in the diets were FSBM and SBM-CV,
respectively. The levels of SBM in the diets were determined to equalize the concentration of P
among diets, and phytase was included at a level close to the greatest levels that are used in
commercial diets. The last diet, a P-free diet, was used to measure basal EPL (Petersen and Stein,
2006). Vitamins and minerals except P were included in all diets to meet or exceed the
requirements for weanling pigs (NRC, 1998).
Feeding and Sample Collection
Feed was supplied in the amount of 2.5 times the daily maintenance energy requirement
(i.e., 106 kcal of ME/kg of BW0.75; NRC, 1998). The daily amount of feed was divided into 2
equal meals that were fed at 800 and 1700 h. Water was available at all times. Individual pig BW
was recorded at the beginning and at the end of the experiment and the amount of feed supplied
each day was also recorded. Pigs were fed their experimental diets for 12 d. The initial 5 d were
considered an adaptation period to the diet. Chromic oxide and ferric oxide were added as
indigestible markers to the diet in the morning meals on d 6 and d 11, respectively. The fecal
collections started when chromic oxide appeared in the feces and ceased when ferric oxide
appeared as previously described (Adeola, 2001). Feces were collected twice daily and stored at -
20ºC immediately after collection.
Chemical Analysis
All samples were analyzed in duplicate. Fecal samples were dried at 65ºC in a forced-air
oven and ground through a 1-mm screen in a Wiley mill (model 4; Thomas Scientific,

29
Swedesboro, NJ) before analysis. Diets, ingredients, and fecal samples were analyzed for DM
(method 930.15; AOAC Int., 2007). Phosphorous and Ca were analyzed in all samples by the
inductively coupled plasma spectroscopy procedure (method 985.01 A, B, and C; AOAC, 2007)
after wet ash sample preparation (method 975.03B(b); AOAC Int., 2007).Diets and ingredients
were also analyzed for ADF (method 973.18; AOAC Int., 2007), NDF (Holst, 1973), ash
(method 942.05; AOAC Int., 2007), and for CP by combustion (method 990.03; AOAC Int.,
2007) on an Elementar Rapid N-cube protein/nitrogen apparatus (Elementar Americas Inc., Mt.
Laurel, NJ). Fermented soybean meal and SBM-CV were analyzed for AA on a Hitachi Amino
Acid Analyzer, Model No. L8800. (Hitachi High Technologies America, Inc; Pleasanton, CA)
using ninhydrin for postcolumn derivatization and norleucine as the internal standard. Prior to
analysis, samples were hydrolyzed with 6N HCl for 24 h at 110°C (method 982.30 E(a); AOAC
Int., 2007). Methionine and Cys were determined as Met sulfone and cysteic acid after cold
performic acid oxidation overnight before hydrolysis (method 982.30 E(b); AOAC Int., 2007).
Tryptophan was determined after NaOH hydrolysis for 22 h at 110°C (method 982.30 E(c);
AOAC Int., 2007) and total fat concentration was measured in both sources of SBM by acid
hydrolysis using 3N HCl (Sanderson, 1986) followed by crude fat extraction using petroleum
ether (method 2003.06, AOAC Int., 2007) on a Soxtec 2050 automated analyzer (FOSS North
America, Eden Prairie, MN).Diets and ingredients were also analyzed for GE using adiabatic
bomb calorimetry (Model 6300 Parr Instruments, Moline, IL) and for phytase activity (Phytex
Method, Version 1; Eurofins, Des Moines, IA). The 2 sources of SBM were analyzed for trypsin
inhibitor concentrations (method Ba 12-75; AOCS; 2006), phytate (Ellis et al., 1977), and
carbohydrates were analyzed as described by Cervantes-Pahm and Stein (2010).

30
Calculations and Statistical Analysis
The concentration of phytate bound P in the 2 sources of SBM was calculated as 28.2%
of analyzed phytate (Tran and Sauvant, 2004) and the concentration of non-phytate bound P was
calculated by subtracting phytate bound P from total P. The ATTD, STTD, and EPL in each diet
were calculated as previously described (Almeida and Stein, 2010). Data were analyzed as a 2 ×
2 factorial using the MIXED Procedure (SAS Inst. Inc., Cary, NC). Homogeneity of the
variances among treatments was confirmed using the UNIVARIATE procedure and this
procedure was also used to test for outliers, but no outliers were identified. The fixed effects
were source of SBM, phytase, and the interaction between SBM and phytase. Replicate was
considered a random effect. The Least Significant Means statement was used to calculate
treatment means and the PDIFF option was used to separate means if differences were detected.
The pig was the experimental unit for all analyses and an alpha level of 0.05 was used to assess
significance among means.
RESULTS
The total amount of P in FSBM was 0.78% whereas there was 0.66% P in SBM-CV and
the concentration of phytate was 1.38 and 1.51% in FSBM and SBM, respectively (Table 1).
Therefore, 0.39 and 0.43% P was bound in phytate in FSBM and SBM-CV, respectively. This
corresponds to 50.0 and 64.5% of the total P, in FSBM and SBM-CV, respectively. As a
consequence, the concentration of non-phytate bound P was 0.39 and 0.23% in FSBM and SBM,
respectively, which corresponds to 50.0 and 35.5% of the total P in FSBM and SBM,
respectively.

31
There was no detectable phytase activity in FSBM or SBM-CV. Likewise, no phytase
was detected in the 2 diets that contained no microbial phytase, but the phytase concentration
was close to expected values for the 2 diets with added phytase although the FSBM-diet
contained 110 FTU more than expected and the diet containing SBM-CV contained 110 FTU
less than expected (Table 2).
One pig fed the diet containing SBM-CV and phytase failed to consume the allotted
amount of feed and was removed from the experiment, but all other pigs successfully completed
the experiment. Neither source of SBM nor the level of phytase influenced ADFI or basal EPL
(Table 3). There was, however, an unintended interaction (P < 0.05) between source of SBM and
phytase for daily P intake because pigs fed the diet containing SBM-CV with phytase had less P-
intake than pigs fed SBM-CV without phytase, which was caused by the analyzed differences in
P-concentrations between the 2 diets. However, no differences in P intake between pigs fed diets
containing FSBM without and with phytase were observed. Phosphorus concentration in feces
and daily P output were reduced (P < 0.01) when phytase was used in the diets and P
concentration in feces and daily P output were less (P < 0.01) in pigs fed FSBM than in pigs fed
SBM-CV. The reductions in fecal P concentration and in P output that were induced by phytase
were, however, greater in pigs fed SBM-CV than in pigs fed FSBM, resulting in an interaction
(P < 0.01) between source of SBM and phytase.
Daily absorption of P was greater (P < 0.01) in pigs fed FSBM than in pigs fed SBM-CV
and greater (P < 0.05) if phytase was added to the diets than if no phytase was used. The ATTD
and STTD of P were also greater (P < 0.01) when phytase was used than if no phytase was
included in the diets, regardless of the source of SBM. The increase in ATTD and STTD when
phytase was used was, however, greater for SBM-CV than for FSBM resulting in an interaction

32
(P < 0.01) between SBM source and phytase. However, feeding FSBM rather than SBM-CV
resulted in an increase (P < 0.01) in ATTD as well as in STTD of P.
The intake of Ca was less (P < 0.01) if pigs were fed FSBM without phytase than if the
other diets were provided and the interaction between source of SBM and phytase was
significant (P < 0.01) for Ca intake. The concentration of Ca in feces was greater (P < 0.05) in
pigs fed SBM-CV than in pigs fed FSBM, and phytase reduced (P < 0.01) Ca concentration in
the feces, but the reduction was greater for SBM-CV than for FSBM (interaction, P< 0.05).
There was also a reduction (P < 0.05) of daily Ca output when phytase was added to SBM-CV,
but this was not the case if phytase was added to FSBM, which resulted in an interaction between
SBM source and phytase (P < 0.05). Daily absorption of Ca was greater (P < 0.01) in pigs fed
SBM-CV than in pigs fed FSBM and the ATTD of Ca was less (P < 0.05) for pigs fed FSBM
than for pigs fed SBM-CV. However, phytase increased (P < 0.05) the ATTD of Ca in the 2
phytase containing diets.
DISCUSSION
Soybean meal contains both phytate bound P and non-phytate bound P (Eeckhout and De
Paepe, 1994). The chemical name of the phytate molecule is myo-inositol hexaphosphate (IP6)
because it has 6 atoms of P bound to the inositol molecule and the molecular weight of this
molecule is 660.04 g mol-1 (Selle et al., 2009). The molecular weight of P is 30.974 g mol-1
(Ham, 2008), and the 6 P in phytate, therefore, equates to 28.2% of the total weight of phytate
(Tran and Sauvant, 2004).
The concentration of sucrose and oligosaccharides in SBM-CV was close to expected
values (Grieshop et al., 2003). However, there was no sucrose or oligosaccharides detected in

33
FSBM, which indicates that these carbohydrates are fermented during production of FSBM. This
observation is in agreement with Cervantes-Pahm and Stein (2010) who also reported that no
sucrose or oligosaccharides are present in FSBM. The removal of the carbohydrates is the reason
the concentration of CP, NDF, P, and other nutrients is greater in FSBM than in SBM-CV. As a
consequence, the concentration of AA is also greater in FSBM than in SBM-CV, which is also in
agreement with previous data (Cervantes-Pahm and Stein, 2010).
The P concentration in SBM-CV was close to the value of 0.69% reported by NRC
(1998). The basal EPL that was calculated in this experiment (187 mg/kg of DMI) is in
agreement with previously reported values (Stein et al., 2006; Widmer et al., 2007), which
indicates that the basal endogenous loss of P is relatively constant among experiments.
The 2 diets that contained phytase were formulated to contain 800 FTU and the analyzed
values were 910 and 690 FTU for FSBM and SBM-CV, respectively. The reason for these small
differences from the expected value is most likely inaccuracies in the analyses of phytase and
possibly also inaccuracies in diet formulation. It is unlikely that the analyzed difference between
the 2 diets contributed to different responses to microbial phytase, because the response to
microbial phytase that is obtained after inclusion of 500 FTU usually declines. The fact that the
response to microbial phytase was much greater for SBM-CV than for FSBM also indicates that
the P-digestibility in SBM-CV was not compromised because of the slightly lower analyzed
value than expected.
The analyzed values for P were close to expected values in all diets, whereas some
unintended variations in the analyzed values for Ca were observed. The main reason for the
variations in Ca concentrations is most likely that SBM-CV contained twice as much Ca as
expected (NRC, 1998).

34
To our knowledge, the ATTD and STTD of P in FSBM have never previously been
reported, but the greater digestibility of P in FSBM compared with SBM-CV is likely a result of
the reduced concentration of phytate bound P in FSBM compared with SBM-CV. It is likely that
fermentation of FSBM resulted in hydrolysis of phytate bonds, which increased the
concentration of free P in FSBM (Ilyas et al., 1995). We are not aware of other data showing
effects of fermentation of SBM on the concentration of phytate bound P and on the digestibility
of P. However, the effect of fermentation of SBM on P digestibility appears to be similar to the
effect of fermentation of corn in ethanol plants because the digestibility of P in fermented corn
co-products also is greater than in corn and non-fermented co-products (Pedersen et al., 2007;
Widmer et al., 2007; Stein et al., 2009). Fermentation, therefore, seems to be an effective way of
improving P-digestibility of feed ingredients that contain phytate bound P.
The ATTD and STTD of P in SBM-CV without phytase that were obtained in this
experiment concur with previous values (Bohlke et al., 2005) and the ATTD and STTD of P that
were obtained for SBM-CV with phytase were in agreement with the values reported by Almeida
and Stein (2010). These values were also similar to the values obtained for FSBM. The effect of
addition of microbial phytase on the ATTD and STTD of P, therefore, was much greater in
SBM-CV than in FSBM. The reason for this observation is most likely that the amount of
phytate-bound P is greater in SBM-CV than in FSBM, and therefore, phytase hydrolyzed more
phytate in SBM-CV than in FSBM and increased the digestibility of P. This observation is in
agreement with data showing that the effect of microbial phytase is much greater in corn than in
corn distillers dried grains with solubles, which is also a fermented feed ingredient that has a
relatively low concentration of phytate bond P (Almeida and Stein, 2010). It therefore appears
that the response to phytase that is obtained in a particular feed ingredient depends on the amount

35
of substrate that is available. The practical consequence of these observations is that the response
to addition of microbial phytase may vary among diets depending on the feed ingredients
included in the diet. The greater the quantity of phytate bound P in the diet is, the greater will the
response to microbial phytase be. Using a constant value for P release from microbial phytase in
diet formulations across all types of diets regardless of the ingredients that are used may,
therefore, not always give accurate estimates of digestible P in the diet.
The fact that the STTD of P in both sources of soybean meal was around 71% if
microbial phytase was added to the diet indicates that this may be close to the maximum
digestibility of P in SBM when fed to weanling pigs. However, it is possible that older pigs may
have a slightly greater digestibility of P in SBM than the weanling pigs we used in this
experiment because the digestibility of phytate bound P may increase as pigs get older (Baker,
2010).
The Ca in the diets originated from a combination of Ca in the SBM and Ca from
limestone. The concentration of Ca was greater in SBM-CV than in FSBM, which is the reason
Ca intake was greater for pigs fed diets containing SBM-CV than for pigs fed diets containing
FSBM. The ATTD of Ca in the SBM-CV diet without phytase was similar to the value reported
by Bohlke et al. (2005). The ATTD of Ca increased as phytase was used in the diet regardless of
the source of SBM. It is possible that Ca that was bound in the phytate complex was released by
phytase, but the majority of Ca in both diets originated from limestone. It is, therefore, likely that
the increase in the ATTD of Ca that was observed when microbial phytase was used is a result of
increased absorption of Ca from limestone. The reason for this observation may be that phytase
reduced the amount of phytate in the intestine, which reduced the capacity of phytate to chelate
Ca, which increased the amount of Ca available for absorption (Selle et al., 2009). The ATTD of

36
Ca in a corn-SBM-limestone diet is increased by microbial phytase, which supports the
hypothesis that phytase may reduce the ability of phytate to chelate Ca in the intestinal tract of
pigs (Selle et al., 2009).
In conclusion, the ATTD and STTD of P are greater in FSBM than in SBM-CV if
microbial phytase is not added to the diet. However, if microbial phytase is used, there is no
difference in ATTD or STTD of P between FSBM and SBM-CV, and both sources have STTD
values around 71%. Fermented SBM contains more digestible P than SBM-CV, which reduces
the need for inclusion of inorganic P in diets containing FSBM.

37
LITERATURE CITED
Adeola, O. 2001.Digestion and balance techniques in pigs. Pages 903-916 in Swine Nutrition.
2nd ed. A. J. Lewis and L. L. Southern, ed. CRC Press, Washington, DC.
AOAC International. 2007. Official Methods of Analysis of AOAC Int. 18th ed. Rev. 2. W.
Hortwitz and G. W. Latimer Jr., ed. AOAC Int., Gaithersburg, MD.
AOCS. 2006. Official Methods and Recommended Practices (5th Ed). Association of Oil
Chemists Society. Urbana, IL.
Almeida, F. N., and H. H. Stein. 2010. Performance and phosphorus balance of pigs fed diets
formulated on the basis of values for standardized total tract digestibility of phosphorus.
J. Anim. Sci. 88:2968-2977.
Baker, S. R. 2010. Aspects of phosphorus nutrition in swine. MS thesis. Univ. IL, Urbana.
Bohlke, R. A., R. C. Thaler, and H. H. Stein. 2005. Calcium, phosphorus, and amino acid
digestibility in low-phytate corn, normal corn, and soybean meal by growing pigs.
J. Anim. Sci. 83:2396-2403.
Bünsen, S., H. S. Rostagno, D. C. Lopes, P. C. Gomes, F. A. M. Hashimoto, L. R. Apolonio, and
C. G. Borsatto. 2009. Digestibilidade aparente e verdadeira do fosforo de alimentos de
origem animal para suinos. Arq. Bras. Med. Vet. Zootec. 61:903-909.
Bünsen, S., H. S. Rostagno, D. C. Lopes, F. A. M. Hashimoto, P. C. Gomes, and L. R. Apolonio.
2008. Digestibilidade do fosforo de alimentos de origem vegetal derterminada em suinos
em crescimento e terminacao. Rev. Bras. Zootec. 37:1236-1242.
Cervantes-Pahm, S. K., and H. H. Stein. 2010. Ileal digestibility of amino acids in conventional,
fermented, and enzyme-treated soybean meal and in soy protein isolate, fish meal, and
casein fed to weanling pigs. J. Anim. Sci. 88:2674-2683.

38
Eeckhout, W., and M. De Paepe. 1994. Total phosphorus, phytate-phosphorus and phytase
activity in plant feedstuffs. Anim. Feed Sci. Technol. 47:19-29.
Ellis, R., E. R. Morris, and C. Philpot. 1977. Quantitative determination of phytate in the
presence of high inorganic phosphate. Anal. Biochem. 77:536-539.
Fan, M. Z., T. Archbold, W. C. Sauer, D. Lackeyram, T. Rideout, Y. Gao, C. F. M. de Lange,
and R. R. Hacker. 2001. Novel methodology allows simultaneous measurement of true
phosphorus digestibility and the gastrointestinal endogenous phosphorus outputs in
studies with pigs. J. Nutr. 131:2388-2396.
Grieshop, C. M., C. T. Kadzere, G. M. Clapper, E. A. Flickinger, L. L. Bauer, R. L. Frazier, and
G. C. Fahey, Jr. 2003. Chemical and nutritional characteristics of United States soybeans
and soybean meals. J. Agric. Food Chem. 51:7684-7691.
Ham, B. 2008. Periodic table of elements.Pages 92-94 in The Periodic Table. Chelsea House.
New york.
Holst, D. O. 1973.Holst filtration apparatus for Van Soest detergent fiber analysis. J.
AOAC. 56:1352–1356.
Hong, K. J., C. H. Lee, and S. W. Kim. 2004. Aspergillus oryzae GB-107 fermentation improves
nutritional quality of food soybeans and feed soybeanmeals. J. Med. Food. 7:430-436.
Ilyas, A., M. Hirabayashi, T. Matsui, H. Yano, F. Yano, T. Kikushima, M. Takebe, and K.
Hakayaka. 1995. A note on the removal of phytate in soybean meal using Aspergillus
usami. Asian-australas. J. Anim. Sci. 8:135-138.
Knowlton, K. F., J. S. Radcliffe, C. L. Novak, and D. A. Emmerson. 2004. Animal management
to reduce phosphorus losses to the environment. J. Anim. Sci. 82:E173-195.
NRC. 1998. Nutrient requirements of swine. 10th rev. ed. Natl. Acad. Press, Washington, DC.

39
Pedersen, C., M. G. Boersma, and H. H Stein. 2007. Digestibility of energy and phosphorus in
ten samples of distillers dried grains with solubles fed to growing pigs. J. Anim. Sci.
85:1168-1176.
Petersen, G. I., and H. H. Stein. 2006. Novel procedure for estimating endogenous losses and
measurement of apparent and true digestibility of phosphorus by growing pigs. J. Anim.
Sci. 84:2126-2132.
Sanderson, P. 1986. A new method of analysis of feedingstuffs for the determination of crude
oils and fats. Pages 77-81 in Recent Advances in Animal Nutrition. W. Haresign and D.
J. A. Cole, eds. Butterworths, London, U.K.
Selle, P. H., A. J. Cowieson, and V. Ravindran. 2009. Consequences of calcium interactions with
phytate and phytase for poultry and pigs. Livest. Sci. 124:126-141.
Stein, H. H., M. G. Boersma, and C. Pedersen. 2006. Apparent and true total tract digestibility of
phosphorus in field peas (Pisumsativum L.) by growing pigs. Can. J. Anim. Sci. 86:523-
525.
Stein, H. H., S. P. Connot, and C. Pedersen. 2009. Energy and nutrient digestibility in four
sources of distillers dried grains with solubles produced from corn grown within a narrow
geographical area and fed to growing pigs. Asian-australas. J. Anim. Sci. 22:1016-1025.
Tran, G., and D. Sauvant, D. 2004. Chemical data and nutritional value. Pages 17-24 in Tables of
composition and nutritional value of feed materials: Pigs, Poultry, Cattle, Sheep, Goats,
Rabbits, Horses, Fish. D. Sauvant, J. M. Pérez, and G. Tran, ed. Institut National de la
Recherche Agronomique, Association Française de Zootechnie, Paris, France.

40
Widmer, M. R., L. M. McGinnis, and H. H. Stein. 2007. Energy, phosphorus, and amino acid
digestibility of high-protein distillers dried grains and corn germ fed to growing pigs. J.
Anim. Sci. 85:2994-3003.

41
Table 3.1. Nutrient composition of fermented soybean meal (FSBM) and conventional soybean
meal (SBM-CV), as-fed basis
Ingredient
Item FSBM SBM-CV
GE, kcal/kg 4,511 4,313
DM, % 90.76 87.97
CP, % 55.54 47.22
Ca, % 0.29 0.56
P, % 0.78 0.66
Ash, % 6.69 6.30
Acid hydrolyzed ether extract, % 1.44 1.43
NDF, % 8.82 6.14
ADF, % 4.53 4.26
TIU1, mg/kg 1.10 4.00
Phytase, FTU/kg < 70 < 70
Phytate, % 1.38 1.51
Phytate bound P, %2 0.39 0.43
Phytate bound P, % of total P 50.00 64.5
Non-phytate P, %3 0.39 0.23
Non-phytate bound P, % of total P 50.00 35.5
Carbohydrates, %
Glucose 0.23 0.00
Sucrose 0.00 9.36

42
Table 3.1 (cont.)
Maltose 0.00 0.27
Fructose 0.37 0.00
Stachyose 0.00 6.56
Raffinose 0.00 0.98
Indispensable AA, %
Arg 3.78 3.42
His 1.37 1.21
Ile 2.60 2.17
Leu 4.29 3.57
Lys 3.13 2.97
Met 0.75 0.63
Phe 2.81 2.33
Thr 2.07 1.73
Trp 0.71 0.73
Val 2.77 2.30
Dispensable AA, %
Ala 2.39 1.95
Asp 6.12 5.16
Cys 0.87 0.69
Glu 9.81 8.39
Gly 2.35 1.94
Pro 2.98 2.46
Ser 2.49 1.92

43
Table 3.1 (cont.)
Tyr 1.98 1.67
Total AA 53.27 45.24
1TIU = trypsin inhibitor unit.
2Phytate bound P was calculated as 28.2% of phytate (Tran and Sauvant, 2004).
3Non-phytate P was calculated as the difference between total P and phytate
bound P.

44
Table 3.2. Composition of experimental diets, as-fed basis
Diet1
FSBM SBM-CV P free
Phytase, FTU/kg2: 0 800 0 800
Ingredient, %
Fermented soybean meal 47.00 47.00 - - -
Soybean meal, 48% CP - - 50.00 50.00 -
Gelatin3 - - - - 20.00
Soybean oil - - - - 4.00
Solka floc4 - - - - 4.00
Ground limestone 1.00 1.00 1.00 1.00 0.80
Sucrose 15.00 15.00 15.00 15.00 20.00
Cornstarch 36.30 36.26 33.30 33.26 49.22
Amino acid mixture5 - - - - 0.78
Sodium chloride 0.40 0.40 0.40 0.40 0.40
Phytase premix6 - 0.04 - 0.04 -
Vitamin mineral premix 7 0.30 0.30 0.30 0.30 0.30
Potassium carbonate - - - - 0.40
Magnesium oxide - - - - 0.10
Total 100.00 100.00 100.00 100.00 100.00
Analyzed composition
GE, kcal/kg 4,016 4,012 3,885 3,907 3,965
DM, % 92.36 92.09 91.15 91.00 92.22

45
Table 3.2 (cont.)
CP, % 27.36 27.70 24.28 22.19 24.31
Ca, % 0.54 0.62 0.78 0.65 0.32
P, % 0.38 0.39 0.38 0.33 0.01
Ash, % 4.62 4.37 4.52 4.24 1.17
NDF, % 4.35 4.21 3.17 2.93 3.44
ADF, % 2.12 2.09 2.21 2.20 3.24
Phytase, FTU/kg <70 910 <70 690 -
1FSBM = fermented soybean meal; SBM-CV = conventional soybean meal; P-free =
phosphorus-free diet.
2FTU = phytase units.One FTU is defined as the amount of phytase needed to release 1 g
of phytate bound P.
3Pork gelatin obtained from Gelita Gelatine USA Inc. (Sioux City, IA).
4Fiber Sales and Development Corp., Urbana, OH.
5Contained the following AA (%, as-is basis): DL-methionine, 0.27; L-threonine, 0.08; L-
tryptophan, 0.14; L-histidine, 0.08; L-isoleucine, 0.16; and L-valine, 0.05.
6Optiphos 2000 (2000 FTU/g), Enzyvia, Sheridan, IN.
7Provided the following quantities of vitamins and micro minerals per kilogram of
complete diet: Vitamin A as retinyl acetate, 11,128 IU; vitamin D3 as cholecalciferol, 2,204 IU;
vitamin E as DL-alpha tocopheryl acetate, 66 IU; vitamin K as menadione nicotinamide bisulfite,
1.42 mg; thiamin as thiamine mononitrate, 0.24 mg; riboflavin, 6.58 mg; pyridoxine as
pyridoxine hydrochloride, 0.24 mg; vitamin B12, 0.03 mg; D-pantothenic acid as D-calcium
pantothenate, 23.5 mg; niacin as nicotinamide and nicotinic acid, 44 mg; folic acid, 1.58 mg;

46
biotin, 0.44 mg; Cu, 10 mg as copper sulfate; Fe, 125 mg as iron sulfate; I, 1.26 mg as potassium
iodate; Mn, 60 mg as manganese sulfate; Se, 0.3 mg as sodium selenite; and Zn, 100 mg as zinc
oxide.

47
Table 3.3. Effects of phytase on apparent total tract digestibility (ATTD) of P and Ca and standardized total tract digestibility (STTD)
of P in fermented soybean meal (FSBM) and conventional soybean meal (SBM-CV)1
FSBM SBM-CV Pooled SEM
P-value
Item
Phytase, FTU/kg2
0 FTU/kg
< 70
800 FTU/kg
910
0 FTU/kg
< 70
800 FTU/kg
690
Source of SBM3
Phytase Source of SBM × phytase
Feed intake, g DM/d 479.7 482.2 488.1 481.2 13.6 0.57 0.84 0.97
P intake, g/d 2.0 2.0 2.0 1.7 0.1 0.14 0.17 0.02
P in feces, % 2.8 2.1 4.2 2.4 0.1 < 0.01 < 0.01 < 0.01
P output, g/d 0.8 0.7 1.2 0.6 0.1 < 0.01 < 0.01 < 0.01
Absorbed P, g/d 1.2 1.4 0.8 1.2 0.1 < 0.01 < 0.01 0.19
ATTD of P, % 60.9 67.5 41.6 66.2 2.0 < 0.01 < 0.01 < 0.01
Basal EPL,4 mg/d 89.5 90.0 91.1 90.0 2.9 0.57 0.84 0.97
STTD of P5, % 65.5 71.9 46.1 71.4 2.0 < 0.01 < 0.01 < 0.01
Ca intake, g/d 2.8 3.2 4.2 3.4 0.1 < 0.01 0.33 < 0.01
Ca in feces, % 5.0 4.6 6.4 4.3 0.3 0.02 < 0.01 0.03
Ca output, g/d 1.4 1.4 1.8 1.1 0.1 0.46 0.02 0.01

48
Table 3.3 (cont.)
Absorbed Ca, g /d 1.4 1.8 2.3 2.3 0.1 < 0.01 0.08 0.06
ATTD of Ca % 50.7 55.9 56.5 67.4 3.1 0.02 0.02 0.45
1Data are means of 6 observations per treatment, except for the treatment with SBM-CV and phytase, which only had 5
observations.
2FTU = phytase units; Optiphos 2000. Enzyvia, Sheridan, IN.
3SBM = soybean meal.
4EPL = basal endogenous P loss. This value was measured in pigs fed the P-free diet and determined to be 187 mg/kg DMI.
The daily basal EPL was calculated by multiplying daily DMI by 187 mg/kg DMI.
5Values for STTD were calculated by correcting values for ATTD for basal EPL.

49
CHAPTER 4
DIGESTIBILITY OF ENERGY, DRY MATTER, AND NUTRIENTS AND
CONCENTRATION OF DIGESTIBLE METABOLIZABLE, AND NET ENERGY IN
FERMENTED SOYBEAN MEAL, CONVENTIONAL SOYBEAN MEAL, AND FISH
MEAL FED TO WEANLING PIGS
ABSTRACT
Two experiments were conducted to determine the digestibility of energy, DM, and nutrients and
the concentration of DE, ME, and NE in fermented soybean meal (FSBM), conventional soybean
meal (SBM-CV), and fish mealfed to weanling pigs. In Exp. 1, 36 barrows (initial BW: 22.0 ±
3.85 kg) were placed in metabolism cages and allotted to a randomized complete block design
with 4 diets and 9 pigs per diet. Feces and urine were collected for 5 d after a 5 d adaptation
period. A corn-based diet consisting of 96.4% corn and vitamins and minerals was formulated.
Three additional diets containing corn and each of the experimental ingredients (FSBM, SBM-
CV, and fish meal) were also formulated. The apparent total tract digestibility (ATTD) of GE in
corn, FSBM, and SBM-CV was 88.6, 88.2, and 90.3%, respectively. These values were not
different (P > 0.01), but the ATTD of GE in fish meal (84.0%) was less (P < 0.01) than in the
other ingredients. The concentrations of DE, ME, and NE in SBM-CV were 4,553, 4,137, and
3,193 kcal/kg DM. These values were greater (P < 0.01) than the DE, ME, and NE in FSBM
(4,296, 3,781, and 2,951 kcal/kg DM), corn (3,951, 3,819, and 2,864 kcal/kg DM), and fish meal
(3,827, 3,412, and 2,626 kcal/kg DM). However, FSBM contained more (P < 0.01) DE, ME, and
NE than fish meal and more (P < 0.01) DE than corn. The biological value of the protein in fish

50
meal (75.4%) was greater (P< 0.05) than in corn (34.8%) and FSBM (62.8%), and the biological
value of protein in SBM-CV (67.1%) was greater (P< 0.05) than the biological value of protein
in corn, but not different (P> 0.05) from that in FSBM and fish meal. In Exp. 2, 8 barrows
(initial BW: 10.4 ± 0.47 kg) were equipped with a T-cannula in the distal ileum and randomly
allotted to a replicated 4 × 4 Latin square design with 4 diets and 4 periods per square. Three
cornstarch-based diets were formulated with FSBM, SBM-CV, or fish meal as the only source of
AA in each diet. A N-free diet that was used to estimate basal endogenous losses of CP and AA
was also formulated. The standardized ileal digestibility (SID) of all indispensable AA except
Lys, Thr, and Trp was greater (P< 0.01) in FSBM than in fish meal. The SID of Met and Val was
also greater (P< 0.05) in FSBM than in SBM-CV, but for the remaining indispensable AA, no
difference between FSBM and SBM-CV was observed.In conclusion, the concentration of DE,
ME, and NE is less in FSBM than in SBM-CV. However, DE, ME, and NE are greater in FSBM
than in fish meal, but the SID of most AA is not different between the 2 sources of SBM,
although they are greater than in fish meal.
Key words:amino acid digestibility, energy, fermented soybean meal, fish meal, pigs, soybean
meal.
INTRODUCTION
Protein from conventional soybean meal (SBM-CV) contains anti-nutritional factors such
as antigens, oligosaccharides, lectins, and trypsin inhibitors that decrease nutrient availability and
reduce growth performance of young pigs (Li et al., 1991; Hong et al., 2004). Therefore,
inclusion of SBM-CV is restricted in diets fed to weanling pigs (Dunsford, 1989). Animal
protein such as fish meal is often used in these diets (Kim and Easter, 2001) although animal

51
protein is more expensive than soy protein. However, many of the anti-nutritional factors in
SBM-CV may be eliminated if SBM-CV is fermented (Kaankuka et al., 1996; Hong et al., 2004;
Cervantes-Pahm and Stein, 2010) and fermented soybean meal (FSBM) is, therefore, better
tolerated by young pigs than SBM-CV (Liu et al., 2007; Yang et al., 2007). Thus, it is believed
that FSBM may replace fish meal in diets fed to weanling pigs without reducing growth
performance (Jones et al., 2010; Kim et al., 2010),and FSBM may have a positive effect on
intestinal health and gut morphology of weaned pigs compared with SBM-CV (Kim et al., 2007).
An increase in the apparent ileal digestibility (AID) of DM and most AA may also be observed
in FSBM compared with SBM-CV (Min et al., 2004) although that is not always the case
(Cervantes-Pahm and Stein, 2010).
Recently, production of FSBM was initiated in the United States, but there are no data on
the digestibility of energy and AA in this source of FSBM. Two experiments were, therefore,
conducted with the objective of determining the concentration of DE, ME, and NE, apparent
total tract digestibility (ATTD) of GE, DM, and nutrients, and the ileal digestibility of AA in
FSBM produced in the United States and to compare these values to values obtained for SBM-
CV and fish meal.
MATERIALS AND METHODS
Two experiments were conducted, and the Institutional Animal Care and Use Committee
at the University of Illinois reviewed and approved the protocols for both experiments. Pigs used
in the experiments were the offspring of G-performer boars mated to F-25 gilts (Genetiporc,
Alexandria, MN). The ingredients that were used in the experiments included FSBM, SBM-CV,
and fish meal (Table 1) and the same batches of these ingredients were used in both experiments.

52
The source of FSBM that was used was PepSoyGen® (Nutra Ferma, North Sioux City, SD),
which is produced by fermentation of SBM in the presence of Aspergillus oryzae and
Lactobacillus subtilis. The SBM-CV was sourced from Rose Acre Farms (Seymour, IN), and the
fish meal was prepared from menhaden fish (Menhaden Select, Omega Protein, Houston, TX).
Exp. 1: Energy Concentration and Total Tract Digestibility
Diets, Animals, and Experimental Design.Experiment 1 was designed to determine the DE, ME,
and NE, the N-balance, and the ATTD of GE, DM, and nutrients in FSBM, SBM-CV, and fish
meal. Thirty-six barrows (initial BW: 22.2 ± 3.85 kg) were placed in metabolism cages equipped
with a feeder and a nipple drinker in a randomized complete block design with 4 diets and 9
replicate pigs per diet.
Four corn-based diets were formulated (Table 2). The basal diet contained 96.4% corn
(as-fed basis. The FSBM diet contained 69.3% corn and 28.0% FSBM (as-fed basis). The SBM-
CV diet contained 65.2% corn and 31.0% SBM-CV (as-fed basis), and the fish meal diet
contained 75.3% corn and 24.0% fish meal (as-fed basis). Vitamins and minerals were included
in the diets to meet or exceed the requirements for weanling pigs (NRC, 1998).
Feeding and Sample Collection.Feed was supplied in a daily amount of 3 times the maintenance
energy requirement (i.e., 106 kcal of ME/kg of BW0.75; NRC, 1998) of the smallest pig in each
replicate. The daily amount of feed was divided into 2 equal meals that were fed at 0800 and
1700 h. Water was available at all times.
Pigs were fed experimental diets for 12 d. The initial 5 d were considered an adaptation
period to the diet. Fecal markers were fed on d 6 (chromic oxide) and on d 11, (ferric oxide) and
fecal collections were initiated when chromic oxide appeared in the feces and ceased when ferric
oxide appeared (Adeola, 2001). Feces were collected twice daily and stored at -20ºC

53
immediately after collection. Urine was also collected and urine collections started on d 6 at
1700 h and ceased on d 11 at 1700 h. Urine buckets were placed under the metabolism cages to
permit total collection. They were emptied in the morning and afternoon and a preservative of 50
mL of sulfuric acid was added to each bucket when they were emptied. The collected urine was
weighed and a 10% subsample was stored at -20ºC.
Chemical Analyses. After completing sample collections, urine samples were thawed, combined,
and mixed within animal and diet, and a subsample was collected for chemical analysis. Fecal
samples were dried at 65ºC in a forced-air oven and ground through a 1-mm screen in a Wiley
mill (model 4; Thomas Scientific, Swedesboro, NJ) before analyses. Urine samples were
prepared and lyophilized before energy analysis as previously described (Kim et al., 2009). All
samples were analyzed in duplicate. Diets, ingredients, and fecal samples were analyzed for DM
(method 930.15; AOAC Int., 2007), ash (method 975.03; AOAC Int., 2007), and acid hydrolyzed
ether extraction (AEE), which was determined by acid hydrolysis using 3N HCl (Sanderson,
1986) followed by crude fat extraction with petroleum ether (method 2003.06, AOAC Int., 2007)
on a Soxtec 2050 automated analyzer (FOSS North America, Eden Prairie, MN).Diets,
ingredients, fecal samples, and urine samples were also analyzed for CP by combustion (method
999.03; AOAC Int., 2007) using a Rapid N cube (Elementar Americas Inc, Mt. Laurel, NJ) and
for GE using bomb calorimetry (Model 6300, Parr Instruments, Moline, IL). Ingredients were
analyzed for AA (method 982.30 E [a, b, c]; AOAC Int., 2007), and diets and ingredients were
analyzed for ADF (method 973.18; AOAC Int., 2007), NDF (Holst, 1973), and for total starch
using the glucoamylase procedure (method 979.10; AOAC Int., 2007). Phosphorus and Ca were
analyzed in all ingredients by inductively coupled plasma spectroscopy (method 975.03; AOAC
Int., 2007) after wet ash sample preparation (method 975.03; AOAC Int., 2007) and FSBM and

54
SBM-CV were analyzed for trypsin inhibitor concentration (method Ba 12-75; AOCS; 2006),
phytic acid (Ellis et al., 1977), and monosaccharaides, sucrose, and oligosaccharides were
analyzed as described by Cervantes-Pahm and Stein (2010).
Calculations and Statistical Analysis.Energy values that were determined from the excretion of
GE in the feces and urine were subtracted from the intake of GE to calculate DE and ME for
each diet (Adeola, 2001). The DE and ME in the corn diet were divided by 0.964 to calculate the
DE and ME in corn. The contributions of DE and ME from corn to the diets containing FSBM,
SBM-CV, and fish meal were then calculated and subtracted from the total DE and ME of these
diets, and the concentrations of DE and ME in FSBM, SBM-CV, and fish meal were calculated
by difference (Adeola, 2001). The DE and ME in all ingredients were calculated on an as-fed
basis as well as on a DM basis. The ATTD of GE, DM, CP, AEE, and ash was also calculated in
all diets and in each ingredient using the direct procedure and the difference procedure,
respectively (Adeola, 2001). These procedures were also used to calculate the N-balance for each
diet and ingredient and the biological value of the protein. The concentration of NE was
calculated in diets and ingredients using the average value for equations 3, 5, 6, and 8 published
by Noblet et al. (1994).
Data were analyzed by ANOVA using the Mixed Procedure of SAS (SAS Institute Inc.,
Cary, NC). Homogeneity of the variances among treatments was confirmed using the
UNIVARIATE procedure and this procedure was also used to identify outliers, but no outliers
were observed. Diet was the fixed effect and pig and replicate were random effects. The
LSmeans statement was used to calculate treatment means and the PDIFF option was used to
separate means if differences were detected. The pig was the experimental unit for all analyses
and an alpha level of 0.05 was used to assess significance among means.

55
Exp. 2: AA Digestibility
Diets, Animals, and Experimental Design.Experiment 2 was designed to determine the AID and
the standardized ileal digestibility (SID) of CP and AA in FSBM, SBM-CV, and fish meal fed to
weanling pigs. Eight weanling barrows (initial BW: 10.4 ± 0.47 kg) were equipped with a T-
cannula in the distal ileum according to procedures adapted from Stein et al. (1998). Pigs were
allotted to a replicated 4 × 4 Latin square design with 4 periods and 4 diets in each square. Pigs
were housed individually in pens (1.2 × 1.5 m) in an environmentally controlled room. Pens had
fully slatted tri-bar floors and a feeder and a nipple drinker were installed in each pen.
Four diets were prepared (Tables 3 and 4). Three cornstarch-based diets contained FSBM
(30.0%, as-fed basis), SBM-CV (33.0%, as-fed basis), or fish meal (25%, as-fed basis) as the
only AA-containing ingredient. The last diet was a N-free diet that was used to estimate basal
endogenous losses of CP and AA. Chromic oxide (0.4%) was included in all diets as an
indigestible marker and vitamins and minerals were included to meet or exceed estimated
nutrient requirements for weanling pigs (NRC, 1998).
Feeding and Sample Collection.Pigs were fed at a daily level of 2.5 times the estimated
maintenance requirement for energy, and the daily allotment of feed was provided at 0700 h each
day. Water was available at all times.
Individual pig BW were recorded at the beginning of each period and the amount of feed
supplied each day was recorded. Each experimental period lasted 7 d. The initial 5 d was an
adaptation period to the diet whereas ileal digesta were collected for 8 h on d 6 and 7. A 225-mL
plastic bag was attached to the cannula barrel by a zip tie, and digesta that flowed into the bag
were collected. Bags were removed whenever they were filled with digesta, or at least once
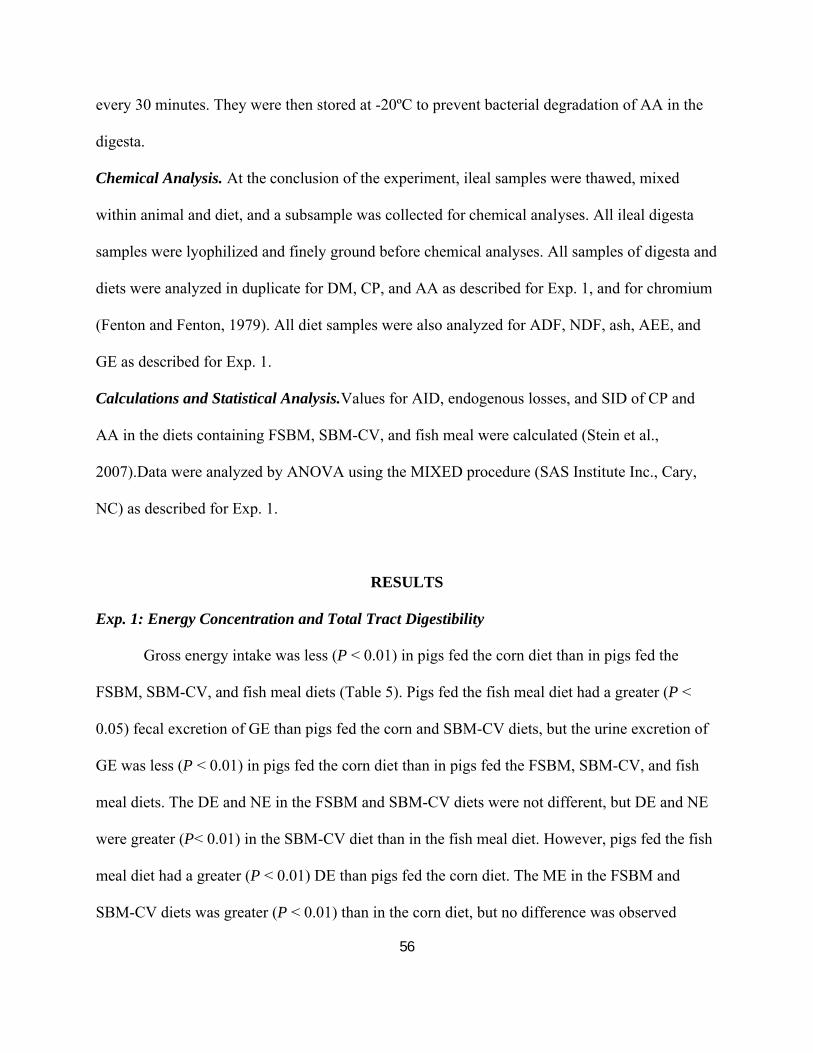
56
every 30 minutes. They were then stored at -20ºC to prevent bacterial degradation of AA in the
digesta.
Chemical Analysis. At the conclusion of the experiment, ileal samples were thawed, mixed
within animal and diet, and a subsample was collected for chemical analyses. All ileal digesta
samples were lyophilized and finely ground before chemical analyses. All samples of digesta and
diets were analyzed in duplicate for DM, CP, and AA as described for Exp. 1, and for chromium
(Fenton and Fenton, 1979). All diet samples were also analyzed for ADF, NDF, ash, AEE, and
GE as described for Exp. 1.
Calculations and Statistical Analysis.Values for AID, endogenous losses, and SID of CP and
AA in the diets containing FSBM, SBM-CV, and fish meal were calculated (Stein et al.,
2007).Data were analyzed by ANOVA using the MIXED procedure (SAS Institute Inc., Cary,
NC) as described for Exp. 1.
RESULTS
Exp. 1: Energy Concentration and Total Tract Digestibility
Gross energy intake was less (P < 0.01) in pigs fed the corn diet than in pigs fed the
FSBM, SBM-CV, and fish meal diets (Table 5). Pigs fed the fish meal diet had a greater (P <
0.05) fecal excretion of GE than pigs fed the corn and SBM-CV diets, but the urine excretion of
GE was less (P < 0.01) in pigs fed the corn diet than in pigs fed the FSBM, SBM-CV, and fish
meal diets. The DE and NE in the FSBM and SBM-CV diets were not different, but DE and NE
were greater (P< 0.01) in the SBM-CV diet than in the fish meal diet. However, pigs fed the fish
meal diet had a greater (P < 0.01) DE than pigs fed the corn diet. The ME in the FSBM and
SBM-CV diets was greater (P < 0.01) than in the corn diet, but no difference was observed

57
between pigs fed the fish meal and corn diets. Nitrogen intake, N-excretion in feces, and N-
excretion in urine were less (P < 0.01) in pigs fed the corn diet than in pigs fed the FSBM, SBM-
CV, and fish meal diets. However, there was no difference in N-intake between pigs fed the
FSBM and SBM-CV diets and there was no difference in N-excretion in the feces and urine
among pigs fed the FSBM, SBM-CV, and fish meal diets.
The ATTD of GE and DM was less (P < 0.05) in the fish meal diet than in the corn and
SBM-CV diets and the ATTD of GE and DM in the SBM-CV diet was not different from that in
pigs fed the corn or the FSBM diets. The ATTD of N was less (P < 0.01) in the corn diet than in
the other diets, but there were no differences among FSBM, SBM-CV, and fish meal diets. The
ATTD of AEE was greater (P < 0.01) in the FSBM diet than in the other diets. The ATTD of
AEE was less in the corn diet than in the other diets, but no difference was observed between the
SBM-CV and fish meal diets. The ATTD of ash was less (P < 0.01) in the corn diet than in the
FSBM and SBM-CV diets, and the ATTD of ash was greater (P < 0.01) in the SBM-CV diet
than in the FSBM and fish meal diets.
Pigs fed corn had a greater (P < 0.01) GE intake and fecal excretion of GE than pigs fed
FSBM, SBM-CV, and fish meal (Table 6). There was no difference in urinary excretion of GE
among ingredients. The DE, ME, and NE were greater (P < 0.01) in SBM-CV than in the other
ingredients on an as-is as well as on a DM basis, but FSBM had a greater (P < 0.01) DE (as-is
and DM basis) than corn and fish meal and a greater (P < 0.01) ME and NE (as-is and DM basis)
than fish meal. Nitrogen intake was less (P < 0.01) in pigs fed corn than in pigs fed FSBM,
SBM-CV, and fish meal, but there was no difference in N-intake between SBM-CV and fish
meal. There were no differences among ingredients in fecal and urinary excretion of N. The
retention of N was less (P < 0.01) in pigs fed corn than in pigs fed FSBM, SBM-CV, and fish

58
meal. The retention of N was also less (P < 0.01) in pigs fed FSBM than in pigs fed fish meal,
but there was no difference in N-retention between pigs fed FSBM and pigs fed SBM-CV.
The biological value of the protein in corn was less (P < 0.01) than in all other
ingredients and there was no difference in the biological value between FSBM and SBM-CV, but
the biological value of protein was less (P < 0.01) in FSBM than in fish meal. The ATTD of GE
was less (P < 0.01) in fish meal than in corn, FSBM, and SBM-CV and there was no difference
in the ATTD of GE among corn, FSBM, and SBM-CV. The ATTD of DM was also less (P <
0.01) in fish meal than in the other ingredients, but there was no difference among corn, FSBM,
and SBM-CV. The ATTD of N was less (P < 0.01) in corn than in the other ingredients, but
there was no difference among FSBM, SBM-CV, and fish meal. The ATTD of AEE was greater
(P < 0.01) in FSBM than in the other ingredients, but there was no difference between SBM-CV
and fish meal in the ATTD of AEE, whereas corn had the least (P < 0.01) ATTD of AEE. The
ATTD of ash was greater (P < 0.01) in SBM-CV than in all other ingredients, but the ATTD of
ash was greater (P < 0.01) in FSBM than in corn, but not different from fish meal.
Exp. 2: AA Digestibility
The AID of CP was not different among ingredients (Table 7). The AID of Arg, His, Phe,
and Trp were less (P< 0.05) in fish meal than in FSBM and SBM-CV. The AID of Ile, Leu, Met,
Phe, Thr, and Val was greater (P< 0.05) in FSBM than in SBM-CV and fish meal, but the AID
of Lys was not different among ingredients. The AID of Gly and Pro was also not different
among ingredients, but the AID of Ala was less (P< 0.01) in SBM-CV than in FSBM and fish
meal. The AID of Cys was less (P < 0.01) in fish meal than in FSBM and SBM-CV, and the AID
of Glu was greater (P < 0.01) in SBM-CV than in FSBM and fish meal. The AID of Asp, Ser,

59
and Tyr was greater (P< 0.01) in FSBM than in SBM-CV and fish meal, and the AID of these
AA was also greater (P < 0.05) in SBM-CV than in fish meal.
The SID of CP was not different among FSBM, SBM-CV, and fish meal. The SID of
Arg, His, and Phe was less (P< 0.05) in fish meal than in SBM-CV and FSBM. The SID of Ile
and Leu was also less (P <0.05) in fish meal than in FSBM, but not different from SBM-CV. The
SID of Met and Val were greater (P< 0.01) in FSBM than in SBM-CV and fish meal. However,
for Lys, Thr, and Trp no differences among ingredients were observed.The SID of Asp, Cys, Ser,
and Tyr were less (P< 0.01) in fish meal than in FSBM and SBM-CV, but the SID of Ala was
greater (P< 0.05) in FSBM than in SBM-CV and fish meal. The SID of Glu, however, was
greater (P< 0.05) in SBM-CV than in the other 2 ingredients, but for Gly and Pro, no differences
among ingredients were observed.
DISCUSSION
Exp. 1: Energy Concentration and Total Tract Digestibility
The values for GE, DE, ME, and ATTD of GE in corn that were determined in this
experiment are in close agreement with previously reported values (NRC, 1998; Pedersen et al.,
2007; Widmer et al., 2007; Baker and Stein, 2009). Likewise, the DE and ME that were
determined for SBM-CV concur with data from Baker and Stein (2009). The reason for the
greater DE, ME, and NE in SBM-CV than in FSBM is most likely that during fermentation of
soybean meal, the oligosaccharides and sucrose are removed. Sucrose is easily digested by pigs
and oligosaccharides are almost completely fermented (Smiricky et al., 2002). If
oligosaccharides and sucrose in soybean meal are removed by enzyme treatment, the
concentration of DE and ME are not affected (Goebel and Stein, 2011), but results of this

60
experiment indicate that fermentation of soybean meal in the presence of Aspergillussubtillis and
Lactobacillus oryzae may have a different impact on the concentration of DE and ME than
enzyme treatment. Removal of sucrose and oligosaccharides from soybean meal results in a
greater concentration of CP, ADF, and NDF, which is the reason the concentration of these
nutrients is greater in FSBM than in SBM-CV. These changes in nutrient concentration in FSBM
compared with SBM-CV were also reported by Cervantes-Pahm and Stein (2010). However,
ADF and NDF are not completely fermented, and a greater concentration of ADF and NDF will
result in reduced values for DE and ME.
The NE values that were calculated for corn and fish meal concur with previous values
(NRC, 1998) and the DE and ME in fish meal that were determined in this experiment also agree
with values reported by NRC (1998). Fish meal has a greater concentration of GE than FSBM
and SBM-CV, which most likely is a result of the greater concentration of AEE in fish meal than
in FSBM and SBM-CV. However, AEE and GE in fish meal are poorly digested, which is the
reason the DE, ME, and NE were less in fish meal than in FSBM. To our knowledge, NE values
have not been previously reported for FSBM, but the fact that the NE in FSBM is greater than in
fish meal indicates that the NE of diets containing FSBM rather than fish meal will not be
compromised.
The greater biological value of the protein in fish meal compared with the other
ingredients indicates that the AA profile of protein in fish meal more closely resembles the
requirements of the pigs than the AA profile of protein in the other ingredients. The biological
value for protein in FSBM indicates that the protein in FSBM has the same value as protein in
SBM-CV, but corn protein has a reduced value compared with protein from the other
ingredients.

61
The fact that the ATTD of DM was not different between SBM-CV and FSBM indicates
that fermentation of soybean meal does not affect DM digestibility. A similar observation was
reported by Goebel and Stein (2011) when soybean meal was enzyme treated.
The ATTD of N in corn was slightly less than the value reported by Widmer et al. (2007),
which may be a result of younger pigs being used in this experiment than in the experiment by
Widmer et al. (2007). The reduced ATTD of N in corn compared with the other ingredients also
is in agreement with Widmer et al. (2007) and may be a result of the reduced concentration of N
in corn compared with the other ingredients because endogenous N output contribute more to the
total output of N in ingredients with a low concentration of N than in ingredients with greater
concentrations of N.
Exp. 2: AA Digestibility
The AA composition of FSBM, SBM-CV, and fish meal were in agreement with values
reported by Hong et al. (2004) and Cervantes-Pahm and Stein (2010) who used FSBM that was
produced in South Korea. The fact that the AID of most indispensable AA is greater in FSBM
than in SBM-CV is in agreement with Yang et al. (2007). The reason for the greater AID of
indispensable AA in FSBM than in SBM-CV may be that during fermentation, the concentration
of small peptides have been reported to increase (Hong et al. (2004) and small peptides may be
better absorbed in the small intestine than AA (Gilbert et al., 2008). However, Cervantes-Pahm
and Stein (2010) did not observe differences in peptide size, AID, or SID of AA between FSBM
and SBM-CV, but the FSBM used by Cervantes-Pahm and Stein (2010) was not produced in the
United States and may have been of a different quality than the product used in this experiment.
In addition, the FSBM that was used in this experiment was fermented in the presence of both
Aspergillus oryzae and Lactobacillus subtillis, whereas the FSBM use in the previous

62
experiments was produced based on only Aspergillus oryzae. Nevertheless, the present data
indicate that AA in FSMB are well digested by young pigs and FSBM may, therefore, be used as
a source of digestible AA in diets fed to weanling pigs. Cervantes-Pahm and Stein (2010)
reported that the SID of Lys in FSBM is less than in SBM-CV, but such an effect was not
observed in this experiment. It is possible that the reason for the low SID of Lys in the
experiment by Cervantes-Pahm and Stein (2010) is that the FSBM used in that experiment was
heat damaged because heat damage of soybean meal will reduce the SID of Lys (Gonzales-Vega
et al., 2011).
The AID and SID of indispensable AA in fish meal that were determined in this
experiment were less than the values reported in previous experiments (NRC, 1998; Urbaityte et
al., 2009; Cervantes-Pahm and Stein, 2010). The reason for this observation may be that the
quality of fish meal that was use in this experiment was reduced compared with that used in
previous experiments because the quality of fish meal may vary due to the species used and to
the type of processing that is used to produce the meal (Wiseman et al., 1991; Kim and Easter,
2001).
Conclusions
Fermentation of soybean meal reduces the concentration of DE, ME, and NE, but
increases the concentration of DM, CP, AEE, NDF, and ADF compared with SBM-CV. The
concentration of DE, ME, and NE are greater in FSBM than in fish meal, but less than in SBM-
CV. The SID of most AA is not different between SBM-CV and FSBM, but these values are
greater than in fish meal. The biological value of protein in fish meal is greater than in FSBM
and SBM-CV, but the biological value of corn protein is less than in fish meal, FSBM, and
SBM-CV.

63
LITERATURE CITED
Adeola, O. 2001.Digestion and balance techniques in pigs. Pages 903-916 in Swine Nutrition.
2nd ed. A. J. Lewis, and L. L. Southern, ed. CRC Press, Washington, DC.
AOAC International. 2007. Official Methods of Analysis of AOAC Int. 18th ed. Rev. 2. W.
Hortwitz and G. W. Latimer, Jr, ed. AOAC Int., Gaithersburg, MD.
AOCS. 2006. Official Methods and Recommended Practices (5th Ed). Association of Oil
Chemists Society. Urbana, IL.
Baker, K. M., and H. H. Stein. 2009. Amino acid digestibility and concentration of digestible and
metabolizable energy in soybean meal produced from high protein or low oligosaccharide
varieties of soybeans and fed to growing pigs. J. Anim. Sci. 87:2282-2290.
Cervantes-Pahm, S. K., and H. H. Stein. 2010. Ileal digestibility of amino acids in conventional,
fermented, and enzyme-treated soybean meal and in soy protein isolate, fish meal, and
casein fed to weanling pigs. J. Anim. Sci. 88:2674-2683.
Dunsford, B. R., D. A. Knabe, and W. E. Haensly. 1989. Effect of dietary soybean meal on the
microscopic anatomy of the small intestine in the early-weaned pig.
J. Anim. Sci. 67:1855-1863.
Ellis, R., E. R. Morris, and C. Philpot. 1977. Quantitative determination of phytate in the
presence of high inorganic phosphate. Anal. Biochem. 77:536-539.
Fenton, T. W., and M. Fenton. 1979. An improved procedure for the determination of chromic
oxide in feeds and feces. Can. J. Anim. Sci. 59:631–634.
Gilbert, E. R., E. A. Wong, and K. E. Webb, Jr. 2008. BOARD INVITED REVIEW: Peptide
absorption and utilization: Implications for animal nutrition and health. J. Anim. Sci.
86:2135-2155.

64
Goebel, K. P., andH. H. Stein. 2011. Phosphorus digestibility and energy concentration of
enzyme-treated and conventional soybean meal fed to weanling pigs. J. Anim. Sci.
89:764-772.
Gonzales-Vega, J. C., B. G. Kim, J. K. Htoo, A. Lemme, and H. H. Stein. 2011. Amino acid
digestibility in heated soybean meal fed to growing pigs. J. Anim. Sci. doi: 10.2527.
Holst, D. O. 1973.Holst filtration apparatus for Van Soest detergent fiber analysis. J. AOAC.
56:1352–1356.
Hong, K. J., C. H. Lee, and S. W. Kim. 2004. Aspergillus oryzae GB-107 fermentation improves
nutritional quality of food soybeans and feed soybeanmeals. J. Med. Food. 7:430-436.
Jones, C. K., J. M. DeRouchey, J. L. Nelssen, M. D. Tokach, S. S. Dritz, and R. D. Goodband.
2010. Effects of fermented soybean meal and specialty animal protein sources on nursery
pig performance.J. Anim. Sci. 88:1725-1732.
Kaankuka, F. G., T. F. Balogun, and T. S. B. Tegbe. 1996. Effects of duration of cooking of full-
fat soya beans on proximate analysis, levels of anti-nutritional factors, and digestibility
by weanling pigs. Anim. Feed Sci. Technol. 62:229-237.
Kim, B. G., G. I. Petersen, R.B. Hinson, G. L. Allee, and H. H. Stein. 2009. Amino acid
digestibility and energy concentration in a novel source of high-protein distillers dried
grainsand their effects on growth performance of pigs. J. Anim. Sci. 87:4013-4021.
Kim, S. W., and R. A. Easter. 2001. Nutritional value of fish meals in the diet for young pigs. J.
Anim. Sci. 79:1829-1839.
Kim, S. W., E. van Heugten, F. Ji, C. H. Lee, and R. D. Mateo. 2010. Fermented soybean meal
as a vegetable protein source for nursery pigs: I. Effects on growth performance of
nursery pigs. J. Anim. Sci. 88:214-224.

65
Kim, Y. G., J. D. Lohakare, J. H. Yun, S. Heo, and B. J. Chae. 2007. Effect of feeding levels of
microbial fermented soy protein on the growth performance, nutrient digestibility and
intestinal morphology in weaned piglets. Asian-australas. J. Anim. Sci. 20:399-404.
Li, D. F., J. L. Nelssen, P. G. Reddy, F. Blecha, R. Klemm, and R. D. Goodband. 1991.
Interrelationship between hypersensitivity to soybean proteins and growth performance in
early-weaned pigs. J. Anim. Sci. 69:4062-4069.
Liu, X., J. Feng, Z. Xu, Y. Lu, and Y. Liu. 2007. The effects of fermented soybean meal on
growth performance and immune characteristics in weaned piglets. Turkish J. Vet. Anim.
Sci. 31:341-345.
Min, B. J., J. W. Hong, O. S. Kwon, W. B. Lee, Y. C. Kim, I. H. Kim, W. T. Chol, and J. H.
Kim. 2004. The effect of feeding processed soy protein on the growth performance and
apparent ileal digestibility in weanling pigs. Asian-australas. J. Anim. Sci. 17:1271-1276.
Noblet, J., H. Fortune, X. S. Shi, and S. Dubois. 1994. Prediction of net energy value of feeds for
growing pigs. J. Anim. Sci. 72:344-354
NRC. 1998. Nutrient requirements of swine. 10th rev. ed. Natl. Acad. Press, Washington, DC.
Pedersen, C., M. G. Boersma, and H. H Stein. 2007. Digestibility of energy and phosphorus in
ten samples of distillers dried grains with solubles fed to growing pigs. J. Anim. Sci.
85:1168-1176.
Sanderson, P. 1986. A new method of analysis of feedingstuffs for the determination of crude
oils and fats. Pages 77-81 in Recent Advances in Animal Nutrition. W. Haresign and D. J.
A. Cole, ed. Butterworths, London, U.K.

66
Smiricky, M.R., C. M. Grieshop, D. M. Albin, J. E. Wubben, V. M. Gabert,and G. C. Fahey, Jr.
2002. The influence of soy oligosaccharides on apparent and true ileal amino acid
digestibilities and fecal consistency in growing pigs.J. Anim. Sci. 80:2433-2441.
Stein, H. H., B. Sève, M. F. Fuller, P. J. Moughan, and C. F. M. de Lange. 2007. Invited review:
Amino acid bioavailability and digestibility in pig feed ingredients: Terminology and
application. J. Anim. Sci. 85:172-180.
Stein, H. H., C. F. Shipley, and R. A. Easter. 1998. Technical Note: A technique for inserting a
T-cannula into the distal ileum of pregnant sows. J. Anim. Sci. 76:1433-1436.
Urbaityte, R., R. Mosenthin, M. Eklund, H. P. Piepho, N. Sauer, and M. Rademacker. 2009.
Standardized ileal crude protein and amino acid digestibilities in protein supplements for
piglets. Arch. Anim. Nutr. 63:359–378.
Widmer, M. R., L. M. McGinnis, and H. H. Stein. 2007. Energy, phosphorus, and amino acid
digestibility of high-protein distillers dried grains and corn germ fed to growing pigs. J.
Anim. Sci. 85:2994-3003.
Wiseman, J., S. Jaggert, D. J. A. Cole, and W. Haresign. 1991. The digestion and utilization of
amino acids of heat-treated fish meal by growing finishing pigs. Anim. Prod. 53:215-225.
Yang, Y. X., Y. G. Kim, J. D. Lohakare, J. H. Yun, J. K. Lee, M. S. Kwon, J. L. Park, J. Y.
Choi, and B. J. Chae. 2007. Comparative efficacy of different soy protein sources on
growth performance, nutrient digestibility and intestinal morphology in weaned pigs.
Asian-australas. J. Anim. Sci. 20:775-783.

67
Table 4.1. Analyzed nutrient composition of fermented soybean meal (FSBM), conventional
soybean meal (SBM-CV), fish meal, and corn, as-fed basis
Ingredient
Item FSBM SBM-CV Fish meal Corn
GE, kcal/kg 4,533 4,281 4,589 3,938
DM, % 91.0 89.39 91.80 87.04
CP, % 53.91 50.20 63.98 7.44
Ca, % 0.27 0.23 4.96 0.01
P, % 0.83 0.69 3.05 0.24
Ash, % 7.10 5.85 17.86 1.20
AEE1, % 1.50 1.39 9.33 2.20
NDF, % 8.45 5.40 - 6.56
ADF, % 4.97 3.42 - 1.76
TIU2 / mg/kg < 1.00 4.20 - -
Starch, % 0.90 0.61 - 55.77
Carbohydrates, %
Glucose 0.33 0.00 - -
Sucrose 0.00 8.77 - -
Maltose 0.00 0.20 - -
Fructose 0.54 0.00 - -

68
Table 4.1 (cont.)
Stachyose 0.06 6.23 - -
Raffinose 0.00 1.29 - -
Indispensable, AA %
Arg 3.59 3.61 3.58 0.33
His 1.34 1.33 1.41 0.19
Ile 2.45 2.35 2.54 0.24
Leu 4.11 3.79 4.17 0.75
Lys 3.15 3.17 4.76 0.24
Met 0.73 0.69 1.66 0.14
Phe 2.64 2.46 2.35 0.31
Thr 2.00 1.85 2.34 0.23
Trp 0.71 0.66 0.59 0.05
Val 2.60 2.50 3.03 0.33
Dispensable, AA %
Ala 2.26 2.12 3.71 0.46
Asp 5.82 5.37 5.32 0.44
Cys 0.82 0.66 0.49 0.15
Glu 9.31 8.69 7.72 1.14
Gly 2.24 2.06 4.13 0.28
Pro 2.87 2.41 2.91 0.56
Ser 2.33 2.12 2.03 0.27
Tyr 1.89 1.71 1.82 0.20

69
Table 4.1 (cont.)
Total AA 50.86 47.55 54.56 6.31
1AEE = acid hydrolyzed ether extract.
2TIU = trypsin inhibitor units.

70
Table 4.2. Composition of experimental diets containing corn, fermented soybean meal (FSBM),
conventional soybean meal (SBM-CV), or fish meal, as-fed basis, Exp. 1
Item
Diet
Corn FSBM SBM-CV Fish meal
Ingredients, %
Ground corn 96.40 69.30 65.20 75.30
FSBM - 28.00 - -
SBM-CV - - 31.00 -
Fish meal - - - 24.00
Monocalcium phosphate 1.70 - 2.00 -
Ground limestone 1.20 2.00 1.10 -
Sodium chloride 0.40 0.40 0.40 0.40
Vitamin mineral premix1 0.30 0.30 0.30 0.30
Total 100.00 100.00 100.00 100.00
Analyzed composition
GE, kcal/kg 3,740 3,932 3,931 3,926
DM, % 86.86 89.80 88.30 88.53

71
Table 4.2 (cont.)
CP, % 6.87 20.49 20.30 21.30
ADF, % 1.86 3.02 2.67 2.04
NDF, % 9.92 11.49 9.92 15.59
AEE2, % 1.16 2.55 2.17 2.58
Ash, % 3.44 5.06 7.03 6.09
Starch, % 56.11 40.97 39.75 46.06
1Provided the following quantities of vitamins and micro minerals per kilogram of
complete diet: Vitamin A as retinyl acetate, 11,128 IU; vitamin D3 as cholecalciferol, 2,204 IU;
vitamin E as DL-alpha tocopheryl acetate, 66 IU; vitamin K as menadione nicotinamide bisulfite,
1.42 mg; thiamin as thiamine mononitrate, 0.24 mg; riboflavin, 6.58 mg; pyridoxine as
pyridoxine hydrochloride, 0.24 mg; vitamin B12, 0.03 mg; D-pantothenic acid as D-calcium
pantothenate, 23.5 mg; niacin as nicotinamide and nicotinic acid, 44 mg; folic acid, 1.58 mg;
biotin, 0.44 mg; Cu, 10 mg as copper sulfate; Fe, 125 mg as iron sulfate; I, 1.26 mg as potassium
iodate; Mn, 60 mg as manganese sulfate; Se, 0.3 mg as sodium selenite; and Zn, 100 mg as zinc
oxide.
2AEE = acid hydrolyzed ether extract.

72
Table 4.3. Composition of experimental diets, as-fed basis, Exp. 2
Diet1
ItemFSBM SBM-CV Fish meal N-free1
Ingredient, %
FSBM 30.00 - - -
SBM-CV - 33.00 - -
Fish meal - - 25.00 -
Soybean oil 3.00 3.00 - 4.00
Solka floc - - - 4.00
Monocalcium phosphate 1.30 1.30 - 2.40
Ground limestone 1.30 1.30 - 0.50
Sucrose 20.00 20.00 20.00 20.00
Chromic oxide 0.40 0.40 0.40 0.40
Cornstarch 43.30 40.30 53.90 67.50
Magnesium oxide - - - 0.10
Potassium carbonate - - - 0.40
Sodium chloride 0.40 0.40 0.40 0.40
Vitamin mineral premix 2 0.30 0.30 0.30 0.30
Total 100.00 100.00 100.00 100.00
1FSBM = fermented soybean meal; SBM-CV = conventional soybean meal.

73
2Provided the following quantities of vitamins and micro minerals per kilogram of
complete diet: Vitamin A as retinyl acetate, 11,128 IU; vitamin D3 as cholecalciferol, 2,204 IU;
vitamin E as DL-alpha tocopheryl acetate, 66 IU; vitamin K as menadione nicotinamide bisulfite,
1.42 mg; thiamin as thiamine mononitrate, 0.24 mg; riboflavin, 6.58 mg; pyridoxine as
pyridoxine hydrochloride, 0.24 mg; vitamin B12, 0.03 mg; D-pantothenic acid as D-calcium
pantothenate, 23.5 mg; niacin as nicotinamide and nicotinic acid, 44 mg; folic acid, 1.58 mg;
biotin, 0.44 mg; Cu, 10 mg as copper sulfate; Fe, 125 mg as iron sulfate; I, 1.26 mg as potassium
iodate; Mn, 60 mg as manganese sulfate; Se, 0.3 mg as sodium selenite; and Zn, 100 mg as zinc
oxide.

74
Table 4.4. Analyzed nutrient composition of experimental diets, as-fed basis, Exp. 2
Diet1
ItemFSBM SBM-CV Fish meal N free
GE, kcal/kg 4,034 3,937 3,857 3,788
Ash, % 5.90 4.16 6.76 3.87
DM, % 94.42 93.96 93.96 94.34
CP, % 15.43 12.07 16.91 0.32
ADF, % 1.75 1.73 0.28 3.19
NDF, % 3.70 2.60 5.44 2.84
AEE2, % 2.44 2.39 2.46 1.54
Indispensable, AA %
Arg 1.12 0.91 0.85 0.01
His 0.45 0.35 0.37 -
Ile 0.79 0.60 0.64 0.02
Leu 1.32 0.98 1.08 0.03
Lys 1.00 0.82 1.18 0.01
Met 0.24 0.18 0.41 -
Phe 0.83 0.63 0.58 0.01
Thr 0.65 0.49 0.60 0.01
Trp 0.22 0.19 0.16 < 0.04

75
Table 4.4 (cont.)
Val 0.84 0.60 0.74 0.01
Dispensable, AA %
Ala 0.75 0.55 0.74 0.02
Asp 1.82 1.38 1.30 0.02
Cys 0.23 0.17 0.12 0.01
Glu 2.96 2.27 1.93 0.03
Gly 0.73 0.54 1.03 0.01
Pro 0.84 0.63 0.67 0.02
Ser 0.76 0.55 0.50 0.01
Tyr 0.52 0.39 0.36 0.01
Total AA 16.07 12.23 13.46 0.25
1FSBM = fermented soybean meal; SBM-CV = conventional soybean meal.
2AEE = acid hydrolyzed ether extract.

76
Table 4.5. Concentration of digestible and metabolizable energy, daily energy and nitrogen balance, and apparent total tract
digestibility (ATTD) of energy, DM, and nutrients in experimental diets containing corn, fermented soybean meal (FSBM),
conventional soybean meal (SBM-CV), or fish meal, as-fed basis, Exp. 11
Item Corn FSBM SBM-CV Fish meal SEM P-value
GE intake, kcal 3,266b 3,623a 3,755a 3,664a 122.2 < 0.01
GE in feces, kcal 374.5b 418.0ab 403.4b 464.8a 23.3 0.02
GE in urine, kcal 96.5b 192.6a 181.0a 168.8a 18.1 < 0.01
DE in diet kcal/kg 3,315c 3,478ab 3,504a 3,433b 16.6 < 0.01
ME in diet kcal/kg 3,204b 3,267a 3,314a 3,255ab 21.4 < 0.01
NE in diet kcal/kg 2,373c 2,453ab 2,481a 2,432b 13.2 < 0.01
N intake, g 6.0c 18.9b 19.4ab 19.8a 0.5 < 0.01
N in feces, g 1.4b 2.3a 2.2a 2.4a 0.1 < 0.01
N in urine, g 3.0b 7.1a 6.8a 5.9a 0.6 < 0.01
ATTDof GE, % 88.6a 88.4ab 89.2a 87.3b 0.4 0.02
ATTD of DM, % 89.1a 88.4ab 89.2a 87.3b 0.5 0.02
ATTD of N, % 76.0b 87.8a 88.5a 87.9a 1.0 < 0.01

77
Table 4.5 (cont.)
ATTD of AEE2, % 28.5c 48.6a 40.6b 37.9b 2.5 < 0.01
ATTD of ash, % 60.3c 64.6b 72.9a 62.5bc 1.2 < 0.01
a-dMeans within a row lacking a common superscript letter differ (P< 0.05).
1Data are means of 9 observations per treatment.
2AEE = acid hydrolyzed ether extract.

78
Table 4.6. Concentration of digestible and metabolizable energy, daily energy and nitrogen balance, and apparent total tract
digestibility (ATTD) of energy, DM, and nutrients in corn, fermented soybean meal (FSBM), conventional soybean meal (SBM-CV),
and fish meal, as-fed basis, Exp. 11
Item Corn FSBM SBM-CV Fish meal SEM P-value
GE intake, kcal 3,388a 1,275c 1,546b 1,112d 124.3 < 0.01
GE in feces, kcal 388.5a 148.8b 150.1b 172.2b 23.8 < 0.01
GE in urine, kcal 100.1 123.3 115.8 93.5 18.1 0.63
DE, kcal/kg 3,439c 3,910b 4,069a 3,513c 48.9 < 0.01
DE, kcal/kg DM 3,951c 4,296b 4,553a 3,827c 52.2 < 0.01
ME, kcal/kg 3,324bc 3,441b 3,698a 3,132c 73.6 < 0.01
ME, kcal/kg DM 3,819b 3,781b 4,137a 3,412c 80.9 < 0.01
NE, kcal/kg 2,469c 2,666b 2,832a 2,394c 42.0 < 0.01
NE, kcal/kg DM 2,864b 2,951b 3,193a 2,626c 46.1 < 0.01
N intake, g 6.2c 14.5b 15.3a 15.1a 0.5 < 0.01
N in feces, g 1.5 1.3 1.2 1.3 0.1 0.37
N in urine, g 3.1 5.0 4.7 3.5 0.6 0.09

79
Table 4.6 (cont.)
N retention, g 1.6c 8.3b 9.4ab 10.3a 0.5 < 0.01
Biological value, % 34.8c 62.8b 67.1ab 75.4a 4.3 < 0.01
ATTD of GE, % 88.6a 88.2a 90.3a 84.0b 1.1 < 0.01
ATTD of DM, % 89.1a 86.9a 89.5a 81.6b 1.3 < 0.01
ATTD of N, % 76.0b 91.3a 91.8a 91.6a 1.0 < 0.01
ATTD of AEE2, % 28.5c 71.9a 56.9b 49.9b 4.7 < 0.01
ATTD of ash, % 60.3c 68.3b 78.7a 64.3bc 1.8 < 0.01
a-dMeans within a row lacking a common superscript letter differ (P< 0.05).
1Data are means of 9 observations per treatment.
2AEE = acid hydrolyzed ether extract.

80
Table 4.7. Apparent ileal digestibility (AID) and standardized ileal digestibility (SID) of CP and AA in fermented soybean meal
(FSBM), conventional soybean meal (SBM-CV), and fish meal by weanling pigs, Exp. 21
AID SID2
Ingredient Ingredient
Item FSBM SBM-CV Fish meal SEM P-value FSBM SBM-CV Fish meal SEM P-value
CP, % 64.5 59.7 61.9 2.7 0.50 79.9 79.6 76.1 2.7 0.54
Indispensable AA, %
Arg 87.6a 86.1a 77.4b 1.2 < 0.01 94.2a 94.2a 86.1b 1.2 < 0.01
His 83.6a 81.9a 75.4b 1.2 < 0.01 89.3a 89.1a 82.3b 1.2 0.01
Ile 82.1a 77.7b 75.1b 1.2 < 0.01 87.5a 84.7ab 81.7b 1.2 < 0.01
Leu 82.1a 76.8b 75.5b 1.2 < 0.01 87.6a 84.3ab 82.2b 1.2 0.02
Lys 76.2 77.0 76.0 1.3 0.86 82.2 84.2 81.1 1.3 0.24
Met 85.6a 79.2b 79.9b 1.4 < 0.01 90.6a 85.7b 82.8b 1.4 < 0.01
Phe 83.4a 78.9b 72.3c 1.2 < 0.01 88.6a 85.8a 79.7b 1.2 < 0.01
Thr 72.0a 64.5b 66.7b 1.6 0.01 83.4 79.6 79.0 1.6 0.14

81
Table 4.7 (cont.)
Trp 82.7a 81.9a 77.7b 1.3 0.02 89.4 89.6 86.8 1.3 0.25
Val 77.7a 69.4b 69.4b 1.5 < 0.01 85.6a 80.5b 78.4b 1.5 < 0.01
Mean 81.1a 77.4b 74.4b 1.2 < 0.01 87.6a 85.8a 81.7b 1.2 < 0.01
Dispensable AA, %
Ala 71.6a 61.5b 66.6a 1.9 < 0.01 81.9a 75.5b 74.8b 1.9 0.02
Asp 81.5a 77.5b 65.5c 1.5 < 0.01 86.6a 84.3a 72.8b 1.5 < 0.01
Cys 64.4a 64.7a 46.4b 2.5 < 0.01 75.2a 79.2a 67.0b 2.5 < 0.01
Glu 77.0b 82.9a 74.1b 1.6 < 0.01 81.3b 88.5a 80.7b 1.6 0.01
Gly 47.1 38.8 47.5 5.4 0.40 77.7 80.1 69.2 5.4 0.29
Pro 3.1 -36.1 -50.2 26.3 0.18 100.1 93.0 71.3 26.3 0.57
Ser 80.3a 74.2b 64.5c 1.6 < 0.01 88.4a 85.3a 76.7b 1.6 < 0.01
Tyr 82.1a 77.4b 71.6c 1.2 < 0.01 88.4a 85.8a 80.7b 1.2 < 0.01
Mean 68.0a 63.1a 54.0b 3.5 0.02 85.0a 85.6a 75.2b 3.5 0.05
All AA 74.1a 69.8ab 64.0b 2.2 0.01 86.2a 85.7a 78.4b 2.2 0.03
a-cMeans within a row lacking a common superscript letter differ (P< 0.05).

82
1Data are least squares means of 8 observations.
2Values for SID were calculated by correcting the values for AID for basal ileal endogenous losses. Basal ileal endogenous
losses were determined (g/kg of DMI) as CP, 25.55; Arg, 0.78; His, 0.27; Ile, 0.45; Leu, 0.78; Lys, 0.64; Met, 0.13; Phe, 0.46; Thr,
0.79; Trp, 0.16; Val, 0.71; Ala, 0.82.

83
CHAPTER 5
EFFECTS OF REPLACING FISH MEAL, CHICKEN MEAL, OR POULTRY BY-
PRODUCT MEAL WITH FERMENTED SOYBEAN MEAL IN PHASE 1, PHASE 2,
AND PHASE 3 DIETS FED TO WEANLING PIGS
ABSTRACT
Three experiments were conducted to test the hypothesis that fermented soybean meal (FSBM),
may replace fish meal, chicken meal (CM), or poultry by-product meal (PBM) in diets fed to
weanling pigs during the initial 28 d post-weaning. In all experiments, newly weaned pigs (21 d)
were randomly allotted to a randomized complete block design. In Exp. 1, 192 pigs (initial BW:
6.88 ± 2.48 kg) were allotted to 4 dietary treatments with 2 phases (14 and 12 d, respectively). In
phase 1, a positive control diet contained fish meal, whey powder, and protein plasma. A
negative control diet (without animal protein) and 2 additional diets in which FSBM replaced
fish meal or fish meal and protein plasma were also formulated. In phase 2 diets, a positive
control, a negative control diet, and 2 diets in which FSBM replaced fish meal or fish meal and
whey powder were formulated. In Exp. 2, 175 pigs (initial BW: 6.86 ± 2.86 kg) were allotted to
5 dietary treatments with 3 phases (7, 7, and 14 d, respectively). The positive control diet
contained fish meal, whey powder, and protein plasma in phase 1 and 2, and fish meal and whey
powder in phase 3, but no animal ingredients were included in the negative control diets. Three
additional diets were formulated within each phase in which FSBM replaced fish meal, fish meal
and protein plasma, or fish meal, protein plasma, and whey powder. In Exp. 3, 175 pigs (initial
BW: 6.97 ± 2.1 kg) were allotted to 5 dietary treatments with 3 phases (7, 7, and 14 d,
respectively). Three positive control diets contained fish meal, CM, or PBM whereas none of

84
these ingredients were included in the negative control diets. An additional diet in which fish
meal, CM, or PBM was replaced by FSBM was also formulated. The final BW of the pigs in
each experiment was not different among treatments. Likewise, the G:F ratio for the overall
experiment were not difference among treatments in Exp. 1 and Exp. 2. However, in Exp. 3, G:F
was greater for pigs fed the fish meal diets than for pigs on the other treatments, but it was not
different among pigs fed CM, PBM, or FSBM. In conclusion, FSBM may replace FM, CM, and
PBM in diets fed to pigs during the initial 28 d post-weaning without affecting pig growth
performance except that G:F may be reduced.
Key Words: chicken meal, fermented soybean meal, fish meal, pig, poultry by-product meal.
INTRODUCTION
Use of conventional soybean meal (SBM-CV) as the sole source of AA in weanling pig
diets is not recommended because SBM-CV contains anti-nutritional factors such as
oligosaccharides and antigens (Li et al., 1991; Jezierny et al., 2010). Antigens may produce
transient hypersensitivity in the small intestine, which affects the digestion and absorption of
nutrients (Li et al., 1991).
Instead of SBM-CV, animal proteins such as fish meal, chicken meal (CM), and poultry
by-product meal (PBM) are usually used as AA sources in diets for weanling pigs because these
ingredients have a high digestibility of nutrients and are free of anti-nutritional factors (Kim and
Easter, 2001; Pierce et al., 2005). However, production of fermented soybean meal (FSBM) was
recently initiated in the US. During fermentation, most of the oligosaccharides and the antigens
are removed (Cervantes-Pahm and Stein, 2010), and it is, therefore, believed that FSBM is

85
tolerated by weanling pigs. The digestibility of P, AA, and energy in US-produced FSBM has
been reported (Rojas and Stein, 2012a; b).
Between 3 and 9% of FSBM may be used in weanling pig diets to replace dried skim
milk powder and protein plasma (Kim et al., 2010), and 1.5 to 3.75% of FSBM in combination
with dried porcine solubles may replace fish meal in diets fed to pigs from d 7 to 21 post-
weaning (Jones et al., 2010). However, it is not known if FSBM can replace CM and PBM and
there are no data on inclusion of more than 10%FSBM in diets fed to weanling pigs. There are
also no data on effects of replacing fish meal, CM, or PBM by FSBM during the initial 7 d post-
weaning. Therefore, the objectives of these experiments were to test the hypothesis that FSBM
can replace all animal proteins in diets fed to weanling pigs during the initial 28 d post-weaning.
MATERIALS AND METHODS
Three experiments were conducted, and the Institutional Animal Care and Use
Committee at the University of Illinois reviewed and approved the protocols for all experiments.
Pigs used in the experiments were the offspring of G-performer boars mated to F-25 gilts
(Genetiporc, Alexandria, MN). Pigs were weaned at approximately 21 d of age. Ingredients used
in the experiments included FSBM, SBM-CV, fish meal, whey powder, protein plasma, CM, and
PBM (Table 1). The FSBM (PepSoyGen®) was sourced from Nutra Ferma, Sioux City, SD, and
is produced by fermentation of SBM in the presence of Aspergillus oryzae and Lactobacillus
subtilis. The SBM-CV that was used was sourced locally (Solae, Gibson City, IL). The fish meal
was prepared from menhaden fish (Menhaden Select, Omega Protein, Houston, TX). Chicken
meal and PBM were prepared from rendered parts of chickens (The Scoular Company,
Minneapolis, MN).

86
In all 3 experiments, pigs were housed in 1.2 x 1.4 m pens that have fully slatted floors. A
feeder and a nipple drinker were provided in each pen. Feed and water were provided on an ad
libitum basis throughout the experiment.
Corn was the only source of cereal grain that was used in all diets used in the 3
experiments. In Exp. 1, diets were formulated to contain 1.35 and 1.25% standardized ileal
digestible Lys in phase 1 and phase 2, respectively. In Exp. 2 and 3, diets were formulated to
contain 1.40, 1.35, and 1.25% standardized ileal digestible Lys in phase 1, phase 2, and phase 3,
respectively. All other AA were included in the diets according to the ideal protein concept
(Baker, 1997).
Exp. 1: Fermented Soybean Meal in Phase 1 and Phase 2 Diets
Experiment 1 was designed to test the hypothesis that FSBM can replace fish meal in
phase 1 and phase 2 diets fed to weanling pigs during the initial 26 d post-weaning without
negatively impacting growth performance. A total of 192 weaned pigs with an average initial
BW of 6.88 ± 2.48 kg were used. On the day of weaning, pigs were randomly allotted to 4
dietary treatments in a randomized complete block design based on BW and sex. Phase 1 diets
were fed for 14 d and phase 2 diets were provided during the following 12 d. There were 6 pigs
per pen and 8 replicate pens per treatment. Four phase 1 diets were formulated (Tables 2 and 3).
The positive control diet contained 8% fish meal, 15% whey powder, and 3.5% protein plasma,
but in the negative control diet, fish meal and protein plasma were replaced by corn and SBM-
CV. Two additional diets in which FSBM replaced fish meal (FSBM-Low) or fish meal and
protein plasma (FSBM-High) were also formulated. In the phase 2 diets the positive control diet
contained 8% fish meal and 5% whey powder, but fish meal and whey powder were replaced by

87
corn and SBM-CV in the negative control diet, and FSBM replaced fish meal or fish meal and
whey powder in the FSBM-Low and the FSBM-High diets, respectively.
Diets and ingredients were analyzed for GE using bomb calorimetry (Model 6300 Parr
Instruments, Moline, IL), DM (method 930.15; AOAC Int., 2007), CP by combustion (method
999.03; AOAC Int., 2007) using a Rapid N cube (Elementar Americas Inc, Mt Laurel, NJ), ADF
(method 973.18; AOAC Int., 2007), and NDF (Holst, 1973). Ash (method 975.03; AOAC Int.,
2007) was also analyzed in the ingredients. Phosphorus and Ca were analyzed in all diets and
ingredients by the inductively coupled plasma spectroscopy procedure (method 975.03; AOAC
Int., 2007) after wet ash sample preparation (method 975.03; AOAC Int., 2007). Total fat
concentration was measured in ingredients by acid hydrolysis using 3N HCl (Sanderson, 1986)
followed by crude fat extraction using petroleum ether (method 2003.06, AOAC Int., 2007) on a
Soxtec 2050 automated analyzer (FOSS North America, Eden Prairie, MN) and AA were
analyzed in all samples of diets and ingredients (method 982.30 E [a, b, c]; AOAC Int., 2007).All
diets and ingredients were ground through a 1-mm screen in a Wiley mill (model 4; Thomas
Scientific, Swedesboro, NJ) before analysis. All samples were analyzed in duplicate.
Individual pig BW was recorded at the start of the experiment, on d 14, and at the
conclusion of the experiment. Daily feed allotments were recorded as well and feed left in the
feeders was recorded on the same days as pigs were weighed. At the conclusion of the
experiment, data were summarized to calculate ADG, ADFI, and G:F for each pen and treatment
group. Data were analyzed using the MIXED Procedure (SAS Institute Inc., Cary, NC).
Homogeneity of the variances among treatments was confirmed using the UNIVARIATE
procedure and this procedure was also used to identify outliers, but no outliers were observed.
Diet was the fixed effect and replicate was the random effect. The LS Means statement was used

88
to calculate treatment means and the PDIFF option was used to separate means if differences
were detected. The pen was the experimental unit for all calculations and anα-level of 0.05 was
used to assess significance among means.
Exp. 2: Fermented Soybean Meal in Phase 1, Phase 2, and Phase 3 Diets
Experiment 2 was designed to test the hypothesis that FSBM can replace fish meal, whey
powder, and protein plasma in phase 1, phase 2, and phase 3 diets fed to weanling pigs without
negatively impacting growth performance. A total of 175 pigs with an initial BW of 6.86 ± 2.86
kg were used. On the day of weaning, pigs were randomly allotted to 5 dietary treatments as
described for Exp. 1. Phase 1, phase 2, and phase 3 diets were fed for 7, 7, and 14 d post-
weaning, respectively. There were 5 pigs per pen and 7 replicate pens per treatment. Five phase 1
diets and 5 phase 2 diets were formulated (Tables 4 and 5). The positive control diets contained
fish meal, whey powder, and protein plasma. In the negative control diets, all whey powder, fish
meal, and protein plasma were replaced by corn and SBM-CV. Three additional diets in which
FSBM replaced fish meal (FSBM-Low), fish meal and protein plasma (FSBM-Medium), or fish
meal, protein plasma, and whey powder (FSBM-High), respectively, were also formulated within
each phase. In phase 3 diets (Tables 6 and 7), the positive control diet contained fish meal and
whey powder, whereas those ingredients were not included in the negative control diet.
Fermented soybean meal replaced whey powder in the diet fed to FSBM-Low and FSBM-
Medium treatments, but FSBM replaced both fish meal and whey powder in the diet fed to
FSBM-High pigs. All diets and ingredients were ground as explained for Exp. 1 before chemical
analysis and analyzed as described for Exp. 1.

89
Individual pig BW was recorded at the start of the experiment and on d 7, 14, and 28
post-weaning. Daily feed allotments were recorded as described for Exp. 1 and data were
summarized and analyzed as described for Exp. 1.
Exp. 3: Fermented Soybean Meal, Chicken Meal, or Poultry By-product Meal in Phase 1,
Phase 2, and Phase 3 Diets
Experiment 3 was designed to test the hypothesis that FSBM can replace CM, PBM, or
fish meal in phase 1, phase 2, and phase 3 diets fed to weanling pigs without negatively
impacting growth performance. A total of 175 pigs with an initial BW of 6.97 ± 2.1 kg were
used. On the d of weaning, pigs were randomly allotted to 5 treatment groups that were fed a 3-
phase feeding program as explained for Exp. 2. There were 5 pigs per pen and 7 replicate pens
per treatment. Five phase 1 diets were formulated (Tables 8 and 9). Three of these diets
contained fish meal, CM, or PBM, and 15% whey powder and 3% protein plasma, but the
negative control diet did not contain any ingredients of animal origin. The last diet was
formulated by using 10% FSBM in addition to whey powder and protein plasma, but no fish
meal, CM, or PBM. Phase 2 and phase 3 diets were formulated as the phase 1 diets with the
exception that no protein plasma was used in these diets and whey powder was included by only
10 and 5% in phase 2 and phase 3 diets, respectively (Tables 10 and 11). All diets and
ingredients were ground and analyzed as explained for Exp. 1. Individual pig BW and daily feed
allotments were also recorded as described for Exp. 2, and data were summarized and analyzed
as described for Exp. 1.

90
RESULTS
Exp. 1: Fermented Soybean Meal in Phase 1 and Phase 2
The initial and final BW was not different among treatments (Table 12). However, the
BW at the end of phase 1 was greater (P < 0.01) in pigs fed the PC or FSBM-Low diets than for
pigs fed the FSBM-High diet, but no difference was observed between pigs fed the FSBM-High
or the NC diets. The ADG in phase 1 was greater (P < 0.05) for pigs fed the FSBM-Low diet diet
than for pigs fed the NC or FSBM-High diets, but no difference was observed between pigs fed
the NC and the FSBM-High diets. However, during phase 2 and for the overall experiment, ADG
was not different among treatments. The ADFI was not different during phase 1, phase 2, or the
overall experiment among diets. However, during phase 1, ADFI tended to be greater (P = 0.08)
for pigs fed the FSBM-Low diet than for pigs fed the other diets. The G:F ratio was not different
among treatments during phase 1 or for the overall experiment, but the G:F ratio during phase 2
was less (P < 0.01) for pigs fed the FSBM-Low diet than for pigs fed PC or FSBM-High diets.
Exp. 2: Fermented Soybean Meal in Phase 1, Phase 2, and Phase 3 Diets
The initial BW was not different among treatments (Table 13), but the BW at the end of
phase 1 was greater (P < 0.01) for pigs fed the PC or FSBM-Low diets than for pigs fed the NC,
FSBM-Medium, or FSBM-High diets. Pigs fed the FSBM-High diet had less (P < 0.01) BW than
pigs fed the PC and FSBM-Low diets at the end of each phase, but the BW for pigs fed the
FSBM-Medium diet was not different from that of pigs on any of the other treatments. The ADG
during phase 1 was greater (P< 0.01) for pigs fed the PC or FSBM-Low diets than for pigs fed
the other diets, but during phase 2 and phase 3, ADG was not different among treatments.
However, ADG for the overall experiment was greater (P < 0.01) for pigs fed the PC diets than
for pigs fed the NC or the FSBM-High diets, but there was no difference among pigs fed PC,

91
FSBM-Low, or FSBM-Medium diets. The ADFI during phase 1 was greater (P< 0.01) for pigs
fed PC or FSBM-Low diets than for pigs fed the other diets, but for phase 2, phase 3, and the
overall experimental period, no difference among treatments were observed for ADFI. The G:F
ratio during phase 1 was not different among pigs fed the PC or FSBM-Low diets. However, pigs
fed the NC, FSBM-Medium, and FSBM-High diets had negative values for G:F, and, therefore,
these treatments were not included in the statistical analysis for G:F during phase 1. The G:F was
not different among diets fed to pigs during phase 2, phase 3, or for the overall experimental
period, but in phase 3 there was a tendency (P = 0.08) for pigs fed the FSBM-Low diet to have
less G:F than pigs fed the other experimental diets.
Exp. 3: Fermented Soybean Meal, Chicken Meal, or Poultry By-product Meal in Phase 1,
Phase 2, and Phase 3 Diets
The initial BW was not different among treatments (Table 14). Likewise, the BW at the
end of phase 1 and at the end of phase 3 were not different among treatments although pigs fed
the PC diet tended (P = 0.08) to be heavier at the end of phase 3 than pigs fed the NC diets.
However, the BW at the end of phase 2 was less (P < 0.01) for pigs fed the NC diet than for pigs
fed the other diets. The ADG during phase 1 and phase 3 were not different among treatments.
However, during phase 2, ADG was less (P < 0.01) for pigs fed the NC diet than for pigs fed the
other diets, but no differences were observed among the other diets. For the entire experiment,
there was a tendency (P = 0.07) for ADG to be greater for pigs fed the PC diet than for pigs fed
the NC diet. The ADFI for all phases and for the overall experiment was not different among
diets. The G:F ratio was not different among treatments during phase 1 and phase 3. However,
G:F was less (P < 0.01) during phase 2 for pigs fed the NC diet than for pigs fed the other diets,

92
but no differences among the other diets were observed. The G:F ratio for the overall experiment
was greater (P < 0.05) for pigs fed the PC diets than for pigs fed the other diets.
DISCUSSION
In Exp. 1, pigs fed either low or high levels of FSBM in the diets had a BW at the end of
the experiment that was not different from that of pigs fed the positive control diet. This
observation is in agreement with Jones et al., 2010, who reported that fish meal may be replaced
by 6% FSBM in a diet fed from 7 d to 28 d post-weaning. The FSBM-High diet was formulated
to replace fish meal and protein plasma by FSBM, and results indicated that high levels of FSBM
may replace fish meal. The fact that ADG during phase 1 was greater for pigs fed the FSBM-
Low diet than for pigs fed the NC and FSBM-High diets indicate that FSBM can replace fish
meal and SBM-CV in diets fed to weanling pigs, but it cannot replace whey powder or plasma
protein. The reason for this observation is most likely that whey powder provides both lactose
and AA to the diet, but no lactose is provided by FSBM. Weanling pigs easily digest lactose and
inclusion of 15 to 30% lactose during the initial weeks post-weaning usually results in improved
performance (Mahan et al., 1993; Tang et al., 1999; Mahan et al., 2004; Kim et al., 2010).
Protein plasma is an ingredient that is used not only to supply AA to the diet; it also contains
immunoglobulins that may enhance the immune system of newly weaned pigs, which may result
in a reduction in post-weaning diarrhea (Van Dijk et al., 2001). It is, therefore, likely that when
FSBM replaced whey powder and protein plasma, pigs did not get sufficient quantities of lactose
and immunoglobulins, which was the reason for the reduction in performance for the FSBM fed
pigs.

93
During the first week post-weaning pigs experience many changes (Pluske et al., 1997)
and usually pigs during this phase have low ADG and ADFI. Therefore, the main objective
during the first week post-weaning is to avoid loss of BW and to stimulate feed intake. In the
second experiment, results indicated that FSBM may replace fish meal without negatively
impacting pig growth performance. In agreement with the results of Exp. 1, it was not possible to
replace whey powder and protein plasma during the first week post-weaning without negatively
impacting pig growth performance. However, the fact that ADG and ADFI were not different
among treatments in the second week post-weaning indicates that FSBM may replace whey
powder in diets after 1 week post-weaning. The reason for this observation is most likely that
lactase activity in the small intestine starts decreasing at 3 d after weaning and continues to
decrease as pigs get older (Tang et al., 1999). Kim et al. (2007) and Jones et al. (2010) reported
that increasing levels of FSBM improved G:F and ADG. However, results from Exp. 1 and 2
indicated that increasing the concentration of FSBM beyond 9 and 15% during the first and the
second week post-weaning, respectively, tend to decrease ADFI, ADG, and G:F.
Overall, the results of Exp. 1 and 2 indicated that whey powder and protein plasma
improved growth performance of weanling pigs and that these ingredients cannot be replace by
FSBM. In Exp. 3, therefore, the inclusions of whey powder and protein plasma were kept
constant among treatments and only effects of replacing fish meal, CM, and PBM with FSBM
were evaluated. As was the case in Exp. 1 and 2, it was possible to replace fish meal with FSBM
without impacting ADG and ADFI, but unlike the situation in Exp. 1 and 2, G:F was slightly less
for pigs fed FSBM compared with pigs fed fish meal. We do not have an explanation for this
observation. It was previously reported that CM and PBM may replace fish meal during the first
28 d after weaning (Keegan et al., 2004; Zier et al., 2004). However, Keegan et al. (2004)

94
reported that pigs fed CM with high levels of ash had a reduction in G:F compared with pigs fed
CM with low levels of ash. In the present experiment, we only had 1 source of CM, and the ash
value was close to the ash value reported by Keegan et al. (2004) for CM with low levels of ash.
Likewise, the ash in PBM used in this experiment is close to the value of ash for CM with high
ash reported by Keegan et al. (2004). We did not observe any difference in ADG, ADFI, or G:F
between CM and PBM. However, the fact that the final BW at the end of the experiment was not
different among treatments indicates that FSBM can replace not only fish meal, but also CM and
PBM in diets fed to weanling pigs. We are not aware of any previous data that have
demonstrated this effect.
In conclusion, FSBM may replace FM, CM, and PBM in diets fed to pigs during the
initial 28 d post-weaning without affecting pig growth performance except that G:F may be
reduced. However, FSBM cannot replace protein plasma and whey powder during the first week
after weaning without negatively impacting pig growth performance, but during the second and
third week after weaning, it is possible to use FSBM rather than protein plasma and whey
powder.

95
LITERATURE CITED
AOAC International. 2007. Official Methods of Analysis of AOAC Int. 18th ed. Rev. 2. W.
Hortwitz and G. W. Latimer Jr., ed. AOAC Int., Gaithersburg, MD.
Baker, D. H. 1997. Ideal amino acid profiles for swine and poultry and their applications in feed
formulation. BioKyowa Technical Review-9. Nutri-Quest Inc., Chesterfield, MO.
Cervantes-Pahm, S. K., and H. H. Stein. 2010. Ileal digestibility of amino acids in conventional,
fermented, and enzyme-treated soybean meal and in soy protein isolate, fish meal, and
casein fed to weanling pigs. J. Anim. Sci. 88:2674-2683.
Holst, D. O. 1973.Holst filtration apparatus for Van Soest detergent fiber analysis. J. AOAC.
56:1352–1356.
Jezierny, D., R. Mosenthin, and E. Bauer. 2010. The use of grain legumes as a protein source in
pig nutrition: A review. Anim. Feed Sci. Technol. 157:111-128.
Jones, C. K., J. M. DeRouchey, J. L. Nelssen, M. D. Tokach, S. S. Dritz, and R. D. Goodband.
2010. Effects of fermented soybean meal and specialty animal protein sources on nursery
pig performance. J. Anim. Sci. 88:1725-1732.
Keegan, T. P., J. M. DeRouchey, J. L. Nelssen, M. D. Tokach, R. D. Goodband,and S. S. Dritz.
2004. The effects of poultry meal source and ash level on nursery pig performance. J.
Anim. Sci. 82:2750-2756.
Kim, S. W., and R. A. Easter. 2001. Nutritional value of fish meals in the diet for young pigs. J.
Anim. Sci. 79:1829-1839.
Kim, S. W., E. Van Heugten, F. Ji, C. H. Lee, and R. D. Mateo. 2010. Fermented soybean meal
as a vegetable protein source for nursery pigs: I. Effects on growth performance of
nursery pigs. J. Anim. Sci. 88:214-224.

96
Kim, Y. G., J. D. Lohakare, L. H. Yun, S. Heo, and B. J. Chae. 2007. Effect of feeding levels of
microbial fermented soy protein on the growth performance, nutrient digestibility and
intestinal morphology in weaned pigs. Asian-australas. J. Anim. Sci. 20:399-404.
Li, D. F., J. L. Nelssen, P. G. Reddy, F. Blecha, R. Klemm, and R. D. Goodband. 1991.
Interrelationship between hypersensitivity to soybean proteins and growth performance in
early-weaned pigs. J. Anim. Sci. 69:4062-4069.
Mahan, D. C., and E. A. Newton. 1993. Evaluation of feed grains with dried skim milk and
added carbohydrate sources on weanling pig performance. J. Anim. Sci. 71:3376-3382.
Mahan, D. C., N. D. Fastinger, and J. C. Peters. 2004. Effects of diet complexity and dietary
lactose levels during three starter phases on postweaning pig performance. J. Anim. Sci.
82:2790–2797.
Pierce, J. L., G. L. Cromwell, M. D. Lindemann, L. E. Russell, and E. M. Weaver. 2005. Effects
of spray-dried animal plasma and immunoglobulins on performance of early weaned
pigs. J. Anim. Sci. 83:2876-2885.
Pluske, J. R., D. J. Hampson, and I. H. Williams. 1997. Factors influencing the structure and
function of the small intestine in the weaned pig: a review. Livest. Sci. 51:215-236.
Sanderson, P. 1986. A new method of analysis of feedingstuffs for the determination of crude
oils and fats. Pages 77-81 in Recent Advances in Animal Nutrition. W. Haresign and D.
J. A. Cole, eds. Butterworths, London, U.K.
Tang, M., B. Laarveld, A. G. Van Kessel, D. L. Hamilton, A. Estrada, and J. F. Patience. 1999.
Effect of segregated early weaning on postweaning small intestinal development in pigs.
J. Anim. Sci. 77:3191-3200.

97
Van Dijk, A. J., H. Everts, M. J. A. Nabuurs, R. J. C. F. Margry, and A. C. Beynen. 2001.
Growth performance of weanling pigs fed spray-dried animal plasma: a review. Livest.
Prod. Sci. 68:263-274.
Zier, C. E., R. D. Jones, and M. J. Azain. 2004. Use of pet food-grade poultry by-
product meal as an alternate protein source in weanling pig diets. J. Anim. Sci. 82:3049-
3057.

98
Table 5.1. Analyzed nutrient composition of fermented soybean meal (FSBM), conventional soybean meal (SBM-CV), fish meal,
protein plasma (PP), chicken meal (CM), poultry by-product meal (PBM), whey dried, and corn, as-fed basis
Ingredient
Item FSBM SBM-CV Fish meal PP CM PBM Whey dried Corn
GE, kcal/kg 4,328 4,283 4,337 4,620 4,907 5,226 3,593 3,924
Ash, % 7.06 5.70 20.20 8.06 14.19 11.33 7.29 1.26
DM, % 92.97 90.69 93.70 89.57 96.80 94.80 84.15 89.11
CP, % 52.96 44.93 61.47 73.14 66.04 62.25 13.53 7.61
ADF, % 5.37 6.15 - - - - - 2.29
NDF, % 8.30 9.51 - - - - - 8.98
P, % 0.81 0.62 3.09 1.31 2.43 1.87 0.65 0.27
Ca, % 0.36 0.35 5.23 0.11 4.43 2.69 0.42 0.02
AEE1, % 1.4 1.4 10.17 0.32 11.03 14.29 0.84 4.08
Indispensable, AA %
Arg 3.53 3.12 3.69 4.23 4.05 4.05 0.26 0.37
His 1.37 1.18 1.47 2.56 1.25 1.32 0.21 0.21
Ile 2.44 2.01 2.53 2.35 2.43 2.35 0.65 0.24

99
Table 5.1 (cont.)
Leu 4.05 3.35 4.37 7.36 4.27 4.25 1.11 0.75
Lys 3.24 2.75 4.85 6.64 3.49 3.96 0.93 0.27
Met 0.70 0.57 1.66 0.71 1.09 1.26 0.15 0.15
Phe 2.71 2.26 2.45 4.17 2.42 2.41 0.35 0.33
Thr 1.96 1.65 2.45 4.24 2.27 2.37 0.68 0.26
Trp 0.74 0.67 0.66 1.40 0.58 0.60 0.23 0.07
Val 2.61 2.11 2.96 5.04 3.15 2.92 0.62 0.33
Dispensable, AA %
Ala 2.24 1.86 3.81 4.03 3.78 3.92 0.52 0.48
Asp 5.58 4.65 5.38 7.06 4.67 4.84 1.09 0.45
Cys 0.68 0.59 0.48 2.07 0.96 0.59 0.22 0.15
Glu 8.95 7.60 7.90 10.14 7.56 7.68 1.81 1.17
Gly 2.22 1.86 4.43 2.63 5.56 5.63 0.21 0.30
Pro 2.40 2.25 2.83 4.29 4.06 3.52 0.59 0.55
Ser 2.22 1.84 2.07 4.23 2.65 2.38 0.43 0.30
Tyr 1.96 1.65 2.00 3.72 1.92 2.08 0.26 0.23
Total AA 49.60 41.97 55.99 76.87 56.16 56.13 10.32 6.61
1AEE = acid hydrolyzed ether extract.

100
Table 5.2. Composition of experimental diets, as-fed basis, Exp. 1
Diet
Phase 1 Phase 2
ItemPositive
control
Negative
Control
FSBM
Low
FSBM
High
Positive
control
Negative
Control
FSBM
Low
FSBM
High
Ingredient, %
Corn 50.57 45.16 47.81 40.61 55.16 59.25 52.45 55.43
FSBM1 - - 10.00 19.00 - - 9.00 11.00
Whey powder, dried 15.00 15.00 15.00 15.00 5.00 - 5.00 -
Soybean meal, 48% CP 18.00 34.00 17.00 19.75 28.00 35.00 28.00 28.00
Fish meal 8.00 - - - 8.00 - - -
Protein plasma 3.50 - 3.50 - - - - -
Soybean oil 3.10 2.55 3.45 2.75 2.35 2.50 2.65 2.55
Ground limestone 0.35 0.75 1.00 0.95 0.35 0.75 0.95 0.95
Dicalcium phosphate 0.30 1.10 0.95 0.80 0.10 1.15 0.80 0.95
L-lysine HCL 0.19 0.32 0.29 0.19 0.07 0.26 0.17 0.15

101
Table 5.2 (cont.)
DL-methionine 0.16 0.21 0.17 0.14 0.14 0.21 0.16 0.16
L-threonine 0.13 0.21 0.13 0.11 0.13 0.18 0.12 0.11
Sodium chloride 0.40 0.40 0.40 0.40 0.40 0.40 0.40 0.40
Vitamin-mineral premix2 0.30 0.30 0.30 0.30 0.30 0.30 0.30 0.30
Total 100.00 100.00 100.00 100.00 100.00 100.00 100.00 100.00
1FSBM = fermented soybean meal.
2Provided the following quantities of vitamins and micro minerals per kilogram of complete diet: Vitamin A as retinyl acetate,
11,128 IU; vitamin D3 as cholecalciferol, 2,204 IU; vitamin E as DL-alpha tocopheryl acetate, 66 IU; vitamin K as menadione
nicotinamide bisulfite, 1.42 mg; thiamin as thiamine mononitrate, 0.24 mg; riboflavin, 6.58 mg; pyridoxine as pyridoxine
hydrochloride, 0.24 mg; vitamin B12, 0.03 mg; D-pantothenic acid as D-calcium pantothenate, 23.5 mg; niacin as nicotinamide and
nicotinic acid, 44 mg; folic acid, 1.58 mg; biotin, 0.44 mg; Cu, 10 mg as copper sulfate; Fe, 125 mg as iron sulfate; I, 1.26 mg as
potassium iodate; Mn, 60 mg as manganese sulfate; Se, 0.3 mg as sodium selenite; and Zn, 100 mg as zinc oxide.

102
Table 5.3.Analyzed nutrient composition of experimental diets, as-fed basis, Exp. 1
Diet
Phase 1 Phase 2
Item
Positive
control
Negative
Control
FSBM
Low
FSBM
High
Positive
control
Negative
Control
FSBM
Low
FSBM
High
GE, kcal/kg 4,113 4,048 4,092 4,091 4,100 4,065 4,091 4,107
DM, % 90.27 90.40 89.63 90.58 89.39 89.89 89.98 90.52
CP, % 22.70 24.72 22.53 25.79 24.29 24.18 24.20 25.67
ADF, % 2.31 2.68 2.50 3.00 2.73 2.91 3.07 3.21
NDF, % 8.32 7.98 7.20 6.83 8.81 8.57 8.41 8.39
P, % 0.71 0.67 0.64 0.63 0.61 0.58 0.59 0.59
Ca, % 0.81 0.82 0.81 0.82 0.81 0.74 0.75 0.77
Indispensable, AA %
Arg 1.30 1.45 1.29 1.51 1.40 1.38 1.54 1.49
His 0.57 0.59 0.57 0.61 0.57 0.56 0.62 0.60
Ile 0.89 0.98 0.88 1.00 0.93 0.89 0.99 0.99

103
Table 5.3 (cont.)
Leu 1.84 1.87 1.83 1.96 1.83 1.76 1.95 1.89
Lys 1.58 1.62 1.53 1.59 1.39 1.40 1.46 1.40
Met 0.51 0.50 0.42 0.45 0.50 0.53 0.44 0.48
Phe 0.99 1.11 1.05 1.12 1.03 1.06 1.18 1.15
Thr 1.04 1.12 1.00 1.10 0.96 0.97 0.99 0.95
Trp 0.30 0.31 0.31 0.32 0.28 0.27 0.30 0.30
Val 1.09 1.06 1.05 1.09 1.05 0.97 1.08 1.09
1FSBM = fermented soybean meal.

104
Table 5.4. Composition of experimental phase 1 and phase 2 diets, as-fed basis, Exp. 2
Diet
Phase 1 Phase 2
Item Positive
control
Negative
control
FSBM
Low
FSBM
Medium
FSBM
High
Positive
control
Negative
control
FSBM
Low
FSBM
Medium
FSBM
High
Ingredient. %
Corn 47.35 54.8 44.07 39.07 56.05 54.68 54.99 51.42 48.84 55.66
FSBM1 - - 9.00 20.00 22.00 - - 9.00 15.00 18.00
Whey powder, dried 20.00 - 20.00 20.00 - 10.00 - 10.00 10.00 -
Soybean meal, 48% CP 15.00 40.00 15.00 15.00 15.00 20.00 40.00 20.00 20.00 20.00
Fish meal 7.00 - - - - 7.00 - - - -
Protein plasma 6.00 - 6.00 - - 3.50 - 3.50 - -
Soybean oil 3.00 1.70 3.15 3.00 3.15 2.75 1.60 2.88 2.85 2.74
Ground limestone 0.47 0.57 1.00 0.95 0.90 0.35 0.54 0.88 0.85 0.83
Dicalcium phosphate 0.12 1.60 0.67 0.65 1.36 0.55 1.65 1.12 1.10 1.43
L-lysine HCL 0.16 0.27 0.22 0.33 0.41 0.19 0.21 0.25 0.33 0.30

105
Table 5.4 (cont.)
DL-methionine 0.12 0.20 0.13 0.15 0.23 0.15 0.17 0.15 0.17 0.19
L-threonine 0.07 0.16 0.06 0.15 0.20 0.12 0.14 0.10 0.16 0.15
L-tryptophan 0.01 - - - - 0.01 - - - -
Sodium chloride 0.40 0.40 0.40 0.40 0.40 0.40 0.40 0.40 0.40 0.40
Vitamin-mineral 0.30 0.30 0.30 0.30 0.30 0.30 0.30 0.30 0.30 0.30
Total 100.00 100.00 100.00 100.00 100.00 100.00 100.00 100.00 100.00 100.00
1FSBM = fermented soybean meal.
2Provide the following quantities of vitamins and micro minerals per kilogram of complete diet: Vitamin A as retinyl acetate,
11,128 IU; vitamin D3 as cholecalciferol, 2,204 IU; vitamin E as DL-alpha tocopheryl acetate, 66 IU; vitamin K as menadione
nicotinamide bisulfite, 1.42 mg; thiamin as thiamine mononitrate, 0.24 mg; riboflavin, 6.58 mg; pyridoxine as pyridoxine
hydrochloride, 0.24 mg; vitamin B12, 0.03 mg; D-pantothenic acid as D-calcium pantothenate, 23.5 mg; niacin as nicotinamide and
nicotinic acid, 44 mg; folic acid, 1.58 mg; biotin, 0.44 mg; Cu, 10 mg as copper sulfate; Fe, 125 mg as iron sulfate; I, 1.26 mg as
potassium iodate; Mn, 60 mg as manganese sulfate; Se, 0.3 mg as sodium selenite; and Zn, 100 mg as zinc oxide.

106
Table 5.5.Analyzed nutrient composition of experimental phase 1 and phase 2 diets, as-fed basis, Exp. 2
Diet1
Phase 1 Phase 2
Item Positive
control
Negative
control
FSBM
Low
FSBM
Medium
FSBM
High
Positive
control
Negative
control
FSBM
Low
FSBM
Medium
FSBM
High
GE, kcal/kg 4,104 4,049 4,074 4,095 4,121 4,114 4,041 4,087 4,077 4,093
DM, % 89.38 90.28 89.85 90.56 90.96 90.40 90.40 90.37 91.01 90.85
CP, % 23.56 24.40 23.32 25.26 24.62 23.92 24.44 23.75 23.56 24.09
ADF, % 1.80 3.48 2.38 2.87 3.33 2.51 3.55 2.79 3.32 3.45
NDF, % 6.75 8.33 5.02 5.78 8.21 7.44 9.07 7.73 8.11 8.80
P, % 0.63 0.71 0.59 0.63 0.68 0.69 0.72 0.63 0.64 0.69
Ca, % 0.76 0.80 0.78 0.82 0.85 0.81 0.80 0.78 0.75 0.82
Indispensable, AA %
Arg 1.25 1.59 1.27 1.33 1.40 1.31 1.53 1.31 1.44 1.55
His 0.58 0.63 0.58 0.56 0.58 0.58 0.61 0.57 0.59 0.62
Ile 0.90 1.04 0.93 1.00 0.95 0.90 0.96 0.91 1.00 1.01

107
Table 5.5 (cont.)
Leu 1.93 1.95 1.93 1.82 1.80 1.84 1.86 1.85 1.88 1.93
Lys 1.67 1.55 1.64 1.63 1.54 1.59 1.49 1.48 1.59 1.58
Met 0.47 0.47 0.41 0.45 0.51 0.50 0.51 0.43 0.46 0.49
Phe 1.02 1.19 1.06 1.06 1.08 0.99 1.14 1.06 1.11 1.15
Thr 1.06 0.98 1.01 1.00 0.99 1.01 0.99 0.95 0.98 1.00
Trp 0.32 0.29 0.32 0.31 0.28 0.30 0.29 0.30 0.32 0.30
Val 1.16 1.14 1.17 1.08 1.06 1.12 1.06 1.08 1.09 1.12
1FSBM = fermented soybean meal.

108
Table 5.6.Composition of experimental phase 3 diets, as-fed basis, Exp. 2
Diet
Item Positive
control
Negative
Control
FSBM
Low
FSBM
Medium
FSBM
High
Ingredient, %
Corn 54.25 58.43 51.01 51.01 57.78
FSBM1 - - 9.00 9.00 12.00
Whey powder, dried 10.00 - 10.00 10.00 -
Soybean meal, 48% CP 25.00 37.00 25.00 25.00 25.00
Fish meal 7.00 - - - -
Protein plasma - - - - -
Soybean oil 2.14 1.58 2.27 2.27 2.18
Ground limestone 0.42 0.77 0.95 0.95 0.97
Dicalcium phosphate 0.09 1.10 0.63 0.63 0.94
L-lysine HCL 0.16 0.17 0.21 0.21 0.19
DL-methionine 0.12 0.14 0.12 0.12 0.14
L-threonine 0.12 0.11 0.11 0.11 0.10
L-tryptophan - - - - -
Sodium chloride 0.40 0.40 0.40 0.40 0.40
Vitamin-mineral premix2 0.30 0.30 0.30 0.30 0.30
Total 100.00 100.00 100.00 100.00 100.00
1FSBM = fermented soybean meal.
2Provide the following quantities of vitamins and micro minerals per kilogram of
complete diet: Vitamin A as retinyl acetate, 11,128 IU; vitamin D3 as cholecalciferol, 2,204 IU;
vitamin E as DL-alpha tocopheryl acetate, 66 IU; vitamin K as menadione nicotinamide bisulfite,
109
1.42 mg; thiamin as thiamine mononitrate, 0.24 mg; riboflavin, 6.58 mg; pyridoxine as
pyridoxine hydrochloride, 0.24 mg; vitamin B12, 0.03 mg; D-pantothenic acid as D-calcium
pantothenate, 23.5 mg; niacin as nicotinamide and nicotinic acid, 44 mg; folic acid, 1.58 mg;
biotin, 0.44 mg; Cu, 10 mg as copper sulfate; Fe, 125 mg as iron sulfate; I, 1.26 mg as potassium
iodate; Mn, 60 mg as manganese sulfate; Se, 0.3 mg as sodium selenite; and Zn, 100 mg as zinc
oxide.

110
Table 5.7.Analyzed nutrient composition of experimental phase 3 diets, as-fed basis, Exp. 2
Diet1
Item Positive
control
Negative
control
FSBML
ow
FSBM
Medium
FSBM
High
GE, kcal/kg 4,046 3,993 4,047 4,047 4,040
DM, % 89.83 89.80 89.97 90.17 90.32
CP, % 22.56 24.46 23.98 24.03 24.82
ADF, % 2.98 3.20 3.18 2.99 3.19
NDF, % 8.26 7.24 6.81 6.95 9.22
P, % 0.60 0.60 0.56 0.55 0.61
Ca, % 0.73 0.79 0.72 0.77 0.83
Indispensable, AA %
Arg 1.29 1.44 1.35 1.34 1.43
His 0.53 0.58 0.55 0.55 0.58
Ile 0.85 0.90 0.93 0.91 0.92
Leu 1.75 1.79 1.77 1.75 1.80
Lys 1.38 1.36 1.38 1.38 1.40
Met 0.45 0.44 0.40 0.40 0.45
Phe 0.95 1.08 1.04 1.03 1.09
Thr 0.92 0.90 0.90 0.92 0.92
Trp 0.27 0.28 0.29 0.29 0.28
Val 0.95 0.99 1.02 1.00 1.02
1FSBM = fermented soybean meal.

111
Table 5.8. Composition of experimental phase 1 diets, as-fed basis, Exp. 3
Diet1
Phase 1
Item Positive
control
Negative
control
CM PBM FSBM
Ingredient, %
Corn 48.30 46.13 46.22 46.22 44.86
Soybean meal, 48% CP 21.00 30.00 21.00 21.00 21.00
Fish meal 8.00 - - - -
Chicken meal - - 9.00 - -
Poultry by-product meal - - - 9.00 -
FSBM - - - - 10.00
Whey powder, dried 15.00 15.00 15.00 15.00 15.00
Protein plasma 3.00 3.00 3.00 3.00 3.00
Soybean oil 3.00 2.82 3.69 3.69 3.16
Ground limestone 0.30 0.75 0.54 0.54 0.88
Dicalcium phosphate 0.25 1.05 0.25 0.25 0.90
L-lysine HCL 0.18 0.27 0.27 0.27 0.25
DL-methionine 0.14 0.16 0.18 0.18 0.15
L-threonine 0.12 0.12 0.13 0.13 0.10
L-tryptophan 0.01 - 0.02 0.02 -
Sodium chloride 0.40 0.40 0.40 0.40 0.40
Vitamin-mineral premix2 0.30 0.30 0.30 0.30 0.30
Total 100.00 100.00 100.00 100.00 100.00
1CM = chicken meal; PBM = poultry by-product meal; FSBM = fermented soybean meal.

112
2Provide the following quantities of vitamins and micro minerals per kilogram of
complete diet: Vitamin A as retinyl acetate, 11,128 IU; vitamin D3 as cholecalciferol, 2,204 IU;
vitamin E as DL-alpha tocopheryl acetate, 66 IU; vitamin K as menadione nicotinamide bisulfite,
1.42 mg; thiamin as thiamine mononitrate, 0.24 mg; riboflavin, 6.58 mg; pyridoxine as
pyridoxine hydrochloride, 0.24 mg; vitamin B12, 0.03 mg; D-pantothenic acid as D-calcium
pantothenate, 23.5 mg; niacin as nicotinamide and nicotinic acid, 44 mg; folic acid, 1.58 mg;
biotin, 0.44 mg; Cu, 10 mg as copper sulfate; Fe, 125 mg as iron sulfate; I, 1.26 mg as potassium
iodate; Mn, 60 mg as manganese sulfate; Se, 0.3 mg as sodium selenite; and Zn, 100 mg as zinc
oxide

113
Table 5.9. Analyzed nutrient composition of experimental phase 1 diets, as-fed basis, Exp. 3
Diet1
Phase 1
Item Positive control Negative control CM PBM FSBM
GE, kcal/kg 4,110 3,997 4,182 4,246 4,067
DM, % 90.00 89.53 90.24 89.34 88.71
CP, % 23.97 20.60 25.78 24.74 23.96
ADF, % 2.39 2.46 2.43 2.53 2.78
NDF, % 6.83 6.34 7.70 8.29 6.37
P, % 0.75 0.69 0.73 0.61 0.67
Ca, % 0.92 0.93 0.95 0.72 0.83
Indispensable, AA %
Arg 1.44 1.19 1.45 1.40 1.42
His 0.62 0.52 0.59 0.57 0.60
Ile 0.99 0.81 0.96 0.91 0.97
Leu 1.99 1.66 1.94 1.86 1.91
Lys 1.74 1.43 1.66 1.63 1.60
Met 0.52 0.40 0.47 0.48 0.45
Phe 1.12 0.94 1.05 1.01 1.08
Thr 1.09 0.93 1.09 1.01 1.03
Trp 0.31 0.28 0.32 0.33 0.32
Val 1.19 0.97 1.17 1.11 1.13
1CM = chicken meal; PBM = poultry by-product meal; FSBM = fermented soybean meal.

114
Table 5.10. Composition of experimental phase 2 and phase 3 diets, as-fed basis, Exp. 3
Diet1
Phase 2 Phase 3
Item Positive
control
Negative
control
CM PBM FSBM Positive
control
Negative
control
CM PBM FSBM
Ingredient, %
Corn 52.16 49.98 50.58 50.58 48.7 55.76 53.31 54.20 54.20 52.95
Soybean meal, 48% CP 25.00 34.00 25.00 25.00 25.00 30.00 37.00 30.00 30.00 30.00
Fish meal 8.00 - - - - 5.00 - - - -
Chicken meal - - 9.00 - - - - 6.00 - -
Poultry by-product meal - - - 9.00 - - - - 6.00 -
FSBM - - - - 10.00 - - - - 7.00
Whey powder, dried 10.00 10.00 10.00 10.00 10.00 5.00 5.00 5.00 5.00 5.00
Protein plasma - - - - - - - - - -
Soybean oil 2.85 2.67 3.32 3.32 3.02 2.24 1.95 2.64 2.64 2.29
Ground limestone 0.21 0.66 0.47 0.47 0.8 0.52 0.79 0.65 0.65 0.91
Dicalcium phosphate 0.48 1.28 0.42 0.42 1.13 0.43 0.90 0.39 0.39 0.80

115
Table 5.10 (cont.)
L-lysine HCL 0.24 0.33 0.22 0.22 0.32 0.13 0.14 0.17 0.17 0.15
DL-methionine 0.17 0.19 0.16 0.16 0.17 0.12 0.12 0.14 0.14 0.11
L-threonine 0.17 0.18 0.12 0.12 0.16 0.10 0.09 0.11 0.11 0.09
L-tryptophan 0.02 0.01 0.01 0.01 - - - - - -
Sodium chloride 0.40 0.40 0.40 0.40 0.40 0.40 0.40 0.40 0.40 0.40
Vitamin-mineral premix2 0.30 0.30 0.30 0.30 0.30 0.30 0.30 0.30 0.30 0.30
Total 100.00 100.00 100.00 100.00 100.00 100.00 100.00 100.00 100.00 100.00
1CM = chicken meal; PBM = poultry by-product meal; FSBM = fermented soybean meal.
2Provide the following quantities of vitamins and micro minerals per kilogram of complete diet: Vitamin A as retinyl acetate,
11,128 IU; vitamin D3 as cholecalciferol, 2,204 IU; vitamin E as DL-alpha tocopheryl acetate, 66 IU; vitamin K as menadione
nicotinamide bisulfite, 1.42 mg; thiamin as thiamine mononitrate, 0.24 mg; riboflavin, 6.58 mg; pyridoxine as pyridoxine
hydrochloride, 0.24 mg; vitamin B12, 0.03 mg; D-pantothenic acid as D-calcium pantothenate, 23.5 mg; niacin as nicotinamide and
nicotinic acid, 44 mg; folic acid, 1.58 mg; biotin, 0.44 mg; Cu, 10 mg as copper sulfate; Fe, 125 mg as iron sulfate; I, 1.26 mg as
potassium iodate; Mn, 60 mg as manganese sulfate; Se, 0.3 mg as sodium selenite; and Zn, 100 mg as zinc oxide.

116
Table 5.11. Analyzed nutrient composition of experimental phase 2 and phase 3 diets, as-fed basis, Exp. 3
Diet1
Phase 1 Phase 2
Item Positive
control
Negative
controlCM PBM FSBM
Positive
control
Negative
controlCM PBM FSBM
GE, kcal/kg 4,078 4,030 4,139 4,213 4,043 4,029 4,005 4,091 4,110 4,072
DM, % 88.56 88.98 89.50 90.66 90.09 89.51 88.93 89.69 88.99 89.47
CP, % 24.32 24.34 26.67 25.18 25.10 23.98 24.01 25.16 25.53 25.79
ADF, % 2.74 3.12 2.84 3.14 3.31 2.65 3.07 2.95 2.39 2.90
NDF, % 8.69 6.99 8.64 9.60 6.88 8.17 7.71 8.67 8.12 6.70
P, % 0.72 0.70 0.71 0.65 0.71 0.60 0.58 0.61 0.55 0.57
Ca, % 0.82 0.71 0.89 0.69 0.84 0.75 0.62 0.80 0.68 0.72
Indispensable, AA %
Arg 1.42 1.53 1.56 1.55 1.58 1.44 1.63 1.47 1.54 1.40
His 0.58 0.61 0.59 0.60 0.63 0.59 0.65 0.58 0.61 0.57
Ile 0.97 0.98 1.04 1.01 1.06 0.98 1.10 0.99 1.01 0.97

117
Table 5.11 (cont.)
Leu 1.84 1.91 1.92 1.91 1.96 1.85 2.05 1.85 1.94 1.79
Lys 1.48 1.56 1.54 1.57 1.57 1.46 1.52 1.42 1.52 1.36
Met 0.48 0.46 0.53 0.53 0.42 0.47 0.45 0.45 0.53 0.41
Phe 1.03 1.11 1.09 1.09 1.16 1.06 1.21 1.06 1.10 1.04
Thr 0.96 1.03 1.02 1.00 1.00 0.94 0.96 0.92 0.99 0.88
Trp 0.29 0.30 0.31 0.32 0.34 0.28 0.31 0.29 0.30 0.29
Val 1.08 1.07 1.18 1.14 1.16 1.10 1.22 1.12 1.14 1.07
1CM = chicken meal; PBM = poultry by-product meal; FSBM = fermented soybean meal.

118
Table 5.12. Growth performance of nursery pigs fed experimental diets, Exp 11
Item
Positive
control
Negative
control
FSBM2
Low
FSBM
HighSEM P-value
BW, kg
Day 0 6.97 6.93 6.99 6.99 0.349 0.22
Day 14 9.54a 9.46ab 9.74a 9.15b 0.388 0.01
Day 26 14.90 14.42 14.38 14.09 0.573 0.27
ADG, g/d
Day 14 184ab 165b 197a 154b 10.71 0.04
Day 26 446 414 387 412 21.02 0.18
Day 0 to 26 305 278 284 273 12.58 0.33
ADFI, g/d
Day 14 260 254 276 236 12.64 0.08
Day 26 655 647 644 625 25.24 0.75
Day 0 to 26 442 433 446 416 17.42 0.42
G:F
Day 14 0.71 0.65 0.72 0.66 0.04 0.26
Day 26 0.68a 0.64ab 0.60b 0.66a 0.01 0.01
Day 0 to 26 0.69 0.64 0.64 0.66 0.02 0.14
a-b Means within a row lacking a common superscript letter are different (P< 0.05).
1Each least squares mean represents 8 pens of 6 pigs/pen.
2FSBM = fermented soybean meal.

119
Table 5.13. Growth performance of nursery pigs fed experimental diets, Exp 21
Item
Positive
control
Negative
control
FSBM2
Low
FSBM
Medium
FSBM
HighSEM P-value
BW, kg
Day 0 7.08 7.04 7.07 7.10 7.13 0.42 0.35
Day 7 7.44a 6.94bc 7.41a 7.14b 6.86c 0.41 < 0.01
Day 14 9.09a 8.44bc 8.84ab 8.53abc 7.97c 0.43 < 0.01
Day 28 16.34a 14.99bc 15.94ab 15.37abc 14.43c 0.61 < 0.01
ADG, g/d
Day 7 51a -16bc 50a 4b -37c 11.50 < 0.01
Day 14 232 214 205 200 158 23.29 0.27
Day 28 521 467 465 489 461 24.90 0.26
Day 0 - 28 331a 282b 292ab 295ab 260b 16.60 0.05
ADFI, g/d
Day 7 126a 88b 127a 93b 67b 10.20 < 0.01
Day 14 301 282 285 282 234 19.70 0.20
Day 28 724 668 722 681 646 29.49 0.14
Day 0 - 28 469 427 455 434 398 20.81 0.11
G:F
Day 7 0.29 - 0.41 - - 0.15 0.56
Day 14 0.78 0.75 0.69 0.70 0.67 0.06 0.75
Day 28 0.72 0.70 0.64 0.72 0.71 0.02 0.08
Day 0 - 28 0.71 0.67 0.63 0.68 0.66 0.20 0.14
a-c Means within a row lacking a common superscript letter are different (P< 0.05).
1Each least squares mean represents 7 pens of 5 pigs/pen.

120
2FSBM = fermented soybean meal.

121
Table 5.14. Growth performance of nursery pigs fed experimental diets, Exp 31
Item
Positive
control
Negative
controlCM2 PBM3 FSBM4 SEM P-value
BW, kg
Day 0 7.06 7.09 7.07 7.10 7.05 0.34 0.53
Day 7 7.49 7.41 7.41 7.38 7.33 0.36 0.68
Day 14 9.12a 8.34b 8.94a 9.05a 8.87a 0.41 < 0.01
Day 28 17.49 16.16 16.62 16.65 16.36 0.73 0.08
ADG, g/d
Day 0 61 45 49 40 40 10.47 0.59
Day 7 233a 132b 217a 239a 220a 14.17 < 0.01
Day 14 598 559 549 543 535 26.08 0.16
Day 0 - 28 372 324 341 341 333 16.04 0.07
ADFI, g/d
Day 0 135 124 133 119 114 8.69 0.31
Day 7 308 275 297 315 300 18.96 0.44
Day 14 791 744 759 762 749 41.27 0.86
Day 0 - 28 506 471 487 490 478 26.09 0.80
G:F
Day 0 0.44 0.34 0.34 0.32 0.34 0.06 0.69
Day 7 0.75a 0.48b 0.73a 0.76a 0.73a 0.03 < 0.01
Day 14 0.76 0.75 0.72 0.71 0.71 0.02 0.13
Day 0 - 28 0.74a 0.69b 0.70b 0.70b 0.70b 0.01 0.03
a-b Means within a row lacking a common superscript letter are different (P< 0.05).
1Each least squares mean represents 7 pens of 5 pigs/pen.

122
2CM = chicken meal.
3PBM = poultry by-product meal.
4FSBM = fermented soybean meal.

123
CHAPTER 6
CONCLUSIONS
From the first 3 experiments that are reported in this thesis, it is concluded that apparent
total tract digestibility (ATTD) and standardized total tract digestibility (STTD) of P in
conventional soybean meal (SBM-CV) is less than in fermented soybean meal (FSBM), when
no microbial phytase is added to the diet, but if phytase is used, no differences in ATTD and
STTD of P between FSBM and SBM-CV are observed. It was also demonstrated that SBM-CV
contains less digestible P than FSBM. This indicates that diets formulated with FSBM need less
inorganic P than diets formulated with SBM-CV. It was also concluded that concentrations of
DE, ME, and NE is greater in SBM-CV than in FSBM, but DE, ME, and NE are greater in
FSBM than in fish meal. Fermentation of SBM seems to reduce the concentration of energy, but
at the same time increases the concentration of DM, CP, acid hydrolyzed ether extraction, NDF,
and ADF compared with SBM-CV. The reason for the reduced DE, ME, and NE in FSBM
compared with SBM-CV is most likely that fermentation eliminates sugar and soluble
carbohydrates in FSBM. The standardized ileal digestibility of most AA is not different between
FSBM and SBM-CV, but they are greater in FSBM than in fish meal. It was also observed that
the biological value of protein in fish meal is greater than in FSBM and SBM-CV, but the
biological value of corn protein is less than in fish meal, FSBM, and SBM-CV.
From the growth performance experiments, it was concluded that FSBM may replace fish
meal, chicken meal, and poultry by-product meal in diets fed to pigs during the initial 28 d post-
weaning without affecting pig growth performance except that G:F may be reduced. It was also
concluded that protein plasma and whey powder cannot be replaced by FSBM during the first

124
week after weaning without negatively affecting pig growth performance. However, during the
second and third week after weaning, it is possible to use FSBM rather than protein plasma and
whey powder. Overall results indicate that it may be possible to reduce diet costs without
compromising pig growth performance if FSBM is included in diets fed to weanling pigs at the
expense of animal protein sources.