characterization of caking and cake strength in a potash...
TRANSCRIPT

CHARACTERIZATION OF CAKING AND CAKE
STRENGTH IN A POTASH BED
A Thesis
Submitted to the College of Graduate Studies and Research
in Partial Fulfillment of the Requirements for the Degree of
Master of Science
In the Department of Mechanical Engineering
University of Saskatchewan
By
Yan WANG
Saskatoon, Saskatchewan
Copyright Yan WANG, May 2006. All rights reserved.

i
PERMISSION TO USE
The author grants permission to the University of Saskatchewan Libraries to
make this thesis available for inspection. Copying of this thesis, in whole or in part, for
scholarly purposes may be granted by my supervisors (Prof. Robert W. Besant and Prof.
Richard W. Evitts), the head of the Department of Mechanical Engineering, or the Dean
of the College of Engineering. It is understood that any copying or publication or use of
this thesis or parts thereof for financial gain shall not be allowed without my written
permission. It is also understood that due recognition to me and the University of
Saskatchewan must be granted in any scholarly use which may be made of any material
in this thesis.
Requests for permission to copy or to make other use of the material in this thesis
in whole or in part should be addressed to:
Head, Department of Mechanical Engineering
University of Saskatchewan
57 Campus Drive
Saskatoon, SK
Canada S7N 5A9

ii
ABSTRACT
When a water soluble granular fertilizer, such as potash, is wetted and then dried
during storage and transportation processes, clumps or cakes often form in the material
even when the maximum moisture content is less than 1% by mass. In order to avoid or
decrease these occurred cakes, it is essential to characterize cake strength and to explore
the process of cake formulation or caking through theoretical/numerical analysis. In this
thesis, both experimental measurements of cake strength and theoretical/numerical
simulations for recrystallization near a contact point are used to investigate the
relationship between the caking process and the cake strength for important factors such
as initial moisture content and drying time.
In this research, a centrifugal loading method has been developed to determine
cake strength in a caked ring specimen of potash fertilizer where internal tensile stresses
dominate. Research on fracture mechanics states that brittle materials, such as caked
potash, fail at randomly positioned fracture surfaces in tension – so the centrifuge test
method is well suited to provide good data. A two-dimensional plane stress analysis was
used to determine the area-averaged tensile stress at the speed of the centrifuge when
each specimen fractures. Repeated tests and uncertainty calculations give data with a
narrow range of uncertainty.
The centrifuge test facility was used for a series of tests in which the initial
moisture content, drying time, particle size and chemical composition (i.e. magnesium
content) of the samples were varied. For particle sizes in the range from 0.85 to 3.35

iii
mm, experimental data show that the cake strength increased linearly with initial
moisture content for each drying method and particle size, and decreased with increasing
particle size for each initial moisture content and drying method. As well, it was also
found that cake strength will increase essentially linearly with magnesium content from
0.02% to 0.1% for samples with the same initial moisture content, particle size and
drying method. All data show that potash samples tend to form a stronger cake with a
slower drying process.
A theoretical/numerical model is presented in this thesis to simulate ion diffusion
and crystallization near one contact point between two potash (KCl) particles during a
typical drying process. The effects of three independent factors are investigated: initial
moisture content; evaporation rate; and degree of supersaturation on the surface
surrounding the contact point. The numerical results show that the mass of crystal
deposition near the contact point will increase with increased initial moisture content
and decreased evaporation rate. These numerical predictions for recrystallization near
the contact point are consistent with the experimental data for the cake strength of test
samples of particle beds. With variations in the solid crystal surface degree of
supersaturation near the contact point, simulations showed up to 5 times the increase in
the crystal mass deposition near the contact point. This prediction of increased
roughness is consistent with another experimental investigation which showed that the
surface roughness of NaCl and KCl surfaces increased by a factor of five after one
wetting and drying process.

iv
ACKNOWLEDGMENTS
I would like to firstly express my sincere and deepest appreciation to my
supervisors, Professor Robert W. Besant and Professor Richard W. Evitts. You showed
me different ways to approach a research problem and the need to be persistent to
accomplish any goal. Without your expertise, encouragement, patience and guidance
throughout this work, I would not have completed my Master’s program.
The grateful thanks are also extended to my advisory committee members:
Professor Allan Dolovich who provided a lot of advice and impetus for the portion of
applied mechanics in this project and Professor Carey J. Simonson for your valuable
comments and suggestion.
Sincere thanks to Dan Gillies who collected most of the data presented in
Chapter 3. Thanks also to Mr. Dave Deutscher, Mr. Chris James, Mr. Hans-Jürgen
Steinmetz, and Mr. Dave G. Crone for your help with the experimental studies.
Heartfelt thanks to my families: my parents and father-in-law for your
encouragement during my period of studies. Special thanks are given to my wife for
your everlasting love and support.
Financial assistance from the Natural Science and Engineering Research Council
of Canada (NSERC) and the Potash Corporation of Saskatchewan (PCS) is also
acknowledged and appreciated.

v
DEDICATION
This thesis is dedicated to my wife, Yuwei Li
vi
TABLE OF CONTENTS
PERMISSION TO USE....................................................................................................i
ABSTRACT .............................................................................................................. ii
ACKNOWLEDGMENTS ..............................................................................................iv
TABLE OF CONTENTS................................................................................................vi
LIST OF TABLES ..........................................................................................................ix
LIST OF FIGURES .........................................................................................................x
NOMENCLATURE.......................................................................................................xv
CHAPTER 1 INTRODUCTION................................................................................1
1.1 General ...............................................................................................................1
1.2 Caking in Potash..................................................................................................5
1.3 Literature review of potash products...................................................................8
1.3.1 University investigations of heat and moisture transfer ..............................8
1.3.2 Cake strength studies for bulk materials....................................................13
1.3.3 Cake strength measurement .......................................................................15
1.3.4 Recrystallization process and moving boundary problems.......................18
1.4 Research Objectives...........................................................................................20
1.5 Overview of Thesis............................................................................................23
CHAPTER 2 MEASUREMENT OF CAKE STRENGTH IN POTASH USING
A CENTRIFUGE...............................................................................25
2.1 Background........................................................................................................25
2.2 Test Principle.....................................................................................................27
2.2.1 Stress analysis in a 2-D plane-stress ring...................................................28
2.2.2 Boundary conditions..................................................................................31

vii
2.2.3 Stress distribution.......................................................................................34
2.3 Experiment.........................................................................................................38
2.3.1 Sample preparation ....................................................................................38
2.3.2 Experimental procedure.............................................................................42
2.4 Experimental Results and Analysis ...................................................................44
2.5 Summary............................................................................................................46
CHAPTER 3 EFFECTS OF PARTICLE SIZE AND CHEMICAL
COMPOSITION ON CAKE STRENGTH .....................................47
3.1 Introduction........................................................................................................47
3.2 Test Conditions..................................................................................................48
3.2.1 Particle sizes...............................................................................................48
3.2.2 Magnesium content....................................................................................49
3.2.3 Initial moisture content and drying methods .............................................49
3.3 Data and Analysis..............................................................................................49
3.3.1 Uncertainty calculation..............................................................................49
3.3.2 Comparison of new and recycled potash...................................................51
3.3.3 Cake strength measurements......................................................................52
3.4 Conclusion and Summary..................................................................................58
CHAPTER 4 THEORETICAL/NUMERICAL MODEL OF
RECRYSTALLIZATION NEAR A CONTACT POINT
BETWEEN TWO POTASH PARTICLES.....................................60
4.1 Introduction........................................................................................................60
4.2 Background........................................................................................................61
4.2.1 Diffusion in electrolytic solution...............................................................64
4.2.2 Boundary conditions at crystal solid surface (z=0)....................................67
4.2.3 Boundary conditions at z=s(t) ....................................................................70
4.2.4 Problem formulation..................................................................................72
4.2.5 Method of analysis.....................................................................................74
4.3 Summary............................................................................................................75
viii
CHAPTER 5 SIMULATION OF NUMERICAL MODEL AND COMPARISON
WITH EXPERIMENTAL DATA ....................................................76
5.1 Dimensionless Terminology ..............................................................................76
5.2 Numerical Results..............................................................................................79
5.2.1 Simulation with a range of initial moisture contents.................................79
5.2.2 Simulation with a range of evaporation rates ............................................82
5.2.3 Simulation with a range of supersaturation on particle surface.................85
5.3 Analysis and Discussion....................................................................................88
5.3.1 Mass deposition and cake strength ............................................................88
5.3.2 Thickness of deposited crystal layer and roughness..................................93
5.3.3 Supersaturation and changes in the diffusion coefficient ..........................95
5.4 Conclusions and Summary ................................................................................98
CHAPTER 6 SUMMARY, CONCLUSIONS AND FUTURE WORK..............100
6.1 Summary..........................................................................................................100
6.2 Conclusions......................................................................................................101
6.3 Hypothesis........................................................................................................101
6.4 Future Work .....................................................................................................103
REFERENCES ...........................................................................................................106
APPENDIX A MEARSUREMENT OF BOND STRENGTH BETWEEN CAKED
POTASH AND PVC PLATE..........................................................109
APPENDIX B ELASTIC PROPERTY DATA FOR A CAKED POTASH
SAMPLE...........................................................................................111
APPENDIX C MEASURED DATA FOR CAKE STRENGTH...........................115
APPENDIX D SENSITIVITY STUDY ON PARAMETERS USED IN
NUMERICAL MODEL ..................................................................118

ix
LIST OF TABLES
Table 2-1: Drying Conditions for Potash Test Samples...................................................41
Table 3-1: Untreated potash particle size for tests...........................................................48
Table 3-2: Comparison of cake strength for new and recycled potash............................51
Table 4-1: Values of diffusion coefficients of binary electrolytes in dilute solution and
solubility in water at 25oC for KCl, NaCl, MgCl2 ........................................66
Table 5-1: Comparisons between experimental cake strength data after both oven drying
and air drying and simulations for crystal mass deposition inside the contact
region between two potash particles for evaporation rate, dpm=1.02 mm.....89
Table B-1: Experimental data and uncertainty to determine Young’s modulus and
Poisson’s ratio for a caked potash specimen comprised of particles with a
size range 0.85 to 1.18 mm which is 200 mm long and 100 mm diameter.114
Table C- 1: Average (15 samples) cake strength for different particle diameters and
initial moisture contents for oven drying at 40º C ......................................115
Table C- 2: Average (15 samples) cake strength at different particle diameters and initial
moisture contents for air drying..................................................................116
Table C- 3: Average (15 samples) cake strength at different magnesium concentrations
and initial moisture contents for oven drying at 40º C, 0.85 < pd < 1.18 mm
.....................................................................................................................117
Table C- 4: Average (15 samples) cake strength at different magnesium concentrations
and initial moisture contents for air drying, 0.85 < pd < 1.18 mm............117

x
LIST OF FIGURES
Figure 1-1: Two types of potash sold as commercial products (a) Standard Potash and
(b) Granular Potash .........................................................................................2
Figure 1-2: Photos of a few potash particles with enlarged images for particle size ranges
(a) from 0.85 mm to 1.18 mm and (b) from 2.85 mm to 3.30 mm.................2
Figure 1-3: Enlarged image of a single potash particle (dpm ≈ 3.00 mm) ..........................3
Figure 1-4: Caked standard and granular potash samples..................................................4
Figure 1-5: SEM image of a solid bridge between two particles of potash due to a
recrystallization microprocess (Kollmann and Tomas 2001) .........................7
Figure 2-1: Plastic ring and bottom plate used to hold a caked potash sample...............27
Figure 2-2: Photos of (a) plastic annular ring device to make caked potash samples and
(b) prepared caked potash sample with its holder for testing in a centrifuge28
Figure 2-3: Schematic of (a) axisymmetric rotating caked potash cylinder and (b)
stresses on an infinitesimal element at r, θ....................................................29
Figure 2-4: Schematic showing (a) caked potash shell specimen, (b) particle contact
points on an internal fracture surface, and (c) fracture surface between the
particles and the PVC surface.......................................................................32
Figure 2-5: The radial distribution of dimensionless tensile stress ,ξ �, in a caked potash
ring for ν = 0.1 with inner radius dimensionless stress as a parameter .........36
Figure 2-6: Mohr’s circle diagram for plane stress in a caked potash structural element37
Figure 2-7: Principal stresses and maximum shear stress distribution across caked potash
for a radial cross-section ...............................................................................37
Figure 2-8: Experimental apparatus for particle sieving..................................................39

xi
Figure 2-9: Schematic of the air drying facility which can dry five samples at once......40
Figure 2-10: Dimensionless potash moisture content versus dimensionless time for three
different drying processes.............................................................................41
Figure 2-11: Experimental apparatus to measure fracture rotating speed including the
centrifuge, aluminium holder and non-contact tachometer...........................42
Figure 2-12: Photos of (a) a caked potash sample mounted on centrifuge before test and
(b) a fractured potash sample after test in a centrifuge.................................43
Figure 2-13: A sequence of three photos (30 frames per second) which captured the
potash caked ring just before and after the instant fracture in the centrifuge,
rpm250≈ω ..................................................................................................44
Figure 2-14: Ultimate fracture tensile stress versus initial moisture content showing
average data points with three drying processes, dpm=1.02 mm ...................45
Figure 3-1: Potash cake strength versus initial moisture content for four different particle
size ranges for (a) oven drying at 40oC and (b) air drying at room conditions,
Mg %02.0≈ ...................................................................................................53
Figure 3-2: Cake strength versus average particle diameter for oven drying at 40ºC with
three different initial moisture contents, Mg %02.0≈ ..................................54
Figure 3-3: Potash cake strength versus initial moisture content with three different
concentrations of magnesium for (a) oven drying at 40oC and (b) air drying
at room conditions, pmd =1.02 mm ...............................................................56
Figure 3-4: Potash cake strength versus concentration of magnesium for (a) oven drying
and (b) air drying, pmd =1.02 mm.................................................................57
Figure 4-1: A two-dimensional axi-symmetric schematic for ion diffusion in a liquid
film and recrystallization near a contact point between two potash particles
.......................................................................................................................63
xii
Figure 4-2: Schematic of aqueous salt solution of uniform thickness around a stretched
contact point at r = 0.....................................................................................63
Figure 4-3: Schematic for the axi-symmetrical domain...................................................73
Figure 5-1: Dimensionless crystal mass deposition inside contact region, Mc, versus
dimensionless moving boundary position, S* , with different initial film
thicknesses, So (initial moisture content, X), as a parameter, US=0.05,
0.1== ba CC ................................................................................................79
Figure 5-2: Dimensionless crystal mass deposition per unit area inside contact region,
Nc, versus dimensionless moving boundary position, S* , with different film
thickness, So (initial moisture content, X), as a parameter, US=0.05,
0.1== ba CC ................................................................................................80
Figure 5-3: Local distribution of crystal mass deposition per unit area, N, versus radial
position, R, with different initial film thicknesses, So (initial moisture
content, X), as a parameter, US=0.05�S*=0.2, 0.1== ba CC ....................81
Figure 5-4: Dimensionless crystal mass deposition per unit area at r=ro, No, versus
dimensionless moving boundary position, S* , with different initial film
thicknesses, So (initial moisture content, X), as a parameter, US=0.05,
0.1== ba CC ................................................................................................81
Figure 5-5: Dimensionless crystal mass deposition inside contact region, Mc, versus
dimensionless moving boundary position, S* , with different moving
boundary velocities, US, as a parameter, So=1.1(X=0.06), 0.1== ba CC ...82
Figure 5-6: Dimensionless crystal mass deposition per unit area inside contact region,
Nc, versus dimensionless moving boundary position, S* , with different
moving boundary velocities, US, as a parameter, So=1.1(X=0.06),
0.1== ba CC ................................................................................................83

xiii
Figure 5-7: Local distribution of crystal mass deposition per unit area, N, versus radial
position, R, with different moving boundary velocities, US, as a parameter,
So=1.1(X=0.06), S*=0.2, 0.1== ba CC .......................................................84
Figure 5-8: Dimensionless crystal mass deposition per unit area at r=ro, No, versus
dimensionless moving boundary position, S* , with different moving
boundary velocities, US, as a parameter, So=1.1(X=0.06), 0.1== ba CC ...84
Figure 5-9: Dimensionless crystal mass deposition inside contact region, Mc, versus
dimensionless moving boundary position, S* , with Ca=1.0 and saturated and
supersaturated boundary conditions, Us=0.05 and So=1.1............................86
Figure 5-10: Dimensionless crystal mass deposition per unit area inside contact region,
Nc, versus dimensionless moving boundary position, S* , with Ca=1.0 and
saturated and supersaturated boundary conditions, Us=0.05 and So=1.1......86
Figure 5-11: Dimensionless crystal mass deposition per unit area at Ro, Nc, versus
dimensionless moving boundary position, S* , with Ca=1.0 and saturated and
supersaturated boundary conditions, Us=0.05 and So=1.1............................87
Figure 5-12: Local distribution of crystal mass deposition per unit area versus radial
position, R, with Ca=1.0 and saturated and supersaturated boundary
conditions, Us=0.05, So=1.1 and S*=0.2.......................................................87
Figure 5-13: Dimensionless crystal mass deposition inside contact region, Mc, at S*=0.2
versus initial moisture content, X, and US as a parameter, 0.1== ba CC ...88
Figure 5-14: Comparison of numerical results of crystal mass deposition inside contact
region and experimental data of cake strength for (a) US=0.05 and oven
drying (b) US=0.5 and air drying, dpm=1.02 mm...........................................90
Figure 5-15: Dimensionless crystal mass deposition inside contact region, Mc, at S*=0.2
versus moving boundary velocity, US, and So as a parameter, 0.1== ba CC
.......................................................................................................................91

xiv
Figure 5-16: Local distribution of height of deposited crystal layer on potash particle
surface versus radial position, R, with Ca=1.0 and saturated and
supersaturated boundary conditions, Us=0.05, So=1.1 and S*=0.2...............93
Figure 5-17: Dimensionless ion concentration, C, on the moving evaporation surface
(i.e.Z=S(τ)) versus dimensionless moving boundary position, S* , US as a
parameter, So =1.1(X=6%, R=Ro), 0.1== ba CC .......................................96
Figure 5-18: Dimensionless ion concentration, C, on the moving evaporation surface
(i.e.Z=S(τ), R=Ro) versus dimensionless moving boundary position, S* , X as
a parameter, US=0.05, 0.1== ba CC ...........................................................96
Figure 5-19: Dimensionless crystal mass deposition inside contact region, Mc, versus
dimensionless moving boundary position, S* , with different diffusion
coefficients, D, as a parameter, US=0.05, So=1.1 (X=6%), 0.1== ba CC ...97
Figure A-1: Schematic of a device to measure the bond strength between PVC plate and
a caked potash specimen.............................................................................109
Figure B-1: Compression test in the INSTRON machine used to determine Young’s
modulus and Poisson’s ratio for a caked potash sample.............................112
Figure D-1: Crystal mass deposition per unit area, N, at various radial position, R, with
different time step, t∆ , as a parameter, So=1.1, US=0.05� S*=0.2,
25/1=∆Z ...................................................................................................118
Figure D-2: Crystal mass deposition per unit area, N, at various radial position, R, with
different space step, Z∆ , as a parameter, So=1.1, US=0.05�S*=0.2,
st 310−=∆ ...................................................................................................119
Figure D-3: Crystal mass deposition per unit area, N, at various radial position, R, with
different tolerance,ε , as a parameter, So=1.1, US=0.05�S*=0.2, st 310−=∆ ,
25/1=∆Z ...................................................................................................120

xv
NOMENCLATURE
ENGLISH SYMBOLS
A surface area of crystal growth, [m2]
B coefficient
c electrolyte concentration, [mole/m3]
C dimensionless concentration
C1 defined coefficient
C1’ defined coefficient
C2 defined coefficient
C2’ defined coefficient
Ca dimensionless concentration on solid surface of particle for 0,10 =≤≤ ZR
Cb dimensionless concentration on solid surface of particle for 0,1 => ZR
cs solubility, [mole/m3] or [g/100g water]
D diameter of sample [mm], or diffusion coefficient of an electrolyte in water,
[m2/s]
+D diffusion coefficient for a cation, [m2/s]

xvi
−D diffusion coefficient for an anion, [m2/s]
do average distance between contact points on one particle, [mm]
dp particle diameter [mm]
dpm mean particle diameter [mm]
E Young’s modulus [Pa]
Eb measured Young’s modulus for caked potash sample [Pa]
h height of potash bed [mm]
HR Dimensionless height of deposited crystal layer on potash particle surface
k kth measurement
L height of cylindrical potash sample [mm]
Mc dimensionless crystal mass deposition inside the contact region 0,10 =≤≤ ZR
mc mass of crystal deposition inside contact region 0,10 =≤≤ ZR , [mole]
mci initial mass of KCl in the liquid film solution inside the contact region [mole]
Mg magnesium content [%]
N number of test samples, or dimensionless crystal mass deposition per unit area
nc average mass of crystal deposition per unit area inside the contact region, [mole]

xvii
Nc dimensionless crystal mass deposition per unit area inside the contact region
ni initial mass of KCl salt per unit area in the thin film solution [mole]
oN dimensionless crystal mass deposition per unit area at orr =
on mass of crystal deposition per unit area at orr = [mole]
q mass of crystal growth on a surface, [mole]
r radial position [m], or space variable for the cylindrical coordinate
r radius of cylindrical shell [m]
R dimensionless space variable, r/rc
rc thickness of contact region, [m]
mr mean radius of cylindrical shell [m]
Ro dimensionless outer radius of cylinder
s position of moving evaporation surface, [m]
S dimensionless position of moving evaporation surface, or estimate of the
standard deviation of sample mean
S* relative moving boundary position, S/δ
So dimensionless position of moving evaporation surface before drying, δ/rc

xviii
mS specific surface area per unit mass for potash bed, [m2/kg]
t time [s], or student multiplier
tc time constant [min]
T temperature [oC]
u displacement [m]
U uncertainty of measurement
us constant moving boundary velocity, [m/s]
US dimensionless moving boundary velocity
sv volume of infinitesimal evaporation layer, [m3]
V air velocity through the specimen [m/s]
Vs dimensionless volume of infinitesimal evaporation layer
x the length of the diffusion path, [m]
X initial moisture content, [w/w %]
Xb potash bed moisture content, [w/w %]
z axial position [m], or space variable in cylindrical coordinate
Z dimensionless space variable

xix
−z charge number for anion
+z charge number for cation
GREEK SYMBOLS
δ thickness of thin film before the start of the drying process, [m]
∆D displacement in lateral direction [mm]
∆L displacement in uniaxial direction [mm]
∆Z dimensionless space step in Z direction
∆t drying period [h], or time step [s]
ε porosity for potash bed, or tolerance
εl strain in lateral direction
εa strain in uniaxial direction
θ angular position (radians)
ν Poisson’s ratio
ξ dimensionless tensile stress )/( 22mrρωσ
ξc dimensionless radial stress at inner surface (i.e. at ψ= ψi)

xx
ρ bulk density of a potash bed [kg/m3]
ρw density of water [kg/m3]
σ stress [Pa]
σc loading stress [Pa]
τ dimensionless time(i.e. Fourier number for mass transfer), or shear stress [Pa]
Φ relative humidity [%]
ψ dimensionless radius of cylindrical shell mrr /
ω angular speed (rad/s)
SUBSCRIPTS
i inner side
o outer side
r radial
θ circumferential

1
CHAPTER 1
INTRODUCTION
1.1 General
As the most important potassium fertilizer, potash is widely used around world.
The final potash product is primarily comprised of sylvite (i.e. potassium chloride
(KCl)), but it contains internal and surface impurities. The mineral, sylvite, is mined
from naturally occurring ore bodies deposited about 1 km underground. After KCl is
produced and processed in a solution or flotation process, the final products are sold as
different types, each with a different particle size distribution. Standard and granular
potash are the two main commercial products for which the particle sizes range from 0.2
to 2 mm for the standard and 2 mm to 4 mm for the granular products. Figure 1-1 shows
these two kinds of potash produced by Saskatchewan Potash Corporation, Canada.
Potash can appear as white crystals produced by a solution mining process or red
crystals with traces of iron oxide produced by a mining machine and processed by a
floatation process. Almost all potash fertilizers are handled as bulk granular products.
Figure 1-2 shows the photography of a few potash particles with enlarged images for
particle size ranges of (a) 0.85 mm ~1.18 mm and (b) 2.85 mm~3.30 mm.

2
(a) (b)
Figure 1-1: Two types of potash sold as commercial products (a) Standard Potash and
(b) Granular Potash
(a) (b)
Figure 1-2: Photos of a few potash particles with enlarged images for particle size ranges
(a) from 0.85 mm to 1.18 mm and (b) from 2.85 mm to 3.30 mm
100 mm

3
Figure 1-3 also shows a photo of a single potash particle with a mean particle
diameter of about 3 mm. Both Figure 1-2 and 1-3 show that each potash particle has an
irregular shape with sharp crystalline edges and the shape of each particle is unique.
Figure 1-3: Enlarged image of a single potash particle (dpm ≈ 3.00 mm)
After mining and processing, potash particles may trap some sodium chloride
and magnesium chloride crystals within or on the surface of the particles such as halite
(NaCl) and carnallite (KMgCl3·6H2O) microcrystals. The floatation or recrystallization
process, followed by a subsequent dying process to remove impurities in potash, results
in the surfaces of potash particles coated by a thin layer of mixed crystals which are
composed of small amounts of NaCl (halite) and KMgCl3⋅6H2O (carnallite) with some
local compositional variations.
When exposed in humid air, a potash particle will adsorb moisture from the
surrounding air during storage and transportation. Subsequently, when the relative
humidity drops, moisture will be removed from the granular particles by a drying

4
process. If this occurs at moisture contents greater than about 0.2%, big chunks or
clumps may form in potash beds. This process is called caking. Figure 1-4 shows the
caked potash samples. Experience and past research has revealed that the prime handling
problem with bulk fertilizer products such as potash is caking. Clumps or chunks in
potash impede the handling and flow of granular materials and are especially
unfavorable for the uniform distribution of potash particles in the soil by most
agricultural machines.
Figure 1-4: Caked standard and granular potash samples
Every year, millions of tons of potash fertilizer products are exported to the
United States, Brazil, China, Australia and other overseas markets. Before potash is
eventually spread in the soil, it is usually stored in warehouses or sheds that have no
temperature and humidity control. During storage and transportation, potash may
experience large temperature and humidity changes. Moisture accumulation on potash
surfaces will penetrate toward the inside of a potash bed over time. For this reason,
significant quantities of potash are wasted due to caking. Therefore, understanding the
100 mm

5
caking process and caking physical-chemical mechanism is essential to devise practical
means of preventing or reducing caking. In this research, a direct measurement of cake
strength subject to a range of test conditions is performed using a newly designed test
facility so that the cake strength of a bed of potash can be accurately quantified. To
understand the measured data, a theoretical/numerical model of the caking process is
needed so as to quantify the physical-chemical mechanism.
1.2 Caking in Potash
The caking process in bulk potash products is a complex chemical and physical
process which involves coupled heat and moisture transfer in potash beds. The caking
sequence always starts with moisture accumulation which causes dissolution, and ends
with a dying process (i.e. a water evaporation process) which results in recrystallization
from the aqueous solution films on particle surfaces.
For an aqueous chemical solution system consisting of ions of K, Na, Mg, and Cl
from molecules of KCl-NaCl-MgCl2-H2O, the corresponding room temperature
equilibrium solid phase products (precipitation products) are sylvite, halite and
carnallite, if there are sufficient potassium ions in the solution. These salts are
hygroscopic with deliquescent relative humidities of about 52% for carnallite, 75% for
halite, and 85% for sylvite. The existence of these surface impurities causes the potash-
moisture interactions to significantly deviate from that of pure potassium chloride. A
relative humidity of 52% is the critical relative humidity for the onset of water vapor
adsorption and condensation on potash when carnallite is present on particle surfaces.
When a dry potash sample is exposed to ambient air relative humidity above 52%, the

6
potash will absorb water vapor which forms an aqueous salt solution layer on the
particle surfaces. The dissolution process of different salts will increase with increasing
relative humidity and there will be interactions among the three types of dissolved salts
such that, above 52% relative humidity, the surface carnallite will tend to dissolve
completely, above 75% the halite will dissolve and above 85% the sylvite will dissolve
(Peng et al., 1999).
Moisture adsorbed into potash beds and accumulated on the surface of any
exposed particles will dissolve the solid potash to from a thin layer or film of electrolytic
solution on the surface of each particle. When this potash is dried, the aqueous solution
layer will evaporate and KCl will recrystallize on the particle surfaces. Previous research
showed that the caking process of potash is mainly caused by the growth of crystal
bridges at or near contact points between particles as shown in Figure 1-5 (Kollmann
and Tomas 2001). When crystal bridges are distributed extensively on many adjacent
particles in a bed, the dried bed is caked. These crystal bridges develop during storage
and transportation due to continuous internal water interactions and thermal effects
which result in the deposition of crystals under certain conditions from the salt solutions
present in potash bed. There are many factors that influence the rate and extent of potash
caking. Chen (2004) reviewed such factors including chemical composition and
hygroscopicity, particle size and packing, moisture content, relative humidity of adjacent
air, pressure in potash pile and temperature.

7
Figure 1-5: SEM image of a solid bridge between two particles of potash due to a
recrystallization microprocess (Kollmann and Tomas 2001)
In this study, it is expected that the formation of cakes or the recrystallization of
salts near or at the contact points between particles depends on the initial moisture
content, the rate of drying and chemical composition of the salt solution on the surfaces
of the particles. Accurate measurements of cake strength are needed for each of these
important factors. A theoretical/numerical model is needed to simulate the
recrystallization process near or at contact points between particles during drying
processes.
Studying the heat and moisture transfer in potash beds and understanding the
mechanism of caking has been the subject of several research studies in recent years and
is of considerable engineering interest because of its economic impact. Many papers
have been published in a variety of journals concerning the storage handling, and caking
of bulk materials such as potash.

8
1.3 Literature review of potash products
The previous research works concerning caking of bulk materials are reviewed in
different areas. Some investigations on heat and moisture transfer in potash at the
University of Saskatchewan are reviewed in section 1.3.1, cake strength studies for bulk
materials in section 1.3.2, cake strength measurement in section 1.3.3, and studies on
recrystallization processes in section 1.3.4.
1.3.1 University investigations of heat and moisture transfer
In recent years, several research investigations on heat and moisture transfer in
potash have been performed at the University of Saskatchewan. Peng et al. (1999)
modelled the thermodynamic state of potash over a range of relative humidities and
predicted the moisture content (i.e. as an aqueous solution of three different salts, KCl,
NaCl and KMgCl3·6H2O, each with a unique concentration). A solubility analysis of
potash fertilizer at thermodynamic equilibrium was presented. The equilibrium constant
method was used to analyze and solve the equilibrium dissolution reaction of potash
with moisture as a function of the adjacent air relative humidity or surface solution
activity. A critical relative humidity for the existence of a surface aqueous solution
saturated with three solid salts (sylvite, halite and carnallite) but predominately carnallite
was found around 52% relative humidity with slight temperature dependence. This
relative humidity is defined as the critical relative humidity for the onset of condensation
on potash when a small fraction of carnallite exists on the particle surfaces. When the
environmental relative humidity is lower than 52%, the potash will adsorb a small

9
amount of water vapour and several layers of adsorbed water may exist on the surface.
When the relative humidity exceeds 52%, water vapour will condense and cause
dissolution of the potash salts until a new equilibrium is reached. The relationship
between the relative humidity and the equilibrium moisture content was established by
the dissolution calculation using the Pitzer chemical equilibrium model for multi-species
electrolyte.
Peng et al. (2000) studied the heat and mass transfer due to air flow through a
granular potash bed experimentally and numerically. They used an experimental setup to
measure the temperature and air humidity response and mass gain of a potash bed
subject to a step change in air flow down through the bed. The transient temperature and
moisture content distribution was predicted using a porous medium
mathematical/numerical model. Experimental and numerical results showed that non-
equilibrium internal moisture and heat transfer processes existed in the bed with
significant differences between the pore air properties and particle temperature and
surface relative humidity. The dissolution of potash, due to humid air flow through a
potash bed, causes a significant temperature rise and humidity decrease in the exhaust
air. The adsorption and dissolution during potash-water vapour interaction causes the
temperature of solid particles to be significantly higher than the air temperature,
necessitating the use of two coupled energy equations, one for the gaseous component
and the other for the solid-liquid component of the bed.
Zhou (2000) measured the macroscopic properties of each of six different types
of potash products and measured the moisture accumulation in a test bed of two potash
fertilizer products, standard and granular. He developed a one-dimensional transient

10
numerical model to simulate coupled heat and moisture diffusion in a test bed, including
adsorption/dissolution and condensation at the air-potash interface. Experimental data
were compared to the numerical simulations for a range of operating conditions.
Arinze et al. (2000) collected and correlated experimental data for thin-layers
during moisture adsorption, drying and caking for different potash products. Analysis of
these data showed the caking propensity of potash products was strongly dependent on
the surrounding air humidity and storage time. Empirical correlations were developed to
predict moisture uptake, drying time and potential for caking in laboratory potash test
samples. Arinze et al. (2001) studied the factors that favour caking in potash and
suggested an empirical relationship between potash cake strength as determined
qualitatively and peak moisture content, storage time and self-imposed pressure. Other
factors that were not investigated but may influence the extent of a potash cake include:
chemical composition on the particle surfaces; particle size, shape and packing; the
history of ambient air humidity adjacent to the test bed; hydrostatic pressure in the test
bed; and atmospheric temperature and pressure variations.
Peng et al. (2001) measured the enthalpy change or the thermal energy release
during a potash-moisture interaction using a method developed by Tao et al. (1992) for
two typical granular potash fertilizers with slightly different surface chemical
composition. It was found that the combined enthalpy change, including heat of
adsorption, condensation and dissolution is a function of the moisture content and trace
chemical impurities on potash particles surface. At low moisture content, the enthalpy
change is much larger than the combined heat of dissolution and latent heat of
evaporation/condensation, which declines with moisture content so that for moisture

11
contents above 1% the latent heat effects equal that for water in contact with a salt
mixture.
A dry air wall jet was studied by Gao (2001) which may be used to protect
potash from humid air in large storage buildings. The wall jet mean velocity, relative
humidity and moisture accumulation were investigated using an experimental test
facility for measuring changes in the wall jet. The decay of maximum velocity, growth
of the jet half-width, and self-similarity of the wall jet variation with distance from the
jet exit were determined from measured data. The skin friction coefficient and mass
transfer coefficient were calculated for the fully developed flow region of the wall jet.
Studying fully developed wall jet air flow over both rough and smooth surfaces showed
that the maximum velocity decays much more rapidly for rough surfaces than for
smooth surfaces and that wall jet separation can readily occur due to the heating effects
of water vapour condensation when the supply air relative humidity is above 60%.
Chen et al. (2004) experimentally and theoretically investigated the important
properties required to determine moisture transfer by capillarity, gravity, and diffusion
within a particle bed of potash such as porosity, permeability, specific surface area, and
irreducible saturation for narrow ranges of particle size. Porosity and permeability were
directly measured and specific surface area was calculated using the Carman correlation.
The irreducible saturation level in a granular potash bed was deduced from experimental
data when there was agreement with a theoretical/numerical simulation of moisture
movement by capillarity and gravity. It was shown that, for a bed mixture with a wide
range of particle sizes (i.e. as in typical potash products), the potash bed properties can
be predicted from the properties for each narrow range of particle sizes in the mixture.
12
Chen (2004) developed a one-dimensional transient numerical model of moisture
transport accounting for diffusion, capillarity and gravity effects within potash beds.
Two kinds of moisture transport mechanisms were presented, moisture transfer caused
by liquid film movement due to capillarity and gravity effects in a wet region where
local moisture saturation level, S, is larger than an irreducible saturation, S0, and water
vapour diffusion and water adsorption in layers on the surfaces in a dry region where S
is less than S0. The moisture content spatial distribution for different particle sizes under
different initial conditions was also measured using an experimental facility. Both
experimental data and numerical simulation results showed that the irreducible
saturation is a strong function of particle size and this property will decrease as particle
size increases. This research for step changes in bed moisture content indicated that
water vapour diffusion will always occur through the interstitial void spaces between
particles but water drainage due to gravity will only occur when the initial moisture
content exceeds the critical value for each particle size.
Moisture transport in potash beds is the essential factor to cause caking problems
in potash products. These research studies on the heat and moisture transfer processes in
potash provided valuable data and theoretical/numerical models so that one can
understand the mechanism of moisture accumulation, salt dissolution and moisture
movement in a humid environment. No studies were done on the caking process
resulting from recrystallization during drying and no direct measurements of the cake
strength were taken, nor were fracture stresses calculated.

13
1.3.2 Cake strength studies for bulk materials
Since the 1930’s, many papers and reports have been published concerning the
handling, caking and application of bulk materials such as potash. Rumpf (1958)
reviewed agglomeration phenomena, including both desired phenomena such as
granulation and the formation of large particles from small ones, or undesired
phenomena such as when cakes form in bulk granular materials which are intended to
retain free flowing characteristics. He also presented a synopsis of the various bonding
mechanisms. For the bonding mechanism with material bridges, Rumpf suggested the
investigation of the tensile strength of agglomerates to gain a fundamental understanding
using comparable data. He developed a theoretical equation for the tensile strength of
agglomerates bonded together in a bed of mono-sized spherical particles.
Guided by Rumpf’s theory and using a salt particle range of 15 µm to 60 µm,
Pietsch (1969) investigated the correlation between the drying behaviour and the tensile
strength of limestone agglomerates bound together by NaCl salt bridges in the dry state.
In this experimental study, limestone powders were wetted with a selected amount of
NaCl-solution and were pressed into cylindrical green pellets 30 mm in diameter. Each
sample was dried in an oven and machined to remove the crust layer which was about 2
mm thick. The tensile strength of these dry pellets was measured by using a specially
constructed tensile strength tester. The mean particle size of the limestone powders, the
initial percentage liquid saturation, the salt concentration of the solution and the drying
temperature were varied as independent parameters in a series of experiments. It was
stated that the tensile strength of the dry pellet depends on the quantity and the local
distribution of the crystalline salt on the surface.

14
Thompson (1972) presented a comprehensive review and experimental study of
the caking process in typical granular fertilizer products. He investigated the relationship
between caking of the granular fertilizer and moisture content, storage pressure,
temperature and time using a special laboratory cake strength apparatus. Each sample
was caked in a shallow mould and the differential pressure over the top and underneath
of the mould required to remove the caked sample in the mould was taken as a measure
of degree of cake. Experimental results revealed that these factors are all necessary to
create any significant cake. For ammonium nitrate prills he concluded that caking is
primarily brought on by a deformation process based on plastic creep. According to
Thompson these high pressure contact areas between prills are bound together by a
surface tension the pressure deficiency beneath a curved meniscus of the aqueous film
between prills. The long-term storage trail where the cake was measured in exposed
plastic bags subject to a drop test at the end of the test duration would be advisable to
confirm the results of laboratory tests.
Tanaka (1978) developed a theoretical model of a cake fracture stress in a caked
particle bed comprised of spherical particles in contact with one another. This model
was used to predict the ultimate cake strength of powder products such as NaCl. The
relationships between cake strength, moisture content and drying time predicted by
Tanaka indicates that the cake strength should be proportional to the square root of
drying time and an exponential function of the initial moisture content before drying.
Walker et al. (1998) investigated the caking process for mixed granular nitrogen,
phosphorus and potassium fertilizers for accelerated cake tests to determine the role of
unbound water, and the effect of ammonium chloride. Compression testing using an

15
Instron Test System was used to determine the cake strength of NPK fertilizer. They
indicated that the caking process is dominated by the accumulation and movement of
free water by capillary adhesion culminating in a crystal bridging process. Water at the
contact points is essential to cause caking. This investigation suggested that the presence
of free water on the surface of the granules causes mass transfer of saturated fertilizer
salts to the granule surface where solid crystal bridges can form upon evaporation.
Walker et al. (1999) continued the research work on the caking phenomenon in fertilizer
products. Their plastic creep-capillary adhesion model based on empirical correlation
was developed to predict the caking propensity of granular fertilizers considering the
increased granule-granule contact area caused by plastic creep. They found that the cake
strength increases with the increased steady-state creep rate, which is a function of
storage pressure.
Arinze et al. (2000) experimentally determined the relationship between moisture
content and a qualitative degree of caking. They further investigated (Arinze et al., 2001)
the factors that influence caking such as the environmental humidity and temperature,
moisture content, storage pressure, handling impact velocity and storage time and
developed empirical correlations for the onset of caking.
1.3.3 Cake strength measurement
In the past, several methods have been investigated to assess the cake strength in
potash fertilizer samples. These methods can be grouped into two categories:
comparative and quantitative methods. The Potash Corporation of Saskatchewan cake
measurement method is a typical comparative method to measure cake strength (Arinze
16
et al., 2000 and 2001). In this method, a caked potash sample is placed on top of a
standard screen mounted on a vibrator and the screen is vibrated for 10 seconds.
Compared to the initial mass the fractional mass of the sample retained on top of the
screen after this vibration is used to determine a comparative caked fraction. Empirical
results presented using this method are only meaningful when a large data base of
comparative samples are developed. This method of testing has proved to be useful in
evaluating the performance of various types of anti-caking agents added to the external
surfaces of potash particles.
In order to better quantify the mechanical cake strength of bulk samples,
various test devices have been used which may be classified as shear, compression and
tensile test methods. Shear type loads occur in granular bulk fertilizer piles when bulk
materials are moved by sliding the bulk material over surfaces or through hoppers. The
shear cake strength of granular bulk fertilizer, such as potash, has been characterized
using the Jenike Shear Tester, a device in which a caked cylindrical shaped sample is
sheared in half by a shear force while a normal axial force is applied on the sample
(ASTM Std. D6128-00, 2003; Kollmanu and Tomas, 2001). Compression type loads
occur in bulk fertilizer storage piles due to the hydrostatic weight of the bulk material
above any point inside a storage pile. A compressive test method was used by Walker et
al. (1999) to investigate the cake strength in cylindrical caked fertilizer specimens
similar in geometry to that specified to test concrete cylinders (ASTM Std. C39/C39M-
03).
These methods all require relatively complex models to determine the stress
at failure and this leads to large uncertainties in the data even when the auxiliary external

17
loads are carefully controlled. For example, shear testing with the Jenike Shear Tester
requires the user to apply a force normal to the shear plane along the axis of the test
cylinder and another force parallel to the shear plane across the cylinder in a test cell of
caked material. Since the force normal to the shear plane is selected on the basis of
empirical data, it adds complication to the stress analysis and results in large
compressive and shear stresses as well as local tensile stresses at the shear plane.
A tensile tester was used to measure tensile strength of caked sugar (Leaper
et al., 2002). In this technique, caked material was bonded to the surface of a split
cylinder whose two halves are pulled apart by a tensile force. The applied force at
fracture divided by the fracture surface area gives the tensile strength of the specimen
cake. Leaper investigated the caking effects of repeated exposures to cycles of ambient
air relative humidity between 70% and 20% by measuring this tensile strength for many
samples of caked materials. They found that, as the number of specimens increased, a
large variation in the tensile strength occurred. These results suggest that bonding
variations between sample and cell surfaces and the inconsistent position of the fracture
surfaces help to explain the significant variations in the experimental data for the
calculated failure tensile strength.
In both the Jenike shear test cell and the Leaper tensile test cell, an attempt was
made to force the sample failure surface to occur on a unique predetermined fracture
surface in each sample. This implies that the sample cake characteristics are
homogeneously distributed throughout the cell. In the test results of Leaper et al. (2003),
the stress field is uniform but the fracture surfaces are non-planar suggesting that the
assumption of homogeneity is not valid, even when care is taken to create test samples

18
with homogeneous properties. Although the compression test method of Walker et al.
(1999) does not depend on predetermined failure surfaces with each sample, it results in
stresses in each test sample with complex compression, tension and shear components
that vary radially and axially throughout each sample.
1.3.4 Recrystallization process and moving boundary problems
Drying and caking in a bed of granular fertilizer during bulk storage are complex
chemical-physical processes. Most of the earlier investigations hypothesized that crystal
growth during a drying process may be a prime cause of caking. Kollmann and Thomas
(2001) showed a microscopic photo of what they claim is a crystal bridge in their study
of cake formation (Figure 1-5). In the past, recrystallization process which is a problem
with phase change and moving boundaries had been investigated experimentally and
numerically.
A simple tension testing method was used by Sun et al. (2006) to determine the
fracture tensile stress of pairs of specially prepared caked sodium chloride and
potassium chloride particles. In their study, NaCl and KCl particles, of 99% purity and
15 mm to 20 mm size, were cut into two pieces of approximately equal size by a
diamond saw to obtain smooth contact surfaces. The paired pieces of NaCl and KCl
were placed in contact and exposed to a cavity filling wetting, followed by a drying
process. After recrystallization, the fracture tensile stress for the caked particles was
measured. The surface roughness of contact areas was measured before and after testing.
Typical experimental results showed that the area-averaged tensile stress for these NaCl
and KCl particles was 330 KPa which is only a very small fraction of perfect molecular

19
bond strength for NaCl or KCl (i.e. 11.5 GPa for KCl and 15.2 GPa for NaCl). It was
also found that contact surface roughness of the original fracture surface area was 5
times larger after drying than that measured before wetting. These results imply that
only a very small fraction of the salt particle surface contact area is bonded or caked
together. Sun et al. (2006) suggested that although large crystals form everywhere on the
surface only a very few crystals develop contact points between the particles during
recrystallization. Microscopic image analysis of an original cut surface shows that the
largest crystal sizes formed during recrystallization were 1 to 2µm. Based on these
experimental findings, it can be concluded that only the region very near contact points
between particles in a particle bed are important for caking. During a caking process
between particles, only the crystals which are deposited very near contact points have
the potential to fill the gap between particles so that crystal bridges could form to bond
particles together. Outside these contact point regions the distance between particles in a
bed is larger than the crystal growth so no crystal bond can be formed between particles
during recrystallization.
Models of phase change with moving boundaries are called Stefan problems
due to his 1891 paper which correctly formulated the non-linear problem of phase
change from liquid to solid in a infinite domain with only one important dimension
(Carlslaw and Jaegar 1959, Yao and Prusa 1989). Muller-Krumbhaar (1975) considered
this Stefan problem for planar crystal growth surface due to transport of solute near a
moving crystal-liquid interface. He used several different perturbation methods of
solution to investigate the influence the solute concentration on crystal growth for
various cases with equilibrium and non-equilibrium boundary conditions, constant

20
cooling rate and temperature dependent diffusion coefficient in a semi-infinite domain.
Assumptions for this study included one dimensional effects, uniform temperature and
negligible gravitational effects. Crank (1984) has presented a detailed account of the
mathematical solution of moving boundary problems and reviewed the numerical
algorithms used to solve these problems. Wang and Hu (1999) numerically investigated
the concentration distribution for a quasi-steady state of solution crystal growth in a two-
dimensional rectangular container in a low gravity environment. They showed that it
was important to include the moving crystal growth interface because it influences the
concentration distribution in some cases.
Some research has been done to predict the deposition of a dissolved salt in a
liquid when the liquid water evaporates into a dry particle bed of soil and diffuses to the
top surface of the soil (Tsypkin and Brevdo, 1999).
1.4 Research Objectives
It is well understood that the initial moisture content in potash products is an
essential factor to influence the cake strength of granular potash but other factors such as
particle size, temperature and bed pressure also appear to play a role according to the
literature on moisture transport and caking. Several research works have been carried out
to try to determine the quantitative relationship between cake strength and these factors
using different cake strength measurements. As discussed above, one of the difficulties
in establishing such a relationship between cake strength and the above variables has
been the lack of an accurate test method.

21
It is also clear from the literature that the physical phenomena associated with
cake formation in particle salt beds, such as potash, are not entirely understood in spite
of the well known physical principles and chemical properties of electrolytic solutions.
This dearth of a good theoretical model, which has been partly a consequence of
insufficiently accurate cake strength data and controlled test methods, has led
researchers to list and correlate many factors that appear to influence caking when in
fact there are maybe only a few important factors. There is a need to model and simulate
these primary factors that influence caking and to compare these predictions with more
accurate cake strength data.
Therefore, a new experimental method which can measure cake strength of the
caked potash sample with a high accuracy and the theoretical/numerical model to
simulate/predict the caking process around contact points between particles would be of
great practical significance. The primary factors such as initial moisture content, particle
size, drying time and chemical composition on particle surfaces need to be tested using a
new experimental method. Data from these tests should be compared with the prediction
by the developed numerical model of recrystallization near one contact point between
two potash particles during drying process. The main objectives of this research are:
(1) To develop a new test method to accurately measure the fracture strength of caked
potash samples.
(2) To investigate and quantify the effects of initial moisture content, drying process,
particle size and chemical impurities on the strength of caked potash test samples
using the new test method in (1) and specify the uncertainty in these data.

22
(3) To develop an analytical/numerical model for the caking process near the contact
points between particles in a test sample.
(4) To investigate the caking process with the numerical model in (3) by varying
significant physical effects such as initial moisture content, evaporation rate and
supersaturation on each particle surface.
(5) To compare the numerical model predictions in (4) with the measured cake strength
data from (2).
In order to achieve these objectives, a number of steps are required to measure
the cake strength of a caked potash sample and develop the theoretical/numerical model
of recrystallization near one contact point between two potash particles during a drying
process. These specific steps include:
(1) Devise and design a new test facility that can be used to measure the fracture cake
strength of specimens such that the test results in a symmetrical stress field which is
predominately tensile but has no specific fracture plane. Develop a mathematical
model for the stress distribution at the condition of sample fracture.
(2) Prepare test samples for a range of test conditions by changing the key parameters
such as: initial moisture content, particle size, drying time and chemical
compositions (i.e. magnesium content) of potash particles. Measure the cake
strength and explore the relationship between cake strength and these factors.
Determine the uncertainty in these data for each set of tests.

23
(3) Theoretically formulate and numerically model the recrystallization process due to
thin film evaporation on wetted salt particles close to one contact point between two
particles. Simulate the mass distribution of recrystallization near this contact point
to investigate the effects of the initial thickness of the liquid film electrolytic layer
(i.e. initial moisture content), velocity of moving liquid film-air interface or rate of
drying, and the degree of supersaturation on the solid surface near the contact point.
(4) Compare the simulated results of mass deposition near a contact point with
previously measured cake strength in sample test beds of potash. For various
parameters used in this numerical model, investigate the sensitivity of the important
properties.
1.5 Overview of Thesis
A centrifugal loading method to measure the cake strength in a caked potash ring
is described in Chapter 2. The details of the test apparatus, test sample preparation and
measurement techniques are presented in this chapter. A stress analysis is also presented
relating the speed of the centrifuge to when the specimen fractures. The cake strength is
measured for the tests in which the initial moisture content and drying time of each
sample is varied.
Chapter 3 presents the experimental data obtained during a series of tests in
which the initial moisture content, particle size, drying duration and chemical content of
particles are varied. The relationship between cake strength and these factors are shown
in this chapter along with the uncertainty analysis of the data and the correlations used.

24
Chapter 4 develops a theoretical/numerical model to simulate ion diffusion and
crystallization near one contact point between two potash (KCl) particles during a
typical drying process. This model can be used to examine the recrystallization process
between potash particles as a result of water evaporation after the particles have been
previously wetted.
Chapter 5 investigates the effects of three independent factors on the caking
process: initial moisture content; evaporation rate and degree of supersaturation on the
surrounding surface. Qualitative agreement between simulated results and measured
experimental fracture stress data is investigated in this chapter.
In Chapter 6, the summary and conclusions of this research are presented.
Several recommendations and suggestions for future work are proposed.
The appendices includes: (1) Experimental measurement of the bond strength
between the caked potash and a PVC plate; (2) Measurement of elastic properties for a
caked potash sample; (3) Measured experimental data for cake strength; and (4)
Sensitivity studies on parameters used in the numerical model.

25
CHAPTER 2
MEASUREMENT OF CAKE STRENGTH IN POTASH
USING A CENTRIFUGE
2.1 Background
Accurate measurement of cake strength is of great importance to understand the
caking process for bulk fertilizer products and it may also have a practical value for
quality control. In the past, the caking behavior of potash fertilizer products was
characterized using several different test methods including qualitative measurement
such as the PCS comparative measurement method (Arinze, 2000) and quantitative
measurements such as the Jenike Shear Test method. The comparative method provides
empirical results for a large data base of different quantitative samples. The Jenike test
method results in three dimensional strain effects that cause large uncertainties in the
data.
Textbooks on fracture mechanics (e.g. Craig, 2000; Felbeck and Atkins 1984)
state that the failure mode of brittle materials will be primarily caused by tensile stresses,
and not by compression or shear stresses at the fracture surface. This would suggest that
caked particle test samples should be loaded in such a manner that the tensile stresses
dominate. However, due to the somewhat random nature of the caking properties in

26
particle beds, no attempt should be made to predetermine the location of the failure
surface inside a caked sample.
One device that can produce this type stress field is a centrifuge. In this research,
the fracture cake strength of potash will be measured using this new method that results
in symmetrical stresses that are predominately tensile. This device can be used to find
the relationship between the cake strength in a potash bed and its initial moisture
content, drying time, particle size and chemical composition of particles.
The strength of cake bonds between particles may be compared to the strength of
pure crystals, but the surface area of the contact points between the particles in a packed
bed is many orders of magnitude smaller than the cross-sectional surface area of the bed.
When caking occurs this results in a low, but significant, area-averaged fracture strength
caused by the chemical bonds between the particles near their contact points within a
caked bed of particles. As mentioned previously, brittle materials, such as caked potash,
usually fail in tension. Because crystalline caked potash is a brittle material, a tensile
stress induced failure is expected to be the most likely mode of failure. With such a
brittle material the ultimate fracture cake strength is best determined using a test
specimen under tension with little or no asymmetries or stress concentrations on the
boundaries of the specimen.
A centrifuge was used to create the internal tensile stress field in a ring specimen
of potash particles in a caked sample subjected to a constant rotational speed. The
continuum method of stress analysis in a two-dimensional plane-stress ring is used to
calculate the area-averaged tensile stress required to fracture a caked potash sample.
27
This method of analysis assumes that the caked specimen is a continuum with
homogenous and isotropic properties. In this method a two-dimensional, plane-stress,
elastic stress-strain field with a finite radial stress on the inner surface boundary is
considered. This results in a slightly non-uniform tensile stress distribution on any radial
cross-section of the specimen.
In this chapter, a detailed description of experimental facilities and test procedure
is presented. The stress analysis at the sample fracture and the calculation of area-
averaged fracture tensile stress (i.e. cake strength) are presented. The cake behaviour of
potash for one particle size range from 0.85 mm to 1.18 mm is evaluated first for various
initial moisture contents and drying procedures using this method.
2.2 Test Principle
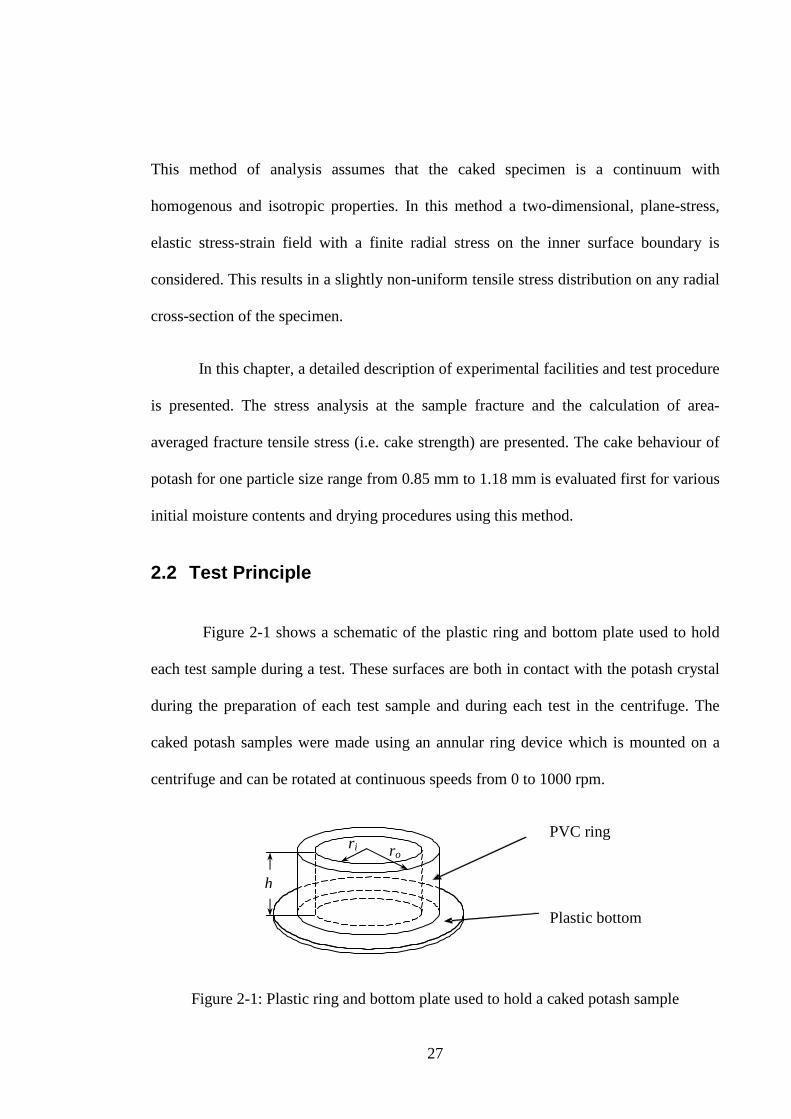
Figure 2-1 shows a schematic of the plastic ring and bottom plate used to hold
each test sample during a test. These surfaces are both in contact with the potash crystal
during the preparation of each test sample and during each test in the centrifuge. The
caked potash samples were made using an annular ring device which is mounted on a
centrifuge and can be rotated at continuous speeds from 0 to 1000 rpm.
PVC ring
Plastic bottom
Figure 2-1: Plastic ring and bottom plate used to hold a caked potash sample
h
ro r i

28
Figure 2-2 (a) is a photograph of the annular ring which is configured for caking
preparation between the two concentric rings and Figure 2-2 (b) is a photograph of a
prepared cake. The cylindrical height, h, of each sample tested was 27 mm, the sample
wall thickness, (ro-r i), was 12 mm, and the radius of the inside radius, r i, was 65.5 mm.
The test cell is made up of a horizontal circular plastic base upon which sits a plastic
tube, which is surrounded by a removable outer circular plastic cylinder as shown in
Figure 2-2 (a).
(a) (b)
Figure 2-2: Photos of (a) plastic annular ring device to make caked potash samples and
(b) prepared caked potash sample with its holder for testing in a centrifuge
2.2.1 Stress analysis in a 2-D plane-stress ring
The geometry of the caked potash sample in a packed bed of particles with
known uniform and isotropic properties of porosity and density is assumed to be a
symmetrical cylindrical shell. Figure 2-3 shows a schematic of a 2-D ring of potash and
29
r θ
�r
�r+d� r
�
r
���
� �
(r+dr)d� dr
rd� cm
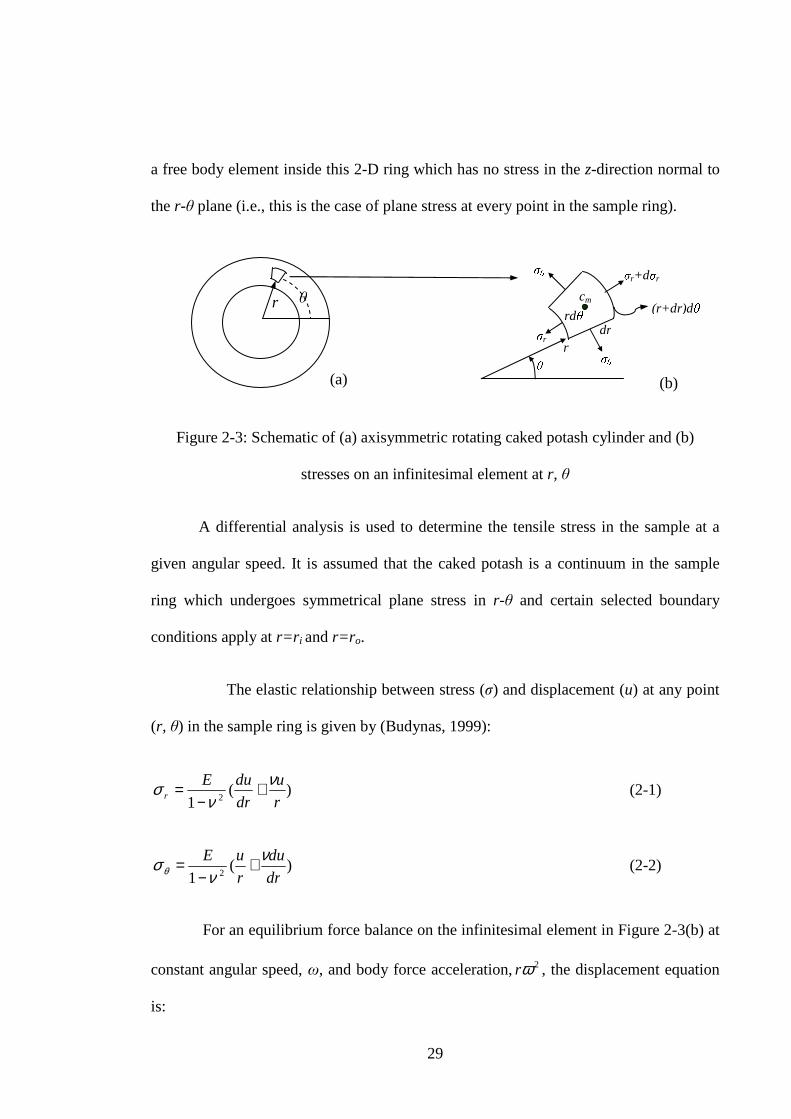
a free body element inside this 2-D ring which has no stress in the z-direction normal to
the r-θ plane (i.e., this is the case of plane stress at every point in the sample ring).
Figure 2-3: Schematic of (a) axisymmetric rotating caked potash cylinder and (b)
stresses on an infinitesimal element at r, θ
A differential analysis is used to determine the tensile stress in the sample at a
given angular speed. It is assumed that the caked potash is a continuum in the sample
ring which undergoes symmetrical plane stress in r-θ and certain selected boundary
conditions apply at r=r i and r=ro.
The elastic relationship between stress (σ) and displacement (u) at any point
(r, θ) in the sample ring is given by (Budynas, 1999):
)(1 2 r
u
dr
duEr
νν
σ +−
= (2-1)
)(1 2 dr
du
r
uE νν
σ θ +−
= (2-2)
For an equilibrium force balance on the infinitesimal element in Figure 2-3(b) at
constant angular speed, ω, and body force acceleration, 2ωr , the displacement equation
is:
(a) (b)

30
2222
2
)1(11 ωρν rEr
u
dr
du
rdr
ud −−=−+ (2-3)
Solving this non-homogeneous and linear ordinary differential equation and
using the definition of tangential stress and radial stress in equations (2-1) and (2-2)
gives the stress components at any point inside the test specimen:
2222
1 8
)3(r
r
CCr ρωνσ +−+= (2-4)
2222
1 8
)31(r
r
CC ρωνσ θ
+−−= (2-5)
where C1 and C2 are coefficients of integration which are determined from the boundary
conditions presented in section 2.2.2 and are related to the rotational speed, ω. The mean
radius of the cylindrical test sample shell, 2/)( iom rrr += , is used as a characteristic
radius. The dimensionless forms of σr and σ � are:
22
'2'
1 8
)3( ψψ
ξ vCCr
+−+= (2-6)
22
'2'
1 8
)31( ψψ
ξθvC
C+−−= (2-7)
where22
mrρωσξ θ
θ = , 22
m
rr
rρωσξ = and
mr
r=ψ
22
1'1
mr
CC
ρω= ,
42
2'2
mr
CC
ρω=

31
For a radial fracture section the dimensionless area-averaged tensile hoop stress
is defined as:
∫−=
o
i
dio
ψ
ψθ ψξ
ψψξ 1
(2-8)
2.2.2 Boundary conditions
In order to analytically solve the equation for stress in the caked potash shell
under a centrifugal force, the boundary conditions at the inner surface and outer surface
must be specified. The tensile hoop stress and radial stress distributions will be
determined subject to these boundary conditions.
For the outer surface of the caked potash shell which is exposed to air, the
dimensionless radial stress is zero (i.e. 0== orrrξ ).
For the inner surface, the caked potash is bonded to the PVC ring. The boundary
condition at this surface needs special consideration. The displacement of the inner
surface of caked potash is not expected to be exactly zero when the angular speed is
finite but, for the low speeds used, it will be very small. This potash-PVC interface
cannot support a large stress because potash does not bond well to smooth plastics and,
for a given volume of bulk material, the number of particle-plastic surface contact points
is much smaller than the number of contact points between particles elsewhere in the
bed. At the instant of fracture it is expected that the radial stress on the plastic surface,
compared to the tensile hoop stress, should be small. The area-averaged tensile stresses
are many orders of magnitude smaller than the stresses that can exist in perfect chemical

32
bonded crystals and the number of contact points between particles per unit volume of
bed which form strong chemical bonds in caked potash is the important factor in
determining the ultimate area-averaged stresses in a caked bed. A higher number of
contact points between particles per unit volume imply a larger contact point area per
unit volume and a stronger cake strength or ultimate stress. Figure 2-4 shows a two-
dimensional schematic of spherical particles in a caked specimen ring showing typical
contact points at a typical fracture surface between spherical particles (b) and on the
inner bed PVC- surface interface (c).
(b) (c)
Figure 2-4: Schematic showing (a) caked potash shell specimen, (b) particle contact
points on an internal fracture surface, and (c) fracture surface between the particles and
the PVC surface
2-D internal fracture surface
Internal fracture surface
Caked potash shell
Inner plastic surface
(a)
Inner plastic surface

33
Kaviany (1999) suggested a range of 6-12 contact points per particle for a typical
bed of nearly spherical particles. Potash particles, with an irregular crystalline shape,
may have a few more contact points per particle in a packed bed. A range of particle
sizes in a packed bed of particles will increase the number of contact points per unit
volume and when caked, the strength of the cake could be larger. As well, the existence
of very fine dust like particles attached to the larger particles will increase the surface
area per unit volume and potentially increase the cake strength. At the inner surface of
the caked test sample ring, there will be only one contact point per particle on the PVC
surface. Also, the strength of the chemical bond between particle and PVC material will
most likely be much smaller than the crystal-to-crystal bonds so it may be concluded
that the stress at the inner plastic surface will be much smaller than elsewhere.
Therefore, a small value of radial stress on the inner surface of a caked potash shell is
estimated to be a small fraction of the average tensile stress. Using this boundary
condition, the coefficients C1’ and C2’ in equations (2-6) and (2-7) are determined and
the stress distribution is determined. In appendix A, a simple test is presented to measure
the bond strength between caked potash and PVC plate. The experimental results show
that bond strength between potash and PVC material is about 400 times smaller than the
tensile fracture stress for any of the centrifuge tests.
In this research, the radial stress at the inner surface of the caked potash ring is
assumed to be zero (i.e. 0== irrrξ ). A sensitivity study of this boundary condition is
also presented by selecting very small stress on this boundary (i.e. crrr iξξ == where
22/ mcc rρωσξ = ).

34
2.2.3 Stress distribution
The Poisson’s ratio, ν, of caked potash sample was measured using a cylindrical
compression test specimen and an INSTRON tester, which is described in Appendix B.
This test determined Poisson’s ratio to be about 0.10. Before solving the 2-D plane-
stress model, another method of stress analysis was considered by applying thin shell
theory. Using fundamental solid mechanics, for a thin caked potash ring the tensile stress
distribution across the caked potash sample is determined while the radial stress, σr, on
the inner ring surface is neglected. Using this method, the tensile stress, σ � , is given
by 222mrωρ . Compared with the plane stress analysis method, this simplified calculation
for cake strength in a caked potash bed gives a reasonable approximation for the tensile
stress.
By solving the equations (2-4) and (2-5) subject to zero stress on the boundaries
irr = and orr = , the coefficients C1 and C2 are given by:
)(8
3 2221 oi rrC ++= ρων
(2-9)
2222 8
3io rrC ρων+−= (2-10)
In fact, thin shell theory is a special case for equations (2-4) and (2-5) as r i goes
to ro. In this case it means that moi rrr ≈≈ for a thin caked potash ring. Solving
equations (2-4) and (2-5) using the determined C1 and C2 which are subject to zero stress
on both inner surface and outer surface, the tensile stress is also given by 222mrωρ .

35
A more general non-dimensional form of C1’ and C2’ is given by equations (2-
11) and (2-12) by considering a very small radial stress on the inner surface of caked
potash ring (i.e. crrr iξξ == ). A sensitivity study was carried out by selecting several
small radial stresses as the inner boundary conditions.
22
244
'1
)(8
3
io
icio
Cψψ
ψξψψν
−
−−+
= (2-11)
22
222222
2
)(8
3
'io
ioioioc
Cψψ
ψψψψνψψξ
−
−+−= (2-12)
Figure 2-5 shows the dimensionless tensile stress distribution, ξ � , in a caked
potash ring subjected to zero radial stress at inner boundary and two small constant
radial stresses, as well as the dimensionless tensile stress distribution using the method
of thin shell theory indicated by the straight line in this figure. It can be seen that the
dimensionless tensile stress, ξ � , is nearly linear with ψ over the radius of each specimen,
and the change in ξ � from inner to outer surface is small relative to the mean value. If the
rotating speed at the fracture of sample, ω , and density of caked potash sample, ρ , are
known, the dimensional stress distribution at fracture will be determined and the area-
average tensile stress (i.e. cake strength) can be calculated. Therefore the measurement
of rotating speed at the instant of sample fracture will establish the fracture stress in this
new test experimental method.

36
0
0.2
0.4
0.6
0.8
1
1.2
0.92 0.94 0.96 0.98 1 1.02 1.04 1.06 1.08
Dimensionless Radius, �
Dim
ensi
onle
ss te
nsile
Str
ess,
� �
�c=0
�c=0.005
�c=0.01
rigid body-thin shell thoery
Figure 2-5: The radial distribution of dimensionless tensile stress ,ξ � , in a caked potash
ring for ν = 0.1 with inner radius dimensionless stress as a parameter
The sensitivity study of the inner boundary conditions also shows that the very
small radial stress on the inner surface will not influence the stress distribution in the
specimen significantly. Therefore, using a zero radial stress on the inner surface will
give reasonable accuracy for the stress analysis. In this research, this boundary condition
will be used to calculate cake strength for each test caked potash sample.
Figure 2-6 shows of Mohr’s circle for plane stress in an isotropic media (Pilkey,
2005), which illustrates how the normal and shear stress components vary at every point
in a test sample as a function of stress surface orientation angle, θ. The normal stresses
equal the principal stresses when the stress is aligned with the principal directions (i.e. r
and θ directions). The shear stress is a maximum when the surface on which stress
occurs is rotated 45o away from principal directions and its value equals 2)( rσσ θ − .

37
Figure 2-6: Mohr’s circle diagram for plane stress in a caked potash structural element
The principal stresses are θσσ =max and rσσ =min for the symmetric ring sample
and the maximum shear stress distribution over the range of radii for the case of zero
radial stress on the inner boundary are shown in Figure 2-7.
0
0.2
0.4
0.6
0.8
1
1.2
0.92 0.94 0.96 0.98 1 1.02 1.04 1.06 1.08
Dimensionless Radius, �
Dim
ensi
onle
ss S
tres
s,
�
tensile stress
maximum shear stress
radial stress
Figure 2-7: Principal stresses and maximum shear stress distribution across caked
potash for a radial cross-section
σ-axis (normal stress)
τ-axis (shear stress)
o C σ � σr
τmax
2θ
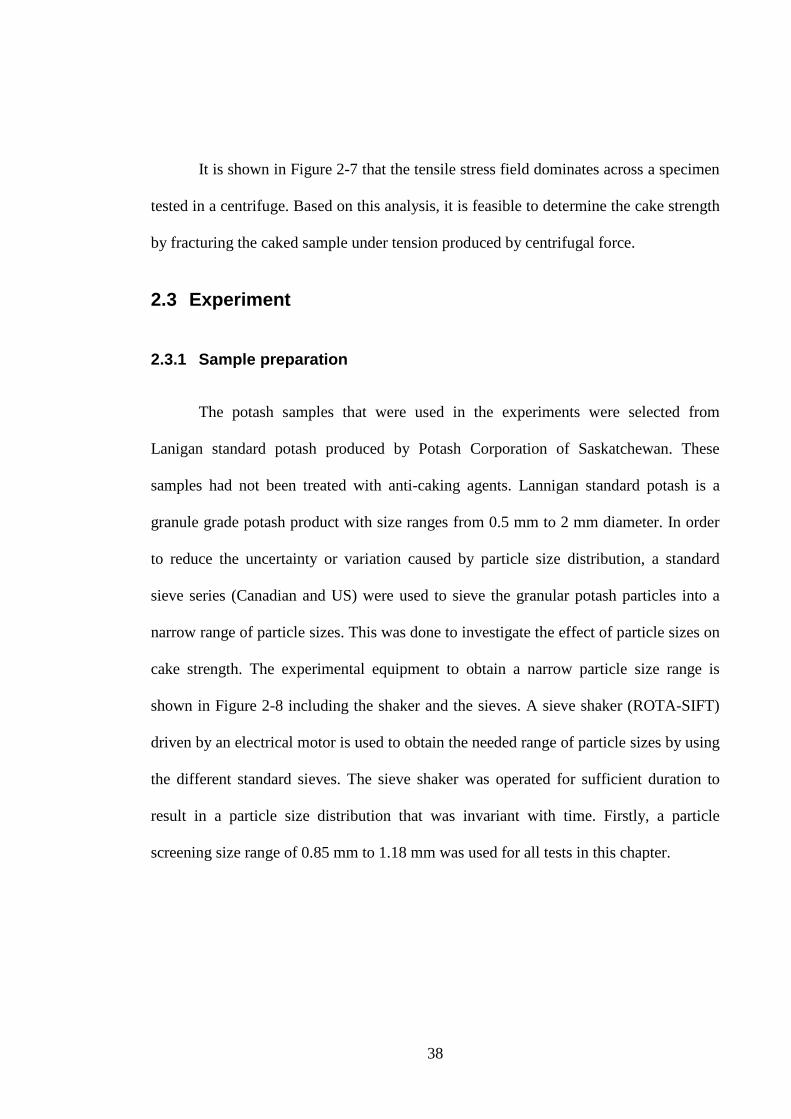
38
It is shown in Figure 2-7 that the tensile stress field dominates across a specimen
tested in a centrifuge. Based on this analysis, it is feasible to determine the cake strength
by fracturing the caked sample under tension produced by centrifugal force.
2.3 Experiment
2.3.1 Sample preparation
The potash samples that were used in the experiments were selected from
Lanigan standard potash produced by Potash Corporation of Saskatchewan. These
samples had not been treated with anti-caking agents. Lannigan standard potash is a
granule grade potash product with size ranges from 0.5 mm to 2 mm diameter. In order
to reduce the uncertainty or variation caused by particle size distribution, a standard
sieve series (Canadian and US) were used to sieve the granular potash particles into a
narrow range of particle sizes. This was done to investigate the effect of particle sizes on
cake strength. The experimental equipment to obtain a narrow particle size range is
shown in Figure 2-8 including the shaker and the sieves. A sieve shaker (ROTA-SIFT)
driven by an electrical motor is used to obtain the needed range of particle sizes by using
the different standard sieves. The sieve shaker was operated for sufficient duration to
result in a particle size distribution that was invariant with time. Firstly, a particle
screening size range of 0.85 mm to 1.18 mm was used for all tests in this chapter.

39
Figure 2-8: Experimental apparatus for particle sieving
The sieved potash particles were firstly dried at 70 oC for 24 hours to eliminate
residual moisture content. In order to prepare a caked sample of potash a known mass of
water was then added to a known mass of potash and the initial moisture content was
calculated. After complete mixing of the water and potash by an electric mixer, the wet
potash was placed into the plastic annular ring device shown in Figure 2-2 (a). It was
packed and vibrated until no more particles could be added. Then the wetted sample was
dried. In this study, three different drying processes were used to investigate the effect of
different drying duration on cake strength. These three drying methods are controlled
relative humidity drying, oven drying and air drying. In controlled relative humidity
drying, the sample was dried inside a closed container with a saturated salt solution on
bottom which produces the ambient air at 52% relative humidity. This drying process
typically needs a time duration of 4 days. In oven drying, the sample was dried at a
controlled temperature of 40 Celsius for a time duration of 10 hours. A designed and
built air drying facility used for air drying is shown in Figure 2-9. The samples

40
(maximum 5 samples at once) were placed on the facility and the air at room
temperature and room relative humidity was forced to flow through the samples and
dried the samples for about half an hour.
Figure 2-9: Schematic of the air drying facility which can dry five samples at once
Among the three drying processes used in this research, air flow drying resulted
in the fastest drying process and the controlled relative humidity drying was the slowest.
Table 2-1 shows the conditions of the three different drying methods, all with the same
initial moisture content of 2.6 % (w/w).
Fan
Air flow
Air flow
Test sample

41
Table 2-1: Drying Conditions for Potash Test Samples
Method Td (oC) Φd (%) ∆td (hour) Vd (m/s)
Air flow ≈22 ≈20 0.25 0.3
Oven 40 ≈10 10 0
Controlled R.H. ≈22 52 110 0
For the three different drying methods, Figure 2-10 shows the dimensionless
moisture content versus dimensionless time for the first four time constants tc using the
exponential decay correlation cttb eXX // −= , where tc is the time for the dimensionless
moisture content, Xb/X, to drop from 1.0 to 0.37 and the initial moisture content, X, is
2.6% (w/w).
0
0.2
0.4
0.6
0.8
1
0.0 1.0 2.0 3.0 4.0
t/tc
Xb/
X
52% R.H drying,
oven drying at 40
air drying at
expontential decay,T � 22 oC,
�d � 20%,
oC,
tc=1900 min
tc=230 min
tc=7 min
Figure 2-10: Dimensionless potash moisture content versus dimensionless time for three
different drying processes

42
2.3.2 Experimental procedure
Once the sample had been dried, the outer cylinder was split in half and removed
and the caked ring sample seated on the circular plastic base with the inner plastic ring
attached was placed in the centrifuge. A special aluminium annular test cell holder had
been designed and built. This device, which can be used to hold the test specimen, was
assembled into the centrifuge. The test cell was attached to the holder and rotated with
the centrifuge. A non-contact tachometer was used to measure the angular speed of the
centrifuge. The centrifuge with the aluminium holder and the non-contact tachometer are
shown in Figure 2-11.
Figure 2-11: Experimental apparatus to measure fracture rotating speed including the
centrifuge, aluminium holder and non-contact tachometer
When testing, the speed of the centrifuge was increased gradually until the caked
ring of potash broke and the fracture speed indicated by the tachometer was recorded.
Figure 2-12 shows photos of caked potash sample mounted in the centrifuge before a

43
test (a) and after a test where the cake had fractured (b). The fractured ring sample inside
the centrifuge outer ring indicates multiple and somewhat symmetric fracture surfaces
around the test ring. The procedures for sample preparation and fracture rotating speed
were then repeated for each test specimen by varying drying methods and initial
moisture contents. In this experiment, the initial moisture content is varied from 0.25%
to 1% for constant 52% R.H. drying, from 0.5% to 4% for oven drying and from 1% to
6% for air drying.
(a) (b)
Figure 2-12: Photos of (a) a caked potash sample mounted on centrifuge before test and
(b) a fractured potash sample after test in a centrifuge
A high speed camera (30 frames per second) was used to capture the fracturing
process in the centrifuge. Figure 2-13 shows photos before and after the instant fracture
in a caked potash sample. Typically the caked ring specimen breaks into four pieces of
nearly equal size. The fracture surfaces in the caked potash ring at the point of sample
fracture are shown to be essentially flat surfaces at each of the four fracture angular
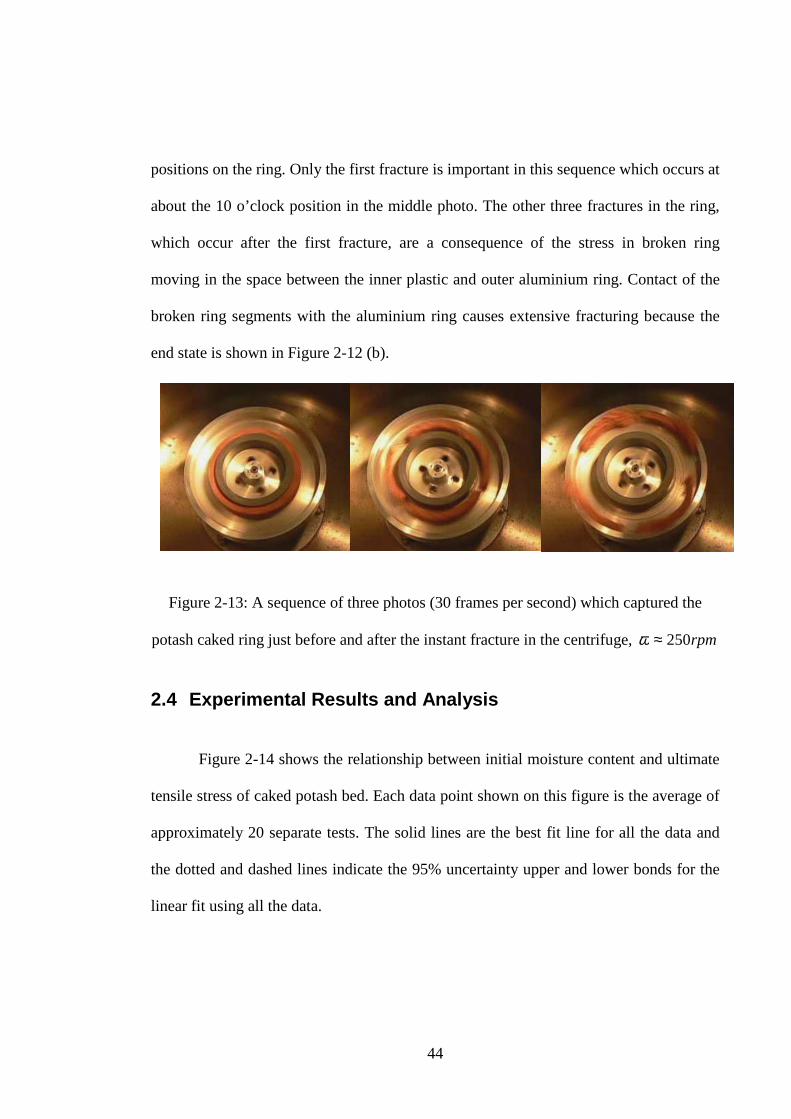
44
positions on the ring. Only the first fracture is important in this sequence which occurs at
about the 10 o’clock position in the middle photo. The other three fractures in the ring,
which occur after the first fracture, are a consequence of the stress in broken ring
moving in the space between the inner plastic and outer aluminium ring. Contact of the
broken ring segments with the aluminium ring causes extensive fracturing because the
end state is shown in Figure 2-12 (b).
Figure 2-13: A sequence of three photos (30 frames per second) which captured the
potash caked ring just before and after the instant fracture in the centrifuge, rpm250≈ω
2.4 Experimental Results and Analysis
Figure 2-14 shows the relationship between initial moisture content and ultimate
tensile stress of caked potash bed. Each data point shown on this figure is the average of
approximately 20 separate tests. The solid lines are the best fit line for all the data and
the dotted and dashed lines indicate the 95% uncertainty upper and lower bonds for the
linear fit using all the data.

45
0
10
20
30
40
50
60
70
80
0 1 2 3 4 5 6 7
Initial Moisture Content(%)
Fra
ctur
e T
ensi
le S
tres
s(K
Pa)
52% R.H. DryingOven Drying Air Drying upper uncertaintylower uncertaintybest fit line
Figure 2-14: Ultimate fracture tensile stress versus initial moisture content showing
average data points with three drying processes, dpm=1.02 mm
These data show that the cake strength is repeatable and increases linearly with
initial moisture content for each drying process. With greater initial moisture contents
there is a thicker film of solution on the particle surfaces. Thicker initial films or higher
moisture contents leads to more crystal bonds formed between particles after drying.
This figure also shows that each potash specimen will have an increasing cake strength
with longer drying processes for the same initial moisture content. For rapid drying
processes, fewer ions have the time to move towards to the contact points between the
particles in each specimen and this leads to fewer crystal bonds between particles during
recrystalliztion. These experimental results do not agree with the cake strength model
developed by Tanaka (1978). Tanaka predicted the cake strength should be proportional
to the square root of drying time and should be an exponential function of initial
moisture content. Our data imply that the cake strength will increase linearly with initial

46
moisture content. As well, the magnitude of the cake strength predicted by Tanaka does
not agree with the test data shown in Figure 2-14.
2.5 Summary
In this chapter, a new centrifugal loading method has been presented. This test
facility was used to measure cake strength in caked potash ring specimens and to
determine the area-average tensile stress at the speed of the centrifuge when each
specimen fractures. A two-dimensional elastic stress analysis is presented to calculate
the area-average fracture tensile stress
Stress analysis shows that the maximum stress at any centrifuge speed at any
point in the caked test rings will be tensile normal to an area element that has a vector
direction parallel to the ring tangent. Fracture mechanics of brittle materials, such as
caked potash, indicates each specimen will fail in tension. The location of the starting
point of this failure of the ring could be at any angular position on the ring specimen.
The cake strength is measured for a series of tests in which the initial moisture
content and drying time of each sample were systematically varied. For each
experimental condition, approximate 20 separate tests were repeated and the 95%
uncertainty for the linear fit of measured stress data was calculated using all the data for
each similar test condition. Repeated experimental tests show the feasibility of this new
centrifugal test method to determine the cake strength for potash samples with small
uncertainties. The experimental results show that the cake strength increases linearly
with greater initial moisture content and slower drying processes produce stronger cakes.
47
CHAPTER 3
EFFECTS OF PARTICLE SIZE AND CHEMICAL
COMPOSITION ON CAKE STRENGTH
3.1 Introduction
It is understood that potash fertilizer, as a strong electrolyte, will dissolve to form
a solution which consists of potassium ions (K+), sodium ions (Na+), magnesium ions
(Mg2+) and chloride ions (Cl-) due to a mix crystal of sylvite, with small amount of halite
and carnallite. These salts are hygroscopic with deliquescent relative humidities of about
52% for carnallite, 75% for halite, and 85% for sylvite. Any subsequent drying process,
due to ambient air temperature increases and humidity decreases, causes growth of
crystal bridges at or near contact points between particles. The formation of cakes or the
recrystallization of salts near or at the contact points between particles depends on the
rate of drying and chemical composition of the salt solution on the surfaces of the
particles. The cake strength or fracture stress of a dried sample specimen is expected to
increase with (i) the number of contact points per unit volume between the potash
particles (i.e. this fracture stress will increase with decreasing particle size), (ii) the
initial moisture content before drying and inversely with the drying rate (i.e. the faster
the drying process the weaker the fracture strength) and (iii) increasing fractions of

48
magnesium or carnallite content in the dried sample. In this chapter, the experiments are
carried out to quantify these relationships.
There are two purposes in this chapter: (1) to confirm and extend the data base
for the relationship between cake strength and initial moisture contents before drying
and to include a range of particle sizes of potash; (2) to explore the relationship between
cake strength and chemical compositions (i.e. magnesium content) of potash particles.
The uncertainty in the data is to be determined for each set of tests.
3.2 Test Conditions
3.2.1 Particle sizes
Samples were tested with four different ranges of particle diameter with a
magnesium content of about 0.02%. The facilities and procedure to obtain a narrow
range of particle size were described in Chapter two. The combinations of different sieve
mesh size series were used to prepare four different ranges of particle diameter which
are shown in Table 3-1.
Table 3-1: Untreated potash particle size for tests
Range 1 Range 2 Range 3 Range 4
Particle size dp(mm)
0.85 <dp< 1.18 1.18 <dp< 1.68 2.00 <dp< 2.36 2.80 <dp< 3.35
Mean particle diameter dpm(mm)
1.02 1.43 2.18 3.08

49
3.2.2 Magnesium content
Samples were tested with three concentrations of magnesium on the external
surfaces of the particles for one particle size range 0.85 mm to 1.18 mm (i.e. standard
potash). The calculated amount of MgCl2 salt was added to the standard potash and the
three magnesium contents of particles were obtained: 0.02, 0.06, and 0.10 % Mg. These
magnesium contents do not include the mass of Cl added.
3.2.3 Initial moisture content and drying methods
Each different type of potash was tested at three different moisture contents
which were selected in the range from 0.5% to 3%. For all types of potash and all initial
moisture contents, two drying methods were used to make caked samples: oven drying
at 40 Celsius and air drying at room conditions.
3.3 Data and Analysis
3.3.1 Uncertainty calculation
In this chapter, all experimental data are presented by a mean cake
strength, meanσ , of at least twelve samples tested and with the uncertainty interval for
95% confidence. Only uncertainty resulting from random errors due to variations in the
test data is considered in the uncertainty analysis of this experiment because calibration
errors are negligible. Random sample errors are mainly introduced by the process of
caked potash sample preparation. The estimate of the standard deviation of sample
mean, S, is given by (ASME PTC 19.1, 1998),

50
( )∑= −
−=
N
k
meankmean NN
S1
2
1
1)(
σσσ (3-1)
where the mean value of the samples is defined as
∑=
=N
kkmean N 1
1 σσ (3-2)
where, kσ is measured cake strength for a sample of ( 1σ , 2σ ,….. Nσ )
meanσ is the mean value of cake strength
N is the number of test samples
k is kth measurement
The uncertainty in the sample mean value at the 95% confidence level is defined
by,
StU mean ⋅=)(σ (3-3)
where t is the student “ t” statistic which has a value of 2.1 for N≥ 15 tests
S is standard deviation of sample mean.
To reduce uncertainty in the measurement of cake strength, special attention was
used to ensure consistent mixing and packing methods for each sample and the number
of repeated tests was selected to result in a small uncertainty at each test condition.

51
3.3.2 Comparison of new and recycled potash
Before testing could begin on the different particle sizes and the magnesium
contents of potash, the difference, if any, between particle samples as received from the
mine, and recycled samples had to be determined. These tests were performed on the
0.85 mm ~ 1.18 mm diameter potash for two different drying methods; air drying from
an initial moisture content of 2.80 % and oven drying at 40 Celsius at an initial moisture
content of 1.80 %. The data presented in Table 3-2 show that there is no significant
difference between the new and recycled potash. To avoid unnecessary waste of potash
it was preferable to reuse potash that had been previously caked by completely drying
and re-sieving the tested particles and these recycled particles were to be used in
subsequent tests.
Table 3-2: Comparison of cake strength for new and recycled potash
Drying Method: Oven Drying at 40oC Initial Moisture Content: 1.80 %
Drying Method: Air Drying Initial Moisture Content: 2.80%
New Samples Recycled Samples New Samples Recycled Samples
meanσ ± U ( meanσ ) meanσ ± U ( meanσ ) meanσ ± U ( meanσ ) meanσ ± U( meanσ )
29.0 ± 3.1 KPa 26.3 ± 3.2 KPa 7.9 ± 1.4 KPa 9.2 ± 1.1 KPa

52
3.3.3 Cake strength measurements
3.3.3.1 Cake strength and initial moisture content
Figure 3-1 shows data and the relationship between initial moisture content and
ultimate tensile stress of caked potash bed for oven drying and air drying with four
different particle sizes. The calculated uncertainty bar for each test point and the best
linear curve fit are also shown in the Figure 3-1. The error bars represent the 95%
uncertainty limits at each particular initial moisture content using at least 12 sample
caked rings calculated by equations (3-1), (3-2) and (3-3). The uncertainty, U, in Figure
3-1 was determined for the best straight line fit shown using only the data implied by the
data points and their uncertainty. For both oven and air drying, these uncertainty values
imply a relative uncertainty in the cake strength correlations of about 50% and 100% for
dpm=1.02 mm and 3.08 mm respectively when the initial moisture content is 1.8% (w/w).
These experimental results, based on the potash samples with four different particle
sizes, further confirmed the correlations obtained in Chapter two shown in Figure 2-14
that, for each drying method, there is a nearly linear relationship between the initial
moisture content and cake strength. The best straight line fit in Figure 3-1 was selected
as the best fit line that when through zero cake strength for the initial moisture content in
the range 0.1 to 0.5% (w/w) as shown in Figure 2-14.

53
0.0
10.0
20.0
30.0
40.0
50.0
0.00 0.50 1.00 1.50 2.00 2.50 3.00
Initial moisture content, %(w/w)
Cak
e S
tren
gth
(KP
a)
dpm = 1.02mm, U=9.62 KPadpm = 1.43mm, U=8.18 KPadpm = 2.18mm, U=5.54 KPadpm = 3.08mm, U=2.78 KPabest fit straight line
uncertainty
(a)
0.0
2.5
5.0
7.5
10.0
12.5
15.0
0.00 0.50 1.00 1.50 2.00 2.50 3.00
Initial moisture content, %(w/w)
Cak
e st
reng
th (
KP
a)
dpm = 1.02mm, U=3.78 KPadpm = 1.43mm, U=3.02 KPadpm = 2.18mm, U=2.10 KPadpm = 3.08mm, U=1.20 KPabest fit straight line
uncertainty
(b)
Figure 3-1: Potash cake strength versus initial moisture content for four different particle
size ranges for (a) oven drying at 40oC and (b) air drying at room conditions,
Mg %02.0≈ .

54
3.3.3.2 Cake strength and particle size
To investigate the relationship between particle size and cake strength using the
same drying method and initial moisture content, the cake strength was measured for
four ranges of particle size. These data are plotted in Figure 3-2 for oven drying and with
three different initial moisture contents. The 95% uncertainty bound for each test point,
comprised of 15 or more tests, is indicated.
0.0
10.0
20.0
30.0
40.0
50.0
0 1 2 3 4Mean particle diameter (mm)
Cak
e st
reng
th (
KP
a)
2.8% (w/w) initial M.C.1.8% (w/w) initial M.C.0.85% (w/w) initial M.C.fit linecorrelation line from Figure 3-1
uncertainty
� =Bd pm-2B=40
B=30
B=10
Figure 3-2: Cake strength versus average particle diameter for oven drying at 40ºC with
three different initial moisture contents, Mg %02.0≈
Figure 3-2 shows that the cake strength can be correlated approximately using an
inverse square relationship with increasing particle diameter. The coefficient, B, of the
2−= pmBdσ correlation decreases with increasing initial moisture content. It is known
that caking process is caused by crystal bridges developing near the contact points
between particles (Thompson, 1972, Kollmann and Tomas, 2001). As the number of

55
contact points per unit volume in a potash bed increase (i.e. the particle sizes decrease),
it is expected that the cake strength will increase. If the number of contact points
between particles is nearly constant for each particle, then with increasing particle
diameter, the number of particle contact points per unit volume in each potash sample
will decrease.
3.3.3.3 Cake Strength and Magnesium Concentration
Small concentrations of impurities, including carnallite and halite, are included
during the production of potash (Arinze et al. 2000, 2001). The chemical composition,
especially the content of magnesium, is expected to have a significant influence on cake
strength. Tests were carried out to investigate the cake strength of a potash bed with
variations in the content of magnesium. Three concentrations of magnesium were tested.
To prepare these samples, a solution of magnesium chloride, MgCl2 was added to the
potash particles which were subsequently dried. In this case, the percentage Mg stands
for mass fraction of the doped potash which is magnesium. Figure 3-3 shows the cake
strength versus initial moisture content with three different concentrations of magnesium
for oven and air drying. Using the same correlation procedure as Figure 3-1, the best fit
straight lines for the linear relationship between cake strength versus initial moisture
content are shown in Figure 3-3. These data show that as the concentration of
magnesium in the potash increases, the cake strength increases significantly.

56
0.0
10.0
20.0
30.0
40.0
50.0
60.0
0.00 0.50 1.00 1.50 2.00Initial moisture content, %(w/w)
Cak
e st
reng
th (
KP
a)
0.02% Mg, U=9.38 KPa
0.06% Mg, U=7.36 KPa
0.10% Mg, U=13.66 KPa
best fit straight line
uncertainty
(a)
0.0
15.0
30.0
45.0
60.0
75.0
90.0
0.00 0.50 1.00 1.50 2.00 2.50 3.00Initial moisture content, %(w/w)
Cak
e st
reng
th (
KP
a)
0.02% Mg, U=4.36 KPa
0.06% Mg, U=6.32 KPa
0.10% Mg, U=24.10 KPa
best fit straight line
uncertainty
(b)
Figure 3-3: Potash cake strength versus initial moisture content with three different
concentrations of magnesium for (a) oven drying at 40oC and (b) air drying at room
conditions, pmd =1.02 mm

57
0.0
10.0
20.0
30.0
40.0
50.0
60.0
0 0.02 0.04 0.06 0.08 0.1Concentration of Magesium (%)
Cak
e st
reng
th (
KP
a)
0.85% (w/w) Initial M.C.1.8% (w/w) Initial M.C.best fit straight lines
uncertainty
(a)
0.0
15.0
30.0
45.0
60.0
75.0
90.0
0 0.02 0.04 0.06 0.08 0.1Concentration of Magesium (%)
Cak
e st
reng
th (
KP
a)
0.85% (w/w) Initial M.C.
2.8% (w/w) Initial M.C.
best fit straight lines
uncertainty
(b)
Figure 3-4: Potash cake strength versus concentration of magnesium for (a) oven drying
and (b) air drying, pmd =1.02 mm
Using the same data, the relationship between cake strength and concentration of
magnesium is plotted in Figure 3-4 for each drying process. A linear relationship
between cake strength and concentration of magnesium gives a reasonably good fit,

58
however, the intercept with the zero cake strength values imply negative magnesium
content values for Figure 3-4 (a) but not (b). The reason for this difference is not clear.
It is found from the experimental results that the concentration of impurities such
as magnesium or magnesium chloride salt, MgCl2, in the salt solution of the liquid film
on the potash particles alters the cake strength significantly. This impurity induces
relative humidity at the air-liquid interface of potash particles from 85% for KCl to 52%
MgCl2 (Peng et al. 1999). It is expected that such a large decrease in the surface relative
humidity would substantially decrease the liquid film evaporation rate when the
interstitial bed air velocity is fixed or is constant and the ambient supply air humidity is
constant. The relationships between cake strength and the content of magnesium shown
in Figure 3-4 are consistent with the experimental data which predict that slower drying
rates result in stronger cake strengths. Another reason for the change in cake strength
may include the inclusion of attached water molecules in the KMgCl3⋅6H2O (carnallite)
during recrystallization process. Further research should be conducted to explore why
the content of magnesium has such a large impact on cake strength.
3.4 Conclusion and Summary
In this chapter, an experimental study has been carried out to determine the
behavior of caked potash by measuring the cake strength using a centrifuge. The cake
strength of potash was measured for tests in which the initial moisture content, particle
size, magnesium content and drying time for each test were varied. For particle sizes
ranging from 0.85 mm to 3.35 mm, new data confirms that the strength of caked potash
increases essentially in a linear relationship with initial moisture content for each

59
method of drying. For other factors such as particle size and concentration of
magnesium in potash, it was found that the cake strength of the bed will decrease with
increasing particle size for the same initial moisture content and drying method. As well,
it was also found that cake strength will increase essentially linearly with magnesium
content for samples with the same initial moisture content, particle size and drying
method.
Although more research on these factors, which influence the cake strength of
potash, will increase this data base, producers of potash can use the data and correlations
presented here to help minimize the impact of caked potash for storage and distribution
in their bulk products.
60
CHAPTER 4
THEORETICAL/NUMERICAL MODEL OF
RECRYSTALLIZATION NEAR A CONTACT POINT
BETWEEN TWO POTASH PARTICLES
4.1 Introduction
A new centrifugal method to measure the cake strength of caked granular
material with a known smaller uncertainty of measurement is developed in this thesis.
The relationship between cake strength and the above variables is established using this
accurate method, which can best represent the physical reality of caking behaviour for
potash. It was found that cake strength increases linearly with initial moisture content,
increases with the duration of drying for a particle bed (e.g. the cake strength more than
doubled when the drying period was increased from 30 minutes to 10 hours), decreases
with increasing particle sizes over the particle size range 0.85 mm to 3.35 mm, and
increases with magnesium content (e.g. increased by a factor of three when the
magnesium content was increased from 0.02% to 0.1%).
In this chapter, the recrystallization process due to thin film evaporation on
wetted salt particles close to one contact point between two potash particles is
theoretically formulated and numerically modelled. In next chapter, the recrystallization

61
process is simulated and the effects of the initial thickness of the liquid film electrolytic
layer (i.e. initial moisture content), velocity of moving liquid film-air interface or rate of
drying, and the degree of supersaturation on the solid surface near the contact point are
considered. The simulated results are also compared to the achieved cake strength data
in sample test beds of potash using the centrifugal method.
4.2 Background
Potash particles in bulk fertilizer products tend to have irregular shapes with
sharp crystalline edges. The number of contact points between one particle and the
surrounding particles will depend on the size distribution of particles in a bed and the
packing of the bed (Chen et al. (2004)). For a well-packed bed of smooth particles, Chen
and Tien (1973) have shown that there will be 6 to 12 contact points per particle. The
geometry of each contact point will most likely be somewhat unique because as shown
in Figure 1-2, each particle has a unique shape.
In this study we choose to avoid geometric complexity and concentrate on the
effects of other important physical parameters such as the initial moisture content or film
thickness, rate of evaporation or drying, and supersaturation effects on the surfaces near
a typical contact point. Chen et al. (2004) also showed that for particle sizes equal to or
less than 1 mm diameter the water content in a packed bed would remain
macroscopically pendant or stationary for moisture contents less than 11% (w/w) - so the
only mode of water transfer would be by gaseous diffusion and convection through the
interstitial air.

62
Although it is not known, if any, what capillary motion will occur on particle
surfaces near contact points during drying for this condition, each particle interstitial
relative humidity in the bed will tend to cause an equal distribution of moisture content
or film thickness on particle surfaces with the same chemical composition (Peng et al.
1999). That is, liquid film thickness are expected to be nearly uniform at each moisture
content or film thickness during a drying process until the number of layers of water
molecules on the surface become small. When potash particles experience a wetting
process during storage, the water vapour from the air is adsorbed and accumulated on
the surface of each particle and a saturated electrolytic solution layer is formed around
each particle. This solution layer or liquid film will be saturated with solute ions from
each salt at equilibrium conditions (Peng et al. 1999). During any subsequent drying
process, there will be a redistribution of solute ions in the liquid film caused by water
evaporation at the air-liquid film interface. This causes some supersaturation of solute at
the liquid film-air interface and diffusion toward the solid crystal surfaces.
A two-dimensional schematic is presented near one contact point between two
potash particles in Figure 4-1 which shows the two particles in contact at one point and
the geometry of liquid film before drying. In this figure, one particle is shown as a flat
surface and the other as a circular cone while a liquid solution layer is in contact with
both particles near this contact point. As the liquid layer evaporates during a drying
process, the liquid layer will get thinner throughout the entire liquid film and new KCl
crystals will form on the solid surfaces where the ion concentration is at saturation or for
slightly supersaturated conditions. When these new crystals are formed very close to
contact point they have the potential to form bridges between particles. Even this

63
simplified geometry is more complex than necessary to study the recrystallization
process and the physical effects. A simpler geometry with a uniform film thickness is
shown in Figure 4-2.
Figure 4-1: A two-dimensional axi-symmetric schematic for ion diffusion in a liquid
film and recrystallization near a contact point between two potash particles
Figure 4-2: Schematic of aqueous salt solution of uniform thickness around a stretched
contact point at r = 0
KCl crystal-liquid interface
Liquid-air interface
Contact point rc
δ Salt solution liquid film
z
r
Air and water vapor gases
Potash particle surfaces
o r s(t)
ro
z
rc

64
Figure 4-2 shows a liquid film of thickness, s(t), which decreases as the film
evaporates and where the fixed outer radius in this domain of interest near the contact
point is ro. On the boundary surfaces (z=s(t) and crr <<0 ), and (r=ro and )(0 tsz ≤≤ ),
there is no mass diffusion. That is, the surface ( crrtsz <<= 0),( ) has no evaporation
which is taken to be the same as no mass transfer on the surface on the diagonal dashed
line in the liquid film near the contact point in Figure 4-1 and the surface
( orrtsz =<< ),(0 ) has no mass transfer because ro/rc is sufficiently large that the
effects of the contact point are negligible. The line of symmetry ( 0),(0 =<< rtsz ) in
Figure 4-2 has no mass transfer and it is transformed or mapped from the contact point
in Figure 4-1. Elsewhere on the boundary, the top and bottom surfaces have two
different mass transfers, on the top there is mass transfer due to the evaporation of water
and on the bottom due to recrystallization of solute. Evaporation causes the domain in
Figure 4-2 to decrease with time and recrystallization acts as a sink for the solute above
the surface z=0. The value of rc is chosen to have a value which is approximately equal
to the initial film thickness very near the contact point r=0 (shown as rc in Figure 4-1).
4.2.1 Diffusion in electrolytic solution
A comprehensive review of mass transfer in electrolytic solutions is given by
Newman (1970). When a salt dissociates in solution, the ions move such that the net
electric ion charge of the solution at any point remains near neutral. The movement of
ions, which are driven by an electrochemical potential gradient (i.e. concentration
gradient) in the absence of an external applied electrical potential difference, may be
treated as pure diffusion process. In our case, the solution of a single KCl salt is
65
comprised of one cation (i.e. K+) and anion (i.e. Cl-) which is called a binary electrolyte.
Since the requirement of zero electric current causes anions and cations to attract each
other strongly and, ions of opposite charge will diffuse as pairs so a single salt will
behave like one species. With no sources or sinks in the fluid media, the diffusion
equation for a single electrolyte in a solution can be modeled by a differential equation
for solute mass continuity at each point in the solution,
[ ]cDt
c ∇⋅∇=∂∂
(4-1)
where, c is the electrolyte concentration, units mole/m3 or a dimensionless ratio when c
is taken as a ratio which is the case used in this study where the reference concentration
is for the saturation condition; D is the diffusion coefficient of the electrolyte, which is
constant for a dilute solution at constant temperature, and is determined by (Newman,
1970).
−−++
−+−+
−−
=DzDz
zzDDDo
)( (4-2)
where +D is diffusion coefficient for cation (for K+ ion, /sm 10957.1 29−+ ×=D )
−D is diffusion coefficient for anion (for Cl- ion, /sm 10032.2 29−− ×=D )
+z is charge number for the cation (for K+ ion, 1=+z )
−z is charge number for the anion (for Cl- ion, 1−=−z )

66
Using these data in equation (4-2), the calculated binary diffusion coefficient for KCl in
a dilute solution is, smDKCl /10994.1 29−×= .
It is known that potash also contains small amount of carnallite and halite (i.e.
less than 2%). When moisture accumulates on potash particles, dissolution will occur
when the ambient humidity exceeds a critical value (Peng at al. 1999). This aqueous
solution film on particles surfaces will consist of three kinds of electrolyte i.e. KCl,
NaCl and MgCl2. A comparison of diffusion coefficients and solubility for these three
salts is shown in Table 4-1.
Table 4-1: Values of diffusion coefficients of binary electrolytes in dilute solution and
solubility in water at 25oC for KCl, NaCl, MgCl2
Salt Diffusion coefficient, D
(m2/s)
Solubility, cs
( g/100 g water)
KCl 91099.1 −× 34.03
NaCl 91061.1 −× 35.89
MgCl2 91025.1 −× 55.23
For a saturated solution Newman (1970) shows a decrease in DKCl from the dilute
solution value shown in Table 1 to about /sm 1077.1 29−× . When there are small changes
in the solution temperature and concentration, c, throughout the domain of study, it can
be shown that D will only change by a small amount. In this study temperature changes
are expected to be less than 1oC and the solute concentration will be no greater than 40%
of saturation conditions. At 40% supersaturation DKCl will be about /sm1037.1 29−× . It

67
will be shown later that this change in diffusion coefficient will not change the results
significantly - so we can assume the diffusion coefficient is a constant equal
to /sm1077.1 29−× for saturation conditions. This analysis of diffusion coefficient in a
concentrated solution is equally applicable for the salts NaCl and MgCl2. It is expected
that the saturated salt solution diffusion coefficients of NaCl and MgCl2 will be about
10% lower than the dilute solution value shown in Table 4-1. The remaining analysis is
presented as it pertains to KCl only, but when these diffusion coefficients are nearly
constant the results will be applicable to other salts.
Equation (4-1) governs the behaviour of the solute in the solution everywhere
inside of a specified closed space or domain. A boundary condition must be specified on
any component of the bounding surface of the domain shown in Figure 4-2. These
boundary conditions are: the crystal solid surface on which there is mass deposition or
recrystallization, the surfaces on which there is no mass flux, and the open evaporative
surface which results in a moving boundary. It is noted that the evaporation of water
from the exposed liquid film in Figure 4-2 does not result in loss of solute mass,
however the concentration will change due to this evaporation. These are considered
separately below.
4.2.2 Boundary conditions at crystal solid surface (z=0)
Theoretically, crystal growth can occur at any point at which C≤1 , however,
when there is no nucleation site at a point, supersaturation conditions are required
(i.e.1<C). Away from the salt crystal surfaces, nucleation sites are unlikely in thin films
of liquid solution. Even on the crystal surfaces the solution may have to be in a

68
supersaturated state before crystallization occurs. Furthermore, the degree of
supersaturation required for crystallization need not be uniform over the entire solid
crystal surface in contact with the solution.
If the crystallization process on a crystal surface is entirely diffusion-controlled,
the crystal growth rate is simply governed by the molecular diffusion equation at the
interface (Mullin, 1993),
cDq ∇= (4-3)
where, q is mass flux of crystal growth on the surface.
Theoretically, the deposition of a new crystallization layer alters the position of
the surface of the domain of solute in the solution by an amount equal to the thickness of
the crystal in deposition layer. Since this deposition crystal layer is five times smaller
than the corresponding drop in the liquid layer at z=s, it is neglected so that this
problem, unlike the Stefan problem, is assumed to be linear and the surface z=0 remains
flat. Before drying, the wetted potash particle is surrounded by a saturated KCl solution
layer as shown near a contact point in Figure 4-1. During drying, the air-liquid interface
is supersaturated due to water evaporation. This results in a concentration gradient
between air-liquid interface and liquid-solid interface where the concentration is
assumed to be at or near saturation. With evaporation, the supersaturated KCl salt ions
diffuse from air-liquid interface towards to the solid surface as governed by Equation (4-
1). This analysis does not include any buoyancy effects due to density variations and
gravity interaction nor any coupling with heat transfer effects.

69
A typical average film thickness in a potash bed before drying can be estimated
knowing the density of water, wρ , specific surface, Sm(m2/kg), initial moisture content, X,
using the equation,
mwS
X
ρδ = (4-4)
For a potash bed for a particle size nearly 1 mm, the specific area, Sm, has been measured
to be 1.55 m2/kg (Zhou 2000) giving the initial film thickness, δ, between 6 and 60 µm
for 1.001.0 ≤≤ X (i.e. initial moisture content 1% (w/w) and 10% (w/w)).
The thickness of a film of electrolytic solution on the particle surfaces in a potash
bed will alter other properties such as effective thermal conductivity. For a small range
of particle diameters, Yungwirth et al. (2006) showed that the effective thermal
conductivity of potash will increase with moisture content such that there would be a
100% increase in effective thermal conductivity when the moisture content was
increased from 0 to 2% (w/w) for 02.1=pmd mm. We might conclude from these data
that increased surface moisture strongly increases the thermal contact between particles.
Chen and Tien (1973) suggested a range of 6-12 contact points for a particle
within a typical particle bed comprised of nearly spherical particles. Potash particles,
with an irregular crystalline shape, may have a slightly different number of contact
points per particle in a packed bed. Using spherical particles the average distance
between contact points on one particle can be estimated by equation,
2
pmo
dd = (4-5)

70
where, pmd is mean diameter of potash particle. This equation implies the average
distance between contact points on a particle is between 10 and 100 times larger than the
average film thickness for moisture contents between 10% (w/w) and 1% (w/w).
4.2.3 Boundary conditions at z=s(t)
The boundary condition on the air-liquid interface is now written for the exposed
surface in Figure 4-2. Evaporation from an open surface is a moving boundary problem
which needs to be solved in a time-dependent space domain (Crank 1984). The position
of moving boundary has to be determined as a function of time and space. In this
problem, the moving boundary at z=s is assumed to have a constant speed, dtdsus /= ,
over the duration of the simulation and s is always positive.
In Figure 4-1, the point at r=0, z=0 is mapped into the line r=0, sz ≤≤0 in
Figure 4-2. On this surface there is no mass flux. It is noted that this surface remains at
the same level as the position of the surface from which there is evaporation. That is, the
entire surface at z=s is assumed to have a constant velocity, US. Since the boundary
conditions at z=0 for r>rc and at z=s for r>rc are uniform if ro is chosen to be much
larger than rc there will be no mass flux at ro except in the z direction. The value of rc is
only expected to change by a small fraction over most of the evaporation period. That is,
the size of rc is specified as a fixed fraction of the original liquid film thickness δ before
evaporation starts (i.e. cr/δ is 5.1/3.0 ≤≤ crδ for 0.12.0 * ≤≤ S ). For 2.0* <S the
value of rc is expected to vary rapidly with time so the complete drying of the surface is
not included in this study.

71
The boundary condition at z=s(t) needs special consideration. It is assumed that
there is no mass transfer where crr ≤≤0 and sz = in Figure 4-2. The interface between
air and liquid where oc rrr ≤< and sz = , an infinitesimal layer (i.e very top layer or
node in the finite difference formulation in the solution) is treated as a moving
evaporation layer. Within this layer, the mass continuity of KCl salt is used as this
moving boundary condition. It is assumed that the solution density is equal to solvent
density, so the mass of KCl salt is calculated by multiplying solution concentration and
solution volume. The moving boundary conditions for the evaporative surface area are
given by,
0),()( =∂∂
= trz
ctsz crr ≤≤0 (4-6)
0)(
)( =⋅
= tszs
dt
vcd oc rrr ≤< (4-7)
sudt
ds −= (4-8)
where, sv is volume of infinitesimal evaporation layer or node region at sz = , m3
us is constant moving boundary velocity, m/s.
Moving boundary problems have been reviewed by Crank (1984). One front-
tracking method is used to solve the numerical model by varying the space grid size
while keeping the number of grid points constant. The number of grid space intervals
between a fixed boundary at z=0 and a moving boundary at z=s is kept constant and
equal to N, so that the moving boundary always lies on the Nth grid. Tracking a

72
particular grid line, the governing equation is transformed from constant space to moved
grid points.
4.2.4 Problem formulation
The diffusion of a salt in a binary electrolytic solution governed by equation (4-1)
for the axi-symmetric domain shown in Figure 4-3 is given using dimensionless
cylindrical coordinates by,
)()(1
Z
C
ZR
CR
RR
C
∂∂
∂∂+
∂∂
∂∂=
∂∂
τ, )(0 τSZ ≤< , oRR <<0 , 0>τ (4-9)
where cr
rR = ,
cr
zZ = ,
cr
tsS
)(= , sc
cC = ,
2cr
tD ⋅=τ .
The dimensionless boundary conditions are:
0),( =∂∂
= τZR
CoRR oRR = , )(0 τSZ ≤≤ (4-10)
aZ CRC == ),(0 τ 10 ≤≤ R , Z=0 (4-11)
bZ CRC == ),(0 τ oRR ≤<1 , Z=0 (4-12)
0),()( =∂∂
= ττ RZ
CSZ 10 ≤≤ R , Z=S (4-13)
0)(
)( =⋅
= ττ SZS
d
VCd oRR ≤<1 , Z=S (4-14)
where Vs is dimensionless volume of the evaporation layer for the node at Z=S
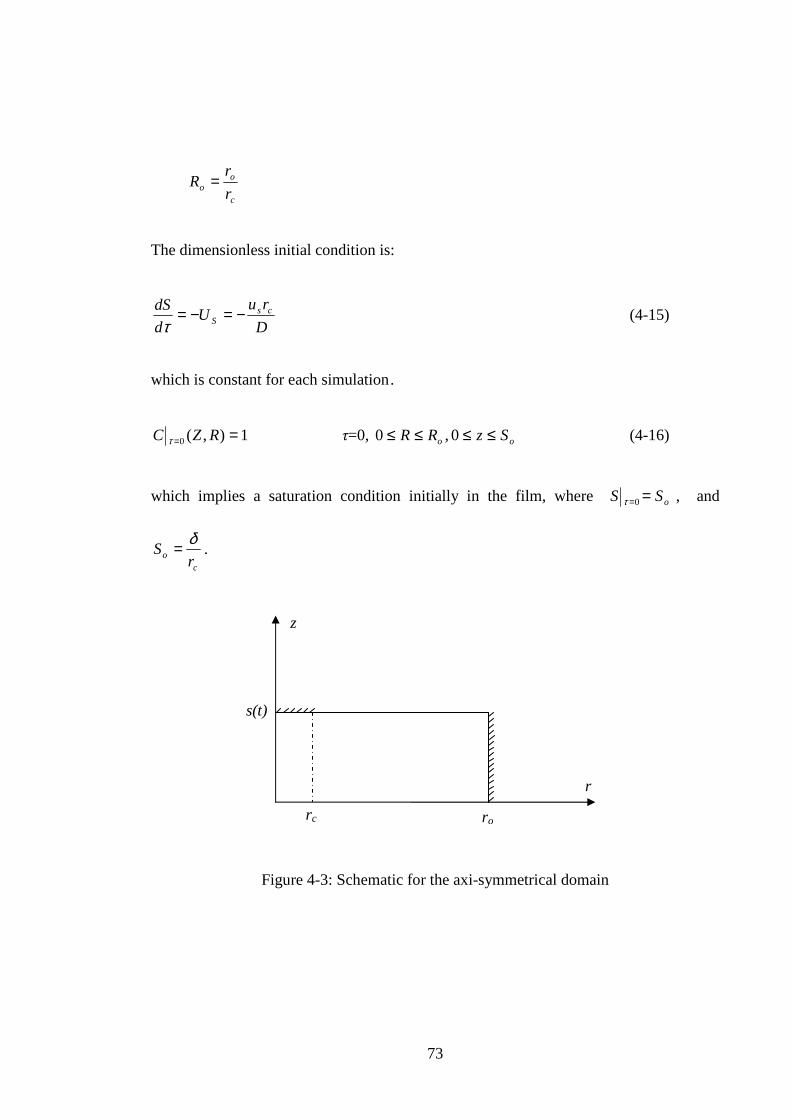
73
c
oo r
rR =
The dimensionless initial condition is:
D
ruU
d
dS csS −=−=
τ (4-15)
which is constant for each simulation .
1),(0 == RZC τ τ=0, oRR ≤≤0 , oSz ≤≤0 (4-16)
which implies a saturation condition initially in the film, where oSS ==0τ , and
co r
Sδ= .
Figure 4-3: Schematic for the axi-symmetrical domain
r
z
s(t)
ro rc

74
4.2.5 Method of analysis
The variable space grid method described is used to solve the moving boundary
problem. The number of space intervals, N, between fixed boundary Z=0 and moving
boundary Z=S(τ) is chosen to be constant. Thus, the grid spacing is different at each time
step such that the moving boundary is always on the Nth grid line. By tracking a
particular grid line, as opposed to constant Z, and differentiating with respect to time τ the following expression is obtained for ith grid line (Crank 1984),
Zi
C
d
dZ
Z
CC
∂∂+
∂∂=
∂∂
τττ τ
(4-17)
where τττ d
dS
S
Z
d
dZ i
)(= and
Z
C
∂∂
τis the term shown in Equation (4-9).
So the diffusion equation which is transformed from physical region to computational
region of grid lines is given by,
Z
C
d
dS
S
Z
Z
C
ZR
CR
RR
C
i ∂∂+
∂∂
∂∂+
∂∂
∂∂=
∂∂
τττ )()()(
1 (4-18)
An implicit numerical solution is used based on finite differences using the
Taylor series expansion method. The alternating direction implicit (ADI) and Gauss
successive iteration methods are used to solve discretized algebraic equations and
moving boundary position S(τ) and grid size ∆Z are updated at each time step subject to
the continuity of solute in the system.

75
Before each time step, the concentration of the very top grid line is determined
first. The changed height for each time step due to water evaporation is applied to the
very top finite volume in this model where the concentration is represented by the
concentration at the top grids. The new concentration is determined by mass continuity
of Equation (4-14). Then the grid size in the whole computational region is updated and
Equation (4-18) is employed to solve diffusion process subject to other boundary
conditions. In this model, the grid matrix is selected as 2550× and the time step is 10-3
second. The selected tolerance used for the criteria of convergence with the numerical
solution is 10-6. The mass conservation for KCl inside the computational domain is
determined for initial moisture content, X= 6% and evaporation rate, Us=0.05 and shows
that when the relative moving boundary position is S*=0.2, the calculated mass of KCl
including the deposition and the solute in the solution is 98% of the initial mass of KCl
salt before drying.
4.3 Summary
A review of the literature revealed a need to analyze the caking process in
particle beds if we are to correctly identify the most important physical factors that
influence cake strength of a potash particle bed. This cake strength in a dried particle
bed is assumed to be caused by crystal bridges forming between particles during the
evaporative dying process which accompanies caking. In this chapter, a simplified
diffusion model is presented to model the salt ion diffusion process and recrystallization
near one geometrically simple contact point.

76
CHAPTER 5
SIMULATION OF NUMERICAL MODEL AND
COMPARISON WITH EXPERIMENTAL DATA
In this chapter, numerical simulations of the model in Chapter 4 are used to
determine the effects of changes for each independent parameter in this model such as:
initial moisture content, rate of evaporation from the aqueous salt solution on the particle
surface, relative size of the contact region compared to the initial film thickness of salt
solution, and supersaturation properties on the solid crystal deposition surface near the
contact point. Non-dimensional graphical curves of these simulations are used to
compare the effects of each parameter for the deposition of salt crystals near the contact
point. These results are compared to data for cake strength in potash specimens which
were obtained for variation of initial moisture content, rate of drying and chemical
composition of the particle surfaces. Also the numerical results considering the degree of
supersaturation on the solid surface near the contact point are compared with the
experimental results of surface roughness for NaCl and KCl after wetting and drying
process investigated by Sun et al. (2006).
5.1 Dimensionless Terminology
In this model, the effects of the initial film thickness, δ, and the velocity of
moving evaporation surface, us, on the mass deposition distribution on the solid surface

77
of a particle are studied numerically. Results for mass deposition during the drying
process are presented by varying the relative moving position, S* , in consideration of
two dimensionless parameters, US and So, which are given by equations (4-15) and (4-
16) respectively. The relative moving position, S* , is defined using the initial film
thickness as,
δ)(
*ts
S = . (5-1)
It is assumed that the evaporation rate depends only on the selected value of US, and the
thickness of contact region, rc, is constant so So is only function of initial moisture
content, X. The numerical model is used to explore the impact of the evaporation rate
and initial moisture content on recrystallization of potash particles. For each independent
factor considered, the local distribution of mass deposition on the particle surface�the
total deposition inside the contact region during the drying process, the deposition per
unit area inside of contact region during drying process and the deposition per unit area
at r=ro during the drying process are plotted in dimensionless forms. These are shown in
Figures 5-1 to 5-8.
The mass of deposition of KCl crystals on a potash particle surface between two
radii, r1 and r2, during drying process is determined by,
rdrdtz
cDm z
t r
r
π20
0
2
1
=∫ ∫ ∂∂= (5-2)
Two dimensionless mass distributions are used in Figures 5-1 to 5-8 to make the results
more general. These are defined using the following terms:

78
ci
cc m
mM = (5-3)
where, Mc is the total dimensionless mass fraction of crystal deposition inside the
contact region; mc is the total crystal mass deposition inside contact region; mci is the
initial mass of KCl salt in the liquid film inside the contact region.
i
cc n
nN = (5-4)
where, Nc is dimensionless mass fraction of crystal deposition per unit area inside the
contact region; nc is the average crystal mass deposition per unit area inside the contact
region; ni is the initial mass of KCl salt per unit area in the thin film solution.
No can be used to characterize the mass fraction at r=ro using
i
oo n
nN = (5-5)
where, oN is dimensionless mass fraction of crystal deposition per unit area at orr = ;
on is the crystal mass deposition per unit area at orr = .
N can be used to characterize the mass fraction at any radius r
in
nN = (5-6)
where, N is dimensionless mass fraction of crystal deposition per unit area; n is the
crystal mass deposition per unit area at r.

79
5.2 Numerical Results
5.2.1 Simulation with a range of initial moisture contents
The effect of initial film thickness on particle surface before drying was
investigated in this model. A range of initial moisture contents from 2% (w/w) to 7%
(w/w) were selected and the corresponding dimensionless initial positions of moving
evaporation surface, So, are from 0.4 to 1.3. The dimensionless mass depositions of KCl
inside of contact region, Mc and Nc, are plotted in Figures 5-1 and 5-2.
0
0.1
0.2
0.3
0.4
0.5
00.20.40.60.81 boundary position,S*
Mc
So=1.3(X=0.07)So=1.1(X=0.06)So=0.9(X=0.05)So=0.4(X=0.02)
Figure 5-1: Dimensionless crystal mass deposition inside contact region, Mc, versus
dimensionless moving boundary position, S* , with different initial film thicknesses, So
(initial moisture content, X), as a parameter, US=0.05, 0.1== ba CC

80
0
0.02
0.04
0.06
0.08
0.1
0.12
0.14
00.20.40.60.81 boundary position,S*
Nc
So=1.3(X=0.07)So=1.1(X=0.06)So=0.9(X=0.05)So=0.4(X=0.02)
Figure 5-2: Dimensionless crystal mass deposition per unit area inside contact region,
Nc, versus dimensionless moving boundary position, S* , with different film thickness, So
(initial moisture content, X), as a parameter, US=0.05, 0.1== ba CC
It is shown in Figures 5-1 and Figure 5-2 that the mass deposition of KCl crystals
inside contact region significantly increases with greater initial moisture content where
S*=1 corresponds to the initial position of the liquid film and S*=0.2 corresponds to the
time when 80% of the film has evaporated. Figure 5-3 shows the local distribution of
dimensionless mass crystal deposition per unit area. It is shown that, as the initial film
thickness is increased, the mass deposition in the contact region ( crr ≤≤0 ) will
increase.

81
0
0.05
0.1
0.15
0.2
0.25
0.3
0 1 2 3 4 5radial position,R
N So=1.3(X=0.07)
So=1.1(X=0.06)
So=0.9(X=0.05)
So=0.4(X=0.02)
Figure 5-3: Local distribution of crystal mass deposition per unit area, N, versus radial
position, R, with different initial film thicknesses, So (initial moisture content, X), as a
parameter, US=0.05�S*=0.2, 0.1== ba CC
0
0.1
0.2
0.3
00.20.40.60.81boundary position,S*
No
So=0.5(X=0.03)So=1.1(X=0.06)So=1.6(X=0.09)
Figure 5-4: Dimensionless crystal mass deposition per unit area at r=ro, No, versus
dimensionless moving boundary position, S* , with different initial film thicknesses, So
(initial moisture content, X), as a parameter, US=0.05, 0.1== ba CC
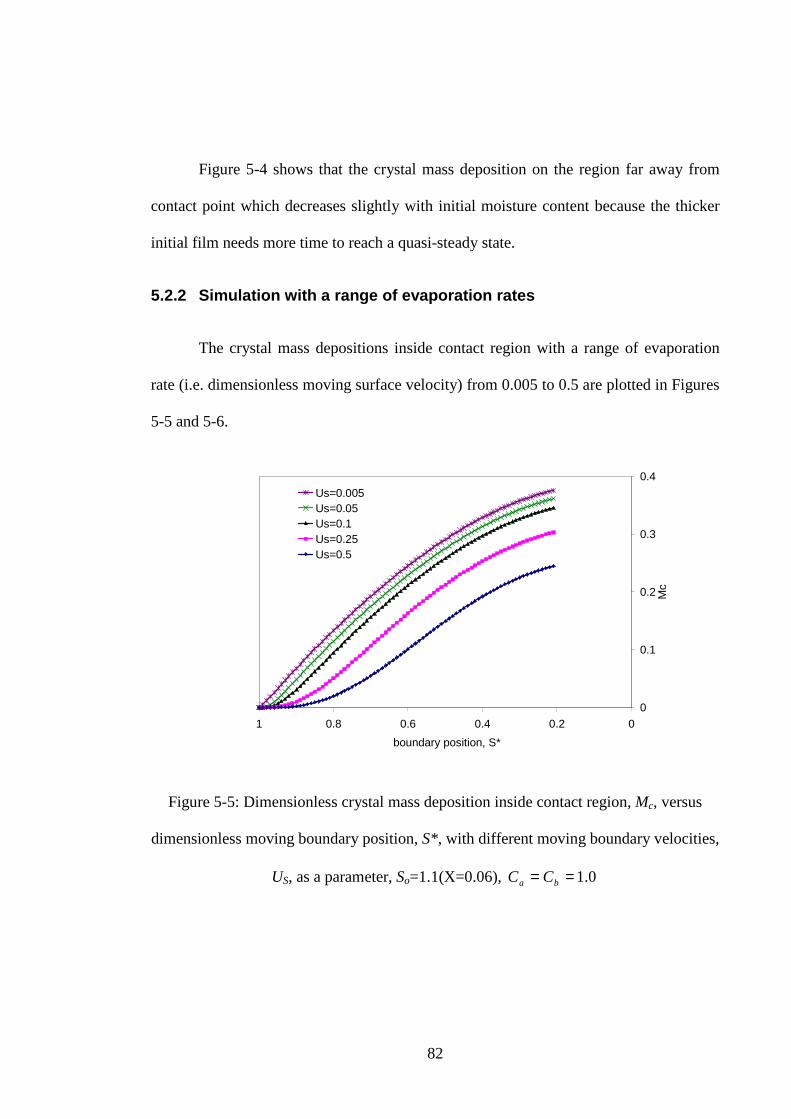
82
Figure 5-4 shows that the crystal mass deposition on the region far away from
contact point which decreases slightly with initial moisture content because the thicker
initial film needs more time to reach a quasi-steady state.
5.2.2 Simulation with a range of evaporation rates
The crystal mass depositions inside contact region with a range of evaporation
rate (i.e. dimensionless moving surface velocity) from 0.005 to 0.5 are plotted in Figures
5-5 and 5-6.
0
0.1
0.2
0.3
0.4
00.20.40.60.81
boundary position, S*
Mc
Us=0.005Us=0.05Us=0.1Us=0.25Us=0.5
Figure 5-5: Dimensionless crystal mass deposition inside contact region, Mc, versus
dimensionless moving boundary position, S* , with different moving boundary velocities,
US, as a parameter, So=1.1(X=0.06), 0.1== ba CC

83
0
0.02
0.04
0.06
0.08
0.1
0.12
0.14
00.20.40.60.81
boundary position, S*
Nc
Us=0.005Us=0.05Us=0.1Us=0.25Us=0.5
Figure 5-6: Dimensionless crystal mass deposition per unit area inside contact region,
Nc, versus dimensionless moving boundary position, S* , with different moving boundary
velocities, US, as a parameter, So=1.1(X=0.06), 0.1== ba CC
It is shown in Figure 5-5 and Figure 5-6 that the mass deposition of KCl crystals
inside contact region increases with slower evaporation rates (i.e moving boundary
velocity US). With 6% initial moisture content, the total drying time when S*=0.2
corresponding to the Us=0.05 is 11 seconds and 1.1 seconds for Us=0.5. It will be
shown later that the supersaturation in the film of solution increases with faster
evaporation rate.
It will be shown later that the supersaturation in the film of solution increases
with faster evaporation rates. This results in more mass of solute in the solution and less
mass of crystal deposition distributed on the particle surface at the same S* . This is
shown in Figures 5-7 and 5-8. As the moving boundary velocity is decreased, the mass
deposition will increase everywhere.

84
0
0.1
0.2
0.3
0 1 2 3 4 5Radial position,R
N Us=0.005Us=0.05Us=0.1Us=0.25Us=0.5
Figure 5-7: Local distribution of crystal mass deposition per unit area, N, versus radial
position, R, with different moving boundary velocities, US, as a parameter,
So=1.1(X=0.06), S*=0.2, 0.1== ba CC
0
0.1
0.2
0.3
00.20.40.60.81 boundary position, S*
No
Us=0.005Us=0.05Us=0.1Us=0.25Us=0.5
Figure 5-8: Dimensionless crystal mass deposition per unit area at r=ro, No, versus
dimensionless moving boundary position, S* , with different moving boundary velocities,
US, as a parameter, So=1.1(X=0.06), 0.1== ba CC

85
5.2.3 Simulation with a range of supersaturation on particle surface
Another factor considered in this model is supersaturated concentrations on the
crystal growth surface. Mullin (1993) showed that crystals tend to grow primarily at
nucleation sites on surfaces. He also showed that very small crystals can have a
solubility significantly higher than those of macrocrystals. Variations in supersaturation
can be investigated using this symmetric model near one contact point with the surface
of contact region, 10 ≤≤ R , at saturation conditions while the exterior region crystal
surface is supersaturated. In Figure 5-9, 5-10, 5-11 and 5-12 we use the numerical model
to simulate results using the following boundary conditions,
1),(0 === aZ CRC τ 10 ≤≤ R , Z=0 (5-7)
bZ CRC == ),(0 τ oRR ≤<1 , Z=0 (5-8)
where, Cb is a dimensionless supersaturated concentration parameter.
Supersaturation is shown to be very sensitive to a few percent increases in
supersaturation for Cb (i.e. the mass accumulation in the contact region in Figure 5-9 and
5-10 increases by a factor of 5 or more as Cb is changed from 1.00 to 1.04). The reason
for this increase is made clear from Figure 5-11 and 5-12 which show that the change in
deposition per unit area at Ro is quite small; but, inside the region 1<R<2 and including
the contact region, 10 ≤≤ R , the mass deposition per unit area is strongly affected.
Figure 5-12 shows mass deposition decreased for 1<R<2 and increased for 10 ≤≤ R .
The negative values for N imply that mass is removed (i.e. crystal dissolution) which is
subsequently deposited in the raised N value regions.

86
0
0.5
1
1.5
2
00.20.40.60.81
boundary position,S*
Mc
Cb=1.04Cb=1.02Cb=1.01Cb=1.00
Figure 5-9: Dimensionless crystal mass deposition inside contact region, Mc, versus
dimensionless moving boundary position, S* , with Ca=1.0 and saturated and
supersaturated boundary conditions, Us=0.05 and So=1.1
0
0.1
0.2
0.3
0.4
0.5
0.6
00.20.40.60.81
boundary position,S*
Nc
Cb=1.04Cb=1.02Cb=1.01Cb=1.00
Figure 5-10: Dimensionless crystal mass deposition per unit area inside contact region,
Nc, versus dimensionless moving boundary position, S* , with Ca=1.0 and saturated and
supersaturated boundary conditions, Us=0.05 and So=1.1

87
0
0.1
0.2
0.3
00.20.40.60.81
boundary position,S*
No
Cb=1.04Cb=1.02Cb=1.01Cb=1.00
Figure 5-11: Dimensionless crystal mass deposition per unit area at Ro, Nc, versus
dimensionless moving boundary position, S* , with Ca=1.0 and saturated and
supersaturated boundary conditions, Us=0.05 and So=1.1
-0.4
-0.2
0.0
0.2
0.4
0.6
0.8
1.0
0 1 2 3 4 5
Radial position, R
N
Cb=1.04Cb=1.02Cb=1.01Cb=1.00
Figure 5-12: Local distribution of crystal mass deposition per unit area versus radial
position, R, with Ca=1.0 and saturated and supersaturated boundary conditions, Us=0.05,
So=1.1 and S*=0.2
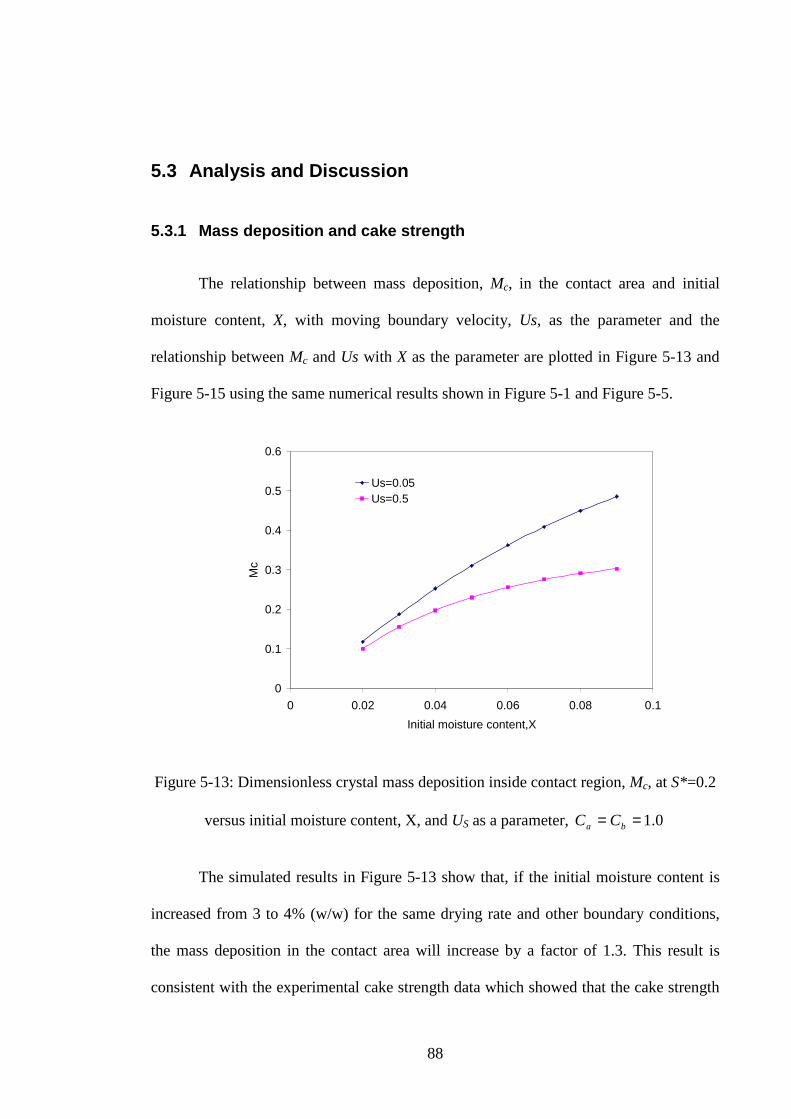
88
5.3 Analysis and Discussion
5.3.1 Mass deposition and cake strength
The relationship between mass deposition, Mc, in the contact area and initial
moisture content, X, with moving boundary velocity, Us, as the parameter and the
relationship between Mc and Us with X as the parameter are plotted in Figure 5-13 and
Figure 5-15 using the same numerical results shown in Figure 5-1 and Figure 5-5.
0
0.1
0.2
0.3
0.4
0.5
0.6
0 0.02 0.04 0.06 0.08 0.1
Initial moisture content,X
Mc
Us=0.05Us=0.5
Figure 5-13: Dimensionless crystal mass deposition inside contact region, Mc, at S*=0.2
versus initial moisture content, X, and US as a parameter, 0.1== ba CC
The simulated results in Figure 5-13 show that, if the initial moisture content is
increased from 3 to 4% (w/w) for the same drying rate and other boundary conditions,
the mass deposition in the contact area will increase by a factor of 1.3. This result is
consistent with the experimental cake strength data which showed that the cake strength

89
of a bed of potash particles increased by a factor 1.3 to 1.5 when the initial moisture
content was increased from 3 to 4% (w/w) for the same drying process. Table 5-1 shows
a comparison of these experimental data for cake strength and numerical results in
crystal mass deposition inside contact region between two potash particles for two
different drying processes and two different initial moisture contents. The selected
surface velocities for these numerical simulations (i.e. µm/s 8.2=su and µm/s 28=su )
are approximately consistent with the oven drying and air drying data.
Table 5-1: Comparisons between experimental cake strength data after both oven drying
and air drying and simulations for crystal mass deposition inside contact region between
two potash particles for evaporation rate, dpm=1.02 mm
Experimental Data (oven drying) Numerical Results (Us=0.05)
X (w/w %) Cake strength(KPa) X(w/w %) Mc (S*=0.2)
1.8 29 2 0.12
2.8 39 3 0.19
3.7 57 4 0.25
Experimental Data (air drying) Numerical Results (Us=0.5)
X (w/w %) Cake strength(KPa) X (w/w %) Mc (S*=0.2)
1.7 5 2 0.10
2.8 12 3 0.15
3.7 16 4 0.20
The same data shown in the Table 5-1 are plotted in Figure 5-14 to compare the
numerical results at US=0.05 and US=0.5 with experimental data for oven drying and air
drying respectively.

90
0
0.05
0.1
0.15
0.2
0.25
0 1 2 3 4Initial Moisture Content, X
Cak
e S
tren
gth
(KP
a)
0
10
20
30
40
50
60
Mas
s D
epos
ition
MC
simulated results (Us=0.05)
experimental data (oven drying)
linear fit from Figure 2-14 data for cake strength
linear fit for simulations of mass deposition
(a)
0
0.05
0.1
0.15
0.2
0.25
0 1 2 3 4Initial Moisture Content, X
Cak
e S
tren
gth
(KP
a)
0
5
10
15
20
Mas
s D
epos
ition
MC
simulated results (Us=0.5)
experimental data (air drying)
linear fit from Figure 2-14 data for cake strength
linear fit for simulations of mass deposition
(b)
Figure 5-14: Comparison of numerical results of crystal mass deposition inside contact
region and experimental data of cake strength for (a) US=0.05 and oven drying (b)
US=0.5 and air drying, dpm=1.02 mm
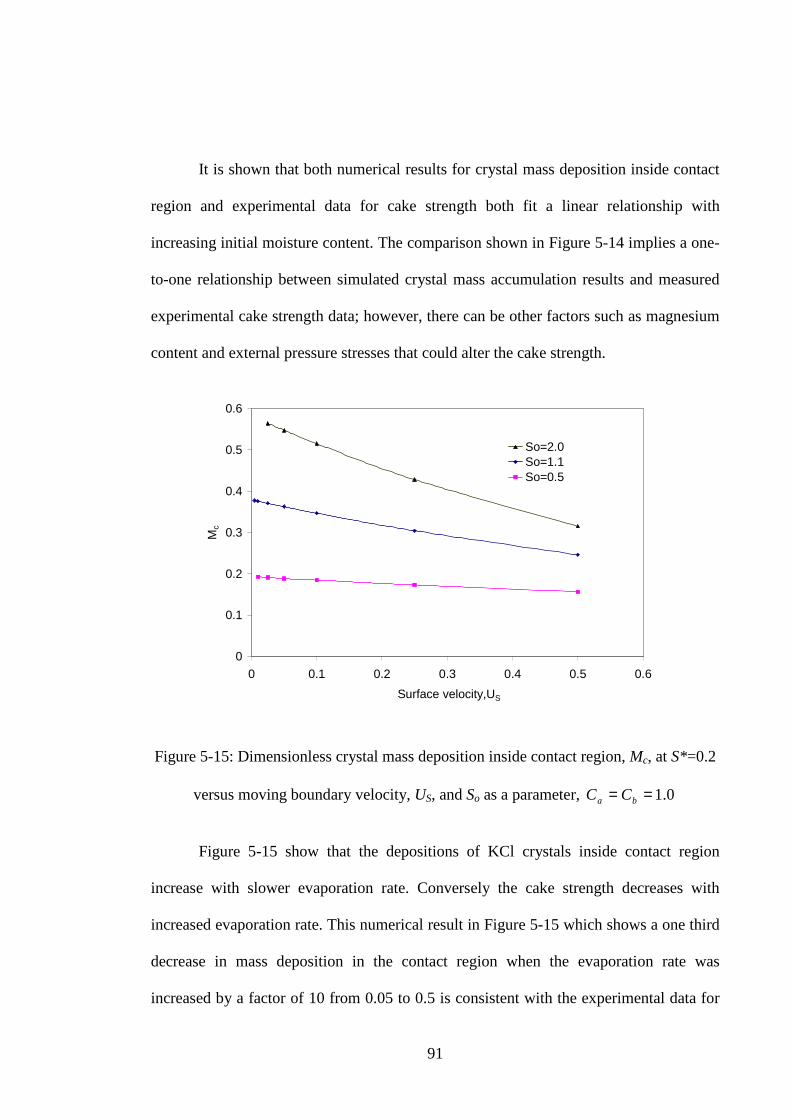
91
It is shown that both numerical results for crystal mass deposition inside contact
region and experimental data for cake strength both fit a linear relationship with
increasing initial moisture content. The comparison shown in Figure 5-14 implies a one-
to-one relationship between simulated crystal mass accumulation results and measured
experimental cake strength data; however, there can be other factors such as magnesium
content and external pressure stresses that could alter the cake strength.
0
0.1
0.2
0.3
0.4
0.5
0.6
0 0.1 0.2 0.3 0.4 0.5 0.6
Surface velocity,US
Mc
So=2.0So=1.1So=0.5
Figure 5-15: Dimensionless crystal mass deposition inside contact region, Mc, at S*=0.2
versus moving boundary velocity, US, and So as a parameter, 0.1== ba CC
Figure 5-15 show that the depositions of KCl crystals inside contact region
increase with slower evaporation rate. Conversely the cake strength decreases with
increased evaporation rate. This numerical result in Figure 5-15 which shows a one third
decrease in mass deposition in the contact region when the evaporation rate was
increased by a factor of 10 from 0.05 to 0.5 is consistent with the experimental data for

92
cake strength which showed that, when the drying speed was increased by a factor of
about 25 for the same initial moisture content, the cake strength was one half. These
comparisons of two somewhat different things, mass deposition and cake strength,
implies a direct relationship between mass deposition of crystals near a typical contact
point between particles in a caked bed and the cake strength of the bed. That is, we have
no directly measured data on the mass deposition due to recrystallization - so we have
made comparisons with the one quantity that we have directly measured, cake strength.
Future experiments will be required to better establish the validity of this relationship
over a wide range of properties and test conditions. As well, more sophisticated
experiments would be needed to directly relate crystal bridging near contact points and
the evaporation of water from thin films.
Another important factor in the caking process is the concentration of impurities
such as magnesium or magnesium chloride salt MgCl2 in the salt solution of the liquid
film on the potash particles. This impurity reduces the water vapour induced relative
humidity at the air-liquid interface from 85% for KCl to 52% MgCl2 (Peng et al. 1999).
Such a large decrease in the surface relative humidity would substantially decrease the
liquid film evaporation rate when the interstitial bed air velocity is fixed or is constant
and the ambient supply air humidity is constant. Experimental data for cake strength
showed that increasing the surface magnesium content from 0.02% to 0.1% resulted in a
three fold increase in cake strength when the same method of drying was used for testing
samples. These simulation results for the effect of film surface speed are also consistent
with these experimental data.

93
Zhou (2000) measured the apparent thermal conductivity of granular potash
using a steady state method. It was shown that there was a 20% increase in the apparent
thermal conductivity between dry and re-dried samples, which indicates that re-drying
creates caking bridges between potash particles which decrease the contact resistance
between particles and enhances heat conduction between the particles. These
experimental results are consistent with the experimental data for cake strength and with
the simulation results using this model.
5.3.2 Thickness of deposited crystal layer and roughness
The results in Figure 5-12 can be used to predict the thickness of the
recrystallization layer shown in Figure 5-16.
-0.3
-0.2
-0.1
0.0
0.1
0.2
0.3
0.4
0.5
0.6
0 1 2 3 4 5
Radial position, R
HR
Cb=1.04Cb=1.02Cb=1.01Cb=1.00
Figure 5-16: Local distribution of height of deposited crystal layer on potash particle
surface versus radial position, R, with Ca=1.0 and saturated and supersaturated boundary
conditions, Us=0.05, So=1.1 and S*=0.2

94
This figure implies another interesting prediction-crystal surfaces on particles
which are initially smooth can, due to non-uniform variations in the supersaturation
boundary conditions on these solid surfaces, become rough during a recrystallization
process. That is, the uneven mass deposition for the contact region shown in Figure 5-12
and Figure 5-16 will not only enhance the likehood of crystal bridging between particles
but the surface will be rougher after recrystallization compared to the original surface
which was assumed to be smooth.
In Figure 5-16, the dimensionless height of deposited crystal layer on potash
particle surface, HR, is defined as )/( δρKClR nH = where KClρ is the density of pure
solid KCl crystal. For example, the recrystallization layer thickness at R = 5 would be
6.3 µm for these conditions when the initial film thickness, δ, is 38.7 µm for an initial
moisture content of 6% (w/w) for particles with 015.1=pmd mm. In the contact region,
R=1, the peak crystal height would be 11.4 µm for Cb=1.02 and 19.6µm for Cb=1.04,
implying that too high a value of Cb (i.e. Cb>1.02) can lead to a somewhat unrealistic
result that the peak deposition height would approach the original liquid film height.
This prediction of increased roughness after drying is consistent with the finding of Sun
et al. (2006) who showed that NaCl and KCl crystal surfaces, with less than 1%
impurities and cut with a diamond cutter with a low initial roughness before wetting
became about five times rougher after drying. Furthermore, this measured roughness
was distributed over the entire cut surface, suggesting that the crystal surfaces can have
significant variations in the degree of saturation due to slight chemical potential changes
at the liquid-solid interface. In a particle bed, there is no apparent reason that the contact
points between one particle and the surrounding particles would be the site of an

95
enhanced deposition surface as implied in Figure 5-12 and Figure 5-16. Such contact
points may have an equal probability of reduced deposition or even mass removal from
the surface after drying. If this were the case, some contact points between particles may
enhance the caking process, as implied by Figure 5-12 and Figure 5-16 while others
would have a reduced probability of caking. This observation may be one of many
reasons why various samples of wetted and dried particle beds show significant
variations in the measured cake strength even when every effort is made to have
identical test conditions.
5.3.3 Supersaturation and changes in the diffusion coefficient
As stated by Newman (1970), the diffusion coefficient of concentrated
solution such as saturated or supersaturated KCl salt solution is a function of ion
concentration of the electrolyte solution. In this research, the ion concentration
distribution on the evaporation surface during drying is shown in Figures 5-17 and 5-18.
Figure 5-17 shows that the ion concentration on the evaporation surface increases
with increasing evaporation rate. It is also shown in Figure 5-18 that the ion
concentration increases with initial moisture content and the film boundary position
corresponding to the peak value of ion concentration decreases with initial moisture
content. These figures imply that ion concentration on the moving boundary may be
more sensitive to evaporation rate than the initial moisture content. For example, when
evaporation rate, Us=0.5 at initial moisture content X=6% (w/w), the ion concentration
will increase to a maximum value of 40% supersaturation when moving boundary
position, S* , is about 0.6.

96
1
1.1
1.2
1.3
1.4
1.5
00.20.40.60.81
boundary position S*
C
Us=0.5
Us=0.1
Us=0.05
Figure 5-17: Dimensionless ion concentration, C, on the moving evaporation surface
(i.e.Z=S(τ)) versus dimensionless moving boundary position, S* , US as a parameter,
So =1.1(X=6%, R=Ro), 0.1== ba CC
1
1.02
1.04
1.06
1.08
1.1
00.20.40.60.81
boundary position S*
CX=9%X=6%X=3%X=2%
Figure 5-18: Dimensionless ion concentration, C, on the moving evaporation surface
(i.e.Z=S(τ), R=Ro) versus dimensionless moving boundary position, S* , X as a
parameter, US=0.05, 0.1== ba CC

97
A sensitivity study of variations in diffusion coefficient caused by
supersaturation is shown in Figure 5-19. This figure suggests that the peak 40%
supersaturation shown in Figure 5-17 for Us=0.5, which would cause a about 20%
decrease in the diffusion coefficient, would not alter the previously shown results
significantly.
0
0.1
0.2
0.3
0.4
00.20.40.60.81
Boundary position S*M
C
DD-30%DD-50%D
Figure 5-19: Dimensionless crystal mass deposition inside contact region, Mc, versus
dimensionless moving boundary position, S* , with different diffusion coefficients, D, as
a parameter, US=0.05, So=1.1 (X=6%), 0.1== ba CC
The sensitivity study of variation in diffusion coefficient shown in Figure 5-19
also suggests that the numerical model of recrytallization process near one contact point
is applicable for a certain range of diffusion coefficients because the simulation results
are not significantly changed when a 50% decrease of diffusion coefficient is used. From
the values of diffusion coefficients for KCl, NaCl and MgCl2 show in Table 4-1, it

98
implied that these simulation results are equally valid for NaCl and MgCl2 and the
numerical model may be applied for typical chemical solutions on potash particle
surfaces consisting of KCl, NaCl and MgCl2.
The sensitivity studies on other parameters used in this numerical model such as
time step, space grid and tolerance are presented in Appendix D.
5.4 Conclusions and Summary
In this chapter, a theoretical/numerical model is formulated to investigate the
recrystallization process near one contact point between two salt particles. To study this
problem, potash fertilizer properties are used and some geometric simplifications are
introduced near the contact point but the conditions simulated are typical of other tests
and field conditions. The effects of three independent factors are investigated separately
using this model. These are initial moisture content, X, evaporation rate or liquid film
speed, US, and degree of supersaturation on the surrounding surface, Cb. The numerical
results show that the mass of crystal deposition near the contact point will increase with
increased initial moisture content and decrease with evaporation rate. These numerical
predictions are consistent with the experimental data of cake strength of potash particle
beds after a specified wetting and drying process. The numerical investigation of
variations in the bounding solid surface degree of supersaturation near the contact point
showed variations in the mass deposition per unit area near the contact point. This
prediction is consistent with experimental finding of Sun who showed increased surface
roughness NaCl and KCl surface after wetting and drying implying significant variations
in the recrystallization surface degree of saturation during this process.

99
It is concluded from the numerical investigation that the recrytallization near the
contact point is the prime factor to cause a caking process in a particle bed. The
relationship between cake strength and initial moisture content, drying time, particle size
and chemical composition can be explained by the simulation of this numerical model. It
is also concluded that numerical simulation results are equally valid for a wide range of
salts such as KCl, NaCl and MgCl2.

100
CHAPTER 6
SUMMARY, CONCLUSIONS AND FUTURE WORK
6.1 Summary
In this study, the problems of product caking for bulk granular potash stored in
vessels or storage bins are investigated using laboratory tests. The general purpose of
this research is to investigate the effects of some prime factors such as initial moisture
content, particle size, drying time and chemical composition on cake strength. The first
key objective was to develop a new test method to accurately measure cake strength and
investigate the factors that influence cake strength using this method. Then the second
objective was to develop and validate a theoretical/numerical model that can
simulate/predict the caking process near contact points between particles.
The following points summarize the work carried out by this research:
1. A new test facility was devised and designed which can be used to accurately
measure cake strength of a caked potash bed. A centrifugal loading method has
been developed to determine the area-averaged fracture tensile stress in a ring of
caked potash fertilizer. A theoretical model of stress analysis in a two-dimensional
plane was developed.

101
2. A series of tests were conducted to measure cake strength of caked potash samples
in which the initial moisture content, particle size, drying time and chemical
composition (i.e. content of magnesium) were varied. The effect of these factors on
cake strength and its uncertainty were investigated and quantified experimentally.
3. A theoretical/numerical model was developed to simulate ion diffusion and
crystallization process near one contact point between two potash (KCl) particles
during a typical drying process. The moving boundary problem (i.e. one-
dimensional Stefen problem) was formulated considering the moving air-liquid
interface around the particle surface. A FORTRAN program was developed based
on this model and specified boundary conditions.
4. The numerical model was used to investigate the effects of three independent factors
such as initial moisture content, evaporation rate, and degree of supersaturation on
the surface surrounding the contact point. The simulated results were compared to
the experimental cake strength data and the roughness measurements and the
numerical model was shown to be consistent with experimental data.
6.2 Conclusions
1. The new centrifugal method of cake strength measurement developed in this thesis
can be used to measure cake strength with smaller uncertainties for a typical caked
sample bed of bulk materials such as potash. Experimental correlations between
cake strength and some important factors such as initial moisture content, particle
size, drying time and chemical composition can be predicted using this method for
various sample preparations considering these factors. It is found that cake strength

102
increases linearly with greater initial moisture content and a slower drying process
produces a stronger cake. It is also found that cake strength decreases with
increasing particle size for the same initial moisture content and drying method and
cake strength will increase essentially linearly with magnesium content for samples
with the same initial moisture content, particle size and drying method.
2. The developed theoretical/numerical model can be used to predict ion diffusion and
recrystallization process near one contact point between two salt particles such as
KCl during a typical drying process. The effects of initial moisture content, drying
rate and degree of supersaturation on the surrounding surface on the
recrystallization process can be investigated numerically using this model. The
simulated results for the crystal mass deposition near contact points between
particles are consistent with the experimental studies of cake strength and surface
roughness after caking.
3. This numerical model can be used to explain the relationship between cake strength
and initial moisture content, cake strength and the rate of drying, cake strength and
salt impurities on the particle surfaces, and enhanced surface roughness on caked
surfaces after caking compared to the roughness before wetting. Although
qualitative agreement between this recrystallization theory and experimental data is
evident from these findings, quantitative agreement will require the measurement of
more data and the use of more complex boundary conditions in the analysis and
likely more sophisticated experimental techniques and chemical analysis.

103
4. The theoretical modelling investigation indicates that, as hypothesized by other
researchers, recrystallization from wetted particle surfaces near contact points
between potash particles in beds or bulk storage is the primary cause of caking.
6.3 Hypothesis
The centrifugal method to measure cake strength for one particular bulk material,
potash, are thought to be applicable for a wide range of the bulk materials which are
susceptible to caking. The numerical results simulated by the theoretical/numerical
model for the recrystallization process near one contact point between two particles are
equally valid for a wide range of salts such as NaCl and MgCl2.
6.4 Future Work
Although the current theoretical/numerical model can simulate the
recrytallization process near one contact point between two potash particles which is the
most likely mechanism of caking in a potash bed, it is still at elementary level for caking
process in actual potash storage beds. Therefore, more experimental and
theoretical/numerical work should be done to characterize caking. Recommendations for
future work are as folows:
1. Future work should be done on the theoretical/numerical model of recrystallization
near a contact point between two particles considering following points: 1) another
moving boundary condition should be included in the numerical model considering
the crystal layer growth at the liquid-solid interface; 2) the relative size of the
contact region between two potash particles, rc ,should be analyzed and calculated

104
and the relationship between contact region and liquid film thickness surrounding
particle surfaces should be determined; 3) the model should be modified to take into
account the effect of surface tension on the recrystallization process near the contact
point; and 4) the evaporation rate could be influenced by the thermal changes caused
by latent effects during the drying process so the model should be modified to
consider the changed evaporation rate.
2. When potash is stored and transported, the ambient temperature and relative
humidity often change. These changes lead to cyclic processes for salt dissolution
and recrystallization in the potash beds. Experiments should be carried out to
measure cake strength of caked potash sample subject to cyclic wetting and drying
processes. Corresponding to the experimental investigation, the dissolution process
should be included in the numerical model and the effects of cyclic wetting and
drying on final cake strength should be studied numerically.
3. Zhou (2000) measured the effective thermal conductivity of a potash bed and
showed that the thermal conductivity of caked potash increased 20% compared to
uncaked potash. More experimental studies should be conducted to explore the
relationship and the correlation between effective thermal conductivity and cake
strength for a potash bed.
4. The experimental work could be expanded to cover a wide range of properties and
test conditions to validate the numerical model of recrystallization near a contact
point between two potash particles. As well, more sophisticated experiments would
be needed to directly relate crystal bridging near contact points and the test

105
conditions such as initial moisture content and the evaporation rate of water from
thin films surrounding particles.

106
REFERENCES
Arinze, E.A., S.Sokhansanj, Besant, R.W., Wood, H.C., and Schoenau, G.J., 2000 Moisture Adsorption Characteristics of Granular Potash during Storage-Caking, ASAE Annual International Meeting.
Arinze, E.A., S.Sokhansanj, Besant, R.W., Wood, H.C., and Schoenau, G.J., Effects of Material & Environmental Conditions on Caking & Breakage of Potash Fertilizer Products during Storage, Shipment & Handling, Powder Handling Processing, 2001. 13(1), 45-54.
ASME PTC 19.1 Uncertainty Analysis, 1998.
ASTM Standards, C39/C39M-03, 2003 Standard Test Method for Compressive Strength of Cylindrical Concrete Specimens, ASTM International.
ASTM Standards, D6128-00, 2000 Standard Test Method for Shear Testing of Bulk Solids Using the Jenike Shear Cell, ASTM International.
Budynas, R.G., 1999 Advanced Strength and Applied Stress Analysis, 2nd edition, Boston: WCB/McGraw-Hill.
Carslaw, H.S, Jaeger, J.C. Conduction of Heat in Solids, 2nd , Clarendon Press, Oxford 1959
Chen, C.K. and Tien, C.-L., Conductance of Packed Spheres in Vacuum, ASME J. Heat Transfer, 1973, 95, 302-308
Chen, R., Chen, H., Besant, R.W., and Evitts, R.W., Properties Required to Determine Moisture Transport by Capillarity, Gravity, and Diffusion in Potash Beds, Ind. Eng. Chem. Res. 2004, 43, 5365-5371.
Craig, R.R., 2000 Mechanics of Materials, 2nd edition, John Wiley &Sons. Inc.
Crank, J. Free and Moving Boundary Problems, Clarendon Press, Oxford 1984.
CRC handbook of Chemistry and Physics, 79th Edition, 1998-1999.
Felbeck, D.K., Atkins, A.G., 1984 Strength and Fracture of Engineering Solids, Prentice-Hall, Inc., Englewood Cliffs.
Gao, Q. Measurement and Modeling of an Air Wall Jet Over Potash Surfaces, M.Sc Thesis, University of Saskatchewan, 2001

107
Garrett, D.E., 1996 Potash Deposit, Processing, Properties, and Use, Chapman & Hall, London.
Gillies, D., Wang, Y., Evitts, R.W., Besant, R.W., Effects of Moisture Content, Particle Size and Chemical Content on the Cake Strength of Potash (accepted by The 5th International Conference for Conveying and Handling of Particulate Solids), 2006
Hu, G., Otaki, H., Lin, M., 2001 An Index of The Tensile Strength of Brittle Particles, Minerals Engineering, Vol. 14, No. 10, pp1199-1211.
Kaviany, M., 1999 Principles of Heat Transfer in Porous Media, 2nd edition, Springer-Verlag New York.
Kollmann T. H. and Tomas J, 2001 Time Consolidation and Caking Behaviours of Soluble Particulate Solids, Bulk Solids Handling 21 (4), pp. 431-434.
Leaper, M.C., Berry, R.J., Bradley, M.S.A., Bridle, I., Reed, A.R., Abou-Chakra H. and Tüzün, U., 2003 Measuring the tensile strength of caked sugar produced from humidity cycling, Proceedings of the Institution of Mechanical Engineers, Part E: Journal of Process Mechanical Engineering, v 217, n1, p41-47.
Muller-Krumbhaar, H., Diffusion Theory for Crystal Growth at Arbitrary Solute Concentration, The Journal of Chemical Physics, 1975, 63(12), 5131-5138.
Mullin, J. W., Crystallization, 3rd edition, Butterworth-Heinemann, 1993.
Newman, J., Electrochemical System, Prentice-Hall, Inc. Englewood Cliffs, 1973.
Peng, Shi-wen, Strathdee, Graeme and Besant, R.W., Dissolution Reaction of Potash Fertilizer with Moisture, The Canadian Journal of Chemical Engineering, 1999. Vol 77, pp1127-1133
Pietsch, W.B., 1969 The Strength of Agglomerates Bound by Salt Bridges, The Canadian Journal of Chemical Engineering , Vol. 47, pp403-409.
Pilkey, W. D., 2005 Formulas for Stress, Strain and Structural Materials, John Wiley& Sons, Inc.
Rumpf, H., 1958 Grundlagen und Methoden des Granulierens. Chemie Ing. Tech., 30, p144-158.
Sun, J., Besant, R.W., Evitts, R.W., Fracture Stress Measurement and Images of Caked particles of KCl and NaCl (accepted by The 5th International Conference for Conveying and Handling of Particulate Solids), 2006
Tanaka, T., 1978 Evaluating the Caking Strength of Powder, Ind. Eng. Chem. Prod. Res. Dev., Vol. 17, No. 3, pp241-246.

108
Thompson, D.C., Fertilizer Caking and Its Prevention, Proceeding of Fertilizer Society, No. 125, London, UK. 1972.
Tsypkin, G.G., Brevdo, L, A Phenomenological Model of the Increase in Solute Concentration in Ground Water Due to Evaporation, Transport in Porous Media, 1999, 37, 129-151.
Walker, G. M., Magee, T.R., Holland, C.R., Ahmad, M.N., Fox, J.N., Moffat, N. A. and Kells, A.G., Caking Process in Granular NPK, Ind. Eng. Chem. Res., 1999, 37, 435-438.
Wang, W., Hu, W.R., Concentration Distribution in Solution Crystal Growth: Effect of moving interface conditions, Journal of Crystal Growth, 1999, 203, 227-233.
Yao, L.S., Prusa, J., Melting and Freezing, Advances in Heat Transfer, Volume 19, Academic Press, INC. 1989
Yungwirth, T., Evitts, R.W., Besant, R.W., Measuring Moisture Content of Potash Bulk Fertilizers Using a Steel Ball in a Transient Heat Transfer Process, Ind. Eng. Chem. Res., (accepted for publication 2006)
Zhou, Q, Measurement and Simulation of Transient Moisture and Heat Diffusion in a Potash Layer, M.Sc Thesis, University of Saskatchewan, 2000.
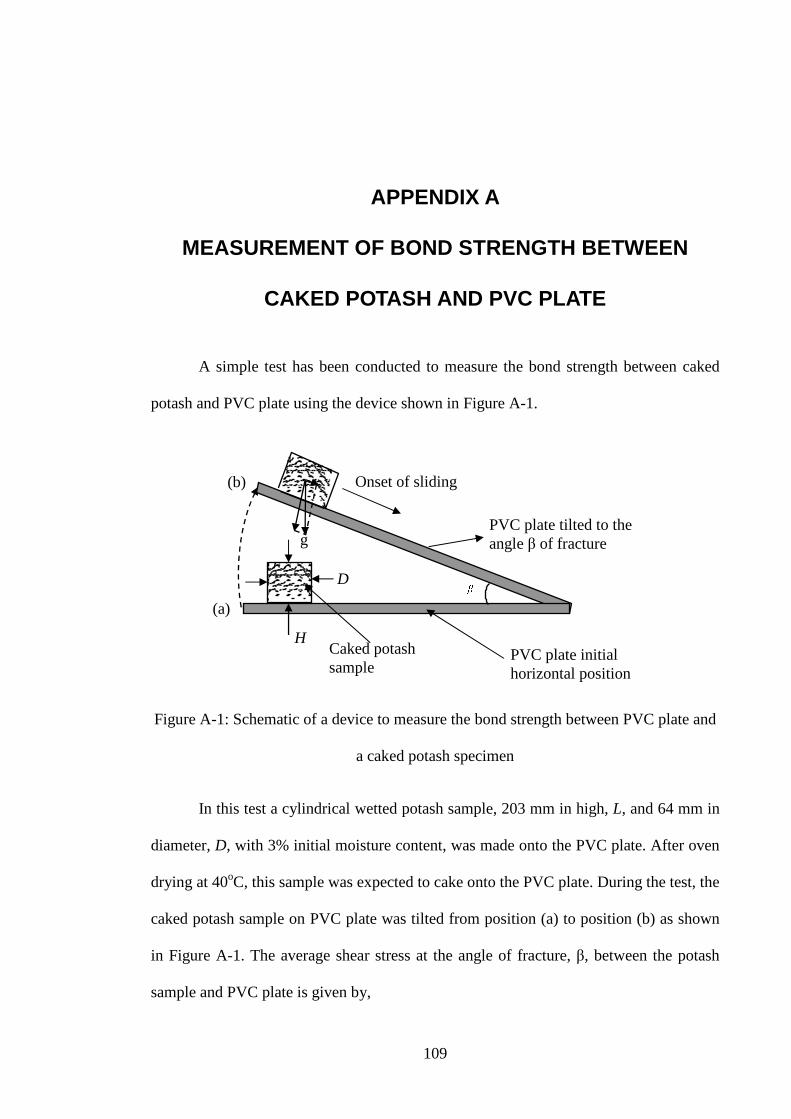
109
APPENDIX A
MEASUREMENT OF BOND STRENGTH BETWEEN
CAKED POTASH AND PVC PLATE
A simple test has been conducted to measure the bond strength between caked
potash and PVC plate using the device shown in Figure A-1.
Figure A-1: Schematic of a device to measure the bond strength between PVC plate and
a caked potash specimen
In this test a cylindrical wetted potash sample, 203 mm in high, L, and 64 mm in
diameter, D, with 3% initial moisture content, was made onto the PVC plate. After oven
drying at 40oC, this sample was expected to cake onto the PVC plate. During the test, the
caked potash sample on PVC plate was tilted from position (a) to position (b) as shown
in Figure A-1. The average shear stress at the angle of fracture, β, between the potash
sample and PVC plate is given by,
Onset of sliding
�
g
PVC plate initial horizontal position
Caked potash sample
PVC plate tilted to the angle β of fracture
D
(a)
(b)
H

110
2)2/(
sin
D
mgb π
βτ = (A-1)
Where, m is mass of the caked potash sample which is given by 4/2DHm πρ= ;
The selected particle size of potash sample is ranged from 0.85 mm to 1.18 mm.
5 samples were repeated and the experimental results for the fracture shear stress were
131.8 Pa, 115.9 Pa, 100.25 pa, 84.9 Pa and 108.2 Pa respectively which gave a mean
fracture value of 108.1 Pa. Using Mohr’s circle, the tensile stress at the fracture surface
to break the crystal bond between caked potash and PVC plate in Figure A-1 should
have the same order of magnitude as the shear stress. This bond strength between caked
potash and PVC plate is much smaller than the cake strength measured for caked potash
in the centrifuge under similar conditions (i.e. 40 KPa). This test implies that the radial
tensile stress on the inner plastic surface of a caked potash shell shown in Figure 2-2
would be negligible compared to the inter-particle tensile stress for a ring test sample
placed in the centrifuge. This experimental finding is used to determine the boundary
conditions in the stress analysis model which was presented in Chapter two.

111
APPENDIX B
ELASTIC PROPERTY DATA FOR A CAKED POTASH
SAMPLE
The literature on potash gave elastic property data for solid KCl specimens but
none for caked potash particle specimens. In this experiment, Young’s modulus, Eb, and
Poisson’s ratio, ν, were determined using a compression test of a caked potash specimen.
This compression test for a caked potash sample was conducted using the INSTRON
material testing machine. The experimental data for a caked potash specimen shows that
these mechanical properties of a caked potash bed are significantly different than those
for solid KCl crystal salt specimens (i.e. 10105.2 × Pa for Young’s modulus and 0.3 for
Poisson’s ratio).
1. Experiment procedure
Potash particles with a particle size range from 0.85 mm to 1.18 mm and with
0.1% magnesium content were selected to prepare the test sample. A cylindrical caked
potash sample, 200 mm in high, L, and 100 mm in diameter, D, was made by drying this
specimen for 48 hours in oven at 40 oC after it was wetted with 3% moisture content.
This caked sample then was placed into the INSTRON material testing machine (Model
1122) and two dial indicators were used to measure displacements in the uniaxial and
lateral directions. The load cells in the INSTRON machine have a range from 0 to 5000
N. The full scale of the dial indicator used in uniaxial direction is from 0 to 25 mm with
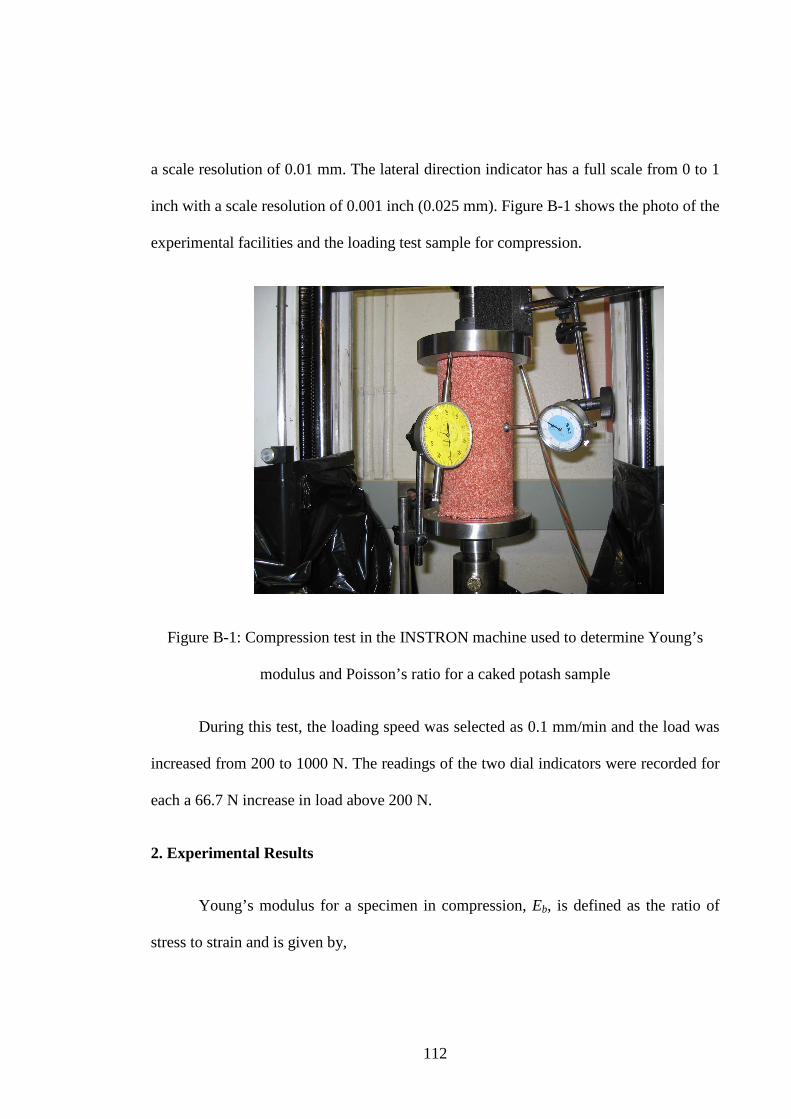
112
a scale resolution of 0.01 mm. The lateral direction indicator has a full scale from 0 to 1
inch with a scale resolution of 0.001 inch (0.025 mm). Figure B-1 shows the photo of the
experimental facilities and the loading test sample for compression.
Figure B-1: Compression test in the INSTRON machine used to determine Young’s
modulus and Poisson’s ratio for a caked potash sample
During this test, the loading speed was selected as 0.1 mm/min and the load was
increased from 200 to 1000 N. The readings of the two dial indicators were recorded for
each a 66.7 N increase in load above 200 N.
2. Experimental Results
Young’s modulus for a specimen in compression, Eb, is defined as the ratio of
stress to strain and is given by,

113
a
cbE
εσ
= (B-1)
where cσ is the stress which is given by the loading force, F, divided by the cross-
sectional area of sample; aε is the strain in the uniaxial direction of loading which is
given by the displacement in the axial direction, L∆ , divide by the original length. The
calculation of Eb is given by equation (B-2),
)/(
)/(4 2
LL
DFE
a
cb ∆
== πεσ
(B-2)
The Poisson’s Ratio in compression is defined as the ratio of the lateral strain, lε ,
to the axial strain, aε , which is given by,
LL
DD
a
l
/
/
∆∆==
εεν (B-3)
The experimental data and calculated Young’s modulus and Poisson’s ratio are
shown in Table B-1. For pure solid potassium chloride crystals, Poisson’s ratio and the
Young’s modulus were reported to be 0.3 and 10105.2 × Pa respectively (Garrett, 1996).
It is found from the data in Table B-1 that the stiffness of a caked potash particle bed is
significantly lower than the pure solid KCl.

114
Table B-1: Experimental data and uncertainty to determine Young’s modulus and
Poisson’s ratio for a caked potash specimen comprised of particles with a size range 0.85
to 1.18 mm which is 200 mm long and 100 mm diameter
Loading (N)
100×∆L
(mm)
1000×∆D
(mm)
Eb
(Pa)
U(Eb)
(Pa) ν U(ν)
200.0 13.5 0 3.77 710× 2.5 410× 0.00 N/A
266.7 19.0 0 3.58 710× 2.0 410× 0.00 N/A
333.3 26.0 0 3.27 710× 1.5 410× 0.00 N/A
400.0 33.0 0 3.09 710× 1.3 410× 0.00 N/A
466.7 41.0 0 2.90 710× 1.1 410× 0.00 N/A
533.3 47.0 0 2.89 710× 1.0 410× 0.00 N/A
600.0 51.5 0 2.97 710× 1.0 410× 0.00 N/A
666.7 56.0 0 3.03 710× 1.0 410× 0.00 N/A
733.3 62.0 4 3.01 710× 0.9 410× 0.01 0.05
800.0 69.0 20 2.95 710× 0.9 410× 0.06 0.04
866.7 73.0 30 3.02 710× 0.8 410× 0.08 0.04
933.3 78.0 46 3.05 710× 0.8 410× 0.12 0.04
1000.0 82.5 46 3.09 710× 0.8 410× 0.11 0.03

115
APPENDIX C
MEASURED DATA FOR CAKE STRENGTH
Table C- 1: Average (15 samples) cake strength for different particle diameters and
initial moisture contents for oven drying at 40º C
Particle size
(mm)
Initial moisture
content, %(w/w) meanσ (KPa) )( meanU σ (KPa)
0.44 0.9 0.2
0.86 7.2 1.2
1.76 29.5 2.9
2.72 39.1 3.5
18.185.0 << pd
02.1=pmd
3.68 56.7 2.7
0.92 5.9 1.8
1.83 17.7 2.6 68.118.1 << pd
43.1=pmd 2.72 20.1 1.9
0.90 0.80 0.4
1.86 4.1 1.4 36.200.2 << pd
18.2=pmd 2.68 10.3 2.5
0.88 0.5 0.1
1.39 0.8 0.3
1.78 1.5 0.5
35.380.2 << pd
08.3=pmd
2.68 4.7 0.7

116
Table C- 2: Average (15 samples) cake strength at different particle diameters and initial
moisture contents for air drying
Particle size
(mm)
Initial moisture
content, %(w/w) meanσ (KPa) )( meanU σ (KPa)
0.84 1.8 0.3
1.27 2.9 0.5
1.75 4.8 0.8
2.70 11.9 1.3
3.37 15.9 1.7
5.75 31.0 2.1
18.185.0 << pd
02.1=pmd
0.84 1.8 0.3
0.89 2.5 0.5
1.82 3.9 0.6 68.118.1 << pd
43.1=pmd 2.74 8.1 1.0
0.87 1.7 0.4
1.74 2.1 0.5 36.200.2 << pd
18.2=pmd 2.59 2.9 0.6
1.32 0.8 0.1
1.74 1.1 0.3 35.380.2 << pd
08.3=pmd 2.65 2.3 0.4

117
Table C- 3: Average (15 samples) cake strength at different magnesium concentrations
and initial moisture contents for oven drying at 40º C, 0.85 < pd < 1.18 mm
Magnesium
Concentration (%)
Initial moisture
content, %(w/w) meanσ (KPa) )( meanU σ (KPa)
0.51 2.0 0.7
0.93 7.3 1.5 0.02
1.83 25.9 4.2
0.52 8.1 1.4
0.94 15.2 1.5 0.06
1.84 39.8 3.7
0.51 12.7 1.7
0.92 24.4 4.3 0.10
1.83 47.2 5.1
Table C- 4: Average (15 samples) cake strength at different magnesium concentrations
and initial moisture contents for air drying, 0.85 < pd < 1.18 mm
Magnesium
Concentration (%)
Initial moisture
content, %(w/w) meanσ (KPa) )( meanU σ (KPa)
0.88 4.2 0.6
1.84 9.0 1.1 0.02
2.81 12.8 2.4
0.87 9.5 2.1
1.82 19.3 2.0 0.06
2.68 32.5 2.3
0.93 22.8 5.4
1.85 55.7 6.9 0.10
2.76 69.3 8.1

118
APPENDIX D
SENSITIVITY STUDY ON PARAMETERS USED IN
NUMERICAL MODEL
The sensitivity of parameters used in this numerical model such as time step,
space step in Z direction and criteria of convergence (i.e. tolerance) was studied. The
simulation results with different time steps, space steps in Z direction and tolerances are
shown in Figure D-1, D-2 and D-3 respectively.
1. Time Step (∆t)
0
0.05
0.1
0.15
0.2
0.25
0.3
0 1 2 3 4 5
radial position, R
N
�t=0.02s
�t=0.01s
�t=0.001s
�t=0.0001s
Figure D-1: Crystal mass deposition per unit area, N, at various radial position, R, with
different time step, t∆ , as a parameter, So=1.1, US=0.05�S*=0.2, 25/1=∆Z

119
2. Space step in Z direction (∆Z)
0
0.05
0.1
0.15
0.2
0.25
0.3
0 1 2 3 4 5
radial position,R
N
�Z=1/5
�Z=1/10
�Z=1/25
�Z=1/50
Figure D-2: Crystal mass deposition per unit area, N, at various radial position, R, with
different space step, Z∆ , as a parameter, So=1.1, US=0.05�S*=0.2, st 310−=∆

120
3. Tolerance (ε)
0
0.05
0.1
0.15
0.2
0.25
0.3
0 1 2 3 4 5
radial position, R
N
�
�
�
�
= 10-2
= 10-3
= 10-4
= 10-6
Figure D-3: Crystal mass deposition per unit area, N, at various radial position, R, with
different tolerance,ε , as a parameter, So=1.1, US=0.05�S*=0.2, st 310−=∆ ,
25/1=∆Z