impurities enhance caking in lactose powder
TRANSCRIPT

HAL Id: hal-01408010https://hal.archives-ouvertes.fr/hal-01408010
Submitted on 3 Apr 2017
HAL is a multi-disciplinary open accessarchive for the deposit and dissemination of sci-entific research documents, whether they are pub-lished or not. The documents may come fromteaching and research institutions in France orabroad, or from public or private research centers.
L’archive ouverte pluridisciplinaire HAL, estdestinée au dépôt et à la diffusion de documentsscientifiques de niveau recherche, publiés ou non,émanant des établissements d’enseignement et derecherche français ou étrangers, des laboratoirespublics ou privés.
Impurities enhance caking in lactose powderMélanie Carpin, H. Bertelsen, A. Dalberg, Claire Roiland, J. Risbo, Pierre
Schuck, Romain Jeantet
To cite this version:Mélanie Carpin, H. Bertelsen, A. Dalberg, Claire Roiland, J. Risbo, et al.. Impurities en-hance caking in lactose powder. Journal of Food Engineering, Elsevier, 2017, 198, pp.91-97.�10.1016/j.jfoodeng.2016.11.013�. �hal-01408010�

Accepted Manuscript
Impurities enhance caking in lactose powder
M. Carpin, H. Bertelsen, A. Dalberg, C. Roiland, J. Risbo, P. Schuck, R. Jeantet
PII: S0260-8774(16)30420-4
DOI: 10.1016/j.jfoodeng.2016.11.013
Reference: JFOE 8718
To appear in: Journal of Food Engineering
Received Date: 30 August 2016
Revised Date: 13 October 2016
Accepted Date: 18 November 2016
Please cite this article as: Carpin, M., Bertelsen, H., Dalberg, A., Roiland, C., Risbo, J., Schuck, P.,Jeantet, R., Impurities enhance caking in lactose powder, Journal of Food Engineering (2016), doi:10.1016/j.jfoodeng.2016.11.013.
This is a PDF file of an unedited manuscript that has been accepted for publication. As a service toour customers we are providing this early version of the manuscript. The manuscript will undergocopyediting, typesetting, and review of the resulting proof before it is published in its final form. Pleasenote that during the production process errors may be discovered which could affect the content, and alllegal disclaimers that apply to the journal pertain.
MANUSCRIP
T
ACCEPTED
ACCEPTED MANUSCRIPT
1
Impurities enhance caking in lactose powder 1
M. Carpin1,2,4, H. Bertelsen2, A. Dalberg2, C. Roiland3, J. Risbo4, P. Schuck1, R. Jeantet1 2
1 UMR 1253, Science and Technology of Milk and Eggs, Inra-Agrocampus Ouest, 35042 3
Rennes cedex, France 4
2 Arla Foods Ingredients Group P/S, 6920 Videbæk, Denmark 5
3 University of Rennes 1, UMR CNRS 6226, Campus de Beaulieu, Rennes, France 6
4 Department of Food Science, University of Copenhagen, 1958 Frederiksberg C, Denmark 7
Abstract: 15
Caking of lactose and other dry ingredients is a common problem in the dairy and food 16
industries. The lactose production process includes different purification steps, depending on 17
the type of lactose produced. The aim of this study was therefore to investigate how the 18
remaining impurities (i.e. non-lactose components) affect the caking tendency of the final 19
powder. The results from a combination of different methods, including dynamic vapor sorption, 20
characterization of the physicochemical composition and assessment of caking with a ring 21
shear tester, suggested humidity caking. Larger amounts of impurities in the lactose powder 22
resulted in enhanced moisture sorption and greater caking tendency. These findings emphasize 23
the importance of controlling the washing and purification steps throughout the production 24
process in order to limit caking in the final product. 25
Keywords: 26
Caking, lactose, impurities, amorphous, moisture sorption, ring shear tester 27

MANUSCRIP
T
ACCEPTED
ACCEPTED MANUSCRIPT
2
1. Introduction 28
As a consequence of trade globalization and significant advances in drying and powder handling 29
technology, the volume of food ingredients produced in powder form has dramatically increased 30
in the past decade. Indeed, as dry ingredients have better storage stability and are easier to 31
transport, a major part of the recent investments in the dairy sector has been focused on dry 32
products (International Dairy Federation, 2015). In particular, whey, which was traditionally 33
considered as waste, has gained considerable attention, and its different constituents (whey 34
proteins, lactose, lactoferrin, milk salts, etc.) are now separated and sold as high value products 35
in the dry state. The range of applications for whey-derived dry ingredients has thus expanded 36
considerably. 37
Among the whey-derived ingredients, lactose is used in various food and pharmaceutical 38
applications. For example, lactose powder is the main ingredient of infant formulae and provides 39
an important source of carbohydrates to match the composition of human milk. Lactose can be 40
found in different forms, but the most common and stable form is crystallized α-lactose 41
monohydrate. α-lactose monohydrate is produced industrially by evaporation of whey followed 42
by slow cooling in a crystallization tank. Typically, the harvested crystals are then washed and 43
dried in a fluidised bed dryer. Different purification steps can make the process more complex, 44
depending on the type of lactose produced. For example, calcium and phosphate are usually 45
removed prior to evaporation in order to increase the running time of the evaporators and reduce 46
fouling. The lactose production process has been described in greater detail by Hourigan et al. 47
(2013). 48
The handling and storage of lactose and other dry food products can be complicated by a 49
problem that is well known in the food industry, i.e. the unwanted agglomeration of powder 50
particles observed as lumps of various sizes and hardness. This process, known as caking, 51
results in non-conform products and significant economic loss. Although α-lactose monohydrate 52
is generally considered to be a stable product, caking of lactose is a major problem in the dairy 53
industry. The three most relevant caking mechanisms in food powders have recently been 54
reviewed (Carpin et al., 2016). Amorphous caking is the main mechanism in amorphous 55
powders whereby a temperature increase above the glass transition temperature (Tg) of the 56
MANUSCRIP
T
ACCEPTED
ACCEPTED MANUSCRIPT
3
material leads to viscous flow to contact points. Due to the plasticization effect of water, storage 57
at relatively high relative humidity (RH) can lower the Tg and initiate amorphous caking. 58
Humidity is also a crucial factor in the second caking mechanism, called humidity caking. Water 59
molecules are adsorbed on the surface of the particles and liquid bridges can be formed by 60
capillary condensation. If the RH increases above the deliquescence relative humidity (DRH) of 61
the material, the solid can dissolve in the surrounding water layer. A subsequent decrease in RH 62
results in solid bridges and thus stronger links between particles. Finally, the third mechanism, 63
mechanical caking, is an aggravating factor rather than a caking mechanism in itself. Mechanical 64
pressure on a powder bed brings the particles closer to each other, thereby increasing the 65
interactions between particles and the number of contact points. Mechanical caking therefore 66
worsens any caking tendency due to humidity or the presence of amorphous material. 67
In view of the above three mechanisms, it is obvious that caking can be influenced by several 68
parameters such as water content, particle size and shape, amorphous content, etc. Several 69
studies have investigated how these factors affect caking of α-lactose monohydrate. Listiohadi et 70
al. (2008, 2005a, 2005b) focused on the role of the different lactose polymorphs, amorphous 71
lactose and the milling procedure. Bronlund and Paterson (2004) examined the effects of particle 72
size and temperature on the moisture sorption characteristics of lactose powder and 73
temperature-induced moisture migration in a bag of lactose (Paterson and Bronlund, 2009). As 74
humidity has a crucial role in both amorphous and humidity caking, any impurity that can 75
enhance lactose hygroscopicity, such as peptides and minerals, can be detrimental. This 76
parameter has not been investigated to date. The aim of this study was therefore to characterize 77
the effects of impurities on lactose caking. 78
2. Materials and methods 79
2.1. Production of lactose powders on a pilot scale 80
Decalcified and decolored ultrafiltered (UF) whey permeate was obtained from Arla Foods 81
Ingredients, Viby J, Denmark. The solids content was raised to 60% in a Centritherm CT2 82
evaporator (Flavourtech, Griffith, Australia). The concentrate was cooled in a tank from 79 °C to 83
11 °C in about 18 hours for lactose crystallization purposes. For the washing step, a Lemitec 84

MANUSCRIP
T
ACCEPTED
ACCEPTED MANUSCRIPT
4
MD80 laboratory decanter centrifuge (Lemitec GMBH, Berlin, Germany) was used to produce 85
five lactose powders with different washing grades. The slurry was first run through the decanter 86
once without water for a pre-wash (Wash 0). The prewashed slurry was then mixed with water at 87
different water / lactose slurry (w/w) ratios: 1/3 (Wash 0.3), 1/2 (Wash 0.5), 1/1 (Wash 1) and 2/1 88
(Wash 2). The different washing grades of slurry were run through the decanter once more, and 89
then dried on an Anhydro SFD 47 spin flash dryer (SPX Flow Technology, Søborg, Denmark) 90
with an inlet temperature of 105 °C and an outlet t emperature of 82-87 °C. Finally the powders 91
were packaged in two layers of plastic bags and a Kraft paper bag before transportation to the 92
analysis laboratory where they were poured into airtight plastic containers of various sizes to 93
minimize the headspace. The powders were stored at 20 °C before analysis. 94
Pharmaceutical grade lactose (Lactochem ® Crystals, batch number 663108) was purchased 95
from DFE pharma (Goch, Germany) for comparison with the experimental lactose powders 96
produced at different washing grades. Pharmaceutical grade lactose is produced industrially 97
from edible grade lactose by re-dissolving the lactose in clean water followed by additional 98
purification steps (Paterson, 2009). It is therefore the most pure lactose available on the market. 99
Pharmaceutical grade lactose was mixed with distilled water to make a 15% (w/w) lactose 100
solution which was left to stand at 40 °C for one h our. The solution was then cooled to 20 °C and 101
spray dried on a pilot-scale spray dryer (GEA Niro A/S, Mobile Minor Dryer (MMD), Soeborg, 102
Denmark) to obtain amorphous lactose. The inlet and outlet air temperatures were 200 °C and 103
90 °C, respectively, and the feed flow rate was 40 mL.min-1. 104
2.2. Chemical composition 105
Protein, moisture and ash content were determined according to the methods described by 106
Schuck et al. (2012). Total nitrogen content determined by Kjeldahl with a 6.38 conversion factor 107
will be designated as protein content. Given the filtration steps in the lactose process, it is 108
however unlikely that proteins remain in the final powder. Therefore, impurities formally 109
expressed as protein may more likely be smaller nitrogen containing components such as 110
peptides and amino-acids. Analysis of moisture and ash content was carried out in triplicate and 111
the protein content was determined in duplicate. The lactose content was then calculated by 112

MANUSCRIP
T
ACCEPTED
ACCEPTED MANUSCRIPT
5
difference. Individual minerals (calcium, phosphorus, sodium, potassium and magnesium) were 113
measured by inductively coupled plasma optical emission spectrometry (ICP-OES) on an 114
Optima 2000 DV (PerkinElmer, Waltham, Massachusetts, USA). Chloride was determined by 115
potentiometry. All minerals were analyzed in duplicate. 116
2.3. Sieving and measurement of particle size 117
The lactose powders of different washing grades were sieved to separate 80, 160, 250, 355 and 118
500 µm fractions. The particle size distribution of the powders was measured by laser light 119
scattering using a Malvern Mastersizer 2000 equipped with a Scirocco 2000 dry dispersion unit 120
(Malvern Instruments, Worchestershire, UK). 121
2.4. Moisture sorption measurements 122
Sorption isotherms of powders were obtained with a Dynamic Vapor Sorption (DVS) Advantage 123
(Surface Measurement Systems Ltd., London, UK) equipped with a Cahn microbalance. The 124
experiments were carried out in duplicate at a constant temperature (25 °C) using a nitrogen 125
flow rate of 200 standard cm3.min-1. Approximately 40 mg of powder was subjected to ramping 126
of RH from 0% to 95% in 10%–RH steps with water as solvent. Equilibrium was considered to be 127
reached if the rate of change in mass was less than 0.0002 %.min-1. 128
2.5. Particle morphology — scanning electron microscopy (SEM) 129
The surface morphology of the lactose samples was examined using a scanning electron 130
microscope (SEM, JEOL JCM-6000 - NeoScope II, Tokyo, Japan) operating at 15 kV. Samples 131
were mounted on an aluminium stub and coated with a thin layer of gold (JEOL JFC-1300 auto 132
fine coater) prior to analysis. The photomicrographs were taken at ×1,000 magnification. 133
2.6. Solid-state Nuclear Magnetic Resonance (NMR) 134
13C NMR spectra were obtained using proton decoupling, magic angle spinning (MAS) and 135
cross polarization (CP). The spectra were recorded on a Bruker Avance I WB 300 MHz 136
(7T) instrument (Bruker, Billerica, USA) at ambient temperature according to the method 137
described by Gustafsson et al. (1998), with the following parameters: spinning rate 5 kHz, 138

MANUSCRIP
T
ACCEPTED
ACCEPTED MANUSCRIPT
6
contact time 2 ms, acquisition time 147 ms, sweep widths 2190 ppm and delay between pulses 139
of 3 s. For each spectrum, about 150,000 transients were cumulated with 49k data points. The 140
spectra were referenced to trimethylsilane (TMS). 141
2.7. Quantification of caking 142
Caking, also known as time consolidation, was measured with a ring shear tester (RST-XS, 143
Schulze-Schüttgutmesstechnik, Wolfenbüttel, Germany). The measurement procedure has been 144
described in detail by Schulze (2008). First the yield locus of each powder was measured for a 145
normal stress at preshear σpre corresponding to a consolidation stress σc of around 9.3 kPa. This 146
value was chosen to simulate powder consolidation at the bottom of a flexible intermediate bulk 147
container (FIBC), also called a Big Bag. Three points of incipient flow were used to draw the 148
yield locus. Once the initial yield locus was established, the powder was preconditioned using 149
the same σpre as above and stored at 20 °C and 60% RH for four d ays. A temperature and 150
humidity data logger was used to check the storage conditions. Loads of 2 kg (corresponding to 151
a consolidation stress of 9.3 kPa) were applied to the samples for the duration of storage. After 152
storage the samples were sheared to obtain the time yield locus. From this, the unconfined yield 153
strength σ1 and the ratio of σc to σ1, called ffc, were identified. By definition, a sample with an ffc 154
lower than 1 was considered to be caked (Jenike, 1964). For each powder except Wash 0.3, the 155
ffc was measured in triplicate. As the amount of Wash 0.3 was limited, the analysis could only be 156
performed in duplicate. 157
3. Results and discussion 158
3.1. Chemical composition 159
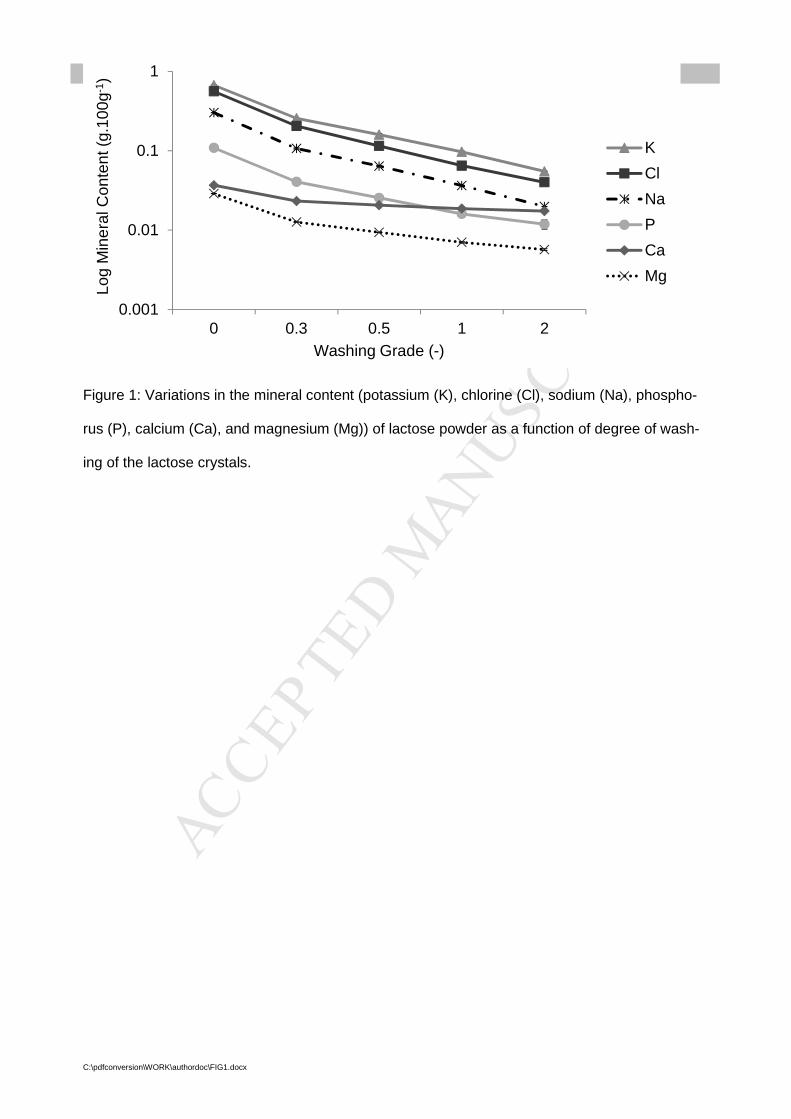
The results showed, as expected, that the higher the washing grade, the fewer the remaining 160
impurities measured in the final powder (i.e. nitrogen containing components expressed as 161
proteins, free moisture, ash and minerals) (Table 1 and Fig. 1). The remaining ash and protein 162
levels were highly correlated (R2=0.972). Moreover, ash and protein levels were found to 163
correlate better with moisture measured by loss on drying at 87°C for 16 hours (R 2=0.995 and 164
R2=0.972, respectively) than with moisture measured after drying at 105°C for 5 hours (R 2=0.709 165

MANUSCRIP
T
ACCEPTED
ACCEPTED MANUSCRIPT
7
and R2=0.840, respectively) (data not shown). The method to measure food moisture by loss on 166
drying has been criticized for the lack of discrimination between the different types of water, 167
distinguished by the extent of binding with solids (Isengard, 2001). “Free” and “bound” water can 168
indeed be difficult to differentiate, and the results at 105 °C may overestimate the “free” water 169
content of the samples. 170
The amounts of all minerals decreased with a higher degree of washing, with the exception of 171
calcium (Fig. 1). The decalcification and subsequent separation steps applied to the UF 172
permeate reduced the initial calcium and phosphorus content (Hourigan et al., 2013). Thus the 173
starting material for the trial already had low calcium and phosphorus content from the 174
beginning. Fig. 1 shows that it was not possible to reduce the calcium content much further by 175
washing the lactose crystals. This suggests that, as mentioned by Guu and Zall (1992), most of 176
the remaining calcium formed strong complexes with lactose. Interestingly, phosphate did not 177
follow the same trend as calcium. Guu and Zall (1991) reported that calcium phosphate 178
precipitates may act as nuclei facilitating lactose crystallization. It was therefore expected that 179
calcium phosphate could be trapped inside the crystals, thereby preventing it from being washed 180
away. This was however not observed in the present study. 181
Using a basic mass balance with simple assumptions, the expected amount of impurities in the 182
different washing grades after decantation was calculated from the amount measured in Wash 0. 183
The water content in the decanter output was considered the same for all washing grades (i.e. 184
10%) and it was assumed that no lactose was dissolved during the decantation process. The 185
calculated levels of protein and ash were in general lower than the measured amounts (data not 186
shown). The inclusion of droplets of mother liquor inside the crystals, as suggested by 187
Mathlouthi and Rogé (2003) for sucrose, could explain the limited effect of washing. 188
3.2. Moisture sorption 189
Sieving the powders led to standardization of particle size distribution (Fig. 2). Indeed it has 190
been shown that particle size can have a significant effect on moisture sorption (Stoklosa et al., 191
2012). 192

MANUSCRIP
T
ACCEPTED
ACCEPTED MANUSCRIPT
8
Moisture sorption was highly dependent on the washing grade (Fig. 3). For the same particle 193
size fraction (160<x<250µm), the sorption of the unwashed powder (Wash 0) was dramatically 194
enhanced from 30% RH and the final sorption was almost ten times higher than the most 195
washed powders (Wash 1 and Wash 2). Crystalline lactose is characterized by a very low 196
hygroscopicity, with a deliquescence relative humidity (DRH) value of 95% (Salameh et al., 197
2006). However, Tereshchenko (2015) reported that, for a water soluble crystalline solid, 198
moisture sorption below the DRH was due to impurities. Enhanced sorption and reduced DRH 199
due to the presence of low levels of impurities have also been reported in a model deliquescent 200
pharmaceutical salt, in agreement with our results (Guerrieri et al., 2007). The sorption behavior 201
of the different lactose powders is thus likely to originate from differences in impurity contents 202
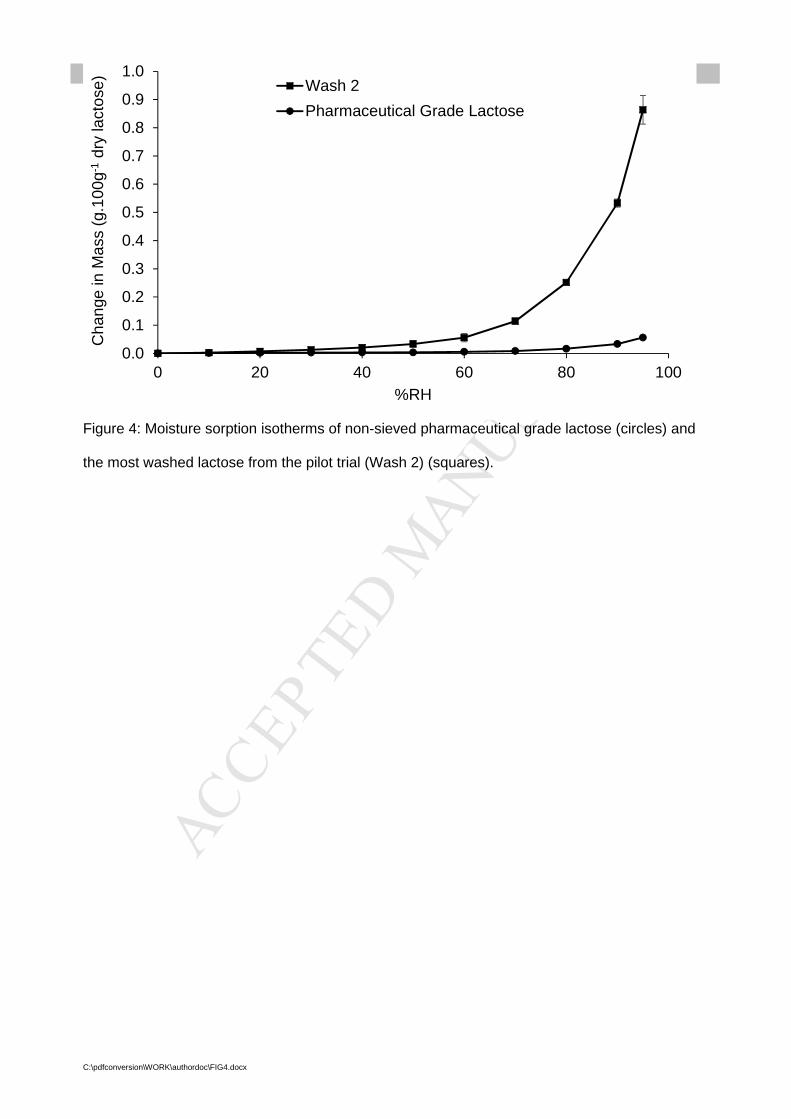
(Table 1). This was further evidenced by a comparison with pharmaceutical grade lactose. The 203
latter was found to contain about 20 times less ash and proteins than the most washed powder 204
produced during the pilot trial (Table 1). The difference in moisture sorption behavior between 205
Wash 2 and the pharmaceutical grade powder was very clear: indeed, Wash 2 powder adsorbed 206
almost 10 times more moisture than pharmaceutical grade lactose above 50% RH (Fig. 4). 207
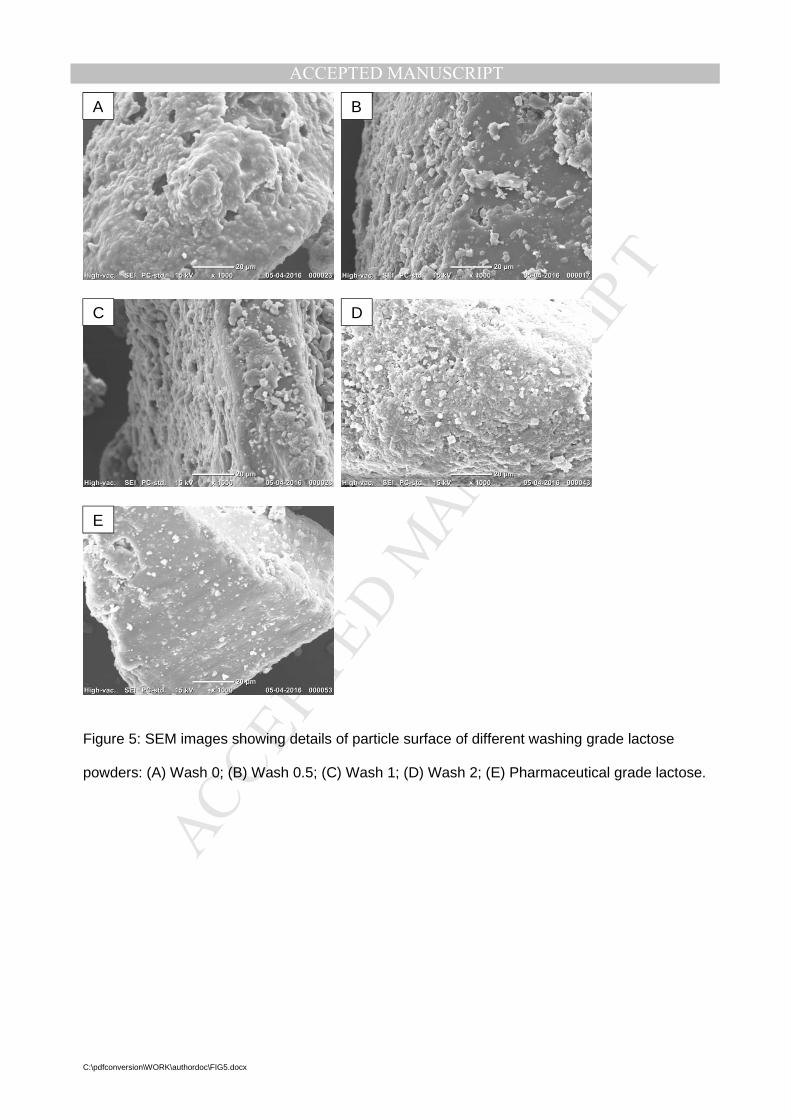
As moisture sorption occurs primarily on the surface of crystals, a comparison of the surface of 208
the different washing grade lactose powders was undertaken by scanning electron microscopy 209
(Fig. 5). All samples from the pilot trial (Fig. 5A-D) presented a rough surface. Wash 0 powder 210
had many pores (Fig. 5A), which would provide greater possibilities for capillary condensation 211
and could therefore partly explain the enhanced moisture sorption previously reported (Fig. 3). 212
Compared to pharmaceutical grade lactose, which presented a smooth surface (Fig. 5E), Wash 213
0.5, 1 and 2 powders had significant amounts of fines agglomerated on the surface of their large 214
tomahawk crystals (Fig. 5B-D). Mathlouthi and Rogé (2003) showed that the presence of fines in 215
sucrose crystals enhanced moisture sorption and that the greater the number of fine particles, 216
the closer the sorption behavior of the sample to that of the amorphous state. Their findings are 217
consistent with the moisture sorption isotherms obtained in this study, showing less sorption for 218
pharmaceutical grade lactose (Fig. 4). 219
Moreover, a higher concentration of impurities on the surface of the crystals would probably lead 220
to enhanced sorption behavior. On the other hand, impurities trapped inside the crystals are not 221

MANUSCRIP
T
ACCEPTED
ACCEPTED MANUSCRIPT
9
expected to have a significant role in moisture sorption. This point requires further attention to 222
identify which impurities (nature, concentration) are present on the surface of the particles. 223
3.3. Role of amorphous material 224
One particular kind of impurity is amorphous material, which is well known for its high 225
hygroscopicity compared to the crystalline counterpart. Amorphous lactose can be formed on the 226
surface of lactose particles during rapid drying and milling (Vollenbroek et al., 2010). As the 227
samples were dried in a spin flash dryer in the present study, the possibility of formation of 228
amorphous material due to rapid drying cannot be excluded. The impurities remaining after the 229
washing process (e.g. minerals and protein fractions) were likely to retain some mother liquor 230
which could turn into amorphous lactose upon drying. The presence of increasing, yet very low, 231
amounts of amorphous lactose at lower washing grades could thus be another explanation for 232
the enhanced hygroscopicity of the corresponding powders. 233
However, no recrystallization event was observed in the moisture sorption curves, contrary to 234
previously reported sorption isotherms of predominantly crystalline materials containing some 235
amorphous content (Sheokand et al., 2014). For example, a weight increase and subsequent 236
decrease due to amorphous lactose absorbing moisture and crystallizing has been reported in 237
samples containing between 0.125 and 0.5 w/w % amorphous material (Buckton and Darcy, 238
1995). However, the presence of amorphous material in our samples cannot be ruled out from 239
the sorption isotherms. Residual amorphous lactose might be present at lower levels than those 240
studied by Buckton and Darcy (1995). Moreover, Buckton and Darcy (1995) used physical mixes 241
of spray-dried lactose and α-lactose monohydrate in their study, which can facilitate the 242
crystallization event compared to a situation where the amorphous material is in close contact 243
with crystalline portions on the same particle. 244
The samples with different washing grades were therefore analyzed by solid-state NMR. A 245
detection limit of 0.5% amorphous lactose has been reported for this technique (Gustafsson et 246
al., 1998), which is among the lowest levels for the detection of amorphous material in 247
predominantly crystalline materials (Giron et al., 2007). No disorder indicating amorphous 248

MANUSCRIP
T
ACCEPTED
ACCEPTED MANUSCRIPT
10
material was detected in our samples (Fig. 6). It can therefore be concluded that if any 249
amorphous material was present in the samples, the amorphous content was probably below 250
0.5%. However, the analysis of very low levels of amorphous material is always challenging in 251
terms of sample storage and sampling. Indeed, amorphous material can crystallize during 252
storage before analysis, thus preventing its identification. 253
3.4. Caking tendency 254
For the different particle size distributions investigated, the unwashed powder was characterized 255
by a poorer flowability and hence a higher tendency to caking than the washed powders (Fig. 7). 256
Moreover, a ffc after storage of 0.6 ± 0.1 was obtained for non-sieved Wash 0.3 while non-257
sieved pharmaceutical grade lactose still flowed easily after the four-day storage. It was not 258
straightforward to discriminate Wash 1 and Wash 2 powders from each other. 259
It is clear from these results that higher levels of impurities lead to greater risk of caking. In the 260
present study, the samples were stored at 20 °C and 60% RH for four days in the ring shear 261
cells before measurement of caking tendency. Amorphous lactose stored at room temperature 262
(20-25 °C) has been reported to crystallize at abou t 40% RH (Jouppila and Roos, 1994; 263
Thomsen et al., 2005). Amorphous caking was therefore expected to occur if the samples 264
contained amorphous lactose. However, as mentioned in section 3.3., the solid state NMR 265
analysis did not indicate the presence of disordered structures, meaning that the amorphous 266
content of the samples was probably below 0.5%. Thus amorphous caking cannot be considered 267
to be the main mechanism responsible for the caking tendency observed here. In his work on 268
caking of crystalline lactose, Bronlund (1997) also showed that amorphous caking was only 269
marginal for amorphous content below 5%, and that the major contribution to caking from the 270
amorphous material occurred through moisture sorption. 271
The sorption isotherms of Wash 0, 1, 2 powders and pharmaceutical grade lactose showed that 272
the difference in sorption behavior was important at 60% and room temperature (Fig. 3 and Fig. 273
4). During the caking experiments, the samples were given time to equilibrate with ambient air at 274
60% RH. Due to humidity caking, the caking tendency was therefore expected to be enhanced 275
for samples which could adsorb more moisture. This was confirmed by the flowability results 276

MANUSCRIP
T
ACCEPTED
ACCEPTED MANUSCRIPT
11
after storage (Fig. 7). Only Wash 1 and Wash 2 showed similar flowability values, although 277
Wash 1 was found to adsorb twice as much moisture as Wash 2 at 60% RH according to the 278
DVS measurements. The difference in the impurity levels and thus moisture sorption between 279
these two powders was probably too small for the ring shear tester to detect a difference 280
between the caking tendencies of the two powders. 281
As humidity caking could be evidenced by the caking measurements with the ring shear tester, 282
the repeatability of the measurement was considered acceptable. In order to discriminate 283
between samples with similar sorption behaviors (such as Wash 1 and Wash 2), it might be 284
helpful to increase the repeatability even further. As pointed out by Hartmann and Palzer (2011), 285
one drawback of the ring shear cells is that they are almost closed, which hampers moisture 286
exchange between the powder and the surrounding atmosphere. If the impurities are not 287
homogeneously distributed in the powder, moisture sorption might be heterogeneous at a local 288
level, leading to various degrees of consolidation. It is however interesting to note the low 289
standard deviation associated with the results for Wash 0 and Wash 0.3. It seems therefore that 290
once humidity caking has reached a certain level, it systematically proceeds to strong and 291
repeatable caking. This level may be associated with the DRH which, as explained in section 292
3.2., can be significantly decreased by the presence of impurities. Moreover, a critical step in the 293
experimental procedure is relieving the shear cells from the consolidation pressure and moving 294
them from the humidity controlled chamber to the ring shear tester. This operation requires care 295
as interactions between the powder particles can be damaged. It is thus consistent that the 296
stronger the interactions between particles, the better the caking reproducibility. 297
4. Conclusions 298
Time consolidation experiments with a ring shear tester constitute an appropriate method to 299
discriminate between samples with different caking tendencies. Combined with DVS 300
measurements and characterization of the physicochemical composition, including the 301
amorphous content, the caking test results suggested a humidity caking mechanism. The 302
presence of impurities in lactose powder was found to greatly enhance moisture sorption and 303
MANUSCRIP
T
ACCEPTED
ACCEPTED MANUSCRIPT
12
caking. It is therefore critical to control the washing and purification steps in the process in order 304
to prevent caking in the final product. 305
306

MANUSCRIP
T
ACCEPTED
ACCEPTED MANUSCRIPT
13
Acknowledgments 307
This work was partially funded by Innovation Fund Denmark. The authors wish to thank Jens 308
Kristian Bech for his input in the preparation of the pilot trial and Morten Nielsen for his great 309
help in conducting the trial. We are grateful to Betina Mikkelsen and Anne Dolivet for showing us 310
how to conduct SEM imaging and for all the physicochemical characterization analyses. 311
References 312
Bronlund, J., 1997. The modelling of caking in bulk lactose. Massey University. 313
Bronlund, J., Paterson, T., 2004. Moisture sorption isotherms for crystalline, amorphous and 314
predominantly crystalline lactose powders. Int. Dairy J. 14, 247–254. doi:10.1016/S0958-315
6946(03)00176-6 316
Buckton, G., Darcy, P., 1995. The use of gravimetric studies to assess the degree of crystallinity 317
of predominantly crystalline powders. Int. J. Pharm. 123, 265–271. 318
Carpin, M., Bertelsen, H., Bech, J.K., Jeantet, R., Risbo, J., Schuck, P., 2016. Caking of lactose: 319
A critical review. Trends Food Sci. Technol. 53, 1–12. doi:10.1016/j.tifs.2016.04.002 320
Giron, D., Monnier, S., Mutz, M., Piechon, P., Buser, T., Stowasser, F., Schulze, K., Bellus, M., 321
2007. Comparison of quantitative methods for analysis of polyphasic pharmaceuticals. J. 322
Therm. Anal. Calorim. 89, 729–743. doi:10.1007/s10973-006-7962-y 323
Guerrieri, P., Salameh, A.K., Taylor, L.S., 2007. Effect of small levels of impurities on the water 324
vapor sorption behavior of ranitidine HCl. Pharm. Res. 24, 147–56. doi:10.1007/s11095-325
006-9134-y 326
Gustafsson, C., Lennholm, H., Iversen, T., Nystro, C., 1998. Comparison of solid-state NMR and 327
isothermal microcalorimetry in the assessment of the amorphous component of lactose. Int. 328
J. Pharm. 174, 243–252. 329
Guu, M.Y.K., Zall, R.R., 1991. Lactose Crystallization - Effects of Minerals and Seeding. Process 330
Biochem. 26, 167–172. doi:10.1016/0032-9592(91)80013-F 331
Guu, Y.K., Zall, R.R., 1992. Nanofiltration Concentration Effect on the Efficacy of Lactose 332
Crystallization. J. Food Sci. 57, 735–739. doi:10.1111/j.1365-2621.1992.tb08084.x 333
Hartmann, M., Palzer, S., 2011. Caking of amorphous powders — Material aspects, modelling 334
and applications. Powder Technol. 206, 112–121. doi:10.1016/j.powtec.2010.04.014 335
MANUSCRIP
T
ACCEPTED
ACCEPTED MANUSCRIPT
14
Hourigan, J., Lifran, E., Vu, L., Listiohadi, Y., Sleigh, R., 2013. Lactose: Chemistry, Processing, 336
and Utilization, in: Smithers, G.W., Augustin, M.A. (Eds.), Advances in Dairy Ingredients. 337
John Wiley & Sons, Inc., pp. 31–69. 338
International Dairy Federation, 2015. The world dairy situation 2015, Bulletin of the International 339
Dairy Federation 481/2015. doi:10.1111/j.1471-0307.2010.00573.x 340
Isengard, H.D., 2001. Water content, one of the most important properties of food. Food Control 341
12, 395–400. doi:10.1016/S0956-7135(01)00043-3 342
Jenike, A.W., 1964. Storage and flow of solids, Bulletin 123 of the University of Utah. Salt Lake 343
City. 344
Jouppila, K., Roos, Y.H., 1994. Glass Transitions and Crystallization in Milk Powders. J. Dairy 345
Sci. 77, 2907–2915. doi:10.3168/jds.S0022-0302(94)77231-3 346
Listiohadi, Y., Hourigan, J., Sleigh, R., Steele, R., 2008. Moisture sorption, compressibility and 347
caking of lactose polymorphs. Int. J. Pharm. 359, 123–34. 348
doi:10.1016/j.ijpharm.2008.03.044 349
Listiohadi, Y., Hourigan, J., Sleigh, R., Steele, R., 2005a. Role of amorphous lactose in the 350
caking of α-lactose monohydrate powders. Aust. J. dairy Technol. 60, 19–32. 351
Listiohadi, Y., Hourigan, J., Sleigh, R., Steele, R., 2005b. Effect of milling on the caking 352
behaviour of lactose. Aust. J. Dairy Technol. 60, 214–224. 353
Mathlouthi, M., Rogé, B., 2003. Water vapour sorption isotherms and the caking of food 354
powders. Food Chem. 82, 61–71. doi:10.1016/S0308-8146(02)00534-4 355
Paterson, A.H.J., 2009. Production and uses of lactose, in: McSweeney, P.L.H., Fox, P.F. 356
(Eds.), Advanced Dairy Chemistry. Springer New York, pp. 105–120. doi:10.1007/978-0-357
387-84865-5 358
Paterson, A.H.J., Bronlund, J.E., 2009. The practical implications of temperature induced 359
moisture migration in bulk lactose. J. Food Eng. 91, 85–90. 360
doi:10.1016/j.jfoodeng.2008.08.021 361
Salameh, A.K.A., Mauer, L.J.L., Taylor, L.S.L., 2006. Deliquescence Lowering in Food 362
Ingredient Mixtures. J. Food Sci. 71, E10–E16. doi:10.1111/j.1365-2621.2006.tb12392.x 363
Schuck, P., Dolivet, A., Jeantet, R., 2012. Analytical Methods for Food and Dairy Powders. 364

MANUSCRIP
T
ACCEPTED
ACCEPTED MANUSCRIPT
15
Wiley-Blackwell, Oxford, UK. doi:10.1002/9781118307397 365
Schulze, D., 2008. Powders and Bulk Solids: Behavior, Characterization, Storage and Flow. 366
Springer Berlin Heidelberg, Berlin, Heidelberg. doi:10.1007/978-3-540-73768-1 367
Sheokand, S., Modi, S.R., Bansal, A.K., 2014. Dynamic Vapor Sorption as a Tool for 368
Characterization and Quantification of Amorphous Content in Predominantly Crystalline 369
Materials. J. Pharm. Sci. 103, 3364–3376. doi:10.1002/jps.24160 370
Stoklosa, A.M., Lipasek, R. a., Taylor, L.S., Mauer, L.J., 2012. Effects of storage conditions, 371
formulation, and particle size on moisture sorption and flowability of powders: A study of 372
deliquescent ingredient blends. Food Res. Int. 49, 783–791. 373
doi:10.1016/j.foodres.2012.09.034 374
Tereshchenko, A.G., 2015. Deliquescence: Hygroscopicity of Water-Soluble Crystalline Solids. 375
J. Pharm. Sci. doi:10.1002/jps.24589 376
Thomsen, M.K., Jespersen, L., Sjostrom, K., Risbo, J., Skibsted, L.H., 2005. Water activity-377
temperature state diagram of amorphous lactose. J. Agric. Food Chem. 53, 9182–9185. 378
doi:10.1021/jf0508394 379
Vollenbroek, J., Hebbink, G. a., Ziffels, S., Steckel, H., 2010. Determination of low levels of 380
amorphous content in inhalation grade lactose by moisture sorption isotherms. Int. J. 381
Pharm. 395, 62–70. doi:10.1016/j.ijpharm.2010.04.035 382
383

MANUSCRIP
T
ACCEPTED
ACCEPTED MANUSCRIPT
C:\pdfconversion\WORK\authordoc\Captions.docx
Table 1: Composition of lactose powders as a function of degree of washing of the crys-tals. Results are given as average ± standard deviation. Number of repeats = 3 for mois-ture and ash and 2 for proteins. Figure 1: Variations in the mineral content (potassium (K), chlorine (Cl), sodium (Na), phosphorus (P), calcium (Ca), and magnesium (Mg)) of lactose powder as a function of degree of washing of the lactose crystals. Figure 2: Particle size distributions of lactose powders for three different washing grades (0, 1, 2) but with the same particle size fraction (160<x<250 µm). Figure 3: Moisture sorption isotherms of lactose powders with three different washing grades but the same particle size fraction (160<x<250 µm): Wash 0 (squares), Wash 1 (circles), Wash 2 (triangles). Figure 4: Moisture sorption isotherms of non-sieved pharmaceutical grade lactose (cir-cles) and the most washed lactose from the pilot trial (Wash 2) (squares). Figure 5: SEM images showing details of particle surface of different washing grade lac-tose powders: (A) Wash 0; (B) Wash 0.5; (C) Wash 1; (D) Wash 2; (E) Pharmaceutical grade lactose. Figure 6: 13C CP/MAS NMR spectra of (A) Wash 0; (B) Wash 0.3; (C) pharmaceutical grade lactose; (D) amorphous lactose. Figure 7: ffc of non-sieved (crosses) and sieved (triangles) lactose powders between 160 µm and 250 µm as a function of the washing grade. The ffc was measured after storage for four days at 60% RH and 20 °C. Each sam ple was consolidated under a pressure of 9.3 kPa. The flowability of pharmaceutical grade lactose after storage is in-cluded for comparison purposes.

MANUSCRIP
T
ACCEPTED
ACCEPTED MANUSCRIPT
C:\pdfconversion\WORK\authordoc\TAB1.docx
Table 1: Composition of lactose powders as a function of degree of washing of the crystals.
Results are given as average ± standard deviation. Number of repeats = 3 for moisture and ash
and 2 for proteins.
Washing Grade Protein (g.100g-1) Moisture (g.100g-1) Ash (g.100g-1) Lactose (g.100g-1)
0 0.640 ± 0.014 1.12 ± 0.01 2.14 ± 0.05 96.09 0.3 0.332 ± 0.005 0.89 ± 0.00 0.79 ± 0.04 97.99 0.5 0.227 ± 0.006 0.77 ± 0.02 0.52 ± 0.02 98.49 1 0.152 ± 0.006 0.36 ± 0.02 0.43 ± 0.04 99.05 2 0.082 ± 0.001 0.31 ± 0.01 0.19 ± 0.00 99.42
Pharmaceutical grade lactose 0.004 ± 0.002 n.d. 0.01 ± 0.00 n.d.
MANUSCRIP
T
ACCEPTED
ACCEPTED MANUSCRIPT
C:\pdfconversion\WORK\authordoc\FIG1.docx
Figure 1: Variations in the mineral content (potassium (K), chlorine (Cl), sodium (Na), phospho-
rus (P), calcium (Ca), and magnesium (Mg)) of lactose powder as a function of degree of wash-
ing of the lactose crystals.
0.001
0.01
0.1
1
0 0.3 0.5 1 2
Log
Min
eral
Con
tent
(g.
100g
-1)
Washing Grade (-)
K
Cl
Na
P
Ca
Mg

MANUSCRIP
T
ACCEPTED
ACCEPTED MANUSCRIPT
C:\pdfconversion\WORK\authordoc\FIG2.docx
Figure 2: Particle size distributions of lactose powders for three different washing grades (0, 1, 2)
but with the same particle size fraction (160<x<250 µm).
0
2
4
6
8
10
12
14
16
0.01 0.1 1 10 100 1000
Vol
ume
Den
sity
(%
)
Size (µm)
Wash 0Wash 1Wash 2

MANUSCRIP
T
ACCEPTED
ACCEPTED MANUSCRIPT
C:\pdfconversion\WORK\authordoc\FIG3.docx
Figure 3: Moisture sorption isotherms of lactose powders with three different washing grades but
the same particle size fraction (160<x<250 µm): Wash 0 (squares), Wash 1 (circles), Wash 2
(triangles).
0
2
4
6
8
10
12
14
0 20 40 60 80 100
Cha
nge
in M
ass
(g.1
00g-
1dr
y la
ctos
e)
%RH
Wash 0
Wash 1
Wash 2
MANUSCRIP
T
ACCEPTED
ACCEPTED MANUSCRIPT
C:\pdfconversion\WORK\authordoc\FIG4.docx
Figure 4: Moisture sorption isotherms of non-sieved pharmaceutical grade lactose (circles) and
the most washed lactose from the pilot trial (Wash 2) (squares).
0.0
0.1
0.2
0.3
0.4
0.5
0.6
0.7
0.8
0.9
1.0
0 20 40 60 80 100
Cha
nge
in M
ass
(g.1
00g-
1dr
y la
ctos
e)
%RH
Wash 2
Pharmaceutical Grade Lactose
MANUSCRIP
T
ACCEPTED
ACCEPTED MANUSCRIPT
C:\pdfconversion\WORK\authordoc\FIG5.docx
Figure 5: SEM images showing details of particle surface of different washing grade lactose
powders: (A) Wash 0; (B) Wash 0.5; (C) Wash 1; (D) Wash 2; (E) Pharmaceutical grade lactose.
B
C D
E
A

MANUSCRIP
T
ACCEPTED
ACCEPTED MANUSCRIPT
13C (ppm)
0255075100125150
Pharmaceutical grade lactose
Wash 0
Wash 0.3
Amorphouslactose
A
B
C
D
Figure 6: 13C CP/MAS NMR spectra of (A) Wash 0; (B) Wash 0.3; (C) pharmaceutical grade lactose; (D)
amorphous lactose.

MANUSCRIP
T
ACCEPTED
ACCEPTED MANUSCRIPT
C:\pdfconversion\WORK\authordoc\FIG7.docx
Figure 7: ffc of non-sieved (crosses) and sieved (triangles) lactose powders between 160 µm
and 250 µm as a function of the washing grade. The ffc was measured after storage for four
days at 60% RH and 20 °C. Each sample was consolida ted under a pressure of 9.3 kPa. The
flowability of pharmaceutical grade lactose after storage is included for comparison purposes.
0
1
2
3
4
5
6
7
Wash 0 Wash 1 Wash 2 Pharma
ffcA
fter
Sto
rage
Washing Grade
Non-sieved
160<x<250µm
Caking threshold

MANUSCRIP
T
ACCEPTED
ACCEPTED MANUSCRIPT
C:\pdfconversion\WORK\authordoc\Highlights.docx
• Caking of lactose results in non-conform products and significant economic loss.
• Impurities in the lactose powder increased moisture sorption and caking tendency.
• The ring shear tester is a valuable tool to assess caking.
• The washing and purification steps should be closely monitored to limit caking.