characterization of botanical extracts using multiple...
TRANSCRIPT
Characterization of Botanical
Extracts Using Multiple
Technologies
Dr. Ranjan MitraHead – Analytical Development, Dabur India Limited
President Elect – India Section of AOAC INTERNATIONAL
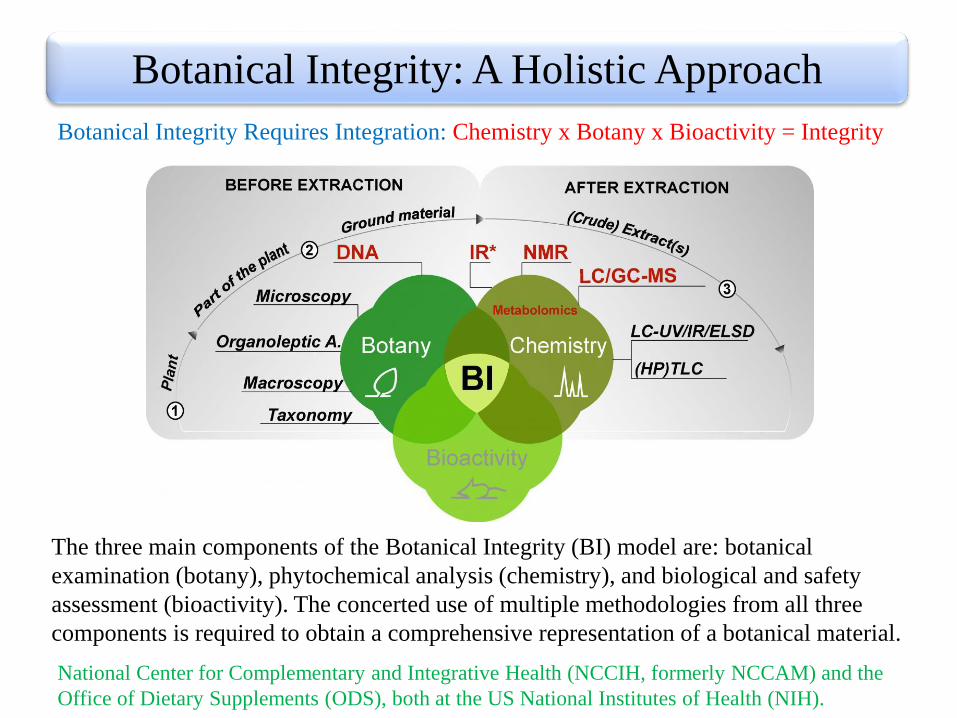
The three main components of the Botanical Integrity (BI) model are: botanical
examination (botany), phytochemical analysis (chemistry), and biological and safety
assessment (bioactivity). The concerted use of multiple methodologies from all three
components is required to obtain a comprehensive representation of a botanical material.
Botanical Integrity: A Holistic Approach
Botanical Integrity Requires Integration: Chemistry x Botany x Bioactivity = Integrity
National Center for Complementary and Integrative Health (NCCIH, formerly NCCAM) and the
Office of Dietary Supplements (ODS), both at the US National Institutes of Health (NIH).
TLC vs. HPTLC
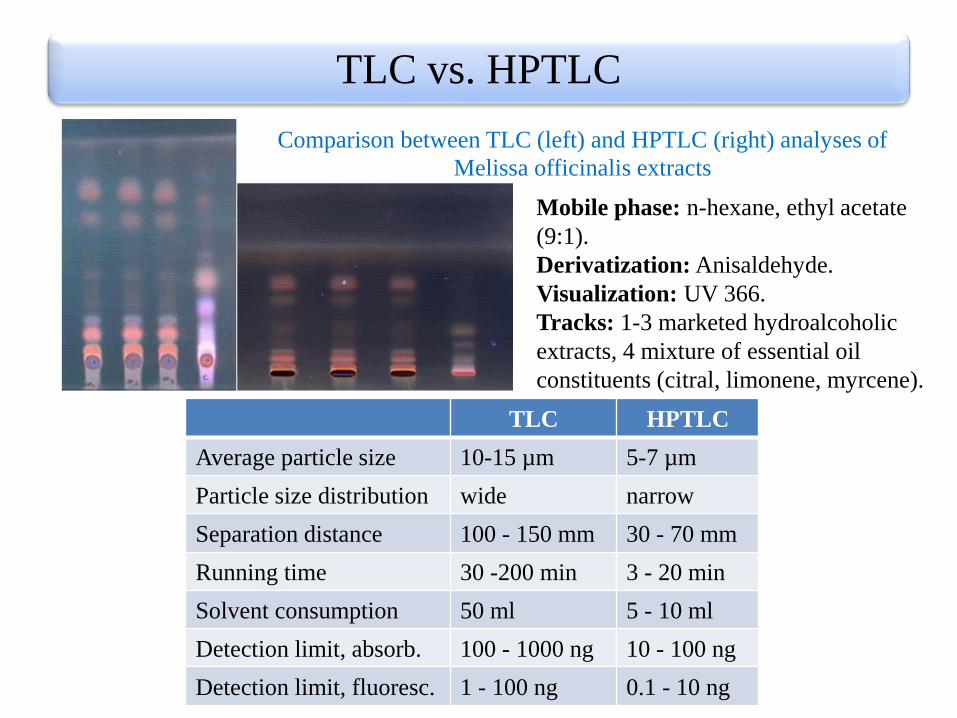
TLC HPTLC
Average particle size 10-15 µm 5-7 µm
Particle size distribution wide narrow
Separation distance 100 - 150 mm 30 - 70 mm
Running time 30 -200 min 3 - 20 min
Solvent consumption 50 ml 5 - 10 ml
Detection limit, absorb. 100 - 1000 ng 10 - 100 ng
Detection limit, fluoresc. 1 - 100 ng 0.1 - 10 ng
Comparison between TLC (left) and HPTLC (right) analyses of
Melissa officinalis extracts
Mobile phase: n-hexane, ethyl acetate
(9:1).
Derivatization: Anisaldehyde.
Visualization: UV 366.
Tracks: 1-3 marketed hydroalcoholic
extracts, 4 mixture of essential oil
constituents (citral, limonene, myrcene).
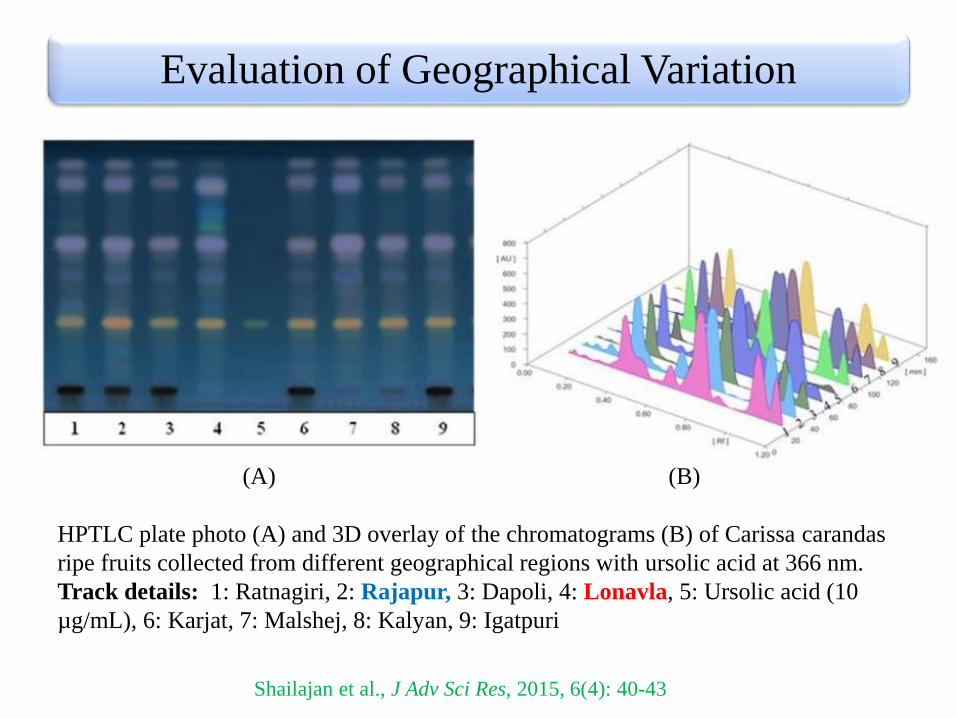
HPTLC plate photo (A) and 3D overlay of the chromatograms (B) of Carissa carandas
ripe fruits collected from different geographical regions with ursolic acid at 366 nm.
Track details: 1: Ratnagiri, 2: Rajapur, 3: Dapoli, 4: Lonavla, 5: Ursolic acid (10
µg/mL), 6: Karjat, 7: Malshej, 8: Kalyan, 9: Igatpuri
(A) (B)
Shailajan et al., J Adv Sci Res, 2015, 6(4): 40-43
Evaluation of Geographical Variation
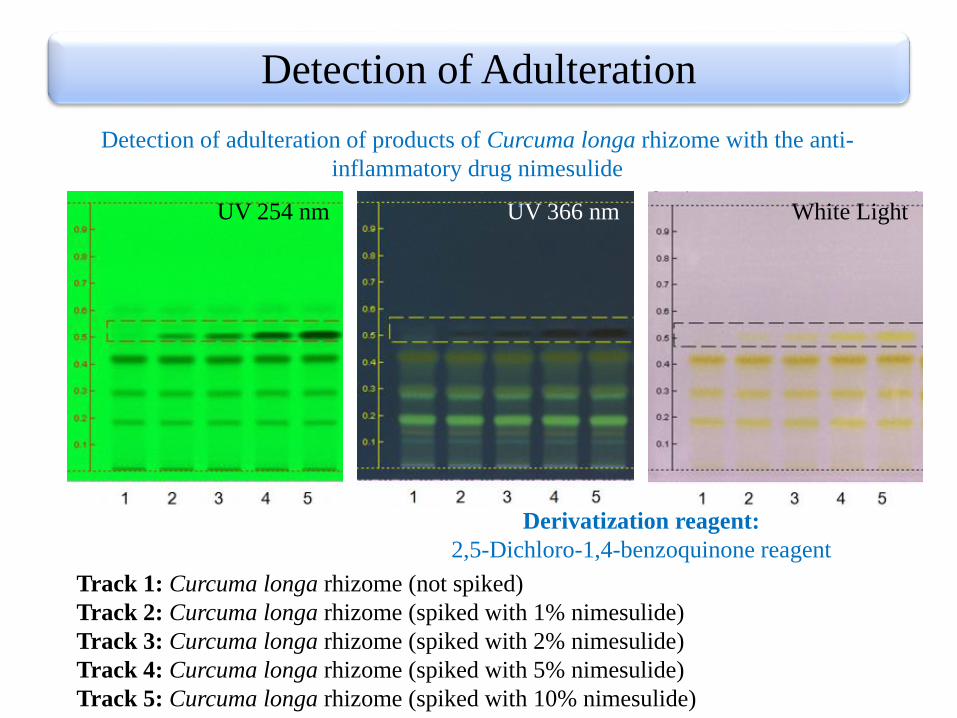
UV 254 nm
Derivatization reagent:
2,5-Dichloro-1,4-benzoquinone reagent
UV 366 nm White Light
Detection of adulteration of products of Curcuma longa rhizome with the anti-
inflammatory drug nimesulide
Track 1: Curcuma longa rhizome (not spiked)
Track 2: Curcuma longa rhizome (spiked with 1% nimesulide)
Track 3: Curcuma longa rhizome (spiked with 2% nimesulide)
Track 4: Curcuma longa rhizome (spiked with 5% nimesulide)
Track 5: Curcuma longa rhizome (spiked with 10% nimesulide)
Detection of Adulteration
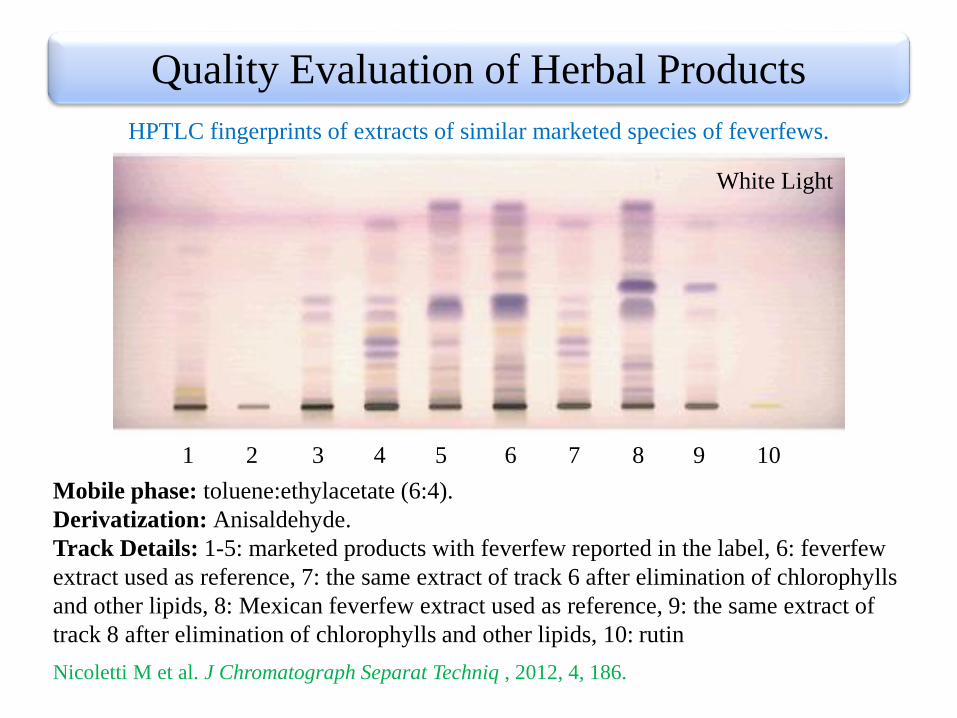
1 2 3 4 5 6 7 8 9 10
Mobile phase: toluene:ethylacetate (6:4).
Derivatization: Anisaldehyde.
Track Details: 1-5: marketed products with feverfew reported in the label, 6: feverfew
extract used as reference, 7: the same extract of track 6 after elimination of chlorophylls
and other lipids, 8: Mexican feverfew extract used as reference, 9: the same extract of
track 8 after elimination of chlorophylls and other lipids, 10: rutin
Nicoletti M et al. J Chromatograph Separat Techniq , 2012, 4, 186.
Quality Evaluation of Herbal Products
White Light
HPTLC fingerprints of extracts of similar marketed species of feverfews.
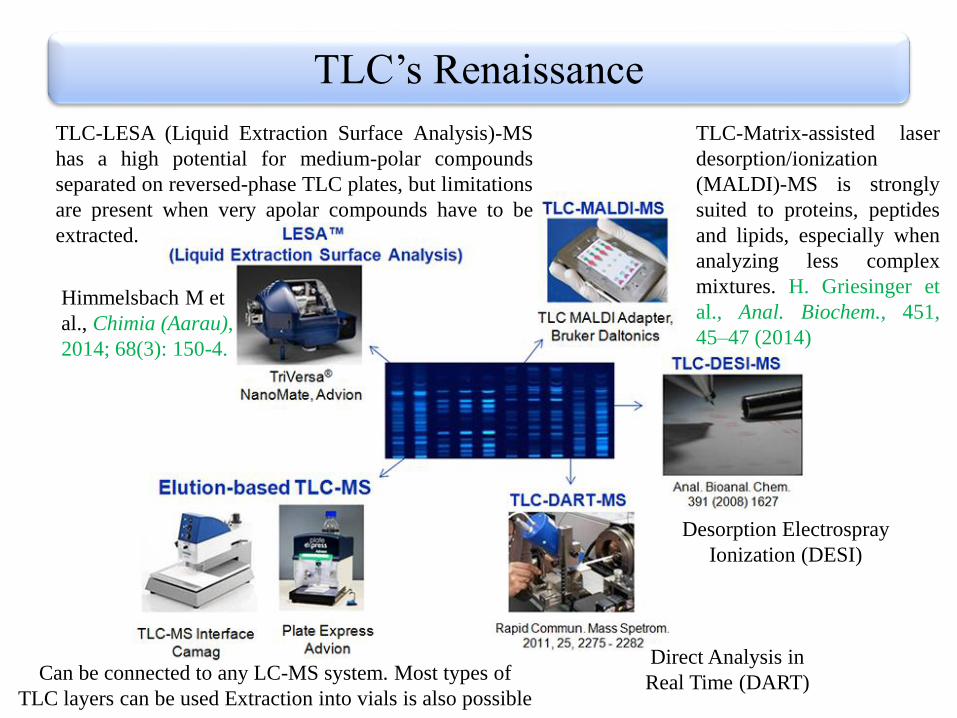
TLC’s Renaissance
TLC-Matrix-assisted laser
desorption/ionization
(MALDI)-MS is strongly
suited to proteins, peptides
and lipids, especially when
analyzing less complex
mixtures. H. Griesinger et
al., Anal. Biochem., 451,
45–47 (2014)
Direct Analysis in
Real Time (DART)
Desorption Electrospray
Ionization (DESI)
TLC-LESA (Liquid Extraction Surface Analysis)-MS
has a high potential for medium-polar compounds
separated on reversed-phase TLC plates, but limitations
are present when very apolar compounds have to be
extracted.
Himmelsbach M et
al., Chimia (Aarau),
2014; 68(3): 150-4.
Can be connected to any LC-MS system. Most types of
TLC layers can be used Extraction into vials is also possible
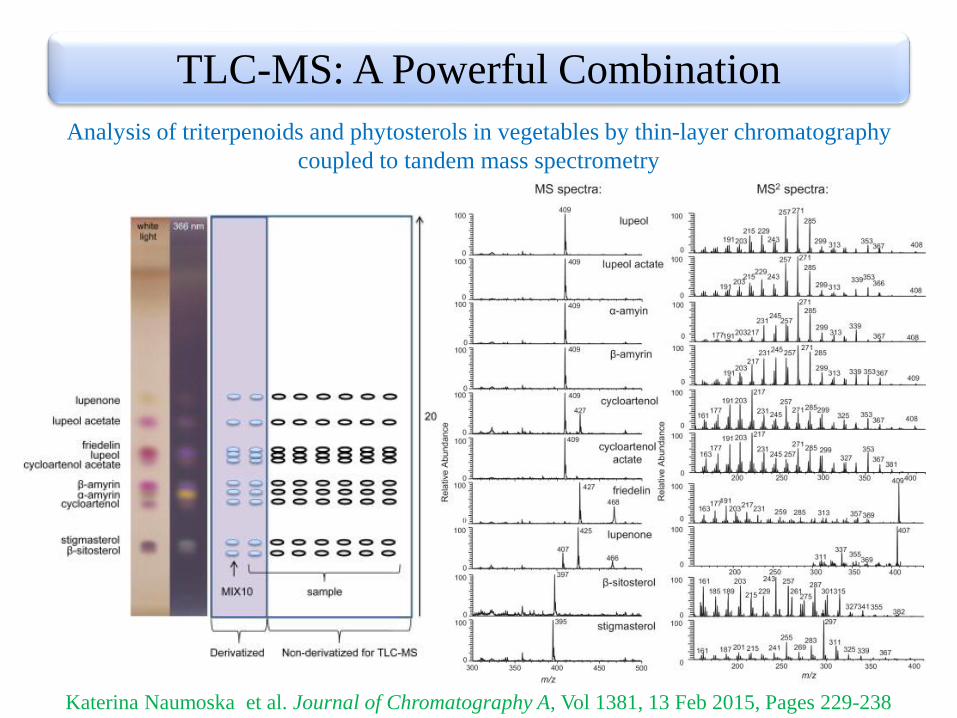
TLC-MS: A Powerful Combination
Analysis of triterpenoids and phytosterols in vegetables by thin-layer chromatography
coupled to tandem mass spectrometry
Katerina Naumoska et al. Journal of Chromatography A, Vol 1381, 13 Feb 2015, Pages 229-238
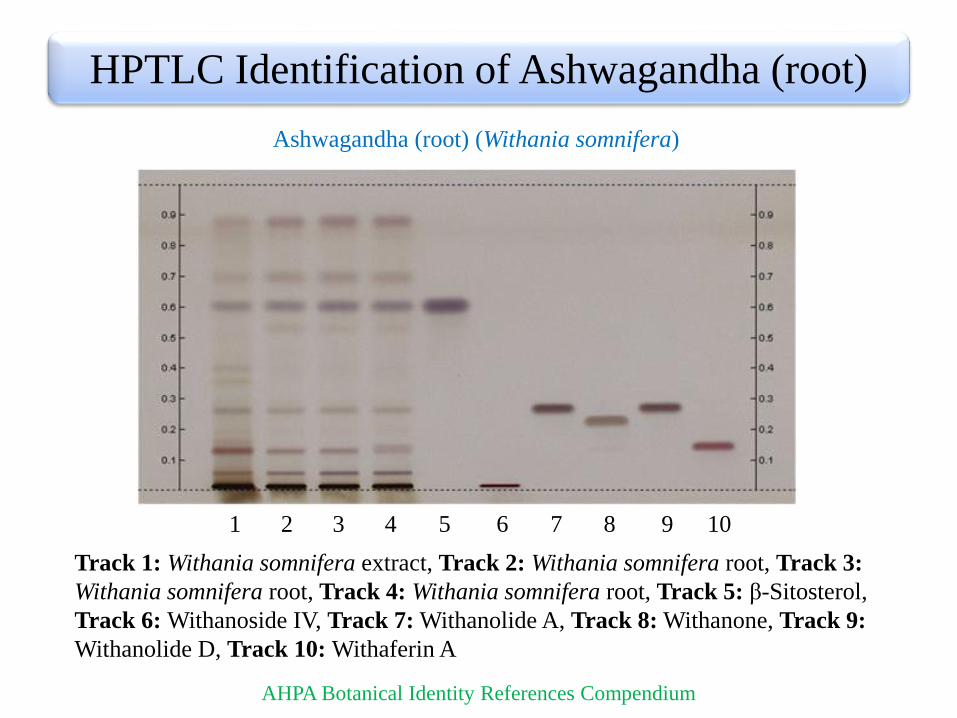
Track 1: Withania somnifera extract, Track 2: Withania somnifera root, Track 3:
Withania somnifera root, Track 4: Withania somnifera root, Track 5: β-Sitosterol,
Track 6: Withanoside IV, Track 7: Withanolide A, Track 8: Withanone, Track 9:
Withanolide D, Track 10: Withaferin A
1 2 3 4 5 6 7 8 9 10
AHPA Botanical Identity References Compendium
HPTLC Identification of Ashwagandha (root)
Ashwagandha (root) (Withania somnifera)
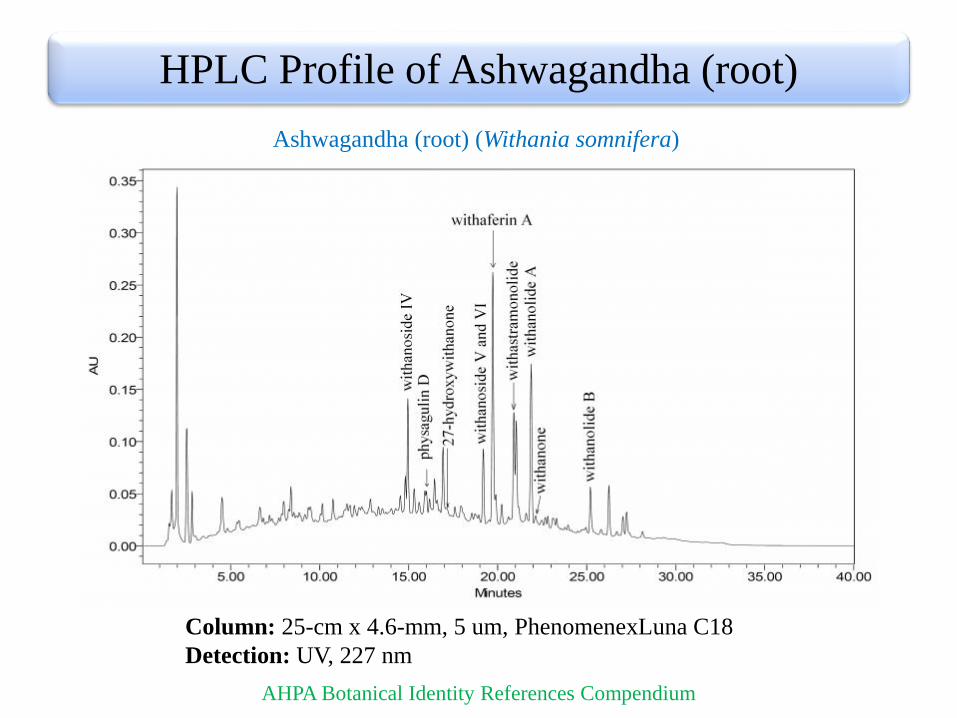
Column: 25-cm x 4.6-mm, 5 um, PhenomenexLuna C18
Detection: UV, 227 nm
HPLC Profile of Ashwagandha (root)
Ashwagandha (root) (Withania somnifera)
AHPA Botanical Identity References Compendium
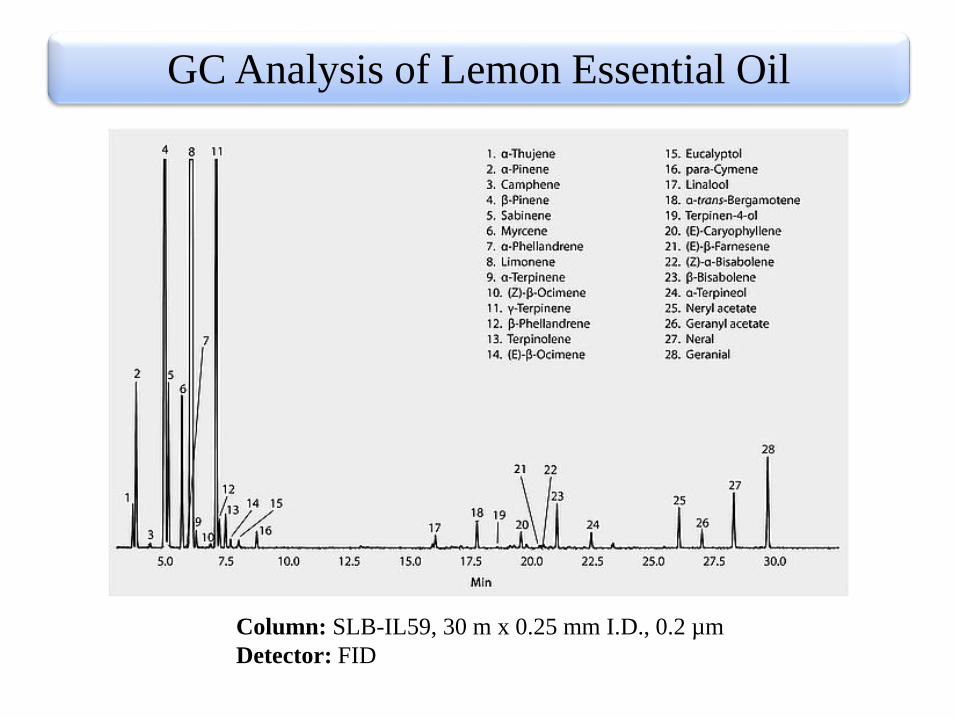
Column: SLB-IL59, 30 m x 0.25 mm I.D., 0.2 µm
Detector: FID
GC Analysis of Lemon Essential Oil
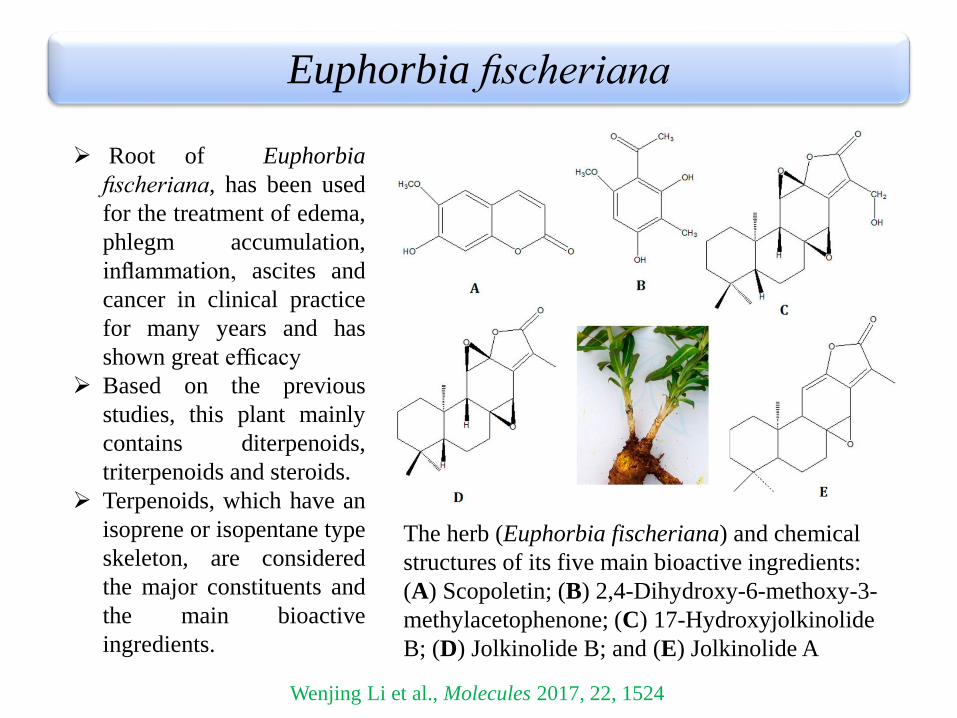
The herb (Euphorbia fischeriana) and chemical
structures of its five main bioactive ingredients:
(A) Scopoletin; (B) 2,4-Dihydroxy-6-methoxy-3-
methylacetophenone; (C) 17-Hydroxyjolkinolide
B; (D) Jolkinolide B; and (E) Jolkinolide A
Euphorbia fischeriana
Wenjing Li et al., Molecules 2017, 22, 1524
➢ Root of Euphorbia
fischeriana, has been used
for the treatment of edema,
phlegm accumulation,
inflammation, ascites and
cancer in clinical practice
for many years and has
shown great efficacy
➢ Based on the previous
studies, this plant mainly
contains diterpenoids,
triterpenoids and steroids.
➢ Terpenoids, which have an
isoprene or isopentane type
skeleton, are considered
the major constituents and
the main bioactive
ingredients.
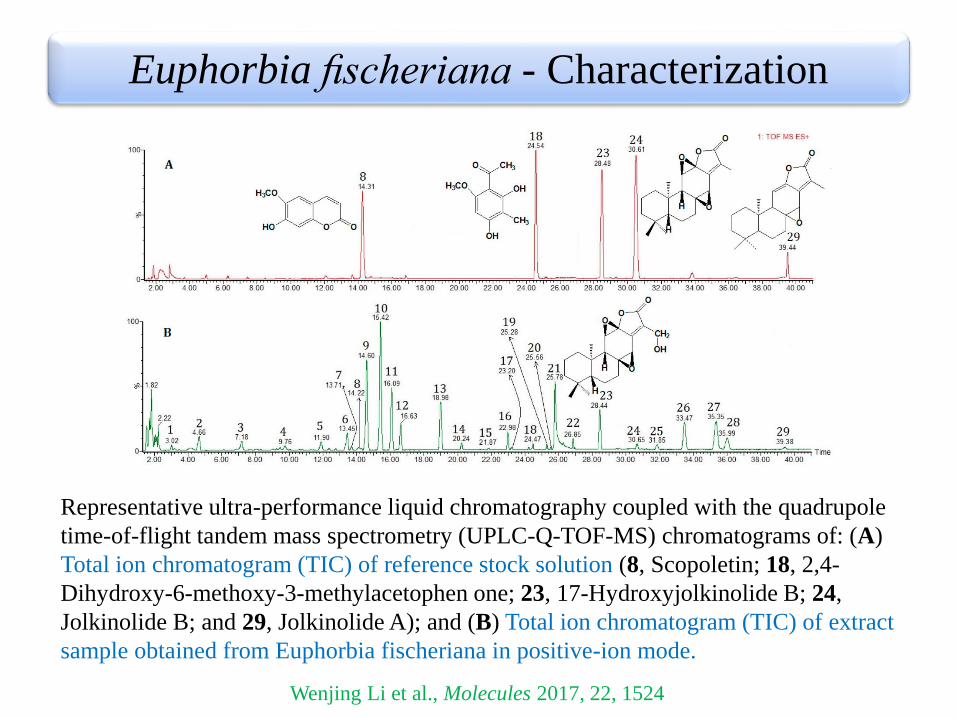
Representative ultra-performance liquid chromatography coupled with the quadrupole
time-of-flight tandem mass spectrometry (UPLC-Q-TOF-MS) chromatograms of: (A)
Total ion chromatogram (TIC) of reference stock solution (8, Scopoletin; 18, 2,4-
Dihydroxy-6-methoxy-3-methylacetophen one; 23, 17-Hydroxyjolkinolide B; 24,
Jolkinolide B; and 29, Jolkinolide A); and (B) Total ion chromatogram (TIC) of extract
sample obtained from Euphorbia fischeriana in positive-ion mode.
Euphorbia fischeriana - Characterization
Wenjing Li et al., Molecules 2017, 22, 1524
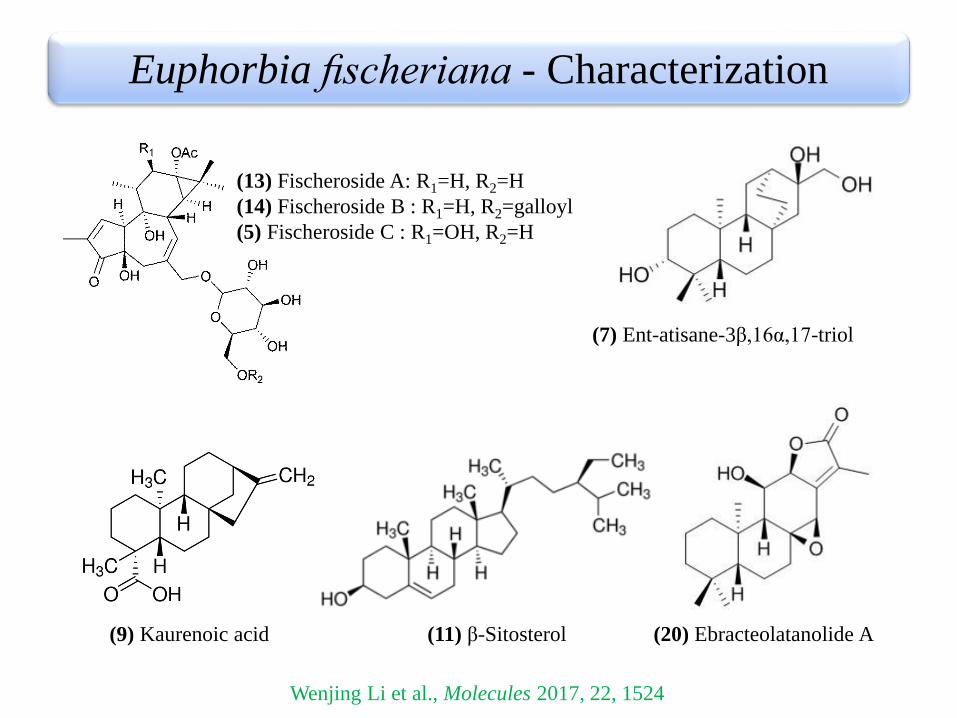
Euphorbia fischeriana - Characterization
(13) Fischeroside A: R1=H, R2=H
(14) Fischeroside B : R1=H, R2=galloyl
(5) Fischeroside C : R1=OH, R2=H
(7) Ent-atisane-3β,16α,17-triol
(9) Kaurenoic acid (11) β-Sitosterol (20) Ebracteolatanolide A
Wenjing Li et al., Molecules 2017, 22, 1524
Liang et al., Journal of Chromatography B 2004, 812, 1–2, 53-70
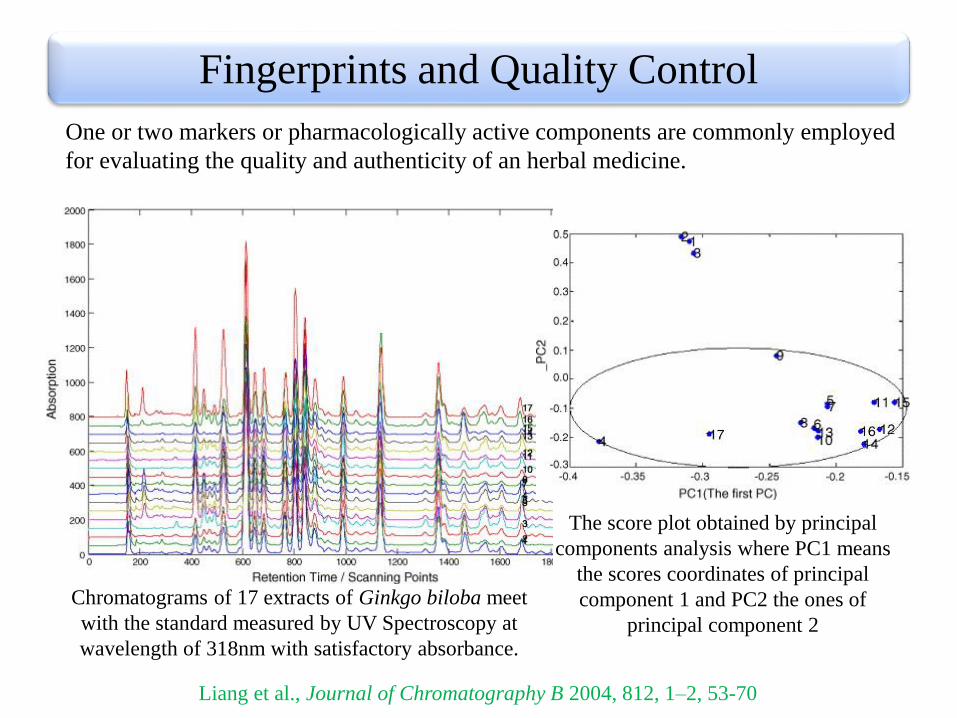
One or two markers or pharmacologically active components are commonly employed
for evaluating the quality and authenticity of an herbal medicine.
Chromatograms of 17 extracts of Ginkgo biloba meet
with the standard measured by UV Spectroscopy at
wavelength of 318nm with satisfactory absorbance.
The score plot obtained by principal
components analysis where PC1 means
the scores coordinates of principal
component 1 and PC2 the ones of
principal component 2
Fingerprints and Quality Control
Fingerprints and Quality Control
Liang et al., Journal of Chromatography B 2004, 812, 1–2, 53-70
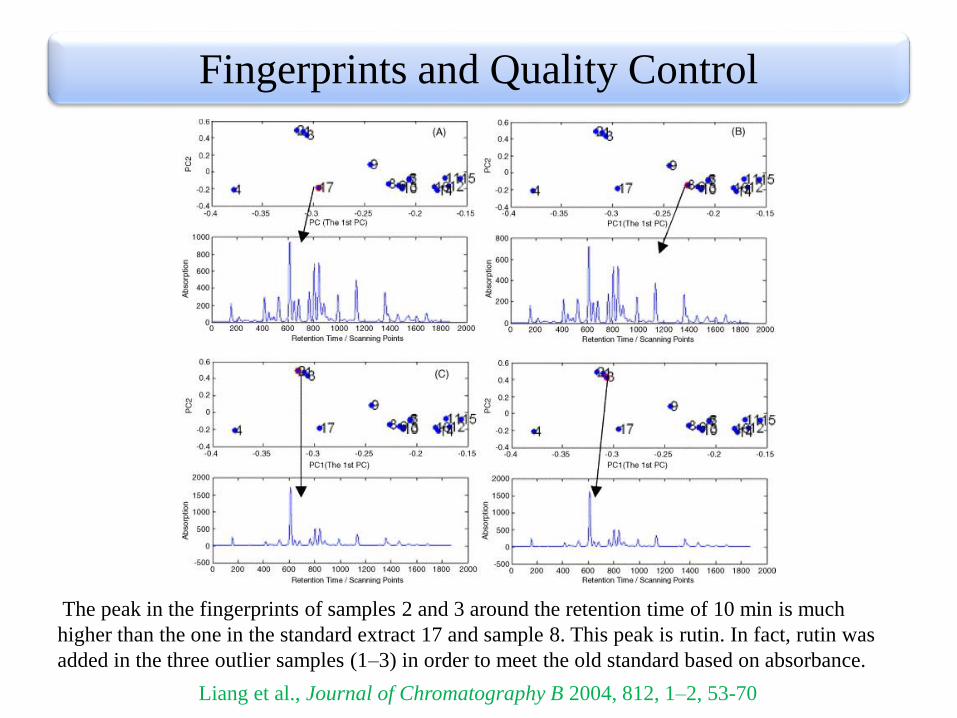
The peak in the fingerprints of samples 2 and 3 around the retention time of 10 min is much
higher than the one in the standard extract 17 and sample 8. This peak is rutin. In fact, rutin was
added in the three outlier samples (1–3) in order to meet the old standard based on absorbance.
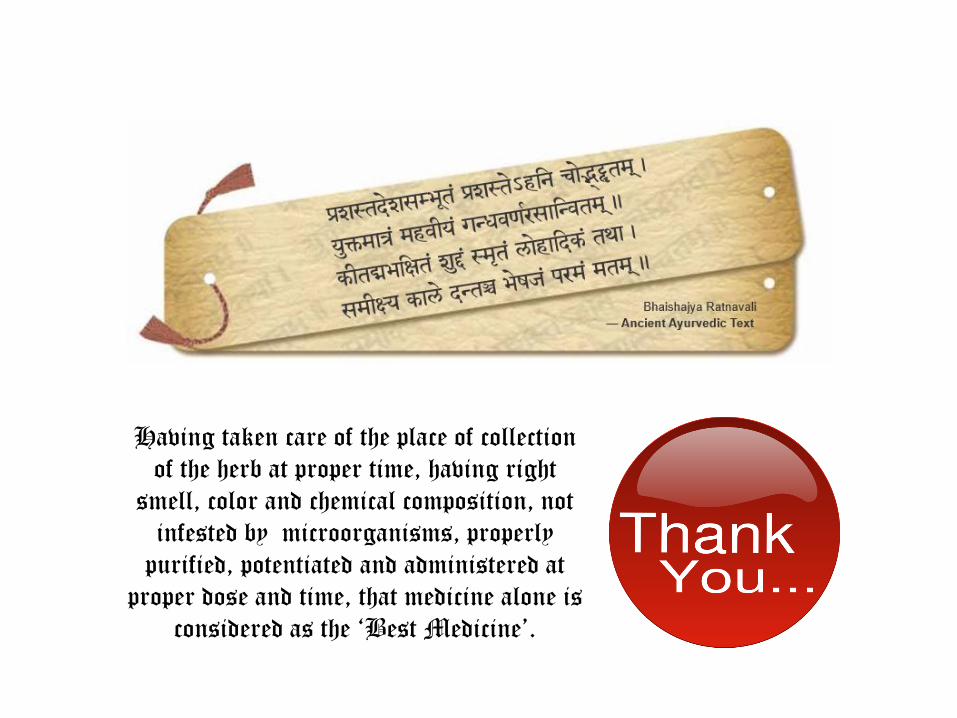
Having taken care of the place of collection
of the herb at proper time, having right
smell, color and chemical composition, not
infested by microorganisms, properly
purified, potentiated and administered at
proper dose and time, that medicine alone is
considered as the ‘Best Medicine’.