characterization of a ferroptosis and iron-metabolism
TRANSCRIPT

Yao et al. Cancer Cell Int (2021) 21:340 https://doi.org/10.1186/s12935-021-02027-2
PRIMARY RESEARCH
Characterization of a ferroptosis and iron-metabolism related lncRNA signature in lung adenocarcinomaJie Yao1,4, Xiao Chen1,2,4, Xiao Liu1,4, Rui Li1,4, Xijia Zhou1,4 and Yiqing Qu3,4*
Abstract
Background: Long non-coding RNAs (lncRNAs) are increasingly recognized as the crucial mediators in the regulation of ferroptosis and iron metabolism. A systematic understanding of ferroptosis and iron-metabolism related lncRNAs (FIRLs) in lung adenocarcinoma (LUAD) is essential for new diagnostic and therapeutic strategies.
Methods: FIRLs were obtained through Pearson correlation analysis between ferroptosis and iron-metabolism related genes and all lncRNAs. Univariate and multivariate Cox regression analysis were used to identify optimal prog-nostic lncRNAs. Next, a novel signature was constructed and risk score of each patient was calculated. Survival analysis and ROC analysis were performed to evaluate the predictive performance using The Cancer Genome Atlas Lung Adenocarcinoma (TCGA-LUAD) and Gene Expression Omnibus (GEO) datasets, respectively. Furthermore, multivariate Cox and stratification analysis were used to assess prognostic value of this signature in whole cohort and various sub-groups. The correlation of risk signature with immune infiltration and gene mutation was also discussed. The expres-sion of lncRNAs was verified by quantitative real-time PCR (qRT-PCR).
Results: A 7-FIRLs signature including ARHGEF26-AS1, LINC01137, C20orf197, MGC32805, TMPO-AS1, LINC00324, and LINC01116 was established in the present study to assess the overall survival (OS) of LUAD. The survival analysis and ROC curve indicated good predictive performance of the signature in both the TCGA training set and the GEO validation set. Multivariate Cox and stratification analysis indicated that the 7‐FIRLs signature was an independent prognostic factor for OS. Nomogram exhibited robust validity in prognostic prediction. Differences in immune cells, immune functions and gene mutation were also found between high-risk and low-risk groups.
Conclusions: This risk signature based on the FIRLs may be promising for the clinical prediction of prognosis and immunotherapeutic responses in LUAD patients.
Keywords: Ferroptosis, Iron metabolism, Signature, lncRNA, Immune infiltration, Lung adenocarcinoma
© The Author(s) 2021. This article is licensed under a Creative Commons Attribution 4.0 International License, which permits use, sharing, adaptation, distribution and reproduction in any medium or format, as long as you give appropriate credit to the original author(s) and the source, provide a link to the Creative Commons licence, and indicate if changes were made. The images or other third party material in this article are included in the article’s Creative Commons licence, unless indicated otherwise in a credit line to the material. If material is not included in the article’s Creative Commons licence and your intended use is not permitted by statutory regulation or exceeds the permitted use, you will need to obtain permission directly from the copyright holder. To view a copy of this licence, visit http:// creat iveco mmons. org/ licen ses/ by/4. 0/. The Creative Commons Public Domain Dedication waiver (http:// creat iveco mmons. org/ publi cdoma in/ zero/1. 0/) applies to the data made available in this article, unless otherwise stated in a credit line to the data.
BackgroundLung cancer, an extremely heterogeneous disease, caused more deaths in 2017 than breast, prostate, colorectal, and brain cancers combined [29]. LUAD is one of the important sub-types of lung cancer with an increasing
incidence [28]. Despite great efforts having been made in developing novel treatments but still received a poor prognosis with 5-year survival rates vary from 4% to 17% [13]. Patients with histologically similar tumors may have different outcomes due to molecular differences. Therefore, there is an urgent need to find new sensitive biomarkers for predicting survival of LUAD patients. Compared with a single biomarker, integrating multiple biomarkers into a signature would greatly improve prog-nostic prediction.
Open Access
Cancer Cell International
*Correspondence: [email protected] Department of Pulmonary and Critical Care Medicine, Qilu Hospital of Shandong University, Jinan, ChinaFull list of author information is available at the end of the article

Page 2 of 14Yao et al. Cancer Cell Int (2021) 21:340
Iron is an essential trace element for human body. Its deficiency or excess can influence many biological pro-cesses [23]. Cancer cells exhibit an enhanced dependence on iron for growth and are dramatically more suscepti-ble to iron depletion than non-cancer cells [21]. How-ever, highly increased iron concentrations result in cell death through membrane lipid peroxidation, termed fer-roptosis [12, 31]. Ferroptosis is an iron-dependent path-way of cell death that was discovered in recent years [18, 19]. The induction of cell death is known to be an viable approach for cancer therapy. Ferroptosis has also been identified as a potential prevention or therapeutic strate-gies to trigger cancer cell death, especially for malignan-cies that are resistant to traditional treatments [20]. Some studies have noticed the potential function of ferroptosis and iron metabolism in lung cancer development and suppression, but the detailed regulators remain unclear. Meanwhile, lncRNAs are defined as non-protein-coding transcripts larger than 200 nucleotides to distinguish them from small noncoding RNAs [16]. LncRNAs are participated in various biological purposes, such as immune, metabolism, infection, and so on. LncRNAs have been shown to function as master regulators in vari-ous disease processes including cancer [11]. Remarkably, it has been found that lncRNAs are the crucial mediators in the regulation of ferroptosis and iron metabolism in cancer [33]. For example, LINC00336, as an endogenous sponge of microRNA 6852, regulates ferroptosis in lung cancer cells [30]. In human leukemia, overexpression of LINC00618 increased the concentrations of intracellular iron and promoted ferroptosis [32]. Only a small number of lncRNAs have been functionally well-characterized, the clinical significance of most lncRNAs, especially FIRLs, has not been investigated clearly. Therefore, it is valuable to identify key lncRNAs closely related to fer-roptosis and iron metabolism with prognosis significance in LUAD.
This is a systematic investigation of the underlying prognostic significance of FIRLs in LUAD. Prognostic FIRLs were selected using univariate Cox analysis based on TCGA database. Then, a 7‐FIRLs signature was con-stituted by multivariate COX regression and GEO dataset was applied for external validation. Multivariate Cox and stratification analysis verified that the independence and universal adaption of the 7‐FIRLs signature. Considering the potential role of the FIRLs in the interaction between immune infiltrating and tumor mutation burden (TMB), their relationship was further explored. In conclusion, the signature played an important role in LUAD and was potential prognostic biomarker.
Materials and methodsPatient data setsThe data collected in this study were from TCGA-LUAD1 and GEO2 (GSE3141, GSE37745) datasets. The detailed gene expression information, OS events and time were obtained from above three datasets, whereas clinical fea-tures data were available from TCGA (n = 477) as train-ing set (Table1). Only LUAD patients with clear survival time and survival status were included in the study. And patients in TCGA-LUAD whose OS less than 30 days were removed in order to improve the accuracy of study.
Table 1 Clinical features of lung adenocarcinoma (LUAD) patients in TCGA database
Feature N (477) %
Age (years)
≦ 65 247 51.8
> 65 230 48.2
Vital status
Alive 320 67.1
Dead 157 32.9
Gender
Female 257 53.9
Male 220 46.1
TNM stage
Stage I 253 53.0
Stage II 113 23.7
Stage III 78 16.4
Stage IV 25 5.2
Unknown 8 1.7
T stage
T1 159 33.3
T2 254 53.2
T3 43 9.0
T4 18 3.8
Unknown 3 0.6
N stage
N0 307 64.4
N1 90 18.9
N2 67 14.0
N3 2 0.4
Unknown 11 2.3
M stage
M0 313 65.6
M1 24 5.0
Unknown 140 29.4
1 https:// cance rgeno me. nih. gov/.2 https:// www. ncbi. nlm. nih. gov/ geo/.

Page 3 of 14Yao et al. Cancer Cell Int (2021) 21:340
The GSE3141 (n = 58) and GSE37745 (N = 106) data sets were merged into an independent validation set. Besides, the somatic mutation data of patients with LUAD were downloaded with a mutation annotation format (MAF) file from TCGA. The “maftools” package [22] in R soft-ware was used to visualize the mutation data and calcu-late the TMB of LUAD patients.
Identification of FIRLs in LUADAccording to the lncRNAs annotation file acquired from the GENCODE3 [8]. 14,142 lncRNAs were identified in the TCGA, and 1632 lncRNAs were identified in the GSE37745 for gene screening. Ferroptosis related genes were obtained from three databases. 177 ferroptosis regu-lators (including 108 drivers, 69 suppressors) and 111 fer-roptosis markers were found from FerrDb database4 [36]. 25 ferroptosis-related genes were obtained in the ferrop-tosis pathway (map04216) from the KEGG PATHWAY Database.5 40 ferroptosis-related genes were extracted in gene sets “M39768: Ferroptosis” from the Molecular Signatures Database (MSigDB).6 Iron metabolism related genes were also obtained in gene sets “M962: Iron uptake and transport” and “M15748: Iron ion homeostasis” from MSigDB. Finally, the 296 ferroptosis and iron metabolism related genes were included for subsequent research by integrating intersection genes and eliminating unrelated genes (see Additional file 5: Table S1). Pearson correla-tion analysis was performed between the lncRNAs and 296 ferroptosis and iron metabolism related genes (with the |Correlation Coefficient| > 0.3 and p < 0.001). Then FIRLs were obtained in TCGA and GSE37745 respec-tively. Venn analysis was used to screen intersection FIRLs from two datasets above for further analysis.
Construction of FIRLs prognostic signature for LUADAccording to the clinical data of LUAD cases in the TCGA, univariate Cox proportional hazards regres-sion analysis was applied to screen prognostic lncRNAs related to OS. Those lncRNAs with P value < 0.01 were selected for multivariate Cox regression analysis to iden-tify optimal prognostic lncRNAs. A risk signature was then established on the basis of the expression levels as well as the risk coefficients of optimal prognostic lncR-NAs. Based on the following formula, the risk score for each patient was calculated.
lncRNAn is the nth selected lncRNAs.
Evaluation of the prognostic signature containing 7 FIRLsLUAD patients in TCGA were divided into high-risk group and low-risk group by using the corresponding median risk score as the cutoff point. Kaplan–Meier survival analysis was performed to estimate the sur-vival difference between the two groups by using the “survival” and “survminer” R packages. ROC curve was performed and area under the curve (AUC) at different time points were calculated to assess the diagnostic value of risk signature. Due to the few samples in GSE37745, the GSE3141 (n = 58) and GSE37745 (N = 106) data sets were merged as an independent validation set to assess the prognostic performance of the signature. The same prognostic formula and cutoff point (median risk score in TCGA) were used to calculate the risk score of each included patient and divided into high/low risk group. Next, Kaplan–Meier survival analysis and ROC curve were also performed in validation set. Besides, principal component analysis (PCA) and t-SNE analysis were per-formed using “Rtsne” and “ggplot2” packages to exam the clustering ability of risk signature.
Univariate and multivariate Cox regression analysis evaluated whether the risk score was independent of other clinicopathological parameters, including age, gen-der, TNM stage, T stage and N stage (M stage had a large number of uncertain values, which were not included in the study). The hazard ratios (HR) and 95% confidence intervals (CI) were estimated. Then a nomogram was for-mulated by employing “rms” R packages. All independent prognostic factors identified by multivariate Cox regres-sion analysis were included in the construction of a prog-nostic nomogram to investigate the probability of 1-, 3-, and 5-OS of LUAD. Calibration curves of the nomogram were plotted to estimate the accuracy of actual observed survival rates with the predicted survival probability. But beyond all that, stratification analysis was also performed to detect the prognostic value of risk signature in differ-ent subgroups. All statistical analysis were conducted using R software and Bioconductor. The significance was defined as P value being less than 0.05.
Functional enrichment analysis and immune infiltration level analysisIn order to investigate the biological roles of the seven lncRNAs in LUAD, the mRNAs that highly related with these above lncRNAs were identified. A co-expression network of the seven lncRNAs-mRNAs was established and visualized using Sankey diagram. The correlation
Risk score = ExplncRNA1 × βlncRNA1 + ExplncRNA2
× βlncRNA2 + · · · + ExplncRNAn × βlncRNAn,
3 https:// www. genco degen es. org/.4 http:// www. zhoun an. org/ ferrdb/.5 https:// www. genome. jp/ kegg/ pathw ay. html.6 https:// www. gsea- msigdb. org/ gsea/ msigdb/.

Page 4 of 14Yao et al. Cancer Cell Int (2021) 21:340
coefficient threshold was set to > 0.3 or < − 0.3, and the corresponding P value < 0.01 was considered statisti-cally significant. Functional enrichment analysis were conducted including gene ontology (GO) and Kyoto encyclopedia of genes and genomes (KEGG) pathway. The pathways with P value < 0.05 were considered as sig-nificantly enriched. The relationship between 7 lncRNAs and ferroptosis was verified by the correlation expres-sion with four most common ferroptosis-related mRNAs through GEPIA.7
At the same time, the TIMER [18, 19], CIBERSORT [6, 25], QUANTISEQ [10], Microenvironment Cell Populations-counter (MCP-counter) [5], XCELL [1], and Estimating the Proportion of Immune and Cancer cells (EPIC) [27] algorithms were used to estimate the abundances of immune cells between the high-risk and low-risk groups based on FIRLs signature. In addition, ssGSEA was used to quantify the immune cells and path-ways between two groups using the “gsva” package. Given the important roles of immune infiltration cells in the tumour microenvironment, the relationship between the signature and single lncRNA contained in it and immune infiltration cells were also analyzed through TIMER and CIBERSORT algorithms. Pearson correlation coef-ficient and P value were calculated. The expression level of immune checkpoint related genes may be connected with treatment responses of immune checkpoint inhibi-tors. The relationship between risk score and immune checkpoint was explored by testing the difference of gene expression level in high-risk and low-risk groups.
Cell culture and qRT‑PCRHuman LUAD cells (A549 and H1299) and normal bron-chial epithelial cell (16HBE) were purchased from Cell Bank, Institute of Life Sciences, Chinese Academy of Sciences Cell Bank (Shanghai, China) and confirmed by short tandem repeat (STR) profiling. The 16HBE and H1299 cells were cultured in RPMI 1640 medium (Gibco, Invitrogen, Carlsbad, CA), and A549 cells were cultured in DMEM medium (Gibco) with 10% fetal bovine serum (FBS) under a humidified atmosphere of 37 °C and 5% of CO2. Total cellular RNA was extracted using TRIzol rea-gent (Invitrogen, Carlsbad, CA, USA) and quantified by NanoDrop Lite spectrophotometer (Thermo Scientific). The total RNA underwent reverse transcription using the PrimeScript™ RT Reagent Kit (Takara, Dalian, Liaon-ing, China) for cDNA synthesis according to the manu-facturer’s instruction. The relative lncRNA expression levels were determined by qRT-PCR in triplicate on the Applied Biosystems StepOnePlus Real-Time PCR System
(Termo Fisher Scientific) using the TB Green™ Premix Ex Taq™ II (TaKaRa). All program steps of qRT-PCR are performed in accordance with the instructions provided by the manufacture. Melting curves were generated at the end of amplification to ensure the specificity of the PCR products. GAPDH was used as an internal control. The relative expression of each lnRNA was calculated by 2−△△Ct method. Multiple primers of C20orf197 were designed, and none of them had specific melting curves, so only the other six lncRNAs were conducted qRT-PCR analysis. Primers sequences are listed in Additional file 6: Table S2.
ResultsIdentification of shared FIRLs from TCGA and GEO databasesThis study was conducted according to the flow chart shown in Fig. 1. First, 14,142 lncRNAs were identified in the TCGA-LUAD and 1632 lncRNAs were identified in the GSE37745 according to the lncRNA annotation file. Then these lncRNAs were subjected to Pearson correla-tion analysis with 296 ferroptosis and iron metabolism related genes (Additional file 1: Figure S1A, B; |Correla-tion Coefficient| > 0.3 and p < 0.001). TCGA-LUAD and GSE37745 obtained 1757 and 183 FIRLs, respectively. The intersection of two datasets yielded 118 FIRLs (Addi-tional file 1: Figure S1C; Additional file 7: Table S3).
Derivation of FIRLs signature for OS prediction477 LUAD patients from TCGA were chosen to explore the association between the expression of 118 lncR-NAs and survival. Among 118 lncRNAs, 16 lncRNAs were significantly associated with the survival of LUAD (P < 0.01) by univariate Cox proportional hazards regres-sion analysis. Then multivariate Cox proportional haz-ards regression analysis was performed to pick out the optimal prognostic lncRNAs with nonzero coefficients. Finally,7 lncRNAs constituted the optimal prognos-tic risk signature of FIRLs (Table 2), including 3 risky lncRNAs (HR > 1) and 4 protective lncRNAs (HR < 1). By combination of lncRNAs expression levels weighted by the corresponding regression coefficients, the risk score of LUAD patients was calculated as follows: Risk score = (− 0.310 × A RHG EF2 6-A S1) + (0.364 × LI NC0 11 37) + (− 0 . 270 × C2 0orf197) + (− 0.2 6 3 × MGC3 2 805 ) + (0.331 × T M PO- AS1 ) + (− 0.4 0 4 × LI NC0 032 4) + (0.222 × LINC0111 6).
Validation of FIRLs signatureThe risk scores of all LUAD patients were obtained based on the above calculation formula. LUAD patients in TCGA were classified into high-risk group (n = 238) and low-risk group (n = 239) on the basis of median 7 http:// gepia. cancer- pku. cn/.

Page 5 of 14Yao et al. Cancer Cell Int (2021) 21:340
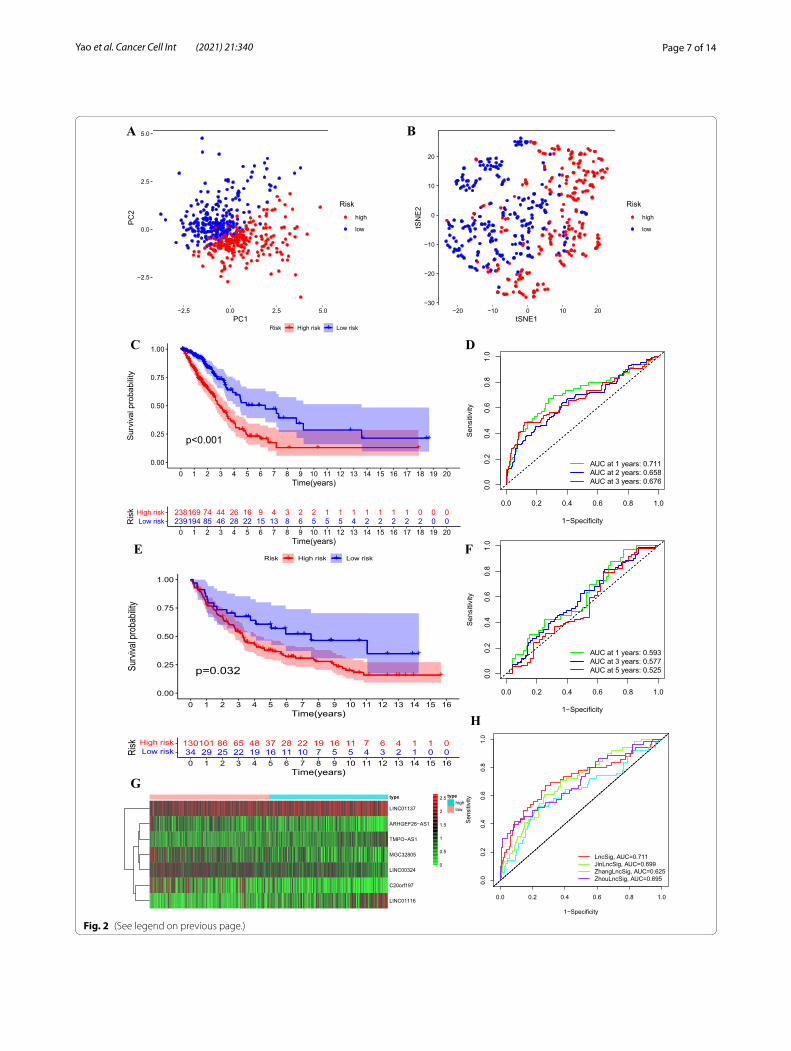
risk score. The classification ability of the risk signature was confirmed by PCA and t-SNE analysis (Fig. 2A, B). Kaplan–Meier survival analysis showed that the high-risk group exhibited a significantly shorter OS than the low-risk group (training set: P < 0.001, Fig. 2C; validation set:
P = 0.032, Fig. 2E), indicating that the risk signature of the 7 FIRLs has prognostic value. We next assessed the predictive sensitivity and specificity of the risk signature by ROC curves. The AUC at 1, 2, and 3 years reached 0.711, 0.658, 0.676, and 0.593, 0.577, 0.525 for training set and validation set respectively (Fig. 2D, F). The expres-sion patterns of seven lncRNAs is shown in Fig. 2G. As expected, three risky lncRNAs was highly expressed in the high-risk group and the remaining four protective lncRNAs were up-regulated in the low-risk group.
We compared the performance for OS prediction of 7-FIRLs signature (hereinafter referred to as LncSig) and other published prognostic signatures [15, 34, 35]: the lncRNAs signature derived from Zhang’s study (ZhangL-ncSig), Zhou’s study (ZhouLncSig) and Jin’s study (Jin-LncSig). Utilizing the same TCGA patient cohort, risk scores of each signature were calculated based on normal-ized expression values and coefficients provided by origi-nal articles and ROC analysis was performed. As shown in Fig. 2H, LncSig achieved a AUC value is 0.711, which
Fig. 1 Flow chart of the study
Table 2 The optimal prog nos tic risk si gna tur e of 7 l ncR NAs by mu ltivariate Cox regression analysis
LncRNA Coef. HR HR.95L HR.95H P‑value
ARHGEF26-AS1 − 0.310 0.734 0.515 1.046 0.087
C20orf197 − 0.270 0.764 0.603 0.967 0.025
MGC32805 − 0.263 0.769 0.578 1.022 0.070
LINC00324 − 0.404 0.668 0.464 0.961 0.030
LINC01116 0.222 1.249 1.039 1.501 0.018
LINC01137 0.364 1.438 1.157 1.788 0.001
TMPO-AS1 0.331 1.393 1.005 1.931 0.047
Page 6 of 14Yao et al. Cancer Cell Int (2021) 21:340
was higher than of JinLncSig (AUC = 0.699), ZhangLnc-Sig (AUC = 0.625) and ZhouLncSig (AUC = 0.695). These results indicated the superiority of the 7-FIRLs signature in OS prediction of patients with LUAD. Additionally, in univariate and multivariate Cox regression analysis, Lnc-Sig was both an independent and superior prognostic factor of LUAD patients. Our signature was identified to be superior or comparable to the previous defined signa-tures (Additional file 8: Table S4).
Correlation of the prognostic signature of 7 FIRLs with clinicopathological featuresThe independence of the signature in LUAD was eval-uated by univariate and multivariate Cox regression analysis. Univariate Cox regression analysis demon-strated that the risk score was associated with the OS of LUAD patients (P < 0.001; Fig. 3A). Multivariate Cox regression analysis revealed that the risk signature was independent prognostic factor for predicting the OS of LUAD patients (P < 0.001; Fig. 3B). Then a nomo-gram was constructed (Fig. 3C) to quantify the 1-, 3-, and 5-year survival probabilities by using independent predictive factors, including tumor stage, N stage and risk score (based on 7FIRLs signature). The calibration curves of the nomogram showed that the predicted sur-vival rates is closed related to the actual survival rates at 1, 3 and 5 years (Fig. 3D–F).
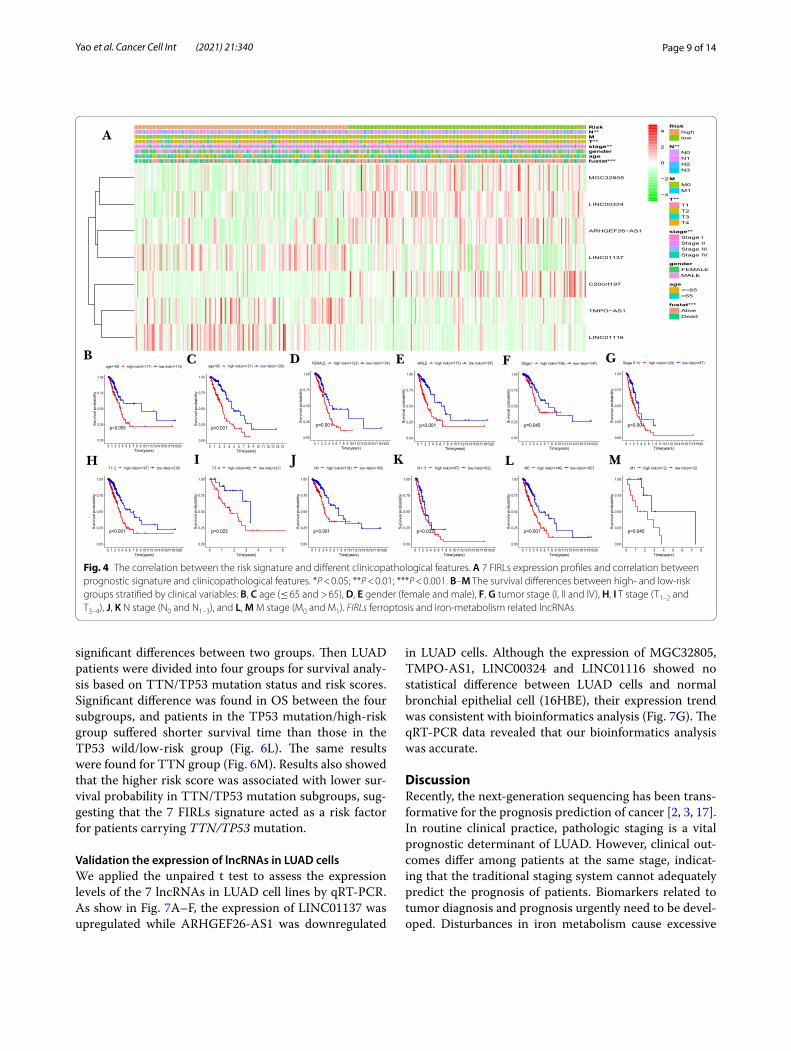
Chi-square test was conducted to investigate whether the 7-FIRLs signature participated in the development of LUAD. The heat map (Fig. 4A) showed that there were significant differences between high- and low-risk groups in tumor stage (P < 0.01), N stage (P < 0.01), T stage (P < 0.01), and survival state (P < 0.001). Stratifica-tion analysis was further conducted using the following clinical variables: age (≤ 65 and > 65), gender (female and male), tumor stage (I, II and IV), T stage (T1–2 and T3–4), N stage (N0 and N1–3) and M stage (M0 and M1). The results indicated that the signature has prognostic significance between high and low risk patients for all subgroups. Patients in the high-risk group shown sig-nificantly poorer OS than patients in the low-risk group (Fig. 4B–M). In sum, these results testify that the 7-FIRLs risk signature exerts critical roles in determining the prognosis of LUAD patients.
Functional enrichment analysis and immune infiltration level analysisTo explore the potential biological function of the seven FIRLs, protein-coding genes co-expressed with seven lncRNAs were screened out. |Pearson correlation coef-ficients | > 0.3 and p < 0.001 as the cutoff value yielded 40 protein-coding genes from the mRNA expression data of TCGA, whose expression was highly associated with all or at least one of the seven lncRNAs. A Sankey diagram was depicted to visualize the correlation of lncRNAs, mRNAs, and risk type (Additional file 2: Figure S2A). GO functional enrichment analysis revealed that the corre-lated mRNAs were significantly clustered in ion homeo-stasis and protein catabolic processes (Additional file 2: Figure S2B). The KEGG enrichment analysis showed that the correlated mRNAs were enriched in known ferropto-sis, necroptosis, autophagy and cancer-related pathway (Additional file 2: Figure S2C). The correlation expression between 7 FIRLs and four most common ferroptosis-related mRNAs (FTH1, GPX4, ACSL4, PTGS2) verified the relationship between 7 lncRNAs and ferroptosis from another perspective. The results with P value < 0.05 are shown in Additional file 2: Figure S2D–L.
The heatmap of immune infiltration based on TIMER, CIBERSORT, QUANTISEQ, MCP-counter, XCELL, and EPIC algorithms is shown in Fig. 5A. Compara-tive analysis of immune cells and pathways confirmed the differences of HLA, MHC class I, parainflammation, type I IFN response, type II IFN response, B cell, iDCs, mast cell, neutrophils, NK cell, T helper cell and TIL between two risk groups (P < 0.05, Fig. 5B, C). Given the importance of checkpoint-based immunotherapy, dif-ference was further found in the expression of immune checkpoints between two-groups (Fig. 5D). Then, scat-ter plots were generated using TIMER database to show the relationship between the risk score and immune cell infiltration. Results showed that the immune cell infil-tration was negatively correlated with the prognosis of LUAD patients (Additional file 3: Figure S3A–F): B cells (cor = − 0.181, p = 7.595e−05), CD4 cells (cor = − 0.105, p = 0.023), CD8 cells (cor = − 0.061, p = 0.185), dendritic cells (cor = − 0.08, p = 0.082), neutrophil (cor = − 0.043, p = 0.353), macrophages (cor = − 0.112, p = 0.015). It was suggested that this prognostic signature may
Fig. 2 The prognostic value of the risk signature including 7 FIRLs in training set and validation set. A, B PCA (A) and t-SNE (B) analysis between high-risk and low-risk groups in training set. C, D Kaplan–Meier survival analysis (C) and AUC of ROC at 1-, 2- and 3-y OS (D) in training set. E, F Kaplan–Meier survival analysis (E) and AUC of ROC at 1-, 2- and 3-y OS (F) in validation set. G lncRNA expression patterns for patients in high/low risk groups based on the 7-FIRLs prognostic signature. H Comparison of OS prediction for different prognostic signatures. FIRLs ferroptosis and iron-metabolism related lncRNAs, AUC area under the curve, OS overall survival
(See figure on next page.)
Page 7 of 14Yao et al. Cancer Cell Int (2021) 21:340
−2.5
0.0
2.5
5.0
−2.5 0.0 2.5 5.0
PC
2
Risk
high
low
−30
−20
−10
0
10
20
−20 −10 0 10 20tSNE1
tSN
E2 Risk
high
low
238169 74 44 26 16 9 4 3 2 2 1 1 1 1 1 1 1 0 0 0239194 85 46 28 22 15 13 8 6 5 5 5 4 2 2 2 2 2 0 0Low risk
High risk
0 1 2 3 4 5 6 7 8 9 10 11 12 13 14 15 16 17 18 19 20Time(years)
Ris
k
0.0 0.2 0.4 0.6 0.8 1.0
0.0
0.2
0.4
0.6
0.8
1.0
1−Specificity
Sen
sitiv
ityAUC at 1 years: 0.711AUC at 2 years: 0.658AUC at 3 years: 0.676
+
+++
+++++++++++++++++++++ + ++ +++ + + +++ + +
+ +++ +++ + ++
+ ++ ++ ++
p=0.032
0.00
0.25
0.50
0.75
1.00
0 1 2 3 4 5 6 7 8 9 10 11 12 13 14 15 16Time(years)
Surv
ival p
roba
bility
Risk + +High risk Low risk
130101 86 65 48 37 28 22 19 16 11 7 6 4 1 1 034 29 25 22 19 16 11 10 7 5 5 4 3 2 1 0 0Low risk
High risk
0 1 2 3 4 5 6 7 8 9 10 11 12 13 14 15 16Time(years)
Risk
0.0 0.2 0.4 0.6 0.8 1.0
0.0
0.2
0.4
0.6
0.8
1.0
1−Specificity
Sen
sitiv
ity
AUC at 1 years: 0.593AUC at 3 years: 0.577AUC at 5 years: 0.525
LINC01137
ARHGEF26−AS1
TMPO−AS1
MGC32805
LINC00324
C20orf197
LINC01116
type typehighlow
0
0.5
1
1.5
2
2.5
0.0 0.2 0.4 0.6 0.8 1.0
0.0
0.2
0.4
0.6
0.8
1.0
1−Specificity
Sen
sitiv
ity
LncSig, AUC=0.711JinLncSig, AUC=0.699ZhangLncSig, AUC=0.625ZhouLncSig, AUC=0.695
A B
PC1
++++++++++++++++++++++++++++++++++++++++++++++++++++++++++++++++++++++++++++++++++++++++++++++++++++++++++
+++ +++++++++ + + +
++++++++++++++++++++++++++++++++++++++++++++++++++++++++++++++++++++++++++++++++++++++++++++++++++++++++++++++++++++++++++++++++++++++++++++++++++++++++++ +++ ++
+++
++ ++p<0.001
0.00
0.25
0.50
0.75
1.00
0 1 2 3 4 5 6 7 8 9 10 11 12 13 14 15 16 17 18 19 20Time(years)
Sur
viva
l pro
babi
lity
Risk + +High risk Low risk
C D
E F
G
H
Fig. 2 (See legend on previous page.)

Page 8 of 14Yao et al. Cancer Cell Int (2021) 21:340
participate in immune response in tumor microenviron-ment through affecting immune cells. Moreover, CIBER-SORT algorithm was applied to analysis the correlation between expression level of single lncRNA in the signa-ture and immune cell infiltration (p < 0.001, Additional file 3: Figure S3G-N). In summary, these results indicate that the 7-FIRLs prognostic signature of LUAD was cor-related with immune cell infiltration to a certain extent.
Somatic mutations in different risk groups based on 7‑FIRLs signatureThe somatic mutation information of LUAD patients were utilized to explore the association between risk score and TMB. First, detailed mutation information of each gene was exhibited in waterfall plot, where small rectangles with different color represent different muta-tion types (Additional file 4: Figure S4A). Among these
mutations, missense mutation was the most common type in patients with LUAD (Additional file 4: Figure S4B). Single nucleotide polymorphism (SNP) occurred more proportion than insertion (INS) or deletion (DEL), and C > A was the most common of single nucleotide variants (SNV; Additional file 4: Figure S4C, D). The number of variants per sample was shown in Additional file 4: Figure S4E. The box diagram showed the mutation type with different colors (Additional file 4: Figure S4F). Horizontal histogram revealed the top ten mutated genes with high mutation frequency (Additional file 4: Figure S4G). Then, patients in the high-risk group were found with more mutation event than patients in the low-risk group (p < 0.05; Fig. 6A). Differential analysis was per-formed with the top ten mutated genes between the high/low risk group (Fig. 6B–K). The results showed that the TP53 mutation and TTN mutation had statistically
age
gender
stage
T
N
riskScore
0.718
1.000
<0.001
<0.001
<0.001
<0.001
pvalue
0.997(0.978−1.015)
1.000(0.694−1.441)
1.648(1.396−1.946)
1.600(1.285−1.994)
1.801(1.468−2.210)
1.346(1.249−1.450)
Hazard ratio
Hazard ratio
0.0 0.5 1.0 1.5 2.0
age
gender
stage
T
N
riskScore
0.474
0.694
0.012
0.495
0.037
<0.001
pvalue
1.007(0.988−1.026)
0.928(0.640−1.346)
1.356(1.068−1.721)
1.089(0.853−1.390)
1.331(1.017−1.741)
1.273(1.175−1.380)
Hazard ratio
Hazard ratio
0.0 0.5 1.0 1.5
Points0 10 20 30 40 50 60 70 80 90 100
StageStage I
Stage II−IV
NN0
N1−3
riskScore0 2 4 6 8 10 12 14 16 18 20
Total Points0 10 20 30 40 50 60 70 80 90 100 110 120 130
1−year survival0.9 0.8 0.7 0.5 0.3 0.1 0.01
3−year survival0.9 0.8 0.7 0.5 0.3 0.1 0.01
5−year survival0.8 0.7 0.5 0.3 0.1 0.01
0.80 0.85 0.90 0.95
0.65
0.70
0.75
0.80
0.85
0.90
0.95
1.00
Nomogram−Predicted Probability of 1−Year OS
Act
ual 1
−Yea
r OS
(pro
porti
on)
0.4 0.5 0.6 0.7 0.8
0.3
0.4
0.5
0.6
0.7
0.8
0.9
Nomogram−Predicted Probability of 3−Year OS
Act
ual 3
−Yea
r OS
(pro
porti
on)
0.2 0.3 0.4 0.5 0.6
0.2
0.4
0.6
0.8
Nomogram−Predicted Probability of 5−Year OS
Actu
al 5
−Yea
r OS(
prop
ortio
n)
A C
DB E
F
Fig. 3 Evaluation of the risk signature including 7 FIRLs. A Univariate Cox regression analysis of the correlation between OS and various clinicopathological features including risk signature. B Multivariate Cox regression analysis revealed that the risk signature was independent prognostic factor for predicting the OS of LUAD patients. C The nomogram for predicting the OS of patients with LUAD at 1, 3, and 5 years. D, E Calibration curves of the nomogram for OS prediction at 1 (D), 3 (F), and 5 (E) years. FIRLs, ferroptosis and iron-metabolism related lncRNAs
Page 9 of 14Yao et al. Cancer Cell Int (2021) 21:340
significant differences between two groups. Then LUAD patients were divided into four groups for survival analy-sis based on TTN/TP53 mutation status and risk scores. Significant difference was found in OS between the four subgroups, and patients in the TP53 mutation/high-risk group suffered shorter survival time than those in the TP53 wild/low-risk group (Fig. 6L). The same results were found for TTN group (Fig. 6M). Results also showed that the higher risk score was associated with lower sur-vival probability in TTN/TP53 mutation subgroups, sug-gesting that the 7 FIRLs signature acted as a risk factor for patients carrying TTN/TP53 mutation.
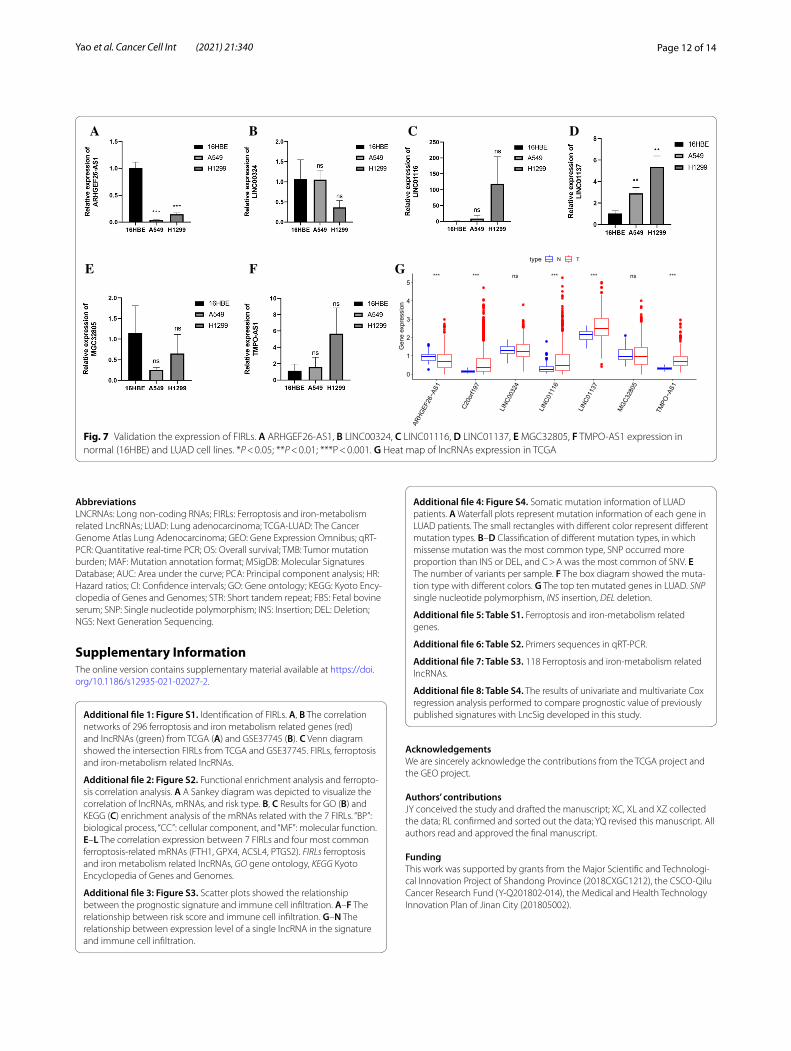
Validation the expression of lncRNAs in LUAD cellsWe applied the unpaired t test to assess the expression levels of the 7 lncRNAs in LUAD cell lines by qRT-PCR. As show in Fig. 7A–F, the expression of LINC01137 was upregulated while ARHGEF26-AS1 was downregulated
in LUAD cells. Although the expression of MGC32805, TMPO-AS1, LINC00324 and LINC01116 showed no statistical difference between LUAD cells and normal bronchial epithelial cell (16HBE), their expression trend was consistent with bioinformatics analysis (Fig. 7G). The qRT-PCR data revealed that our bioinformatics analysis was accurate.
DiscussionRecently, the next-generation sequencing has been trans-formative for the prognosis prediction of cancer [2, 3, 17]. In routine clinical practice, pathologic staging is a vital prognostic determinant of LUAD. However, clinical out-comes differ among patients at the same stage, indicat-ing that the traditional staging system cannot adequately predict the prognosis of patients. Biomarkers related to tumor diagnosis and prognosis urgently need to be devel-oped. Disturbances in iron metabolism cause excessive
MGC32805
LINC00324
ARHGEF26−AS1
LINC01137
C20orf197
TMPO−AS1
LINC01116
fustat***agegenderstage**T**MN**Risk Risk
highlow
N**N0N1N2N3
MM0M1
T**T1T2T3T4
stage**Stage IStage IIStage IIIStage IV
genderFEMALEMALE
age<=65>65
fustat***AliveDead
−4
−2
0
2
4
+++++++++++++++++++++++++++++++++++++++++++++++++++++
+++
++
+ ++
+
++++++++++++++++++++++++++++++++++++++++++++++++++++++++++++++++++++++++++++++++
+++++
++ +p<0.001
0.00
0.25
0.50
0.75
1.00
0 1 2 3 4 5 6 7 8 9 10 11 12 13 14 15Time(years)
Sur
viva
l pro
babi
lity
age>65 + +high risk(n=121) low risk(n=126)
++++++++++++++++++++++++++++++++++++++++++++++++++++++
++++++
++++ +
+++++++++++++++++++++++++++++++++++++++++++++++++++++++++++++++++++++++++++++++++++++++++
++++ + +
+p=0.001
0.00
0.25
0.50
0.75
1.00
0 1 2 3 4 5 6 7 8 9 1011121314151617181920Time(years)
Sur
viva
l pro
babi
lity
FEMALE + +high risk(n=123) low risk(n=134)
++++++++++++++++++++++++++++++++++++++++++++++
++++++
+++++++ +
++++++++++++++++++++++++++++++++++++++++++++++++++++++++++++++++++++++
++++
+++ + +
p<0.001
0.00
0.25
0.50
0.75
1.00
0 1 2 3 4 5 6 7 8 9 1011121314151617181920Time(years)
Sur
viva
l pro
babi
lity
MALE + +high risk(n=115) low risk(n=105)
++++++++++++++++++++++++++++++++++++++++++++++++++++++++++++++
++++
+++++++++ + +
++++++++++++++++++++++++++++++++++++++++++++++++++++++++++++++++++++++++++++++++++++++++++++++++++
++++++++
++
+ ++p=0.045
0.00
0.25
0.50
0.75
1.00
0 1 2 3 4 5 6 7 8 9 1011121314151617181920Time(years)
Sur
viva
l pro
babi
lity
Stage I + +high risk(n=106) low risk(n=147)
+++++++++++++++++++++++++++++++++++++++++
+++
+++
+
+++++++++++++++++++++++++++++++++++++++++++++++++++
+++++++
++p=0.001
0.00
0.25
0.50
0.75
1.00
0 1 2 3 4 5 6 7 8 9 1011121314151617181920Time(years)
Sur
viva
l pro
babi
lity
Stage II−IV + +high risk(n=129) low risk(n=87)
++++++++++++++++++++++++++++++++++++++++++++++++++++++++++++++++++++++++++++++++++++++++++++
++++++++++++
+ + +
++++++++++++++++++++++++++++++++++++++++++++++++++++++++++++++++++++++++++++++++++++++++++++++++++++++++++++++++++++++++++++++++++++++++
+++++++ ++++
++
+ ++p<0.001
0.00
0.25
0.50
0.75
1.00
0 1 2 3 4 5 6 7 8 9 1011121314151617181920Time(years)
Sur
viva
l pro
babi
lity
T1−2 + +high risk(n=197) low risk(n=216)
+
++
+++
++++++++
+
+ +
+ ++
+++++ ++++ +
++
+
p=0.023
0.00
0.25
0.50
0.75
1.00
0 1 2 3 4 5 6Time(years)
Sur
viva
l pro
babi
lity
T3−4 + +high risk(n=40) low risk(n=21)
+++++++++++++++++++++++++++++++++++++++++++++++++++++++++++++++++++++++++++++++++
+++++++++ + +
++++++++++++++++++++++++++++++++++++++++++++++++++++++++++++++++++++++++++++++++++++++++++++++++++++++++++++++++
+++++++++
++
+ ++p<0.001
0.00
0.25
0.50
0.75
1.00
0 1 2 3 4 5 6 7 8 9 1011121314151617181920Time(years)
Sur
viva
l pro
babi
lity
N0 + +high risk(n=138) low risk(n=169)
+++
+++++++++++++++++++++++
++
+++
+
+++++++++++++++++++++++++++
+++++++++
++++
++p=0.032
0.00
0.25
0.50
0.75
1.00
0 1 2 3 4 5 6 7 8 9 1011121314151617181920Time(years)
Sur
viva
l pro
babi
lity
N1−3 + +high risk(n=97) low risk(n=62)
++++++++++++++++++++++++++++++++++++++++++++++++++++++++++++
++++++++
++++++ +
++++++++++++++++++++++++++++++++++++++++++++++++++++++++++++++++++++++++++++++++++++++++++++++++++++++++++
+ +++++++
+
+p<0.001
0.00
0.25
0.50
0.75
1.00
0 1 2 3 4 5 6 7 8 9 1011121314151617181920Time(years)
Sur
viva
l pro
babi
lity
M0 + +high risk(n=146) low risk(n=167)
+ +
+ +++
++ +
+
p=0.040
0.00
0.25
0.50
0.75
1.00
0 1 2 3 4 5 6 7 8Time(years)
Sur
viva
l pro
babi
lity
M1 + +high risk(n=12) low risk(n=12)
A
B C D E F G
H I J K L M
+++++++++++++++++++++++++++++++++++++++++++++++++++++
+++++++
++ + +
+++++++++++++++++++++++++++++++++++++++++++++++++++++++++++++++++++++++++++++++
+ + +++
+
++
p=0.005
0.00
0.25
0.50
0.75
1.00
0 1 2 3 4 5 6 7 8 9 1011121314151617181920Time(years)
Sur
viva
l pro
babi
lity
age<=65 + +high risk(n=117) low risk(n=113)
Fig. 4 The correlation between the risk signature and different clinicopathological features. A 7 FIRLs expression profiles and correlation between prognostic signature and clinicopathological features. *P < 0.05; **P < 0.01; ***P < 0.001. B–M The survival differences between high- and low-risk groups stratified by clinical variables: B, C age (≤ 65 and > 65), D, E gender (female and male), F, G tumor stage (I, II and IV), H, I T stage (T1–2 and T3–4), J, K N stage (N0 and N1–3), and L, M M stage (M0 and M1). FIRLs ferroptosis and iron-metabolism related lncRNAs

Page 10 of 14Yao et al. Cancer Cell Int (2021) 21:340
intracellular iron storage and may induce ferroptosis [4]. Impaired ferroptosis is implicated in various pathological conditions [7]. Due to the important role of ferroptosis and iron metabolism in cancer, its related lncRNA has also attracted a lot of attention [24].
To the best of our knowledge, this study is the first one to identify and comprehensively analyze prognostic FIRLs in LUAD. This signature based on 7 FIRLs pro-vides a useful tool to supplement the traditional clinical prognostic factors, and guides prognostic prediction and therapeutic decisions. Additionally, we provide a FIRLs-related nomogram combining clinical factors to predict the OS of LUAD patients with an effective quantitative approach.
Immune regulation plays a crucial part in the progres-sion of LUAD. The number and proportion of infiltrating immune cells are recognized as important factors affect-ing cancer progression and immunotherapy response and associated with patient prognosis. According to the
tumor immunoediting hypothesis [9], less immunogenic cancer cells are selected for during tumor development in immune-competent hosts, to evade antitumor immune responses. This may result in increased immunosuppres-sive cells (e.g., regulatory T cells), decreased immunore-active cells (e.g., helper T cells). Thus, we hypothesized that patients in different risk groups would have different immunotherapeutic responses. Results found that high-risk LUAD patients had higher NK cells infiltration and lower fractions of Mast cells and helper T cells than low-risk patients. The above results suggest that the poorer prognosis of high-risk patients is due to higher immu-nosuppression and lower immunoreactivity in the tumor microenvironment, and these differences contribute to tumor progression. Checkpoint inhibitor-based immu-notherapies have improved the survival of patients of advanced malignancies [14]. Significant differences in the expression of immune checkpoints between high and low risk groups suggested the differences in the sensitivity
Fig. 5 Immune infiltration analysis. A Heatmap for immune responses based on TIMER, CIBERSORT, QUANTISEQ, MCP-counter, XCELL, and EPIC algorithms among high and low risk groups. B, C Results for ssGSEA scores [immune cells scores (B) and immune functions scores (C)] between high and low risk groups in boxplots. D Expression of immune checkpoints among high and low risk groups. ns not significant; *P < 0.05; **P < 0.01

Page 11 of 14Yao et al. Cancer Cell Int (2021) 21:340
to immunotherapies. Furthermore, findings in some cancer suggest that TMB may predict clinical response to immune checkpoint inhibitors [26]. In this study, we found that patients with LUAD in high risk group had higher TMB levels which was related to the immune effect.
However, several limitations of our study should be taken into consideration. Firstly, our study was mainly based on data from TCGA in which most patients were White or Asian. Caution must be taken when extrapolat-ing our findings to patients from other ethnicities. Sec-ondly, external validation of the signature in large-scale multicenter cohorts is necessary. Thirdly, further func-tional experiments in our laboratory will be required to verify findings and elucidate the roles of FIRLs in LUAD. In addition to its excellent performance in differentiating LUAD from normal lung, the role of the signature in dif-ferentiating normal lung, pulmonary nodules, and small cell lung cancer remains to be further elucidated.
In summary, the 7-FIRLs signature is a potential tool for predicting the OS rate of LUAD patients. Importantly, the signature might be associated with immune infil-tration levels and even the TMB scores. We expect this robust signature will provide clues on biological behav-iors as well as prognostic characteristics in clinical tests.
ConclusionsBy and large, we successfully constructed a strong predic-tive signature of ferroptosis and iron metabolism which may serve as a new biomarker and therapeutic target affecting the progression of LUAD. Meanwhile, the signa-ture helps researchers deeply understand the correlation between ferroptosis and tumourigenesis. Furthermore, this study provides a promising avenue for future anti-tumor immunotherapy.
0
500
1000
1500
Soma
tic mu
tation
count 55%
45%
43%
57%
0
25
50
75
100
High risk Low risk
Perc
ent TP53
Mutation
Wild
p=0.009
62%
38%
47%
53%
0
25
50
75
100
High risk Low risk
Perc
ent TTN
Mutation
Wild
p=0.002
47%
53%
42%
58%
0
25
50
75
100
High risk Low risk
Perc
ent MUC16
Mutation
Wild
p=0.377
46%
54%
38%
62%
0
25
50
75
100
High risk Low risk
Perc
ent CSMD3
Mutation
Wild
p=0.083
48%
52%
40%
60%
0
25
50
75
100
High risk Low risk
Perc
ent RYR2
Mutation
Wild
p=0.125
38%
62%
33%
67%
0
25
50
75
100
High risk Low risk
Perc
ent LRP1B
Mutation
Wild
p=0.264
39%
61%
36%
64%
0
25
50
75
100
High risk Low risk
Perc
ent USH2A
Mutation
Wild
p=0.593
39%
61%
31%
69%
0
25
50
75
100
High risk Low risk
Perc
ent ZFHX4
Mutation
Wild
p=0.072
34%
66%
29%
71%
0
25
50
75
100
High risk Low risk
Perc
ent XIRP2
Mutation
Wild
p=0.247
29%
71%
25%
75%
0
25
50
75
100
High risk Low risk
Perc
ent KRAS
Mutation
Wild
p=0.486
A B C D
E F G H I
J K L M
Fig. 6 Mutation analysis between high/low risk groups. A Comparative analysis of mutation event between high/low risk groups. B–K Differential analysis of the top ten mutated genes between the high/low risk groups. L, M Survival analysis based on TP53 (L)/TTN (M) mutation status and low/high risk
Page 12 of 14Yao et al. Cancer Cell Int (2021) 21:340
AbbreviationsLNCRNAs: Long non-coding RNAs; FIRLs: Ferroptosis and iron-metabolism related LncRNAs; LUAD: Lung adenocarcinoma; TCGA-LUAD: The Cancer Genome Atlas Lung Adenocarcinoma; GEO: Gene Expression Omnibus; qRT-PCR: Quantitative real-time PCR; OS: Overall survival; TMB: Tumor mutation burden; MAF: Mutation annotation format; MSigDB: Molecular Signatures Database; AUC : Area under the curve; PCA: Principal component analysis; HR: Hazard ratios; CI: Confidence intervals; GO: Gene ontology; KEGG: Kyoto Ency-clopedia of Genes and Genomes; STR: Short tandem repeat; FBS: Fetal bovine serum; SNP: Single nucleotide polymorphism; INS: Insertion; DEL: Deletion; NGS: Next Generation Sequencing.
Supplementary InformationThe online version contains supplementary material available at https:// doi. org/ 10. 1186/ s12935- 021- 02027-2.
Additional file 1: Figure S1. Identification of FIRLs. A, B The correlation networks of 296 ferroptosis and iron metabolism related genes (red) and lncRNAs (green) from TCGA (A) and GSE37745 (B). C Venn diagram showed the intersection FIRLs from TCGA and GSE37745. FIRLs, ferroptosis and iron-metabolism related lncRNAs.
Additional file 2: Figure S2. Functional enrichment analysis and ferropto-sis correlation analysis. A A Sankey diagram was depicted to visualize the correlation of lncRNAs, mRNAs, and risk type. B, C Results for GO (B) and KEGG (C) enrichment analysis of the mRNAs related with the 7 FIRLs. “BP”: biological process, “CC”: cellular component, and “MF”: molecular function. E–L The correlation expression between 7 FIRLs and four most common ferroptosis-related mRNAs (FTH1, GPX4, ACSL4, PTGS2). FIRLs ferroptosis and iron metabolism related lncRNAs, GO gene ontology, KEGG Kyoto Encyclopedia of Genes and Genomes.
Additional file 3: Figure S3. Scatter plots showed the relationship between the prognostic signature and immune cell infiltration. A–F The relationship between risk score and immune cell infiltration. G–N The relationship between expression level of a single lncRNA in the signature and immune cell infiltration.
Additional file 4: Figure S4. Somatic mutation information of LUAD patients. A Waterfall plots represent mutation information of each gene in LUAD patients. The small rectangles with different color represent different mutation types. B–D Classification of different mutation types, in which missense mutation was the most common type, SNP occurred more proportion than INS or DEL, and C > A was the most common of SNV. E The number of variants per sample. F The box diagram showed the muta-tion type with different colors. G The top ten mutated genes in LUAD. SNP single nucleotide polymorphism, INS insertion, DEL deletion.
Additional file 5: Table S1. Ferroptosis and iron-metabolism related genes.
Additional file 6: Table S2. Primers sequences in qRT-PCR.
Additional file 7: Table S3. 118 Ferroptosis and iron-metabolism related lncRNAs.
Additional file 8: Table S4. The results of univariate and multivariate Cox regression analysis performed to compare prognostic value of previously published signatures with LncSig developed in this study.
AcknowledgementsWe are sincerely acknowledge the contributions from the TCGA project and the GEO project.
Authors’ contributionsJY conceived the study and drafted the manuscript; XC, XL and XZ collected the data; RL confirmed and sorted out the data; YQ revised this manuscript. All authors read and approved the final manuscript.
FundingThis work was supported by grants from the Major Scientific and Technologi-cal Innovation Project of Shandong Province (2018CXGC1212), the CSCO-Qilu Cancer Research Fund (Y-Q201802-014), the Medical and Health Technology Innovation Plan of Jinan City (201805002).
A B DC
E F G
Fig. 7 Validation the expression of FIRLs. A ARHGEF26-AS1, B LINC00324, C LINC01116, D LINC01137, E MGC32805, F TMPO-AS1 expression in normal (16HBE) and LUAD cell lines. *P < 0.05; **P < 0.01; ***P < 0.001. G Heat map of lncRNAs expression in TCGA

Page 13 of 14Yao et al. Cancer Cell Int (2021) 21:340
Availability of data and materialsAll data generated or analysed during this study are included in this published article and its Additional files.
Declarations
Ethics approval and consent to participateNot applicable.
Consent for publicationNot applicable.
Competing interestsThe authors declare that they have no competing interests.
Author details1 Department of Pulmonary and Critical Care Medicine, Qilu Hospital, Cheeloo College of Medicine, Shandong University, Jinan, China. 2 Department of Res-piratory Medicine, Tai’an City Central Hospital, Tai’an, China. 3 Department of Pulmonary and Critical Care Medicine, Qilu Hospital of Shandong University, Jinan, China. 4 Shandong Key Laboratory of Infectious Respiratory Diseases, Qilu Hospital of Shandong University, Jinan, China.
Received: 4 April 2021 Accepted: 15 June 2021
References 1. Aran D, Hu Z, Butte AJ. xCell: digitally portraying the tissue cellular hetero-
geneity landscape. Genome Biol. 2017;18(1):220. https:// doi. org/ 10. 1186/ s13059- 017- 1349-1.
2. Abdelaal AM, Attalla EM, Elshemey MW. Estimation of out-of-field dose variation using markus ionization chamber detector. Sci Med J. 2020;2(1):8–15. https:// doi. org/ 10. 28991/ SciMe dJ- 2020- 0201-2.
3. Agsalda-Garcia M, Shieh T, Souza R, Kamada N, Loi N, Oda R, Acosta-Maeda T, Choi SY, Lim E, Misra A, Shiramizu B. Raman-enhanced spectros-copy (RESpect) probe for childhood non-Hodgkin lymphoma. Sci Med J. 2020;2(1):1–7. https:// doi. org/ 10. 28991/ SciMe dJ- 2020- 0201-1.
4. Bogdan AR, Miyazawa M, Hashimoto K, Tsuji Y. Regulators of iron homeostasis: new players in metabolism, cell death, and disease. Trends Biochem Sci. 2016;41(3):274–86. https:// doi. org/ 10. 1016/j. tibs. 2015. 11. 012.
5. Becht E, Giraldo NA, Lacroix L, Buttard B, Elarouci N, Petitprez F, Selves J, Laurent-Puig P, Sautès-Fridman C, Fridman WH, de Reynies A. Estimating the population abundance of tissue-infiltrating immune and stromal cell populations using gene expression. Genome Biol. 2016;17(1):218. https:// doi. org/ 10. 1186/ s13059- 016- 1070-5.
6. Chen B, Khodadoust MS, Liu CL, Newman AM, Alizadeh AA. Profiling tumor infiltrating immune cells with CIBERSORT. Methods Mol Biol. 2018;1711:243–59. https:// doi. org/ 10. 1007/ 978-1- 4939- 7493-1_ 12.
7. Chen X, Yu C, Kang R, Tang D. Iron metabolism in ferroptosis. Front Cell Dev Biol. 2020;8: 590226. https:// doi. org/ 10. 3389/ fcell. 2020. 590226.
8. Derrien T, Johnson R, Bussotti G, Tanzer A, Djebali S, Tilgner H, et al. The GENCODE v7 catalog of human long noncoding RNAs: analysis of their gene structure, evolution, and expression. Genome Res. 2012;22(9):1775–89. https:// doi. org/ 10. 1101/ gr. 132159. 111.
9. Efremova M, Rieder D, Klepsch V, Charoentong P, Finotello F, Hackl H, Hermann-Kleiter N, Löwer M, Baier G, Krogsdam A, Trajanoski Z. Targeting immune checkpoints potentiates immunoediting and changes the dynamics of tumor evolution. Nat Commun. 2018;9(1):32. https:// doi. org/ 10. 1038/ s41467- 017- 02424-0.
10. Finotello F, Mayer C, Plattner C, Laschober G, Rieder D, Hackl H, et al. Molecular and pharmacological modulators of the tumor immune contexture revealed by deconvolution of RNA-seq data. Genome Med. 2019;11(1):34. https:// doi. org/ 10. 1186/ s13073- 019- 0638-6.
11. Gibb EA, Brown CJ, Lam WL. The functional role of long non-coding RNA in human carcinomas. Mol Cancer. 2011;10:38. https:// doi. org/ 10. 1186/ 1476- 4598- 10- 38.
12. Hassannia B, Vandenabeele P, VandenBerghe T. Targeting ferroptosis to iron out cancer. Cancer Cell. 2019;35(6):830–49. https:// doi. org/ 10. 1016/j. ccell. 2019. 04. 002.
13. Hirsch FR, Scagliotti GV, Mulshine JL, Kwon R, Curran WJ Jr, Wu YL, Paz-Ares L. Lung cancer: current therapies and new targeted treatments. Lan-cet. 2017;389(10066):299–311. https:// doi. org/ 10. 1016/ S0140- 6736(16) 30958-8.
14. Hellmann MD, Nathanson T, Rizvi H, Creelan BC, Sanchez-Vega F, Ahuja A, et al. Genomic features of response to combination immunotherapy in patients with advanced non-small-cell lung cancer. Cancer Cell. 2018;33(5):843–52. https:// doi. org/ 10. 1016/j. ccell. 2018. 03. 018.
15. Jin D, Song Y, Chen Y, Zhang P. Identification of a seven-lncRNA immune risk signature and construction of a predictive nomogram for lung adenocarcinoma. Biomed Res Int. 2020;2020:7929132. https:// doi. org/ 10. 1155/ 2020/ 79291 32.
16. Kopp F, Mendell JT. Functional classification and experimental dissection of long noncoding RNAs. Cell. 2018;172(3):393–407. https:// doi. org/ 10. 1016/j. cell. 2018. 01. 011.
17 Kosvyra A, Maramis C, Chouvarda I. Developing an integrated genomic profile for cancer patients with the use of NGS data. ESJ. 2019;3(3):157–67. https:// doi. org/ 10. 28991/ esj- 2019- 01178.
18. Li J, Cao F, Yin HL, Huang ZJ, Lin ZT, Mao N, Sun B, Wang G. Ferroptosis: past, present and future. Cell Death Dis. 2020;11(2):88. https:// doi. org/ 10. 1038/ s41419- 020- 2298-2.
19. Li T, Fu J, Zeng Z, Cohen D, Li J, Chen Q, Li B, Liu XS. TIMER2.0 for analysis of tumor-infiltrating immune cells. Nucleic Acids Res. 2020;48(W1):W509–14. https:// doi. org/ 10. 1093/ nar/ gkaa4 07.
20. Liang C, Zhang X, Yang M, Dong X. Recent progress in ferroptosis induc-ers for cancer therapy. Adv Mater. 2019;31(51): e1904197. https:// doi. org/ 10. 1002/ adma. 20190 4197.
21. Manz DH, Blanchette NL, Paul BT, Torti FM, Torti SV. Iron and cancer: recent insights. Ann N Y Acad Sci. 2016;1368(1):149–61. https:// doi. org/ 10. 1111/ nyas. 13008.
22. Mayakonda A, Lin DC, Assenov Y, Plass C, Koeffler HP. Maftools: efficient and comprehensive analysis of somatic variants in cancer. Genome Res. 2018;28(11):1747–56. https:// doi. org/ 10. 1101/ gr. 239244. 118.
23. Musallam KM, Taher AT. Iron deficiency beyond erythropoiesis: should we be concerned? Curr Med Res Opin. 2018;34(1):81–93. https:// doi. org/ 10. 1080/ 03007 995. 2017. 13948 33.
24. Mou Y, Wang J, Wu J, He D, Zhang C, Duan C, Li B. Ferroptosis, a new form of cell death: opportunities and challenges in cancer. J Hematol Oncol. 2019;12(1):34. https:// doi. org/ 10. 1186/ s13045- 019- 0720-y.
25. Newman AM, Liu CL, Green MR, Gentles AJ, Feng W, Xu Y, Hoang CD, Diehn M, Alizadeh AA. Robust enumeration of cell subsets from tissue expression profiles. Nat Methods. 2015;12(5):453–7. https:// doi. org/ 10. 1038/ nmeth. 3337.
26. Rizvi NA, Hellmann MD, Snyder A, Kvistborg P, Makarov V, Havel JJ, et al. Cancer immunology Mutational landscape determines sensitivity to PD-1 blockade in non-small cell lung cancer. Science. 2015;348(6230):124–8. https:// doi. org/ 10. 1126/ scien ce. aaa13 48.
27. Racle J, Gfeller D. EPIC: a tool to estimate the proportions of different cell types from bulk gene expression data. Methods Mol Biol. 2020;2120:233–48. https:// doi. org/ 10. 1007/ 978-1- 0716- 0327-7_ 17.
28. Shiraishi K, Kunitoh H, Daigo Y, Takahashi A, Goto K, Sakamoto H, et al. A genome-wide association study identifies two new susceptibility loci for lung adenocarcinoma in the Japanese population. Nat Genet. 2012;44(8):900–3. https:// doi. org/ 10. 1038/ ng. 2353.
29. Siegel RL, Miller KD, Jemal A. Cancer statistics, 2020. CA Cancer J Clin. 2020;70(1):7–30. https:// doi. org/ 10. 3322/ caac. 21590.
30. Wang M, Mao C, Ouyang L, Liu Y, Lai W, Liu N, et al. Long noncoding RNA LINC00336 inhibits ferroptosis in lung cancer by functioning as a com-peting endogenous RNA. Cell Death Differ. 2019;26(11):2329–43. https:// doi. org/ 10. 1038/ s41418- 019- 0304-y.
31. Wang S, Luo J, Zhang Z, Dong D, Shen Y, Fang Y, et al. Iron and magnetic: new research direction of the ferroptosis-based cancer therapy. Am J Cancer Res. 2018;8(10):1933–46.
32. Wang Z, Chen X, Liu N, Shi Y, Liu Y, Ouyang L, Tam S, Xiao D, Liu S, Wen F, Tao Y. A nuclear long non-coding RNA LINC00618 accelerates ferroptosis in a manner dependent upon apoptosis. Mol Ther. 2021;29(1):263–74. https:// doi. org/ 10. 1016/j. ymthe. 2020. 09. 024.

Page 14 of 14Yao et al. Cancer Cell Int (2021) 21:340
• fast, convenient online submission
•
thorough peer review by experienced researchers in your field
• rapid publication on acceptance
• support for research data, including large and complex data types
•
gold Open Access which fosters wider collaboration and increased citations
maximum visibility for your research: over 100M website views per year •
At BMC, research is always in progress.
Learn more biomedcentral.com/submissions
Ready to submit your researchReady to submit your research ? Choose BMC and benefit from: ? Choose BMC and benefit from:
33. Wu Y, Zhang S, Gong X, Tam S, Xiao D, Liu S, Tao Y. The epigenetic regula-tors and metabolic changes in ferroptosis-associated cancer progression. Mol Cancer. 2020;19(1):39. https:// doi. org/ 10. 1186/ s12943- 020- 01157-x.
34. Zhang X, Han J, Du L, Li X, Hao J, Wang L, et al. Unique metastasis-asso-ciated lncRNA signature optimizes prediction of tumor relapse in lung adenocarcinoma. Thorac Cancer. 2020;11(3):728–37. https:// doi. org/ 10. 1111/ 1759- 7714. 13325.
35. Zhou M, Shao W, Dai H, Zhu X. A robust signature based on autophagy-associated LncRNAs for predicting prognosis in lung adenocarcinoma. Biomed Res Int. 2020;2020:3858373. https:// doi. org/ 10. 1155/ 2020/ 38583 73.
36. Zhou N, Bao J. FerrDb: a manually curated resource for regulators and markers of ferroptosis and ferroptosis-disease associations. Database. 2020. https:// doi. org/ 10. 1093/ datab ase/ baaa0 21.
Publisher’s NoteSpringer Nature remains neutral with regard to jurisdictional claims in pub-lished maps and institutional affiliations.