characterization and classification of soils along a ... · characterization and classification of...
TRANSCRIPT

FUTO Journal Series (FUTOJNLS), 2015, VOL. 1, Issue 2
Chikere-Njoku Characterization And Classification...,
1.0 IntroductionGlobally, or at least with tropical or
subtropical World the identification and classification of landscape as soil association has opened up a vista of challenges to unravel the systematic occurrence of landscape within climatic/agro climatic belt (Temitope, 2006.) Despite the study and characterization of soils being the basis for soil mapping and land use also, characterization and classification of soils help in understanding of how much nutrient resources varies across landscape and this has become the focal point of much ecological resources (Benning & Seastedt, 1995).
However, soi l identif icat ion and characterization take into account the geology, parent material, topography and hydrological factors (Juo & Katherin, 2003). When soil are arranged according to changes in relief or topography, it is referred to as toposequence (Brady & Weil, 2002). Wild (1999), also defined toposequence as the pattern of soil following topography where climate and parent material are constant or vary in the same way within altitudes.
Topography as a soil forming factor is in direct relationship to the differences in variability across a landscape. Odernerho (1980) observed that
the distribution of the toposequence itself has spatial distribution and considerable influence on land use pattern of an area.
Stoop (1987) observed a high degree of variation in crop stand and low average productivity on the West African landscape and noted that crop field tends to decrease from fertile valley bottom soil to generally infertile upland. This is true because landscape position creates differences in soil formation and consequently difference in soil properties along a hill slope (Brubaker et al., 1993).
The most important effect of topography on landscape of Oba, Anambra State, Nigeria is majorly on its influence on water flow pattern as a susceptible factor to erosion menace. The recorded cases of soil degradation by erosion in the tropics, especially Nigeria is enormous (Igwe, 2003; Jan et al., 2007).
Bubagwu and Obi (2003), noted that 85 % of land degradation is due to erosion. Thus, soil degradation along the toposequence of Oba seems to share the common features of crusting, compaction, sealing, impeded drainage, reduced water holding capacity, acidification, nutrient leaching and depletion in organic matter as constraining factors to agriculture in the area.
U n f o r t u n a t e l y , s t u d i e s o n t h e
103
Characterization and Classification of Soils Along A Toposequence for Agronomic Use in Obaidemili South L.G.A. of Anambra State,
Southern Nigeria
Chikere-Njoku, C.Department of Soil Science and Environment
Imo State University, Owerri, P.M.B 2000, Nigeria.E-mail: [email protected]
AbstractThe soils of Oba Idemili South Local Government Area of Anambra State, Nigeria were studied with a view to characterizing and classifying them. Three pedons were dug in the study area and examined with regards to their soils morphology, physical and chemical properties. The result of these search study revealed that the soils were derived from lignite series formation and belong to the lowland geomorphology. They have high sand ranging from 64 to 88.60 % in both the upper, mid and foot slope but, it decreased with depth. Both the clay and silt contents were low. There was a little variation in colour and consistency. All the soils were slightly to moderately acidic, with medium to high base saturation levels (60-75 %). The available
-1phosphorus level was high [>20.0 mgkg ] in all the slope levels while several other fertility variables were low. The soils were classified as Typic hapluducts.
Keywords: Soil, Characterization, Classification, Toposequence
p-ISSN: 2467-8325; e-ISSN: 2476-8456
characterization and classification of soil of Oba are relatively scarce. Therefore, the purpose of the study is to characterize, classify soils along toposequence of Oba with a view to adopting better approach to the use of lands for both agricultural and non-agricultural activities and; to proffer improved management practices to the soils of the area.
2.0 Materials and Methods2.1 The study areaThe study was conducted at Oba, Idemili South of Anambra State. The soils are derived from lignite series formation, Ogwashiukwu-Asaba formation (Orajiaku, 1975). The area belongs to the low land geomorphology of Southeastern State (Ofomata, 1980), with elevation between 30-74 m above sea
2levels, covering an average total land area of 15km (Wikipedia, 2009). The major rivers tributaries of the area are Idemili River that empties into the river Niger and the minor tributaries is the Ose and Ekulu stream which empties into the Idemili River.
The study area is found in the humid tropical climate with mean annual rainfall greater than 2,250 mm and annual temperature range of
0between 27 – 30 C (Ofomata, 1975). The area is characterized with rainforest tropical vegetation of multiple plant species such as oil palm (Elais guineensis), Ogbono (Irvingia gabonensis), mango (Mangifera indica) etc.
2.2 Soil sampling siteThe sampling site for the study is within the flood plain of Idemili River in Oba. It lies within latitude
0 1 0 1 6 03 N and longitude 6 49 E.The soil samples were delineated along three topographical units (upper slope, mid-slope and the foot slope) distance at an intervals of 1000 m from each other. The profile pits were geo-referenced with handheld global positioning system. The profile pits were dug and described according to FAO, (1998) procedure and system (G.P.S) receiver. The elevations above mean sea level were 53, 44, 34 meters for upper slope, mid slope and foot slope pedons, respectively. Soil samples collected from the bottom horizon upward to avoid contaminations. Soil colour was determined using Munsselcolour chart while soil texture, consistency and structure were determined using moist soil samples ,collected with auger while soil cores were used to collect core samples for bulk density analysis.
2.3 Laboratory analysisThe soil samples collected from the profile pits were air dried, ground and sieved with 2 mm sieve for
chemical property analysis. Particle size distribution was determined by Bouyocous hydrometer method (Gee and Bauder, 1986). Organic carbon was determined by Walkey Black-Wet oxidation method (Nelson and Sommers, 1982), Total Nitrogen (TN) by micro-kjeldah techniques as described by Bremmer and Mulvaney (1982). The soil pH (H o) was determined in 1:2.5 2
soil/water ratio suspension using glass electrode pH meter (Mclean, 1982). Available phosphorus was determined using the Bray II solution method (Olson & Sommer, 1982) and the exchangeable bases by 1 N NH OAC (Jackson, 1962).4
3.0 Results and Discussion3.1 Morphological properties
The result of the morphological, physical and silt/clay ratio properties of the pedon at each slope position were presented in Table 1. In the upper slope, the topsoil was predominantly dull and reddish brown in a progressive lightening of colour down the horizon. Though, the colour matrix of the subsoil at the upper slope was 10 R exhibiting a uniform red colour as an expression of good internal drainage.
The mid slope colour varied from dull reddish brown (2.5 years/8) at the top soil to orange (2.5 yr 7/8) at the subsoil. It also exhibited progressive lighting down the profile.
In the foot slope, the colour changes from dull reddish brown at the topsoil to a red coloured horizon (10 R5/6). Possibly, as a result of poor drainage and mottling that are common in the foot slope while, the colour became dark red-greyish in the below horizon. Generally, the drainage condition and the topography position may be the major cause of differences in colour along the toposequence. Not only that the water content had been identified as one of the major factors influencing soil colour (Brady and Weil, 2002) also, topographical features such as curvature slope, upslope area influences the hydrological conditions of a location and generates different soil moisture and flow patterns (Jan et al., 2007).
The structure of the soil found at the upper slope and mid slope were generally sub-angular blocky, angular blocky and blocky. These are typical for mature stable landscape (Okusami et al., 1997). The foot slope had granular structure topsoil followed by a lower structureless horizon with a strong granular structure below, having deposition of eroded materials as evidence of immature soil.
The texture of the top soil varied from sandy loam at the upper slope, sandy clay loam at
Chikere-Njoku Characterization And Classification...,
FUTO Journal Series (FUTOJNLS), 2015, VOL. 1, Issue 2 104p-ISSN: 2467-8325; e-ISSN: 2476-8456
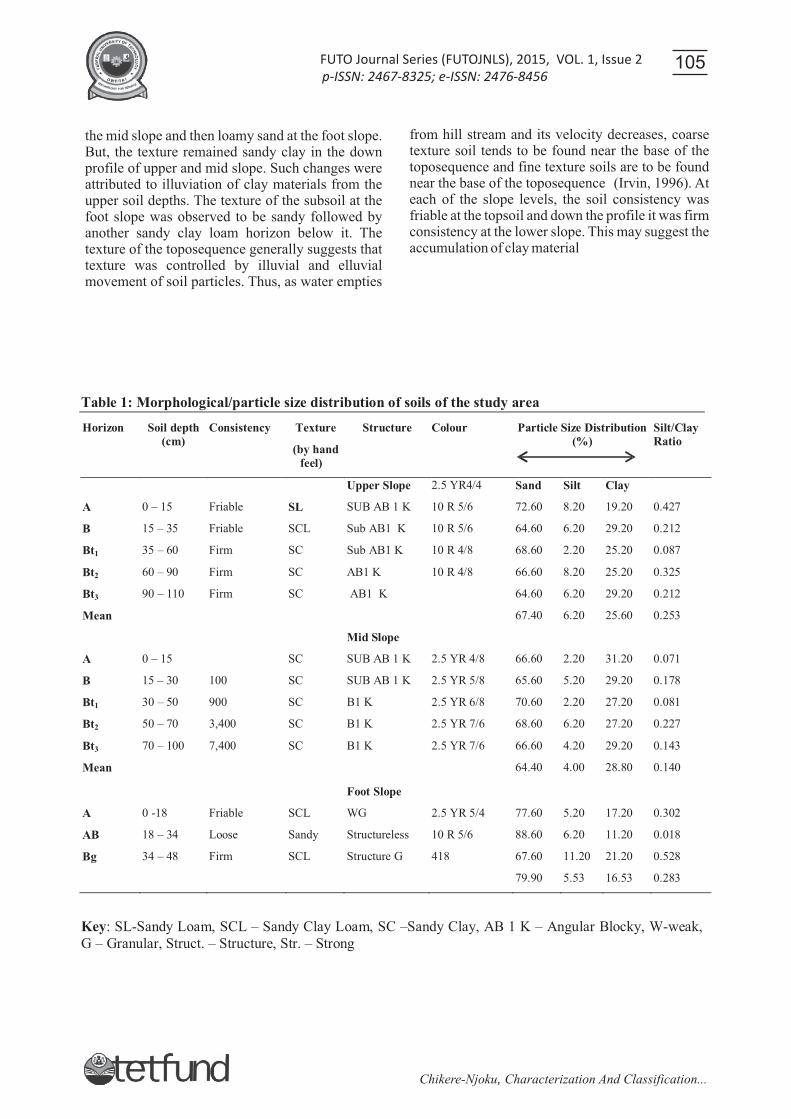
the mid slope and then loamy sand at the foot slope. But, the texture remained sandy clay in the down profile of upper and mid slope. Such changes were attributed to illuviation of clay materials from the upper soil depths. The texture of the subsoil at the foot slope was observed to be sandy followed by another sandy clay loam horizon below it. The texture of the toposequence generally suggests that texture was controlled by illuvial and elluvial movement of soil particles. Thus, as water empties
from hill stream and its velocity decreases, coarse texture soil tends to be found near the base of the toposequence and fine texture soils are to be found near the base of the toposequence (Irvin, 1996). At each of the slope levels, the soil consistency was friable at the topsoil and down the profile it was firm consistency at the lower slope. This may suggest the accumulation of clay material
Table 1: Morphological/particle size distribution of soils of the study area
Horizon Soil depth (cm)
Consistency Texture
(by hand feel)
Structure Colour Particle Size Distribution (%)
Silt/Clay Ratio
Upper Slope 2.5 YR4/4 Sand Silt Clay
A 0 – 15 Friable SL SUB AB 1 K 10 R 5/6 72.60 8.20 19.20 0.427
B 15 – 35 Friable SCL Sub AB1 K 10 R 5/6 64.60 6.20 29.20 0.212
Bt1 35 – 60 Firm SC Sub AB1 K 10 R 4/8 68.60 2.20 25.20 0.087
Bt2 60 – 90 Firm SC AB1 K 10 R 4/8 66.60 8.20 25.20 0.325
Bt3 90 – 110 Firm SC AB1 K 64.60 6.20 29.20 0.212
Mean 67.40 6.20 25.60 0.253
Mid Slope
A 0 – 15 SC SUB AB 1 K 2.5 YR 4/8 66.60 2.20 31.20 0.071
B 15 – 30 100 SC SUB AB 1 K 2.5 YR 5/8 65.60 5.20 29.20 0.178
Bt1 30 – 50 900 SC B1 K 2.5 YR 6/8 70.60 2.20 27.20 0.081
Bt2 50 – 70 3,400 SC B1 K 2.5 YR 7/6 68.60 6.20 27.20 0.227
Bt3 70 – 100 7,400 SC B1 K 2.5 YR 7/6 66.60 4.20 29.20 0.143
Mean 64.40 4.00 28.80 0.140
Foot Slope
A 0 -18 Friable SCL WG 2.5 YR 5/4 77.60 5.20 17.20 0.302
AB 18 – 34 Loose Sandy Structureless 10 R 5/6 88.60 6.20 11.20 0.018
Bg 34 – 48 Firm SCL Structure G 418 67.60 11.20 21.20 0.528
79.90 5.53 16.53 0.283
Key: SL-Sandy Loam, SCL – Sandy Clay Loam, SC –Sandy Clay, AB 1 K – Angular Blocky, W-weak, G – Granular, Struct. – Structure, Str. – Strong
Chikere-Njoku Characterization And Classification...,
FUTO Journal Series (FUTOJNLS), 2015, VOL. 1, Issue 2 105p-ISSN: 2467-8325; e-ISSN: 2476-8456
3.2 Particle size distributionThe particle size distribution of the soils of
the study area are shown in Table. 1. The sand fraction ranged 72.6 – 64.60 % at upper slope, 65.60 – 70.60% in the mid slope and 67.60 – 88.60 % in the foot slope. Such irregularities of sand fraction suggest possible evidence of differential velocity in runoff water carrying eroded materials down the slope. As soil depths increased, clay content also increased in both the upper, mid and foot slopes.Accumulation of clay fractions in the lower soil depths have been attributed to migration processes leading to the formation of argillic horizon in the subsoil (Ewulo et al., 2008). However, the silt/clay ratio were < 1 in all the profiles of the soils studied. Ashayer (1961) had indicated such low silt/clay ratio as soils having ferralitic pedogenesis.
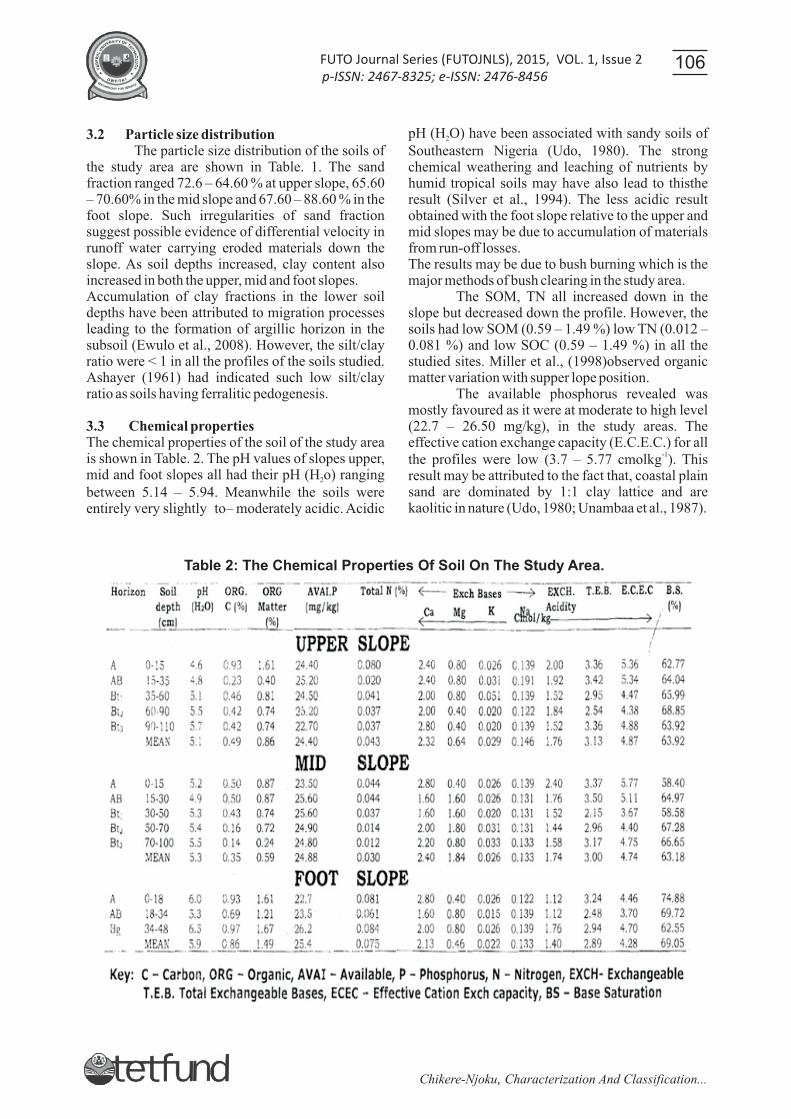
3.3 Chemical propertiesThe chemical properties of the soil of the study area is shown in Table. 2. The pH values of slopes upper, mid and foot slopes all had their pH (H o) ranging 2
between 5.14 – 5.94. Meanwhile the soils were entirely very slightly to– moderately acidic. Acidic
pH (H O) have been associated with sandy soils of 2
Southeastern Nigeria (Udo, 1980). The strong chemical weathering and leaching of nutrients by humid tropical soils may have also lead to thisthe result (Silver et al., 1994). The less acidic result obtained with the foot slope relative to the upper and mid slopes may be due to accumulation of materials from run-off losses.The results may be due to bush burning which is the major methods of bush clearing in the study area.
The SOM, TN all increased down in the slope but decreased down the profile. However, the soils had low SOM (0.59 – 1.49 %) low TN (0.012 – 0.081 %) and low SOC (0.59 – 1.49 %) in all the studied sites. Miller et al., (1998)observed organic matter variation with supper lope position.
The available phosphorus revealed was mostly favoured as it were at moderate to high level (22.7 – 26.50 mg/kg), in the study areas. The effective cation exchange capacity (E.C.E.C.) for all
-1the profiles were low (3.7 – 5.77 cmolkg ). This result may be attributed to the fact that, coastal plain sand are dominated by 1:1 clay lattice and are kaolitic in nature (Udo, 1980; Unambaa et al., 1987).
Table 2: The Chemical Properties Of Soil On The Study Area.
Chikere-Njoku Characterization And Classification...,
FUTO Journal Series (FUTOJNLS), 2015, VOL. 1, Issue 2 106p-ISSN: 2467-8325; e-ISSN: 2476-8456
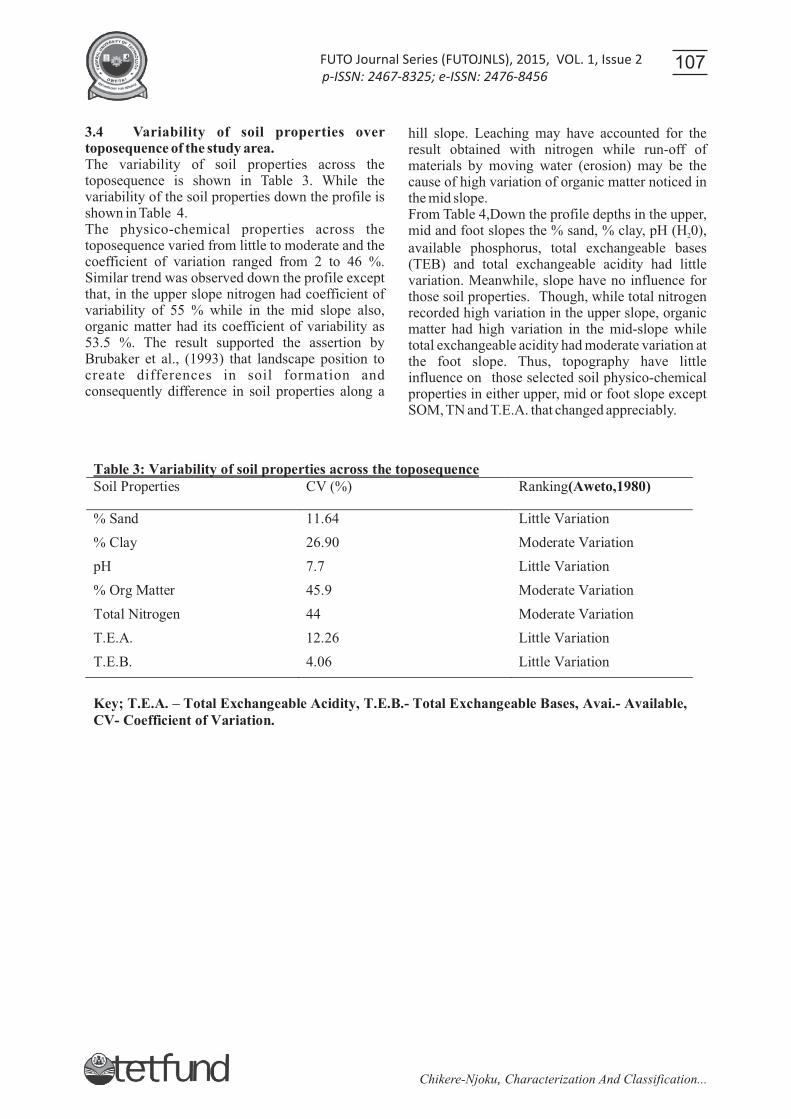
3.4 Variability of soil properties over toposequence of the study area.The variability of soil properties across the toposequence is shown in Table 3. While the variability of the soil properties down the profile is shown in Table 4.The physico-chemical properties across the toposequence varied from little to moderate and the coefficient of variation ranged from 2 to 46 %. Similar trend was observed down the profile except that, in the upper slope nitrogen had coefficient of variability of 55 % while in the mid slope also, organic matter had its coefficient of variability as 53.5 %. The result supported the assertion by Brubaker et al., (1993) that landscape position to create differences in soil formation and consequently difference in soil properties along a
hill slope. Leaching may have accounted for the result obtained with nitrogen while run-off of materials by moving water (erosion) may be the cause of high variation of organic matter noticed in the mid slope.From Table 4,Down the profile depths in the upper, mid and foot slopes the % sand, % clay, pH (H 0), 2
available phosphorus, total exchangeable bases (TEB) and total exchangeable acidity had little variation. Meanwhile, slope have no influence for those soil properties. Though, while total nitrogen recorded high variation in the upper slope, organic matter had high variation in the mid-slope while total exchangeable acidity had moderate variation at the foot slope. Thus, topography have little influence on those selected soil physico-chemical properties in either upper, mid or foot slope except SOM, TN and T.E.A. that changed appreciably.
Table 3: Variability of soil properties across the toposequence Soil Properties CV (%) Ranking(Aweto,1980)
% Sand 11.64 Little Variation
% Clay 26.90 Moderate Variation
pH 7.7 Little Variation
% Org Matter 45.9 Moderate Variation
Total Nitrogen 44 Moderate Variation
T.E.A. 12.26 Little Variation
T.E.B. 4.06 Little Variation
Key; T.E.A. – Total Exchangeable Acidity, T.E.B.- Total Exchangeable Bases, Avai.- Available, CV- Coefficient of Variation.
Chikere-Njoku Characterization And Classification...,
FUTO Journal Series (FUTOJNLS), 2015, VOL. 1, Issue 2 107p-ISSN: 2467-8325; e-ISSN: 2476-8456

TABLE 4: Variability of Soil Properties Down the Profile. SOIL PROPERTIES CV (%) RANKING (Aweto,1980)
UPPER SLOPE
% Sand 4.97 Little Variation % Clay 16.01 Little Variation pH 4.28 Little Variation Org. Matter 20.30 Moderate Variation Total Nitrogen 55.20 High Variation Avai. Phosphorus 4.20 Little Variation T.E.B 11.80 Little Variation T.E.B 13.00 Little Variation
MID SLOPE % Sand 2.90 Little Variation % Clay 5.70 Little Variation pH 0.80 Little Variation Org. Matter 53.50 High Variation Total Nitrogen 9.93 Little Variation Avai. Phosphorus 3.40 Little Variation T.E.B 3.30 Little Variation T.E.B 4.36 Little Variation
FOOT SLOPE % Sand 13.50 Little Variation % Clay 29.79 Little Variation pH 10.12 Little Variation Org. Matter 16.10 Little Variation Total Nitrogen 6.19 Little Variation Avai. Phosphorus 10.70 Little Variation T.E.B 13.10 Little Variation T.E.B 22 Little Variation
Table 5: Correlation of Selected Soil Properties Down the Profile Soil Properties r Interpretation
UPPER SLOPE O.M Vs Total N. 0.97 Strong positive correlation O.M.Vs Avai. P -0.20 Weak negative correlation pHVs E.C.E.C -0.16 Weak negative correlation pHVs O.M -0.10 Weak negative correlation
pHVs T.E.B -0.4 Weak negative correlation MID SLOPE O.M Vs Total N. 1.0 Strong positive correlation O.M. VsAvai. P -O.065 Weak negative correlation pHVs E.C.E.C -0.44 Weak negative correlation pHVs O.M. -0.90 Strong positive correlation phVs T.E.B -0.36 Weak negative correlation FOOT SLOPE O.M Vs Total N. 0.8 Strong positive correlation O.M. VsAvai.P 0.96 Strong positive correlation pHVs E.C.E.C 0.98 Strong positive correlation pHVs O.M 0.93 Strong positive correlation pHVs T.E.B 0.67 Strong positive correlation
Key:O.M.- Organic matter, r – correlation, N-nitrogen, P-phosphorus, E.C.E.C – effective cation exchange capacity, T.E.B- total base saturation.
Chikere-Njoku Characterization And Classification...,
FUTO Journal Series (FUTOJNLS), 2015, VOL. 1, Issue 2 108p-ISSN: 2467-8325; e-ISSN: 2476-8456

3.5 Correlation between some soil propertiesThe correlation of some selected soil properties down the profile is shown in Tab. 5. There was strong positive correlation relationship between total nitrogen and soil organic matter at each slope level. This indicates that SOM must be a great reservoir for nitrogen in slope levels. SOM and available phosphorus, pH (H 0), E.C.E.C; pH (H 0)and T.E.B. showed weak negative correlation 2
at the upper slope. Similarly, in the mid slope, SOM and available phosphorus, pH and E.C.E.C; pH and T.E.B. showed weak negative correlation variation while pH (H 0) and SOM showed strong negative 2
relation. By implication, it is not actually slope level (topography) that influences the availability of nutrient elements in the upper or mid slopes levels rather, other possible considerable factors.
However, in the foot slope, strong positive correlation existed between the selected soil properties. This suggests the ability of nutrient elements to influence each other particularly is in the foot slope level. Typically, Ogban et al., 1999, had reviewed relationship existing between soil nutrient and topography and reported that nutrient status and soil properties are related to the land area.
3.6 Soil classificationIn Pedon A, there was formation of argillic horizon as a result of clay migration. It has bright coloration and acidic (pH> 6.5) soil reaction may be while due to possible possibly translocation of basic nutrient from anthropogenic activity occurring in the topsoil, it has base saturation greater than 35%. Also, it developed under moist condition in warm tropical climates.
The mid slope (Pedon B), had similar all the characteristics noticed with pedon A.In the foot slope (Pedon C), there was presence of few diagnostic horizon suggesting characteristics of an inceptisol. The soil was developed under aquic moisture regime because it is usually saturated with water up to 90 consecutive days.
Thus, according to the diagnostic criteria for classification as adopted by USDA soil taxonomy (Soil Survey Staff, 2003), both soils of Pedon A, B and C as studied are classified as typic Haplauduct.
4.0 ConclusionThe variation in the top soil properties from the upper slope, mid slope and foot slope position was not quite remarkable probably because there was a considerable distance between the three positions. However, some of the morphological properties
2
such as colour, consistency varied to a little degree over the slope while sand particle dominated the foot slope due to intense sedimentation from slope. Silt and clay fractions were low in all the profiles.All the soils were acidic with low soil chemical fertility variables except with avail P. that ranked medium to high levels in the soils. Positive correlation among soil properties only occurred in the foot slope not in the upper and mid slope with the exception of on soil and TN that were high in all slope positions. Because of the poor fertility status of these soil applications of organic matter and guided fertilizer use in the area are is strongly recommended. Also, agricultural practices involving agro forestry, alley cropping, mulching should be adopted while vegetative barriers as natural terraces should be used to control run-off water via erosion.
References
Ashaye, T. Y. (1969). Sesquioxides status and particle size distribution in twelve Nigeria soils derived from sand stones. African soils 14, 85 - 96.
Aweto A.O.(1980). Variability of upper slope soil development on sand stone in South western Nigeria. The Nigeria geographical journal 25,27-37.
Benning,T.L. & Seastedt, T.R. (1995). Land scape level interactions between topographic features and nitrogen limitation in tall grass prairie. Landscape. Ecol.10,337-348.
Brady, N. C., & Weil, R.R. (2002): The nature and properties of soil 43th ed, Prentice Hall. New Jessey, U.S.A.
Bremmer J.M. (1965). Total Nitrogen In C.A Black. Method of Soil Analysis. Part 2 Amer. Soc.
Bremmer, J.M. & Mulvaney, C.S. (1982). Total nitrogen. In: method of soil analysis part 2,ed. A.L. Page, et al., American Society of Agronomy. Madison,W.E.595-624.
Brubakar, S.C., Jones, A.A., Lewis D.T. & Frank.K. (1993). Soil properties associated with landscape position. Soil Science Soc. Am J. 57,235-239.
Fasina, A.S, Aruleba, J.O., Omolayo., F.O., Shittu, O.S. & Okusami, Y.A. (2005). Properties and classification of five soils formed on granatic parent materials of humid Southwest Nigeria. Nigeria Journal of Soil
Chikere-Njoku Characterization And Classification...,
FUTO Journal Series (FUTOJNLS), 2015, VOL. 1, Issue 2 109p-ISSN: 2467-8325; e-ISSN: 2476-8456

Science.15(2),21-29.Food and Agriculture organization of the United
Nations(FAO) (1998). The tropical forestry Action plan. Rome: UN Food and Agricultural Organization.
Gee, G.W. & D. Or (2002).Particle size analysis. In J.H. Dane, and G.C. Topps (eds). Methods of Soil analysis part 4, physical methods. Soil Sci. Soc. A handbook series No 5,SSSA,Madison, W., 255-293.
Igwe ,C. A. (2003). Assessment of potential soil loss and erodability in soils of Southern Nigeria. Tnt. Agrophy, 9,95-100.
Irvin B.J. (1996). Special information tools for delineating landform elements to support soil/landscape analysis. PhD. Thesis, University of Wisconsin-Madison 431.
Jackson, M.C. (1962). Soil chemical analysis determination of K+ and Na+, using flame photometry, 493 .
Jan Seibert, Johan Stenda,W. Rasmus Sorensen. (2007), Topographical influence on soil properties in boreal forest. Geoderma 141,139-148.
Juo, A.S.R., & Kathrin, F. (2003). Tropical soil properties and management for sustainable Agriculture, 127-128.
Mclean, E.O. (1982). Soil pH determination. In phase (ed) method of soil analysis part 2 Chemical analysis. Agronomy Series, No 9 ASA and SSSA Maidson, W.I. USA.
Nelson, D.W. & Sommers, L.E (1982). Total carbon, organic carbon, and organic matter In: A.L, Page, R.H. Miller, & D.R. Veeney Soil methods of soil analysis. Chemical method ASA and SSSA, Madison 39, 1085-1121.
Oderneho F.O. (1980). Catenary sequence and agriculture productivity in the tropics. Paper presentation at the conference of the 8th Joint Annual National Soil Correlation Committee. Soil SG. Society of Nigeria. 15.
Ofomata, G.E.K. (1975) Landform of Nigeria in Map: Eastern States. G.E.K Ofomata, . (Ed), Ethiope Publishing House Benin: 31-34.
Olsen, S.R. & Sommer, L. E., (1982): Phosphorus In;
A.L., Miller, R.H., & D.R. Keeney, (Ed), Method of Soil Analysis Part 2. Am Soc. Agron. Madison, WI, 403-430.
Orajaka, S.O.(1975). Geology. In: Nigeria in maps, Eastern States. Ofomata, G.E.K.(ed). Benin City. Ethiope Publishing House, 5-7.
Silver, W.L. Seatena, F.N.J. Johnson, A.H. Siccama, T. & GandSanchez, M.J. (1994). Nutrient availability in a Montane wet tropical forest. Spatial patterns and methodolological considrerations. Plant/Soil 164:129-146.
Soil Survey Staff (2003) .Keys to Soil taxanomy. A basic system of soil classification for making and interpreting soil surveys. Agricultural handbook 436.U.SDepartment of Agriculture.Soil Conservation Service. Washinghton D.C. 18-22.
Stoop W.A.(1978).Adaptation of Sorghum Maize and Sorghum Pear Millet intercrop to the toposequence land type in North Sudania zone of West African Savannah. Field Crops Research 16, 225-272.
Temitope, A.O. (2003): Catena/Toposequence. Soil Association Unifying concept in Soil Classification, Soil Genesis and Land Use in the West Africa Sub-region, Nigeria. Interdependency of soil and soil scape.
thTheater 18 world Congress of soil science. 6,1-2.
Udo, E. J. (1980). Profile distribution of Iron sesquoxides contents in selected Nigeria soils. Journal Agricultural Science of Cambridge 95, 191- 198.
Unamba-Oparah, I.M.J. Wilson I. & Smith, B.F.I. Smith,(1987). Exchangeable cations and mineralogy of some selected Nigeria Soil. Applied Clay Science 2:105-125.
Wild,(1999). Soil and environment. An introduction : Cambridge University Press.
Chikere-Njoku Characterization And Classification...,
FUTO Journal Series (FUTOJNLS), 2015, VOL. 1, Issue 2 110p-ISSN: 2467-8325; e-ISSN: 2476-8456