hydrodynamic characterization of soils within a representative
TRANSCRIPT

Evolving Water Resources Systems: Understanding, Predicting and Managing Water–Society Interactions Proceedings of ICWRS2014, Bologna, Italy, June 2014 (IAHS Publ. 364, 2014).
94
Hydrodynamic characterization of soils within a representative watershed in northeast Brazil ERIKA G. SALES, CRISTIANO DAS N. ALMEIDA, AMANDA S. FARIAS & VICTOR H. R. COELHO Federal University of Paraíba, Av. Cap. João Freire, 620, CEP: 58.041-060 – João Pessoa, PB, Brazil [email protected] Abstract Studies about the infiltration of water in the soil, based on hydraulic conductivity and retention curve, are important to simulate hydrological processes and pollution fluxes. This paper aims to present the hydrodynamic soil behaviour of the Gramame watershed, located in northeast Brazil. This basin is representative of several other watersheds located on the coastal region of northeast Brazil, where sugarcane crops constitute the main land use. For this study, three different land uses and land covers were considered: sugarcane crops, pineapple crops and Atlantic Forest, which is the native forest of this region. The Beerkan method and the BEST program were used in order to get retention and hydraulic conductivity curves. The results show that the highest values of hydraulic conductivity were obtained at points located in native vegetation and deforestation impacts the soil hydrodynamic characteristics. Key words infiltration; Atlantic Forest; Beerkan method; Brazil INTRODUCTION The infiltration rate in the soil determines the physical aspects that influence the capacity of water storage. Studies on the infiltration rate into the soil, based on hydraulic characteristic curves (hydraulic conductivity curve and water retention curve), give support to model the hydrological processes and transport of contaminants (Xu et al. 2009, Bagarello and Lovino 2012). The knowledge about these soil/water characteristics may improve agricultural use, since some practices can significantly affect the topsoil layers and associated hydraulic properties, reducing the micro pores and increasing bulk density (Gonzalez-Sosa et al. 2010, Mubarak et al. 2010). However, the determination of these characteristics involves the collection of a vast amount of information in the field and laboratory testing, making the procedure quite time consuming and laborious (Bagarello et al. 2009). Several methods have been developed for the determination of hydraulic characteristics, with different degrees of accuracy and experimental effort (Bagarello and Lovino 2012), but the high cost embedded in more complex processes, using laboratory equipment, often makes its application impracticable (Santos et al. 2012). Trying to reduce the costs of field work, some researchers have developed low cost efficient methods, such as the Beerkan method (Haverkamp et al. 1994, Braud et al. 2005). This method proposes the estimation of the parameters of the water retention curve θ(h), where θ is the soil water content and h is the pressure head, and the hydraulic conductivity curve K(θ) based on the soil texture and structure, where K is the hydraulic conductivity. More recently, Lassabatère et al. (2006) developed the BEST algorithm (Beerkan Estimation of Soil Transfer Parameters through Infiltration Experiments) to calculate the analytical formulas of hydraulic characteristic curves (Burdine 1953, Brooks and Corey 1964, van Genuchten 1980) and estimate their shape parameters and scale parameters from field infiltration experiments at a null pressure (Haverkamp et al. 1999). Due to its practicality, several studies have been carried out with BEST to characterize the hydraulic properties of different types of soils in different regions of the planet, such as those carried out by Lassabatère et al. (2006), Xu et al. (2009), Lassabatère et al. (2010), Mubarak et al. (2010) and Bagarello et al. (2012). In the Brazilian northeast, some studies were also carried out using the BEST to calculate the shape parameters of retention and conductivity curves in areas with different soil types, all with satisfactory results (Souza et al. 2008, Furtunato et al. 2012, Santos et al. 2012). This paper aims to identify the behaviour of the infiltration capacity of the soil in a representative basin, River Gramame watershed, located in northeast Brazil, through infiltration tests using the Beerkan method and BEST algorithm, in areas with sugarcane crops and pineapple crops. Infiltration tests were also carried out, as a control, in areas with fragments of Atlantic Forest.
Copyright 2014 IAHS Press
doi:10.5194/piahs-364-94-2014

Hydrodynamic characterization of soils within a representative watershed in northeast Brazil
95
MATERIALS AND METHODS
The study was carried out in the Gramame River basin, a representative watershed with a drainage area of 590 km2, located in the coastal region of northeastern Brazil, between coordinates –7°11′ and –7°23′S, –34°48′ and –35°10′W (Fig. 1). In this basin there is a high rate of natural vegetation deforestation due to urbanization and land use for agricultural activities, e.g. sugarcane and pineapple crops. This watershed only has 15% of its natural vegetation. For this work, the hydraulic conductivity curve K(θ) and water retention curve θ(h) were obtained from infiltration tests, soil sample collection in the field and laboratory analyses. A total of 36 points were chosen to perform experiments within the watershed: 15 in areas with sugarcane crops, six in areas of pineapple crops, and 15 in the Atlantic Forest. However, 18 points (five in sugarcane crops, four in pineapple crops and nine in the Atlantic Forest area) were discarded due to problems related to infiltration curve stabilization. Indeed, these points have not reached the steady state, as shown in the example reported in Fig. 2(a) for an infiltration test carried out in the sugarcane area. An example of infiltration curve reaching steady state for an Atlantic Forest area is shown in Fig. 2(b).
Fig. 1 Study area location (Gramame River basin) and infiltration test points.
Fig. 2 Infiltration curve behaviour: (a) transient state and (b) steady state. Beerkan method
In the Beerkan method the curves θ(h) and K(θ) can be described by five parameters, two shape and three scale parameters (Haverkamp et al. 1994, Lassabatere et al. 2006). The shape parameters (N and M, equation (1)) are dependent on the soil texture, and were obtained from the particle-size analyses, i.e. curve F(D) of the soil samples. F(D) is the cumulative frequency associated with diameter (D), according the following equation:
(a) (b)

Erika G.Sales et al.
96
𝐹𝐹(𝐷𝐷) = [1 + (𝐷𝐷𝐷𝐷𝐷𝐷
)𝑁𝑁]−𝑀𝑀 (1)
The scale parameters depend on an infiltration test at null pressures head (Haverkamp et al. 1999). The Beerkan method uses the Van Genuchten (1980) and Brooks and Corey (1964) models to describe the retention curve θ(h) and the hydraulic conductivity curve K(θ), as shown in equations (2) and (3), respectively:
� θ−θrθs−θr
� = �1+ � hhg�
n�
-m where m = 1 – 2
n (2)
K(θ)=Ks �θ-θrθs-θr
�η (3)
where θ is the water content [L3L-3]; θr and θs are the residual water content and the saturated final water content, respectively [L3L-3], h is the pressure head [L]; hg [L] is the scale parameter for pressure head (h); n, m and η are the hydraulic shape parameters and KS is the hydraulic conductivity [LT-1]. The shape parameters and scale parameters are determined by the BEST algorithm. In order to apply these equations, a field experiment has to be carried out, it consists of: an infiltration test with a simple annular ring and soil sample collection for particle-size analysis, determination of initial gravimetric water content, soil bulk density and saturated gravimetric water content. The infiltration test is carried out with a set of fixed volumes of water that are poured into the annular ring. The time of infiltration of every fixed volume of water is registered and it is repeated until the steady state is reached. If the steady state is not reached after about 15 repetitions, the experiment is considered failed to this point. More information can be found in Lassabatère et al. (2006). RESULTS AND DISCUSSION
From particle-size analysis of soil samples, there is, in general, a similar percentage of sand among the three land uses. Other soil types were not analysed. Indeed, most of the points obtained more than 70% of sand in their composition. The highest percentage (96.45%) was obtained in the Atlantic Forest. The exception was a single point, where the experiment was carried out in an area of Atlantic Forest and had just over 40% of sand in its composition, as can be seen in Table 1. Table 1 Percentage of sand according to the land uses. Land use % of sand PINEAPPLE 78.00
76.84 68.07 80.29
SUGARCANE 95.85 88.82 90.06 89.30 88.59
RAINY FOREST 78.64 70.40 44.45 83.57 96.45 91.15 88.37 85.10 58.14
Hydrodynamic characterization of soils within a representative watershed in northeast Brazil
97
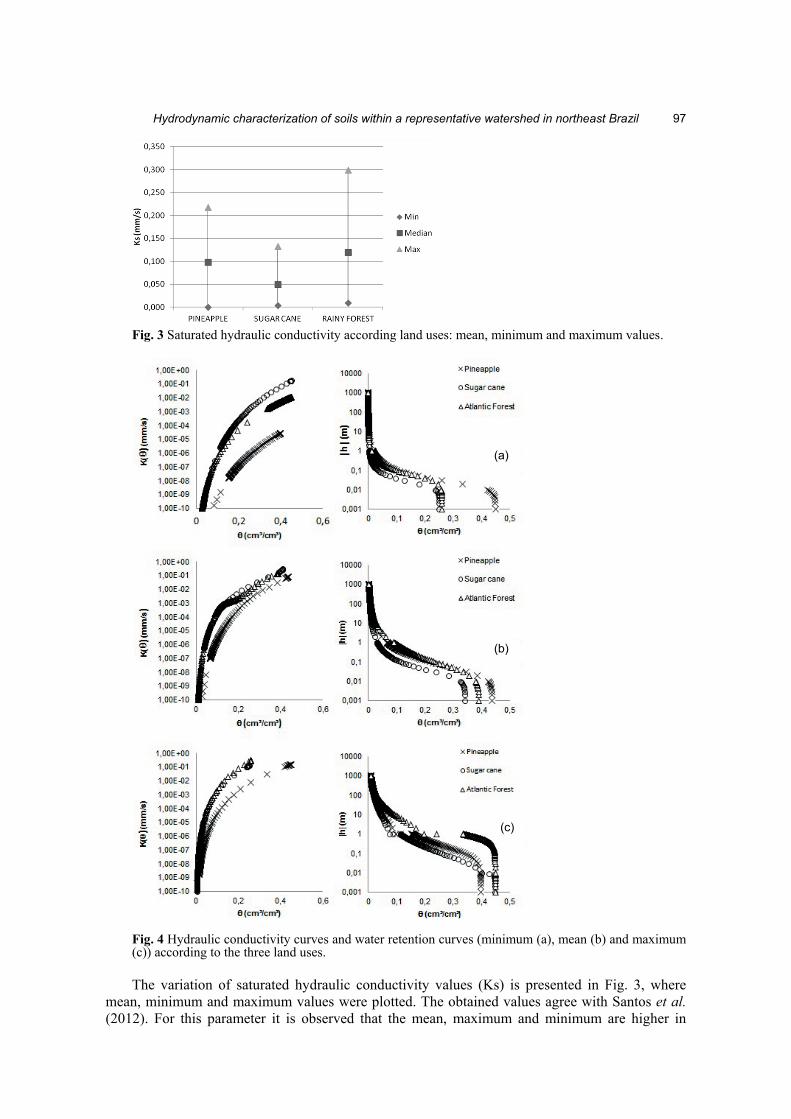
Fig. 3 Saturated hydraulic conductivity according land uses: mean, minimum and maximum values.
Fig. 4 Hydraulic conductivity curves and water retention curves (minimum (a), mean (b) and maximum (c)) according to the three land uses.
The variation of saturated hydraulic conductivity values (Ks) is presented in Fig. 3, where mean, minimum and maximum values were plotted. The obtained values agree with Santos et al. (2012). For this parameter it is observed that the mean, maximum and minimum are higher in
(a)
(b)
(c)

Erika G.Sales et al.
98
areas of the Atlantic Forest. The analyses of this figure suggests that in the Atlantic Forest the infiltration process is easier than in the other compared land uses, in other words it means that the recharge process is higher in these areas than in the others. Hydraulic conductivity curves and water retention curves are plotted in Fig. 4(a)–(c), which shows the mean, minimum and maximum of these curves for pineapple, sugarcane and Atlantic Forest. Mean, minimum and maximum hydraulic conductivity curves have the same behaviour for sugarcane and Atlantic Forest uses. Just the mean curve presents different behaviour when the volumetric water content reaches a value of 0.1 cm3 cm-3. The behaviour of pineapple curves (mean, minimum and maximum) are the same, the three curves of pineapple are below the others which implies that hydraulic conductivity values are smaller for pineapple areas than sugarcane and Atlantic Forest. The similar behaviour of the sugarcane and Atlantic Forest curves may be due to the soil treatment during the planting and harvesting of sugarcane, which increases the pores of vadose zone and consequently the hydraulic conductivity in the upper layers (Ceddia et al. 1999). In the case of water retention curves, they typically have a behaviour contrary to the hydraulic conductivity curves, on the assumption that areas with less infiltration capacity hold the infiltrated water with a higher proportion. In this case, the curves with lower hydraulic conductivity, i.e. pineapple and sugarcane, respectively, showed the greatest water retention. Pineapple curves (mean (a) and minimum (b)) present the highest values of water retention. Sugarcane curves (mean (a), minimum (b) and maximum (c)) present the lowest values of water retention; just the maximum curve has similar values when water retention is lower than 0.01 m. From this value, the behaviour is similar to the Atlantic Forest curve. Our results show that the hydraulic conductivity and the water retention in the soil were influenced by soil compaction, due to the land use, bulk density and the pore system of the soil. Human activities indeed cause pores size reduction or tend to decrease the pore sizes. Most of the points located on the Atlantic Forest had the highest hydraulic conductivities, but some points located on crops have presented high hydraulic conductivities. Thus, we find crop land uses to impact the hydraulic conductivity, while in the Atlantic Forest, due to vegetation cover, this impact is smaller. CONCLUSIONS
The methodology used in this study was fundamental for the evaluation of the hydrodynamic characteristics of soils. It was observed that the particle-size and the land use affect the processes of infiltration. Considering the 18 points used to describe the hydrodynamic characteristics of soils, areas within the Atlantic Forest showed the highest values of infiltration compared to the crop areas due to the particle-size distribution and land use. Some points were studied, but discarded because they did not reach the steady state; it was observed that the particle-size and the land use similarly interfered with the natural process of infiltration. In this case, this method cannot be used and another method has to be chosen. REFERENCES Bagarello, V., Provenzano, G. and Sgroi, A. (2009) Fitting particle size distribution models to data from Burundian soils for the
BEST procedure and other purposes. Biosystems Engineering 104, 435–441. Bagarello, V. and Lovino, M. (2012) Testing the BEST procedure to estimate the soil water retention curve. Geoderma 187–
188, 67–76. Bagarello, V., et al. (2012) Estimating field-saturated soil hydraulic conductivity by a simplified Beerkan infiltration
experiment. Hydrological Processes. Braud, I., et al. (2005) Use of scaled forms of the infiltration equation for the estimation of unsaturated soil hydraulic properties
(the Beerkan method). European Journal of Soil Science 56, 361–374. Brooks, R. H. and Corey, C. T. (1964) Hydraulic Properties of Porous Media. Hydrology Papers. Colorado State University,
Fort Collins. Burdine, N. T. (1953) Relative permeability calculation from pore size distribution data. Transactions of the American Institute
of Mining, Metallurgical, and Petroleum Engineers 198, 71–77. Furtunato, O. M., et al. (2013) Variabilidade espacial de atributos físico-hídricos de solos em uma bacia experimental no Estado
de Pernambuco. Revista Brasileira de Recursos Hídricos 18(2), 135–147.
Hydrodynamic characterization of soils within a representative watershed in northeast Brazil
99
Gonzalez-Sosa, E., et al. (2010) Impact of land use on the hydraulic properties of the topsoil in a small French catchment. Hydrological Processes 24, 2382–2399.
Haverkamp, R., et al. (1994) Three dimensional analysis of infiltration from the disc infiltrometer. 2. Physically based infiltration equation. Water Resources Research 30, 2931–2935.
Haverkamp, R., et al. (1999) Soil properties and moisture movement in the unsaturated zone. p. 2931–2935. In: The Handbook of Groundwater Engineering (ed. by J. W. Delleur (ed.). CRC, Boca Raton, FL.
Lassabatère, L., et al. (2006) Beerkan Estimation of Soil Transfer Parameters through Infiltration Experiments—BEST. Soil Science Society of America 70, 521–532.
Lassabatere, L., et al. (2010) Effect of the settlement of sediments on water infiltration in two urban infiltration basins. Geoderma 156, 316–325.
Mubarak, I., et al. (2010) Spatial analysis of soil surface hydraulic properties: Is infiltration method dependent? Agricultural Water Management 97, 1517–1526.
Santos, C. A. G., Silva, J. F. C. B. C. and Silva, R. M. (2012) Caracterização hidrodinâmica dos solos da bacia experimental do riacho Guaraíra utilizando o método Beerkan. Revista Brasileira de Recursos Hídricos 17(4), 149–160.
Souza, E. S., et al. (2008) Caracterização hidrodinâmica de solos: Aplicação do método Beerkan. Revista Brasileira de Engenharia Agrícola e Ambiental 12(2), 128–135.
Van Genuchten, M. T. (1980) A closed form equation for predicting the hydraulic conductivity of unsaturated soils. Soil Science Society of America Journal 44, 892–898.
Xu, X., Kiely, G., and Lewis, C. (2009) Estimation and analysis of soil hydraulic properties through infiltration experiments: comparison of BEST and DL fitting methods. Soil Use and Management 25, 354–361.