chapter two investment and political risk in … · chapter two investment and political risk in...
TRANSCRIPT
28 | MIGA WIPR REPORT 2010
CHAPTER TWO
INvESTMENT AND POLITICAL RISk
IN CONFLICT-AFFECTED AND FRAGILE ECONOMIES
MIGA WIPR REPORT 2010 | 29
Overview
Countries considered fragile and prone to conflict present unique challenges, caused not only by heightened risks of new or recurring political violence, but also by structural and institutional weak-nesses. As a result, the volume and composition of foreign capital flows to these countries is signifi-cantly different from patterns observed in developing countries in general. The econometric analysis pre-sented in this chapter suggests that conflict has a profound negative effect on the number of foreign direct investment (FDI) projects and, even more significantly, on their value. FDI accounts for the bulk of private capital flows to conflict-affected and fragile (CAF) countries because private debt and portfolio investment flows are minimal. FDI in CAF countries is heavily concentrated in a handful of economies, which are either middle income or rich in natural resources. Why some investors in the primary sector opt to invest and others do not, given similar risk perceptions, remains unclear.
In a context of conflict, investment decisions appear to be influenced to a large degree by the risk of asset destruction, of unavailability of local inputs and infrastructure, and of abrupt declines in domestic demand. Investors’ relative vulnerability to each of these channels helps explain the sector composition of FDI flows to CAF countries. This analytical framework provides only partial answers. Sectors such as extractive industries and telecom-munications—typically large FDI recipients in CAF economies—appear to be outliers when it comes to investor behavior. This finding suggests that other investment considerations, such as geological con-straints, the potential for high returns on investment, payback periods, and the ability to mitigate political risk, also weigh heavily on investment decisions.
While the risk of civil disturbance is ranked higher in CAF economies than in developing countries in general, investors are more concerned about the risk of adverse government interventions—regulatory
changes, non-honoring of sovereign guarantees, currency restrictions, expropriation, and breach of contract—than about political violence, such as civil disturbance, war, and terrorism. This concern reflects the close correlation between structural and institu-tional weaknesses and conflict in these countries.
Conflict-Affected and Fragile Economies
There is no single definition of CAF states. For the purpose of this report, CAF economies include the group of countries and territories identified by the political risk insurance (PRI) industry as carrying the highest risk of political violence as of January 1, 2010 (see appendix 3). Among these economies, 18 are considered economically dependent on natural resources.1 This group overlaps partly with the low-income countries and territories identified by the World Bank as fragile and needing special assistance, according to (i) the World Bank’s Country Policy and Institutional Assessment (CPIA) index,2 or (ii) the presence of a United Nations or a regional peace-keeping or peace-building mission or both during the past three years.
Conflict—defined as a violent “clash between two opposing groups”3—has followed diverging trends in recent years; while interstate violence has declined, internal conflict (e.g., civil wars, separatist tensions, and terrorism) has been on the rise. In all cases, conflict is inversely correlated with per capita incomes, and low-income countries are more at risk of violence.4 According to the World Bank, poverty affects 54 percent of people living in CAF states, compared to 22 percent in low-income countries as a whole.5 While violence often breeds poverty, the link between low income and conflict goes both ways. Some evidence suggests that worsening economic circumstances, economic shocks, or natural catastrophes can foster political violence.6 This evidence also applies to the subnational level,
30 | MIGA WIPR REPORT 2010
with poorer regions within a country being more prone to conflict than wealthier ones.7
According to the World Bank’s forthcoming World Development Report 2011, conflict and fragility are also closely correlated, with fragility indicating a high risk of new conflict or of recurring violence. CAF investment destinations face challenges that not only are limited to conflict per se, but also include weak or non-existent state institutions, inad-equate infrastructure, disruptions to supply chains, demand shocks, and difficulty obtaining private debt financing. In countries experiencing conflict or fra-gility, the economic performance and the ability to deliver basic social services are weak, reflecting poor policies and institutions. In addition, during periods of intense conflict, these economies tend to receive considerably less external assistance than other low-income countries, and their relations with the inter-national financial community are often complicated by high levels of debt and protracted arrears. Some of these constraints are supported by the findings of the surveys commissioned by the Multilateral Investment Guarantee Agency (MIGA) and are cited in this chapter.
A reduction in conflict and a return to political stability often result in improved economic per-formance. Conversely, economic growth and devel-opment are essential to reduce the risk of conflict. By one estimate, a doubling of per capita income
roughly halves the risk of civil war, and each point improvement in the CPIA index increases the economic growth rate by 1.25 percentage points.8 Fostering a virtuous cycle of reconciliation and economic development once violence has broken out is particularly challenging. Some 40 percent of countries coming out of conflict relapse into fighting within 10 years,9 and around half of all civil wars are due to postconflict relapses.10 Besides being prone to conflict and instability at home, CAF countries can also destabilize entire regions through refugee flows and barriers to trade and investment.
Foreign capital can contribute to economic growth and development and, therefore, ease fragility and the risk of conflict. Not only can foreign investment increase these countries’ productive capacity and generate employment, but also it has the potential to promote the dissemination of managerial and technological expertise that contributes to local firms’ improved productivity and competitiveness. It can also generate positive spillovers by fostering local supplier sales and can provide access to international markets.
This chapter seeks to understand the drivers and characteristics of FDI in CAF economies, as well as how investors perceive and mitigate political risk in these destinations.
Table 2.1 Capital flows to CAF economies $ million
2005 2006 2007 2008 2009e 2010f
Net private and official inflows 17,283 32,514 38,861 31,909 33,313 –
Net private inflows (equity + debt) 16,719 30,951 37,045 26,967 24,905 -
Net FDI inflows 14,909 26,353 30,207 28,828 25,192 28,971
Net portfolio equity inflows 1,230 3,035 2,734 (1,104) 5 –
Net debt flows: Official creditors 564 1,563 1,816 4,942 8,408 –
Net debt flows: Private creditors 580 1,563 4,105 (757) (292) –
Official development assistance (OECD Development Assistance Committee)
39,768 32,597 24,664 27,577 – –
Worker remittances 16,894 21,340 28,767 34,129 34,076 –
Source: World Bank estimates. Note: e=estimate; f=forecast; –=not available.
MIGA WIPR REPORT 2010 | 31
Capital Flows and FDI Trends in CAF Economies
Because of the challenges outlined earlier, the nature of capital flows to CAF economies diverge from those observed in developing countries in general, where private financial flows—and FDI in particular—con-stitute the main source of foreign capital (chapter 1). In CAF economies, workers’ remittances have become the main source of foreign capital since 2008, over-shadowing foreign aid and FDI (table 2.1). These economies also rely more heavily on foreign aid than do other developing countries.
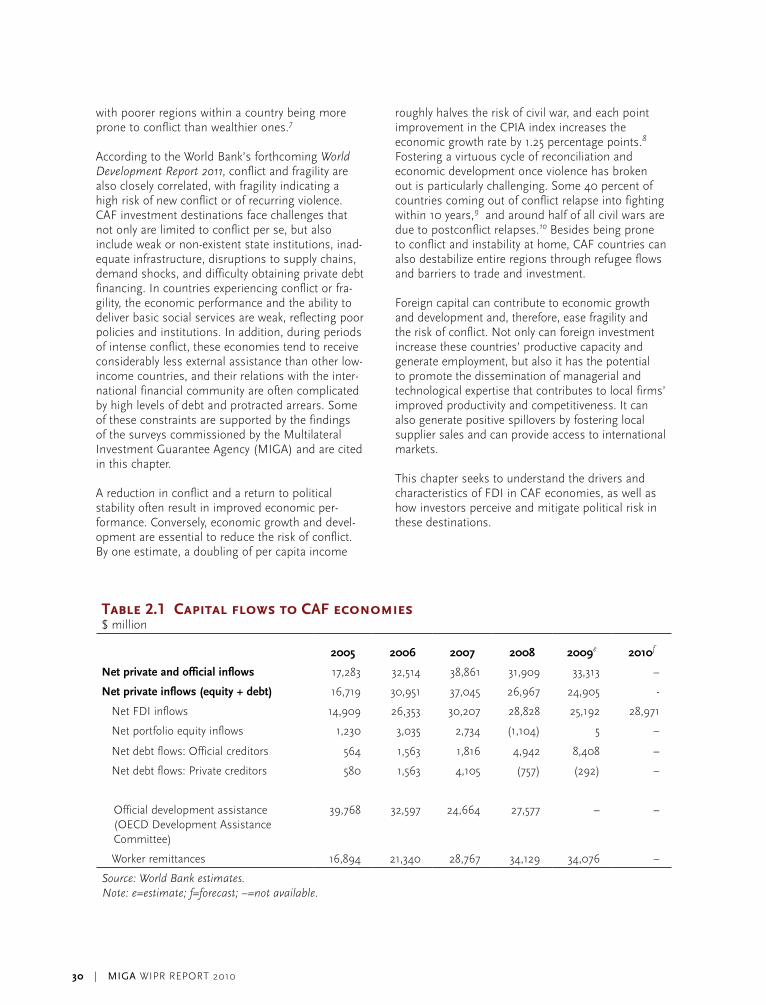
Although foreign aid and international private investment are significant sources of capital flows to CAF countries, their timing tends to be different. Foreign aid, mostly grants, typically make up the bulk of foreign capital in the few years immediately following a period of conflict (figure 2.1). According to the Organisation for Economic Co-operation and Development (OECD),11 most aid flows to countries as soon as conflict ceases but falls off in subsequent years, just as management capacity to administer aid improves. Private investment, however, picks up when foreign aid flows begin to wane. Remarkably absent in this picture are private debt flows, which shy away from most CAF economies in light of the perceived risk and structural weaknesses that often include weak financial systems.
Figure 2.1 Timeline of foreign aid and investment flows in postconflict states
Remittances
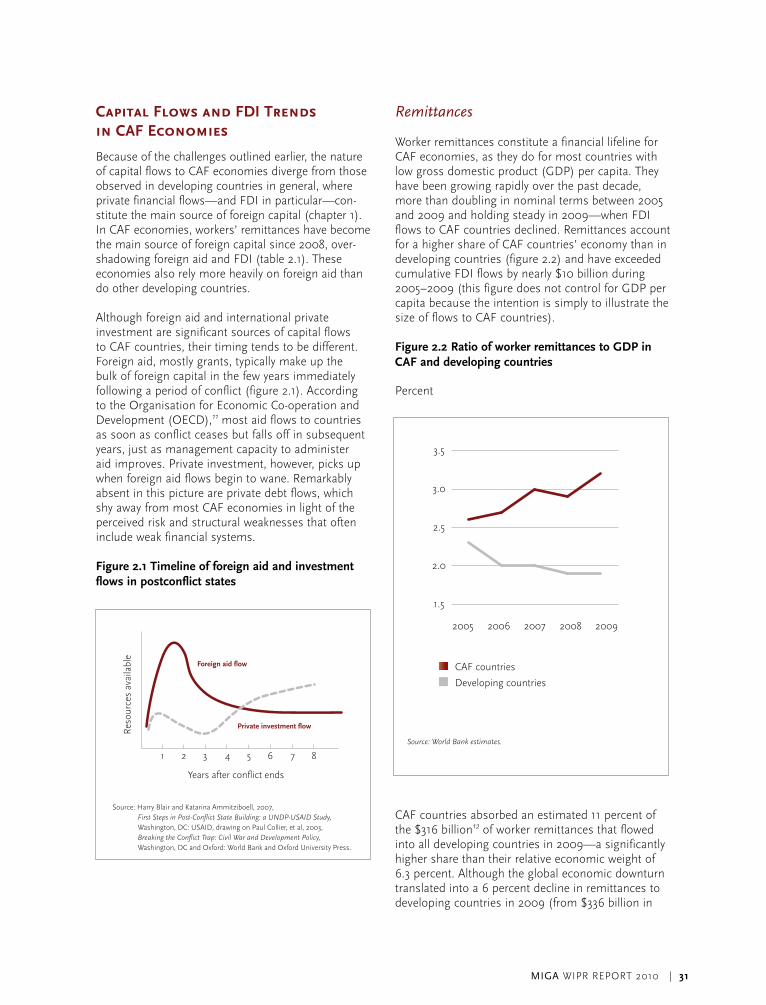
Worker remittances constitute a financial lifeline for CAF economies, as they do for most countries with low gross domestic product (GDP) per capita. They have been growing rapidly over the past decade, more than doubling in nominal terms between 2005 and 2009 and holding steady in 2009—when FDI flows to CAF countries declined. Remittances account for a higher share of CAF countries’ economy than in developing countries (figure 2.2) and have exceeded cumulative FDI flows by nearly $10 billion during 2005–2009 (this figure does not control for GDP per capita because the intention is simply to illustrate the size of flows to CAF countries).
Figure 2.2 Ratio of worker remittances to GDP in CAF and developing countries
Percent
CAF countries absorbed an estimated 11 percent of the $316 billion12 of worker remittances that flowed into all developing countries in 2009—a significantly higher share than their relative economic weight of 6.3 percent. Although the global economic downturn translated into a 6 percent decline in remittances to developing countries in 2009 (from $336 billion in
Figure 2.1. Timeline of foreign aid and investment flows in post-conflict states
Years after conflict ends
Source: Harry Blair and Katarina Ammitziboell, 2007, First Steps in Post-Conflict State Building: a UNDP-USAID Study,Washington, DC: USAID, drawing on Paul Collier, et al, 2003, Breaking the Conflict Trap: Civil War and Development Policy,Washington, DC and Oxford: World Bank and Oxford University Press.
Res
ourc
es a
vaila
ble
Foreign aid flow
Private investment flow
1 2 3 4 5 6 7 8
Figure 2.2 Worker remittances as a share of GDP in CAF and developing countries
CAF countries
Developing countries
2005 2006 2007 2008 2009
1.5
2.0
2.5
3.0
3.5
Source: World Bank estimates.

32 | MIGA WIPR REPORT 2010
2008), these flows held up better in CAF countries. With improved prospects for the global economy, remittances to developing countries are expected to increase by 6 percent in 2010 and 7 percent in 2011, and they should continue to be a key source of foreign capital to CAF economies.
Foreign Assistance
Foreign assistance also constitutes a significant source of external financing for CAF countries, and cumulative official development assistance (ODA) flows to CAF countries were on average 24 percent higher than FDI flows during 2005–2008 (table 2.1). During 2005–2008, CAF countries received 28 percent of cumulative ODA flows from the OECD’s Development Assistance Committee (DAC), and this assistance accounted for a higher share of their economies than in developing countries in general (figure 2.3).
Figure 2.3 Ratio of ODA to GDP in CAF and developing countries
Percent
CAF countries also rely on aid from donor countries that are not members of the OECD’s DAC (such
as China, the Republic of korea, Saudi Arabia, and Turkey), as well as from global funds and private foundations. Aid from these donors has been growing rapidly. Bilateral aid to fragile states13 from the limited number of non-DAC donor countries14 that release data to the OECD is reported to have increased by 68 percent between 2004 and 2008.15
Aid to CAF economies from both the OECD’s DAC members and non-DAC donors, however, is heavily concentrated. Afghanistan and Iraq account for nearly half of all DAC assistance received by CAF economies during 2005–2008, with Iraq alone absorbing about 40 percent. The doubling of DAC aid flows to CAF countries between 2004 and 2005 was due to a nearly fivefold increase in aid to Iraq. Similarly, four countries (including Afghanistan, Iraq, and Sudan) accounted for almost three-quarters of emerging donors’ aid flows to fragile states in 2004–2008. In addition, some fragile states are overwhelmingly dependent on one or two donors for the bulk of the foreign aid they receive.
Official credit to CAF countries is small in absolute value ($17 billion accumulated during 2005–2009) and in relation to both ODA and FDI. Although official debt has more than quadrupled over the past two years (table 2.1), the trend is due to increased lending to a single country. New official debt is heavily concentrated in very few CAF countries, and official credit flows to some CAF economies is actually negative. In addition, most of these countries, especially those without natural resources, struggle to mobilize debt financing. On an aggregate level, the bulk of CAF countries’ bor-rowing is now official credit, especially because foreign private lending has collapsed and even turned negative since the onset of the financial crisis (table 2.1).
CAF economies’ external debt stock has historically been high in relation to both the size of their economies and vis-à-vis other developing countries. In each year between 2000 and 2003, their debt to gross national income ratio exceeded 40 percent, compared to roughly 30 percent for developing countries.16 Although debt flows to CAF countries are usually relatively small, arrears tend to accumulate during periods of conflict and result in fast-ballooning debt obligations.
By 2009, however, debt relief and arrears clearance had contributed to a convergence of the debt to gross national income ratio of around 17 percent for both CAF and developing countries. Debt relief
Figure 2.3 ODA to GDP ratio in CAF and developing countries
CAF countries
Developing countries
‘05 ‘06 ‘07 ‘08‘02 ‘03 ‘040
2
4
6
8
Source: World Bank estimates based on OECD DAC data.Note: ODA flows from members of the OECD’s DAC.

MIGA WIPR REPORT 2010 | 33
initiatives available to CAF economies include the Heavily Indebted Poor Countries (HIPC) Initiative, the Multilateral Debt Relief Initiative (MDRI), and the administration of the Debt Reduction Facility (for International Development Association [IDA]-only countries). The HIPC Initiative seeks to reduce debt to selected countries that are pursuing adjustment and reform programs, and to countries that are graduating from the process benefit from a 100-percent relief on eligible debt from major multilateral creditors. As of July 2010, 11 CAF states had reached the postcompletion point under this initiative, meaning that creditors have provided irrevocably debt relief. Bilateral debt is also worked out through the Paris Club, which provides excep-tional treatment such as deferral of all debt service payments for a specified number of years for CAF states affected by long-standing internal political conflicts.
Foreign Direct Investment
In light of the structural weaknesses outlined in the previous section, most CAF economies struggle to attract substantial foreign investment. In aggregate terms, CAF countries have absorbed between 5 and 8 percent of FDI into developing countries over the past half decade. This small share is broadly in line with their economic weight of 6–7 percent of developing countries’ GDP over the same period.
Aggregate FDI flows into CAF countries have largely followed global trends. They increased during the second half of the past decade, reaching a record $30 billion in 2007 (table 2.1) and declined by 5 and 13 percent in 2008 and 2009, respectively, on account of the global economic crisis. In relative terms, the decline of FDI to CAF countries was on average less pronounced than the 40 percent reduction observed in developing countries overall (chapter 1), reflecting the relative resilience of foreign investment in resource-rich economies.
As observed in developing countries in general (chapter 1), FDI flows into CAF countries are heavily concentrated in a few countries. During 2006–2009, the five largest recipients accounted for 60 percent of FDI flows to CAF countries, compared to 54 percent for all developing countries. Low-income countries, conversely, attracted only 15 percent of FDI inflows to CAF economies during 2005–2009.17 FDI to CAF economies has flowed primarily into resource-rich countries (figure 2.4). These economies accounted for 72 percent of inflows
during 2005–2009 on average and for as much as 90 percent in select years.
Figure 2.4 FDI flows into CAF countries
$ billion and percent
Sub-Saharan Africa—which accounts for 23 out of 43 CAF economies and most of the 18 resource-rich ones—absorbs more than two-fifths of FDI flows into CAF states. The United States is the largest source of foreign investment into economies, with a stock of FDI valued at around $11 billion as of 2008 (0.4 percent of its global outward stock).18 China’s FDI stock in CAF states stood at roughly $5 billion in 2008 (or 9 percent of its global outward stock).19
CAF countries’ regulatory framework applicable to FDI is diverse. Although all countries are open to FDI, a number of them restrict foreign ownership in individual sectors.20 At the same time, CAF countries had concluded 450 bilateral investment treaties (BITs) protecting FDI21 as of June 2010 (appendix 4). Their share in the universe of BITs exceeds their relative importance in FDI. Just over half of these
Figure 2.4 FDI flows into CAF countries
Resource-rich CAFs
Other CAFs
Percentage of developing-country FDI
accounted by CAF countries
0
5
10
15
20
25
30
35
0
2
4
6
8
10
Source: World Bank estimates.Note: e=estimate.
02 03 04 05 06 07 08 09e

34 | MIGA WIPR REPORT 2010
treaties were with developing countries and the remainder, with developed ones.22
Economic and business reform has been essential in attracting FDI into CAF states, in particular in the aftermath of conflict. In the 1990s, Croatia and Mozambique,23 for example, both implemented sig-nificant privatization programs at the end of their respective conflicts, laying the ground for FDI inflows.24 Yet, while several CAF economies have successfully implemented privatization programs to attract foreign investment and to stimulate the private sector, overall results have been mixed.25
Figure 2.5 Private capital flows into CAF and developing countries, cumulative 2005–2009
$ million
In spite of the small proportion of FDI they attract compared to other developing countries, CAF economies heavily depend on FDI as a source of foreign private capital (figure 2.5). With very limited access to private debt markets, FDI flows exceeded private debt by a factor of 24 during 2005–2009—compared to around two-thirds for developing countries overall (table 2.1 and chapter 1). The dearth of foreign private credit largely limits projects for CAF economies to those that are financed through
equity or are assisted by foreign donors. In addition, portfolio equity flows in CAF states are virtually non-existent apart from occasional spikes, largely reflecting the weakness of these economies’ financial systems.
Although FDI flows in developing countries dwarf those in CAF states, they account for a similar share of their economies on average (figure 2.6). The aggregate masks substantial variations. The ratio of FDI flows to GDP in some countries26 can be significantly higher than the average, often exceeding 10 percent. CAF economies not endowed with natural resources tend to rely more heavily on FDI than others.
Figure 2.6 Ratio of FDI to GDP in CAF and developing countries
Percent
FDI flows, conversely, account for a higher share of gross capital formation in CAF states than in developing countries in general (figure 2.7). This finding reflects low levels of capital formation and the depletion of inventories taking place during periods of conflict, as well as the weakness of local
Figure 2.5 Private capital flows in CAF and developing countries
Portfolio equity
Private debt
FDI
0
500
1,000
1,500
2,000
2,500
3,000
3,500
4,000
CAFcountries
Developingcountries
Source: World Bank estimates.
Figure 2.6 FDI to GDP ratio in CAF and developing countries
All CAFs
Resource-rich CAFs
Other CAFs
All developing countries
2005 2006 2007 2008 2009 20100
2
4
6
8
Source: World Bank estimates.

MIGA WIPR REPORT 2010 | 35
investment in most CAF economies. The gap has broadened since the onset of the global downturn, reflecting the relative resilience of FDI flows to CAF countries compared to developing ones. As men-tioned earlier, a significant portion of these aggregate flows are invested in the extractives industries, and investment projects in that sector usually have opera-tional durations that last for decades. Therefore, they suffer less acute fluctuations of flows on a year-by-year basis.
Figure 2.7 Ratio of FDI to gross capital formation in CAF and developing countries
Percent
The outlook for foreign investment in CAF countries is expected to improve as the global economy and FDI to developing countries show signs of recovery. These economies are not expected to increase their share of FDI. However, their combined FDI inflows are projected to reach $29 billion in 2010—or 7 percent of flows to all developing countries—up from $25 billion in 2009.27
Investor surveys conducted on behalf of MIGA for this report support the general FDI outlook for CAF countries. In addition to the MIGA-EIU Political Risk Survey 2010, MIGA commissioned a survey
of investors already involved in CAF countries (the MIGA-EIU CAF Investors Survey) representing 60 multinational enterprises (MNEs) with investments in at least one CAF country conducted in July 2010 (appendix 6). The overwhelming majority of responses from the MIGA-EIU CAF Investors Survey, which indicated intentions to maintain or increase their investments over the next 12 months, showed a small proportion intending to decrease their financial involvement (figure 2.8).
Figure 2.8 Investment intentions of investors operating in CAF countries
Percent of responses
In addition, almost 40 percent of all respondents in the MIGA-EIU Political Risk Survey 2010 intend to invest in at least one CAF country within the next three years, a slightly higher proportion than those already operating in these countries. The CAF destinations where the largest proportion of MNEs intends to invest are generally middle income or rich in natural resources (figure 2.9), confirming past FDI patterns in this group of countries.
The proportion of respondents operating in the primary sector (57 percent) that intended to invest in CAF economies over the medium term was signifi-cantly higher than in other sectors. Continued interest from extractive industries in those investment des-tinations reflects the global geography of mineral deposits, as well as long investment horizons. That these MNEs have limited choices in their investment destinations compared to other sectors impacts their attitude to political risk, as well as the way they manage it, as outlined in the following section.
Figure 2.7 FDI to gross capital formation ratio in CAF and developing countries
CAF countries
Developing countries
02 03 04 05 06 07 08 090
5
10
15
20
25
30
35
Source: World Bank estimates.
Figure 2.8 Investment intentions from investors operating in CAF countries
Increase
Maintain
Decrease
0 20 40 60 80
Source: MIGA-EIU CAF Investors Survey.

36 | MIGA WIPR REPORT 2010
Figure 2.9 Top 15 investment destinations among the countries in the top two political violence cat-egories over the next three years
Percent of respondents
Political Risk Perceptions in CAF Economies
Although the link between political risk and FDI is far from straightforward, there is little dispute that risk perceptions influence foreign investment. A better understanding of investors’ attitude toward political risk in CAF countries and how they manage it could, therefore, help illuminate their investment behavior. The reaction of investors to political perils in CAF countries, as manifested by the trends in FDI in these countries, is not uniform.
The literature on conflict has not focused much on foreign investors’ reaction to, and mitigation of, political perils (see appendix 5 for a review of the literature). There are indications that various types of conflict affect FDI differently. In addition, most CAF countries, as noted earlier, suffer from structural weaknesses that are also likely to affect risk per-ceptions besides political violence.
FDI flows in Côte d’Ivoire during a 20-year period (figure 2.10) illustrate the typical impact of conflict on investment flows. Although the anticipated 1994
devaluation of the CFA franc had a severe negative impact on FDI, the decline was very short lived, and Côte d’Ivoire attracted sizable FDI inflows during most of the second half of the decade, when the country was still largely considered as a model of sta-bility. The eruption of political conflict toward the end of the 1990s, however, resulted in a decline in FDI flows. Yet, FDI flows remained positive, most likely because violence was largely contained to a limited part of the country. Foreign investment continued to mirror Côte d’Ivoire’s political situation, with an upswing following the creation of a government of national unity in 2002.
Figure 2.10 FDI flows in Côte d’Ivoire
$ million
To better understand the impact of conflict and fra-gility on the perception and management of political risk, MIGA gauged the responses of investors involved in CAF countries (the MIGA-EIU CAF Investors Survey, see appendix 6). Those findings complement the findings of the MIGA-EIU Political Risk Survey 2010 (chapter 1 and appendix 2).
When compared to other investment challenges, political risk appears to be a far more salient issue for investors in CAF countries than for those operating in developing markets in general. A third of respondents considered it as the main obstacle to investing in CAF destinations (figure 2.11). Obstacles indirectly related to conflict and fragility—such as limited market size and, to a lesser extent, weak gov-
Figure 2.10 FDI flows inCôte d’Ivoire
90 95 00 05 10-300
-200
-100
0
100
200
300
400
500
Source: World Bank estimates.
Figure 2.9 Top 15 CAF investment destinations over the next three years
Iraq Georgia Nigeria
Bosnia and Herzegovina Iran, Islamic Rep.
Pakistan Afghanistan
Central African Rep. Congo, Dem. Rep.
Haiti Kosovo
Uzbekistan Angola
Cameroon Côte d'Ivoire
0 2 4 6 8 10
Source: MIGA-EIU Political Risk Survey 2010.

MIGA WIPR REPORT 2010 | 37
ernment institutions—also rank somewhat higher for investors in CAF countries than for those involved in developing countries overall. Given the importance of these other obstacles to foreign investment in CAF countries, the statistical analysis conducted by MIGA (explained next) attempted to control for variables related to market size and level of economic devel-opment in order to assess as closely as possible the political-risk impact on investments to CAF. This could less easily be isolated in the surveys, though. Conversely, fewer investors are concerned about economic and business considerations such as lack of qualified staff or macroeconomic instability in CAF countries relative to other developing countries.
Figure 2.11 Constraints for FDI in CAF states and developing countries
Percent of respondents
South-based MNEs with investments in CAF countries find political risk more challenging than other investment obstacles compared to their North-based counterparts. Similarly, a higher pro-portion of small firms than large ones rank political perils as a top challenge—although they cite access to financing as the main obstacle they face.
Both investors involved in CAF countries and those investing in developing countries are more worried about adverse government interventions—including regulatory changes, non-honoring of sovereign guarantees, currency restrictions, expropriation, and breach of contract—than about political violence (figure 2.12). Over 60 percent of investors in countries affected by conflict or considered fragile rank adverse regulatory changes as a main concern, a higher proportion than for those involved in developing countries. This ranking is likely to reflect the fact that these are the key concerns to investors in the extractive industries. In this sense, a driver for the differential in responses from the CAF and non-CAF countries appears to be the industry mix in each of these countries, which itself is driven by the sector characteristics (as detailed next).
War and terrorism, conversely, rank low relative to other risks for both sets of investors. This rank may reflect that in CAF countries, the main asset–given the importance of the primary sector—is the mineral underground, which is not prone to losses caused by violence. However, in other developing countries, the same result for a different sector mix must represent an inherent loss of a lower risk arising from war and civil disturbance. Although the risk of terrorism is by no means absent in developing countries, it appears to be perceived as primarily related to industrialized countries.28
Investors in CAF countries, moreover, rank concerns over civil disturbance (as opposed to war and to ter-rorism) significantly higher than those in developing countries in general, reflecting a more acute risk of conflict in these investment destinations. Yet, breach of contract—the main worry for investors in developing countries—is considered a major investment obstacle by less than one in five investors in CAF countries. This finding is somewhat surprising because extractive industries and infrastructure, both of which usually rely on contractual agreements with local governments, are often major areas of investment in CAF economies.
Figure 2.11. Constraints for FDI in CAF states and emerging markets
Other
Lack of informationon the country's
business environmentLack of financing
for investments in these countries
Lack of investmentopportunities
Poor infrastructure
Limited size of the market
Lack of qualified staff
Macroeconomic instability
Weak government institutions
Political risk
0 5 10 15 20 25 30 35
CAF countries
Developing countries
Source: MIGA-EIU Political Risk Survey 2010.

38 | MIGA WIPR REPORT 2010
Figure 2.12 Political risks of most concern to foreign investors
Percent of respondents
A quarter of investors involved in CAF countries report having suffered losses resulting from political risks, primarily caused by civil disturbance and adverse regulatory changes. The highest proportion of investors having experienced losses in developing countries, however, suffered from government inter-vention—whether regulatory changes, breach of contract, transfer and convertibility restrictions, or non-honoring of sovereign guarantees (chapter 1).
Although losses associated with war or civil dis-turbance appear more frequent in CAF countries, the financial impact is often limited to partial asset destruction or temporary business interruption, which does not necessarily result in the investment being written off. Other political perils such as expro-
priation, moreover, generally translate into a total loss. The average size of losses, therefore, tends to be smaller in CAF countries than in developing economies, as confirmed by claims data from political risk insurers (chapter 3). MIGA’s experience, while limited, also points in the same direction: three out of the five claims it has paid were due to the war and civil disturbance; yet the single expropriation loss that MIGA has paid to date dwarfed the cumulative losses from these three war and civil disturbance claims.
For investors in CAF states, past losses appear directly related to divestment: 22 percent of MNEs surveyed say that political risk in CAF countries has resulted in scaling back, canceling or delaying their investments (figure 2.13). Civil disturbance and regu-latory changes—which, as mentioned earlier, caused losses to a significant proportion of respondents—were the risks to which investors were most sensitive.
Figure 2.13 Proportion of companies that have scaled back, canceled, or delayed investments in CAF states because of political risk
Percent of respondents
The survey results are consistent with findings from MIGA’s review of over 45,000 greenfield investment projects, about 1,000 of which were located in CAF states. Two distinct analyses were carried out: one focused on the number of investment projects, and the other, on the investment amounts. As would be expected, the analysis confirmed the negative
Figure 2.12 Political risks of most concern to foreign investors
Regulatory changes
Civil disturbance
Expropriation
Breach of contract
War
Terrorism
Investors in CAF countries
Investors in developing countries
0 10 20 30 40 50 60 70
Source: MIGA-EIU Political Risk Survey 2010 and MIGA-EIU CAF Investors Survey.
Note: Percentages add up to more than 100 because of multiple selections.
Non-honoring of sovereign guarantees
Transfer andconvertibility
restrictions
Figure 2.13 Proportion of companies that have scaled back, cancelled or delayed investments
Terrorism
War
Expropriation
Civil disturbances
Regulatory changes
0 10 20
Source: MIGA-EIU CAF Investors Survey.
Non-honoring ofsovereign guarantees
Transfer andconvertibility restrictions
Breach of contract
MIGA WIPR REPORT 2010 | 39
impact of conflict on investment29. The number of new investment projects was found to drop by 44 percent following civil war and by 34 percent when postconflict situations are included. The impact on greenfield investment by value was even more pro-nounced: conflict was found to result in a 90 percent decline (see appendix 7 for methodology and detailed results). This finding suggests that conflict affects larger investment projects more than smaller ones.
This statistical analysis does have limitations though. A significant part of the result remains unexplained by the conflict itself. As noted in an earlier section, violence is linked to a host of related challenges, from weakened institutions, to a breakdown in the rule of law and judicial systems, to drained public finances, and to increased corruption, all of which can discourage investment. Depleted public finances, for example, can increase the risk of non-honoring of sovereign guarantees, transfer restrictions, and expropriations. The breakdown of the rule of law contributes to regulatory uncertainty and undermines investors’ ability to seek legal recourse. In a context of heightened global scrutiny, operating in a situation of conflict or political crisis can also threaten an investor’s reputation (box 2.1). At the same time, political risk is pitted against other factors, such as the level and history of investors’ involvement in a country (box 2.2). All these considerations, although only indirectly related to the conflict itself, none-theless weigh on investment decisions.
Sector-Level Perspectives
Political risk perceptions and investment behavior in CAF countries appear to be determined to a large degree by sector characteristics. MIGA’s investor surveys and statistical analysis largely suggest that both attitude to risk and the impact of conflict on investment decisions are heavily influenced by sectors of operation, resulting in FDI profiles in CAF economies that are significantly different from the rest of developing countries.
The following analysis, however, provides only partial and sometimes contradictory answers. In addition, some findings are ambiguous when it comes to sectors critical for these economies, such as extractive industries and telecommunications. More research is needed to fully explain the inter-action between sector characteristics, political risk, and investment decisions in a context of fragility and conflict.
To decipher the behavior of investors in various sectors, three main channels of transmission of political risk to foreign investors in CAF countries have been identified as an initial framework of analysis:
r the possible destruction of assets resulting from conflict itself;
r the unavailability of inputs and adequate human resources resulting from the lack of infra-structure and from weak institutional and regu-latory frameworks, all of which often characterize CAF economies; and
r abrupt declines in domestic demand, leading to lasting impoverishment that persists beyond the end of hostilities.
According to the above framework, most services—in particular financial services—would be unlikely to be the main source of investment in CAF countries, unlike in developing countries in general, where services account for most FDI. The main challenge would not be the risk of asset destruction—because services tend to rely more on intangible than tangible assets—but the demand shock resulting from conflict (box 2.2). Moreover, the extractive industry, with little links to the domestic economy and oriented toward exports, is not affected by demand shocks. Extractive investments are in theory particularly vulnerable to asset destruction resulting from their capital intensity. Yet, the concentration of those assets in one or two locations, sometimes offshore, makes them easier to secure, which partly mitigates the risk of destruction.
Actual investment flows confirm this analysis only in part, however. Although reliable FDI data by sector are not available for CAF countries, greenfield investments suggest that the primary sector—mostly extractive industries—has been receiving the lion’s share of FDI in aggregate terms (figure 2.14). As noted earlier in this chapter, a significant proportion of countries prone to conflict or fragile are also dependent on natural resources, and the link between minerals and violence has been the subject of much debate and scrutiny (box 2.3).
40 | MIGA WIPR REPORT 2010
Box 2.1 AngloGold Ashanti in the Democratic Republic of Congo
On June 1, 2005, AngloGold Ashanti faced an unexpected storm: a Human Rights Watch (HRW) report accused the mining company of providing financial and logistical assistance to an armed militia responsible for atrocities in the northeastern region of the Democratic Republic of Congo. The accusations, which received broad media coverage, came as a surprise and threatened the company’s reputation and operations in the country.
AngloGold Ashanti was the first major foreign investor to return to the troubled northeastern region of the war-ravaged Democratic Republic of Congo. In 1996, Ashanti Goldfields purchased a stake in a joint venture that held an exploration and mining lease near Mongbwalu in the Ituri region, which sits on one of the richest gold fields in Africa. War halted operations in 1997, however, and the site was handed over to the local parastatal minority partner. Following the December 2002 peace agreement, Ashanti Goldfields—then in the process of merging with AngloGold—consulted its local joint venture partner, the interim government of the Democratic Republic of Congo, and the United Nations peacekeeping mission to explore whether a presence could be reestablished in the area and mining exploration conducted.
In light of the recent conflict, the persisting instability in the eastern part of the country, and the continued presence of militia elements, security remained an issue. The company, however, assessed the situation as sufficiently stable to reengage. In addition, a United Nations peace-keeping camp was to be established in the vicinity of the concession. As a result, AngloGold Ashanti set up an exploration camp in 2004, and unarmed security guards were recruited. Exploration drilling started in January 2005. The company, nonetheless, prepared emergency response and evacuation plans in case the conflict escalated again. As the project was in its early stages, financial investment was to be very gradual, thus limiting potential losses.
Besides keeping an active dialogue with the government and the United Nations, as well as constantly monitoring the situation, AngloGold Ashanti’s risk-mitigation strategy also relied on relations with the local community. The long history of mining in the area predating AngloGold Ashanti’s involvement had resulted in suspicions and grievances that needed to be addressed. The company, aware it needed to secure a “social license” to mine, supplied the neighboring public hospital with equipment and medication, and it repaired its water supply system, which had been down for seven years. Equipment and supplies have also been provided to local schools, and infrastructure such as roads, drainage, and power supply have been repaired and maintained.
The HRW report documented the intense competition among armed militia over access to gold in the Ituri region—where the central government had very little control—and the resulting atrocities committed against the local population. It accused AngloGold Ashanti of developing relations with one of the militias, the Nationalist and Integrationist Front (FNI), in exchange for security assurance and access to the concession. The nongovernmental organization (NGO)

MIGA WIPR REPORT 2010 | 41
further stated that the company provided financial and logistical support to the group, indirectly furthering conflict and human rights abuses. It also argued that, although investment was des-perately needed in the Democratic Republic of Congo, the company should have waited until it could work in the area without having to interact with warlords.
AngloGold Ashanti denied it had nurtured a relationship with the militia. Although admitting that some encounters with the FNI were unavoidable, it argued that cash and transport had been provided under duress and threats from the militia. There was also confusion surrounding freight landing taxes at the local airstrip, which the company initially thought legitimate and col-lected by the transitional government. The company stated that caving in to extortion was not part of its policy.
The fallout from the HRW report threatened AngloGold Ashanti’s reputation and its relation with the government of the Democratic Republic of Congo and the local population; it could also undermine its efforts to obtain mining concessions in other countries. Relations with the government were ironed out, and the investor ramped up its interactions with NGOs, including HRW. Lessons were also learned about when and how to develop closer relations with local com-munities, and about gaining a better understanding of the situation on the ground. A forum of local leaders has been created to keep dialogue open, and AngloGold Ashanti is working with artisanal miners active in the area to introduce basic safety and environmental precautions. The company committed to continually review its operation and to withdraw from the area if the security situation deteriorated, or if its operation failed to enhance economic prospects—and the peace process—in the country.
The project has faced other hurdles. The legal and contractual environment in the Democratic Republic of Congo has been in flux after it launched a review and renegotiation of mining contracts in 2007. With a revised agreement with the Congolese authorities now in place and improved security in the area, the project is back on track. A feasibility study is planned for next year, with potential production starting a few years later.
NGO scrutiny has become an integral part of the business environment, however. In January 2010, CAFOD, a United kingdom–based aid agency, published a report questioning the benefits of the mining project for the local population, and called for more transparency.
Source: MIGA, based on information provided by AngloGold Ashanti, Human Rights Watch, CAFOD, and secondary sources.

42 | MIGA WIPR REPORT 2010
Box 2.2 The Weight of History: Old Mutual in Zimbabwe
Old Mutual, a global financial services provider, has deep African roots. Established in South Africa in 1845 as the Mutual Life Assurance Society of the Cape of Good Hope, it opened its first office in what is today known as Zimbabwe in 1927. Over time, Old Mutual expanded its business in the country from life insurance to mortgage finance, short-term insurance, pension funds, fund management, and real estate development. By the late 1990s, the company was a pillar of Zimbabwe’s financial services industry, employing about 2,200 people who serve hundreds of thousands of clients.
Starting in the late 1990s, however, Zimbabwe sunk into political crisis and economic meltdown. In less than a decade, unemployment skyrocketed, while domestic demand col-lapsed. Hyperinflation destroyed asset values and wiped out savings. The local currency became worthless. A parallel economy developed, bypassing the formal financial system. Old Mutual’s client base and assets melted away. Unable to invest offshore, the company converted cash into real assets as much as possible, investing in sectors such as mining or tourism, which were largely shielded from the collapse of local demand. To survive the collapse of local demand, it had to slim down and transform itself into a back office for the group’s South African operations. At the worst of the crisis, Old Mutual’s Zimbabwe business was written down to Uk£2.
Old Mutual also got caught in the political crossfire. The group’s shares listed on the Harare stock exchange—which once accounted for a fifth of the local market capitalization—were being used by the public and the business community as virtual currency. Comparing Old Mutual’s share prices in Harare, Johannesburg, and London provided the basis for calculating a virtual exchange rate. In addition, share trading across the group’s multiple listings was used to bypass currency transfer regulations. Local authorities threatened to delist the company and accused Old Mutual—which had moved its head office to the United kingdom and was listed in London in 1999—of nurturing a political agenda and pushing for a change of regime. The company was threatened with expropriation.
At the same time, opposition supporters accused Old Mutual of shoring up the regime. By law, the company was required to hold government debt. In addition, part of its long-standing assets included shares in a media group considered as a ruling party mouthpiece.
Faced with the collapse of its local business, the intensifying political pressure from both sides, and the threats to its reputation, Old Mutual briefly considered closing up shop in Zimbabwe. Yet, clients and employees depended on the company, and Old Mutual’s long history in the country weighed in favor of weathering the storm. By then, financial risks were minimal because the investment had already been written off, and the Zimbabwe business—although barely sur-viving—was self-sufficient.
The creation of a power-sharing government in 2008 has somewhat eased the political conflict, however, and reforms have fostered a modest economic recovery. The local currency has been abandoned, and hyperinflation reined in. Risks have not disappeared though: the political situation remains fragile; most international assistance is being held back; and the economic outlook is, therefore, still precarious. In addition, there is much debate and uncertainty over the authorities’ plans to indigenize the economy, which could have a significant impact on foreign investors.

MIGA WIPR REPORT 2010 | 43
Figure 2.14 Greenfield cross-border investment flows to CAF countries by sector
Percent
Yet, the service sector (communications, financial services, and other services) comes second after extractive industries, exceeding manufacturing in some years.30 As the channels of transmission framework would suggest, the share of investment in financial services has indeed been minuscule. In most years, infrastructure, which is capital intensive and vulnerable to asset destruction, accounts for the bulk of investments in services. Telecommunications projects, which account for two-thirds of total investment commitments in infrastructure, remain
attractive even in the presence of conflict because of the high value placed on accessing news and infor-mation in an uncertain environment, the weakness of fixed-line networks, and the low cellular penetration— which offer attractive growth potential.31
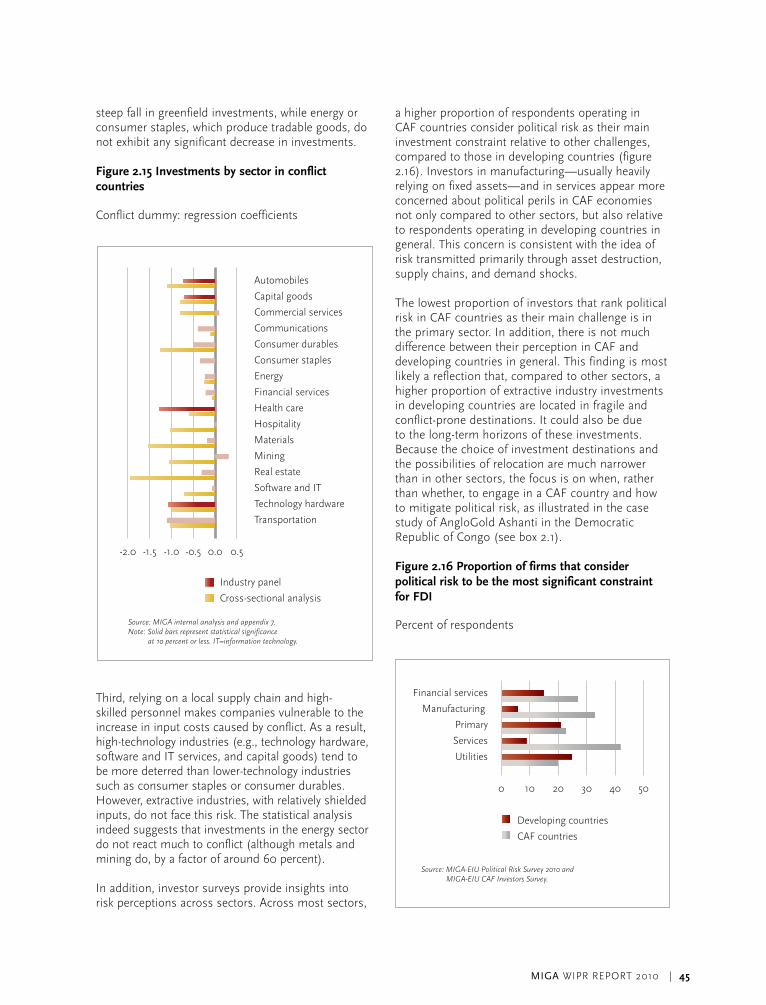
To better understand foreign investors’ reaction to conflict, MIGA conducted statistical work analyzing greenfield investments in various sectors in conflict and nonconflict countries over the past decade. The cross-country analysis for each industry yielded the results depicted in figure 2.15 (where the negative coefficient indicates an unwillingness to invest in a conflict country compared to a nonconflict country and where the positive coefficient indicates that investors are more prone to invest in a conflict country than in a nonconflict country).
The sector-specific analysis confirms the con-clusion of the country-level analysis: conflict results in an overall fall in investments. Although the two regression models yielded results that were not always consistent, different behaviors can be observed across sectors. First, the risk of asset destruction appears to weigh heavily on investment decisions: investments in industries with high fixed- capital intensity—such as real estate, automobiles and components, and technology hardware—appear highly deterred by conflict. Conversely, service industries (financial services or software and infor-mation technology [IT] services), with lower intensity of fixed capital, are less affected. The risk of asset destruction provides only part of the answer, however, because conflict appears to deter investments in commercial services much more than in energy.
Second, the risk of reduced domestic demand caused by conflict appears determinant as well. Investments in tradable industries show, ceteris paribus, a lower fall than in nontradable industries. For example, com-mercial services and hotels, restaurants, and leisure, which provide nontradable services, experience a
Figure 2.14 Greenfield FDI flows to CAF countriesby sector
Primary sector
Manufacturing
Communications
Financial services
Other services
0 20 40 60 80 100
2003
2004
2005
2006
2007
2008
2009
Source: fDi Markets database.
Old Mutual has established a constructive relationship with the transitional authorities, and accu-sations from both sides of the political divide have died down. Market research conducted locally confirmed that the company’s reputation remains positive and its name is trusted. The uptake on recently launched financial products has been promising. Thanks to improved economic con-ditions, Old Mutual’s Zimbabwean operation is once again profitable. Having successfully nav-igated a political and economic minefield, the company remains committed to Zimbabwe.
Source: MIGA, based on information provided by Old Mutual and secondary sources.

44 | MIGA WIPR REPORT 2010
Box 2.3 FDI in Natural Resources and Political Violence
A number of resource-rich countries in the developing world have suffered recurrent conflicts, civil wars, and other forms of political violence. Oil-rich countries, for example, have a higher probability of facing conflict, while countries rich in minerals (gemstones) are more likely to suffer lengthier periods of conflict.a Resource-rich countries are often more likely to relapse into conflict than are resource-poor ones.b
Dependence on natural resources has been found in some studies to be closely correlated with the onset of conflict, either through attempts to control these resources or through grievances stemming from inequitable wealth sharing, which often coincides with weak state institutions or the presence of the “Dutch disease.”c Revenues from the sale of natural resources may also be used to finance conflict or to undermine the return to peace, hence prolonging the duration of conflict. Multinational enterprises in the extractive sectors have themselves at times been implicated in the genesis or prolongation of conflict.d For example, international mining com-panies may trade in minerals sourced from mines that are used to finance lengthy civil wars.
Yet, FDI in natural resources can potentially promote political stability in CAF states by providing the capital and technical knowhow to exploit them, as well as to generate substantial fiscal revenues and to catalyze private investment. In light of both the magnitude of the investment and the time required for natural resource extraction, foreign investors adopt a longer-term horizon. In addition, investors in natural resources, bound by the geography of mineral deposits, have fewer choices when it comes to investment destinations than do those operating in other industries, and most assets cannot be relocated. As a result, they are often among the last ones to retreat in times of conflict and are among the first to return once violence subsides (see also box 2.2).
a Michael L. Ross, 2004, “What Do We know about Natural Resources and Civil War?” Journal of Peace Research, 41: 337–56.
b Resource conflicts experience shorter postconflict peace durations than non-resource conflicts. See Helga Malmin Binningsbø and Siri Rustad, 2007, “Resource Conflicts, Resource Management and Postconflict Peace,” paper presented at the annual meeting of the International Studies Association 48th Annual Convention, Chicago, IL.
c Paul Collier and Anke Hoeffler, 2004, “Greed and Grievance in Civil War,” Oxford Economic Papers, 56: 563–95; Paul Collier, Anke Hoeffler and D. Rohner, 2009, “Beyond Greed and Grievance: Feasibility and Civil War,” Oxford Economic Papers, 61: 1-27; Michael L. Ross, 2006, “A Closer Look at Diamonds, Oil and Civil War,” Annual Review of Political Science, 9: 265–300. Other studies have not found a link between conflict and natural resource abundance (e.g., Christa Brunnschweiler and Erwin Bulte, 2008, “Natural Resources and violent Conflict: Resource Abundance, Dependence and the Onset of Civil War,” working paper 08/78, Center of Economic Research, ETH Zurich).
d John Bray, 2010, “Foreign Direct investment in Conflict-Affected Contexts,” International Alert, Working Group for Development and Peace, Practice Note 3. In this context, the recently passed Wall Street Reform and Consumer Protection Act of 2010 in the United States places new reporting requirements on publicly traded companies that manufacture products using minerals deemed as financing conflict in the Democratic Republic of Congo and neighboring countries.
MIGA WIPR REPORT 2010 | 45
steep fall in greenfield investments, while energy or consumer staples, which produce tradable goods, do not exhibit any significant decrease in investments.
Figure 2.15 Investments by sector in conflict countries
Conflict dummy: regression coefficients
Third, relying on a local supply chain and high-skilled personnel makes companies vulnerable to the increase in input costs caused by conflict. As a result, high-technology industries (e.g., technology hardware, software and IT services, and capital goods) tend to be more deterred than lower-technology industries such as consumer staples or consumer durables. However, extractive industries, with relatively shielded inputs, do not face this risk. The statistical analysis indeed suggests that investments in the energy sector do not react much to conflict (although metals and mining do, by a factor of around 60 percent).
In addition, investor surveys provide insights into risk perceptions across sectors. Across most sectors,
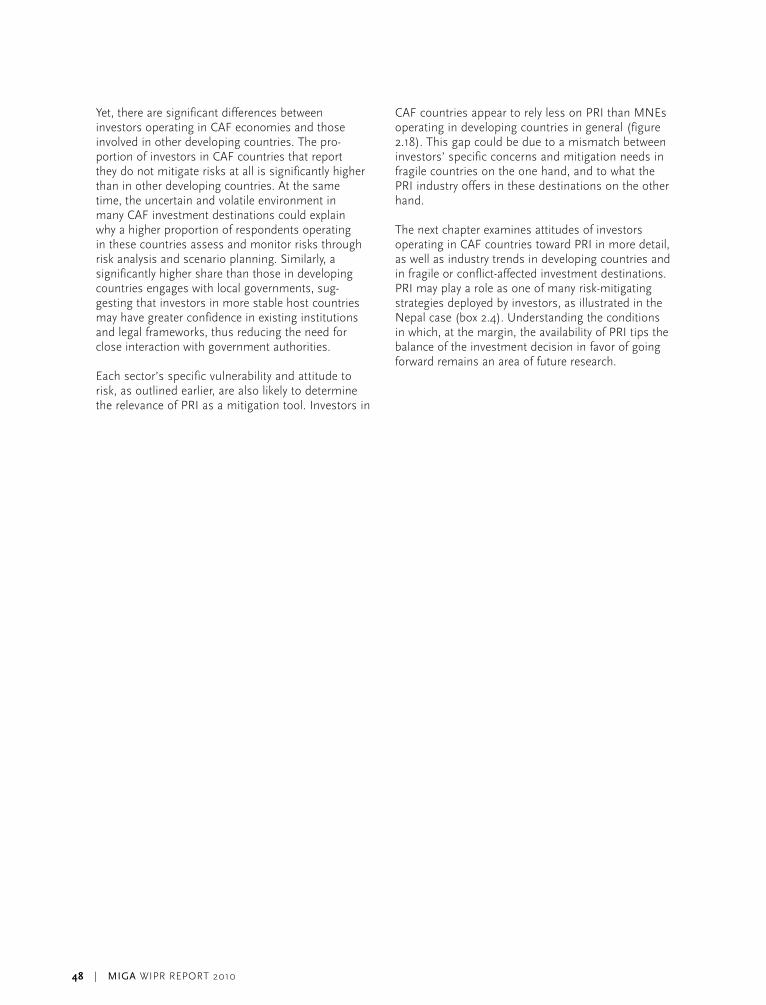
a higher proportion of respondents operating in CAF countries consider political risk as their main investment constraint relative to other challenges, compared to those in developing countries (figure 2.16). Investors in manufacturing—usually heavily relying on fixed assets—and in services appear more concerned about political perils in CAF economies not only compared to other sectors, but also relative to respondents operating in developing countries in general. This concern is consistent with the idea of risk transmitted primarily through asset destruction, supply chains, and demand shocks.
The lowest proportion of investors that rank political risk in CAF countries as their main challenge is in the primary sector. In addition, there is not much difference between their perception in CAF and developing countries in general. This finding is most likely a reflection that, compared to other sectors, a higher proportion of extractive industry investments in developing countries are located in fragile and conflict-prone destinations. It could also be due to the long-term horizons of these investments. Because the choice of investment destinations and the possibilities of relocation are much narrower than in other sectors, the focus is on when, rather than whether, to engage in a CAF country and how to mitigate political risk, as illustrated in the case study of AngloGold Ashanti in the Democratic Republic of Congo (see box 2.1).
Figure 2.16 Proportion of firms that consider political risk to be the most significant constraint for FDI
Percent of respondents
Figure 2.16. Proportion of firms that consider that political risk is the most significant constraint for FDI
Developing countries
CAF countries
Financial services
Manufacturing
Primary
Services
Utilities
0 10 20 30 40 50
Source: MIGA-EIU Political Risk Survey 2010 and MIGA-EIU CAF Investors Survey.
Figure 2.15 Impact of Conflict on Investment by Sector
Automobiles
Capital goods
Commercial services
Communications
Consumer durables
Consumer staples
Energy
Financial services
Health care
Hospitality
Materials
Mining
Real estate
Software and IT
Technology hardware
Transportation
-2.0 -1.5 -1.0 -0.5 0.0 0.5
Industry panel
Cross-sectional analysis
Source: MIGA internal analysis and appendix 7.Note: Solid bars represent statistical significance at 10 percent or less. IT=information technology.

46 | MIGA WIPR REPORT 2010
If one looks across sectors, risk perceptions sometimes seem to be at odds with the behavior of greenfield investments identified in the quantitative analysis cited earlier. For instance, respondents in financial services—one of the sectors least likely to react to conflict according to figure 2.15—appear to be among the most sensitive to political risk in CAF economies (figure 2.16) compared to other industries. The financial services industry has been identified in the analytical framework on the basis of the three transmission channels (see earlier) as an industry likely to be heavily influenced by the collapse of domestic demand resulting from conflict. However, the statistical analysis and survey results appear broadly in line when it comes to telecom-munications, a sector whose risk perceptions appear relatively low. Similarly, the manufacturing sector’s high aversion to risk compared to most other sectors appears to confirm the statistical analysis based on actual investments.
One potential explanation for the gap between risk perception and investment behavior is potential profit: the potential for high returns over a short payback period is likely to convince some investors to operate in a high-risk environment. Indeed, when asked to provide the main reasons why political risk is not a deterrent in CAF economies, two main reasons that survey respondents cited—regardless of their sector, company size, or geographical origin—were that (i) business opportunities outweighed risks, or (ii) potential losses were limited (figure 2.17).
Figure 2.17 Why is political risk not a deterrent to investments in CAF countries?
Percent of responses
MNEs that feel they are able to effectively protect their investments even in environments they perceive as high risk—and therefore limit their losses—are more likely to invest. This observation suggests that risk mitigation is a key determinant of investment in CAF countries.
Corporate Approaches to Political Risk Management in CAF Economies
Ninety percent of the firms that currently invest in CAF countries actively manage their exposures to political risk. Like investors in developing countries, MIGA-EIU CAF Investors Survey respondents over-whelmingly favor non-contractual tools to mitigate political risks (figure 2.18) and typically use a variety of mechanisms to do so (box 2.4).
Figure 2.18 Tools used by investors to mitigate political risk
Percent of respondents
Figure 2.17 Proportion of investors that consider that political risk is high in their investment destinations
Other
Risk is not too highBusiness opportunitiesoutweigh political risks
Source: MIGA-EIU Political Risk Survey 2010 andMIGA-EIU CAF Investors Survey.
0 10 20 30 40 50
Potential losses are modest/manageable
Figure 2.19 Tools used by investorsto mitigate political risk
Developing countries
CAF countries
0 5 10 15 20
Source: MIGA-EIU Political Risk Survey 2010 and MIGA-EIU CAF Investors Survey.

MIGA WIPR REPORT 2010 | 47
Box 2.4 Mitigating Risk on Several Fronts: SN Power in Nepal
SN Power, an international, Norwegian-based hydropower company, illustrates the many ways that foreign investors mitigate political risks in developing countries. In the early 1990s, SN Power’s parent company, Statkraft, decided to expand overseas following 100 years of hydropower experience in Norway, where expansion opportunities had become limited. Nepal offered attractive business opportunities.
The $140 million power project in khimti—about 100 km east of kathmandu—was the first private sector power project in Nepal. Political change and the establishment of a multiparty par-liament in 1991, together with new business legislation, made the country increasingly attractive to foreign investors. The project structure for khimti was carefully designed to address a number of technical, regulatory, and commercial risks. The involvement of multilateral lenders and export credit agencies offered additional comfort and risk mitigation.
At the time, the risk of widespread political violence appeared remote. Although few insurers were ready to underwrite investments in Nepal at the time, the investor managed to contract political risk insurance (PRI) from MIGA to protect the equity investment against the risks of restrictions on currency convertibility and transfer, expropriation, and war and civil disturbance.
The power plant was commissioned in 2000. Although an insurgency had developed in the mid-1990s, few incidents were reported in the khimti area until 2001. When the political and security situation deteriorated, the army was deployed in the region. In October 2002, insurgents sabotaged the intake of the khimti facility, as well as a small hydropower plant providing rural electrification to neighboring villages. Yet, the damage was small compared to the scale of the investment, and support from the local community prevented escalation and further incidents. Compensation was received through the investor’s PRI, and the power plant continued operating.
Over the years, SN Power has continued to develop social programs in Nepal. In partnership with development agencies, the company has provided local electrification, has facilitated the provision of irrigation and drinking water, has established and supports an elementary school, and now operates a clinic—all of which benefit the population living around the power plant and enhance local support for the project. The involvement of a Nepalese shareholder has been important to better understand local dynamics and to develop a constructive relationship with both the local community and the government. In addition, the Norwegian Development Agency and the Norwegian Embassy in kathmandu have provided valuable country expertise, besides financial and technical assistance.
Although the insurgency officially came to an end in 2006, political risks have not disappeared. In light of Nepal’s political situation, the future regulatory framework and protection for long-term investors appear uncertain. The uncertain political landscape has also resulted in delays for investors waiting for licenses or permits. In addition, the peace agreement has not fully put an end to violence, and safety remains a concern.
After years operating in Nepal, however, SN Power is confident it can assess and manage political perils. The company—keen to respond to local power needs and to tap into the power- export potential to India—is now contemplating other investments in the country.
Source: MIGA, based on information provided by SN Power and secondary sources.
48 | MIGA WIPR REPORT 2010
Yet, there are significant differences between investors operating in CAF economies and those involved in other developing countries. The pro-portion of investors in CAF countries that report they do not mitigate risks at all is significantly higher than in other developing countries. At the same time, the uncertain and volatile environment in many CAF investment destinations could explain why a higher proportion of respondents operating in these countries assess and monitor risks through risk analysis and scenario planning. Similarly, a significantly higher share than those in developing countries engages with local governments, sug-gesting that investors in more stable host countries may have greater confidence in existing institutions and legal frameworks, thus reducing the need for close interaction with government authorities.
Each sector’s specific vulnerability and attitude to risk, as outlined earlier, are also likely to determine the relevance of PRI as a mitigation tool. Investors in
CAF countries appear to rely less on PRI than MNEs operating in developing countries in general (figure 2.18). This gap could be due to a mismatch between investors’ specific concerns and mitigation needs in fragile countries on the one hand, and to what the PRI industry offers in these destinations on the other hand.
The next chapter examines attitudes of investors operating in CAF countries toward PRI in more detail, as well as industry trends in developing countries and in fragile or conflict-affected investment destinations. PRI may play a role as one of many risk-mitigating strategies deployed by investors, as illustrated in the Nepal case (box 2.4). Understanding the conditions in which, at the margin, the availability of PRI tips the balance of the investment decision in favor of going forward remains an area of future research.
MIGA WIPR REPORT 2010 | 49
Chapter Two—Endnotes
1 The list of resource-dependent (or resource-rich) countries comprises those whose primary sector accounts for more than 20 percent of GDP. These countries also underwent a qualitative review to assess whether they could be classified as resource dependent from the point of view of the impact of the primary sector on political and economic decision making.
2 The CPIA index is a composite measure of economic management, structural and social policies, and the quality of public-sector institutions. The selection of fragile countries and territories by the World Bank is based on a rating of 3.2 or below (out of a maximum of 5).
3 Ejaz Ghani and Lakshmi Iyer, 2010, “Conflict and Development: Lessons from South Asia,” Economic Premise, No. 31, September. For a definition of civil wars, see Nicholas Sambanis, 2004, “What Is Civil War? Conceptual and Empirical Complexities of an Operational Definition,” Journal of Conflict Resolution, 48: 814-58.
4 Collier and Hoeffler, 2004, “Greed and Grievance in Civil Wars,” Oxford Economic Papers, 56: 563–95; James D. Fearon and David D. Laitin, 2003, “Ethnicity, Insurgency, and Civil War,” American Political Science Review, 97: 75–90.
5 World Bank, Fragile and Conflict-Affected Countries, http://web.worldbank.org/WBSITE/EXTERNAL/PROJECTS/STRATEGIES/EXTLICUS/0,,menuPk:511784~pagePk:64171540~piPk:64171528~theSitePk:511778,00.html.
6 E. Miguel, S. Satyanath, and E. Sergenti, 2004, “Economic Shocks and Civil Conflict: An Instrumental variables Approach,” Journal of Political Economy, 112: 725–53; O. Dube and J. F. vargas, 2009, “Commodity Price Shocks and Civil Conflict: Evidence from Colombia,” Working Paper, Harvard University and UCLA.
7 Ejaz Ghani and Lakshmi Iyer, 2010.8 Paul Collier and Anke Hoeffler, 2003, “Aid, Policy
and Peace: Reducing the Risks of Civil Conflict,” World Bank Conflict Prevention and Reconstruction Unit, Note No. 9. http://siteresources.worldbank.org/INTRANETSOCIALDEvELOPMENT/Resources/CPR9blue.pdf.
9 Paul Collier, 2007, “Post-Conflict Recovery: How Should Policies Be Distinctive?” Centre for Study of African Economies, Department of Economics, Oxford University, May. http://users.ox.ac.uk/~econpco/research/pdfs/PostConflict-Recovery.pdf.
10 Paul Collier, L. Elliott, H. Hegre, A. Hoeffler, M. Reynal-Querol, and N. Sambanis, 2003, “Breaking the Conflict Trap: Civil War and Development Policy,” Washington, DC: World Bank.
11 OECD, 2010, “Ensuring Fragile States Are Not Left Behind: Summary Report 2010,” Paris: OECD.
12 Dilip Ratha, Sanket Mohapatra, and Ani Silwal, 2010, “Outlook for Remittance Flows 2010-11: Remittance Flows to Developing Countries Remained Resilient in 2009, Expected to Recover During 2010–11,” Migration and Development Brief, No.12.
13 The group of countries defined as fragile states used by the OECD is not identical to the list of countries used in the analysis for this report.
14 Excluding China and India.15 OECD, 2010, Annual Report: Resource Flows to
Fragile and Conflict-Affected States 2010, Paris: OECD.
16 World Bank estimates.17 World Bank estimates.18 United States Bureau of Economic Analysis, 2009,
Survey of Current Business, September.19 Ministry of Commerce, 2008, Statistical Bulletin of
China’s Outward Foreign Direct Investment, Beijing: Ministry of Commerce. Other important source countries (e.g., United kingdom, France, and Japan) do not provide information at the level of detail needed to single out the CAF states.
20 World Bank, 2010, Investing Across Borders, Washington, DC: World Bank.
21 Out of a worldwide total of 2,755 treaties.22 UNCTAD, International Investment Agreements
database.23 Croatia and Mozambique were no longer con-
sidered CAF economies in 2010.

50 | MIGA WIPR REPORT 2010
24 UNCTAD, 2009, “How Post-Conflict Countries Can Attract and Benefit from FDI: Lessons from Croatia and Mozambique,” Geneva: UNCTAD. http://www.unctad.org/templates/webflyer.asp?docid=13949&intItemID=2068&lang=1.
25 For a discussion of the outcomes of privatization in conflict and postconflict environments, see UNDP, 2008, Post-Conflict Economic Recovery: Enabling Local Ingenuity, New York: UNDP.
26 In Eritrea, for instance, the ratio of FDI to GDP has been over 36 percent since 1998.
27 World Bank estimates.28 Swiss Re, 2010, “Terrorism Risk Still Looms Large.”
http://www.swissre.com/rethinking/Terrorism_risk_still_looms_large.html.
29 MIGA tested the control variables and found that they are statistically significant at the 1 percent level, which indicates robustness of the findings (see appendix 7, which also contains a brief outline of the methodology used).
30 See also John Bray, 2005, “International Companies and Post-Conflict Reconstruction: Cross-Sectoral Comparisons,” World Bank Social Development Paper No. 22, February.
31 Agnieszka konkel and Richard Heeks, 2009, “Challenging Conventional views on Mobile Telecommunications Investment: Evidence from Conflict Zones,” Development in Practice,19: 414–20. See also knowledge@Wharton, 2009. “An Industry on the Line: Telecommunications in Afghanistan,” March 26.
32 MIGA conducted a series of analysis of greenfield project-level data (described in appendix 7), and focused on two different regression models. First, MIGA conducted an industry (sector) panel analysis, where a panel for each sector and country-year was created. Second, a cross-sectional analysis was conducted, seeking to collapse the time dimension (compared to the panel analysis) and to analyze only yearly averages.

MIGA WIPR REPORT 2010 | 51