chapter data design - cengage · before constructing an information system, a systems analyst must...
TRANSCRIPT
Chapter 9 Data Design
Chapter 9 is the second of three chapters in the
systems design phase of the SDLC. In this chapter, you
will focus on data design skills that are necessary to
construct the physical model of the information system.
Data Design9CHAPTER
O B J E C T I V E SWhen you finish this chapter, you will be able to:• Explain file-oriented systems and how they
differ from database management systems• Explain data design terminology, including
entities, fields, common fields, records, files, tables, and key fields
• Describe data relationships, draw an entity-relationship diagram, define cardinality, and use cardinality notation
• Explain the concept of normalization• Explain the importance of codes and
describe various coding schemes• Explain data warehousing and data mining• Differentiate between logical and physical
storage and records• Explain data control measures
INTRODUCTION
During the systems analysis phase, you created a logical model of the system. Now, you must decide how data will be organized, stored, and managed. These are important issues that affect data quality and consistency.
This chapter begins with a review of data design concepts and terminology, then discusses file-based systems and database systems, including Web-based databases. You will learn how to create entity-relationship diagrams that show the relationships among data elements, and you will learn how to use normalization concepts. You also will learn about using codes to represent data items. The chapter concludes with a discussion of data storage and access issues, including data warehousing and data mining, physical design, logical and physical records, data storage formats, and data control.
Copyright 2011 Cengage Learning. All Rights Reserved. May not be copied, scanned, or duplicated, in whole or in part. Due to electronic rights, some third party content may be suppressed from the eBook and/or eChapter(s).
Editorial review has deemed that any suppressed content does not materially affect the overall learning experience. Cengage Learning reserves the right to remove additional content at any time if subsequent rights restrictions require it.
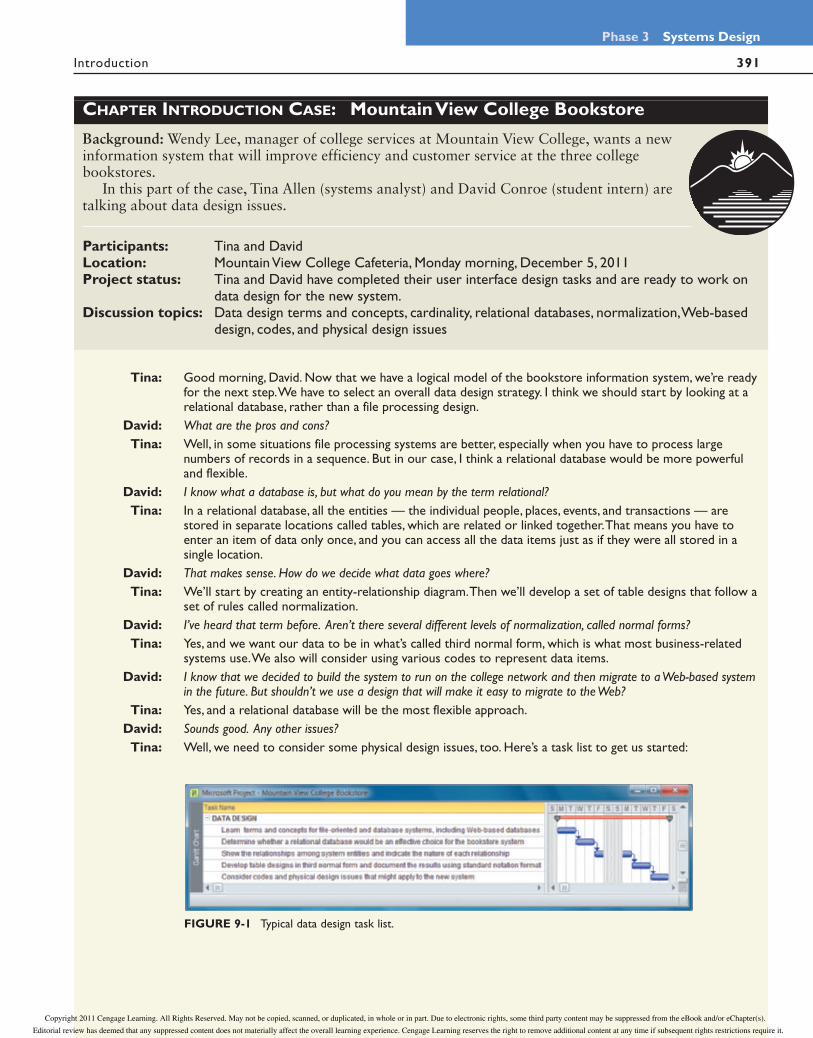
FIGURE 9-1 Typical data design task list.
CHAPTER INTRODUCTION CASE: Mountain View College Bookstore
Background: Wendy Lee, manager of college services at Mountain View College, wants a new information system that will improve efficiency and customer service at the three college bookstores.
In this part of the case, Tina Allen (systems analyst) and David Conroe (student intern) are talking about data design issues.
Participants: Tina and DavidLocation: Mountain View College Cafeteria, Monday morning, December 5, 2011Project status: Tina and David have completed their user interface design tasks and are ready to work on
data design for the new system.Discussion topics: Data design terms and concepts, cardinality, relational databases, normalization, Web-based
design, codes, and physical design issues
Tina: Good morning, David. Now that we have a logical model of the bookstore information system, we’re ready for the next step. We have to select an overall data design strategy. I think we should start by looking at a relational database, rather than a file processing design.
David: What are the pros and cons? Tina: Well, in some situations file processing systems are better, especially when you have to process large
numbers of records in a sequence. But in our case, I think a relational database would be more powerful and flexible.
David: I know what a database is, but what do you mean by the term relational? Tina: In a relational database, all the entities — the individual people, places, events, and transactions — are
stored in separate locations called tables, which are related or linked together. That means you have to enter an item of data only once, and you can access all the data items just as if they were all stored in a single location.
David: That makes sense. How do we decide what data goes where? Tina: We’ll start by creating an entity-relationship diagram. Then we’ll develop a set of table designs that follow a
set of rules called normalization.
David: I’ve heard that term before. Aren’t there several different levels of normalization, called normal forms? Tina: Yes, and we want our data to be in what’s called third normal form, which is what most business-related
systems use. We also will consider using various codes to represent data items.
David: I know that we decided to build the system to run on the college network and then migrate to a Web-based system in the future. But shouldn’t we use a design that will make it easy to migrate to the Web?
Tina: Yes, and a relational database will be the most flexible approach.
David: Sounds good. Any other issues? Tina: Well, we need to consider some physical design issues, too. Here’s a task list to get us started:
Introduction 391
Phase 3 Systems Design
Copyright 2011 Cengage Learning. All Rights Reserved. May not be copied, scanned, or duplicated, in whole or in part. Due to electronic rights, some third party content may be suppressed from the eBook and/or eChapter(s).
Editorial review has deemed that any suppressed content does not materially affect the overall learning experience. Cengage Learning reserves the right to remove additional content at any time if subsequent rights restrictions require it.

392
Chapter 9 Data Design
Data Design Concepts
DATA DESIGN CONCEPTS
Before constructing an information system, a systems analyst must understand basic data design concepts, including data structures and the characteristics of file-oriented and database management systems, including Web-based database design.
Data Structures
A data structure is a framework for organizing, storing, and managing data. Data struc-tures consist of files or tables that interact in various ways. Each file or table contains data about people, places, things, or events. For example, one file or table might contain data about customers, and other files or tables might store data about products, orders, suppliers, or employees. Depending on how the files and tables are designed, an infor-mation system is called a file-oriented system or a database management system (DBMS).
Figure 9-2 shows a typical auto repair shop that handles tune-ups, brakes, and align-ment. The following sections describe how this shop might manage its business data.
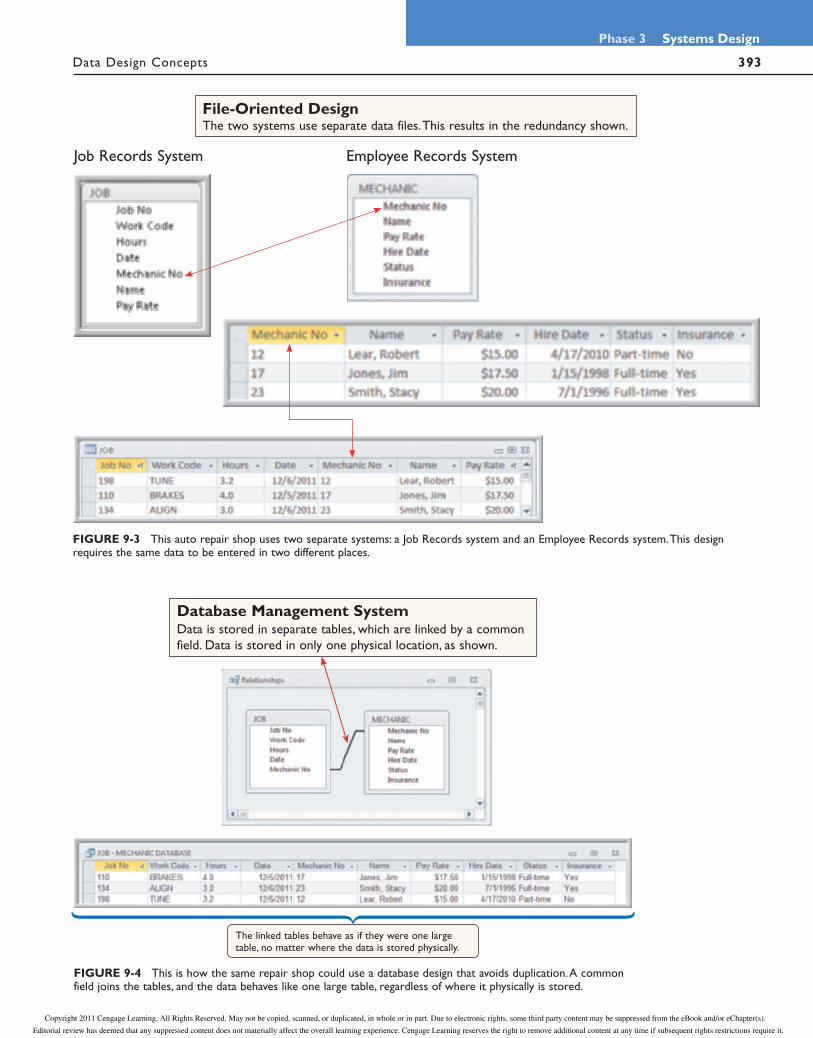
FILE-ORIENTED SYSTEM A file-oriented system, some-times called a file processing system, stores data in one or more separate files. For example, Figure 9-3 shows the auto repair shop with two separate file- oriented systems: A Job Records system that uses a JOB data file, and an Employee Records system that uses a MECHANIC data file. In the example, the JOB file contains the data neces-sary to answer inquiries and generate reports about work performed at the shop. Similarly, the MECHANIC file stores the data necessary to answer inquiries and gener-ate reports about the shop’s employees.
Notice that the same data is stored in more than one location. For example, three items of information (Mechanic No, Name, and Pay Rate) are stored in both data files. This redundancy is a major disadvantage of file-oriented systems, because it reduces efficiency and data quality.
DATABASE MANAGEMENT SYSTEM In a database management system (DBMS), all the tables are connected by common fields. A typical common field might be a Customer Number, which could be used to locate information about that customer in other tables. A common field that connects two tables is said to link, join, or relate the tables.
In a DBMS, the linked tables form a unified data structure that greatly improves data quality and access. This design, also called a relational database or relational model, was introduced in the 1970s and continues to be the most popular approach for organizing, storing, and managing business data.
Now consider Figure 9-4, which shows how the same auto repair shop might use a rela-tional database instead of a file-oriented system. Notice that the two tables are linked by the Mechanic No field. This link allows information to be accessed from either table as if the two tables were one large table, making it unnecessary to store duplicate information.
Overview of File Processing
Although file processing is an older approach, you should understand how these systems were designed, constructed, and maintained. Some companies still use file processing to handle large volumes of structured data on a regular basis. Many older legacy systems
FIGURE 9-2 In the example shown here, data about the mechanic, the customer, and the brake job might be stored in a file-oriented system or in a database system.
Copyright 2011 Cengage Learning. All Rights Reserved. May not be copied, scanned, or duplicated, in whole or in part. Due to electronic rights, some third party content may be suppressed from the eBook and/or eChapter(s).
Editorial review has deemed that any suppressed content does not materially affect the overall learning experience. Cengage Learning reserves the right to remove additional content at any time if subsequent rights restrictions require it.
393 Data Design Concepts
Phase 3 Systems Design
FIGURE 9-3 This auto repair shop uses two separate systems: a Job Records system and an Employee Records system. This design requires the same data to be entered in two different places.
FIGURE 9-4 This is how the same repair shop could use a database design that avoids duplication. A common field joins the tables, and the data behaves like one large table, regardless of where it physically is stored.
Employee Records SystemJob Records System
Database Management SystemData is stored in separate tables, which are linked by a common
field. Data is stored in only one physical location, as shown.
The linked tables behave as if they were one large table, no matter where the data is stored physically.
File-Oriented DesignThe two systems use separate data files. This results in the redundancy shown.
Copyright 2011 Cengage Learning. All Rights Reserved. May not be copied, scanned, or duplicated, in whole or in part. Due to electronic rights, some third party content may be suppressed from the eBook and/or eChapter(s).
Editorial review has deemed that any suppressed content does not materially affect the overall learning experience. Cengage Learning reserves the right to remove additional content at any time if subsequent rights restrictions require it.
394
Chapter 9 Data Design
Data Design Concepts
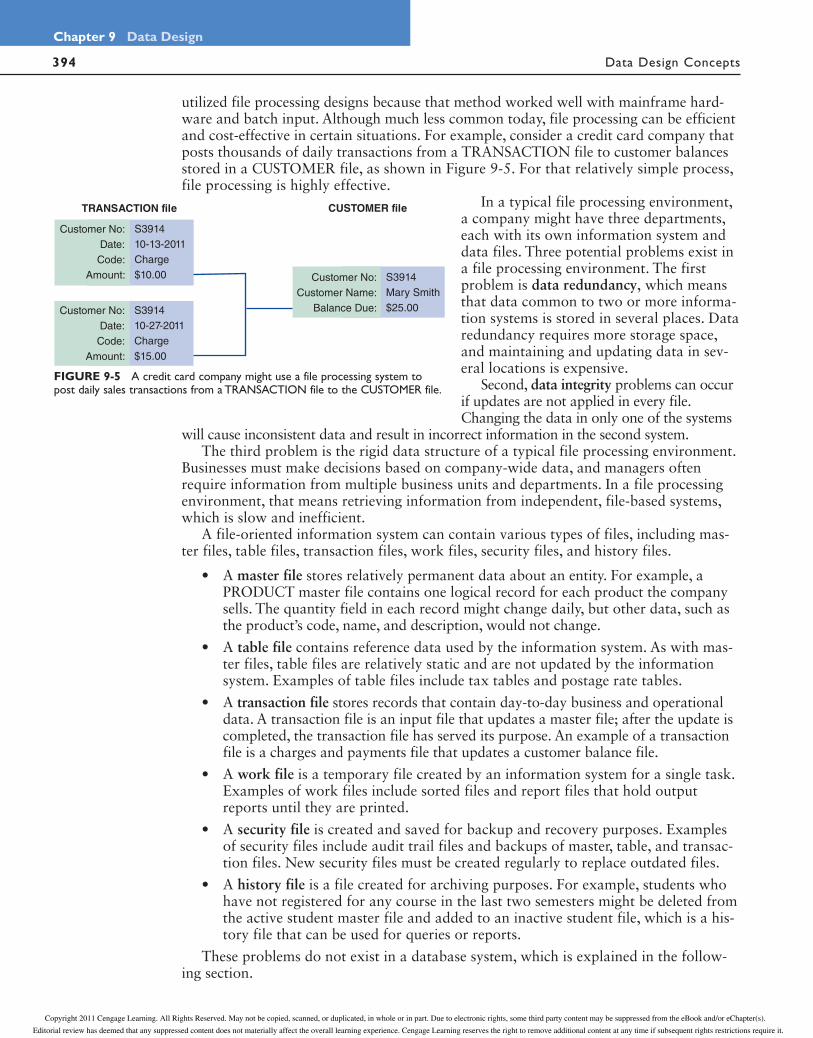
utilized file processing designs because that method worked well with mainframe hard-ware and batch input. Although much less common today, file processing can be efficient and cost-effective in certain situations. For example, consider a credit card company that posts thousands of daily transactions from a TRANSACTION file to customer balances stored in a CUSTOMER file, as shown in Figure 9-5. For that relatively simple process, file processing is highly effective.
In a typical file processing environment, a company might have three departments, each with its own information system and data files. Three potential problems exist in a file processing environment. The first problem is data redundancy, which means that data common to two or more informa-tion systems is stored in several places. Data redundancy requires more storage space, and maintaining and updating data in sev-eral locations is expensive.
Second, data integrity problems can occur if updates are not applied in every file. Changing the data in only one of the systems
will cause inconsistent data and result in incorrect information in the second system.The third problem is the rigid data structure of a typical file processing environment.
Businesses must make decisions based on company-wide data, and managers often require information from multiple business units and departments. In a file processing environment, that means retrieving information from independent, file-based systems, which is slow and inefficient.
A file-oriented information system can contain various types of files, including mas-ter files, table files, transaction files, work files, security files, and history files.
• A master file stores relatively permanent data about an entity. For example, a PRODUCT master file contains one logical record for each product the company sells. The quantity field in each record might change daily, but other data, such as the product’s code, name, and description, would not change.
• A table file contains reference data used by the information system. As with mas-ter files, table files are relatively static and are not updated by the information system. Examples of table files include tax tables and postage rate tables.
• A transaction file stores records that contain day-to-day business and operational data. A transaction file is an input file that updates a master file; after the update is completed, the transaction file has served its purpose. An example of a transaction file is a charges and payments file that updates a customer balance file.
• A work file is a temporary file created by an information system for a single task. Examples of work files include sorted files and report files that hold output reports until they are printed.
• A security file is created and saved for backup and recovery purposes. Examples of security files include audit trail files and backups of master, table, and transac-tion files. New security files must be created regularly to replace outdated files.
• A history file is a file created for archiving purposes. For example, students who have not registered for any course in the last two semesters might be deleted from the active student master file and added to an inactive student file, which is a his-tory file that can be used for queries or reports.
These problems do not exist in a database system, which is explained in the follow-ing section.
Customer No:
Date:
Code:
Amount:
TRANSACTION file
S3914
10-13-2011
Charge
$10.00
Customer No:
Date:
Code:
Amount:
S3914
10-27-2011
Charge
$15.00
Customer No:
Customer Name:
Balance Due:
S3914
Mary Smith
$25.00
CUSTOMER file
FIGURE 9-5 A credit card company might use a file processing system to post daily sales transactions from a TRANSACTION file to the CUSTOMER file.
Copyright 2011 Cengage Learning. All Rights Reserved. May not be copied, scanned, or duplicated, in whole or in part. Due to electronic rights, some third party content may be suppressed from the eBook and/or eChapter(s).
Editorial review has deemed that any suppressed content does not materially affect the overall learning experience. Cengage Learning reserves the right to remove additional content at any time if subsequent rights restrictions require it.

395 Data Design Concepts
Phase 3 Systems Design
The Evolution from File Systems to Database Systems
A properly designed database system offers a solution to the problems of file processing. A database provides an overall framework that avoids data redundancy and supports a real-time, dynamic environment, two potential problems of a file processing system.
In a file processing environment, data files are designed to fit individual business sys-tems. In contrast, in a database environment, several systems can be built around a sin-gle database. Figure 9-6 shows a database environment with a database serving four separate information systems.
A database management system (DBMS) is a collection of tools, features, and interfaces that enables users to add, update, manage, access, and analyze the contents of a set of data. From a user’s point of view, the main advantage of a DBMS is that it offers timely, interactive, and flexible data access. Specific DBMS advantages include the following:
• Scalability, which means that a system can be expanded, modified, or downsized easily to meet the rapidly changing needs of a business enterprise. For example, if a company decides to add data about secondary suppliers of material it uses, a new table can be added to the relational database and linked with a common field.
• Better support for client/server systems. In a client/server system, processing is distributed throughout the organization. Client/server systems require the power and flexibility of a database design. You will learn more about client/server systems in Chapter 10.
• Economy of scale. Database design allows better utili-zation of hardware. If a company maintains an enterprise-wide database, process-ing is less expensive using a powerful mainframe server instead of using several smaller computers. The inherent efficiency of high-volume processing on larger computers is called economy of scale.
• Flexible data sharing. Data can be shared across the enterprise, allowing more users to access more data. A database can be highly flexible, allowing users to view the same information in different ways. Users are empowered because they have access to the information they need to do their jobs.
• Enterprise-wide application. Typically, a DBMS is managed by a person called a database administrator (DBA), who assesses overall requirements and maintains the database for the benefit of the entire organization rather than a single depart-ment or user. Database systems can support enterprise-wide applications more effectively than file processing systems.
• Stronger standards. Effective database administration helps ensure that standards for data names, formats, and documentation are followed uniformly throughout the organization.
• Controlled redundancy. Redundancy means storing data in more than one place, which can result in inconsistency and data errors. Because the data is stored in a set of related tables, data items do not need to be duplicated in multiple locations. Even where some duplication is desirable for performance reasons, or disaster recovery, the database approach allows control of the redundancy.
InventorySystem
OrderSystem
Production
System
AccountingSystem
SALESDATABASE
FIGURE 9-6 In this example, a sales database can support four separate business systems.
Copyright 2011 Cengage Learning. All Rights Reserved. May not be copied, scanned, or duplicated, in whole or in part. Due to electronic rights, some third party content may be suppressed from the eBook and/or eChapter(s).
Editorial review has deemed that any suppressed content does not materially affect the overall learning experience. Cengage Learning reserves the right to remove additional content at any time if subsequent rights restrictions require it.
396
Chapter 9 Data Design
DBMS Components
• Better security. The DBA can define authorization procedures to ensure that only legitimate users can access the database and can allow different users to have dif-ferent levels of access. Most DBMSs provide sophisticated security support.
• Increased programmer productivity. Programmers do not have to create the underlying file structure for a database. That allows them to concentrate on logi-cal design and, therefore, a new database application can be developed more quickly than in a file-oriented system.
• Data independence. Systems that interact with a DBMS are relatively independent of how the physical data is maintained. That design provides the DBA flexibility to alter data structures without modifying information systems that use the data.
Although the trend is toward enterprise-wide database design, many companies still use a combination of centralized DBMSs and smaller, department-level database systems. Why is this so? Most large businesses view data as a company-wide resource that must be accessible to users throughout the company. At the same time, other factors encourage a decentralized design, including network expense; a reluctance to move away from smaller, more flexible systems; and a realization that enterprise-wide DBMSs can be highly complex and expensive to maintain. The compromise, in many cases, is a client/server design, where processing is shared among several computers. Client/server systems are described in detail in Chapter 10. As with many design decisions, the best solution depends on the individual circumstances.
DBMS COMPONENTS
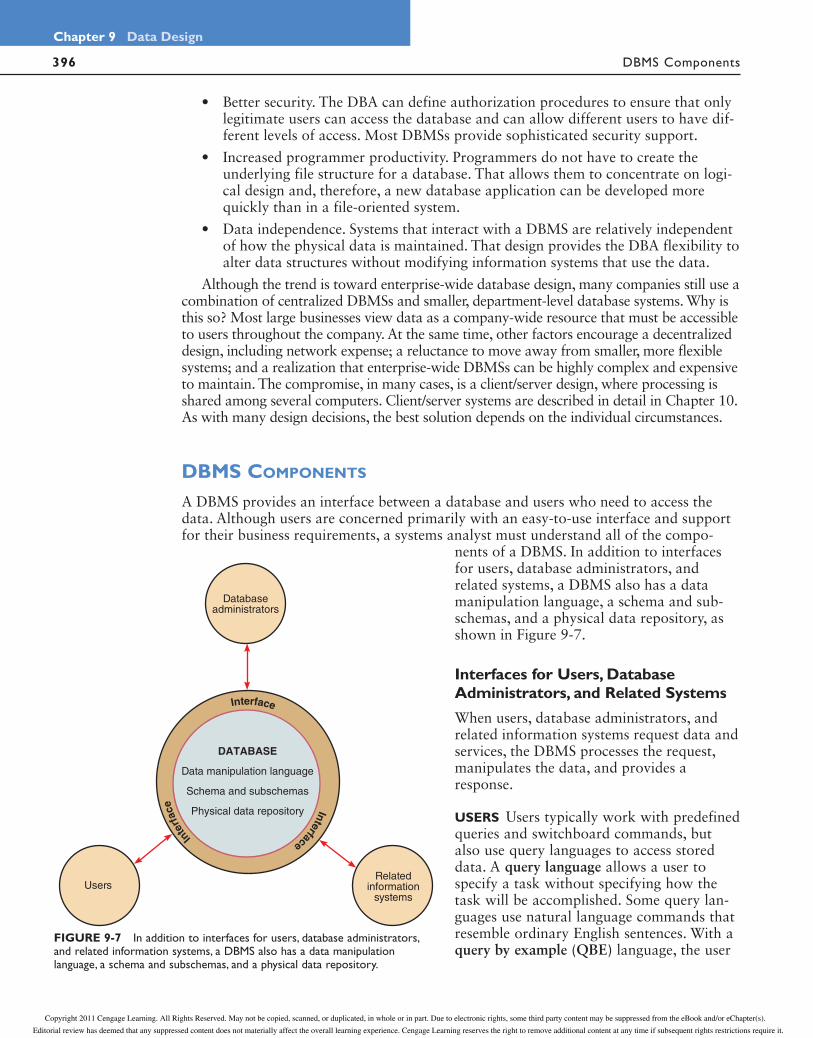
A DBMS provides an interface between a database and users who need to access the data. Although users are concerned primarily with an easy-to-use interface and support for their business requirements, a systems analyst must understand all of the compo-
nents of a DBMS. In addition to interfaces for users, database administrators, and related systems, a DBMS also has a data manipulation language, a schema and sub-schemas, and a physical data repository, as shown in Figure 9-7.
Interfaces for Users, Database Administrators, and Related Systems
When users, database administrators, and related information systems request data and services, the DBMS processes the request, manipulates the data, and provides a response.
USERS Users typically work with predefined queries and switchboard commands, but also use query languages to access stored data. A query language allows a user to specify a task without specifying how the task will be accomplished. Some query lan-guages use natural language commands that resemble ordinary English sentences. With a query by example (QBE) language, the user
DATABASE
Data manipulation language
Schema and subschemas
Physical data repository
Interface
InterfaceIn
terf
ace
UsersRelated
informationsystems
Databaseadministrators
FIGURE 9-7 In addition to interfaces for users, database administrators, and related information systems, a DBMS also has a data manipulation language, a schema and subschemas, and a physical data repository.
Copyright 2011 Cengage Learning. All Rights Reserved. May not be copied, scanned, or duplicated, in whole or in part. Due to electronic rights, some third party content may be suppressed from the eBook and/or eChapter(s).
Editorial review has deemed that any suppressed content does not materially affect the overall learning experience. Cengage Learning reserves the right to remove additional content at any time if subsequent rights restrictions require it.

397
Phase 3 Systems Design
DBMS Components
provides an example of the data requested. Many database programs also generate SQL (Structured Query Language), which is a language that allows client workstations to communicate with servers and mainframe computers. Figure 9-8 shows a QBE request for all Red Candy Metallic or Blue Flame Metallic 2011 Ford Fusions with navigation. The QBE request generates the SQL commands shown at the bottom of Figure 9-8.
DATABASE ADMINISTRATORS A DBA is responsible for DBMS management and sup-port. DBAs are concerned with data security and integrity, preventing unauthorized access, providing backup and recovery, audit trails, maintaining the database, and sup-porting user needs. Most DBMSs provide utility programs to assist the DBA in creating and updating data structures, collecting and reporting patterns of database usage, and detecting and reporting database irregularities.
RELATED INFORMATION SYSTEMS A DBMS can support several related information systems that provide input to, and require specific data from, the DBMS. Unlike a user interface, no human intervention is required for two-way communication between the DBMS and the related systems.
FIGURE 9-8 Using QBE, a user can request a list of all Red Candy Metallic or Blue Flame Metallic 2011 Ford Fusions with navigation.
QBE request
SQL commands
Copyright 2011 Cengage Learning. All Rights Reserved. May not be copied, scanned, or duplicated, in whole or in part. Due to electronic rights, some third party content may be suppressed from the eBook and/or eChapter(s).
Editorial review has deemed that any suppressed content does not materially affect the overall learning experience. Cengage Learning reserves the right to remove additional content at any time if subsequent rights restrictions require it.
398
Chapter 9 Data Design
Web-Based Database Design
Data Manipulation Language
A data manipulation language (DML) controls database operations, including storing, retrieving, updating, and deleting data. Most commercial DBMSs, such as Oracle and IBM’s DB/2, use a DML. Some database products, such as Microsoft Access, also pro-vide an easy-to-use graphical environment that enables users to control operations with menu-driven commands.
Schema
The complete definition of a database, including descriptions of all fields, tables, and relationships, is called a schema. You also can define one or more subschemas. A subschema is a view of the database used by one or more systems or users. A subschema defines only those portions of the database that a particular system or user needs or is allowed to access. For example, to protect individual privacy, you might not want to allow a project management system to retrieve employee pay rates. In that case, the project management system subschema would not include the pay rate field. Database designers also use subschemas to restrict the level of access permitted. For example, spe-cific users, systems, or locations might be permitted to create, retrieve, update, or delete data, depending on their needs and the company’s security policies.
Physical Data Repository
In Chapter 5, you learned about a data dictionary, which describes all data elements included in the logical design. At this stage of the systems development process, the data dictionary is transformed into a physical data repository, which also contains the schema and subschemas. The physical repository might be centralized, or it might be distributed at several locations. In addition, the stored data might be managed by a single DBMS, or sev-eral systems. To resolve potential database connectivity and access problems, companies use ODBC-compliant software that enables communication among various systems and DBMSs. ODBC, which stands for open database connectivity, is an industry-standard pro-tocol that makes it possible for software from different vendors to interact and exchange data. ODBC uses SQL statements that the DBMS understands and can execute, similar to the ones shown in Figure 9-7 on page 396. Another common standard is called JDBC, or Java database connectivity. JDBC enables Java applications to exchange data with any database that uses SQL statements and is JDBC-compliant.
You will learn more about physical design issues in Chapter 10, which discusses system architecture, and in Chapter 11, which discusses system implementation and data conversion.
WEB-BASED DATABASE DESIGN
The concept of Web-based systems was discussed in Chapter 7, Development Strategies. In this chapter, you will revisit this concept and examine the main components of a Web-based database system. The following sections discuss the characteristics of Web-based design, Internet terminology, connecting a database to the Web, and data security on the Web.
Characteristics of Web-Based Design
Figure 9-9 on the next page lists some major characteristics of Web-based database design. In a Web-based design, the Internet serves as the front end, or interface, for the database management system. Internet technology provides enormous power and flexibility because
Copyright 2011 Cengage Learning. All Rights Reserved. May not be copied, scanned, or duplicated, in whole or in part. Due to electronic rights, some third party content may be suppressed from the eBook and/or eChapter(s).
Editorial review has deemed that any suppressed content does not materially affect the overall learning experience. Cengage Learning reserves the right to remove additional content at any time if subsequent rights restrictions require it.
399 Web-Based Database Design
Phase 3 Systems Design
Internet Terminology
To understand Web-based data design, it is helpful to review some basic Internet terms and concepts. To access information on the Internet, a person uses a Web browser, which is an application that enables the user to navigate, or browse, the Internet and display Web pages on his or her local computer. A Web page is a text document written in HTML (Hypertext Markup Language). HTML uses formatting codes called tags, which specify how the text and visual elements will be displayed in a Web browser. Web pages are stored on a Web server, which is a computer that receives requests and makes Web pages available to users. Together, the Web server and the Web pages are referred to as a Web site.
In addition to maintaining a Web site, many companies use intranets and extranets to support business operations and communications. An intranet is a private, company-owned
the system is not tied to any specific combination of hardware and software. Access to the database requires only a Web browser and an Internet connection. Web-based systems are popular because they offer ease of access, cost-effectiveness, and worldwide connectivity — all of which are vital to companies that must compete in a global economy.
To learn more about HTML, visit the Management Information Systems CourseMate Web site at www.cengagebrain.com, navigate to On the Web Links for this chapter, and locate the HTML link.
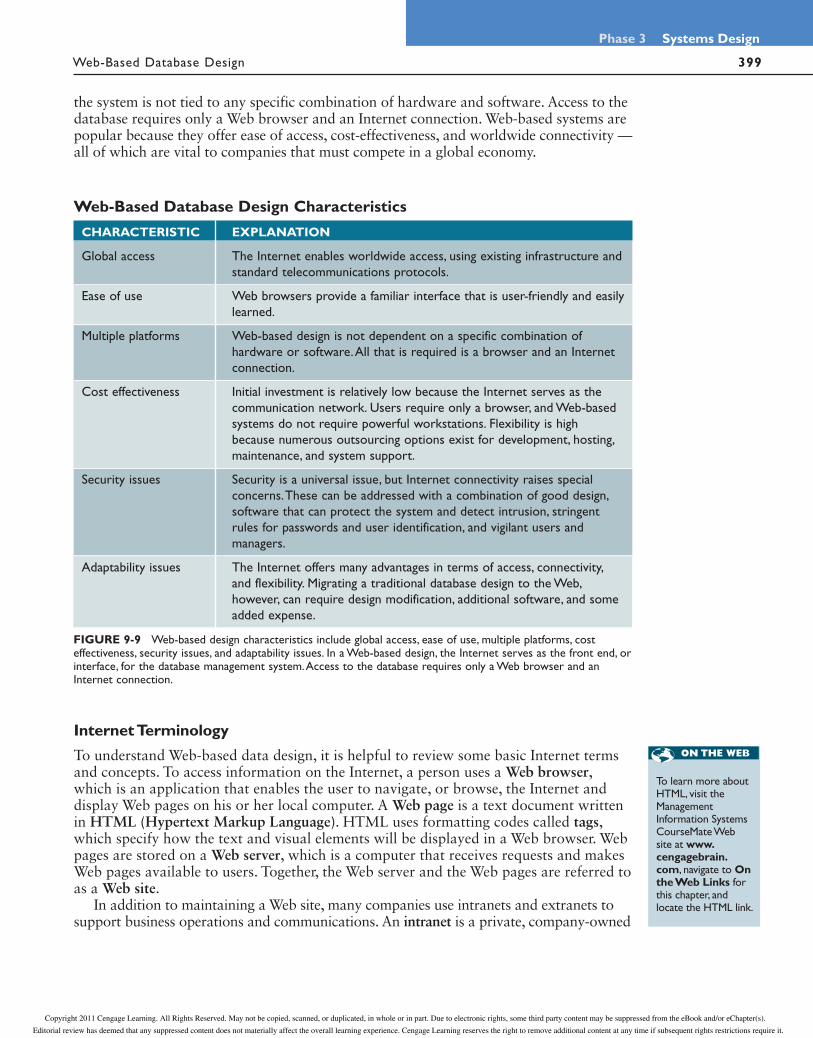
FIGURE 9-9 Web-based design characteristics include global access, ease of use, multiple platforms, cost effectiveness, security issues, and adaptability issues. In a Web-based design, the Internet serves as the front end, or interface, for the database management system. Access to the database requires only a Web browser and an Internet connection.
Web-Based Database Design Characteristics
CHARACTERISTIC EXPLANATION
Global access The Internet enables worldwide access, using existing infrastructure and
standard telecommunications protocols.
Ease of use Web browsers provide a familiar interface that is user-friendly and easily
learned.
Multiple platforms Web-based design is not dependent on a specific combination of
hardware or software. All that is required is a browser and an Internet
connection.
Cost effectiveness Initial investment is relatively low because the Internet serves as the
communication network. Users require only a browser, and Web-based
systems do not require powerful workstations. Flexibility is high
because numerous outsourcing options exist for development, hosting,
maintenance, and system support.
Security issues Security is a universal issue, but Internet connectivity raises special
concerns. These can be addressed with a combination of good design,
software that can protect the system and detect intrusion, stringent
rules for passwords and user identification, and vigilant users and
managers.
Adaptability issues The Internet offers many advantages in terms of access, connectivity,
and flexibility. Migrating a traditional database design to the Web,
however, can require design modification, additional software, and some
added expense.
Copyright 2011 Cengage Learning. All Rights Reserved. May not be copied, scanned, or duplicated, in whole or in part. Due to electronic rights, some third party content may be suppressed from the eBook and/or eChapter(s).
Editorial review has deemed that any suppressed content does not materially affect the overall learning experience. Cengage Learning reserves the right to remove additional content at any time if subsequent rights restrictions require it.
400
Chapter 9 Data Design
Web-Based Database Design
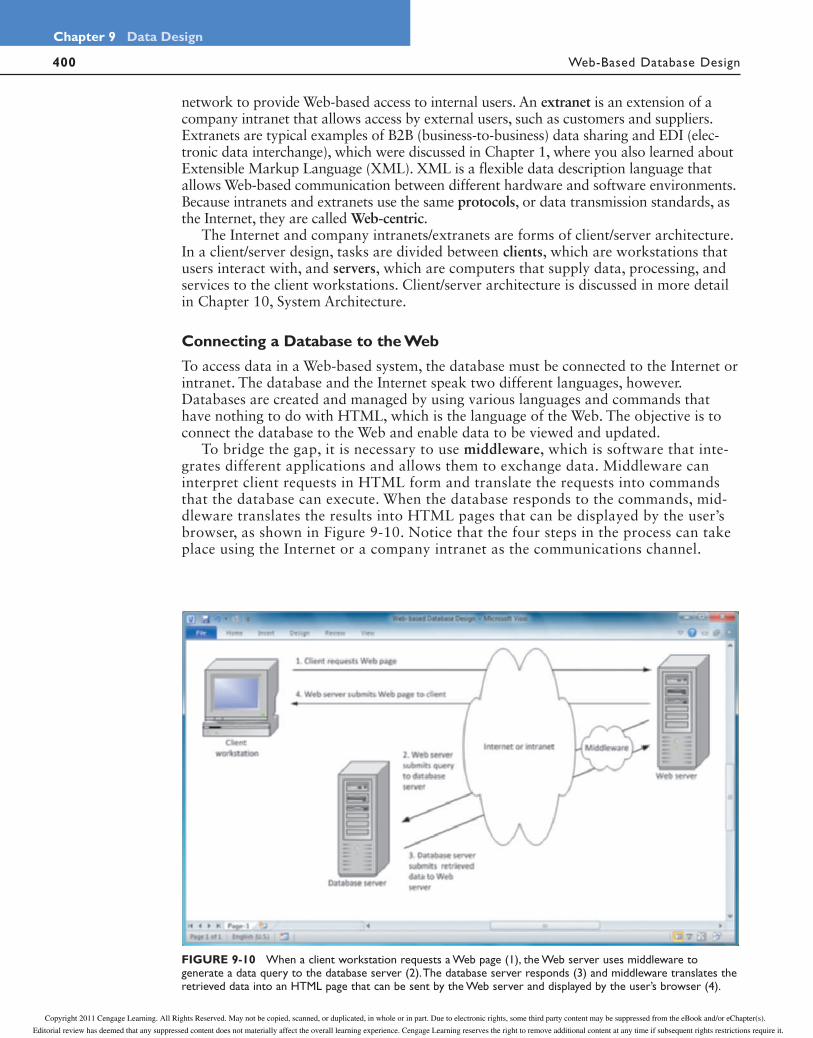
FIGURE 9-10 When a client workstation requests a Web page (1), the Web server uses middleware to generate a data query to the database server (2). The database server responds (3) and middleware translates the retrieved data into an HTML page that can be sent by the Web server and displayed by the user’s browser (4).
network to provide Web-based access to internal users. An extranet is an extension of a company intranet that allows access by external users, such as customers and suppliers. Extranets are typical examples of B2B (business-to-business) data sharing and EDI (elec-tronic data interchange), which were discussed in Chapter 1, where you also learned about Extensible Markup Language (XML). XML is a flexible data description language that allows Web-based communication between different hardware and software environments. Because intranets and extranets use the same protocols, or data transmission standards, as the Internet, they are called Web-centric.
The Internet and company intranets/extranets are forms of client/server architecture. In a client/server design, tasks are divided between clients, which are workstations that users interact with, and servers, which are computers that supply data, processing, and services to the client workstations. Client/server architecture is discussed in more detail in Chapter 10, System Architecture.
Connecting a Database to the Web
To access data in a Web-based system, the database must be connected to the Internet or intranet. The database and the Internet speak two different languages, however. Databases are created and managed by using various languages and commands that have nothing to do with HTML, which is the language of the Web. The objective is to connect the database to the Web and enable data to be viewed and updated.
To bridge the gap, it is necessary to use middleware, which is software that inte-grates different applications and allows them to exchange data. Middleware can interpret client requests in HTML form and translate the requests into commands that the database can execute. When the database responds to the commands, mid-dleware translates the results into HTML pages that can be displayed by the user’s browser, as shown in Figure 9-10. Notice that the four steps in the process can take place using the Internet or a company intranet as the communications channel.
Copyright 2011 Cengage Learning. All Rights Reserved. May not be copied, scanned, or duplicated, in whole or in part. Due to electronic rights, some third party content may be suppressed from the eBook and/or eChapter(s).
Editorial review has deemed that any suppressed content does not materially affect the overall learning experience. Cengage Learning reserves the right to remove additional content at any time if subsequent rights restrictions require it.
401 Data Design Terminology
Phase 3 Systems Design
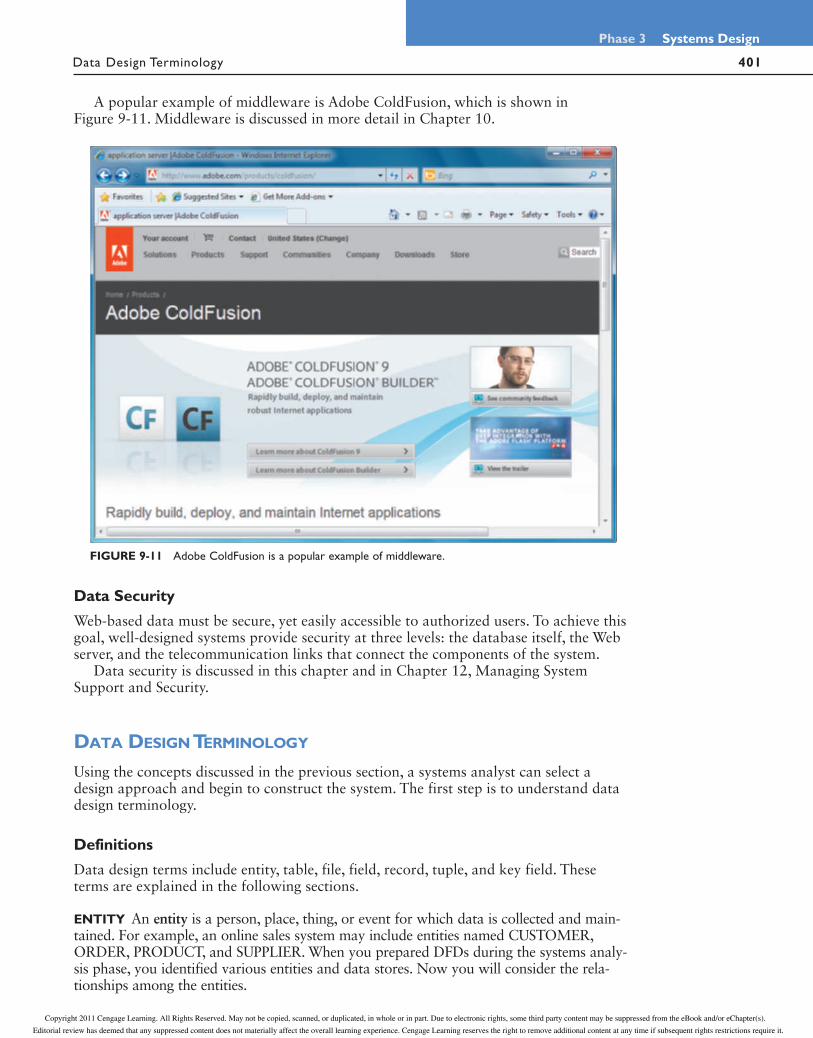
A popular example of middleware is Adobe ColdFusion, which is shown in Figure 9-11. Middleware is discussed in more detail in Chapter 10.
FIGURE 9-11 Adobe ColdFusion is a popular example of middleware.
Data Security
Web-based data must be secure, yet easily accessible to authorized users. To achieve this goal, well-designed systems provide security at three levels: the database itself, the Web server, and the telecommunication links that connect the components of the system.
Data security is discussed in this chapter and in Chapter 12, Managing System Support and Security.
DATA DESIGN TERMINOLOGY
Using the concepts discussed in the previous section, a systems analyst can select a design approach and begin to construct the system. The first step is to understand data design terminology.
Definitions
Data design terms include entity, table, file, field, record, tuple, and key field. These terms are explained in the following sections.
ENTITY An entity is a person, place, thing, or event for which data is collected and main-tained. For example, an online sales system may include entities named CUSTOMER, ORDER, PRODUCT, and SUPPLIER. When you prepared DFDs during the systems analy-sis phase, you identified various entities and data stores. Now you will consider the rela-tionships among the entities.
Copyright 2011 Cengage Learning. All Rights Reserved. May not be copied, scanned, or duplicated, in whole or in part. Due to electronic rights, some third party content may be suppressed from the eBook and/or eChapter(s).
Editorial review has deemed that any suppressed content does not materially affect the overall learning experience. Cengage Learning reserves the right to remove additional content at any time if subsequent rights restrictions require it.

402
Chapter 9 Data Design
Data Design Terminology
TABLE OR FILE Data is organized into tables or files. A table, or file, contains a set of related records that store data about a specific entity. Tables and files are shown as two-dimensional structures that consist of vertical columns and horizontal rows. Each column represents a field, or characteristic of the entity, and each row represents a record, which is an individual instance, or occurrence of the entity. For example, if a company has 10,000 customers, the CUSTOMER table will include 10,000 records, each representing a specific customer.
Although they can have different meanings in a specific context, the terms table and file often can be used interchangeably.
FIELD A field, also called an attribute, is a single characteristic or fact about an entity. For example, a CUSTOMER entity might include the Customer ID, First Name, Last Name, Address, City, State, Zip, and E-mail Address.
A common field is an attribute that appears in more than one entity. Common fields can be used to link entities in various types of relationships.
RECORD A record, also called a tuple (rhymes with couple), is a set of related fields that describes one instance, or occurrence of an entity, such as one customer, one order, or one product. A record might have one or dozens of fields, depending on what infor-mation is needed.
Key Fields
During the systems design phase, you use key fields to organize, access, and maintain data structures. The four types of keys are primary keys, candidate keys, foreign keys, and secondary keys.
PRIMARY KEY A primary key is a field or combination of fields that uniquely and min-imally identifies a particular member of an entity. For example, in a customer table the customer number is a unique primary key because no two customers can have the same customer number. That key also is minimal because it contains no information beyond what is needed to identify the customer. In a CUSTOMER table, a Customer ID might be used as a unique primary key. Customer ID is an example of a primary key based on a single field.
A primary key also can be composed of two or more fields. For example, if a student registers for three courses, his or her student number will appear in three records in the registration system. If one of those courses has 20 students, 20 separate records will exist for that course number — one record for each student who registered.
In the registration file, neither the student number nor the course ID is unique, so neither field can be a primary key. To identify a specific student in a specific course, the primary key must be a combination of student number and course ID. In that case, the primary key is called a combination key. A combination key also can be called a composite key, a concatenated key, or a multivalued key.
Figure 9-12 shows four different tables. The first three tables have single-field pri-mary keys. Notice that in the fourth table, however, the primary key is a combination of two fields: STUDENT-NUMBER and COURSE-ID.
CANDIDATE KEY Sometimes you have a choice of fields or field combinations to use as the primary key. Any field that could serve as a primary key is called a candidate key. For example, if every employee has a unique employee number, then you could use either the employee number or the Social Security number as a primary key. Because you can designate only one field as a primary key, you should select the field that con-tains the least amount of data and is the easiest to use. Any field that is not a primary key or a candidate key is called a nonkey field.
Copyright 2011 Cengage Learning. All Rights Reserved. May not be copied, scanned, or duplicated, in whole or in part. Due to electronic rights, some third party content may be suppressed from the eBook and/or eChapter(s).
Editorial review has deemed that any suppressed content does not materially affect the overall learning experience. Cengage Learning reserves the right to remove additional content at any time if subsequent rights restrictions require it.
403 Data Design Terminology
Phase 3 Systems Design
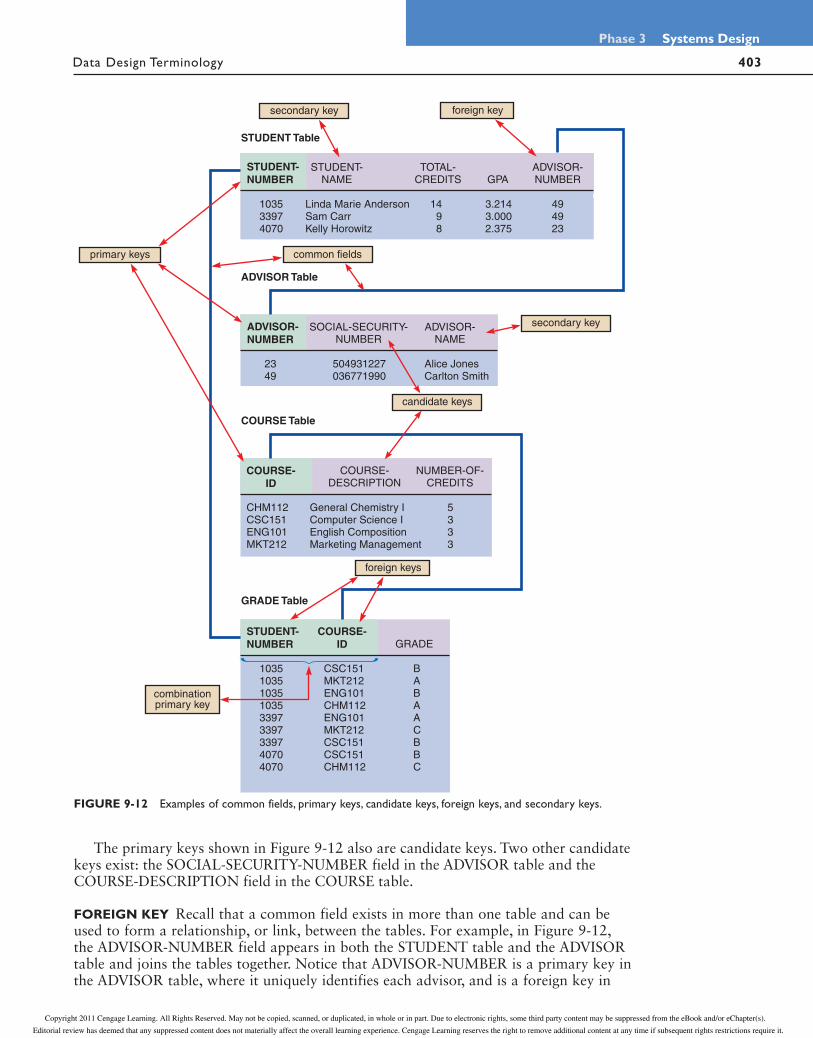
The primary keys shown in Figure 9-12 also are candidate keys. Two other candidate keys exist: the SOCIAL-SECURITY-NUMBER field in the ADVISOR table and the COURSE-DESCRIPTION field in the COURSE table.
FOREIGN KEY Recall that a common field exists in more than one table and can be used to form a relationship, or link, between the tables. For example, in Figure 9-12, the ADVISOR-NUMBER field appears in both the STUDENT table and the ADVISOR table and joins the tables together. Notice that ADVISOR-NUMBER is a primary key in the ADVISOR table, where it uniquely identifies each advisor, and is a foreign key in
combinationprimary key
GRADE Table
COURSE Table
ADVISOR Table
STUDENT Table
primary keys
secondary key
common fields
candidate keys
foreign key
secondary key
foreign keys
STUDENT-NUMBER
ADVISOR-NUMBER
COURSE-
ID
STUDENT-
NUMBER
COURSE-
ID
FIGURE 9-12 Examples of common fields, primary keys, candidate keys, foreign keys, and secondary keys.
Copyright 2011 Cengage Learning. All Rights Reserved. May not be copied, scanned, or duplicated, in whole or in part. Due to electronic rights, some third party content may be suppressed from the eBook and/or eChapter(s).
Editorial review has deemed that any suppressed content does not materially affect the overall learning experience. Cengage Learning reserves the right to remove additional content at any time if subsequent rights restrictions require it.
404
Chapter 9 Data Design
Data Design Terminology
the STUDENT table. A foreign key is a field in one table that must match a primary key value in another table in order to establish the relationship between the two tables.
Unlike a primary key, a foreign key need not be unique. For example, Carlton Smith has advisor number 49. The value 49 must be a unique value in the ADVISOR table because it is the primary key, but 49 can appear any number of times in the STUDENT table, where the advisor number serves as a foreign key.
Figure 9-12 on the previous page also shows how two foreign keys can serve as a com-posite primary key in another table. Consider the GRADE table at the bottom of the figure. The two fields that form the primary key for the GRADE table are both foreign keys: the STUDENT-NUMBER field, which must match a student number in the STUDENT table, and the COURSE-ID field, which must match one of the course IDs in the COURSE table.
How can these two foreign keys serve as a primary key in the GRADE table? When you study the table, you will notice that student numbers and course IDs can appear any number of times, but the combination of a specific student and a specific course occurs only once. For example, student 1035 appears four times and course CSC151 appears three times — but there is only one combined instance of student 1035 and course CSC151. Because the combination of the specific student (1035) and the specific course (CSC151) is unique, it ensures that the grade (B) will be assigned to the proper student in the proper course.
SECONDARY KEY A secondary key is a field or combination of fields that can be used to access or retrieve records. Secondary key values are not unique. For example, if you need to access records for only those customers in a specific ZIP code, you would use the ZIP code field as a secondary key. Secondary keys also can be used to sort or dis-play records in a certain order. For example, you could use the GPA field in a STUDENT file to display records for all students in grade point order.
The need for a secondary key arises because a table can have only one primary key. In a CUSTOMER file, the CUSTOMER-NUMBER is the primary key, so it must be unique. You might know a customer’s name, but not the customer’s number. For exam-ple, you might want to access a customer named James Morgan, but you do not know his customer number. If you search the table using the CUSTOMER-NAME field as a secondary key, you can retrieve the records for all customers named James Morgan and then select the correct one.
In Figure 9-12, student name and advisor names are identified as secondary keys, but other fields also could be used. For example, to find all students who have a particular advisor, you could use the ADVISOR-NUMBER field in the STUDENT file as a secondary key.
Referential Integrity
Validity checks can help avoid data input errors. One type of validity check, called referential integrity, is a set of rules that avoids data inconsistency and quality problems. In a relational database, referential integrity means that a foreign key value cannot be entered in one table unless it matches an existing primary key in another table. For example, referential integrity would prevent you from entering a customer order in an order table unless that customer already exists in the customer table. Without referential integrity, you might have an order called an orphan, because it had no related customer.
In the example shown in Figure 9-12 on page 403, referential integrity will not allow a user to enter an advisor number (foreign key value) in the STUDENT table unless a valid advisor number (primary key value) already exists in the ADVISOR table.
To learn more about referential integrity, visit the Management Information Systems CourseMate Web site at www.cengagebrain.com, navigate to On the Web Links for this chapter, and locate the Referential Integrity link.
Copyright 2011 Cengage Learning. All Rights Reserved. May not be copied, scanned, or duplicated, in whole or in part. Due to electronic rights, some third party content may be suppressed from the eBook and/or eChapter(s).
Editorial review has deemed that any suppressed content does not materially affect the overall learning experience. Cengage Learning reserves the right to remove additional content at any time if subsequent rights restrictions require it.
405 Entity-Relationship Diagrams
Phase 3 Systems Design
Referential integrity also can prevent the deletion of a record if the record has a primary key that matches foreign keys in another table. For example, suppose that an advisor resigns to accept a position at another school. You cannot delete the advisor from the ADVISOR table while records in the STUDENT file still refer to that advisor number. Otherwise, the STUDENT records would be orphans. To avoid the problem, students must be reassigned to other advisors by changing the value in the ADVISOR-NUMBER field; then the advisor record can be deleted.
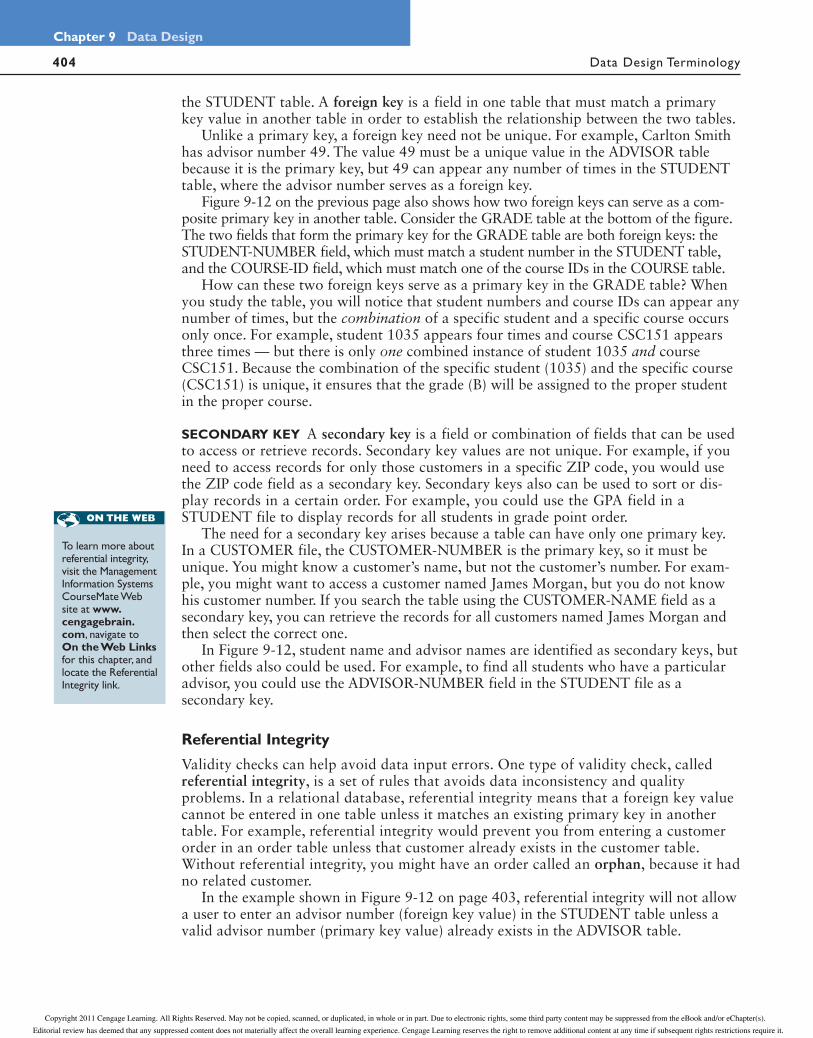
When creating a relational database, you can build referential integrity into the design. Figure 9-13 shows a Microsoft Access screen that identifies a common field and allows the user to enforce referential integrity rules.
ENTITY-RELATIONSHIP DIAGRAMS
Recall that an entity is a person, place, thing, or event for which data is collected and maintained. For example, entities might be customers, sales regions, products, or orders. An information system must recognize the relationships among entities. For example, a customer entity can have several instances of an order entity, and an employee entity can have one instance, or none, of a spouse entity.
To learn more about entity-relationship diagrams, visit the Management Information Systems CourseMate Web site at www.cengagebrain.com, navigate to On the Web Links for this chapter, and locate the Entity-Relationship Diagrams link.
FIGURE 9-13 Microsoft Access allows a user to specify that referential integrity rules will be enforced in a relational database design.
user checks this box to enforce referential integrity
VIDEO LEARNING SESSION: ENTITY-RELATIONSHIP DIAGRAMS
Video Learning Sessions can help you understand key concepts, practice your skills, and check your work. To access the sessions, visit the Management Information Systems CourseMate Web site at www.cengagebrain.com and navigate to the Video Learning Sessions for this book. In this session, you’ll learn how to create an entity-relationship diagram (ERD) that shows the system entities and the nature of their relationships.
Copyright 2011 Cengage Learning. All Rights Reserved. May not be copied, scanned, or duplicated, in whole or in part. Due to electronic rights, some third party content may be suppressed from the eBook and/or eChapter(s).
Editorial review has deemed that any suppressed content does not materially affect the overall learning experience. Cengage Learning reserves the right to remove additional content at any time if subsequent rights restrictions require it.
406
Chapter 9 Data Design
Entity-Relationship Diagrams
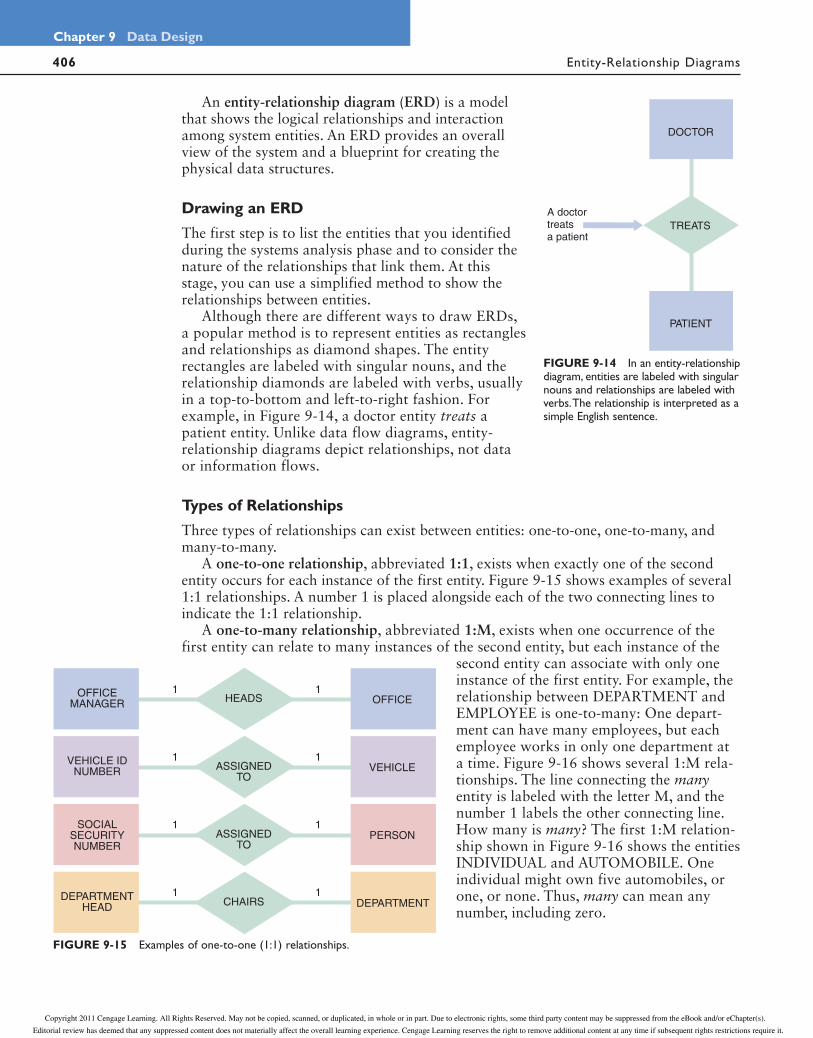
An entity-relationship diagram (ERD) is a model that shows the logical relationships and interaction among system entities. An ERD provides an overall view of the system and a blueprint for creating the physical data structures.
Drawing an ERD
The first step is to list the entities that you identified during the systems analysis phase and to consider the nature of the relationships that link them. At this stage, you can use a simplified method to show the relationships between entities.
Although there are different ways to draw ERDs, a popular method is to represent entities as rectangles and relationships as diamond shapes. The entity rectangles are labeled with singular nouns, and the relationship diamonds are labeled with verbs, usually in a top-to-bottom and left-to-right fashion. For example, in Figure 9-14, a doctor entity treats a patient entity. Unlike data flow diagrams, entity-relationship diagrams depict relationships, not data or information flows.
Types of Relationships
Three types of relationships can exist between entities: one-to-one, one-to-many, and many-to-many.
A one-to-one relationship, abbreviated 1:1, exists when exactly one of the second entity occurs for each instance of the first entity. Figure 9-15 shows examples of several 1:1 relationships. A number 1 is placed alongside each of the two connecting lines to indicate the 1:1 relationship.
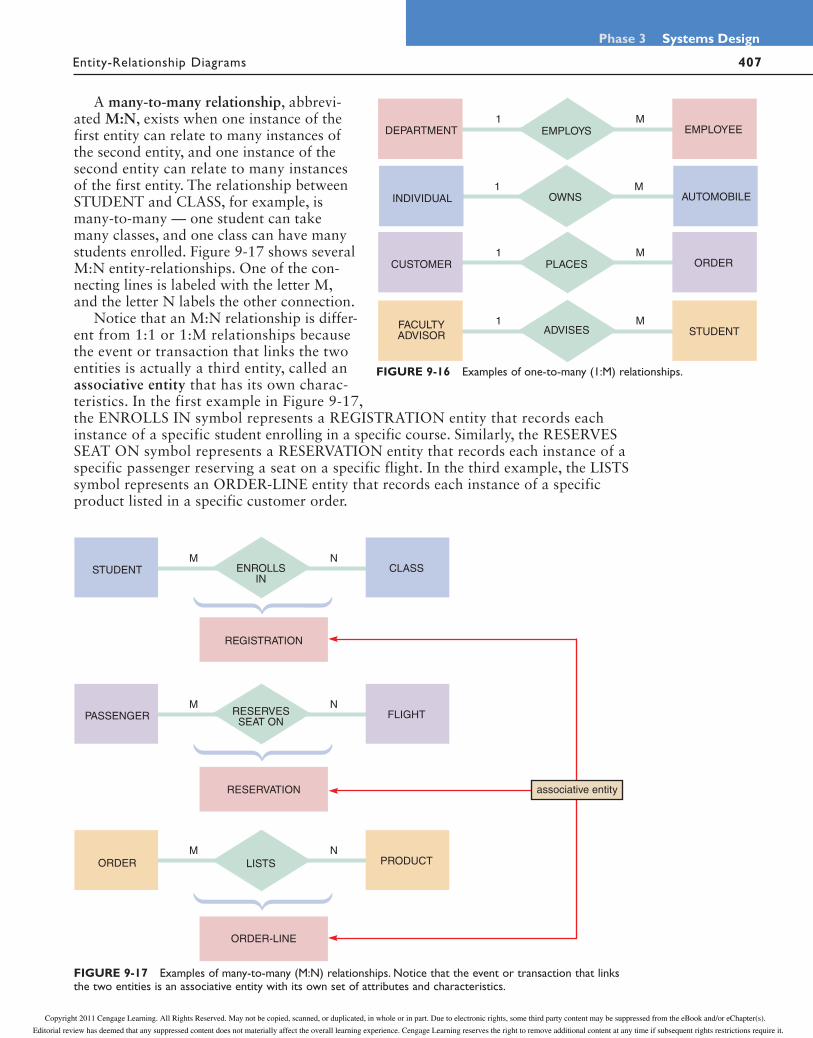
A one-to-many relationship, abbreviated 1:M, exists when one occurrence of the first entity can relate to many instances of the second entity, but each instance of the
second entity can associate with only one instance of the first entity. For example, the relationship between DEPARTMENT and EMPLOYEE is one-to-many: One depart-ment can have many employees, but each employee works in only one department at a time. Figure 9-16 shows several 1:M rela-tionships. The line connecting the many entity is labeled with the letter M, and the number 1 labels the other connecting line. How many is many? The first 1:M relation-ship shown in Figure 9-16 shows the entities INDIVIDUAL and AUTOMOBILE. One individual might own five automobiles, or one, or none. Thus, many can mean any number, including zero.
TREATS
FIGURE 9-14 In an entity-relationship diagram, entities are labeled with singular nouns and relationships are labeled with verbs. The relationship is interpreted as a simple English sentence.
HEADSOFFICE
MANAGER OFFICE
ASSIGNED TO
VEHICLE IDNUMBER VEHICLE
ASSIGNED TO
SOCIAL SECURITY NUMBER
PERSON
CHAIRSDEPARTMENT
HEAD DEPARTMENT
1 1
1 1
1 1
1 1
FIGURE 9-15 Examples of one-to-one (1:1) relationships.
Copyright 2011 Cengage Learning. All Rights Reserved. May not be copied, scanned, or duplicated, in whole or in part. Due to electronic rights, some third party content may be suppressed from the eBook and/or eChapter(s).
Editorial review has deemed that any suppressed content does not materially affect the overall learning experience. Cengage Learning reserves the right to remove additional content at any time if subsequent rights restrictions require it.
407 Entity-Relationship Diagrams
Phase 3 Systems Design
A many-to-many relationship, abbrevi-ated M:N, exists when one instance of the first entity can relate to many instances of the second entity, and one instance of the second entity can relate to many instances of the first entity. The relationship between STUDENT and CLASS, for example, is many-to-many — one student can take many classes, and one class can have many students enrolled. Figure 9-17 shows several M:N entity-relationships. One of the con-necting lines is labeled with the letter M, and the letter N labels the other connection.
Notice that an M:N relationship is differ-ent from 1:1 or 1:M relationships because the event or transaction that links the two entities is actually a third entity, called an associative entity that has its own charac-teristics. In the first example in Figure 9-17, the ENROLLS IN symbol represents a REGISTRATION entity that records each instance of a specific student enrolling in a specific course. Similarly, the RESERVES SEAT ON symbol represents a RESERVATION entity that records each instance of a specific passenger reserving a seat on a specific flight. In the third example, the LISTS symbol represents an ORDER-LINE entity that records each instance of a specific product listed in a specific customer order.
PLACESCUSTOMER ORDER
ADVISESFACULTYADVISOR STUDENT
1 M
1 M
OWNSINDIVIDUAL AUTOMOBILE1 M
EMPLOYSDEPARTMENT EMPLOYEE1 M
FIGURE 9-16 Examples of one-to-many (1:M) relationships.
ENROLLSIN
STUDENT CLASS
RESERVES SEAT ON
PASSENGER FLIGHT
LISTSORDER PRODUCT
M N
M N
M N
REGISTRATION
RESERVATION
ORDER-LINE
associative entity
FIGURE 9-17 Examples of many-to-many (M:N) relationships. Notice that the event or transaction that links the two entities is an associative entity with its own set of attributes and characteristics.
Copyright 2011 Cengage Learning. All Rights Reserved. May not be copied, scanned, or duplicated, in whole or in part. Due to electronic rights, some third party content may be suppressed from the eBook and/or eChapter(s).
Editorial review has deemed that any suppressed content does not materially affect the overall learning experience. Cengage Learning reserves the right to remove additional content at any time if subsequent rights restrictions require it.
408
Chapter 9 Data Design
Entity-Relationship Diagrams
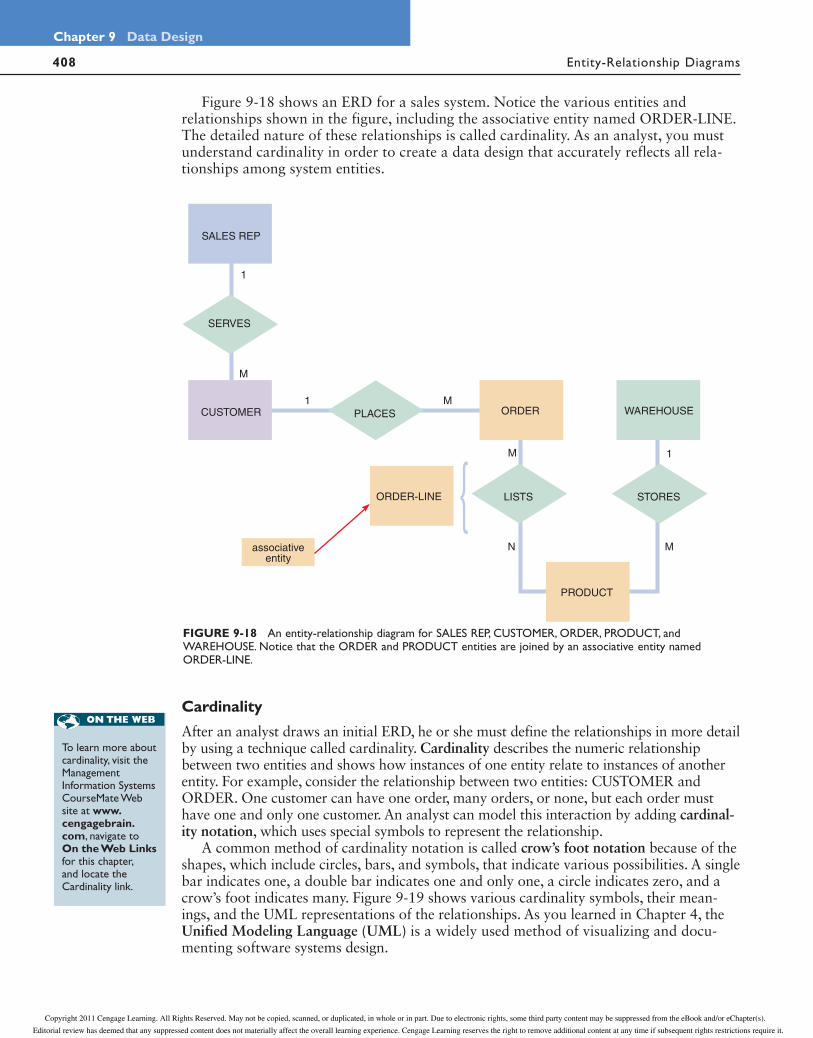
Figure 9-18 shows an ERD for a sales system. Notice the various entities and relationships shown in the figure, including the associative entity named ORDER-LINE. The detailed nature of these relationships is called cardinality. As an analyst, you must understand cardinality in order to create a data design that accurately reflects all rela-tionships among system entities.
SERVES
SALES REP
PLACESCUSTOMER ORDER
ORDER-LINE
WAREHOUSE
LISTS STORES
PRODUCT
1 M
M
1M
M
1
Nassociativeentity
FIGURE 9-18 An entity-relationship diagram for SALES REP, CUSTOMER, ORDER, PRODUCT, and WAREHOUSE. Notice that the ORDER and PRODUCT entities are joined by an associative entity named ORDER-LINE.
Cardinality
After an analyst draws an initial ERD, he or she must define the relationships in more detail by using a technique called cardinality. Cardinality describes the numeric relationship between two entities and shows how instances of one entity relate to instances of another entity. For example, consider the relationship between two entities: CUSTOMER and ORDER. One customer can have one order, many orders, or none, but each order must have one and only one customer. An analyst can model this interaction by adding cardinal-ity notation, which uses special symbols to represent the relationship.
A common method of cardinality notation is called crow’s foot notation because of the shapes, which include circles, bars, and symbols, that indicate various possibilities. A single bar indicates one, a double bar indicates one and only one, a circle indicates zero, and a crow’s foot indicates many. Figure 9-19 shows various cardinality symbols, their mean-ings, and the UML representations of the relationships. As you learned in Chapter 4, the Unified Modeling Language (UML) is a widely used method of visualizing and docu-menting software systems design.
To learn more about cardinality, visit the Management Information Systems CourseMate Web site at www.cengagebrain.com, navigate to On the Web Links for this chapter, and locate the Cardinality link.
Copyright 2011 Cengage Learning. All Rights Reserved. May not be copied, scanned, or duplicated, in whole or in part. Due to electronic rights, some third party content may be suppressed from the eBook and/or eChapter(s).
Editorial review has deemed that any suppressed content does not materially affect the overall learning experience. Cengage Learning reserves the right to remove additional content at any time if subsequent rights restrictions require it.

409 Entity-Relationship Diagrams
Phase 3 Systems Design
In Figure 9-20, four examples of cardinal-ity notation are shown. In the first example, one and only one CUSTOMER can place any-where from zero to many of the ORDER entity. In the second example, one and only one ORDER can include one ITEM ORDERED or many. In the third example, one and only one EMPLOYEE can have one SPOUSE or none. In the fourth example, one EMPLOYEE, or many employees, or none, can be assigned to one PROJECT, or many projects, or none.
Most CASE products support the drawing of ERDs from entities in the data repository. Figure 9-21 on the next page shows part of a library system ERD drawn using the Visible Analyst CASE tool. Notice that crow’s foot nota-tion is used to show the nature of the relation-ships, which are described in both directions.
Now that you understand database ele-ments and their relationships, you can start designing tables. The first step is the normal-ization of your table designs, which is described next.
PLACES
INCLUDESORDER
PROJECT
One and only one CUSTOMER can place anywhere from zero to many of theORDER entity.
One and only one ORDER can include one ITEM ORDERED or many.
One and only one EMPLOYEE can have one SPOUSE or NONE.
One EMPLOYEE, or many employees, or none, can be assigned to one PROJECT, or many projects, or none.
EMPLOYEE HAS SPOUSE
ITEM ORDERED
ORDERCUSTOMER
EXAMPLES OF CARDINALITY NOTATION
EMPLOYEE ASSIGNED TO
FIGURE 9-20 In the first example of cardinality notation, one and only one CUSTOMER can place anywhere from zero to many of the ORDER entity. In the second example, one and only one ORDER can include one ITEM ORDERED or many. In the third example, one and only one EMPLOYEE can have one SPOUSE or none. In the fourth example, one EMPLOYEE, or many employees, or none, can be assigned to one PROJECT, or many projects, or none.
One and only one
One or many
Zero, or one, or many
Zero, or one
1
1..*
0..*
0..1
UMLSYMBOL MEANING REPRESENTATION
FIGURE 9-19 Crow’s foot notation is a common method of indicating cardinality. The four examples show how you can use various symbols to describe the relationships between entities.
Copyright 2011 Cengage Learning. All Rights Reserved. May not be copied, scanned, or duplicated, in whole or in part. Due to electronic rights, some third party content may be suppressed from the eBook and/or eChapter(s).
Editorial review has deemed that any suppressed content does not materially affect the overall learning experience. Cengage Learning reserves the right to remove additional content at any time if subsequent rights restrictions require it.

410
Chapter 9 Data Design
Normalization
FIGURE 9-21 An ERD for a library system drawn with Visible Analyst. Notice that crow’s foot notation has been used and relationships are described in both directions.
CASE IN POINT 9.1: TOPTEXT PUBLISHING
TopText Publishing is a textbook publishing company with a headquarters location, a warehouse, and three sales offices that each have a sales manager and sales reps. TopText sells to schools, colleges, and individual customers. Many authors write more than one book for TopText, and some books are written by more than one author. TopText maintains an active list of more than 100 books, each identified by a universal code called an ISBN number. You have been asked to draw an ERD for the TopText information system, and to include cardinality notation.
NORMALIZATION
Normalization is the process of creating table designs by assigning specific fields or attributes to each table in the database. A table design specifies the fields and identifies the primary key in a particular table or file. Working with a set of initial table designs, you use normalization to develop an overall database design that is simple, flexible, and free of data redundancy. Normalization involves applying a set of rules that can help you identify and correct inherent problems and complexities in your table designs. The concept of normalization is based on the work of Edgar Codd, a British computer scien-tist who formulated the basic principles of relational database design.
The normalization process typically involves four stages: unnormalized design, first normal form, second normal form, and third normal form. The three normal forms constitute a progression in which third normal form represents the best design. Most business-related databases must be designed in third normal form.
To learn more about normalization, visit the Management Information Systems CourseMate Web site at www.cengagebrain.com, navigate to On the Web Links for this chapter, and locate the Normalization link.
Copyright 2011 Cengage Learning. All Rights Reserved. May not be copied, scanned, or duplicated, in whole or in part. Due to electronic rights, some third party content may be suppressed from the eBook and/or eChapter(s).
Editorial review has deemed that any suppressed content does not materially affect the overall learning experience. Cengage Learning reserves the right to remove additional content at any time if subsequent rights restrictions require it.
411 Normalization
Phase 3 Systems Design
ORDER(UNNORMALIZED)
primary key primary keyfor repeating group
repeating groups
2011
2011
2011
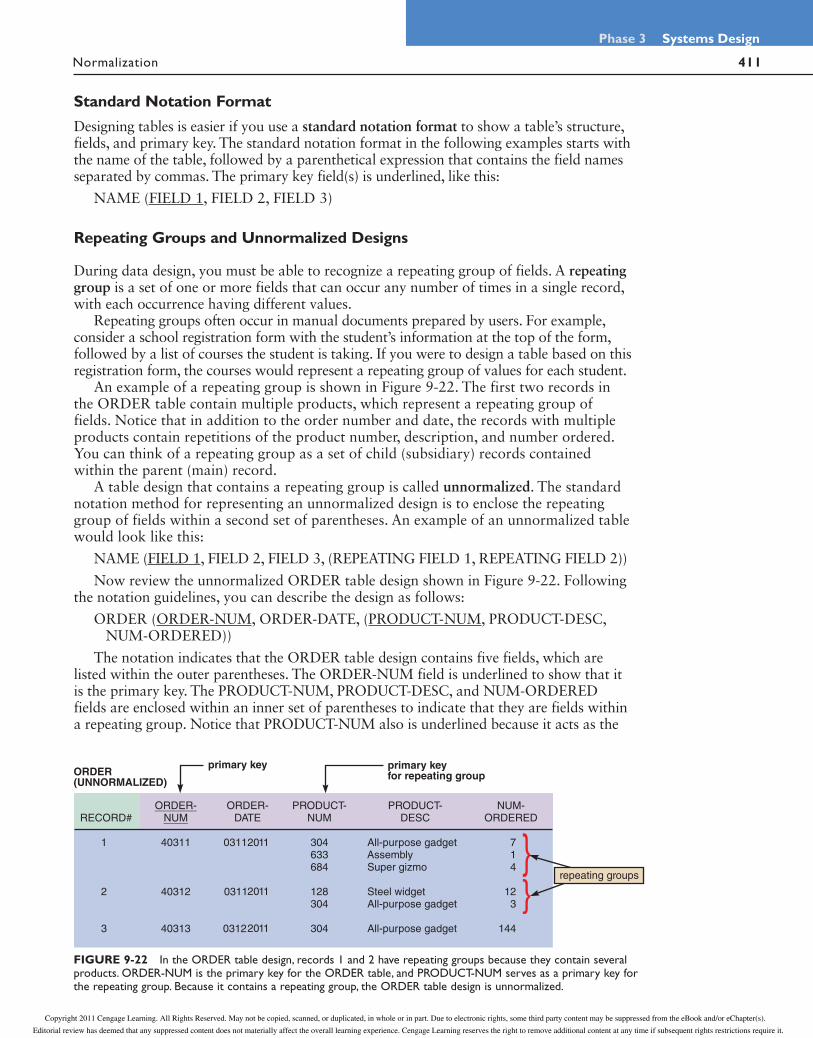
FIGURE 9-22 In the ORDER table design, records 1 and 2 have repeating groups because they contain several products. ORDER-NUM is the primary key for the ORDER table, and PRODUCT-NUM serves as a primary key for the repeating group. Because it contains a repeating group, the ORDER table design is unnormalized.
Standard Notation Format
Designing tables is easier if you use a standard notation format to show a table’s structure, fields, and primary key. The standard notation format in the following examples starts with the name of the table, followed by a parenthetical expression that contains the field names separated by commas. The primary key field(s) is underlined, like this:
NAME (FIELD 1, FIELD 2, FIELD 3)
Repeating Groups and Unnormalized Designs
During data design, you must be able to recognize a repeating group of fields. A repeating group is a set of one or more fields that can occur any number of times in a single record, with each occurrence having different values.
Repeating groups often occur in manual documents prepared by users. For example, consider a school registration form with the student’s information at the top of the form, followed by a list of courses the student is taking. If you were to design a table based on this registration form, the courses would represent a repeating group of values for each student.
An example of a repeating group is shown in Figure 9-22. The first two records in the ORDER table contain multiple products, which represent a repeating group of fields. Notice that in addition to the order number and date, the records with multiple products contain repetitions of the product number, description, and number ordered. You can think of a repeating group as a set of child (subsidiary) records contained within the parent (main) record.
A table design that contains a repeating group is called unnormalized. The standard notation method for representing an unnormalized design is to enclose the repeating group of fields within a second set of parentheses. An example of an unnormalized table would look like this:
NAME (FIELD 1, FIELD 2, FIELD 3, (REPEATING FIELD 1, REPEATING FIELD 2))
Now review the unnormalized ORDER table design shown in Figure 9-22. Following the notation guidelines, you can describe the design as follows:
ORDER (ORDER-NUM, ORDER-DATE, (PRODUCT-NUM, PRODUCT-DESC, NUM-ORDERED))
The notation indicates that the ORDER table design contains five fields, which are listed within the outer parentheses. The ORDER-NUM field is underlined to show that it is the primary key. The PRODUCT-NUM, PRODUCT-DESC, and NUM-ORDERED fields are enclosed within an inner set of parentheses to indicate that they are fields within a repeating group. Notice that PRODUCT-NUM also is underlined because it acts as the
Copyright 2011 Cengage Learning. All Rights Reserved. May not be copied, scanned, or duplicated, in whole or in part. Due to electronic rights, some third party content may be suppressed from the eBook and/or eChapter(s).
Editorial review has deemed that any suppressed content does not materially affect the overall learning experience. Cengage Learning reserves the right to remove additional content at any time if subsequent rights restrictions require it.

412
Chapter 9 Data Design
Normalization
primary key of the repeating group. If a customer orders three different products in one order, then the fields PRODUCT-NUM, PRODUCT-DESC, and NUM-ORDERED repeat three times, as shown in Figure 9-22 on the previous page.
First Normal Form
A table is in first normal form (1NF) if it does not contain a repeating group. To convert an unnormalized design to 1NF, you must expand the table’s primary key to include the primary key of the repeating group.
For example, in the ORDER table shown in Figure 9-22, the repeating group consists of three fields: PRODUCT-NUM, PRODUCT-DESC, and NUM-ORDERED. Of the three fields, only PRODUCT-NUM can be a primary key because it uniquely identifies each instance of the repeating group. The product description cannot be a primary key because it might or might not be unique. For example, a company might sell a large number of parts with the same descriptive name, such as washer, relying on a coded part number to identify uniquely each washer size.
When you expand the primary key of ORDER table to include PRODUCT-NUM, you eliminate the repeating group and the ORDER table is now in 1NF, as shown:
ORDER (ORDER-NUM, ORDER-DATE, PRODUCT-NUM, PRODUCT-DESC, NUM-ORDERED)
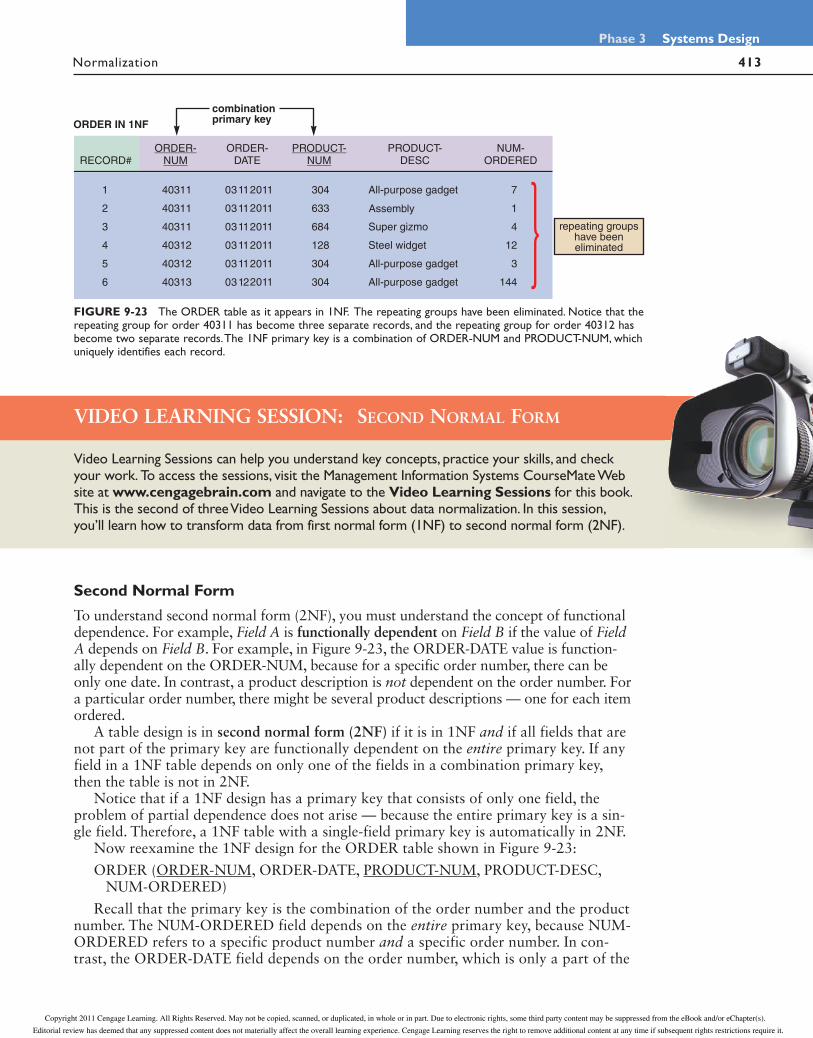
Figure 9-23 shows the ORDER table in 1NF. Notice that when you eliminate the repeating group, additional records emerge — one for each combination of a specific order and a specific product. The result is more records, but a greatly simplified design. In the new version, the repeating group for order number 40311 has become three sepa-rate records, and the repeating group for order number 40312 has become two separate records. Therefore, when a table is in 1NF, each record stores data about a single instance of a specific order and a specific product.
Also notice that the 1NF design shown in Figure 9-23 has a combination primary key. The primary key of the 1NF design cannot be the ORDER-NUM field alone, because the order number does not uniquely identify each product in a multiple-item order. Similarly, PRODUCT-NUM cannot be the primary key, because it appears more than once if several orders include the same product. Because each record must reflect a specific product in a specific order, you need both fields, ORDER-NUM and PRODUCT-NUM, to identify a single record uniquely. Therefore, the primary key is the combination of two fields: ORDER-NUM and PRODUCT-NUM.
VIDEO LEARNING SESSION: FIRST NORMAL FORM
Video Learning Sessions can help you understand key concepts, practice your skills, and check your work. To access the sessions, visit the Management Information Systems CourseMate Web site at www.cengagebrain.com and navigate to the Video Learning Sessions for this book. This is the first of three Video Learning Sessions about data normalization. In this session, you’ll learn how to transform unnormalized data into first normal form (1NF).
e
Copyright 2011 Cengage Learning. All Rights Reserved. May not be copied, scanned, or duplicated, in whole or in part. Due to electronic rights, some third party content may be suppressed from the eBook and/or eChapter(s).
Editorial review has deemed that any suppressed content does not materially affect the overall learning experience. Cengage Learning reserves the right to remove additional content at any time if subsequent rights restrictions require it.
413 Normalization
Phase 3 Systems Design
Second Normal Form
To understand second normal form (2NF), you must understand the concept of functional dependence. For example, Field A is functionally dependent on Field B if the value of Field A depends on Field B. For example, in Figure 9-23, the ORDER-DATE value is function-ally dependent on the ORDER-NUM, because for a specific order number, there can be only one date. In contrast, a product description is not dependent on the order number. For a particular order number, there might be several product descriptions — one for each item ordered.
A table design is in second normal form (2NF) if it is in 1NF and if all fields that are not part of the primary key are functionally dependent on the entire primary key. If any field in a 1NF table depends on only one of the fields in a combination primary key, then the table is not in 2NF.
Notice that if a 1NF design has a primary key that consists of only one field, the problem of partial dependence does not arise — because the entire primary key is a sin-gle field. Therefore, a 1NF table with a single-field primary key is automatically in 2NF.
Now reexamine the 1NF design for the ORDER table shown in Figure 9-23:
ORDER (ORDER-NUM, ORDER-DATE, PRODUCT-NUM, PRODUCT-DESC, NUM-ORDERED)
Recall that the primary key is the combination of the order number and the product number. The NUM-ORDERED field depends on the entire primary key, because NUM-ORDERED refers to a specific product number and a specific order number. In con-trast, the ORDER-DATE field depends on the order number, which is only a part of the
ORDER IN 1NF
combinationprimary key
repeating groupshave beeneliminated
z
FIGURE 9-23 The ORDER table as it appears in 1NF. The repeating groups have been eliminated. Notice that the repeating group for order 40311 has become three separate records, and the repeating group for order 40312 has become two separate records. The 1NF primary key is a combination of ORDER-NUM and PRODUCT-NUM, which uniquely identifies each record.
VIDEO LEARNING SESSION: SECOND NORMAL FORM
Video Learning Sessions can help you understand key concepts, practice your skills, and check your work. To access the sessions, visit the Management Information Systems CourseMate Web site at www.cengagebrain.com and navigate to the Video Learning Sessions for this book. This is the second of three Video Learning Sessions about data normalization. In this session, you’ll learn how to transform data from first normal form (1NF) to second normal form (2NF).
Copyright 2011 Cengage Learning. All Rights Reserved. May not be copied, scanned, or duplicated, in whole or in part. Due to electronic rights, some third party content may be suppressed from the eBook and/or eChapter(s).
Editorial review has deemed that any suppressed content does not materially affect the overall learning experience. Cengage Learning reserves the right to remove additional content at any time if subsequent rights restrictions require it.

414
Chapter 9 Data Design
Normalization
primary key. Similarly, the PRODUCT-DESC field depends on the product number, which also is only a part of the primary key. Because some fields are not dependent on the entire primary key, the design is not in 2NF.
A standard process exists for converting a table from 1NF to 2NF. The objective is to break the original table into two or more new tables and reassign the fields so that each nonkey field will depend on the entire primary key in its table. To accomplish this, you follow these steps:
1. First, create and name a separate table for each field in the existing primary key. For example, in Figure 9-23 on the previous page, the ORDER table’s primary key has two fields, ORDER-NUM and PRODUCT-NUM, so you must create two tables. The ellipsis (…) indicates that fields will be assigned later. The result is:
ORDER (ORDER-NUM,...)
PRODUCT (PRODUCT-NUM,...)
2. Next, create a new table for each possible combination of the original primary key fields. In the Figure 9-23 example, you would create and name a new table with a combination primary key of ORDER-NUM and PRODUCT-NUM. This table describes individual lines in an order, so it is named ORDER-LINE, as shown:
ORDER-LINE (ORDER-NUM, PRODUCT-NUM,...)
3. Finally, study the three tables and place each field with its appropriate primary key, which is the minimal key on which it functionally depends. When you finish placing all the fields, remove any table that did not have any additional fields assigned to it. The remaining tables are the 2NF version of your original table. In the Figure 9-23 example, the three tables would be shown as:
ORDER (ORDER-NUM, ORDER-DATE)
PRODUCT (PRODUCT-NUM, PRODUCT-DESC)
ORDER-LINE (ORDER-NUM, PRODUCT-NUM, NUM-ORDERED)
Figure 9-24 shows the 2NF table designs. By following the steps, you have converted the original 1NF table into three 2NF tables.
Why is it important to move from 1NF to 2NF? Four kinds of problems are found with 1NF designs that do not exist in 2NF:
• Consider the work necessary to change a particular product’s description. Suppose 500 current orders exist for product number 304. Changing the product description involves modifying 500 records for product number 304. Updating all 500 records would be cumbersome and expensive.
• 1NF tables can contain inconsistent data. Because someone must enter the product description in each record, nothing prevents product number 304 from having dif-ferent product descriptions in different records. In fact, if product number 304 appears in a large number of order records, some of the matching product descrip-tions might be inaccurate or improperly spelled. Even the presence or absence of a hyphen in the orders for All-purpose gadget would create consistency problems. If a data entry person must enter a term such as IO1 Queue Controller numerous times, it certainly is possible that some inconsistency will result.
• Adding a new product is a problem. Because the primary key must include an order number and a product number, you need values for both fields in order to add a record. What value do you use for the order number when you want to add a new product that has not been ordered by any customer? You could use a dummy order number, and then replace it with a real order number when the product is ordered to solve the problem, but that solution also creates difficulties.
Copyright 2011 Cengage Learning. All Rights Reserved. May not be copied, scanned, or duplicated, in whole or in part. Due to electronic rights, some third party content may be suppressed from the eBook and/or eChapter(s).
Editorial review has deemed that any suppressed content does not materially affect the overall learning experience. Cengage Learning reserves the right to remove additional content at any time if subsequent rights restrictions require it.

415 Normalization
Phase 3 Systems Design
• Deleting a product is a problem. If all the related records are deleted once an order is filled and paid for, what happens if you delete the only record that con-tains product number 633? The information about that product number and its description is lost.
Has the 2NF design eliminated all potential problems? To change a product descrip-tion, now you can change just one PRODUCT record. Multiple, inconsistent values for the product description are impossible because the description appears in only one loca-tion. To add a new product, you simply create a new PRODUCT record, instead of cre-ating a dummy order record. When you remove the last ORDER-LINE record for a particular product number, you do not lose that product number and its description because the PRODUCT record still exists. The four potential problems are eliminated, and the three 2NF designs are superior to both the original unnormalized table and the 1NF design.
primary key
primary keybased on
combination oftwo fields
ORDER IN 2NF
PRODUCT IN 2NF
ORDER-LINEIN 2NF
primary key
FIGURE 9-24 ORDER, PRODUCT, and ORDER-LINE tables in 2NF. All fields are functionally dependent on the primary key.
VIDEO LEARNING SESSION: THIRD NORMAL FORM
Video Learning Sessions can help you understand key concepts, practice your skills, and check your work. To access the sessions, visit the Management Information Systems CourseMate Web site at www.cengagebrain.com and navigate to the Video Learning Sessions for this book. This is the third of three Video Learning Sessions about data normalization. In this session, you’ll learn how to transform data from second normal form (2NF) to third normal form (3NF).
Copyright 2011 Cengage Learning. All Rights Reserved. May not be copied, scanned, or duplicated, in whole or in part. Due to electronic rights, some third party content may be suppressed from the eBook and/or eChapter(s).
Editorial review has deemed that any suppressed content does not materially affect the overall learning experience. Cengage Learning reserves the right to remove additional content at any time if subsequent rights restrictions require it.

416
Chapter 9 Data Design
Normalization
in 2NF, the nonkey field SALES-REP-NAME is
functionally dependent on another nonkey field,SALES-REP-NUM
CUSTOMER IN 2NF
FIGURE 9-25 2NF design for the CUSTOMER table.
Third Normal Form
A popular rule of thumb is that a design is in 3NF if every nonkey field depends on the key, the whole key, and nothing but the key. As you will see, a 3NF design avoids redun-dancy and data integrity problems that still can exist in 2NF designs.
Consider the following CUSTOMER table design, as shown in Figure 9-25:
CUSTOMER (CUSTOMER-NUM, CUSTOMER-NAME, ADDRESS, SALES-REP-NUM, SALES-REP-NAME)
The table is in 1NF because it has no repeating groups. The design also is in 2NF because the primary key is a single field. But the table still has four potential problems similar to the four 1NF problems described earlier. Changing the name of a sales rep still requires changing every record in which that sales rep name appears. Nothing about the design prohibits a particular sales rep from having different names in different records. In addition, because the sales rep name is included in the CUSTOMER table, you must create a dummy CUSTOMER record to add a new sales rep who has not yet been assigned any customers. Finally, if you delete all the records for customers of sales rep number 22, you will lose that sales rep’s number and name.
Those potential problems are caused because the design is not in 3NF. A table design is in third normal form (3NF) if it is in 2NF and if no nonkey field is dependent on another nonkey field. Remember that a nonkey field is a field that is not a candidate key for the primary key. The CUSTOMER example in Figure 9-25 is not in 3NF because one nonkey field, SALES-REP-NAME, depends on another nonkey field, SALES-REP-NUM.
To convert the table to 3NF, you must remove all fields from the 2NF table that depend on another nonkey field and place them in a new table that uses the nonkey field as a primary key. In the CUSTOMER example, the SALES-REP-NAME field depends on another field, SALES-REP-NUM, which is not part of the primary key. Therefore, to reach 3NF, you must remove SALES-REP-NAME and place it into a new table that uses SALES-REP-NUM as the primary key. As shown in Figure 9-26, the third normal form produces two separate tables:
CUSTOMER (CUSTOMER-NUM, CUSTOMER-NAME, ADDRESS, SALES-REP-NUM)
SALES-REP (SALES-REP-NUM, SALES-REP-NAME)
Copyright 2011 Cengage Learning. All Rights Reserved. May not be copied, scanned, or duplicated, in whole or in part. Due to electronic rights, some third party content may be suppressed from the eBook and/or eChapter(s).
Editorial review has deemed that any suppressed content does not materially affect the overall learning experience. Cengage Learning reserves the right to remove additional content at any time if subsequent rights restrictions require it.
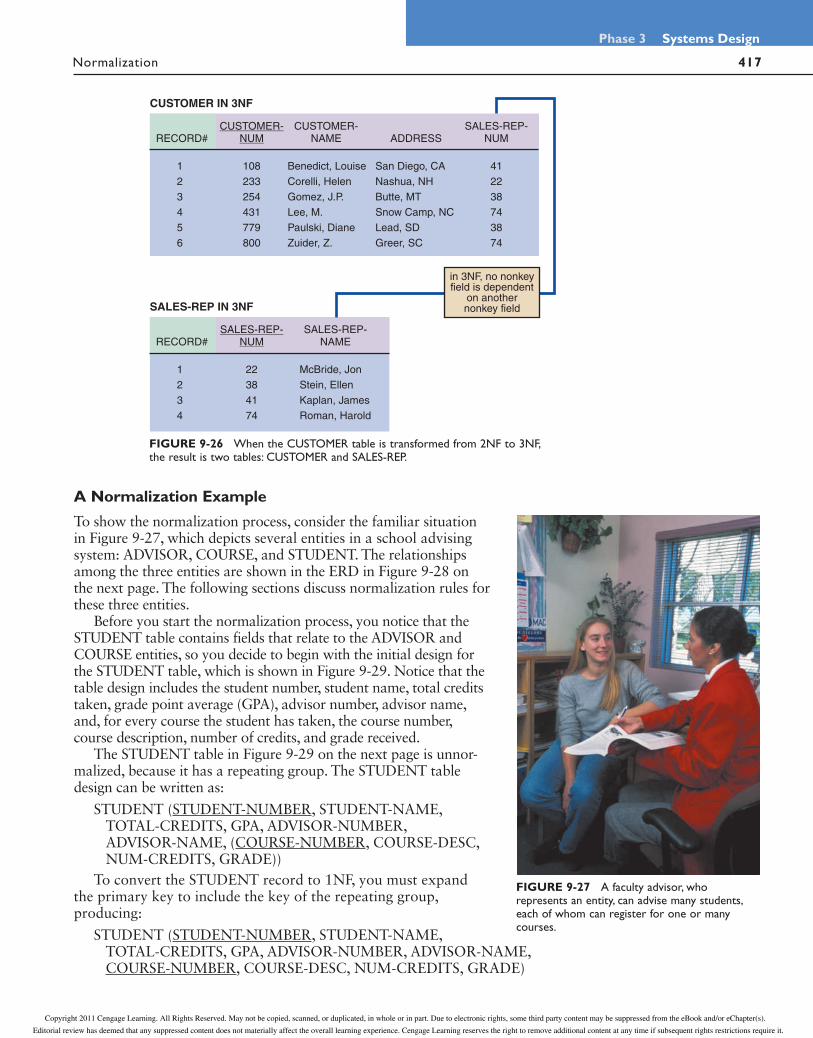
417 Normalization
Phase 3 Systems Design
A Normalization Example
To show the normalization process, consider the familiar situation in Figure 9-27, which depicts several entities in a school advising system: ADVISOR, COURSE, and STUDENT. The relationships among the three entities are shown in the ERD in Figure 9-28 on the next page. The following sections discuss normalization rules for these three entities.
Before you start the normalization process, you notice that the STUDENT table contains fields that relate to the ADVISOR and COURSE entities, so you decide to begin with the initial design for the STUDENT table, which is shown in Figure 9-29. Notice that the table design includes the student number, student name, total credits taken, grade point average (GPA), advisor number, advisor name, and, for every course the student has taken, the course number, course description, number of credits, and grade received.
The STUDENT table in Figure 9-29 on the next page is unnor-malized, because it has a repeating group. The STUDENT table design can be written as:
STUDENT (STUDENT-NUMBER, STUDENT-NAME, TOTAL-CREDITS, GPA, ADVISOR-NUMBER,
ADVISOR-NAME, (COURSE-NUMBER, COURSE-DESC, NUM-CREDITS, GRADE))
To convert the STUDENT record to 1NF, you must expand the primary key to include the key of the repeating group, producing:
STUDENT (STUDENT-NUMBER, STUDENT-NAME, TOTAL-CREDITS, GPA, ADVISOR-NUMBER, ADVISOR-NAME,
COURSE-NUMBER, COURSE-DESC, NUM-CREDITS, GRADE)
FIGURE 9-27 A faculty advisor, who represents an entity, can advise many students, each of whom can register for one or many courses.
in 3NF, no nonkeyfield is dependent
on anothernonkey field
CUSTOMER IN 3NF
SALES-REP IN 3NF
FIGURE 9-26 When the CUSTOMER table is transformed from 2NF to 3NF, the result is two tables: CUSTOMER and SALES-REP.
Copyright 2011 Cengage Learning. All Rights Reserved. May not be copied, scanned, or duplicated, in whole or in part. Due to electronic rights, some third party content may be suppressed from the eBook and/or eChapter(s).
Editorial review has deemed that any suppressed content does not materially affect the overall learning experience. Cengage Learning reserves the right to remove additional content at any time if subsequent rights restrictions require it.

418
Chapter 9 Data Design
Normalization
repeatinggroups
STUDENT
FIGURE 9-29 The STUDENT table is unnormalized because it contains a repeating group that represents the courses each student has taken.
Figure 9-30 shows the 1NF version of the sample STUDENT data. Do any of the fields in the 1NF STUDENT record depend on only a portion of the primary key? The student name, total credits, GPA, advisor number, and advisor name all relate only to the student number and have no relationship to the course number. The course descrip-tion depends on the course number, but not on the student number. Only the GRADE field depends on the entire primary key.
Following the 1NF – 2NF conversion process described earlier, you would create a new table for each field and combination of fields in the primary key, and place the other fields with their appropriate key. The result is:
STUDENT (STUDENT-NUMBER, STUDENT-NAME, TOTAL-CREDITS, GPA, ADVISOR-NUMBER, ADVISOR-NAME)
COURSE (COURSE-NUMBER, COURSE-DESC, NUM-CREDITS)
GRADE (STUDENT-NUMBER, COURSE-NUMBER, GRADE)
You now have converted the original 1NF STUDENT table to three tables, all in 2NF. In each table, every nonkey field depends on the entire primary key.
Figure 9-31 on page 420 shows the 2NF STUDENT, COURSE, and GRADE designs and sample data. Are all three tables in 3NF? The COURSE and GRADE are in 3NF. STUDENT is not in 3NF, however, because the ADVISOR-NAME field depends on the
ADVISESADVISOR STUDENT
TAKES
COURSE
1 M
M
N
FIGURE 9-28 An initial entity-relationship diagram for ADVISOR, STUDENT, and COURSE.
Copyright 2011 Cengage Learning. All Rights Reserved. May not be copied, scanned, or duplicated, in whole or in part. Due to electronic rights, some third party content may be suppressed from the eBook and/or eChapter(s).
Editorial review has deemed that any suppressed content does not materially affect the overall learning experience. Cengage Learning reserves the right to remove additional content at any time if subsequent rights restrictions require it.
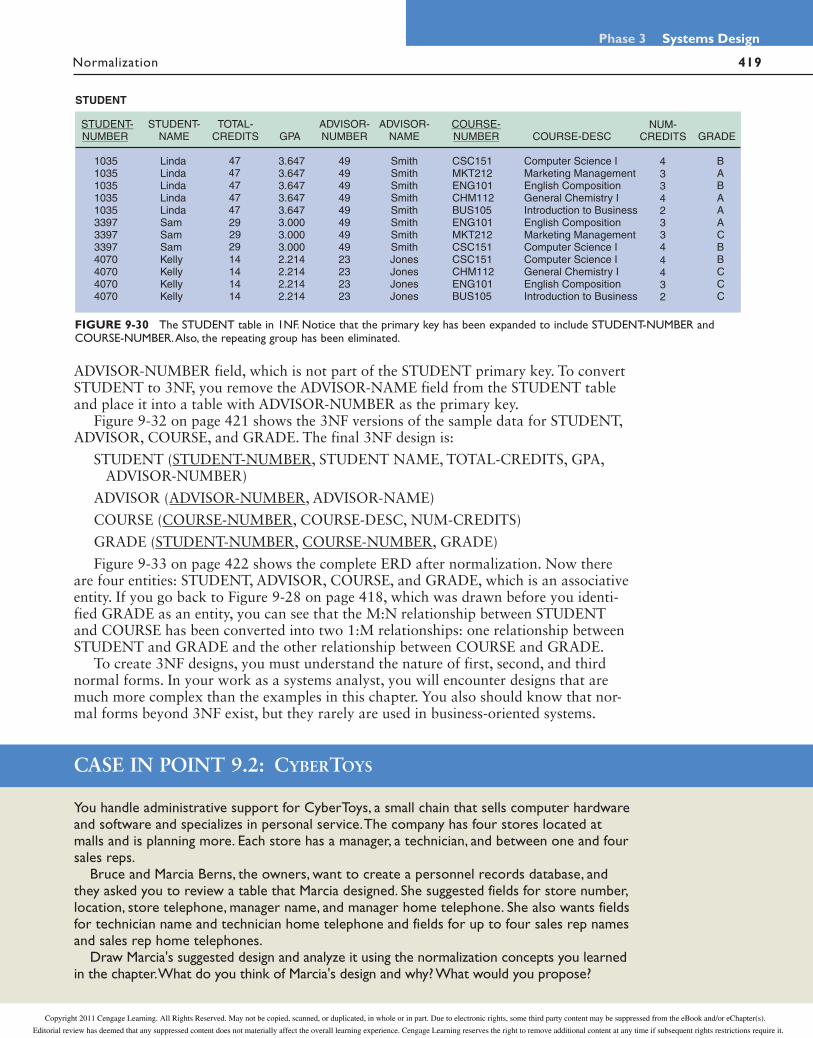
419 Normalization
Phase 3 Systems Design
FIGURE 9-30 The STUDENT table in 1NF. Notice that the primary key has been expanded to include STUDENT-NUMBER and COURSE-NUMBER. Also, the repeating group has been eliminated.
ADVISOR-NUMBER field, which is not part of the STUDENT primary key. To convert STUDENT to 3NF, you remove the ADVISOR-NAME field from the STUDENT table and place it into a table with ADVISOR-NUMBER as the primary key.
Figure 9-32 on page 421 shows the 3NF versions of the sample data for STUDENT, ADVISOR, COURSE, and GRADE. The final 3NF design is:
STUDENT (STUDENT-NUMBER, STUDENT NAME, TOTAL-CREDITS, GPA, ADVISOR-NUMBER)
ADVISOR (ADVISOR-NUMBER, ADVISOR-NAME)
COURSE (COURSE-NUMBER, COURSE-DESC, NUM-CREDITS)
GRADE (STUDENT-NUMBER, COURSE-NUMBER, GRADE)
Figure 9-33 on page 422 shows the complete ERD after normalization. Now there are four entities: STUDENT, ADVISOR, COURSE, and GRADE, which is an associative entity. If you go back to Figure 9-28 on page 418, which was drawn before you identi-fied GRADE as an entity, you can see that the M:N relationship between STUDENT and COURSE has been converted into two 1:M relationships: one relationship between STUDENT and GRADE and the other relationship between COURSE and GRADE.
To create 3NF designs, you must understand the nature of first, second, and third normal forms. In your work as a systems analyst, you will encounter designs that are much more complex than the examples in this chapter. You also should know that nor-mal forms beyond 3NF exist, but they rarely are used in business-oriented systems.
CASE IN POINT 9.2: CYBERTOYS
You handle administrative support for CyberToys, a small chain that sells computer hardware and software and specializes in personal service. The company has four stores located at malls and is planning more. Each store has a manager, a technician, and between one and four sales reps.
Bruce and Marcia Berns, the owners, want to create a personnel records database, and they asked you to review a table that Marcia designed. She suggested fields for store number, location, store telephone, manager name, and manager home telephone. She also wants fields for technician name and technician home telephone and fields for up to four sales rep names and sales rep home telephones.
Draw Marcia's suggested design and analyze it using the normalization concepts you learned in the chapter. What do you think of Marcia's design and why? What would you propose?
Copyright 2011 Cengage Learning. All Rights Reserved. May not be copied, scanned, or duplicated, in whole or in part. Due to electronic rights, some third party content may be suppressed from the eBook and/or eChapter(s).
Editorial review has deemed that any suppressed content does not materially affect the overall learning experience. Cengage Learning reserves the right to remove additional content at any time if subsequent rights restrictions require it.

420
Chapter 9 Data Design
Normalization
primary key
STUDENT
COURSE
GRADE
primary key
primary keybased on
combination oftwo fields
FIGURE 9-31 STUDENT, COURSE, and GRADE tables in 2NF. Notice that all fields are functionally dependent on the entire primary key of their respective tables.
Copyright 2011 Cengage Learning. All Rights Reserved. May not be copied, scanned, or duplicated, in whole or in part. Due to electronic rights, some third party content may be suppressed from the eBook and/or eChapter(s).
Editorial review has deemed that any suppressed content does not materially affect the overall learning experience. Cengage Learning reserves the right to remove additional content at any time if subsequent rights restrictions require it.
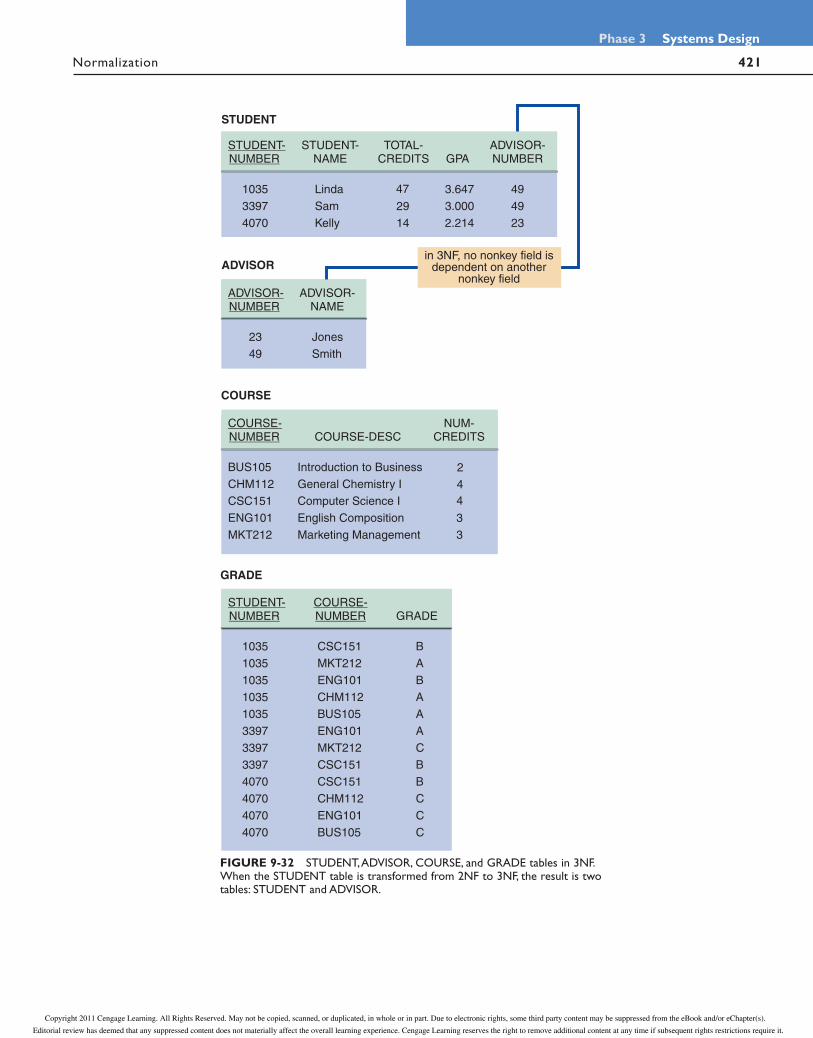
421 Normalization
Phase 3 Systems Design
in 3NF, no nonkey field isdependent on another
nonkey field
STUDENT
ADVISOR
COURSE
GRADE
FIGURE 9-32 STUDENT, ADVISOR, COURSE, and GRADE tables in 3NF. When the STUDENT table is transformed from 2NF to 3NF, the result is two tables: STUDENT and ADVISOR.
Copyright 2011 Cengage Learning. All Rights Reserved. May not be copied, scanned, or duplicated, in whole or in part. Due to electronic rights, some third party content may be suppressed from the eBook and/or eChapter(s).
Editorial review has deemed that any suppressed content does not materially affect the overall learning experience. Cengage Learning reserves the right to remove additional content at any time if subsequent rights restrictions require it.

422
Chapter 9 Data Design
Using Codes During Data Design
USING CODES DURING DATA DESIGN
A code is a set of letters or numbers that represents a data item. Codes can be used to simplify output, input, and data formats. During the data design process, you review existing codes and develop new ones that will be used to store and access data efficiently.
Overview of Codes
Because codes often are used to represent data, you encounter them constantly in your everyday life. Student numbers, for example, are unique codes to identify students in a school registration system. Three students with the name John Turner might be enrolled at your school, but only one is student number 268960.
Your ZIP code is another common example. A ZIP code contains multiple items of information compressed into nine digits. The first digit identifies one of ten geographical areas of the United States. The combination of the next three digits identifies a major city or major distribution point. The fifth digit identifies an individual post office, an area within a city, or a specific delivery unit. The last four digits identify a post office box or a specific street address.
For example, consider the ZIP code 27906-2624 shown in Figure 9-34. The first digit, 2, indicates a broad geographical area in the eastern United States. The digits, 790, indicate Elizabeth City, North Carolina. The fifth digit, 6, identifies the post office that services the College of the Albemarle. The last four digits, 2624, identify the post office box for the college.
FIGURE 9-34 A ZIP code is an example of a significant digit code that uses subgroups to provide information.
ADVISESADVISOR STUDENT
RECEIVES
SHOWSCOURSE GRADE
1 M
1
M
1 Massociative
entity
FIGURE 9-33 The entity-relationship diagram for STUDENT, ADVISOR, and COURSE after normalization. The GRADE entity was identified during the normalization process. GRADE is an associative entity that links the STUDENT and COURSE tables.
Copyright 2011 Cengage Learning. All Rights Reserved. May not be copied, scanned, or duplicated, in whole or in part. Due to electronic rights, some third party content may be suppressed from the eBook and/or eChapter(s).
Editorial review has deemed that any suppressed content does not materially affect the overall learning experience. Cengage Learning reserves the right to remove additional content at any time if subsequent rights restrictions require it.

423 Using Codes During Data Design
Phase 3 Systems Design
As you can imagine, codes serve many useful purposes. Because codes often are shorter than the data they represent, they save storage space and costs, reduce data transmission time, and decrease data entry time. For example, ZIP codes are used to classify and sort mail efficiently. Codes also can be used to reveal or conceal informa-tion. The last two digits of a seven-digit part number, for example, can represent the supplier number. The coded wholesale price on a retail price tag is known to salespeople but generally not to customers.
Finally, codes can reduce data input errors in situations when the coded data is easier to remember and enter than the original source data, when only certain valid codes are allowed, and when something within the code itself can provide immediate verification that the entry is correct.
Types of Codes
Companies use many different coding methods. Because information system users must work with coded data, the codes should be easy to learn and apply. If you plan to create new codes or change existing ones, you first should obtain comments and feedback from users. The following section describes eight common coding methods.
1. Sequence codes are numbers or letters assigned in a specific order. Sequence codes contain no additional information other than an indication of order of entry into the system. For example, a human resource system issues consecutive employee numbers to identify employees. Because the codes are assigned in the order in which employees are hired, you can use the code to see that employee number 584 was hired after employee number 433. The code, however, does not indicate the starting date of either person’s employment.
2. Block sequence codes use blocks of numbers for different classifications. College course numbers usually are assigned using a block sequence code. 100-level courses, such as Chemistry 110 and Mathematics 125, are freshman-level courses, whereas course numbers in the 200s indicate sophomore-level courses. Within a particular block, the sequence of numbers can have some additional meaning, such as when English 151 is the prerequisite for English 152.
3. Alphabetic codes use alphabet letters to distinguish one item from another based on a category, an abbreviation, or an easy-to-remember value, called a mnemonic code. Many classification codes fit more than one of the following definitions:
a. Category codes identify a group of related items. For example, a local department store uses a two-character category code to identify the depart-ment in which a product is sold: GN for gardening supplies, HW for hard-ware, and EL for electronics.
b. Abbreviation codes are alphabetic abbreviations. For example, standard state codes include NY for New York, ME for Maine, and MN for Minnesota. Some abbreviation codes are called mnemonic codes because they use a specific combination of letters that are easy to remember. Many three-character airport codes such as those pictured in Figure 9-35 on the next page are mnemonic codes: BOS represents Boston, SEA represents Seattle, and ANC represents Anchorage. Some airport codes are not mne-monic, such as ORD, which designates Chicago O’Hare International Airport, or HPN, which identifies the White Plains, New York Airport.
Copyright 2011 Cengage Learning. All Rights Reserved. May not be copied, scanned, or duplicated, in whole or in part. Due to electronic rights, some third party content may be suppressed from the eBook and/or eChapter(s).
Editorial review has deemed that any suppressed content does not materially affect the overall learning experience. Cengage Learning reserves the right to remove additional content at any time if subsequent rights restrictions require it.

424
Chapter 9 Data Design
Using Codes During Data Design
4. Significant digit codes distinguish items by using a series of subgroups of digits. ZIP codes, for example, are significant digit codes. Other such codes include inventory location codes that consist of a two-digit warehouse code, followed by a one-digit floor number code, a two-digit section code, a one-digit aisle number, and a two-digit bin number code. Figure 9-36 illustrates the inventory location code 11205327. What looks like a large eight-digit number is actually five separate numbers, each of which has significance.
5. Derivation codes combine data from different item attributes, or characteristics, to build the code. Most magazine subscription codes are deri-vation codes. One popular magazine’s subscriber code consists of the subscriber’s five-digit ZIP code, followed by the first, third, and fourth letters of the subscriber’s last name, the last two digits of the subscriber’s house number, and the
FIGURE 9-36 Sample of a code that uses significant digits to pinpoint the location of an inventory item.
FIGURE 9-35 Airline baggage tags include three-letter codes that identify airports, and machine-readable bar codes that contain information about the passenger, the flight number, and other pertinent information.
FIGURE 9-37 A magazine subscriber code is derived from various parts of the name and address.
first, third, and fourth letters of the subscriber’s street name. The magazine’s subscriber code for one particular subscriber is shown in Figure 9-37.
6. Cipher codes use a keyword to encode a number. A retail store, for example, might use a 10-letter word, such as CAMPGROUND, to code wholesale prices, where the letter C represents 1, A represents 2, and so on. Thus, the code, GRAND, indicates that the store paid $562.90 for the item.
7. Action codes indicate what action is to be taken with an associated item. For example, a student records program might prompt a user to enter or click an action code such as D (to display a record), A (to add a record), and X (to exit the program).
Developing a CodeDevising a code with too many features makes it difficult to remember, decipher, and verify. Keep the following suggestions in mind when developing a code:
1. Keep codes concise. Do not create codes that are longer than necessary. For exam-ple, if you need a code to identify each of 250 customers, you will not need a six-digit code.
Copyright 2011 Cengage Learning. All Rights Reserved. May not be copied, scanned, or duplicated, in whole or in part. Due to electronic rights, some third party content may be suppressed from the eBook and/or eChapter(s).
Editorial review has deemed that any suppressed content does not materially affect the overall learning experience. Cengage Learning reserves the right to remove additional content at any time if subsequent rights restrictions require it.

425 Using Codes During Data Design
Phase 3 Systems Design
2. Allow for expansion. A coding scheme must allow for reasonable growth in the number of assigned codes. If the company currently has eight warehouses, you should not use a one-digit code for the warehouse number. If three more ware-houses are added, the code must be increased to two digits or changed to a charac-ter code in order to identify each location. The rule also applies to using a single letter as a character code; you might need more than 26 codes in the future. Of course, you can add more characters, which is just what the airline industry has done. Airlines now use six-character locator codes, which allow more than 300 mil-lion combinations.
3. Keep codes stable. Changes in codes can cause consistency problems and require data updates. During the changeover period, you will have to change all the stored occurrences of a particular code and all documents containing the old code, as users switch to the new code. Usually, both the old and new codes are used for an interim period, and special procedures are required to handle the two codes. For example, when area codes change, you can use either area code for a certain time period.
4. Make codes unique. Codes used for identification purposes must be unique to have meaning. If the code HW can indicate hardware or houseware, the code is not very useful.
5. Use sortable codes. If products with three-digit codes in the 100s or the 300s are of one type, while products with codes in the 200s are a different type, a simple sort will not group all the products of one type together. In addition, be careful that single-digit character codes will sort properly with double-digit codes — in some cases you must add a leading zero (01, 02, 03, and so on) to ensure that codes sort correctly.
6. Avoid confusing codes. Do not code some part numbers with two letters, a hyphen, and one digit, and others with one letter, a hyphen, and two digits. Avoid allowing both letters and numbers to occupy the same positions within a code because some of those are easily confused. It is easy to confuse the number zero (0) and the uppercase letter O, or the number one (1) with the lowercase letter L (l) or uppercase letter I. For example, the five-character code 5Z081 easily can be misread as 5ZO8I, or 52081, or even totally incorrectly as S2OBI.
7. Make codes meaningful. Codes must be easy to remember, useful for users, conve-nient to use, and easy to encode and interpret. Using SW as a code for the south-west sales region, for example, has far more meaning than the code 14. Using ENG as the code for the English department is easier to interpret and remember than either XVA or 132.
8. Use a code for a single purpose. Do not use a single code to classify two or more unrelated attributes. For example, if you use a single code to identify the combi-nation of an employee’s department and the employee’s insurance plan type, users will have difficulty identifying all the subscribers of a particular plan, or all the workers in a particular department, or both. A separate code for each separate characteristic makes much more sense.
9. Keep codes consistent. For example, if the payroll system already is using two-digit codes for departments, do not create a new, different coding scheme for the personnel system. If the two systems already are using different coding schemes, you should try to convince the users to adopt a consistent coding scheme.
Copyright 2011 Cengage Learning. All Rights Reserved. May not be copied, scanned, or duplicated, in whole or in part. Due to electronic rights, some third party content may be suppressed from the eBook and/or eChapter(s).
Editorial review has deemed that any suppressed content does not materially affect the overall learning experience. Cengage Learning reserves the right to remove additional content at any time if subsequent rights restrictions require it.

426
Chapter 9 Data Design
Database Design: One Step At a Time
DATABASE DESIGN: ONE STEP AT A TIME
After normalizing your table designs, you are ready to create a physical database. The following steps will help you construct a database that is user-friendly, efficient, main-tainable, and meets IT industry design standards:
Step 1: Create an initial ERD. Start by reviewing your DFDs and class diagrams to identify all system entities. Also consider any data stores shown on the DFDs to see whether they might represent entities. For example, a data store called JOB APPLICANTS will need a table to store the information and attributes of each applicant.
Step 2: Next, create an ERD. Carefully analyze each relationship to determine if it is 1:1, 1:M, or M:N.
Step 3: During modeling, you created a data dictionary. Now, review all the data ele-ments to be sure that each one is assigned to an appropriate entity.
Step 4: Review the 3NF designs for all tables, and verify that all primary, secondary, and foreign keys are identified properly. If you added any associative entities during the design process, now is the time to update your ERD.
Step 5: Double-check all data dictionary entries. Make sure that the entries for data stores, records, and data elements are documented completely and correctly. Also be sure that all codes that were developed or identified during the data design process are documented in the data dictionary.
After creating your final ERD and normalized table designs, you can transform them into a database. You might work with applications such as Microsoft Access, Oracle, IBM’s DB2, or other DBMS development tools — or the design might be coded in-house, using one of the popular programming languages.
In the next section, you will work with examples of relational design and apply skills that you learned earlier in the chapter. At this point, it makes no difference whether you used traditional modeling or object-oriented methods to create your model. Either way, you must transform the logical model into a physical data structure that will support user needs and business requirements.
CASE IN POINT 9.3: DOTCOM TOOLS
DotCom Tools operates a small business that specializes in hard-to-find woodworking tools. The firm advertises in various woodworking magazines, and currently accepts mail and tele-phone orders. DotCom is planning a Web site that will be the firm’s primary sales channel. The site will feature an online catalog, powerful search capabilities, and links to woodworking infor-mation and resources.
DotCom has asked you, an IT consultant, whether a set of codes would be advantageous and if so, what codes you would suggest. Provide at least two choices for a customer code and at least two choices for a product code. Be sure to describe your choices and provide some specific examples. Also include an explanation of why you selected these particular codes and what advantages they might offer.
Copyright 2011 Cengage Learning. All Rights Reserved. May not be copied, scanned, or duplicated, in whole or in part. Due to electronic rights, some third party content may be suppressed from the eBook and/or eChapter(s).
Editorial review has deemed that any suppressed content does not materially affect the overall learning experience. Cengage Learning reserves the right to remove additional content at any time if subsequent rights restrictions require it.

427 Database Models
Phase 3 Systems Design
DATABASE MODELSWhether traditional or object-oriented development methods are used, the relational database model is universally accepted as the best way to organize, store, and access large amounts of data. Relational databases can run on many platforms, including personal computers, and are well suited to client/server computing because they are so powerful and flexible. Other models exist, but they are less common, and generally are found on older, mainframe-based systems. At the other end of the spectrum, research-ers are exploring neural architectures that resemble human brain functions, and some observers believe that this research could change the way we think about database design.
A Real-World Business Example
Imagine a company that provides on-site service for electronic equipment, including parts and labor. Figure 9-38 shows the overall database design that such a firm might use. If you study the figure carefully, you will see examples of many concepts described earlier. The database consists of seven separate tables, all joined by common fields so they form an integral data structure.
Figure 9-39 on the next page shows even more detail, including sample data, pri-mary keys, and common fields. Notice that the entities include customers, technicians, service calls, and parts. Other tables store data about labor and parts that are used on specific service calls. Also notice that all tables use a single field as a primary key, except the SERVICE-LABOR-DETAIL and SERVICE-PARTS-DETAIL tables, where the primary key requires a combination of two fields to uniquely identify each record.
FIGURE 9-38 A relational database design for a computer service company uses common fields to link the tables and form an overall data structure. Notice the one-to-many notation symbols, and the primary keys, which are shown in bold.
Copyright 2011 Cengage Learning. All Rights Reserved. May not be copied, scanned, or duplicated, in whole or in part. Due to electronic rights, some third party content may be suppressed from the eBook and/or eChapter(s).
Editorial review has deemed that any suppressed content does not materially affect the overall learning experience. Cengage Learning reserves the right to remove additional content at any time if subsequent rights restrictions require it.
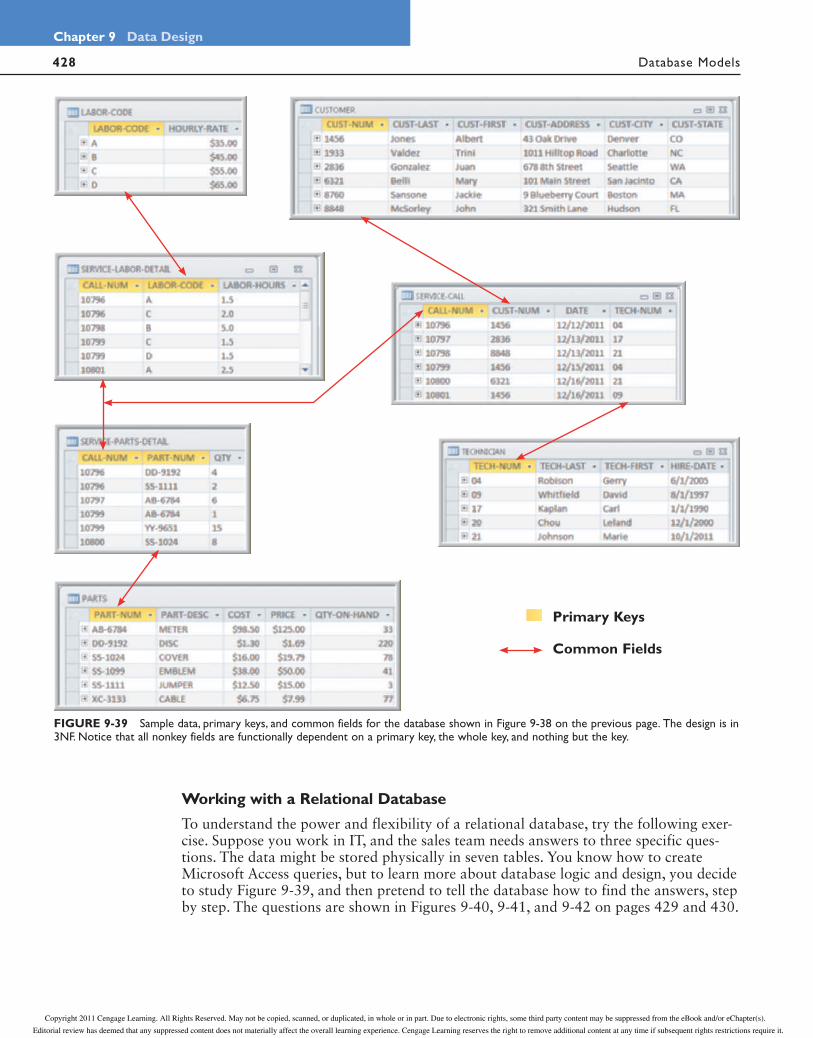
428
Chapter 9 Data Design
Database Models
Working with a Relational Database
To understand the power and flexibility of a relational database, try the following exer-cise. Suppose you work in IT, and the sales team needs answers to three specific ques-tions. The data might be stored physically in seven tables. You know how to create Microsoft Access queries, but to learn more about database logic and design, you decide to study Figure 9-39, and then pretend to tell the database how to find the answers, step by step. The questions are shown in Figures 9-40, 9-41, and 9-42 on pages 429 and 430.
FIGURE 9-39 Sample data, primary keys, and common fields for the database shown in Figure 9-38 on the previous page. The design is in 3NF. Notice that all nonkey fields are functionally dependent on a primary key, the whole key, and nothing but the key.
Primary Keys
Common Fields
Copyright 2011 Cengage Learning. All Rights Reserved. May not be copied, scanned, or duplicated, in whole or in part. Due to electronic rights, some third party content may be suppressed from the eBook and/or eChapter(s).
Editorial review has deemed that any suppressed content does not materially affect the overall learning experience. Cengage Learning reserves the right to remove additional content at any time if subsequent rights restrictions require it.

429 Database Models
Phase 3 Systems Design
FIGURE 9-40 Question 1
FIGURE 9-41 Question 2
Question 1: Did any customers receive service after 12/14/2011? If so, who were they?
Steps: To identify service dates after 12/14/2011, go to the SERVICE-CALL table and look in the DATE fi eld for dates later
than 12/14/2011. Three service call records meet that condition: 10799, 10800, and 10801. Each record has a CUST-NUM
fi eld, which shows that two of the calls were made to customer 1456, and one call was made to customer 6321. To obtain
the customer names, go to the CUSTOMER table, look up the customer numbers, and identify the two customers as Albert
Jones and Mary Belli.
AccessQuery:
QueryResults:
Question 2: Did technician Marie Johnson put in more than six hours of labor on any service calls? If so, which ones?
Steps: To locate Marie Johnson, fi nd her name in the TECHNICIAN table and locate her technician number, which is 21.
Then, go to the SERVICE-CALL table and seek matching values of 21 in the TECH-NUM fi eld. Marie’s two service calls are
shown as call numbers 10798 and 10800. Finally, go to the SERVICE-LABOR-DETAIL table and use those two values to see
if either service call showed more than six hours of labor. In the example, only service call 10798 meets the conditions.
AccessQuery:
QueryResults:
Copyright 2011 Cengage Learning. All Rights Reserved. May not be copied, scanned, or duplicated, in whole or in part. Due to electronic rights, some third party content may be suppressed from the eBook and/or eChapter(s).
Editorial review has deemed that any suppressed content does not materially affect the overall learning experience. Cengage Learning reserves the right to remove additional content at any time if subsequent rights restrictions require it.
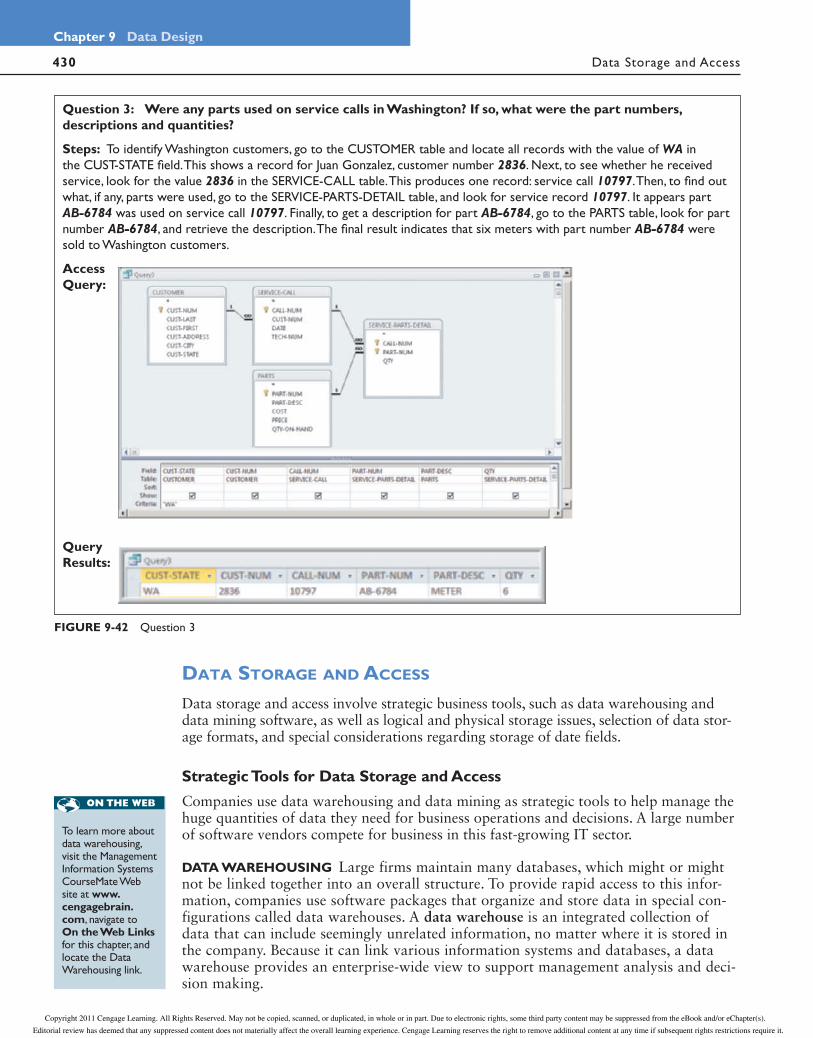
430
Chapter 9 Data Design
Data Storage and Access
DATA STORAGE AND ACCESS
Data storage and access involve strategic business tools, such as data warehousing and data mining software, as well as logical and physical storage issues, selection of data stor-age formats, and special considerations regarding storage of date fields.
Strategic Tools for Data Storage and Access
Companies use data warehousing and data mining as strategic tools to help manage the huge quantities of data they need for business operations and decisions. A large number of software vendors compete for business in this fast-growing IT sector.
DATA WAREHOUSING Large firms maintain many databases, which might or might not be linked together into an overall structure. To provide rapid access to this infor-mation, companies use software packages that organize and store data in special con-figurations called data warehouses. A data warehouse is an integrated collection of data that can include seemingly unrelated information, no matter where it is stored in the company. Because it can link various information systems and databases, a data warehouse provides an enterprise-wide view to support management analysis and deci-sion making.
FIGURE 9-42 Question 3
Question 3: Were any parts used on service calls in Washington? If so, what were the part numbers, descriptions and quantities?
Steps: To identify Washington customers, go to the CUSTOMER table and locate all records with the value of WA in
the CUST-STATE fi eld. This shows a record for Juan Gonzalez, customer number 2836. Next, to see whether he received
service, look for the value 2836 in the SERVICE-CALL table. This produces one record: service call 10797. Then, to fi nd out
what, if any, parts were used, go to the SERVICE-PARTS-DETAIL table, and look for service record 10797. It appears part
AB-6784 was used on service call 10797. Finally, to get a description for part AB-6784, go to the PARTS table, look for part
number AB-6784, and retrieve the description. The fi nal result indicates that six meters with part number AB-6784 were
sold to Washington customers.
AccessQuery:
QueryResults:
To learn more about data warehousing, visit the Management Information Systems CourseMate Web site at www. cengagebrain.com, navigate to On the Web Links for this chapter, and locate the Data Warehousing link.
Copyright 2011 Cengage Learning. All Rights Reserved. May not be copied, scanned, or duplicated, in whole or in part. Due to electronic rights, some third party content may be suppressed from the eBook and/or eChapter(s).
Editorial review has deemed that any suppressed content does not materially affect the overall learning experience. Cengage Learning reserves the right to remove additional content at any time if subsequent rights restrictions require it.
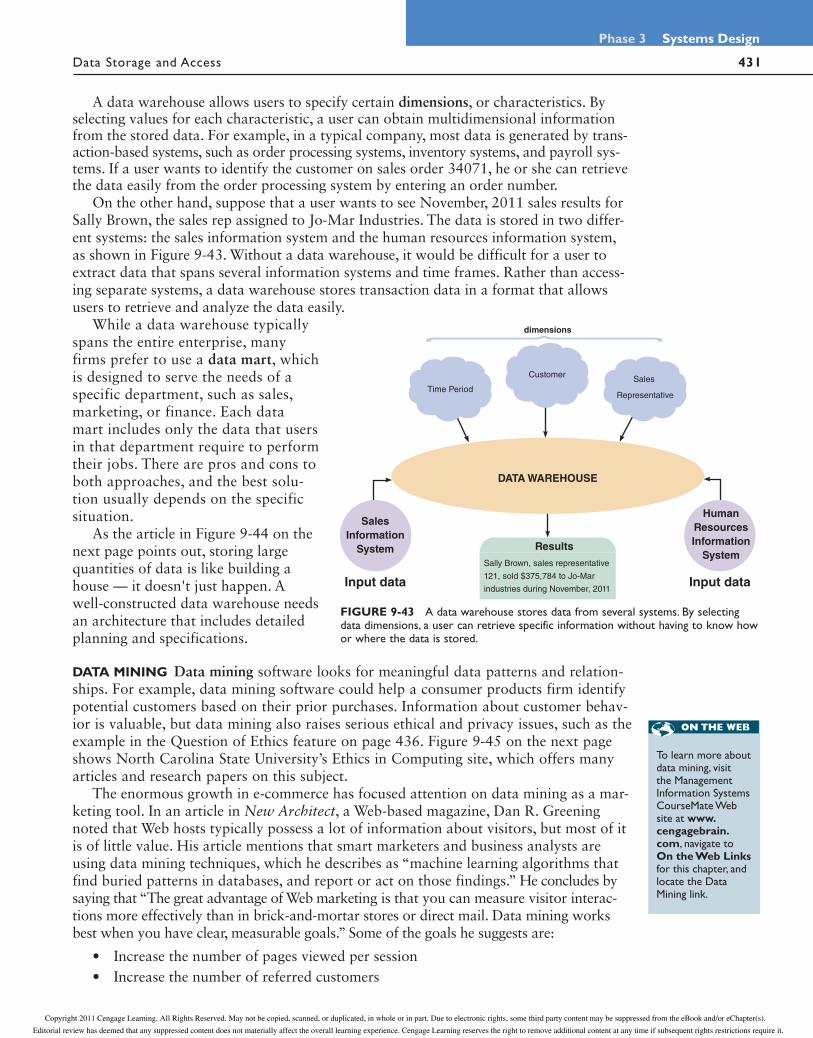
431 Data Storage and Access
Phase 3 Systems Design
A data warehouse allows users to specify certain dimensions, or characteristics. By selecting values for each characteristic, a user can obtain multidimensional information from the stored data. For example, in a typical company, most data is generated by trans-action-based systems, such as order processing systems, inventory systems, and payroll sys-tems. If a user wants to identify the customer on sales order 34071, he or she can retrieve the data easily from the order processing system by entering an order number.
On the other hand, suppose that a user wants to see November, 2011 sales results for Sally Brown, the sales rep assigned to Jo-Mar Industries. The data is stored in two differ-ent systems: the sales information system and the human resources information system, as shown in Figure 9-43. Without a data warehouse, it would be difficult for a user to extract data that spans several information systems and time frames. Rather than access-ing separate systems, a data warehouse stores transaction data in a format that allows users to retrieve and analyze the data easily.
While a data warehouse typically spans the entire enterprise, many firms prefer to use a data mart, which is designed to serve the needs of a specific department, such as sales, marketing, or finance. Each data mart includes only the data that users in that department require to perform their jobs. There are pros and cons to both approaches, and the best solu-tion usually depends on the specific situation.
As the article in Figure 9-44 on the next page points out, storing large quantities of data is like building a house — it doesn't just happen. A well-constructed data warehouse needs an architecture that includes detailed planning and specifications.
DATA MINING Data mining software looks for meaningful data patterns and relation-ships. For example, data mining software could help a consumer products firm identify potential customers based on their prior purchases. Information about customer behav-ior is valuable, but data mining also raises serious ethical and privacy issues, such as the example in the Question of Ethics feature on page 436. Figure 9-45 on the next page shows North Carolina State University’s Ethics in Computing site, which offers many articles and research papers on this subject.
The enormous growth in e-commerce has focused attention on data mining as a mar-keting tool. In an article in New Architect, a Web-based magazine, Dan R. Greening noted that Web hosts typically possess a lot of information about visitors, but most of it is of little value. His article mentions that smart marketers and business analysts are using data mining techniques, which he describes as “machine learning algorithms that find buried patterns in databases, and report or act on those findings.” He concludes by saying that “The great advantage of Web marketing is that you can measure visitor interac-tions more effectively than in brick-and-mortar stores or direct mail. Data mining works best when you have clear, measurable goals.” Some of the goals he suggests are:
• Increase the number of pages viewed per session• Increase the number of referred customers
Results
Sally Brown, sales representative
121, sold $375,784 to Jo-Mar
industries during November, 2011
DATA WAREHOUSE
dimensions
Time Period
CustomerSales
Representative
Sales
Information
System
Input data Input data
Human
Resources
Information
System
FIGURE 9-43 A data warehouse stores data from several systems. By selecting data dimensions, a user can retrieve specific information without having to know how or where the data is stored.
To learn more about data mining, visit the Management Information Systems CourseMate Web site at www. cengagebrain.com, navigate to On the Web Links for this chapter, and locate the Data Mining link.
Copyright 2011 Cengage Learning. All Rights Reserved. May not be copied, scanned, or duplicated, in whole or in part. Due to electronic rights, some third party content may be suppressed from the eBook and/or eChapter(s).
Editorial review has deemed that any suppressed content does not materially affect the overall learning experience. Cengage Learning reserves the right to remove additional content at any time if subsequent rights restrictions require it.
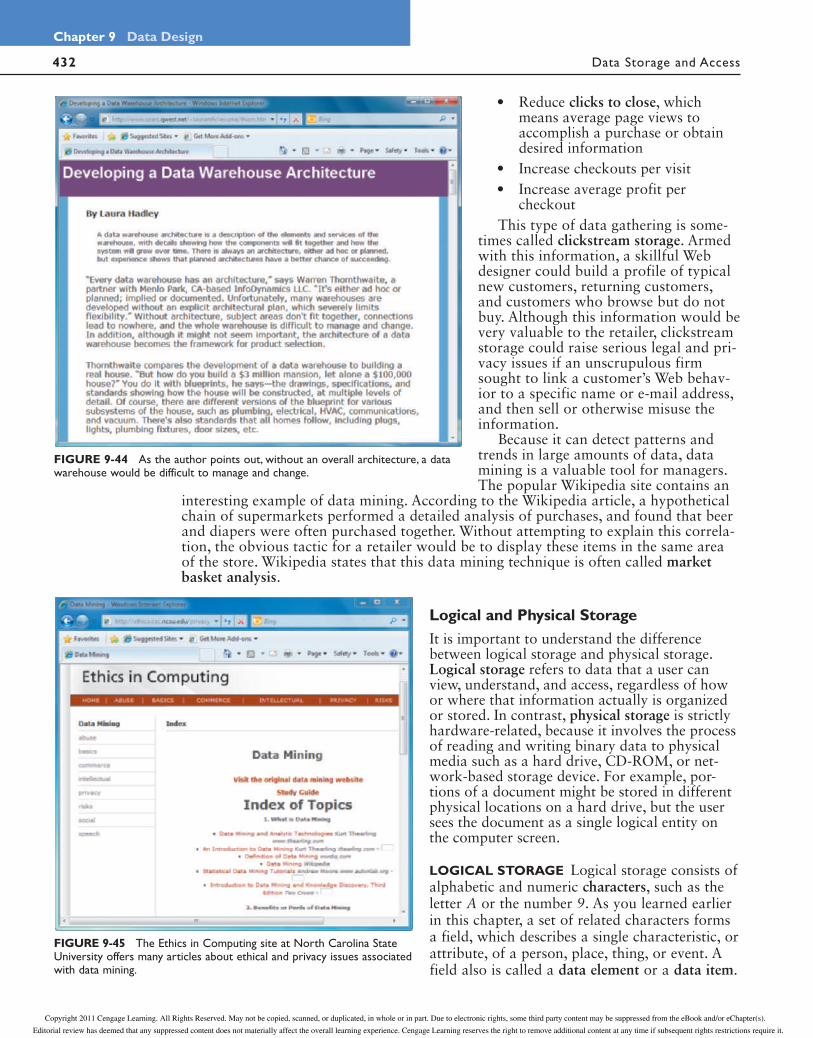
432
Chapter 9 Data Design
Data Storage and Access
• Reduce clicks to close, which means average page views to accomplish a purchase or obtain desired information
• Increase checkouts per visit • Increase average profit per
checkoutThis type of data gathering is some-
times called clickstream storage. Armed with this information, a skillful Web designer could build a profile of typical new customers, returning customers, and customers who browse but do not buy. Although this information would be very valuable to the retailer, clickstream storage could raise serious legal and pri-vacy issues if an unscrupulous firm sought to link a customer’s Web behav-ior to a specific name or e-mail address, and then sell or otherwise misuse the information.
Because it can detect patterns and trends in large amounts of data, data mining is a valuable tool for managers. The popular Wikipedia site contains an
interesting example of data mining. According to the Wikipedia article, a hypothetical chain of supermarkets performed a detailed analysis of purchases, and found that beer and diapers were often purchased together. Without attempting to explain this correla-tion, the obvious tactic for a retailer would be to display these items in the same area of the store. Wikipedia states that this data mining technique is often called market basket analysis.
Logical and Physical StorageIt is important to understand the difference between logical storage and physical storage. Logical storage refers to data that a user can view, understand, and access, regardless of how or where that information actually is organized or stored. In contrast, physical storage is strictly hardware-related, because it involves the process of reading and writing binary data to physical media such as a hard drive, CD-ROM, or net-work-based storage device. For example, por-tions of a document might be stored in different physical locations on a hard drive, but the user sees the document as a single logical entity on the computer screen.
LOGICAL STORAGE Logical storage consists of alphabetic and numeric characters, such as the letter A or the number 9. As you learned earlier in this chapter, a set of related characters forms a field, which describes a single characteristic, or attribute, of a person, place, thing, or event. A field also is called a data element or a data item.
FIGURE 9-44 As the author points out, without an overall architecture, a data warehouse would be difficult to manage and change.
FIGURE 9-45 The Ethics in Computing site at North Carolina State University offers many articles about ethical and privacy issues associated with data mining.
Copyright 2011 Cengage Learning. All Rights Reserved. May not be copied, scanned, or duplicated, in whole or in part. Due to electronic rights, some third party content may be suppressed from the eBook and/or eChapter(s).
Editorial review has deemed that any suppressed content does not materially affect the overall learning experience. Cengage Learning reserves the right to remove additional content at any time if subsequent rights restrictions require it.
433 Data Storage and Access
Phase 3 Systems Design
When designing fields, you should provide space for the largest values that can be anticipated, without allocating unnecessarily large storage capacities that will not be used. For example, suppose you are designing a customer order entry system for a firm with 800 customers. It would be a mistake to limit the customer number field to three, or even four characters. Instead, you might consider a five-character field with leading zeros that could store customer numbers from 00001 to 99999.
You also might consider a mix of alphabetic and numeric characters, which many people find easier to view and use. Alphabetic characters expand the storage capacity, because there are 26 possible values for each character position. Most airlines now use six alphabetic characters as a record locator, which has over 300 million possible values.
A logical record is a set of field values that describes a single person, place, thing, or event. For example, a logical customer record contains specific field values for a single customer, including the customer number, name, address, telephone number, credit limit, and so on. Application programs see a logical record as a group of related fields, regard-less of how or where the data is stored physically.
The term record usually refers to a logical record. Whenever an application program issues a read or write command, the operating system supplies one logical record to the program or accepts one logical record from the program. The physical data might be stored on one or more servers, in the same building or thousands of miles away, but all the application program sees is the logical record — the physical storage location is irrelevant.
PHYSICAL STORAGE Physical storage involves a physical record, or block, which is the smallest data unit that can be handled by the operating system. The system reads or writes one physical record at a time. When the system reads a physical record, it loads the data from storage into a buffer, which is a segment of computer memory.
The physical storage location can be local, remote, or Web-based. Similarly, when the system writes a physical record, all data in the memory buffer is saved physically to a stor-age location. A physical record can contain more than one logical record, depending on the blocking factor. For example, a blocking factor of two means that each physical record will consist of two logical records. Some database programs, such as Microsoft Access, auto-matically write a physical record each time that a logical record is created or updated.
Data Coding and Storage
Computers represent data as bits, or binary digits, that have only two possible values: 1 (which indicates an electrical signal) and 0 (which indicates the absence of a signal). A computer understands a group of bits as a digital code that can be transmitted, received, and stored. Computers use various data coding and storage schemes, such as EBCDIC, ASCII, and binary. A more recent coding standard called Unicode also is popular. Also, the storage of dates raises some design issues that must be considered.
EBCDIC, ASCII, AND BINARY EBCDIC (pronounced EB-see-dik), which stands for Extended Binary Coded Decimal Interchange Code, is a coding method used on main-frame computers and high-capacity servers. ASCII (pronounced ASK-ee), which stands for American Standard Code for Information Interchange, is a coding method used on most personal computers. EBCDIC and ASCII both require eight bits, or one byte, for each character. For example, the name Ann requires three bytes of storage, the number 12,345 requires five bytes of storage, and the number 1,234,567,890 requires ten bytes of storage.
Copyright 2011 Cengage Learning. All Rights Reserved. May not be copied, scanned, or duplicated, in whole or in part. Due to electronic rights, some third party content may be suppressed from the eBook and/or eChapter(s).
Editorial review has deemed that any suppressed content does not materially affect the overall learning experience. Cengage Learning reserves the right to remove additional content at any time if subsequent rights restrictions require it.
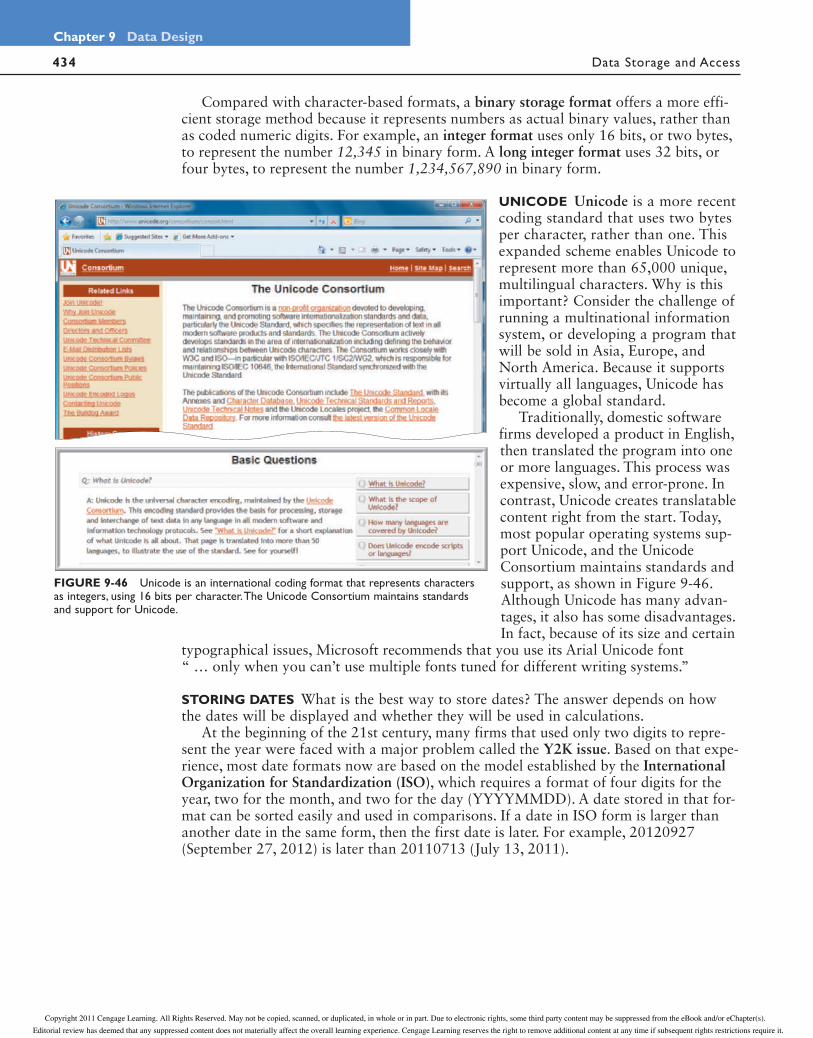
434
Chapter 9 Data Design
Data Storage and Access
Compared with character-based formats, a binary storage format offers a more effi-cient storage method because it represents numbers as actual binary values, rather than as coded numeric digits. For example, an integer format uses only 16 bits, or two bytes, to represent the number 12,345 in binary form. A long integer format uses 32 bits, or four bytes, to represent the number 1,234,567,890 in binary form.
UNICODE Unicode is a more recent coding standard that uses two bytes per character, rather than one. This expanded scheme enables Unicode to represent more than 65,000 unique, multilingual characters. Why is this important? Consider the challenge of running a multinational information system, or developing a program that will be sold in Asia, Europe, and North America. Because it supports virtually all languages, Unicode has become a global standard.
Traditionally, domestic software firms developed a product in English, then translated the program into one or more languages. This process was expensive, slow, and error-prone. In contrast, Unicode creates translatable content right from the start. Today, most popular operating systems sup-port Unicode, and the Unicode Consortium maintains standards and support, as shown in Figure 9-46. Although Unicode has many advan-tages, it also has some disadvantages. In fact, because of its size and certain
typographical issues, Microsoft recommends that you use its Arial Unicode font “ … only when you can’t use multiple fonts tuned for different writing systems.”
STORING DATES What is the best way to store dates? The answer depends on how the dates will be displayed and whether they will be used in calculations.
At the beginning of the 21st century, many firms that used only two digits to repre-sent the year were faced with a major problem called the Y2K issue. Based on that expe-rience, most date formats now are based on the model established by the International Organization for Standardization (ISO), which requires a format of four digits for the year, two for the month, and two for the day (YYYYMMDD). A date stored in that for-mat can be sorted easily and used in comparisons. If a date in ISO form is larger than another date in the same form, then the first date is later. For example, 20120927 (September 27, 2012) is later than 20110713 (July 13, 2011).
FIGURE 9-46 Unicode is an international coding format that represents characters as integers, using 16 bits per character. The Unicode Consortium maintains standards and support for Unicode.
Copyright 2011 Cengage Learning. All Rights Reserved. May not be copied, scanned, or duplicated, in whole or in part. Due to electronic rights, some third party content may be suppressed from the eBook and/or eChapter(s).
Editorial review has deemed that any suppressed content does not materially affect the overall learning experience. Cengage Learning reserves the right to remove additional content at any time if subsequent rights restrictions require it.

435 Data Control
Phase 3 Systems Design
But, what if dates must be used in calcula-tions? For example, if a manufacturing order placed on June 23 takes three weeks to com-plete, when will the order be ready? If a pay-ment due on August 13 is not paid until April 27 of the following year, exactly how late is the payment and how much interest is owed? In these situations, it is easier to use absolute dates.
An absolute date is the total number of days from some specific base date. To calcu-late the number of days between two abso-lute dates, you subtract one date from the other. For example, if the base date is January 1, 1900, then September 27, 2012 has an absolute date value of 41179. Similarly, July 13, 2011 has an absolute date of 40737. If you subtract the earlier date value from the later one, the result is 442 days. You can use a spreadsheet to determine and display absolute dates easily, as shown in Figure 9-47.
DATA CONTROL
Just as it is important to secure the physical part of the system, as shown in Figure 9-48, file and database control must include all measures necessary to ensure that data storage is correct, complete, and secure. File and database control also is related to input and output techniques discussed earlier.
A well-designed DBMS must provide built-in control and security features, including subschemas, passwords, encryption, audit trail files, and backup and recovery proce-dures to maintain data. Your main responsibility is to ensure that the DBMS features are used properly.
Earlier in this chapter, you learned that a subschema can be used to provide a limited view of the database to a specific user, or level of users. Limiting access to files and databases is the most common way of pro-tecting stored data. Users must furnish a proper user ID and password to access a file or database. Different privileges, also called permissions, can be associated with different users, so some employees can be limited to read-only access, while other users might be allowed to update or delete data. For highly sensitive data, additional access codes can be established that restrict specific records or fields within records. Stored data also can be encrypted to prevent unauthorized access. Encryption is the process of convert-ing readable data into unreadable characters to prevent unauthorized access to the data.
FIGURE 9-47 Microsoft Excel uses absolute dates in calculations. For example, January 1, 1900, has a numeric value of 1. In the example shown, September 27, 2012 is displayed as 41179, and July 13, 2011 is displayed as 40737.The difference between the dates is 442 days.
FIGURE 9-48 In addition to network monitoring, system security includes access codes, data encryption, passwords, and audit trails.
Copyright 2011 Cengage Learning. All Rights Reserved. May not be copied, scanned, or duplicated, in whole or in part. Due to electronic rights, some third party content may be suppressed from the eBook and/or eChapter(s).
Editorial review has deemed that any suppressed content does not materially affect the overall learning experience. Cengage Learning reserves the right to remove additional content at any time if subsequent rights restrictions require it.

436
Chapter 9 Data Design
Data Control
All system files and databases must be backed up regularly and a series of backup copies must be retained for a specified period of time. In the event of a file catastrophe, recovery procedures can be used to restore the file or database to its current state at the time of the last backup. Audit log files, which record details of all accesses and changes to the file or database, can be used to recover changes made since the last backup. You also can include audit fields, which are special fields within data records to provide additional control or security information. Typical audit fields include the date the record was created or modified, the name of the user who performed the action, and the number of times the record has been accessed.
CASE IN POINT 9.4: SOCCERMOM
SoccerMom Company sells a patented seat that spectators can take to youth soccer games. The seat folds so it is small enough to fit in the glove box of most vehicles. The company operates a factory in Kansas and also contracts its manufacturing projects to small firms in Canada and Mexico.
An unusual problem has occurred for this small multinational company: People are getting confused about dates in internal memos, purchase orders, and e-mail. Towson Hopkins handles all IT functions for SoccerMom. When he designed the company’s database, he was not aware that the format for dates in Canada and Mexico was different from the format used in the United States. For example, in Canada and Mexico, the notation 7/1/11 indicates January 7, 2011, whereas in the United States the same notation indicates July 1, 2011. Although it seems like a small point, the date confusion has resulted in several order cancellations.
Towson has asked for your advice. You could suggest writing a simple program to convert the dates automatically or designing a switchboard command that would allow users to select a date format as data is entered. You realize, however, that SoccerMom might want to do busi-ness in other countries in the future. What would be the best course of action? Should SoccerMom adapt to the standard of each country, or should it maintain a single international format? What are the arguments for each option?
A QUESTION OF ETHICS
Olivia is the database manager at Tip Top Toys, a relatively small division of Worldwide Enterprises. Worldwide has nine other divisions, which include insurance, health care products, and financial planning services, to name a few.
Riccardo, corporate marketing director for Worldwide, has requested Tip Top’s customer shopping data to target people who might be likely to purchase items or services from other Worldwide divisions. Olivia is not totally comfortable with this, and pointed out Tip Top’s Web privacy policy, which states that “Tip Top Toys, a division of Worldwide Enterprises, will not share personal data with other companies without a customer’s consent.”
Riccardo replied that the statement only applies to outside companies – not other Worldwide divisions. He said he checked with the corporate legal department, and they agreed. Emily responded “Even if it is legally OK, it’s not the right thing to do. Many people take our statement to mean that their data does not leave Tip Top. At the very least, we should give customers a choice, and share the data only with their consent.”
Do you agree with Olivia? Why or why not?
Copyright 2011 Cengage Learning. All Rights Reserved. May not be copied, scanned, or duplicated, in whole or in part. Due to electronic rights, some third party content may be suppressed from the eBook and/or eChapter(s).
Editorial review has deemed that any suppressed content does not materially affect the overall learning experience. Cengage Learning reserves the right to remove additional content at any time if subsequent rights restrictions require it.
437 Chapter Summary
Phase 3 Systems Design
CHAPTER SUMMARY
In this chapter, you continued your study of the systems design phase of the SDLC. You learned that files and tables contain data about people, places, things, or events that affect the information system. File-oriented systems, also called file processing systems, manage data stored in separate files, including master files, table files, transaction files, work files, security files, and history files.
A database consists of linked tables that form an overall data structure. A database management system (DBMS) is a collection of tools, features, and interfaces that enable users to add, update, manage, access, and analyze data in a database.
DBMS designs are more powerful and flexible than traditional file-oriented systems. A database environment offers scalability, support for organization-wide access, econ-omy of scale, data sharing among user groups, balancing of conflicting user require-ments, enforcement of standards, controlled redundancy, effective security, flexibility, better programmer productivity, and data independence. Large-scale databases are com-plex and require extensive security and backup/recovery features.
DBMS components include interfaces for users, database administrators, and related systems; a data manipulation language; a schema; and a physical data repository. Other data management techniques include data warehousing, which stores data in an easily accessible form for user access, and data mining, which looks for meaningful patterns and relationships among data. Data mining also includes clickstream storage, which records how users interact with a site, and market basket analysis, which can identify product relationships and consumer buying patterns.
In an information system, an entity is a person, place, thing, or event for which data is collected and maintained. A field, or attribute, is a single characteristic of an entity. A record, or tuple, is a set of related fields that describes one instance of an entity. Records are grouped into files (in a file-oriented system) and tables (in a database environment).
A primary key is the field or field combination that uniquely and minimally identifies a specific record; a candidate key is any field that could serve as a primary key. A for-eign key is a field or field combination that must match the primary key of another file or table. A secondary key is a field or field combination used as the basis for sorting or retrieving records.
An entity-relationship diagram (ERD) is a graphic representation of all system enti-ties and the relationships among them. The ERD is based on entities and data stores in DFDs prepared during the systems analysis phase. The three basic relationships repre-sented in an ERD are one-to-one (1:1), one-to-many (1:M), and many-to-many (M:N). In a M:N relationship, the two entities are linked by an associative entity.
The relationship between two entities also is referred to as cardinality. A common form of cardinality notation is called crow’s foot notation, which uses various symbols to describe the characteristics of the relationship.
Normalization is a process for avoiding problems in data design. A first normal form (1NF) record has no repeating groups. A record is in second normal form (2NF) if it is in 1NF and all nonkey fields depend on the entire primary key. A record is in third nor-mal form (3NF) if it is in 2NF and if no field depends on a nonkey field.
Data design tasks include creating an initial ERD; assigning data elements to an entity; normalizing all table designs; and completing the data dictionary entries for files, records, and data elements. Files and database tables should be sized to estimate the amount of storage space they will require.
You learned that a code is a set of letters or numbers used to represent data in a sys-tem. By using codes, you can speed up data entry, reduce data storage space, and reduce transmission time. Codes also can be used to reveal or to conceal information. The main types of codes are sequence codes, block sequence codes, classification codes, alphabetic codes (including category codes, abbreviation codes, and mnemonic codes), significant digit codes, derivation codes, cipher codes, and action codes.
Copyright 2011 Cengage Learning. All Rights Reserved. May not be copied, scanned, or duplicated, in whole or in part. Due to electronic rights, some third party content may be suppressed from the eBook and/or eChapter(s).
Editorial review has deemed that any suppressed content does not materially affect the overall learning experience. Cengage Learning reserves the right to remove additional content at any time if subsequent rights restrictions require it.

438
Chapter 9 Data Design
Chapter Summary
Logical storage is information seen through a user’s eyes, regardless of how or where that information actually is organized or stored. Physical storage is hardware-related and involves reading and writing blocks of binary data to physical media. A logical record is a related set of field values that describes a single person, place, thing, or event. A physical record consists of one or more logical records, depending on the blocking factor. Data storage formats include EBCDIC, ASCII, binary, and Unicode. Dates can be stored in several formats, including ISO and absolute format.
File and database control measures include limiting access to the data, data encryp-tion, backup/recovery procedures, audit-trail files, and internal audit fields.
Copyright 2011 Cengage Learning. All Rights Reserved. May not be copied, scanned, or duplicated, in whole or in part. Due to electronic rights, some third party content may be suppressed from the eBook and/or eChapter(s).
Editorial review has deemed that any suppressed content does not materially affect the overall learning experience. Cengage Learning reserves the right to remove additional content at any time if subsequent rights restrictions require it.

439
Phase 3 Systems Design
Key Terms and Phrases
Key Terms and Phrases
1:1 4061:M 406abbreviation codes 423absolute date 435action codes 424alphabetic codes 423ASCII 433associative entity 407attribute 402audit fields 436audit log files 436backup 436binary digit 433binary storage format 434bit 433block 433block sequence codes 423blocking factor 433buffer 433byte 433candidate key 402cardinality 408cardinality notation 408category codes 423characters 432cipher codes 424clicks to close 432clickstream storage 432client/server 395clients 400code 422combination key 402common field 402composite key 402concatenated key 402crow’s foot notation 408data element 432data integrity 394data item 432data manipulation
language (DML) 398data mart 431data mining 431data redundancy 394data structure 392data warehouse 430database administrator
(DBA) 395
database management system (DBMS) 392, 395
derivation codes 424dimensions 431EBCDIC 433economy of scale 395encryption 435entity 401entity-relationship
diagram (ERD) 406extranet 400field 402file 392file-oriented system 392first normal form (1NF) 412foreign key 404functionally dependent 413history file 394HTML (Hypertext Markup
Language) 399integer format 434International Organization for
Standardization (ISO) 434intranet 399JDBC (Java database
connectivity) 398key fields 402logical record 433logical storage 432long integer format 434M:N 407many-to-many relationship 407market basket analysis 432master file 394middleware 400mnemonic codes 423multivalued key 403neural architectures 427nonkey field 402normalization 411ODBC (open database
connectivity) 398one-to-many
relationship 406one-to-one relationship 406orphan 404password 435permissions 435
physical record 433physical storage 432primary key 402protocols 400query by example
(QBE) 396query language 396record 402recovery procedures 436referential integrity 404relational database 392relational model 392repeating group 411scalability 395schema 398second normal form
(2NF) 413secondary key 404security file 394sequence codes 422servers 400significant digit codes 424SQL (Structured Query
Language) 397standard notation
format 411subschema 398table 392table design 411table file 394tags 399third normal form
(3NF) 416transaction file 394tuple 402Unicode 434Unified Modeling
Language (UML) 408unnormalized 412user ID 435Web browser 399Web page 399Web server 399Web site 399Web-centric 400work file 394Y2K issue 434
Copyright 2011 Cengage Learning. All Rights Reserved. May not be copied, scanned, or duplicated, in whole or in part. Due to electronic rights, some third party content may be suppressed from the eBook and/or eChapter(s).
Editorial review has deemed that any suppressed content does not materially affect the overall learning experience. Cengage Learning reserves the right to remove additional content at any time if subsequent rights restrictions require it.

440
Chapter 9 Data Design
Learn It Online
Instructions: To complete the Learn It Online exercises, visit the Management Information Systems CourseMate Web site at www.cengagebrain.com, navigate to the resources for this chapter, and click the link for the exercise you want to complete.
1 Chapter Reinforcement
TF, MC, and SA
Click one of the Chapter Reinforcement links for Multiple Choice, True/False, or Short Answer. Answer each question and submit to your instructor.
2 Flash CardsClick the Flash Cards link and read the instructions. Type 20 (or a number specified by your instructor) in the Number of playing cards text box, type your name in the Enter your Name text box, and then click the Flip Card button. When the flash card is dis-played, read the question and then click the ANSWER box arrow to select an answer. Flip through the Flash Cards. If your score is 15 (75%) correct or greater, click Print on the File menu to print your results. If your score is less than 15 (75%) correct, then redo this exercise by clicking the Replay button.
3 Practice TestClick the Practice Test link. Answer each question, enter your first and last name at the bottom of the page, and then click the Grade Test button. When the graded practice test is displayed on your screen, click Print on the File menu to print a hard copy. Continue to take practice tests until you score 80% or better.
4 Who Wants To Be a Computer Genius?Click the Computer Genius link. Read the instructions, enter your first and last name at the bottom of the page, and then click the Play button. When your score is dis-played, click the PRINT RESULTS link to print a hard copy.
5 Wheel of TermsClick the Wheel of Terms link. Read the instructions, and then enter your first and last name and your school name. Click the PLAY button. When your score is displayed on the screen, right-click the score and then click Print on the shortcut menu to print a hard copy.
6 Crossword Puzzle ChallengeClick the Crossword Puzzle Challenge link. Read the instructions, and then click the Continue button. Work the crossword puzzle. When you are finished, click the Submit button. When the crossword puzzle is redisplayed, submit it to your instructor.
Learn It Online
Copyright 2011 Cengage Learning. All Rights Reserved. May not be copied, scanned, or duplicated, in whole or in part. Due to electronic rights, some third party content may be suppressed from the eBook and/or eChapter(s).
Editorial review has deemed that any suppressed content does not materially affect the overall learning experience. Cengage Learning reserves the right to remove additional content at any time if subsequent rights restrictions require it.

441
Phase 3 Systems Design
Case-Sim: SCR Associates
SCR Associates Case Simulation Session 9: Data Design
OverviewThe SCR Associates case study is a Web-
based simulation that allows you to practice your skills in a real-world environment. The case study transports you to SCR’s intranet, where you complete 12 work sessions, each aligning with a chapter. As you work on the case, you will receive e-mail and voice mail mes-sages, obtain information from SCR’s online libraries, and perform various tasks.
How do I use the case?• Review the SCR background material in Chapter 1.
• Read the Preview for this session and study the Task List.
• Visit the Management Information Systems CourseMate Web site at www.cengagebrain.com, navigate to the SCR Case Simulation, and locate the intranet link.
• Enter your name and the password sad9e. An opening screen will display the 12 sessions.
• Select this session. Check your e-mail and voice mail carefully, and then work on the tasks.
Preview: Session 9Your supervisor, Jesse Baker, has asked you to begin working on data design tasks for the
new information system, which will be implemented as a relational database. You will need to identify the entities, draw an ERD, design tables, and add sample data to each table.
Task List
FIGURE 9-49 Task list: Session 9.
1. List all the entities that interact with the TIMS system. Start by reviewing the data library, previous
e-mail messages, DFDs, and other documentation.
2. Draw an ERD that shows cardinality relationships among the entities. Send the diagram to Jesse.
3. For each entity, Jesse wants to see table designs in 3NF. Use standard notation format to show the
primary key and the other fields in each table.
4. Jesse wants to use sample data to populate fields for at least three records in each table. Better get
started on this right away.
Copyright 2011 Cengage Learning. All Rights Reserved. May not be copied, scanned, or duplicated, in whole or in part. Due to electronic rights, some third party content may be suppressed from the eBook and/or eChapter(s).
Editorial review has deemed that any suppressed content does not materially affect the overall learning experience. Cengage Learning reserves the right to remove additional content at any time if subsequent rights restrictions require it.
442
Chapter 9 Data Design
Chapter Exercises
Review Questions1. Explain the main differences between a file processing system and a database system.2. What is a DBMS? Briefly describe the components of a DBMS.3. Describe a primary key, candidate key, secondary key, foreign key, and common field.4. What are entity-relationship diagrams and how are they used? What symbol is used
to represent an entity in an ERD? What symbol is used for a relationship? What is cardinality, and what symbols do you use in the crow’s foot notation method?
5. What are data warehousing and data mining? Are the terms related?6. What is the criterion for a table design to be in first normal form? How do you con-
vert an unnormalized design to 1NF?7. What are the criteria for a table design to be in second normal form? How do you
convert a 1NF design to 2NF?8. What are the criteria for a table design to be in third normal form? How do you
convert a 2NF design to 3NF?9. Explain the difference between a logical record and a physical record.
10. How would a specific date, such as September 1, 2011, be represented as an absolute date?
Discussion Topics1. Are there ethical issues to consider when planning a database? For example, should
sensitive personal data (such as medical information) be stored in the same DBMS that manages employee salary and benefits data? Why or why not?
2. Suggest three typical business situations where referential integrity avoids data problems.
3. Consider an automobile dealership with three locations. Data fields exist for stock number, vehicle identification number, make, model, year, color, and invoice cost. Identify the possible candidate keys, the likely primary key, a probable foreign key, and potential secondary keys.
4. In the example shown in Figures 9-25 and 9-26 on pages 416 and 417, the 2NF customer table was converted to two 3NF tables. Verify that the four potential problems identified for 2NF tables were eliminated in the 3NF design.
Projects1. Search the Internet to find information about data storage formats. Also do research
on international date formats. Determine whether the date format used in the United States is the most common format.
2. Visit the IT department at your school or at a local business and determine whether the organization uses file-oriented systems, DBMSs, or both. Write a brief memo with your conclusions.
3. Use Microsoft Access or similar database software to create a DBMS for the imagi-nary company called TopText Publishing, which is described in Case In Point 9.1 on page 410. Add several sample records to each table and report to the class on your progress.
4. Visit the bookstore at your school or a bookstore in your area. Interview the man-ager or store employees to learn how the operation works and what entities are involved in bookstore operations. Remember that an entity is a person, place, thing, or event that affects the information system. Draw an ERD, including cardinality that describes the bookstore operations.
Chapter Exercises
Copyright 2011 Cengage Learning. All Rights Reserved. May not be copied, scanned, or duplicated, in whole or in part. Due to electronic rights, some third party content may be suppressed from the eBook and/or eChapter(s).
Editorial review has deemed that any suppressed content does not materially affect the overall learning experience. Cengage Learning reserves the right to remove additional content at any time if subsequent rights restrictions require it.
443
Phase 3 Systems Design
Apply Your Knowledge
The Apply Your Knowledge section contains four mini-cases. Each case describes a situation, explains your role in the case, and asks you to respond to questions. You can answer the ques-tions by applying knowledge you learned in the chapter.
1 Pick and Shovel Construction Company
Situation:
Pick and Shovel Construction Company is a multistate building contractor specializing in medium-priced town homes. C. T. Scott, the owner, is in your office for the third time today to see how the new relational database project is coming along. Unfortunately, someone mentioned to C. T. that the delay had something to do with achieving normalization.“Why is all this normalization stuff so important?” he asks. “The old system worked OK most of the time, and now you are telling me that we need all these special rules. Why is this necessary?”
1. How should you respond to C. T.? Write him a brief memo with your views.2. Assume that the Pick and Shovel’s main entities are its customers, employees,
projects, and equipment. A customer can hire the company for more than one project, and employees sometimes work on more than one project at a time. Equipment, however, is assigned only to one project. Draw an ERD showing those entities.
3. Add cardinality notation to your ERD.4. Create 3NF table designs.
2 Puppy Palace
Situation:
Puppy Palace works with TV and movie producers who need dogs that can perform special tricks, such as headstands, somersaults, ladder climbs, and various dog-and-pony tricks. Puppy Palace has about 16 dogs and a list of 50 tricks from which to choose. Each dog can perform one or more tricks, and many tricks can be performed by more than one dog. When a dog learns a new trick, the trainer assigns a skill level. Some customers insist on using dogs that score a 10, which is the highest skill level.As an IT consultant, you have been asked to suggest 3NF table designs. You are fairly certain that a M:N relationship exists between dogs and tricks.
1. Draw an ERD for the Puppy Palace information system.2. Indicate cardinality.3. Identify all fields you plan to include in the dogs and tricks tables. For example,
in the dogs table, you might want breed, size, age, name, and so on. In the tricks table, you might want the trick name and description. You will need to assign a primary key in each table. Hint: Before you begin, review some database design samples in this chapter. You might spot a similar situation that requires an asso-ciative entity that you can use as a pattern. In addition, remember that numeric values work well in primary key fields.
4. Create 3NF table designs.
Apply Your Knowledge
Copyright 2011 Cengage Learning. All Rights Reserved. May not be copied, scanned, or duplicated, in whole or in part. Due to electronic rights, some third party content may be suppressed from the eBook and/or eChapter(s).
Editorial review has deemed that any suppressed content does not materially affect the overall learning experience. Cengage Learning reserves the right to remove additional content at any time if subsequent rights restrictions require it.
444
Chapter 9 Data Design
Apply Your Knowledge
3 Mayville Public Library
Situation:
Mayville is a rural village with a population of 900. Until now, Mayville was served by a bookmobile from a larger town. The Mayville Village Council has authorized funds for a small public library, and you have volunteered to set up an information system for the library. Assume that the library will have multiple copies of certain books.
1. Draw an ERD for the Mayville library system.2. Indicate cardinality.3. Identify all fields you plan to include in the tables.4. Create 3NF table designs.
4 Western Wear Outfitters
Situation:
Western Wear is a mail-order firm that offers an extensive selection of casual clothing for men and women. Western Wear plans to launch a new Web site, and the company wants to develop a new set of product codes. Currently, 650 different products exist, with the possibility of adding more in the future. Many products come in various sizes, styles, and colors. The marketing manager asked you to develop an individualized product code that can identify a specific item and its characteristics. Your initial reac-tion is that it can be done, but the code might be fairly complex. Back in your office, you give the matter some thought.
1. Design a code scheme that will meet the marketing manager’s stated requirements.2. Write a brief memo to the marketing manager suggesting at least one alternative
to the code she proposed, and state your reasons.3. Suggest a code scheme that will identify each Western Wear customer.4. Suggest a code scheme that will identify each specific order.
Copyright 2011 Cengage Learning. All Rights Reserved. May not be copied, scanned, or duplicated, in whole or in part. Due to electronic rights, some third party content may be suppressed from the eBook and/or eChapter(s).
Editorial review has deemed that any suppressed content does not materially affect the overall learning experience. Cengage Learning reserves the right to remove additional content at any time if subsequent rights restrictions require it.

445
Phase 3 Systems Design
Case Studies
Case studies allow you to practice specific skills learned in the chapter. Each chapter contains sev-eral case studies that continue throughout the textbook, and a chapter capstone case.
New Century Health Clinic
New Century Health Clinic offers preventive medicine and traditional medical care. In your role as an IT consultant, you will help New Century develop a new information system.
BackgroundAfter completing the user interface, input, and output design for the new information
system at New Century, you will consider data design issues. Begin by studying the DFDs and object-oriented diagrams you prepared previously and the rest of the documentation from the systems analysis phase. Perform the following tasks:
Assignments1. Create an initial entity-relationship diagram for the New Century Health Clinic system.2. Normalize your table designs.3. If you identified any new entities during normalization, create a final entity-relationship
diagram for the system.4. Write a memo for your documentation file that contains your recommendation
about whether a file processing or a database environment should be used. Attach copies of your ERD(s) and normalized designs.
PERSONAL TRAINER, INC.
Personal Trainer, Inc., owns and operates fitness centers in a dozen Midwestern cities. The centers have done well, and the company is planning an international expansion by opening a new “supercenter” in the Toronto area. Personal Trainer’s president, Cassia Umi, hired an IT consultant, Susan Park, to help develop an information system for the new facility. During the project, Susan will work closely with Gray Lewis, who will manage the new operation.
BackgroundAfter evaluating various development strategies, Susan prepared a system requirements
document and submitted her recommendations to Cassia Umi, Personal Trainer’s president. During her presentation, Susan discussed several development strategies, including in-house development and outsourcing. She did not feel that a commercial software package would meet Personal Trainer’s needs.
Based on her research, Susan felt it would be premature to select a development strategy at this time. Instead, she recommended to Cassia that an in-house team should develop a design prototype, using a relational database as a model. Susan said that the prototype would have two main objectives: It would represent a user-approved model of the new sys-tem, and it would identify all systems entities and the relationships among them. Susan explained that it would be better to design the basic system first, and then address other issues, including Web enhancements and implementation options. She proposed a three-step plan: data design, user interface design, and application architecture. She explained that sys-tems analysts refer to this as the systems design phase of a development project.
Cassia agreed with Susan’s recommendation, and asked her to go forward with the plan.
Case Studies
Copyright 2011 Cengage Learning. All Rights Reserved. May not be copied, scanned, or duplicated, in whole or in part. Due to electronic rights, some third party content may be suppressed from the eBook and/or eChapter(s).
Editorial review has deemed that any suppressed content does not materially affect the overall learning experience. Cengage Learning reserves the right to remove additional content at any time if subsequent rights restrictions require it.
446
Chapter 9 Data Design
Case Studies
Assignments1. Review the Personal Trainer fact-finding summary in Chapter 4 and draw an ERD
with cardinality notation. Assume that system entities include members, activities and services, and fitness instructors.
2. Design tables in 3NF. As you create the database, include various codes for at least three of the fields.
3. Use sample data to populate the fields for at least three records in each table.4. Recommend a date format for the new system. Should Personal Trainer adopt a sin-
gle international standard, or should the format be determined by the country in which the center is located? Write a message to Susan with your recommendation.
Fastflight Airlines
FastFlight Airlines is a small air carrier operating in three northeastern states. FastFlight is computerizing its passenger reservation system. The data items must include reservation number, flight number, flight date, origin, destination, departure time, arrival time, passen-ger name, and seat number. For example, flight number 303 leaves Augusta, Maine, daily at 9:23 a.m. and arrives in Nashua, New Hampshire, at 10:17 a.m. A typical reservation code might be AXQTBC, for passenger Lisa Lane, in seat 4A, on flight 303 on 11/12/2011.
Assignments1. Create an ERD for the reservations system.2. Create 3NF table designs for the system.3. For each of the entities identified, design tables and identify the possible candidate
keys, the primary key, a probable foreign key, and potential secondary keys.4. Use sample data to populate the fields for three records.
Copyright 2011 Cengage Learning. All Rights Reserved. May not be copied, scanned, or duplicated, in whole or in part. Due to electronic rights, some third party content may be suppressed from the eBook and/or eChapter(s).
Editorial review has deemed that any suppressed content does not materially affect the overall learning experience. Cengage Learning reserves the right to remove additional content at any time if subsequent rights restrictions require it.

447
Phase 3 Systems Design
Chapter Capstone Case: SoftWear, Limited
CHAPTER CAPSTONE CASE: SoftWear, Limited
SoftWear, Limited (SWL), is a continuing case study that illustrates the knowledge and skills described in each chapter. In this case study, the student acts as a member of the SWL sys-tems development team and performs various tasks.
BackgroundWork continued on the ESIP system. Rick said that the system would be a client/server
design that could support SWL’s current and future business requirements. He also said that Ann Hon wanted to use the ESIP system as a prototype for developing other SWL systems in the future. Ann said that the new design would have to be powerful, flexible, and scalable. With that in mind, the team decided that a DBMS strategy was the best solution for SWL’s future information systems requirements.
ERDs and NormalizationRick asked Tom and Becky to draw an entity-relationship diagram with normalized
designs. Tom and Becky used the Visible Analyst, a CASE tool, to produce the diagram shown in Figure 9-50. Rick noticed that only two entities were shown: EMPLOYEE and DEDUCTION. Rick suggested that the ESIP-OPTION and HUMAN RESOURCES entities should be added. Tom and Becky agreed. The second version of their ERD is shown in Figure 9-51 on the next page.
With the ERD completed, Tom turned to the design of the EMPLOYEE table. He sug-gested the following design:
EMPLOYEE (SSN, EMPLOYEE-NAME, HIRE-DATE)
“The table obviously is in 1NF, because it has no repeating groups,” Tom said. “It’s also in 2NF, because it has a single field as the primary key. And I’m sure it’s in 3NF, because the
FIGURE 9-50 The initial ERD shows two entities: EMPLOYEE and DEDUCTION. Notice that crow’s foot notation indicates that one and only one employee can authorize anywhere from zero to many deductions.
Copyright 2011 Cengage Learning. All Rights Reserved. May not be copied, scanned, or duplicated, in whole or in part. Due to electronic rights, some third party content may be suppressed from the eBook and/or eChapter(s).
Editorial review has deemed that any suppressed content does not materially affect the overall learning experience. Cengage Learning reserves the right to remove additional content at any time if subsequent rights restrictions require it.

448
Chapter 9 Data Design
CHAPTER CAPSTONE CASE: SoftWear, Limited (continued)
employee name and the hire date both depend on the Social Security number.” Everyone agreed that this was the correct design. Tom and Becky turned their attention to designing the ESIP-OPTION table and later suggested the following design:
ESIP-OPTION (OPTION-CODE, OPTION-NAME, DESCRIPTION, DEDUCTION- CYCLE, APPLICATION-CYCLE, MIN-SERVICE, MIN-DEDUCTION, MAX-DEDUCTION)
The design appeared to meet the test for 3NF. Although seven fields existed in addition to the primary key, each field seemed to depend on the entire primary key. Finally, Becky proposed the following design for the DEDUCTION record:
DEDUCTION (SSN, ESIP-OPTION, DATE, EMPLOYEE-NAME, AMOUNT)
This time, Rick felt that the table was in 1NF, but not in 2NF because the EMPLOYEE-NAME field was dependent on only a part of the key rather than the entire key. Becky agreed with him and suggested that the EMPLOYEE-NAME field could be removed and accessed using the EMPLOYEE table. The SSN field could be used as a foreign key to match values in the EMPLOYEE table’s primary key. To put the table into 2NF, she revised the DEDUCTION table design as follows:
DEDUCTION (SSN, ESIP-OPTION, DATE, AMOUNT)
With that change, everyone agreed that the table also was in 3NF because the AMOUNT field depended on the entire primary key. The next step was to work on a system design to interface with the payroll system and provide support for SWL’s long-term information technology goals.
While Rick, Tom, and Becky were working on ERDs and normalization, Pacific Software delivered the payroll package that SWL ordered. Tom was assigned to work on installing and configuring the package and training users on the new payroll system.
Meanwhile, Rick felt that SWL should get more information about client/server design. With Ann Hon’s approval, he con-tacted several IT consulting firms that advertised their client/server design exper-tise on the Internet. Rick and Becky met with three firms and recommended that SWL work with True Blue Systems, a consulting group with a local office in Raleigh, not far from SWL’s headquarters. In addition to the design for the ESIP sys-tem, Rick suggested that the agenda should include the possibility that employees could access their ESIP accounts from home via the Internet.
FIGURE 9-51 Second version of the ERD. Now, the DEDUCTION entity has relationships to two other entities: EMPLOYEE and ESIP-OPTION.
Chapter Capstone Case: SoftWear, Limited
Copyright 2011 Cengage Learning. All Rights Reserved. May not be copied, scanned, or duplicated, in whole or in part. Due to electronic rights, some third party content may be suppressed from the eBook and/or eChapter(s).
Editorial review has deemed that any suppressed content does not materially affect the overall learning experience. Cengage Learning reserves the right to remove additional content at any time if subsequent rights restrictions require it.

449
Phase 3 Systems Design
Chapter Capstone Case: SoftWear, Limited
CHAPTER CAPSTONE CASE: SoftWear, Limited (continued)
SWL Team Tasks
1. Rick asked you to help him put together a brief progress update for Michael Jeremy and sev-eral other top managers. Specifically, Rick wants you to explain the concept of normalization without using a lot of technical jargon. Rick wants you to summarize the concept using plain English and simple examples.
2. At SWL, each employee is assigned to a specific department. Employees from several depart-ments often are assigned to special project teams, however, when a new product is launched or for major marketing events. Carla wants to develop a project management system to track the projects, employees assigned, and accumulated project hours. She believes that employees and projects are in a M:N relationship. She showed you an initial design where all data is stored in a single table:
PROJECT DATA (PROJECT-NUMBER, PROJECT-NAME, START-DATE, PROJECT-STATUS, (EMPLOYEE-NUMBER, EMPLOYEE-NAME, JOB-TITLE, DEPT-NUMBER, DEPT-NAME, PROJECT-HOURS))
How would you describe Carla’s design?3. Carla wants you to create an ERD, including cardinality, for the project management system.
She says that you probably will need to add an associative entity.4. After you create the ERD in the previous step, design a table for each entity, in third normal form.
Manage the SWL ProjectYou have been asked to manage SWL’s new information system project. One of your most
important activities will be to identify project tasks and determine when they will be per-formed. Before you begin, you should review the SWL case in this chapter. Then list and ana-lyze the tasks, as follows:
LIST THE TASKS Start by listing and numbering at least 10 tasks that the SWL team needs to perform to fulfill the objectives of this chapter. Your list can include SWL Team Tasks and any other tasks that are described in this chapter. For example, Task 3 might be to Identify all entities, and Task 6 might be to Create an initial ERD.
ANALYZE THE TASKS Now study the tasks to determine the order in which they should be performed. First identify all concurrent tasks, which are not dependent on other tasks. In the example shown in Figure 9-52 on the next page, Tasks 1, 2, 3, 4, and 5 are concurrent tasks, and could begin at the same time if resources were available.
Other tasks are called dependent tasks, because they cannot be performed until one or more earlier tasks have been completed. For each dependent task, you must identify specific tasks that need to be completed before this task can begin. For example, you would want to identify all the entities before you could create an initial ERD, so Task 6 cannot begin until Task 3 is completed, as Figure 9-52 shows.
Copyright 2011 Cengage Learning. All Rights Reserved. May not be copied, scanned, or duplicated, in whole or in part. Due to electronic rights, some third party content may be suppressed from the eBook and/or eChapter(s).
Editorial review has deemed that any suppressed content does not materially affect the overall learning experience. Cengage Learning reserves the right to remove additional content at any time if subsequent rights restrictions require it.

450
Chapter 9 Data Design
CHAPTER CAPSTONE CASE: SoftWear, Limited (continued)
FIGURE 9-52 Tasks 1, 2, 3, 4, and 5 are concurrent tasks that could be performed at the same time. Task 6 is a dependent task that cannot be performed until Task 3 has been completed.
Chapter 3 describes project management tools, techniques, and software. To learn more, you can use the Features section on your Student Study Tool CD-ROM, or visit the Management Information Systems CourseMate Web site at www.cengagebrain.com and locate the project management resources library for this book. On the Web, Microsoft offers demo versions, training, and tips for using Project 2010. You also can visit the OpenWorkbench.org site to learn more about this free, open-source software.
Chapter Capstone Case: SoftWear, Limited
Copyright 2011 Cengage Learning. All Rights Reserved. May not be copied, scanned, or duplicated, in whole or in part. Due to electronic rights, some third party content may be suppressed from the eBook and/or eChapter(s).
Editorial review has deemed that any suppressed content does not materially affect the overall learning experience. Cengage Learning reserves the right to remove additional content at any time if subsequent rights restrictions require it.

451
Phase 3 Systems Design
Ready for a Challenge?
This week, the IT team at Game Technology is working on database design and codes. Your job is to develop a recommendation for keeping track of individual games and their authors. You will be expected to create an ERD and table designs. Here is what you know so far:
• Every game has a product ID, name, version number, category code, and category description.
• Every author has an author ID, name, mailing address, and e-mail address.• An individual author can develop one or more games.• A game also can be developed by several authors. In this case, each author receives a
specific percentage of the royalty that the game earns.
This information must be stored in the database. Your plan is to develop an overall design, list all the individual data items, and then include them as fields in the tables you create. Your design must be in the form of an ERD that shows all the entities, including any associative entities, and their relationships. Also, all table designs must be in third normal form (3NF).
The IT team also discussed data codes. You read somewhere that six-letter codes can have over 300 million unique combinations, but you don’t know the exact number. Your friend, a math major, said that you could figure out the answer on your own, and she gave you a hint by saying it was 26 to the sixth power.
Practice TasksA. Draw an ERD showing all entities and their relationships, and create table designs that include all necessary fields.B. Calculate the exact number of unique combinations that are possible using a six-letter code.
After you complete the Practice Tasks, to check your work and view sample answers, visit the Management Information Systems CourseMate Web site at www.cengagebrain.com, navigate to the resources for this chapter, and locate Ready for a Challenge?.
The ChallengeYour recommended design ran into a snag. The team leader said it wasn’t bad, but it did not go far enough. The specific comment was that it was not in third normal form.
Also, the team finally decided on a code for the customer ID field, which is a primary key. The code will be a combination code, with four letters followed by four digits. The letters would be the first four letters of the customer’s last name, which might make it easier for customers to remember.
Challenge TasksA. Review the sample ERD and table designs, and convert them to third normal form (3NF).B. Calculate the exact number of possible combinations with a code composed of four letters followed by four numbers. Does this seem like a good choice? Why or why
not? What would you suggest?
In additional to technical skills, IT professionals need critical thinking skills such as perception, organization, analysis, problem-solving, and decision-making. The Ready for a Challenge feature can help you learn, practice, and apply critical thinking skills that you can take to the workplace.
Ready for a Challenge?
Copyright 2011 Cengage Learning. All Rights Reserved. May not be copied, scanned, or duplicated, in whole or in part. Due to electronic rights, some third party content may be suppressed from the eBook and/or eChapter(s).
Editorial review has deemed that any suppressed content does not materially affect the overall learning experience. Cengage Learning reserves the right to remove additional content at any time if subsequent rights restrictions require it.