chapter analysis of organic compounds using chromatography
TRANSCRIPT

The term ‘chromatography’ refers to a set of techniques that can be used to separate and analyse the components in a mixture. Separation is performed by passing the mixture through a medium that allows the components of the mixture to move through at different rates.
In Heinemann Chemistry 1, you learned about the basic principles of chromatography. You would also have read how the analytical technique of high-performance liquid chromatography (HPLC) allows extremely sensitive and rapid analysis of the components in a mixture.
In this chapter, you will revise the principles of chromatography with reference to paper chromatography, thin-layer chromatography and column chromatography. You will then examine how these basic principles are employed in HPLC for identifying organic compounds and determining their concentration.
Key knowledge• The principles of chromatography including use of high-performance liquid
chromatography (HPLC) and construction and use of a calibration curve to determine the concentration of an organic compound in a solution
VCE Chemistry Study Design extracts © VCAA (2015); reproduced by permission.
Analysis of organic compounds using chromatography
CHAPTER
Page
Proo
fs

64 AREA OF STUDY 1 | HOW CAN THE DIVERSITY OF CARBON COMPOUNDS BE EXPLAINED AND CATEGORISED?
13.1 Principles of chromatographyChromatography is a widely used technique for separating and analysing complex mixtures of organic compounds. Food, petrochemicals, perfumes and pharmaceuticals are all mixtures that can be separated by chromatography. A feature of chromatography is that it can be performed on very small samples and for low concentrations. When separated, the various components often appear as distinct bands, as seen in Figure 13.1.1.
In this section, you will revise the principles of chromatography that you learned in Chapter 19 of Heinemann Chemistry 1. The next section will describe the use of the analytical technique of high-performance liquid chromatography for the analysis of organic compounds.
HOW CHROMATOGRAPHY WORKSYou can perform a simple chromatography experiment by putting spots of ink from felt-tip pens near one end of a strip of filter paper. The filter paper can then be suspended so the end closest to the ink spots is just immersed in water.
The original position of the ink spots on the paper is called the origin. The inks are a mixture of different-coloured chemicals. As the water soaks up the paper, the components of the inks are carried upwards at different rates and separate into spots of different colours, as seen in Figure 13.1.2.
Each spot contains one of the components that are present in the ink mixture. The pattern of bands or spots is called a chromatogram.
This is an example of paper chromatography. In the laboratory, paper chromatography is performed with high-quality absorbent paper, similar to filter paper.
All methods of chromatography have a:• stationary phase• moving or mobile phase.
In the simple experiment using inks and paper, the stationary phase is a thin layer of water adsorbed to the paper and the mobile phase is the water.
As the components in the ink are swept upwards over the stationary phase by the solvent, they undergo a continual process of adsorption (onto the stationary phase), followed by desorption and dissolving (into the mobile phase).
The rate of movement of each component mainly depends on:• how strongly the component adsorbs onto the stationary phase• how readily the component dissolves in the mobile phase.
The components separate because they undergo these two processes to a different degree. Water is a polar solvent. If water is used as the mobile phase, the more polar components will tend to move more quickly than the less polar components. These more soluble components will move further up the paper in a given time interval.
The term ‘adsorption’ describes the adhesion of molecules or substances to the surface of a solid or liquid. This is why the stationary phase in chromatography is either a solid or a liquid. The mobile phase is in either a liquid or a gas state.
FIGURE 13.1.1 These glowing bands, viewed under fluorescent lighting, are individual chemical components that have been separated from a mixture by a form of thin-layer chromatography. The individual components can then be identified by mass spectrometry.
FIGURE 13.1.2 Paper chromatography can be used to separate mixtures of inks into their separate components.
Page
Proo
fs
65CHAPTER 13 | ANALYSIS OF ORGANIC COMPOUNDS USING CHROMATOGRAPHY
CHEMFILE
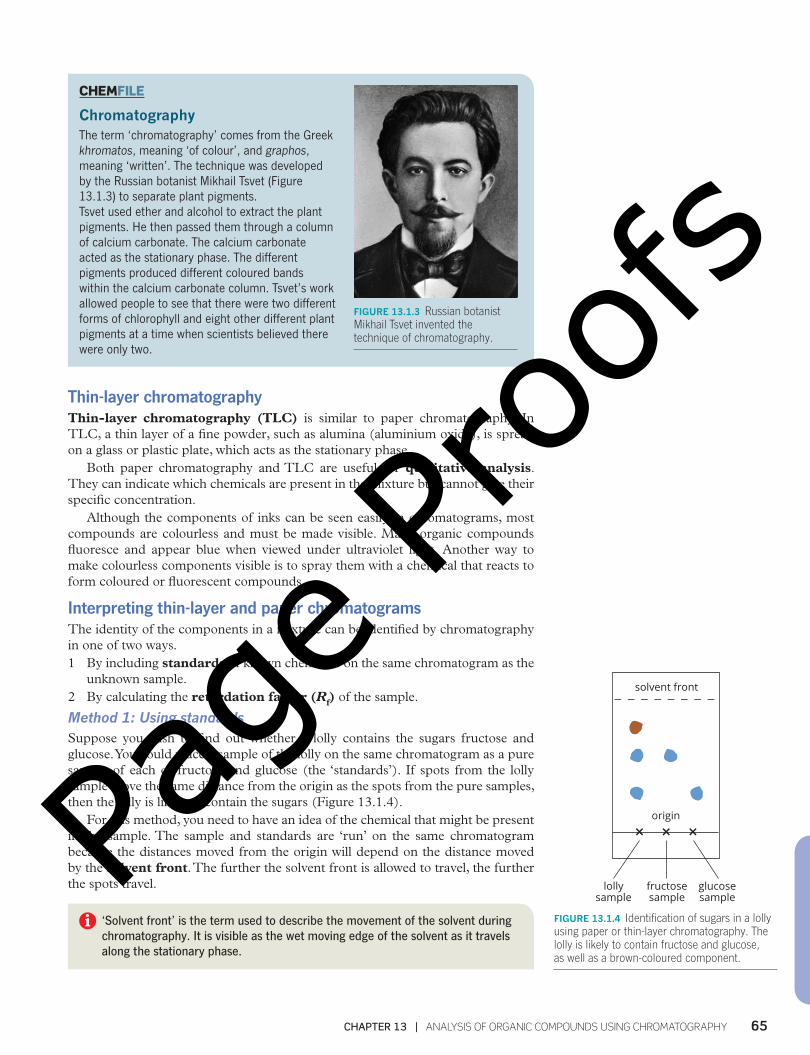
ChromatographyThe term ‘chromatography’ comes from the Greek khromatos, meaning ‘of colour’, and graphos, meaning ‘written’. The technique was developed by the Russian botanist Mikhail Tsvet (Figure 13.1.3) to separate plant pigments.Tsvet used ether and alcohol to extract the plant pigments. He then passed them through a column of calcium carbonate. The calcium carbonate acted as the stationary phase. The different pigments produced different coloured bands within the calcium carbonate column. Tsvet’s work allowed people to see that there were two different forms of chlorophyll and eight other different plant pigments at a time when scientists believed there were only two.
FIGURE 13.1.3 Russian botanist Mikhail Tsvet invented the technique of chromatography.
Thin-layer chromatographyThin-layer chromatography (TLC) is similar to paper chromatography. In TLC, a thin layer of a fine powder, such as alumina (aluminium oxide), is spread on a glass or plastic plate, which acts as the stationary phase.
Both paper chromatography and TLC are useful for qualitative analysis. They can indicate which chemicals are present in the mixture but cannot give their specific concentration.
Although the components of inks can be seen easily in chromatograms, most compounds are colourless and must be made visible. Many organic compounds fluoresce and appear blue when viewed under ultraviolet light. Another way to make colourless components visible is to spray them with a chemical that reacts to form coloured or fluorescent compounds.
Interpreting thin-layer and paper chromatogramsThe identity of the components in a mixture can be identified by chromatography in one of two ways.1 By including standards of known chemicals on the same chromatogram as the
unknown sample.2 By calculating the retardation factor (Rf) of the sample.
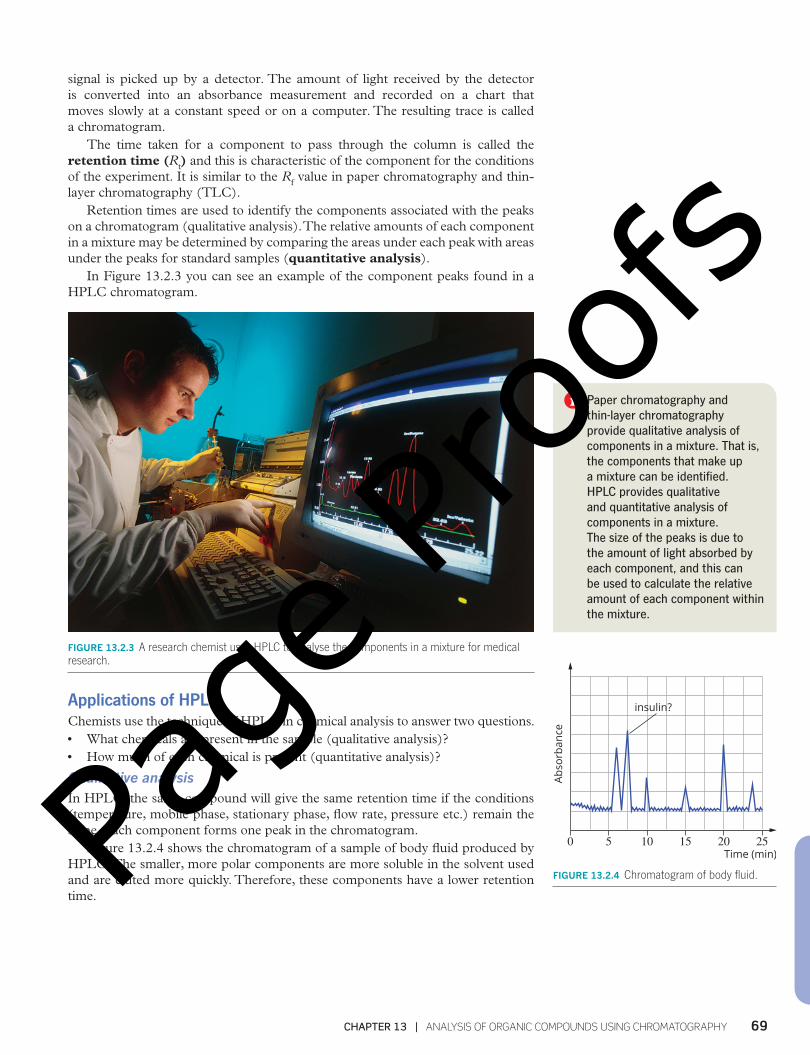
Method 1: Using standardsSuppose you wish to find out whether a lolly contains the sugars fructose and glucose. You could place a sample of the lolly on the same chromatogram as a pure sample of each of fructose and glucose (the ‘standards’). If spots from the lolly sample move the same distance from the origin as the spots from the pure samples, then the lolly is likely to contain the sugars (Figure 13.1.4).
For this method, you need to have an idea of the chemical that might be present in the sample. The sample and standards are ‘run’ on the same chromatogram because the distances moved from the origin will depend on the distance moved by the solvent front. The further the solvent front is allowed to travel, the further the spots travel.
‘Solvent front’ is the term used to describe the movement of the solvent during chromatography. It is visible as the wet moving edge of the solvent as it travels along the stationary phase.
solvent front
origin
lollysample
glucosesample
fructosesample
FIGURE 13.1.4 Identification of sugars in a lolly using paper or thin-layer chromatography. The lolly is likely to contain fructose and glucose, as well as a brown-coloured component.
Page
Proo
fs

66 AREA OF STUDY 1 | HOW CAN THE DIVERSITY OF CARBON COMPOUNDS BE EXPLAINED AND CATEGORISED?
Method 2: Calculating Rf valuesAnother way of identifying the components of a mixture is by calculating the distance they travel up the stationary phase compared to the distance travelled by the solvent front. This is expressed as a retardation factor (Rf) for a component:
Rf = distance the component travels from the origindistance the solvent front travels from the origin
You can see from Figure 13.1.5 that:• Rf values will always be less than one• the component most strongly adsorbed onto the stationary phase moves the
shortest distance and has the lowest Rf value.Each component has a characteristic Rf value for the conditions under which
the chromatogram was obtained. By comparing the Rf values of components of a particular mixture with the Rf values of known substances determined under identical conditions, you can identify the components present in a mixture.
In this method, the distance moved by the solvent front is no longer critical. The proportion of the distance moved from the origin (the Rf value) stays the same provided the conditions under which the chromatogram is obtained are the same.
This means the Rf values of unknown spots can be compared against a table of Rf values of common materials.
However, changes in the temperature, the type of stationary phase, the amount of water vapour (around the plate or paper) and the type of solvent will all change the Rf value for a particular chemical.
For the Rf value of a component to be comparable to a set of standard Rf values, they must be determined under identical conditions.
Worked example 13.1.1
CALCULATING Rf VALUES
Using Figure 13.1.5, calculate the Rf value of the blue component.
THINKING WORKING
Record the distance the component has moved from the origin and the distance the solvent front has moved from the origin.
The distance the blue component has moved from the origin is 3.5 cm.
The distance the solvent front has moved from the origin is 10 cm.
Rf = distance the component travels from the origindistance the solvent front travels from the origin
Rf (blue component) = 3.510
= 0.35
Worked example: Try yourself 13.1.1
CALCULATING Rf VALUES
Using Figure 13.1.5, calculate the Rf value of the red component.
solvent front
10 cm7.5 cm
3.5 cm
origin
FIGURE 13.1.5 Thin-layer chromatogram of a sample with two components. The distances from the origin enable you to calculate Rf.
Page
Proo
fs

67CHAPTER 13 | ANALYSIS OF ORGANIC COMPOUNDS USING CHROMATOGRAPHY
The choice between paper and thin-layer chromatography depends upon the sample being analysed. Advantages of each method are given in Table 13.1.1.
TABLE 13.1.1 A comparison of paper and thin-layer chromatography
Paper chromatography Thin-layer chromatography
Is cheap Detects smaller amounts
Requires little preparation Achieves better separation of less polar compounds
Is more efficient for polar and water-soluble compounds
Can use corrosive materials
Is easy to handle and store Has a wide range of stationary phases
COLUMN CHROMATOGRAPHYFigure 13.1.6 shows another form of chromatography, column chromatography, which can also be used to separate the components of a mixture.
In column chromatography, the solid stationary phase is packed into a glass column. The sample mixture is applied carefully to the top of the packed solid, and a solvent, which acts as the mobile phase, is dripped slowly onto the column from a reservoir above. A tap at the bottom of the column allows the solvent, which is now called the eluent, to leave the column at the same rate as it enters it at the other end.
As the components are carried down the column, they are repeatedly adsorbed to the stationary phase and desorbed back into the mobile phase. The components of a mixture undergo the processes of adsorption and desorption to different degrees, so the components separate as they move downwards.
solvent
component 1:most stronglyadsorbed
component 2
component 3:least stronglyadsorbed
sample originallyplaced here
solid stationaryphase
porous barrier
eluent
FIGURE 13.1.6 Column chromatography is used to separate the components in a mixture.
• The components in a mixture can be separated and identified by chromatography.
• Two simple forms of chromatography are paper chromatography and thin-layer chromatography.
• A mobile phase and a stationary phase are present in all forms of chromatography.
• The components of a mixture separate during chromatography as a consequence of how strongly they adsorb to the stationary phase and desorb back into the mobile phase.
• Paper and thin-layer chromatography can be used to identify the components in a mixture by comparing them with known standards or by determining their Rf values.
13.1 ReviewSUMMARY
KEY QUESTIONS
1 Describe how the rate of adsorption and desorption of a component that appears at the top of a paper chromatogram compares to that of a component that appears at the bottom of the chromatogram.
2 Describe how an Rf value is calculated.
3 For each of the following types of chromatography, identify the:i mobile phaseii stationary phase.
a paper chromatographyb column chromatographyc thin-layer chromatography
4 Explain why the level of the solvent must be below the level of the origin where the samples are placed in paper chromatography.
Page
Proo
fs

68 AREA OF STUDY 1 | HOW CAN THE DIVERSITY OF CARBON COMPOUNDS BE EXPLAINED AND CATEGORISED?
13.2 High-performance liquid chromatographyIn the previous section, you learned how the techniques of paper and thin-layer chromatography can separate the components in a mixture. In these techniques, a liquid mobile phase is used to carry the components of the mixture past a stationary phase. The components undergo a continual process of adsorption to the stationary phase and desorption back into the liquid. The components of a mixture undergo the processes of adsorption and desorption to different degrees, so the components separate as they move over the stationary phase.
In this section, you will learn about a highly sensitive technique capable of detecting miniscule amounts of a compound—high-performance liquid chromatography (HPLC).
HIGH-PERFORMANCE LIQUID CHROMATOGRAPHYHigh-performance liquid chromatography (HPLC) is a modern instrumental chromatographic technique based on column chromatography.
HPLC allows scientists to perform extremely sensitive analyses of a wide range of mixtures. It is commonly used for the separation and identification of very complex mixtures of similar compounds, such as drugs in blood, and hydrocarbons in oil samples. Compounds in trace concentrations as low as parts per trillion (ppt) may easily be identified. HPLC is therefore a much more sensitive technique than volumetric analysis which is discussed in the following chapter.
Figure 13.2.1 shows the apparatus used for HPLC. The basic principles of HPLC are the same as for column chromatography described in the previous section. The main differences between simple column chromatography and HPLC are the:• particles in the solid used in the HPLC column are often 10–20 times smaller
than those used in column chromatography. Their higher surface area allows more frequent adsorption and desorption of the components. This greater surface area therefore gives much better separation of similar compounds.
• small particle size used in HPLC creates a considerable resistance to the flow of the mobile phase. Therefore, the solvent is pumped through the column under high pressure.A range of solids is available for use in HPLC columns, including alumina
(Al2O3) and silica (SiO2). Some solids also have chemicals specially bonded to their surfaces to improve the separation of particular classes of compounds.
In the most common form of HPLC, called reversed-phase HPLC, the stationary phase is silica. The silica used has been modified to make it non-polar by attaching long hydrocarbon chains to its surface. A polar solvent is used as the mobile phase, such as a mixture of water and methanol.
Polar molecules in the sample form relatively strong hydrogen bonds and dipole–dipole attractions with solvent molecules, but are only weakly adsorbed to the non-polar stationary phase. Therefore, polar molecules in the sample spend most of their time moving with the solvent.
On the other hand, non-polar compounds in the sample tend to adsorb to the non-polar stationary phase by dispersion forces. They are also less soluble in the solvent because they cannot form hydrogen bonds with the polar mobile phase. Non-polar compounds spend less time in solution, so they move through the column more slowly than polar molecules.
The way this separation occurs can be seen in Figure 13.2.2.In HPLC, the components are usually detected by passing the eluent stream
through a beam of ultraviolet (UV) light. Many organic compounds absorb UV light. When an organic compound passes in front of the beam of light, a reduced
High-performance liquid chromatography (HPLC) is sometimes also referred to as high-pressure liquid chromatography.
liquidmobile phase
syringe forinjectingsample
solidstationaryphase
detector
columnpump
recorder
waste
FIGURE 13.2.1 The construction of a high-performance liquid chromatograph.
Elute with solvent.
Apply sample.
FIGURE 13.2.2 A diagram showing how HPLC can be used to separate and collect different components.
Page
Proo
fs
69CHAPTER 13 | ANALYSIS OF ORGANIC COMPOUNDS USING CHROMATOGRAPHY
signal is picked up by a detector. The amount of light received by the detector is converted into an absorbance measurement and recorded on a chart that moves slowly at a constant speed or on a computer. The resulting trace is called a chromatogram.
The time taken for a component to pass through the column is called the retention time (Rt) and this is characteristic of the component for the conditions of the experiment. It is similar to the Rf value in paper chromatography and thin-layer chromatography (TLC).
Retention times are used to identify the components associated with the peaks on a chromatogram (qualitative analysis). The relative amounts of each component in a mixture may be determined by comparing the areas under each peak with areas under the peaks for standard samples (quantitative analysis).
In Figure 13.2.3 you can see an example of the component peaks found in a HPLC chromatogram.
FIGURE 13.2.3 A research chemist uses HPLC to analyse the components in a mixture for medical research.
Applications of HPLCChemists use the technique of HPLC in chemical analysis to answer two questions.• What chemicals are present in the sample (qualitative analysis)?• How much of each chemical is present (quantitative analysis)?
Qualitative analysisIn HPLC, the same compound will give the same retention time if the conditions (temperature, mobile phase, stationary phase, flow rate, pressure etc.) remain the same. Each component forms one peak in the chromatogram.
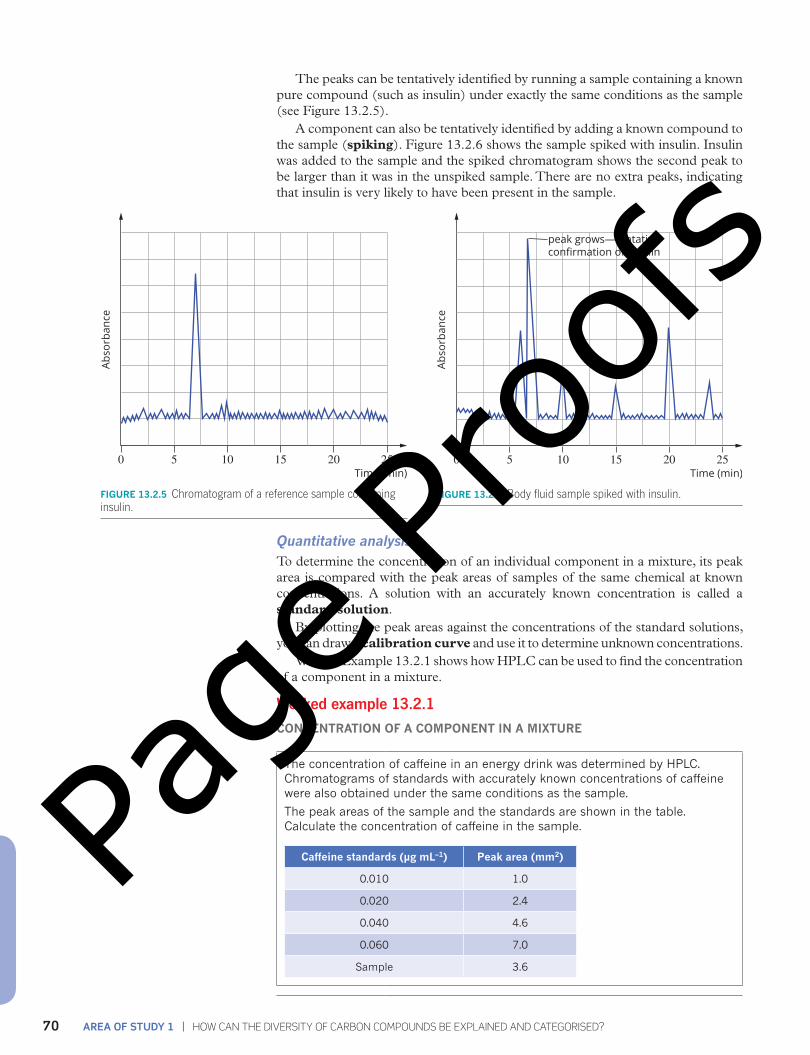
Figure 13.2.4 shows the chromatogram of a sample of body fluid produced by HPLC. The smaller, more polar components are more soluble in the solvent used and are eluted more quickly. Therefore, these components have a lower retention time.
Paper chromatography and thin-layer chromatography provide qualitative analysis of components in a mixture. That is, the components that make up a mixture can be identified. HPLC provides qualitative and quantitative analysis of components in a mixture. The size of the peaks is due to the amount of light absorbed by each component, and this can be used to calculate the relative amount of each component within the mixture.
Abso
rban
ce
Time (min)
insulin?
50 15 20 2510
FIGURE 13.2.4 Chromatogram of body fluid.Page
Proo
fs
70 AREA OF STUDY 1 | HOW CAN THE DIVERSITY OF CARBON COMPOUNDS BE EXPLAINED AND CATEGORISED?
The peaks can be tentatively identified by running a sample containing a known pure compound (such as insulin) under exactly the same conditions as the sample (see Figure 13.2.5).
A component can also be tentatively identified by adding a known compound to the sample (spiking). Figure 13.2.6 shows the sample spiked with insulin. Insulin was added to the sample and the spiked chromatogram shows the second peak to be larger than it was in the unspiked sample. There are no extra peaks, indicating that insulin is very likely to have been present in the sample.
Abso
rban
ce
Time (min)50 15 20 2510
FIGURE 13.2.5 Chromatogram of a reference sample containing insulin.
Abso
rban
ce
Time (min)50 15 20 2510
peak grows—tentativeconfirmation of insulin
FIGURE 13.2.6 Body fluid sample spiked with insulin.
Quantitative analysisTo determine the concentration of an individual component in a mixture, its peak area is compared with the peak areas of samples of the same chemical at known concentrations. A solution with an accurately known concentration is called a standard solution.
By plotting the peak areas against the concentrations of the standard solutions, you can draw a calibration curve and use it to determine unknown concentrations.
Worked Example 13.2.1 shows how HPLC can be used to find the concentration of a component in a mixture.
Worked example 13.2.1
CONCENTRATION OF A COMPONENT IN A MIXTURE
The concentration of caffeine in an energy drink was determined by HPLC. Chromatograms of standards with accurately known concentrations of caffeine were also obtained under the same conditions as the sample.
The peak areas of the sample and the standards are shown in the table. Calculate the concentration of caffeine in the sample.
Caffeine standards (µg mL–1) Peak area (mm2)
0.010 1.0
0.020 2.4
0.040 4.6
0.060 7.0
Sample 3.6
Page
Proo
fs
71CHAPTER 13 | ANALYSIS OF ORGANIC COMPOUNDS USING CHROMATOGRAPHY
Thinking Working
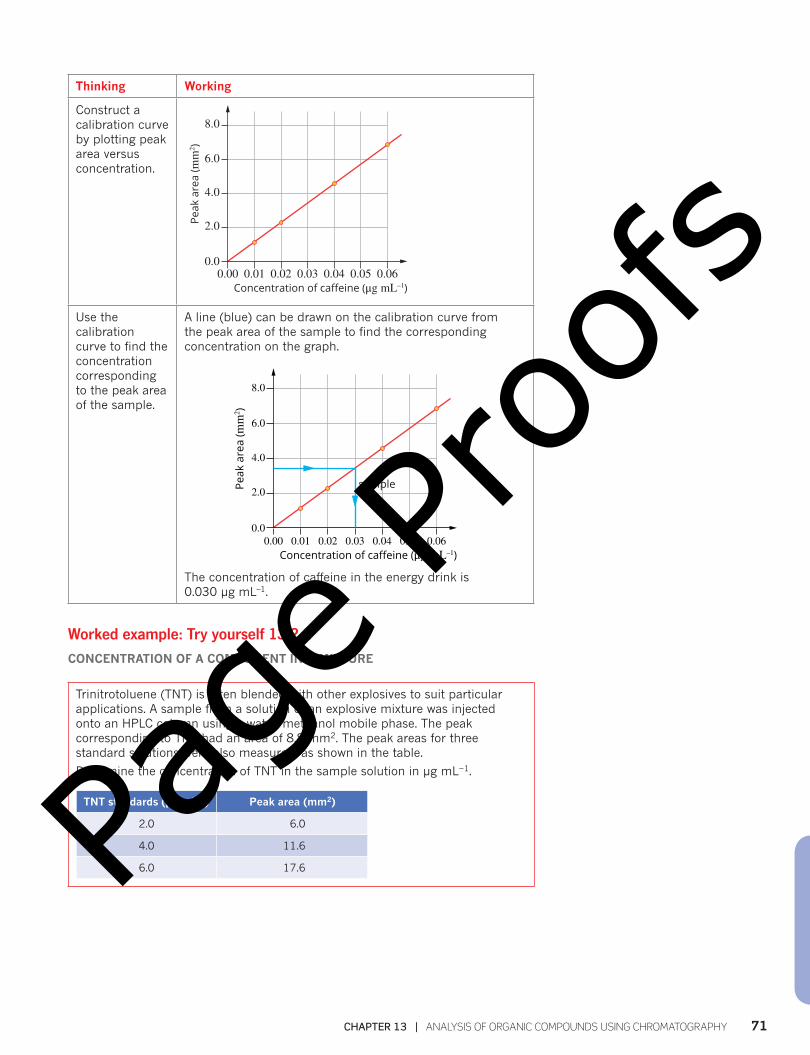
Construct a calibration curve by plotting peak area versus concentration.
2.0
0.00.010.00 0.02 0.03 0.04 0.05 0.06
Concentration of caffeine (μg mL–1)
Peak
are
a (m
m2 )
4.0
6.0
8.0
Use the calibration curve to find the concentration corresponding to the peak area of the sample.
A line (blue) can be drawn on the calibration curve from the peak area of the sample to find the corresponding concentration on the graph.
2.0
0.00.010.00 0.02 0.03 0.04 0.05 0.06
Concentration of caffeine (μg mL–1)
Peak
are
a (m
m2 )
4.0
6.0
8.0
sample
The concentration of caffeine in the energy drink is 0.030 µg mL–1.
Worked example: Try yourself 13.2.1
CONCENTRATION OF A COMPONENT IN A MIXTURE
Trinitrotoluene (TNT) is often blended with other explosives to suit particular applications. A sample from a solution of an explosive mixture was injected onto an HPLC column using a water/methanol mobile phase. The peak corresponding to TNT had an area of 8.8 mm2. The peak areas for three standard solutions were also measured, as shown in the table.
Determine the concentration of TNT in the sample solution in µg mL−1.
TNT standards (µg mL–1) Peak area (mm2)
2.0 6.0
4.0 11.6
6.0 17.6Page
Proo
fs
72 AREA OF STUDY 1 | HOW CAN THE DIVERSITY OF CARBON COMPOUNDS BE EXPLAINED AND CATEGORISED?
CHEMISTRY IN ACTION
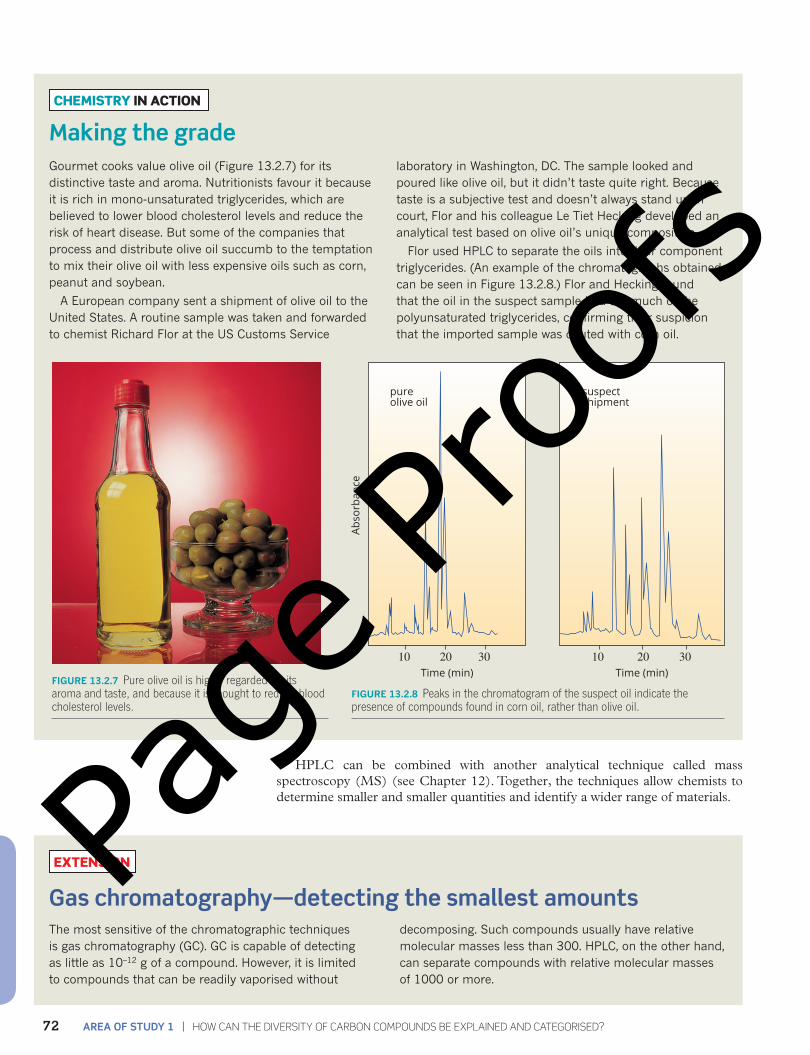
Making the gradeGourmet cooks value olive oil (Figure 13.2.7) for its distinctive taste and aroma. Nutritionists favour it because it is rich in mono-unsaturated triglycerides, which are believed to lower blood cholesterol levels and reduce the risk of heart disease. But some of the companies that process and distribute olive oil succumb to the temptation to mix their olive oil with less expensive oils such as corn, peanut and soybean.
A European company sent a shipment of olive oil to the United States. A routine sample was taken and forwarded to chemist Richard Flor at the US Customs Service
laboratory in Washington, DC. The sample looked and poured like olive oil, but it didn’t taste quite right. Because taste is a subjective test and doesn’t always stand up in court, Flor and his colleague Le Tiet Hecking developed an analytical test based on olive oil’s unique composition.
Flor used HPLC to separate the oils into their component triglycerides. (An example of the chromatographs obtained can be seen in Figure 13.2.8.) Flor and Hecking found that the oil in the suspect sample had too much of the polyunsaturated triglycerides, confirming their suspicion that the imported sample was diluted with corn oil.
10 20 30
pureolive oil
suspectshipment
10 20 30Time (min)
Abso
rban
ce
Time (min)
FIGURE 13.2.8 Peaks in the chromatogram of the suspect oil indicate the presence of compounds found in corn oil, rather than olive oil.
FIGURE 13.2.7 Pure olive oil is highly regarded for its aroma and taste, and because it is thought to reduce blood cholesterol levels.
HPLC can be combined with another analytical technique called mass spectroscopy (MS) (see Chapter 12). Together, the techniques allow chemists to determine smaller and smaller quantities and identify a wider range of materials.
EXTENSION
Gas chromatography—detecting the smallest amountsThe most sensitive of the chromatographic techniques is gas chromatography (GC). GC is capable of detecting as little as 10–12 g of a compound. However, it is limited to compounds that can be readily vaporised without
decomposing. Such compounds usually have relative molecular masses less than 300. HPLC, on the other hand, can separate compounds with relative molecular masses of 1000 or more.
Page
Proo
fs

73CHAPTER 13 | ANALYSIS OF ORGANIC COMPOUNDS USING CHROMATOGRAPHY
The extreme sensitivity of gas chromatography makes it ideal for the analysis of trace contaminants in samples or for the detection of tiny amounts of very potent compounds. For example, urine samples are routinely taken from athletes competing in major sporting events to check whether the athletes are using illegal, performance-enhancing drugs. These samples are analysed by GC.
There are two types of GC, gas–liquid chromatography (GLC) and gas–solid chromatography (GSC). Both GC techniques operate in a similar way as outlined below. A generalised diagram of the equipment used in GC is shown in Figure 13.2.9.
sampleinjectionport
carrier gas(usuallynitrogen)
ovencolumn
detector
chartrecorder
FIGURE 13.2.9 A gas chromatograph.
Gas chromatography has the following features.
• The mobile phase is a gas, generally nitrogen, called the carrier gas.
• A small amount of sample is injected into the top of the column through an injection port.
• The injection port is heated to a temperature sufficient to instantly vaporise the sample, which is then swept into the column by the carrier gas.
• The column is a loop, or series of loops, of glass that has an internal diameter of about 4 mm and is 2–3 m long in total. In GLC, the column is packed with a porous solid that has been coated with a liquid hydrocarbon or ester with a high boiling point. This liquid acts as a liquid stationary phase. In GSC, the column is packed with an adsorbant solid such as silica gel or alumina. The solid acts as a solid stationary phase.
• The column is mounted in an oven and heated.
• The components of the sample repeatedly adsorb onto and desorb from the stationary phase. The least soluble components are swept out first by the gas into the detector (see Figure 13.2.10).
The chromatogram shows the response of the detector against time. The response of the solvent is constant and gives a flat baseline. As components pass through the detector, the response changes and a peak is formed. The sample is injected into the column at time zero. Different chemicals show different strengths of attraction
for the stationary phase and the mobile phase, and so pass through the column at different rates. As in HPLC, the time a component takes to pass through the column is called the retention time, Rt. The same compound will give the same retention time if the conditions (temperature, mobile phase, stationary phase, flow rate, pressure etc.) remain the same.
Extension questionAustralian wines are routinely tested for ethanol content. A quick and reliable method for testing is GLC. The peak areas produced by a sample of wine and a number of standard solutions of ethanol are shown in Table 13.2.1.
TABLE 13.2.1 Peak areas from GLC analysis of a wine sample and standards
Ethanol (%) Relative ethanol peak area
Wine ? 82 400
Standard 1 4.00 31 200
Standard 2 8.00 62 900
Standard 3 12.00 94 200
Standard 4 16.00 125 700
a Plot a calibration curve of concentration of ethanol against peak area.
b Determine the percentage of ethanol in the wine sample.
c Why is it necessary to measure the peak areas produced by a number of standards?
B B
B
B
B
B
B
B
B
B B
B
B
BB
BA A
A
AA
A
A
A
A
AA
A
A
A
A
A
A
A
A
A
A
porous solid, e.g. silica
mobile phase, e.g. nitrogen
stationary phase, e.g. high boiling point liquid hydrocarbon
Component A is more soluble in the stationary phase. Component B is swept away faster.
FIGURE 13.2.10 Cross-section through a GLC column.
Page
Proo
fs

74 AREA OF STUDY 1 | HOW CAN THE DIVERSITY OF CARBON COMPOUNDS BE EXPLAINED AND CATEGORISED?
• High-performance liquid chromatography (HPLC) is a very sensitive technique and is used for qualitative and quantitative analysis.
• In HPLC, the mobile phase is a liquid under pressure.
• In HPLC, retention time is used to identify components in a mixture.
• The concentration of an individual component in a mixture can be determined by comparing its peak area on a chromatogram with the peak areas of samples with known concentrations of the same chemical.
• The peak areas of standard solutions are used to construct a calibration curve, which can be used to determine unknown concentrations.
13.2 ReviewSUMMARY
KEY QUESTIONS
1 A sample containing compounds A, B and C is mixed with ethanol and applied to the top of an HPLC instrument that uses ethanol as the solvent and alumina as the stationary phase. The three compounds have the following properties.• Solubility in ethanol: C is much more soluble than A and B. A and B are
equally soluble.• Adsorption to alumina: B is more strongly absorbed than A. C is least
strongly adsorbed.
Which of the following lists shows the retention times of the components, from lowest to highest?A A, B, CB C, B, AC C, A, BD B, A, C
2 EPO is a protein hormone produced by the kidneys. Although banned, some endurance athletes use it to improve performance because it increases the body’s oxygen-carrying capacity. Athletes are routinely tested for EPO levels by HPLC. The peak areas produced from HPLC analysis of an athlete’s blood and the peak areas of a number of standard solutions of EPO are shown in Table 13.2.2.
TABLE 13.2.2 Peak areas from HPLC analysis of an athlete’s blood and standards
EPO (µg mL–1) Relative EPO peak area
Blood sample ? 5.6
Standard 1 2.0 1.6
Standard 2 4.0 3.2
Standard 3 6.0 4.8
Standard 4 8.0 6.4
a Plot a calibration curve of relative peak area against concentration of EPO (µg mL–1).
b Determine the concentration of EPO in the blood sample correct to one decimal place.
3 Why is it necessary to construct a calibration curve to determine the concentration of a component in a mixture that has been analysed by HPLC?
Page
Proo
fs
75CHAPTER 13 | ANALYSIS OF ORGANIC COMPOUNDS USING CHROMATOGRAPHY
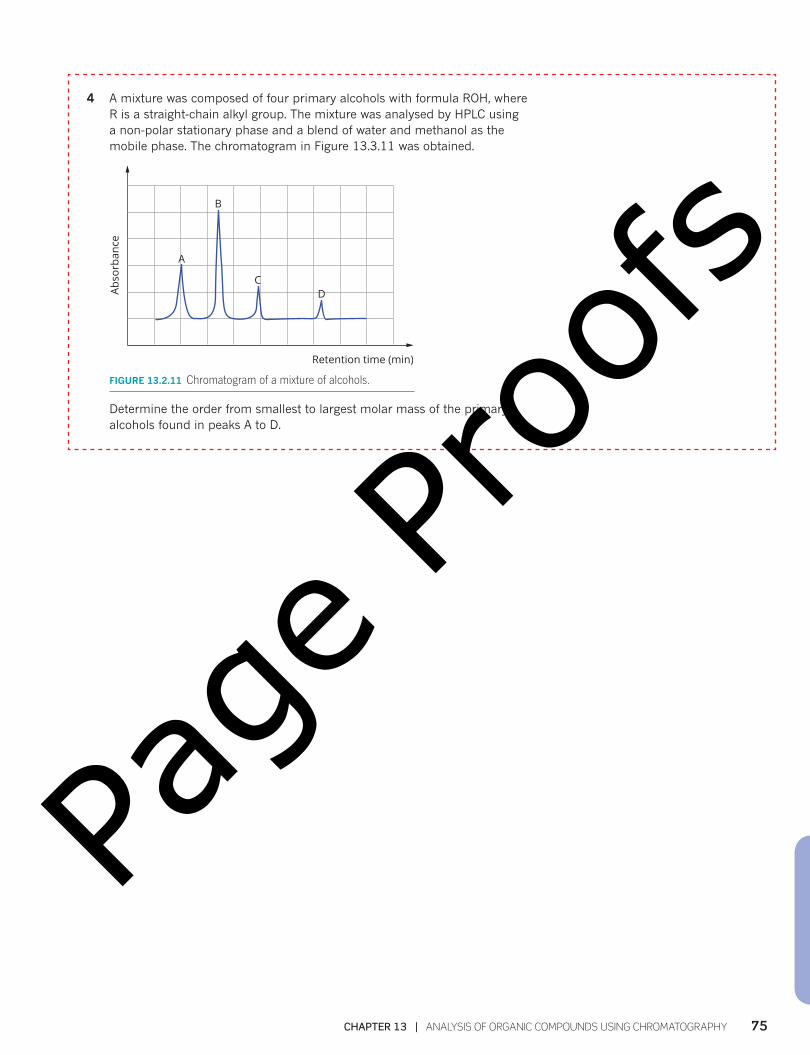
4 A mixture was composed of four primary alcohols with formula ROH, where R is a straight-chain alkyl group. The mixture was analysed by HPLC using a non-polar stationary phase and a blend of water and methanol as the mobile phase. The chromatogram in Figure 13.3.11 was obtained.
Abso
rban
ce
Retention time (min)
A
B
CD
FIGURE 13.2.11 Chromatogram of a mixture of alcohols.
Determine the order from smallest to largest molar mass of the primary alcohols found in peaks A to D.
Page
Proo
fs
76 AREA OF STUDY 1 | HOW CAN THE DIVERSITY OF CARBON COMPOUNDS BE EXPLAINED AND CATEGORISED?
KEY TERMS
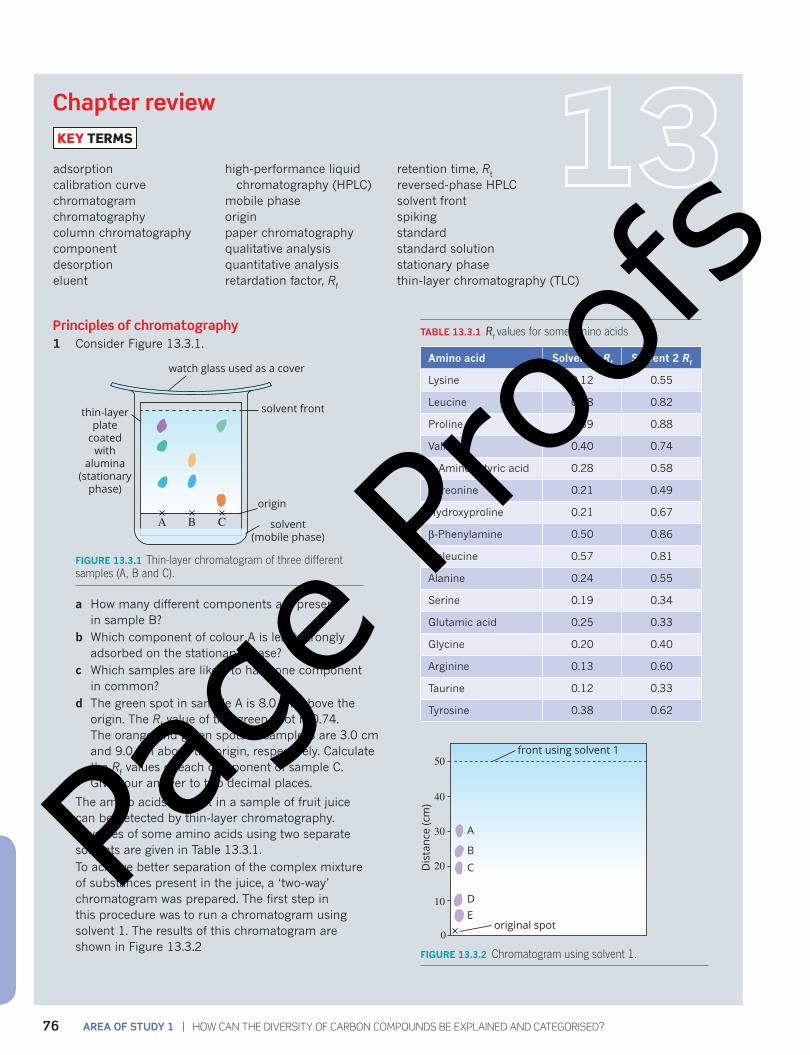
Principles of chromatography1 Consider Figure 13.3.1.
origin
solvent front
solvent(mobile phase)
watch glass used as a cover
thin-layer plate
coatedwith
alumina (stationary
phase)
A B C
FIGURE 13.3.1 Thin-layer chromatogram of three different samples (A, B and C).
a How many different components are present in sample B?
b Which component of colour A is least strongly adsorbed on the stationary phase?
c Which samples are likely to have one component in common?
d The green spot in sample A is 8.0 cm above the origin. The Rf value of this green spot is 0.74. The orange and green spots of sample C are 3.0 cm and 9.0 cm above the origin, respectively. Calculate the Rf values of each component of sample C. Give your answer to two decimal places.
2 The amino acids present in a sample of fruit juice can be detected by thin-layer chromatography. Rf values of some amino acids using two separate solvents are given in Table 13.3.1.To achieve better separation of the complex mixture of substances present in the juice, a ‘two-way’ chromatogram was prepared. The first step in this procedure was to run a chromatogram using solvent 1. The results of this chromatogram are shown in Figure 13.3.2
TABLE 13.3.1 Rf values for some amino acids
Amino acid Solvent 1 Rf Solvent 2 Rf
Lysine 0.12 0.55
Leucine 0.58 0.82
Proline 0.39 0.88
Valine 0.40 0.74
2-Aminobutyric acid 0.28 0.58
Threonine 0.21 0.49
Hydroxyproline 0.21 0.67
β-Phenylamine 0.50 0.86
Isoleucine 0.57 0.81
Alanine 0.24 0.55
Serine 0.19 0.34
Glutamic acid 0.25 0.33
Glycine 0.20 0.40
Arginine 0.13 0.60
Taurine 0.12 0.33
Tyrosine 0.38 0.62
front using solvent 150
40
30
20
10
0original spot
A
BC
DE
Dis
tanc
e (c
m)
FIGURE 13.3.2 Chromatogram using solvent 1.
Chapter review
adsorptioncalibration curvechromatogramchromatographycolumn chromatographycomponentdesorptioneluent
high-performance liquid chromatography (HPLC)
mobile phaseoriginpaper chromatographyqualitative analysisquantitative analysisretardation factor, Rf
retention time, Rt
reversed-phase HPLCsolvent frontspikingstandardstandard solutionstationary phasethin-layer chromatography (TLC)
Page
Proo
fs
77CHAPTER 13 | ANALYSIS OF ORGANIC COMPOUNDS USING CHROMATOGRAPHY
a Calculate the Rf value of each spot on the chromatogram.
b Try to identify the amino acids responsible for each spot. The TLC plate was then turned around so that it lay at a right angle to the original and a second chromatogram was produced using solvent 2. Figure 13.3.3 shows the appearance of the TLC plate after some time.
front using solvent 2
fron
t usi
ng S
olve
nt 1
50
50
40
40
30
30
20
20
10
100
0
original placement of spot
AB
C
D
E
Dis
tanc
e (c
m)
FIGURE 13.3.3 Appearance of the TLC plate after run a second time with solvent 2 at right angles to the original spot.
c Use Table 13.3.1 to identify each component in the mixture.
d What is the advantage of a two-way chromatogram?
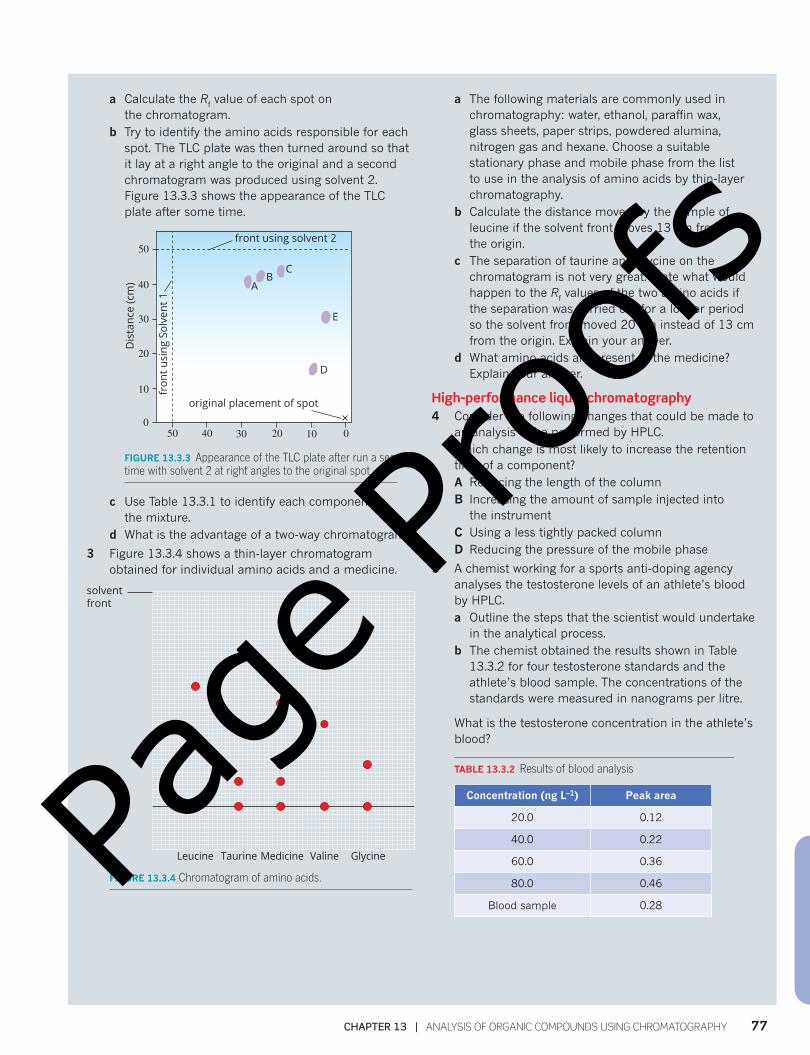
3 Figure 13.3.4 shows a thin-layer chromatogram obtained for individual amino acids and a medicine.
solventfront
Leucine Taurine Medicine Valine Glycine
FIGURE 13.3.4 Chromatogram of amino acids.
a The following materials are commonly used in chromatography: water, ethanol, paraffin wax, glass sheets, paper strips, powdered alumina, nitrogen gas and hexane. Choose a suitable stationary phase and mobile phase from the list to use in the analysis of amino acids by thin-layer chromatography.
b Calculate the distance moved by the sample of leucine if the solvent front moves 13 cm from the origin.
c The separation of taurine and glycine on the chromatogram is not very great. State what would happen to the Rf values of the two amino acids if the separation was carried out for a longer period so the solvent front moved 20 cm instead of 13 cm from the origin. Explain your answer.
d What amino acids are present in the medicine? Explain your answer.
High-performance liquid chromatography4 Consider the following changes that could be made to
an analysis to be performed by HPLC.Which change is most likely to increase the retention time of a component?A Reducing the length of the columnB Increasing the amount of sample injected into
the instrumentC Using a less tightly packed columnD Reducing the pressure of the mobile phase
5 A chemist working for a sports anti-doping agency analyses the testosterone levels of an athlete’s blood by HPLC.a Outline the steps that the scientist would undertake
in the analytical process.b The chemist obtained the results shown in Table
13.3.2 for four testosterone standards and the athlete’s blood sample. The concentrations of the standards were measured in nanograms per litre.
What is the testosterone concentration in the athlete’s blood?
TABLE 13.3.2 Results of blood analysis
Concentration (ng L–1) Peak area
20.0 0.12
40.0 0.22
60.0 0.36
80.0 0.46
Blood sample 0.28Pa
ge Pr
oofs

78 AREA OF STUDY 1 | HOW CAN THE DIVERSITY OF CARBON COMPOUNDS BE EXPLAINED AND CATEGORISED?
6 Reversed-phase HPLC, uses a polar mobile phase and a non-polar stationary phase. A mixture of the amino acid molecules serine, threonine and valine (Figure 13.3.5) was analysed by reversed-phase HPLC. List the amino acids in the order that they would reach the detector.
H3N
H
CH2
OH
C C
O
O–
serine (Ser)
+H3N C
CH3OH
O
O–
threonine (Thr)
+
H
CH
C
H3N
H
CH
C C
CH3CH3
O
O–
valine (Val)
+
FIGURE 13.3.5 Structures of three amino acids.
7 A government department analysed some imported olive oil by HPLC and found that the oil was impure and contained chemicals found only in corn oil. The peak area of one of the corn oil components in the chromatogram of a sample of the impure oil was 15.5 mm2. The peak areas of four standard solutions of the component were also measured (Table 13.3.3).
Calculate the concentration of the corn oil component in the sample.
TABLE 13.3.3 Results of olive oil analysis
Corn oil component standards (%)
Peak area (mm2)
1.0 5.8
2.0 11.6
3.0 17.6
4.0 23.0
8 What are the advantages of HPLC for the analysis of drugs compared to an analysis technique based on column chromatography?
9 Which feature of a chromatogram obtained during a HPLC analysis is:a used to identify the components of a mixture?b least affected by a change in concentration of the
sample components?c used to determine the concentration of each
component in a mixture?
Connecting the main ideas10 Write a definition of each of the following terms:
adsorption, chromatography, desorption, eluent, mobile phase, retention time, stationary phase.
11 A herbal tea extract was analysed by HPLC. The chromatogram obtained is shown in Figure 13.3.6.
0 2 531 4Time (min)
Abso
rban
ce
FIGURE 13.3.6 Chromatogram obtained from a herbal tea extract.
a Explain what information chemists can obtain from this chromatogram.
b How many components are evident?c Briefly explain how the components are separated
by HPLC.
12 Explain why paper or thin-layer chromatography might be used as the initial investigation of a mixture rather than HPLC.
Page
Proo
fs