method 524.2 measurement of purgeable organic compounds in ... - cas lab · 524.2-2 method 524.2...
TRANSCRIPT

524.2-1
METHOD 524.2
MEASUREMENT OF PURGEABLE ORGANIC COMPOUNDS IN WATER BYCAPILLARY COLUMN GAS CHROMATOGRAPHY/MASS SPECTROMETRY
Revision 4.1
Edited by J.W. Munch (1995)
A. Alford-Stevens, J.W. Eichelberger, W.L. Budde - Method 524, Rev. 1.0 (1983)
R.W. Slater, Jr. - Revision 2.0 (1986)
J.W. Eichelberger, and W.L. Budde - Revision 3.0 (1989)
J.W. Eichelberger, J.W. Munch, and T.A. Bellar - Revision 4.0 (1992)
NATIONAL EXPOSURE RESEARCH LABORATORYOFFICE OF RESEARCH AND DEVELOPMENT
U.S. ENVIRONMENTAL PROTECTION AGENCYCINCINNATI, OHIO 45268

524.2-2
METHOD 524.2
MEASUREMENT OF PURGEABLE ORGANIC COMPOUNDS IN WATER BYCAPILLARY COLUMN GAS CHROMATOGRAPHY/MASS SPECTROMETRY
1.0 SCOPE AND APPLICATION
1.1 This is a general purpose method for the identification and simultaneousmeasurement of purgeable volatile organic compounds in surface water,ground water, and drinking water in any stage of treatment . The method is1,2
applicable to a wide range of organic compounds, including the fourtrihalomethane disinfection by-products, that have sufficiently high volatilityand low water solubility to be removed from water samples with purge andtrap procedures. The following compounds can be determined by this method.
Analyte Registry NumberChemical Abstract Services
Acetone* 67-64-1Acrylonitrile* 107-13-1Allyl Chloride* 107-05-1Benzene 71-43-2Bromobenzene 108-86-1Bromochloromethane 74-97-5Bromodichloromethane 75-27-4Bromoform 75-25-2Bromomethane 74-83-92-Butanone* 78-93-3n-Butylbenzene 104-51-8sec-Butylbenzene 135-98-8tert-Butylbenzene 98-06-6Carbon Disulfide* 75-15-0Carbon Tetrachloride 56-23-5Chloroacetonitrile* 107-14-2Chlorobenzene 108-90-71-Chlorobutane* 109-69-3Chloroethane 75-00-3Chloroform 67-66-3Chloromethane 74-87-32-Chlorotoluene 95-49-84-Chlorotoluene 106-43-4Dibromochloromethane 124-48-11,2-Dibromo-3-Chloropropane 96-12-81,2-Dibromoethane 106-93-4Dibromomethane 74-95-31,2-Dichlorobenzene 95-50-1

Analyte Registry NumberChemical Abstract Services
524.2-3
1,3-Dichlorobenzene 541-73-11,4-Dichlorobenzene 106-46-7trans-1,4-Dichloro-2-Butene* 110-57-6Dichlorodifluoromethane 75-71-81,1-Dichloroethane 75-34-31,2-Dichloroethane 107-06-21,1-Dichloroethene 75-35-4cis-1,2-Dichloroethene 156-59-2trans-1,2-Dichloroethene 156-60-51,2-Dichloropropane 78-87-51,3-Dichloropropane 142-28-92,2-Dichloropropane 590-20-71,1-Dichloropropene 563-58-61,1-Dichloropropanone* 513-88-2cis-1,3-Dichloropropene 10061-01-5trans-1,3-Dichloropropene 10061-02-6Diethyl Ether* 60-29-7Ethylbenzene 100-41-4Ethyl Methacrylate* 97-63-2Hexachlorobutadiene 87-68-3Hexachloroethane* 67-72-12-Hexanone* 591-78-6Isopropylbenzene 98-82-84-Isopropyltoluene 99-87-6Methacrylonitrile* 126-98-7Methylacrylate* 96-33-3Methylene Chloride 75-09-2Methyl Iodide* 74-88-4Methylmethacrylate* 80-62-64-Methyl-2-Pentanone* 108-10-1Methyl-t-butyl Ether* 1634-04-4Naphthalene 91-20-3Nitrobenzene* 98-95-32-Nitropropane* 79-46-9Pentachloroethane* 76-01-7Propionitrile* 107-12-0n-Propylbenzene 103-65-1Styrene 100-42-51,1,1,2-Tetrachloroethane 630-20-61,1,2,2-Tetrachloroethane 79-34-5Tetrachloroethene 127-18-4Tetrahydrofuran* 109-99-9Toluene 108-88-31,2,3-Trichlorobenzene 87-61-6

Analyte Registry NumberChemical Abstract Services
524.2-4
1,2,4-Trichlorobenzene 120-82-11,1,1-Trichloroethane 71-55-61,1,2-Trichloroethane 79-00-5Trichloroethene 79-01-6Trichlorofluoromethane 75-69-41,2,3-Trichloropropane 96-18-41,2,4-Trimethylbenzene 95-63-61,3,5-Trimethylbenzene 108-67-8Vinyl Chloride 75-01-4o-Xylene 95-47-6m-Xylene 108-38-3p-Xylene 106-42-3
*New compound in Revision 4.0.
1.2 Method detection limits (MDLs) are compound, instrument and especially3
matrix dependent and vary from approximately 0.02-1.6 µg/L. The applicableconcentration range of this method is primarily column and matrix dependent,and is approximately 0.02-200 µg/L when a wide-bore thick-film capillarycolumn is used. Narrow-bore thin-film columns may have a capacity whichlimits the range to about 0.02-20 µg/L. Volatile water soluble, polarcompounds which have relatively low purging efficiencies can be determinedusing this method. Such compounds may be more susceptible to matrixeffects, and the quality of the data may be adversely influenced.
1.3 Analytes that are not separated chromatographically, but which have differentmass spectra and noninterfering quantitation ions (Table 1), can be identifiedand measured in the same calibration mixture or water sample as long as theirconcentrations are somewhat similar (Section 11.6.2). Analytes that have verysimilar mass spectra cannot be individually identified and measured in thesame calibration mixture or water sample unless they have different retentiontimes (Section 11.6.3). Coeluting compounds with very similar mass spectra,typically many structural isomers, must be reported as an isomeric group orpair. Two of the three isomeric xylenes and two of the three dichlorobenzenesare examples of structural isomers that may not be resolved on the capillarycolumn, and if not, must be reported as isomeric pairs. The more watersoluble compounds (>2% solubility) and compounds with boiling points above200°C are purged from the water matrix with lower efficiencies. Theseanalytes may be more susceptible to matrix effects.
2.0 SUMMARY OF METHOD
2.1 Volatile organic compounds and surrogates with low water solubility areextracted (purged) from the sample matrix by bubbling an inert gas throughthe aqueous sample. Purged sample components are trapped in a tube

524.2-5
containing suitable sorbent materials. When purging is complete, the sorbenttube is heated and backflushed with helium to desorb the trapped samplecomponents into a capillary gas chromatography (GC) column interfaced to amass spectrometer (MS). The column is temperature programmed to facilitatethe separation of the method analytes which are then detected with the MS. Compounds eluting from the GC column are identified by comparing theirmeasured mass spectra and retention times to reference spectra and retentiontimes in a data base. Reference spectra and retention times for analytes areobtained by the measurement of calibration standards under the sameconditions used for samples. Analytes are quantitated using proceduralstandard calibration (Section 3.14). The concentration of each identifiedcomponent is measured by relating the MS response of the quantitation ionproduced by that compound to the MS response of the quantitation ionproduced by a compound that is used as an internal standard. Surrogateanalytes, whose concentrations are known in every sample, are measured withthe same internal standard calibration procedure.
3.0 DEFINITIONS
3.1 Internal Standard (IS) -- A pure analyte(s) added to a sample, extract, orstandard solution in known amount(s) and used to measure the relativeresponses of other method analytes and surrogates that are components of thesame sample or solution. The internal standard must be an analyte that is nota sample component.
3.2 Surrogate Analyte (SA) -- A pure analyte(s), which is extremely unlikely to befound in any sample, and which is added to a sample aliquot in knownamount(s) before extraction or other processing and is measured with the sameprocedures used to measure other sample components. The purpose of the SAis to monitor method performance with each sample.
3.3 Laboratory Duplicates (LD1 and LD2) -- Two aliquots of the same sampletaken in the laboratory and analyzed separately with identical procedures. Analyses of LD1 and LD2 indicates precision associated with laboratoryprocedures, but not with sample collection, preservation, or storageprocedures.
3.4 Field Duplicates (FD1 and FD2) -- Two separate samples collected at the sametime and place under identical circumstances and treated exactly the samethroughout field and laboratory procedures. Analyses of FD1 and FD2 give ameasure of the precision associated with sample collection, preservation andstorage, as well as with laboratory procedures.
3.5 Laboratory Reagent Blank (LRB) -- An aliquot of reagent water or other blankmatrix that is treated exactly as a sample including exposure to all glassware,equipment, solvents, reagents, internal standards, and surrogates that are usedwith other samples. The LRB is used to determine if method analytes or other

524.2-6
interferences are present in the laboratory environment, the reagents, or theapparatus.
3.6 Field Reagent Blank (FRB) -- An aliquot of reagent water or other blank matrixthat is placed in a sample container in the laboratory and treated as a samplein all respects, including shipment to the sampling site, exposure to samplingsite conditions, storage, preservation, and all analytical procedures. Thepurpose of the FRB is to determine if method analytes or other interferencesare present in the field environment.
3.7 Laboratory Performance Check Solution (LPC) -- A solution of one or morecompounds (analytes, surrogates, internal standard, or other test compounds)used to evaluate the performance of the instrument system with respect to adefined set of method criteria.
3.8 Laboratory Fortified Blank (LFB) -- An aliquot of reagent water or other blankmatrix to which known quantities of the method analytes are added in thelaboratory. The LFB is analyzed exactly like a sample, and its purpose is todetermine whether the methodology is in control, and whether the laboratoryis capable of making accurate and precise measurements.
3.9 Laboratory Fortified Sample Matrix (LFM) -- An aliquot of an environmentalsample to which known quantities of the method analytes are added in thelaboratory. The LFM is analyzed exactly like a sample, and its purpose is todetermine whether the sample matrix contributes bias to the analytical results. The background concentrations of the analytes in the sample matrix must bedetermined in a separate aliquot and the measured values in the LFMcorrected for background concentrations.
3.10 Stock Standard Solution -- A concentrated solution containing one or moremethod analytes prepared in the laboratory using assayed reference materialsor purchased from a reputable commercial source.
3.11 Primary Dilution Standard Solution (PDS) -- A solution of several analytesprepared in the laboratory from stock standard solutions and diluted asneeded to prepare calibration solutions and other needed analyte solutions.
3.12 Calibration Standard (CAL) -- A solution prepared from the primary dilutionstandard solution or stock standard solutions and the internal standards andsurrogate analytes. The CAL solutions are used to calibrate the instrumentresponse with respect to analyte concentration.
3.13 Quality Control Sample (QCS) -- A solution of method analytes of knownconcentrations which is used to fortify an aliquot of LRB or sample matrix. The QCS is obtained from a source external to the laboratory and differentfrom the source of calibration standards. It is used to check laboratoryperformance with externally prepared test materials.

524.2-7
3.14 Procedural Standard Calibration -- A calibration method where aqueouscalibration standards are prepared and processed (e.g., purged,extracted,and/or derivatized) in exactly the same manner as a sample. All steps in theprocess from addition of sampling preservatives through instrumental analysesare included in the calibration. Using procedural standard calibrationcompensates for any inefficiencies in the processing procedure.
4.0 INTERFERENCES
4.1 During analysis, major contaminant sources are volatile materials in thelaboratory and impurities in the inert purging gas and in the sorbent trap. Theuse of Teflon tubing, Teflon thread sealants, or flow controllers with rubbercomponents in the purging device should be avoided since such materialsout-gas organic compounds which will be concentrated in the trap during thepurge operation. Analyses of laboratory reagent blanks provide informationabout the presence of contaminants. When potential interfering peaks arenoted in laboratory reagent blanks, the analyst should change the purge gassource and regenerate the molecular sieve purge gas filter. Subtracting blankvalues from sample results is not permitted.
4.2 Interfering contamination may occur when a sample containing low concentrations of volatile organic compounds is analyzed immediately after asample containing relatively high concentrations of volatile organiccompounds. A preventive technique is between-sample rinsing of the purgingapparatus and sample syringes with two portions of reagent water. Afteranalysis of a sample containing high concentrations of volatile organiccompounds, one or more laboratory reagent blanks should be analyzed tocheck for cross-contamination.
4.3 Special precautions must be taken to determine methylene chloride. Theanalytical and sample storage area should be isolated from all atmosphericsources of methylene chloride, otherwise random background levels will result. Since methylene chloride will permeate Teflon tubing, all GC carrier gas linesand purge gas plumbing should be constructed of stainless steel or coppertubing. Laboratory worker's clothing should be cleaned frequently sinceclothing previously exposed to methylene chloride fumes during commonliquid/liquid extraction procedures can contribute to sample contamination.
4.4 Traces of ketones, methylene chloride, and some other organic solvents can bepresent even in the highest purity methanol. This is another potential sourceof contamination, and should be assessed before standards are prepared in themethanol.
5.0 SAFETY
5.1 The toxicity or carcinogenicity of chemicals used in this method has not beenprecisely defined; each chemical should be treated as a potential health hazard,and exposure to these chemicals should be minimized. Each laboratory is

524.2-8
responsible for maintaining awareness of OSHA regulations regarding safehandling of chemicals used in this method. Additional references to laboratorysafety are available for the information of the analyst.4-6
5.2 The following method analytes have been tentatively classified as known orsuspected human or mammalian carcinogens: benzene, carbon tetrachloride,1,4-dichlorobenzene, 1,2-dichlorethane, hexachlorobutadiene,1,1,2,2-tetrachloroethane, 1,1,2-trichloroethane, chloroform,1,2-dibromoethane,tetrachloroethene, trichloroethene, and vinyl chloride. Purestandard materials and stock standard solutions of these compounds should behandled in a hood. A NIOSH/MESA approved toxic gas respirator should beworn when the analyst handles high concentrations of these toxic compounds.
6.0 EQUIPMENT AND SUPPLIES (All specifications are suggested. Catalog numbersare included for illustration only.)
6.1 Sample Containers -- 40-120 mL screw cap vials each equipped with a Teflonfaced silicone septum. Prior to use, wash vials and septa with detergent andrinse with tap and distilled water. Allow the vials and septa to air dry atroom temperature, place in a 105°C oven for one hour, then remove and allowto cool in an area known to be free of organics.
6.2 Purge and Trap System -- The purge and trap system consists of three separatepieces of equipment: purging device, trap, and desorber. Systems arecommercially available from several sources that meet all of the followingspecifications.
6.2.1 The all glass purging device (Figure 1) should be designed to accept25-mL samples with a water column at least 5 cm deep. A smaller(5 mL) purging device is recommended if the GC/MS system hasadequate sensitivity to obtain the method detection limits required. Gaseous volumes above the sample must be kept to a minimum(<15 mL) to eliminate dead volume effects. A glass frit should beinstalled at the base of the sample chamber so the purge gas passesthrough the water column as finely divided bubbles with a diameter of<3 mm at the origin. Needle spargers may be used, however, thepurge gas must be introduced at a point about 5 mm from the base ofthe water column. The use of a moisture control device isrecommended to prohibit much of the trapped water vapor fromentering the GC/MS and eventually causing instrumental problems.
6.2.2 The trap (Figure 2) must be at least 25 cm long and have an insidediameter of at least 0.105 in. Starting from the inlet, the trap shouldcontain 1.0 cm of methyl silicone coated packing and the followingamounts of adsorbents: a of 2,6-diphenylene oxide polymer, a ofsilica gel, and a of coconut charcoal. If it is not necessary to determinedichlorodifluoromethane, the charcoal can be eliminated and thepolymer increased to fill b of the trap. Before initial use, the trap

524.2-9
should be conditioned overnight at 180°C by backflushing with an inertgas flow of at least 20 mL/min. Vent the trap effluent to the room, notto the analytical column. Prior to daily use, the trap should beconditioned for 10 minutes at 180°C with backflushing. The trap maybe vented to the analytical column during daily conditioning; however,the column must be run through the temperature program prior toanalysis of samples. The use of alternative sorbents is acceptableprovided the data acquired meets all quality control criteria describedin Section 9.0, and provided the purge and desorption proceduresspecified in Section 11.0 of the method are not changed. Specifically,the purging time, the purge gas flow rate, and the desorption time maynot be changed. Since many of the potential alternate sorbents may bethermally stable above 180°C, alternate traps may be desorbed andbaked out at higher temperatures than those described in Section 11.0. If higher temperatures are used, the analyst should monitor the data forpossible analyte and/or trap decomposition.
6.2.3 The use of the methyl silicone coated packing is recommended, but notmandatory. The packing serves a dual purpose of protecting the Tenaxadsorbant from aerosols, and also of insuring that the Tenax is fullyenclosed within the heated zone of the trap thus eliminating potentialcold spots. Alternatively, silanized glass wool may be used as a spacerat the trap inlet.
6.2.4 The desorber (Figure 2) must be capable of rapidly heating the trap to180°C either prior to or at the beginning of the flow of desorption gas. The polymer section of the trap should not be heated higher than 200°Cor the life expectancy of the trap will decrease. Trap failure ischaracterized by a pressure drop in excess of 3 lb/in across the trap2
during purging or by poor bromoform sensitivities. The desorberdesign illustrated in Figure 2 meets these criteria.
6.3 Gas Chromatography/Mass Spectrometer/Data System (GC/MS/DS)
6.3.1 The GC must be capable of temperature programming and should beequipped with variable-constant differential flow controllers so that thecolumn flow rate will remain constant throughout desorption andtemperature program operation. If the column oven is to be cooled to10°C or lower, a subambient oven controller will likely be required. Ifsyringe injections of 4-bromofluorobenzene (BFB) will be used, asplit/splitless injection port is required.
6.3.2 Capillary GC Columns -- Any gas chromatography column that meetsthe performance specifications of this method may be used(Section 10.2.4.1). Separations of the calibration mixture must beequivalent or better than those described in this method. Four usefulcolumns have been evaluated, and observed compound retention timesfor these columns are listed in Table 2.

524.2-10
6.3.2.1 Column 1 - 60 m x 0.75 mm ID VOCOL (Supelco, Inc.) glasswide-bore capillary with a 1.5 µm film thickness.
Column 2 - 30 m x 0.53 mm ID DB-624 (J&W Scien-tific, Inc.)fused silica capillary with a 3 µm film thickness.
Column 3 - 30 m x 0.32 mm ID DB-5 (J&W Scientific, Inc.) fusedsilica capillary with a 1 µm film thickness.
Column 4 - 75 m x 0.53 mm id DB-624 (J&W Scien-tific, Inc.)fused silica capillary with a 3 µm film thickness.
6.3.3 Interfaces between the GC and MS -- The interface used depends on thecolumn selected and the gas flow rate.
6.3.3.1 The wide-bore Columns 1, 2, and 4 have the capacity to acceptthe standard gas flows from the trap during thermal desorption,and chromatography can begin with the onset of thermaldesorption. Depending on the pumping capacity of the MS, anadditional interface between the end of the column and the MSmay be required. An open split interface or an all-glass jet7
separator is an acceptable interface. Any interface can be used ifthe performance specifications described in this method(Sections 9.0 and 10.0) can be achieved. The end of the transferline after the interface, or the end of the analytical column if nointerface is used, should be placed within a few mm of the MSion source.
6.3.3.2 When narrow-bore Column 3 is used, a cryogenic interfaceplaced just in front of the column inlet is suggested. Thisinterface condenses the desorbed sample components in anarrow band on an uncoated fused silica precolumn using liquidnitrogen cooling. When all analytes have been desorbed fromthe trap, the interface is rapidly heated to transfer them to theanalytical column. The end of the analytical column should beplaced within a few mm of the MS ion source. A potentialproblem with this interface is blockage of the interface by frozenwater from the trap. This condition will result in a major loss insensitivity and chromatographic resolution.
6.3.4 The mass spectrometer must be capable of electron ionization at anominal electron energy of 70 eV. The spectrometer must be capable ofscanning from 35-260 amu with a complete scan cycle time (includingscan overhead) of two seconds or less. (Scan cycle time = Total MSdata acquisition time in seconds divided by number of scans in thechromatogram.) The spectrometer must produce a mass spectrum thatmeets all criteria in Table 3 when 25 ng or less of4-bromofluorobenzene (BFB) is introduced into the GC. An average
524.2-11
spectrum across the BFB GC peak may be used to test instrumentperformance.
6.3.5 An interfaced data system is required to acquire, store, reduce, andoutput mass spectral data. The computer software should have thecapability of processing stored GC/MS data by recognizing a GC peakwithin any given retention time window, comparing the mass spectrafrom the GC peak with spectral data in a user-created data base, andgenerating a list of tentatively identified compounds with theirretention times and scan numbers. The software must allow integrationof the ion abundance of any specific ion between specified time or scannumber limits. The software should also allow calculation of responsefactors as defined in Section 10.2.6 (or construction of a linear or secondorder regression calibration curve), calculation of response factorstatistics (mean and standard deviation), and calculation ofconcentrations of analytes using either the calibration curve or theequation in Section 12.0.
6.4 Syringe and Syringe Valves
6.4.1 Two 5 mL or 25 mL glass hypodermic syringes with Luer-Lok tip(depending on sample volume used).
6.4.2 Three two-way syringe valves with Luer ends.
6.4.3 Micro Syringes -- 10 µL and 100 µL.
6.4.4 Syringes -- 0.5 mL, 1.0 mL, and 5 mL, gas tight with shut-off valve.
6.5 Miscellaneous
6.5.1 Standard Solution Storage Containers -- 15 mL bottles with Teflon linedscrew caps.
7.0 REAGENTS AND STANDARDS
7.1 Trap Packing Materials
7.1.1 2,6-Diphenylene oxide polymer, 60/80 mesh, chromatographic grade(Tenax GC or equivalent).
7.1.2 Methyl Silicone Packing (Optional) -- OV-1 (3%) on Chromosorb W,60/80 mesh, or equivalent.
7.1.3 Silica Gel -- 35/60 mesh, Davison, Grade 15 or equivalent.
7.1.4 Coconut Charcoal -- Prepare from Barnebey Cheney, CA-580-26 lot#M-2649 (or equivalent) by crushing through 26 mesh screen.

524.2-12
7.2 Reagents
7.2.1 Methanol -- Demonstrated to be free of analytes.
7.2.2 Reagent Water -- Prepare reagent water by passing tap water througha filter bed containing about 0.5 kg of activated carbon, by using awater purification system, or by boiling distilled water for 15 minutesfollowed by a one-hour purge with inert gas while the watertemperature is held at 90°C. Store in clean, narrow-mouth bottles withTeflon lined septa and screw caps.
7.2.3 Hydrochloric acid (1+1) -- Carefully add measured volume of conc. HCl to equal volume of reagent water.
7.2.4 Vinyl Chloride -- Certified mixtures of vinyl chloride in nitrogen andpure vinyl chloride are available from several sources (for example,Matheson, Ideal Gas Products, and Scott Gases).
7.2.5 Ascorbic Acid, ACS Reagent Grade, Granular.
7.2.6 Sodium Thiosulfate, ACS Reagent Grade, Granular.
7.3 Stock Standard Solutions -- These solutions may be purchased as certifiedsolutions or prepared from pure standard materials using the followingprocedures. One of these solutions is required for every analyte of concern,every surrogate, and the internal standard. A useful working concentration isabout 1-5 mg/mL.
7.3.1 Place about 9.8 mL of methanol into a 10 mL ground-glass stopperedvolumetric flask. Allow the flask to stand, unstoppered, for about10 minutes or until all alcohol-wetted surfaces have dried and weigh tothe nearest 0.1 mg.
7.3.2 If the analyte is a liquid at room temperature, use a 100 µL syringe andimmediately add two or more drops of reference standard to the flask. Be sure that the reference standard falls directly into the alcoholwithout contacting the neck of the flask. If the analyte is a gas at roomtemperature, fill a 5 mL valved gas-tight syringe with the standard tothe 5.0 mL mark, lower the needle to 5 mm above the methanolmeniscus, and slowly inject the standard into the neck area of the flask. The gas will rapidly dissolve in the methanol.
7.3.3 Reweigh, dilute to volume, stopper, then mix by inverting the flaskseveral times. Calculate the concentration in µg/µL from the net gainin weight. When compound purity is certified at 96% or greater, theweight can be used without correction to calculate the concentration ofthe stock standard.
524.2-13
7.3.4 Store stock standard solutions in 15 mL bottles equipped with Teflonlined screw caps. Methanol solutions of acrylonitrile, methyl iodide,and methyl acrylate are stable for only one week at 4°C. Methanolsolutions prepared from other liquid analytes are stable for at least fourweeks when stored at 4°C. Methanol solutions prepared from gaseousanalytes are not stable for more than 1 week when stored at <0°C; atroom temperature, they must be discarded after one day.
7.4 Primary Dilution Standards (PDS) -- Use stock standard solutions to prepareprimary dilution standard solutions that contain all the analytes of concern inmethanol or other suitable solvent. The primary dilution standards should beprepared at concentrations that can be easily diluted to prepare aqueouscalibration solutions that will bracket the working concentration range. Storethe primary dilution standard solutions with minimal headspace and checkfrequently for signs of deterioration or evaporation, especially just beforepreparing calibration solutions. Storage times described for stock standardsolutions in Section 7.3.4 also apply to primary dilution standard solutions.
7.5 Fortification Solutions for Internal Standard and Surrogates
7.5.1 A solution containing the internal standard and the surrogatecompounds is required to prepare laboratory reagent blanks (also usedas a laboratory performance check solution), and to fortify each sample. Prepare a fortification solution containing fluorobenzene (internalstandard), 1,2-dichlorobenzene-d (surrogate), and BFB (surrogate) in4
methanol at concentrations of 5 µg/mL of each (any appropriateconcentration is acceptable). A 5 µL aliquot of this solution added to a25 mL water sample volume gives concentrations of 1 µg/L of each. A5 µL aliquot of this solution added to a 5 mL water sample volumegives a concentration of 5 µg/L of each. Additional internal standardsand surrogate analytes are optional. Additional surrogate compoundsshould be similar in physical and chemical characteristics to theanalytes of concern.
7.6 Preparation of Laboratory Reagent Blank (LRB) -- Fill a 25 mL (or 5 mL)syringe with reagent water and adjust to the mark (no air bubbles). Inject anappropriate volume of the fortification solution containing the internalstandard and surrogates through the Luer Lok valve into the reagent water. Transfer the LRB to the purging device. See Section 11.1.2.
7.7 Preparation of Laboratory Fortified Blank -- Prepare this exactly like acalibration standard (Section 7.8). This is a calibration standard that is treatedas a sample.

524.2-14
7.8 Preparation of Calibration Standards (CAL)
7.8.1 The number of CALs needed depends on the calibration range desired. A minimum of three CAL solutions is required to calibrate a range of afactor of 20 in concentration. For a factor of 50, use at least fourstandards, and for a factor of 100 at least five standards. Onecalibration standard should contain each analyte of concern at aconcentration of two to 10 times the method detection limit (Tables 4, 5,and 7) for that compound. The other CAL standards should containeach analyte of concern at concentrations that define the range of themethod. Every CAL solution contains the internal standard and thesurrogate compounds at the same concentration (5 µg/L suggested fora 5 mL sample; 1 µg/L for a 25 mL sample).
7.8.2 To prepare a calibration standard, add an appropriate volume of aprimary dilution standard containing all analytes of concern to analiquot of acidified (pH 2) reagent water in a volumetric flask. Alsoadd an appropriate volume of internal standard and surrogatecompound solution from Section 7.5.1. Use a microsyringe and rapidlyinject the methanol solutions into the expanded area of the filledvolumetric flask. Remove the needle as quickly as possible afterinjection. Mix by inverting the flask three times only. Discard thecontents contained in the neck of the flask. Aqueous standards are notstable in a volumetric flask and should be discarded after one hourunless transferred to a sample bottle and sealed immediately. Alternately, aqueous calibration standards may be prepared in a gastight, 5 mL or 25 mL syringe.
Note: If unacidified samples are being analyzed for THMs only,calibration standards should be prepared without acid.
8.0 SAMPLE COLLECTION, PRESERVATION, AND STORAGE
8.1 Sample Collection and Dechlorination
8.1.1 Collect all samples in duplicate. If samples, such as finished drinkingwater, are suspected to contain residual chlorine, add about 25 mg ofascorbic acid per 40 mL of sample to the sample bottle before filling. Ifanalytes that are gases at room temperature (such as vinyl chloride), oranalytes in Table 7 are not to be determined, sodium thiosulfate isrecommended to reduce the residual chlorine. Three milligrams ofsodium thiosulfate should be added for each 40 mL of water sample.
Note: If the residual chlorine is likely to be present >5 mg/L, adetermination of the amount of the chlorine may be necessary. Diethyl-p-phenylenediamine (DPD) test kits are commercially available todetermine residual chlorine in the field. Add an additional 25 mg of

524.2-15
ascorbic acid or 3 mg of sodium thiosulfate per each 5 mg/L of residualchlorine.
8.1.2 When sampling from a water tap, open the tap and allow the system toflush until the water temperature has stabilized (usually about10 minutes). Adjust the flow to about 500 mL/min. and collect dupli-cate samples containing the desired dechlorinating agent from theflowing stream.
8.1.3 When sampling from an open body of water, partially fill a 1 qwide-mouth bottle or 1 L beaker with sample from a representativearea. Fill duplicate sample bottles containing the desired dechlorinatingagent with sample from the larger container.
8.1.4 Fill sample bottles to overflowing, but take care not to flush out therapidly dissolving dechlorinating agent. No air bubbles should passthrough the sample as the bottle is filled, or be trapped in the samplewhen the bottle is sealed.
8.2 Sample Preservation
8.2.1 Adjust the pH of all samples to <2 at the time of collection, but afterdechlorination, by carefully adding two drops of 1:1 HCl for each40 mL of sample. Seal the sample bottles, Teflon face down, and mixfor one minute. Exceptions to the acidification requirement are detailedin Sections 8.2.2 and 8.2.3.
Note: Do not mix the ascorbic acid or sodium thiosulfate with the HClin the sample bottle prior to sampling.
8.2.2 When sampling for THM analysis only, acidification may be omitted ifsodium thiosulfate is used to dechlorinate the sample. This exceptionto acidification does not apply if ascorbic acid is used for dechlorina-tion.
8.2.3 If a sample foams vigorously when HCl is added, discard that sample. Collect a set of duplicate samples but do not acidify them. Thesesamples must be flagged as "not acidified" and must be stored at 4°C orbelow. These samples must be analyzed within 24 hours of collectiontime if they are to be analyzed for any compounds other than THMs.
8.2.4 The samples must be chilled to about 4°C when collected and main-tained at that temperature until analysis. Field samples that will not bereceived at the laboratory on the day of collection must be packaged forshipment with sufficient ice to ensure that they will arrive at thelaboratory with a substantial amount of ice remaining in the cooler.
8.2 Sample Storage

524.2-16
8.2.1 Store samples at ≤4°C until analysis. The sample storage area must befree of organic solvent vapors and direct or intense light.
8.2.2 Analyze all samples within 14 days of collection. Samples not analyzedwithin this period must be discarded and replaced.
8.3 Field Reagent Blanks (FRB)
8.3.1 Duplicate FRBs must be handled along with each sample set, which iscomposed of the samples collected from the same general sample site atapproximately the same time. At the laboratory, fill field blank samplebottles with reagent water and sample preservatives, seal, and ship tothe sampling site along with empty sample bottles and back to thelaboratory with filled sample bottles. Wherever a set of samples isshipped and stored, it is accompanied by appropriate blanks. FRBsmust remain hermetically sealed until analysis.
8.3.2 Use the same procedures used for samples to add ascorbic acid andHCl to blanks (Section 8.1.1). The same batch of ascorbic acid and HClshould be used for the field reagent blanks as for the field samples.
9.0 QUALITY CONTROL
9.1 Quality control (QC) requirements are the initial demonstration of laboratorycapability followed by regular analyses of laboratory reagent blanks, fieldreagent blanks, and laboratory fortified blanks. A MDL for each analyte mustalso be determined. Each laboratory must maintain records to document thequality of the data generated. Additional quality control practices are recom-mended.
9.2 Initial demonstration of low system background. Before any samples areanalyzed, it must be demonstrated that a laboratory reagent blank (LRB) isreasonably free of contamination that would prevent the determination of anyanalyte of concern. Sources of background contamination are glassware, purgegas, sorbents, reagent water, and equipment. Background contamination mustbe reduced to an acceptable level before proceeding with the next section. Ingeneral, background from method analytes should be below the methoddetection limit.
9.3 Initial demonstration of laboratory accuracy and precision. Analyze four toseven replicates of a laboratory fortified blank containing each analyte ofconcern at a concentration in the range of 2-5 µg/L depending upon thecalibration range of the instrumentation.
9.3.1 Prepare each replicate by adding an appropriate aliquot of a quality
control sample to reagent water. It is recommended that a QCS from asource different than the calibration standards be used for this set ofLFBs, since it will serve as a check to verify the accuracy of the stan-dards used to generate the calibration curve. This is particularly useful

524.2-17
if the laboratory is using the method for the first time, and has nohistorical data base for standards. Prepare each replicate by adding anappropriate aliquot of a quality control sample to reagent water. Alsoadd the appropriate amounts of internal standard and surrogates. If itis expected that field samples will contain a dechlorinating agent andHCl, then add these to the LFBs in the same amounts proscribed inSection 8.1.1. If only THMs are to be determined and field samples donot contain HCl, then do not acidify LFBs. Analyze each replicateaccording to the procedures described in Section 11.0.
9.3.2 Calculate the measured concentration of each analyte in each replicate,the mean concentration of each analyte in all replicates, and meanaccuracy (as mean percentage of true value) for each analyte, and theprecision (as relative standard deviation, RSD) of the measurements foreach analyte.
9.3.3 Some analytes, particularly early eluting gases and late eluting highermolecular weight compounds, will be measured with less accuracy andprecision than other analytes. However, the accuracy and precision forall analytes must fall within the limits expressed below. If these criteriaare not met for an analyte of interest, take remedial action and repeatthe measurements for that analyte until satisfactory performance isachieved. For each analyte, the mean accuracy must be 80-120% (i.e.,an accuracy of ±20%). The precision of the recovery (accuracy) for eachanalyte must be <20%. These criteria are different than the ±30%response factor criteria specified in Section 10.3.5. The criteria differ,because the measurements in Section 9.3.3 as part of the initial demon-stration of capability are meant to be more stringent than the continu-ing calibration measurements in Section 10.3.5.
9.3.4 To determine the MDL, analyze a minimum of seven LFBs prepared ata low concentration. MDLs in Table 5 were calculated from samplesfortified from 0.1-0.5 µg/L, which can be used as a guide, or usecalibration data to estimate a concentration for each analyte that willyield a peak with a three to five signal to noise response. Analyze theseven replicates as described in Section 11.0, and on a schedule thatresults in the analyses being conducted over several days. Calculatethe mean accuracy and standard deviation for each analyte. Calculatethe MDL using the equation in Section 13.0.
9.3.5 Develop and maintain a system of control charts to plot the precisionand accuracy of analyte and surrogate measurements as a function oftime. Charting surrogate recoveries is an especially valuable activitybecause surrogates are present in every sample and the analyticalresults will form a significant record of data quality.
9.4 Monitor the integrated areas of the quantitation ions of the internal standardsand surrogates (Table 1) in all samples, continuing calibration checks, and

524.2-18
blanks. These should remain reasonably constant over time. An abruptchange may indicate a matrix effect or an instrument problem. If a cryogenicinterface is utilized, it may indicate an inefficient transfer from the trap to thecolumn. These samples must be reanalyzed or a laboratory fortified duplicatesample analyzed to test for matrix effect. A more gradual drift of more than50% in any area is indicative of a loss in sensitivity, and the problem must befound and corrected.
9.5 Laboratory Reagent Blanks (LRB) -- With each batch of samples processed as agroup within a work shift, analyze a LRB to determine the background systemcontamination.
9.6 Assessing Laboratory Performance -- Use the procedures and criteria inSections 10.3.4 and 10.3.5 to evaluate the accuracy of the measurement of thelaboratory fortified blank (LFB), which must be analyzed with each batch ofsamples that is processed as a group within a work shift. If more than 20samples are in a work shift batch, analyze one LFB per 20 samples. Preparethe LFB with the concentration of each analyte that was used in theSection 9.3.3 analysis. If the acceptable accuracy for this measurement (±30%)is not achieved, the problem must be solved before additional samples may bereliably analyzed. Acceptance criteria for the IS and surrogate given inSection 10.3.4 also applies to this LFB.
Since the calibration check sample in Section 10.3.5 and the LFB are made thesame way and since procedural standards are used, the sample analyzed heremay also be used as a calibration check in Section 10.3.5. Add the results ofthe LFB analysis to the control charts to document data quality.
9.7 If a water sample is contaminated with an analyte, verify that it is not asampling error by analyzing a field reagent blank. The results of theseanalyses will help define contamination resulting from field sampling, storageand transportation activities. If the field reagent blank shows unacceptablecontamination, the analyst should identify and eliminate the contamination.
9.8 At least quarterly, replicate LFB data should be evaluated to determine theprecision of the laboratory measurements. Add these results to the ongoingcontrol charts to document data quality.
9.9 At least quarterly, analyze a quality control sample (QCS) from an externalsource. If measured analyte concentrations are not of acceptable accuracy,check the entire analytical procedure to locate and correct the problem source.
9.10 Sample matrix effects have not been observed when this method is used withdistilled water, reagent water, drinking water, or ground water. Therefore,analysis of a laboratory fortified sample matrix (LFM) is not required unlessthe criteria in Section 9.4 are not met. If matrix effects are observed orsuspected to be causing low recoveries, analyze a laboratory fortified matrix

524.2-19
sample for that matrix. The sample results should be flagged and the LFMresults should be reported with them.
9.11 Numerous other quality control measures are incorporated into other parts ofthis procedure, and serve to alert the analyst to potential problems.
10.0 CALIBRATION AND STANDARDIZATION
10.1 Demonstration and documentation of acceptable initial calibration is requiredbefore any samples are analyzed. In addition, acceptable performance must beconfirmed intermittently throughout analysis of samples by performingcontinuing calibration checks. These checks are required at the beginning ofeach work shift, but no less than every 12 hours. Additional periodiccalibration checks are good laboratory practice. It is highly recommended thatan additional calibration check be performed at the end of any cycle ofcontinuous instrument operation, so that each set of field samples is bracketedby calibration check standards.
Note: Since this method uses procedural standards, the analysis of thelaboratory fortified blank, which is required in Sect. 9.6, may be used here as acalibration check sample.
10.2 Initial Calibration
10.2.1 Calibrate the mass and abundance scales of the MS with calibrationcompounds and procedures prescribed by the manufacturer with anymodifications necessary to meet the requirements in Section 10.2.2.
10.2.2 Introduce into the GC (either by purging a laboratory reagent blank ormaking a syringe injection) 25 ng or less of BFB and acquire massspectra for m/z 35-260 at 70 eV (nominal). Use the purging procedureand/or GC conditions given in Section 11.0. If the spectrum does notmeet all criteria in Table 3, the MS must be returned and adjusted tomeet all criteria before proceeding with calibration. An averagespectrum across the GC peak may be used to evaluate the performanceof the system.
10.2.3 Purge a medium CAL solution, (e.g., 10-20 µg/L) using the proceduregiven in Section 11.0.
10.2.4 Performance criteria for calibration standards. Examine the storedGC/MS data with the data system software. Figures 3 and 4 shownacceptable total ion chromatograms.
10.2.4.1 GC performance -- Good column performance willproduce symmetrical peaks with minimum tailing formost compounds. If peaks are unusually broad, or ifthere is poor resolution between peaks, the wrong

524.2-20
column has been selected or remedial action is probablynecessary (Section 10.3.6).
10.2.4.2 MS sensitivity -- The GC/MS/DS peak identificationsoftware should be able to recognize a GC peak in theappropriate retention time window for each of thecompounds in calibration solution, and make correcttentative identifications. If fewer than 99% of thecompounds are recognized, system maintenance isrequired. See Section 10.3.6.
10.2.5 If all performance criteria are met, purge an aliquot of each of the otherCAL solutions using the same GC/MS conditions.
10.2.6 Calculate a response factor (RF) for each analyte and isomer pair foreach CAL solution using the internal standard fluorobenzene. Table 1contains suggested quantitation ions for all compounds. Thiscalculation is supported in acceptable GC/MS data system software(Section 6.3.5), and many other software programs. RF is a unitlessnumber, but units used to express quantities of analyte and internalstandard must be equivalent.
where: A = integrated abundance of the quantitation ion of the analytex
A = integrated abundance of the quantitation ion of the internalis
standardQ = quantity of analyte purged in nanograms or concentrationx
unitsQ = quantity of internal standard purged in ng or concentrationis
units
10.2.6.1 For each analyte and surrogate, calculate the mean RFfrom analyses of CAL solutions. Calculate the standarddeviation (SD) and the relative standard deviation (RSD)from each mean: RSD = 100 (SD/M). If the RSD of anyanalyte or surrogate mean RF exceeds 20%, eitheranalyze additional aliquots of appropriate CAL solutionsto obtain an acceptable RSD of RFs over the entireconcentration range, or take action to improve GC/MSperformance Section 10.3.6). Surrogate compounds arepresent at the same concentration on every sample,calibration standard, and all types of blanks.
10.2.7 As an alternative to calculating mean response factors and applying theRSD test, use the GC/MS data system software or other available

524.2-21
software to generate a linear or second order regression calibrationcurve, by plotting A /A vs. Q .x is x
10.3 Continuing Calibration Check -- Verify the MS tune and initial calibration atthe beginning of each 12-hour work shift during which analyses are performedusing the following procedure. Additional periodic calibration checks are goodlaboratory practice. It is highly recommended that an additional calibrationcheck be performed at the end of any cycle of continuous instrumentoperation, so that each set of field samples is bracketed by calibration checkstandards.
10.3.1 Introduce into the GC (either by purging a laboratory reagent blank ormaking a syringe injection) 25 ng or less of BFB and acquire a massspectrum that includes data for m/z 35-260. If the spectrum does notmeet all criteria (Table 3), the MS must be returned and adjusted tomeet all criteria before proceeding with the continuing calibrationcheck.
10.3.2 Purge a CAL solution and analyze with the same conditions usedduring the initial calibration. Selection of the concentration level of thecalibration check standard should be varied so that the calibration isverified at more than one point over the course of several days.
10.3.3 Demonstrate acceptable performance for the criteria shown inSection 10.2.4.
10.3.4 Determine that the absolute areas of the quantitation ions of theinternal standard and surrogates have not decreased by more than 30%from the areas measured in the most recent continuing calibrationcheck, or by more than 50% from the areas measured during initialcalibration. If these areas have decreased by more than these amounts,adjustments must be made to restore system sensitivity. Theseadjustments may require cleaning of the MS ion source, or othermaintenance as indicated in Section 10.3.6, and recalibration. Controlcharts are useful aids in documenting system sensitivity changes.
10.3.5 Calculate the RF for each analyte of concern and surrogate compoundfrom the data measured in the continuing calibration check. The RF foreach analyte and surrogate must be within 30% of the mean valuemeasured in the initial calibration. Alternatively, if a linear or secondorder regression is used, the concentration measured using thecalibration curve must be within 30% of the true value of theconcentration in the calibration solution. If these conditions do notexist, remedial action must be taken which may require recalibration. All data from field samples obtained after the last successful calibrationcheck standard, should be considered suspect. After remedial actionhas been taken, duplicate samples should be analyzed if they areavailable.

524.2-22
10.3.6 Some possible remedial actions. Major maintenance such as cleaning anion source, cleaning quadrupole rods, etc. require returning to theinitial calibration step.
10.3.6.1 Check and adjust GC and/or MS operating conditions;check the MS resolution, and calibrate the mass scale.
10.3.6.2 Clean or replace the splitless injection liner; silanize anew injection liner. This applies only if the injection lineris an integral part of the system.
10.3.6.3 Flush the GC column with solvent according tomanufacturer's instructions.
10.3.6.4 Break off a short portion (about 1 meter) of the columnfrom the end near the injector; or replace GC column. This action will cause a slight change in retention times. Analyst may need to redefine retention windows.
10.3.6.5 Prepare fresh CAL solutions, and repeat the initialcalibration step.
10.3.6.6 Clean the MS ion source and rods (if a quadrupole).
10.3.6.7 Replace any components that allow analytes to come intocontact with hot metal surfaces.
10.3.6.8 Replace the MS electron multiplier, or any other faultycomponents.
10.3.6.9 Replace the trap, especially when only a few compoundsfail the criteria in Section 10.3.5 while the majority aredetermined successfully. Also check for gas leaks in thepurge and trap unit as well as the rest of the analyticalsystem.
10.4 Optional calibration for vinyl chloride using a certified gaseous mixture ofvinyl chloride in nitrogen can be accomplished by the following steps.
10.4.1 Fill the purging device with 25.0 mL (or 5 mL) of reagent water oraqueous calibration standard.
10.4.2 Start to purge the aqueous mixture. Inject a known volume (between100 µL and 2000 µL) of the calibration gas (at room temperature)directly into the purging device with a gas tight syringe. Slowly injectthe gaseous sample through a septum seal at the top of the purgingdevice at 2000 µL/min. If the injection of the standard is made throughthe aqueous sample inlet port, flush the dead volume with several mL
524.2-23
of room air or carrier gas. Inject the gaseous standard beforefive minutes of the 11-minute purge time have elapsed.
10.4.3 Determine the aqueous equivalent concentration of vinyl chloridestandard, in µg/L, injected with the equation:
S = 0.102 (C) (V)
where S = Aqueous equivalent concentration of vinyl chloride standard in µg/LC = Concentration of gaseous standard in mg/L (v/v)V = Volume of standard injected in mL
11.0 PROCEDURE
11.1 Sample Introduction and Purging
11.1.1 This method is designed for a 25 mL or 5 mL sample volume, but asmaller (5 mL) sample volume is recommended if the GC/MS systemhas adequate sensitivity to achieve the required method detectionlimits. Adjust the helium purge gas flow rate to 40 mL/min. Attachthe trap inlet to the purging device and open the syringe valve on thepurging device.
11.1.2 Remove the plungers from two 25 mL (or 5 mL depending on samplesize) syringes and attach a closed syringe valve to each. Warm thesample to room temperature, open the sample bottle, and carefullypour the sample into one of the syringe barrels to just short ofoverflowing. Replace the syringe plunger, invert the syringe, andcompress the sample. Open the syringe valve and vent any residual airwhile adjusting the sample volume to 25 mL (or 5 mL). To all samples,blanks, and calibration standards, add 5 µL (or an appropriate volume)of the fortification solution containing the internal standard and thesurrogates to the sample through the syringe valve. Close the valve. Fill the second syringe in an identical manner from the same samplebottle. Reserve this second syringe for a reanalysis if necessary.
11.1.3 Attach the sample syringe valve to the syringe valve on the purgingdevice. Be sure that the trap is cooler than 25°C, then open the samplesyringe valve and inject the sample into the purging chamber. Closeboth valves and initiate purging. Purge the sample for 11 minutes atambient temperature.
11.1.4 Standards and samples must be analyzed in exactly the same manner. Room temperature must be reasonably constant, and changes in excessof 10°F will adversely affect the accuracy and precision of the method.

524.2-24
11.2 Sample Desorption
11.2.1 Non-Cryogenic Interface -- After the 11-minute purge, place the purgeand trap system in the desorb mode and preheat the trap to 180°Cwithout a flow of desorption gas. Then simultaneously start the flowof desorption gas at a flow rate suitable for the column being used(optimum desorb flow rate is 15 mL/min.) for about four minutes,begin the GC temperature program, and start data acquisition.
11.2.2 Cryogenic Interface -- After the 11-minute purge, place the purge andtrap system in the desorb mode, make sure the cryogenic interface is a-150°C or lower, and rapidly heat the trap to 180°C while backflushingwith an inert gas at 4 mL/min. for about five minutes. At the end ofthe five minutes desorption cycle, rapidly heat the cryogenic trap to250°C, and simultaneously begin the temperature program of the gaschromatograph, and start data acquisition.
11.2.3 While the trapped components are being introduced into the gaschromatograph (or cryogenic interface), empty the purging device usingthe sample syringe and wash the chamber with two 25 mL flushes ofreagent water. After the purging device has been emptied, leavesyringe valve open to allow the purge gas to vent through the sampleintroduction needle.
11.3 Gas Chromatography/mass Spectrometry -- Acquire and store data over thenominal mass range 35-260 with a total cycle time (including scan overheadtime) of two seconds or less. If water, methanol, or carbon dioxide cause abackground problem, start at 47 or 48 m/z. If ketones are to be determined,data must be acquired starting at m/z 43. Cycle time must be adjusted tomeasure five or more spectra during the elution of each GC peak. Suggestedtemperature programs are provided below. Alternative temperature programscan be used.
11.3.1 Single ramp linear temperature program for wide-bore Columns 1 and2 with a jet separator. Adjust the helium carrier gas flow rate to withinthe capacity of the separator, or about 15 mL/min. The columntemperature is reduced 10°C and held for five minutes from thebeginning of desorption, then programmed to 160°C at 6°C/min., andheld until all components have eluted.
11.3.2 Multi-ramp temperature program for wide-bore Column 2 with theopen split interface. Adjust the helium carrier gas flow rate to about4.6 mL/min. The column temperature is reduced to 10°C and held forsix minutes from the beginning of desorption, then heated to 70°C at10°/min., heated to 120°C at 5°/min., heated to 180° at 8°/min., andheld at 180° until all compounds have eluted.

524.2-25
11.3.3 Single ramp linear temperature program for narrow-bore Column 3with a cryogenic interface. Adjust the helium carrier gas flow rate toabout 4 mL/min. The column temperature is reduced to 10°C and heldfor five minutes from the beginning of vaporization from the cryogenictrap, programmed at 6°/min. for 10 minutes, then 15°/min. for fiveminutes to 145°C, and held until all components have eluted.
11.3.4 Multi-ramp temperature program for wide-bore Column 4 with theopen split interface. Adjust the helium carrier gas flow rate to about7.0 mL/min. The column temperature is -10°C and held for sixminutes. from beginning of desorption, then heated to 100°C at10°C/min., heated to 200°C at 5°C/min. and held at 200°C for eightminutes or until all compounds of interest had eluted.
11.4 Trap Reconditioning -- After desorbing the sample for four minutes,recondition the trap by returning the purge and trap system to the purgemode. Wait 15 seconds, then close the syringe valve on the purging device tobegin gas flow through the trap. Maintain the trap temperature at 180°C. Maintain the moisture control module, if utilized, at 90°C to remove residualwater. After approximately seven minutes, turn off the trap heater and openthe syringe valve to stop the gas flow through the trap. When the trap is cool,the next sample can be analyzed.
11.5 Termination of Data Acquisition -- When all the sample components haveeluted from the GC, terminate MS data acquisition. Use appropriate dataoutput software to display full range mass spectra and appropriate plots of ionabundance as a function of time. If any ion abundance exceeds the systemworking range, dilute the sample aliquot in the second syringe with reagentwater and analyze the diluted aliquot.
11.6 Identification of Analytes -- Identify a sample component by comparison of itsmass spectrum (after background subtraction) to a reference spectrum in theuser-created data base. The GC retention time of the sample componentshould be within three standard deviations of the mean retention time of thecompound in the calibration mixture.
11.6.1 In general, all ions that are present above 10% relative abundance in themass spectrum of the standard should be present in the mass spectrumof the sample component and should agree within absolute 20%. Forexample, if an ion has a relative abundance of 30% in the standardspectrum, its abundance in the sample spectrum should be in the rangeof 10-50%. Some ions, particularly the molecular ion, are of specialimportance, and should be evaluated even if they are below 10%relative abundance.
11.6.2 Identification requires expert judgment when sample components arenot resolved chromatographically and produce mass spectra containingions contributed by more than one analyte. When GC peaks obviously

524.2-26
represent more than one sample component (i.e., broadened peak withshoulder(s) or valley between two or more maxima), appropriateanalyte spectra and background spectra can be selected by examiningplots of characteristic ions for tentatively identified components. Whenanalytes coelute (i.e., only one GC peak is apparent), the identificationcriteria can be met but each analyte spectrum will contain extraneousions contributed by the coeluting compound. Because purgeableorganic compounds are relatively small molecules and producecomparatively simple mass spectra, this is not a significant problem formost method analytes.
11.6.3 Structural isomers that produce very similar mass spectra can beexplicitly identified only if they have sufficiently different GC retentiontimes. Acceptable resolution is achieved if the height of the valleybetween two peaks is less than 25% of the average height of the twopeaks. Otherwise, structural isomers are identified as isomeric pairs. Two of the three isomeric xylenes and two of the threedichlorobenzenes are examples of structural isomers that may not beresolved on the capillary columns. If unresolved, these groups ofisomers must be reported as isomeric pairs.
11.6.4 Methylene chloride, acetone, carbon disulfide, and other backgroundcomponents appear in variable quantities in laboratory and field re-agent blanks, and generally cannot be accurately measured. Subtractionof the concentration in the blank from the concentration in the sampleis not acceptable because the concentration of the background in theblank is highly variable.
12.0 DATA ANALYSIS AND CALCULATIONS
12.1 Complete chromatographic resolution is not necessary for accurate and precisemeasurements of analyte concentrations if unique ions with adequate intensi-ties are available for quantitation. If the response for any analyte exceeds thelinear range of the calibration established in Section 10.0, obtain and dilute aduplicate a duplicate sample. Do not extrapolate beyond the calibration range.
12.1.1 Calculate analyte and surrogate concentrations, using the multi-pointcalibration established in Section 10.0. Do not use the daily calibrationverification data to quantitate analytes in samples.

524.2-27
where: C = concentration of analyte or surrogate in µg/L in the waterx
sampleA = integrated abundance of the quantitation ion of the analytex
in the sampleA = integrated abundance of the quantitation ion of the internalis
standard in the sampleQ = total quantity (in micrograms) of internal standard addedis
to the water sampleV = original water sample volume in mLRF = mean response factor of analyte from the initial calibration
12.1.2 Alternatively, use the GC/MS system software or other availableproven software to compute the concentrations of the analytes andsurrogates from the linear or second order regression curve establishedin Section 10.0. Do not use the daily calibration verification data toquantitate analytes in samples.
12.1.3 Calculations should utilize all available digits of precision, but finalreported concentrations should be rounded to an appropriate numberof significant figures (one digit of uncertainty). Experience indicatesthat three significant figures may be used for concentrations above99 µg/L, two significant figures for concentrations between 1-99 µg/L,and one significant figure for lower concentrations.
12.1.4 Calculate the total trihalomethane concentration by summing the fourindividual trihalomethane concentrations.
13.0 METHOD PERFORMANCE
13.1 Single laboratory accuracy and precision data were obtained for the methodanalytes using laboratory fortified blanks with analytes at concentrationsbetween 0.1 and 5 µg/L. Results were obtained using the four columnsspecified (Section 6.3.2.1) and the open split or jet separator (Section 6.3.3.1), orthe cryogenic interface (Sect. 6.3.3.2). These data are shown in Tables 4-8.
13.2 With these data, method detection limits were calculated using the formula :3
where: t = Student's t value for the 99% confidence level with(n-1,1-alpha = 0.99)
n-1 degrees of freedomn = number of replicates

524.2-28
S = the standard deviation of the replicate analyses
14.0 POLLUTION PREVENTION
14.1 No solvents are utilized in this method except the extremely small volumes ofmethanol needed to make calibration standards. The only other chemicalsused in this method are the neat materials in preparing standards and samplepreservatives. All are used in extremely small amounts and pose no threat tothe environment.
15.0 WASTE MANAGEMENT
15.1 There are no waste management issues involved with this method. Due to thenature of this method, the discarded samples are chemically less contaminatedthan when they were collected.
16.0 REFERENCES
1. J.W. Munch, J.W. Eichelberger. "Evaluation of 48 Compounds for PossibleInclusion in USEPA Method 524.2, Revision 3.0: Expansion of the MethodAnalyte List to a Total of 83 Compounds", J. Chro. Sci. ,30, 471,1992.
2. C. Madding. "Volatile Organic Compounds in Water by Purge and TrapCapillary Column GC/MS", Proceedings of the Water Quality TechnologyConference, American Water Works Association, Denver, CO, December 1984.
3. J.A. Glaser, D.L. Foerst, G.D. McKee, S.A. Quave, and W.L. Budde. "TraceAnalyses for Wastewaters", Environ. Sci. Technol., 15, 1426, 1981.
4. "Carcinogens-Working with Carcinogens", Department of Health, Education,and Welfare, Public Health Service, Center for Disease Control, NationalInstitute for Occupational Safety and Health, Publication No. 77-206,August 1977.
5. "OSHA Safety and Health Standards, General Industry", (29CFR1910),Occupational Safety and Health Administration, OSHA 2206, (Revised,January 1976).
6. "Safety in Academic Chemistry Laboratories", American Chemical Society Publication, Committee on Chemical Safety, 3rd Edition, 1979.
7. R.F. Arrendale, R.F. Severson, and O.T. Chortyk. "Open Split Interface forCapillary Gas Chromatography/Mass Spectrometry", Anal. Chem. 1984, 56,1533.
8. J.J. Flesch, P.S. Fair. "The Analysis of Cyanogen Chloride in Drinking Water",Proceedings of Water Quality Technology Conference, American Water WorksAssociation, St. Louis, MO., November 14-16, 1988.

524.2-29
17.0 TABLES, DIAGRAMS, FLOWCHARTS, AND VALIDATION DATA
TABLE 1. MOLECULAR WEIGHTS AND QUANTITATION IONS FORMETHOD ANALYTES
Compound MW Ion Ionsa
Primary SecondaryQuantitation Quantitation
Internal Standard
Fluorobenzene 96 96 77
Surrogates
4-Bromofluorobenzene 174 95 174, 1761,2-Dichlorobenzene-d4 150 152 115, 150
Target Analytes
Acetone 58 43 58Acrylonitrile 53 52 53Allyl Chloride 76 76 49Benzene 78 78 77Bromobenzene 156 156 77, 158Bromochloromethane 128 128 49, 130Bromodichloromethane 162 83 85, 127Bromoform 250 173 175, 252Bromomethane 94 94 962-Butanone 72 43 57, 72n-Butylbenzene 134 91 134sec-Butylbenzene 134 105 134tert-Butylbenzene 134 119 91Caron Disulfide 76 76 – –Carbon Tetrachloride 152 117 119Chloroacetonitrile 75 48 75Chlorobenzene 112 112 77, 1141-Chlorobutane 92 56 49Chloroethane 64 64 66Chloroform 118 83 85Chloromethane 50 50 522-Chlorotoluene 126 91 1264-Chlorotoluene 126 91 126Dibromochloromethane 206 129 1271,2-Dibromo-3-Chloropropane 234 75 155, 1571,2-Dibromoethane 186 107 109, 188Dibromomethane 172 93 95, 1741,2-Dichlorobenzene 146 146 111, 148

TABLE 1. MOLECULAR WEIGHTS AND QUANTITATION IONS FORMETHOD ANALYTES
Compound MW Ion Ionsa
Primary SecondaryQuantitation Quantitation
524.2-30
1,3-Dichlorobenzene 146 146 111, 1481,4-Dichlorobenzene 146 146 111, 148trans-1,4-Dichloro-2-Butene 124 53 88, 75Dichlorodifluoromethane 120 85 871,1-Dichloroethane 98 63 65, 831,2-Dichloroethane 98 62 981,1-Dichloroethene 96 96 61, 63cis-1,2-Dichloroethene 96 96 61, 98trans-1,2-Dichloroethene 96 96 61, 981,2-Dichloropropane 112 63 1121,3-Dichloropropane 112 76 782,2-Dichloropropane 112 77 971,1-Dichloropropene 110 75 110, 771,1-Dichloropropanone* 126 43 83cis-1,3-Dichloropropene 110 75 110trans-1,3-Dichloropropene 110 75 110Diethyl Ether 74 59 45, 73Ethylbenzene 106 91 106Ethyl Methacrylate 114 69 99Hexachlorobutadiene 258 225 260Hexachloroethane 234 117 119, 2012-Hexanone 100 43 58Isopropylbenzene 120 105 1204-Isopropyltoluene 134 119 134, 91Methacrylonitrile 67 67 52Methyl Acrylate 86 55 85Methylene Chloride 84 84 86, 49Methyl Iodide 142 142 127Methylmethacrylate 100 69 994-Methyl-2-Pentanone 100 43 58, 85Methyl-t-butyl Ether 88 73 57Naphthalene 128 128 – –Nitrobenzene 123 51 772-Nitropropane 89 46 – –Pentachloroethane 200 117 119, 167Propionitrile 55 54 – –n-Propylbenzene 120 91 120Styrene 104 104 781,1,1,2-Tetrachloroethane 166 131 133, 1191,1,2,2-Tetrachloroethane 166 83 131, 85Tetrachloroethene 164 166 168, 129

TABLE 1. MOLECULAR WEIGHTS AND QUANTITATION IONS FORMETHOD ANALYTES
Compound MW Ion Ionsa
Primary SecondaryQuantitation Quantitation
524.2-31
Tetrahydrofuran 72 71 72, 42Toluene 92 92 911,2,3-Trichlorobenzene 180 180 1821,2,4-Trichlorobenzene 180 180 1821,1,1-Trichloroethane 132 97 99, 611,1,2-Trichloroethane 132 83 97, 85Trichloroethene 130 95 130, 132Trichlorofluoromethane 136 101 1031,2,3-Trichloropropane 146 75 771,2,4-Trimethylbenzene 120 105 1201,3,5-Trimethylbenzene 120 105 120Vinyl Chloride 62 62 64o-Xylene 106 106 91m-Xylene 106 106 91p-Xylene 106 106 91
Monoisotopic molecular weight calculated from the atomic masses of the isotopesa
with the smallest masses.

524.2-32
TABLE 2. CHROMATOGRAPHIC RETENTION TIMES FOR METHODANALYTES ON THREE COLUMNS WITH FOUR SET OF CONDITIONSa
Compound 1 Col. 2 Col. 2 Col. 3 Col. 4Col. Retention Time (min:sec)
b b c d e
Internal Standard
Fluorobenzene 8:49 6:27 14:06 8:03 22:00
Surrogates
4-Bromofluorobenzene 18:38 15:43 23:38 31:211,2-Dichlorobenzene-d4 22:16 19:08 27:25 35:51
Target Analytes
Acetone 16:14Acrylonitrile 17:49Allyl Chloride 16:58Benzene 8:14 5:40 13:30 7:25 21:32Bromobenzene 18:57 15:52 24:00 16:25 31:52Bromochloromethane 6:44 4:23 12:22 5:38 20:20Bromodichloromethane 10:35 8:29 15:48 9:20 23:36Bromoform 17:56 14:53 22:46 15:42 30:32Bromomethane 2:01 0:58 4:48 1:17 12:262-Butanone 19:41n-Butylbenzene 22:13 19:29 27:32 17:57 35:41sec-Butylbenzene 20:47 18:05 26:08 17:28 34:04tert-Butylbenzene 20:17 17:34 25:36 17:19 33:26Caron Disulfide 16:30Carbon Tetrachloride 7:37 5:16 13:10 7:25 21:11Chloroacetonitrile 23:51Chlorobenzene 15:46 13:01 20:40 14:20 28:261-Chlorobutane 21:00Chloroethane 2:05 1:01 1:27Chloroform 6:24 4:48 12:36 5:33 20:27Chloromethane 1:38 0:44 3:24 0:58 9:112-Chlorotoluene 19:20 16:25 24:32 16:44 32:214-Chlorotoluene 19:30 16:43 24:46 16:49 32:38Cyanogen Chloride 1:038
Dibromochloromethane 14:23 11:51 19:12 12:48 26:571,2-Dibromo-3-Chloropropane 24:32 21:05 18:02 38:201,2-Dibromoethane 14:44 11:50 19:24 13:36 27:19Dibromomethane 10:39 7:56 15:26 9:05 23:221,2-Dichlorobenzene 22:31 19:10 27:26 17:47 35:55

TABLE 2. CHROMATOGRAPHIC RETENTION TIMES FOR METHODANALYTES ON THREE COLUMNS WITH FOUR SET OF CONDITIONSa
Compound 1 Col. 2 Col. 2 Col. 3 Col. 4Col. Retention Time (min:sec)
b b c d e
524.2-33
1,3-Dichlorobenzene 21:13 18:08 26:22 17:28 34:311,4-Dichlorobenzene 21:33 18:23 26:36 17:38 34:45trans-1,4-Dichloro-2-Butene 31:44Dichlorodifluoromethane 1:33 0:42 3:08 0:53 7:161,1-Dichloroethane 4:51 2:56 10:48 4:02 18:461,2-Dichloroethane 8:24 5:50 13:38 7:00 21:311,1-Dichloroethene 2:53 1:34 7:50 2:20 16:01cis-1,2-Dichloroethene 6:11 3:54 11:56 5:04 19:53trans-1,2-Dichloroethene 3:59 2:22 9:54 3:32 17:541,2-Dichloropropane 10:05 7:40 15:12 8:56 23:081,3-Dichloropropane 14:02 11:19 18:42 12:29 26:232,2-Dichloropropane 6:01 3:48 11:52 5:19 19:541,1-Dichloropropanone 24:521,1-Dichloropropene 7:49 5:17 13:06 7:10 21:08cis-1,3-Dichloropropene 11:58 16:42 24:24trans-1,3-Dichloropropene 13:46 17:54 25:33Diethyl Ether 15:31Ethylbenzene 15:59 13:23 21:00 14:44 28:37Ethyl Methacrylate 25:35Hexachlorobutadiene 26:59 23:41 32:04 19:14 42:03Hexachloroethane 36:45Hexanone 26:23Isopropylbenzene 18:04 15:28 23:18 16:25 30:524-Isopropyltoluene 21:12 18:31 26:30 17:38 34:27Methacrylonitrile 20:15Methyl Acrylate 20:02Methylene Chloride 3:36 2:04 9:16 2:40 17:18Methyl Iodide 16:21Methylmethacrylate 23:084-Methyl-2-Pentanone 24:38Methyl-t-butyl Ether 17:56Naphthalene 27:10 23:31 32:12 19:04 42:29Nitrobenzene 39:022-Nitropropane 23:58Pentachloroethane 33:33Propionitrile 19:58n-Propylbenzene 19:04 16:25 24:20 16:49 32:00Styrene 17:19 14:36 22:24 15:47 29:571,1,1,2-Tetrachloroethane 15:56 13:20 20:52 14:44 28:351,1,2,2-Tetrachloroethane 18:43 16:21 24:04 15:47 31:35Tetrachloroethene 13:44 11:09 18:36 13:12 26:27

TABLE 2. CHROMATOGRAPHIC RETENTION TIMES FOR METHODANALYTES ON THREE COLUMNS WITH FOUR SET OF CONDITIONSa
Compound 1 Col. 2 Col. 2 Col. 3 Col. 4Col. Retention Time (min:sec)
b b c d e
524.2-34
Tetrahydrofuran 20:26Toluene 12:26 10:00 17:24 11:31 25:131,2,3-Trichlorobenzene 27:47 24:11 32:58 19:14 43:311,2,4-Trichlorobenzene 26:33 23:05 31:30 18:50 41:261,1,1-Trichloroethane 7:16 4:50 12:50 6:46 20:511,1,2-Trichloroethane 13:25 11:03 18:18 11:59 25:59Trichloroethene 9:35 7:16 14:48 9:01 22:42Trichlorofluoromethane 2:16 1:11 6:12 1:46 14:181,2,3-Trichloropropane 19:01 16:14 24:08 16:16 31:471,2,4-Trimethylbenzene 20:20 17:42 31:30 17:19 33:331,3,5-Trimethylbenzene 19:28 16:54 24:50 16:59 32:26Vinyl Chloride 1:43 0:47 3:56 1:02 10:22o-Xylene 17:07 14:31 22:16 15:47 29:56m-Xylene 16:10 13:41 21:22 15:18 28:53p-Xylene 16:07 13:41 21:18 15:18 28:53
Columns 1-4 are those given in Sectioin 6.3.2.1; retention times were measured froma
the beginning of thermal desorption from the trap (Columns 1-2, and 4) or from thebeginning of thermal release from the cryogenic interface (Column 3).GC conditions given in Section 11.3.1.b
GC conditions given in Section 11.3.2.c
GC conditions given in Section 11.3.3.d
GC conditions given in Section 11.3.4.e
TABLE 3. ION ABUNDANCE CRITERIA FOR 4-BROMOFLUOROBENZENE(BFB)
Mass(M/z) Relative Abundance Criteria
50 15-40% of Mass 9575 30-80% of Mass 9595 Base Peak, 100% Relative Abundance96 5-9% of Mass 95
173 <2% of Mass 174174 >50% of Mass 95175 5-9% of Mass 174176 >95% but <101% of Mass 174177 5-9% of Mass 176

524.2-35
TABLE 4. ACCURACY AND PRECISION DATA FROM 16-31DETERMINATIONS OF THE METHOD ANALYTES IN REAGENT WATER
USING WIDE-BORE CAPILLARY COLUMN 1a
Compound (µg/L) Value) (%) (µg/L)
True Mean Rel. MethodConc. Accuracy Std. Det.Range (% of True Dev. Limitb
Benzene 0.1-10 97 5.7 0.04Bromobenzene 0.1-10 100 5.5 0.03Bromochloromethane 0.5-10 90 6.4 0.04Bromodichloromethane 0.1-10 95 6.1 0.08Bromoform 0.5-10 101 6.3 0.12Bromomethane 0.5-10 95 8.2 0.11n-Butylbenzene 0.5-10 100 7.6 0.11sec-Butylbenzene 0.5-10 100 7.6 0.13tert-Butylbenzene 0.5-10 102 7.3 0.14Carbon Tetrachloride 0.5-10 84 8.8 0.21Chlorobenzene 0.1-10 98 5.9 0.04Chloroethane 0.5-10 89 9.0 0.10Chloroform 0.5-10 90 6.1 0.03Chloromethane 0.5-10 93 8.9 0.132-Chlorotoluene 0.1-10 90 6.2 0.044-Chlorotoluene 0.1-10 99 8.3 0.06Dibromochloromethane 0.1-10 92 7.0 0.051,2-Dibromo-3-Chloropropane 0.5-10 83 19.9 0.261,2-Dibromoethane 0.5-10 102 3.9 0.06Dibromomethane 0.5-10 100 5.6 0.241,2-Dichlorobenzene 0.1-10 93 6.2 0.031,3-Dichlorobenzene 0.5-10 99 6.9 0.121,4-Dichlorobenzene 0.2-20 103 6.4 0.03Dichlorodifluoromethane 0.5-10 90 7.7 0.101,1-Dichloroethane 0.5-10 96 5.3 0.041,2-Dichloroethane 0.1-10 95 5.4 0.061,1-Dichloroethene 0.1-10 94 6.7 0.12cis-1,2-Dichloroethene 0.5-10 101 6.7 0.12trans-1,2-Dichloroethene 0.1-10 93 5.6 0.061,2-Dichloropropane 0.1-10 97 6.1 0.041,3-Dichloropropane 0.1-10 96 6.0 0.042,2-Dichloropropane 0.5-10 86 16.9 0.351,1-Dichloropropene 0.5-10 98 8.9 0.10cis-1,2-Dichloropropenetrans-1,2-DichloropropeneEthylbenzene 0.1-10 99 8.6 0.06Hexachlorobutadiene 0.5-10 100 6.8 0.11Isopropylbenzene 0.5-10 101 7.6 0.154-Isopropyltoluene 0.1-10 99 6.7 0.12

TABLE 4. ACCURACY AND PRECISION DATA FROM 16-31DETERMINATIONS OF THE METHOD ANALYTES IN REAGENT WATER
USING WIDE-BORE CAPILLARY COLUMN 1a
Compound (µg/L) Value) (%) (µg/L)
True Mean Rel. MethodConc. Accuracy Std. Det.Range (% of True Dev. Limitb
524.2-36
Methylene Chloride 0.1-10 95 5.3 0.03Naphthalene 0.1-100 104 8.2 0.04n-Propylbenzene 0.1-10 100 5.8 0.04Styrene 0.1-100 102 7.2 0.041,1,1,2-Tetrachloroethane 0.5-10 90 6.8 0.051,1,2,2-Tetrachloroethane 0.1-10 91 6.3 0.04Tetrachloroethene 0.5-10 89 6.8 0.14Toluene 0.5-10 102 8.0 0.111,2,3-Trichlorobenzene 0.5-10 109 8.6 0.031,2,4-Trichlorobenzene 0.5-10 108 8.3 0.041,1,1-Trichloroethane 0.5-10 98 8.1 0.081,1,2-Trichloroethane 0.5-10 104 7.3 0.10Trichloroethene 0.5-10 90 7.3 0.19Trichlorofluoromethane 0.5-10 89 8.1 0.081,2,3-Trichloropropane 0.5-10 108 14.4 0.321,2,4-Trimethylbenzene 0.5-10 99 8.1 0.131,3,5-Trimethylbenzene 0.5-10 92 7.4 0.05Vinyl Chloride 0.5-10 98 6.7 0.17o-Xylene 0.1-31 103 7.2 0.11m-Xylene 0.1-10 97 6.5 0.05p-Xylene 0.5-10 104 7.7 0.13
Data obtained by using Column 1 with a jet separator interface and a quadrupolea
mass spectrometer (Section 11.3.1) with analytes divided among three solutions.Replicate samples at the lowest concentration listed in Column 2 of this table wereb
analyzed. These results were used to calculate MDLs.

524.2-37
TABLE 5. ACCURACY AND PRECISION DATA FROM SEVENDETERMINATIONS OF THE METHOD ANALYTES IN REAGENT WATERUSING THE CRYOGENIC TRAPPING OPTION AND A NARROW-BORE
CAPILLARY COLUMN 3a
Compound (µg/L) Value) (%) (µg/L)
True Accuracy Std. Det.Conc. (% of True Dev. Limit
Mean Rel. Method
Benzene 0.1 99 6.2 0.03Bromobenzene 0.5 97 7.4 0.11Bromochloromethane 0.5 97 5.8 0.07Bromodichloromethane 0.1 100 4.6 0.03Bromoform 0.1 99 5.4 0.20Bromomethane 0.1 99 7.1 0.06n-Butylbenzene 0.5 94 6.0 0.03sec-Butylbenzene 0.5 90 7.1 0.12tert-Butylbenzene 0.5 90 2.5 0.33Carbon Tetrachloride 0.1 92 6.8 0.08Chlorobenzene 0.1 91 5.8 0.03Chloroethane 0.1 100 5.8 0.02Chloroform 0.1 95 3.2 0.02Chloromethane 0.1 99 4.7 0.052-Chlorotoluene 0.1 99 4.6 0.054-Chlorotoluene 0.1 96 7.0 0.05Cyanogen Chloride 92 10.6 0.30b
Dibromochloromethane 0.1 99 5.6 0.071,2-Dibromo-3-Chloropropane 0.1 92 10.0 0.051,2-Dibromoethane 0.1 97 5.6 0.02Dibromomethane 0.1 93 6.9 0.031,2-Dichlorobenzene 0.1 97 3.5 0.051,3-Dichlorobenzene 0.1 99 6.0 0.051,4-Dichlorobenzene 0.1 93 5.7 0.04Dichlorodifluoromethane 0.1 99 8.8 0.111,1-Dichloroethane 0.1 98 6.2 0.031,2-Dichloroethane 0.1 100 6.3 0.021,1-Dichloroethene 0.1 95 9.0 0.05cis-1,2-Dichloroethene 0.1 100 3.7 0.06trans-1,2-Dichloroethene 0.1 98 7.2 0.031,2-Dichloropropane 0.1 96 6.0 0.021,3-Dichloropropane 0.1 99 5.8 0.042,2-Dichloropropane 0.1 99 4.9 0.051,1-Dichloropropene 0.1 98 7.4 0.02cis-1,2-Dichloropropenetrans-1,2-DichloropropeneEthylbenzene 0.1 99 5.2 0.03Hexachlorobutadiene 0.1 100 6.7 0.04

TABLE 5. ACCURACY AND PRECISION DATA FROM SEVENDETERMINATIONS OF THE METHOD ANALYTES IN REAGENT WATERUSING THE CRYOGENIC TRAPPING OPTION AND A NARROW-BORE
CAPILLARY COLUMN 3a
Compound (µg/L) Value) (%) (µg/L)
True Accuracy Std. Det.Conc. (% of True Dev. Limit
Mean Rel. Method
524.2-38
Isopropylbenzene 0.5 98 6.4 0.104-Isopropyltoluene 0.5 87 13.0 0.26Methylene Chloride 0.5 97 13.0 0.09Naphthalene 0.1 98 7.2 0.04n-Propylbenzene 0.1 99 6.6 0.06Styrene 0.1 96 19.0 0.061,1,1,2-Tetrachloroethane 0.1 100 4.7 0.041,1,2,2-Tetrachloroethane 0.1 100 12.0 0.20Tetrachloroethene 0.1 96 5.0 0.05Toluene 0.1 100 5.9 0.081,2,3-Trichlorobenzene 0.1 98 8.9 0.041,2,4-Trichlorobenzene 0.1 91 16.0 0.201,1,1-Trichloroethane 0.1 100 4.0 0.041,1,2-Trichloroethane 0.1 98 4.9 0.03Trichloroethene 0.1 96 2.0 0.02Trichlorofluoromethane 0.1 97 4.6 0.071,2,3-Trichloropropane 0.1 96 6.5 0.031,2,4-Trimethylbenzene 0.1 96 6.5 0.041,3,5-Trimethylbenzene 0.1 99 4.2 0.02Vinyl Chloride 0.1 96 0.2 0.04o-Xylene 0.1 94 7.5 0.06m-Xylene 0.1 94 4.6 0.03p-Xylene 0.1 97 6.1 0.06
Data obtained by using Column 3 with a cryogenic interface and a quadrupole massa
spectrometer (Section 11.3.3).Reference 8.b
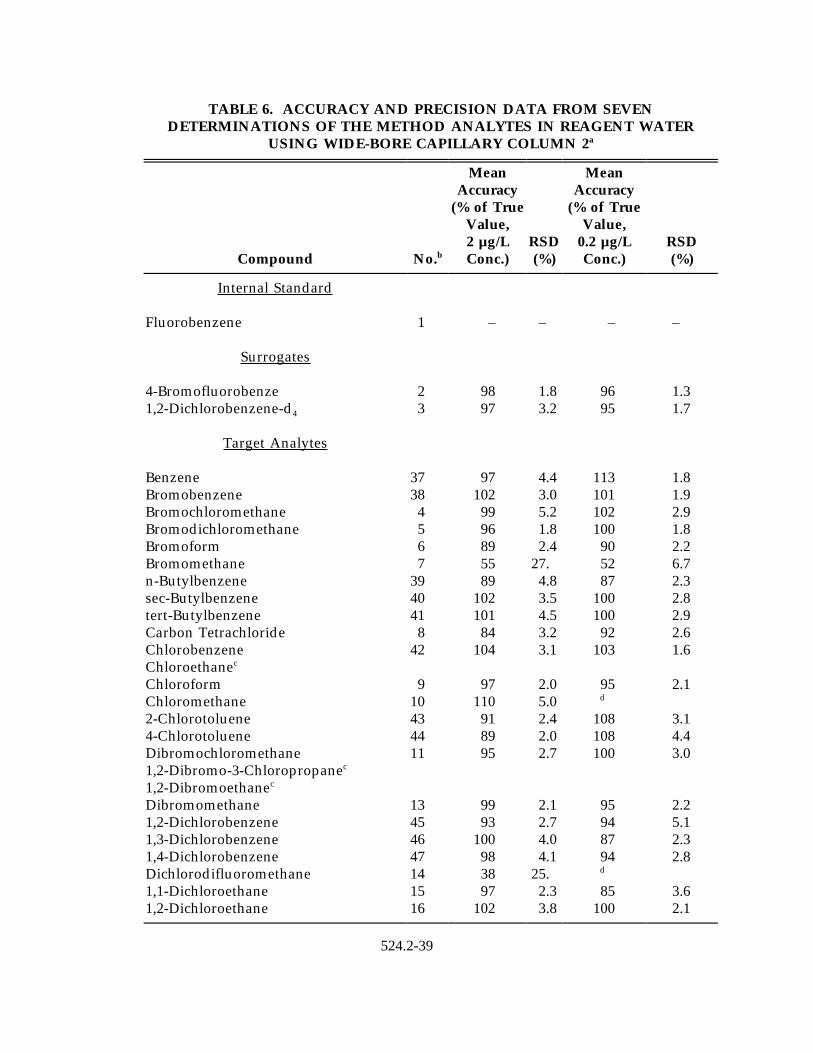
524.2-39
TABLE 6. ACCURACY AND PRECISION DATA FROM SEVENDETERMINATIONS OF THE METHOD ANALYTES IN REAGENT WATER
USING WIDE-BORE CAPILLARY COLUMN 2a
Compound No. Conc.) (%) Conc.) (%)b
Mean MeanAccuracy Accuracy
(% of True (% of TrueValue, Value,2 µg/L RSD 0.2 µg/L RSD
Internal Standard
Fluorobenzene 1 – – – –
Surrogates
4-Bromofluorobenze 2 98 1.8 96 1.31,2-Dichlorobenzene-d 3 97 3.2 95 1.74
Target Analytes
Benzene 37 97 4.4 113 1.8Bromobenzene 38 102 3.0 101 1.9Bromochloromethane 4 99 5.2 102 2.9Bromodichloromethane 5 96 1.8 100 1.8Bromoform 6 89 2.4 90 2.2Bromomethane 7 55 27. 52 6.7n-Butylbenzene 39 89 4.8 87 2.3sec-Butylbenzene 40 102 3.5 100 2.8tert-Butylbenzene 41 101 4.5 100 2.9Carbon Tetrachloride 8 84 3.2 92 2.6Chlorobenzene 42 104 3.1 103 1.6Chloroethanec
Chloroform 9 97 2.0 95 2.1Chloromethane 10 110 5.0 2-Chlorotoluene 43 91 2.4 108 3.14-Chlorotoluene 44 89 2.0 108 4.4Dibromochloromethane 11 95 2.7 100 3.01,2-Dibromo-3-Chloropropanec
1,2-Dibromoethanec
Dibromomethane 13 99 2.1 95 2.21,2-Dichlorobenzene 45 93 2.7 94 5.11,3-Dichlorobenzene 46 100 4.0 87 2.31,4-Dichlorobenzene 47 98 4.1 94 2.8Dichlorodifluoromethane 14 38 25. 1,1-Dichloroethane 15 97 2.3 85 3.61,2-Dichloroethane 16 102 3.8 100 2.1
d
d

TABLE 6. ACCURACY AND PRECISION DATA FROM SEVENDETERMINATIONS OF THE METHOD ANALYTES IN REAGENT WATER
USING WIDE-BORE CAPILLARY COLUMN 2a
Compound No. Conc.) (%) Conc.) (%)b
Mean MeanAccuracy Accuracy
(% of True (% of TrueValue, Value,2 µg/L RSD 0.2 µg/L RSD
524.2-40
1,1-Dichloroethene 17 90 2.2 87 3.8cis-1,2-Dichloroethene 18 100 3.4 89 2.9trans-1,2-Dichloroethene 19 92 2.1 85 2.31,2-Dichloropropane 20 102 2.2 103 2.91,3-Dichloropropane 21 92 3.7 93 3.22,2-Dichloropropanec
1,1-Dichloropropenec
cis-1,2-Dichloropropenec
trans-1,2-Dichloropropene 25 96 1.7 99 2.1Ethylbenzene 48 96 9.1 100 4.0Hexachlorobutadiene 26 91 5.3 88 2.4Isopropylbenzene 49 103 3.2 101 2.14-Isopropyltoluene 50 95 3.6 95 3.1Methylene Chloride 27 Naphthalene 51 93 7.6 78 8.3n-Propylbenzene 52 102 4.9 97 2.1Styrene 53 95 4.4 104 3.11,1,1,2-Tetrachloroethane 28 99 2.7 95 3.81,1,2,2-Tetrachloroethane 29 101 4.6 84 3.6Tetrachloroethene 30 97 4.5 92 3.3Toluene 54 105 2.8 126 1.71,2,3-Trichlorobenzene 55 90 5.7 78 2.91,2,4-Trichlorobenzene 56 92 5.2 83 5.91,1,1-Trichloroethane 31 94 3.9 94 2.51,1,2-Trichloroethane 32 107 3.4 109 2.8Trichloroethene 33 99 2.9 106 2.5Trichlorofluoromethane 34 81 4.6 48 13.1,2,3-Trichloropropane 35 97 3.9 91 2.81,2,4-Trimethylbenzene 57 93 3.1 106 2.21,3,5-Trimethylbenzene 58 88 2.4 97 3.2Vinyl Chloride 36 104 3.5 115 14.
e e

TABLE 6. ACCURACY AND PRECISION DATA FROM SEVENDETERMINATIONS OF THE METHOD ANALYTES IN REAGENT WATER
USING WIDE-BORE CAPILLARY COLUMN 2a
Compound No. Conc.) (%) Conc.) (%)b
Mean MeanAccuracy Accuracy
(% of True (% of TrueValue, Value,2 µg/L RSD 0.2 µg/L RSD
524.2-41
o-Xylene 59 97 1.8 98 1.7m-Xylene 60 p-Xylene 61 98 2.3 103 1.4
f f
Data obtained using Column 2 with the open split interface and an ion trap massa
spectrometer (Section 11.3.2) with all method analytes in the same reagent watersolution.Designation in Figures 1 and 2.b
Not measured; authentic standards were not available.c
Not found at 0.2 µg/L.d
Not measured; methylene chloride was in the laboratory reagent blank.e
m-xylene coelutes with and cannot be distinguished from its isomer p-xylene, No 61.f

524.2-42
TABLE 7. ACCURACY AND PRECISION DATA FROM SEVENDETERMINATIONS OF METHOD ANALYTES IN REAGENT WATER USING
WIDE-BORE CAPILLARY COLUMN 4a
Compound (µg/L) (µg/L) (%) (µg/L)
True Conc. Std. Detect.Conc. Detected Dev. Limit
Mean Rel. Method
Acetone 1.0 1.6 5.7 0.28Acrylonitrile 1.0 0.81 8.7 0.22Allyl Chloride 1.0 0.90 4.7 0.132-Butanone 2.0 2.7 5.6 0.48Carbon Disulfide 0.20 0.19 15 0.093Chloroacetonitrile 1.0 0.83 4.7 0.121-Chlorobutane 1.0 0.87 6.6 0.18trans-Dichloro-2-Butene 1.0 1.3 8.7 0.361,1-Dichloropropanone 5.0 4.2 7.7 1.0cis-1,3-Dichloropropene 0.20 0.20 3.1 0.020trans-1,3-Dichloropropene 0.10 0.11 14 0.048Diethyl Ether 1.0 0.92 9.5 0.28Ethyl Methacrylate 0.20 0.23 3.9 0.028Hexachloroethane 0.20 0.18 10 0.0572-Hexanone 1.0 1.1 12 0.39Methacrylonitrile 1.0 0.92 4.2 0.12Methylacrylate 1.0 1.2 12 0.45Methyl Iodide 0.20 0.19 3.1 0.019Methylmethacrylate 1.0 1.0 13 0.434-Methyl-2-Pentanone 0.40 0.56 9.7 0.090Methyl-tert-Butylether 0.40 0.52 5.6 1.2Nitrobenzene 2.0 2.1 18 0.162-Nitrobenzene 1.0 0.83 6.2 0.14Pentachloroethane 0.20 0.23 20 0.14Propionitrile 1.0 0.87 5.3 1.6Tetrahydrofuran 5.0 3.9 13
Data obtained using Column 4 with the open split interface and an ion trap massa
spectrometer.

524.2-43
TABLE 8. ACCURACY AND PRECISION FROM FOUR DETERMINATIONS OF METHOD ANALYTES IN THREEWATER MATRICES FORTIFIED AT 20 µG/La
Reagent Water Raw Water Tap Water
CompoundMean(µg/L)
Dev.(%)
(% of TrueValue)
Mean(µg/L)
Dev.(%)
(% of TrueValue)
Mean(µg/L)
Dev.(%)
(% of TrueValue)
Acetone
Acrylonitrile
Allyl Chloride
2-Butanone
Carbon Disulfide
Chloroacetonitrile
1-Chlorobutane
t-1,2-Dichloro-2-Butene
1,1-Dichloropropanone
Diethyl Ether
Ethyl Methacrylate
Hexachloroethane
2-Hexanone
Methacrylonitrile
Methylacrylate
19
20
20
17
19
20
18
19
20
18
20
20
19
20
20
12%
4.7%
5.1%
11%
6.4%
4.1%
6.4%
4.1%
5.6%
6.7%
3.7%
6.1%
6.3%
3.4%
3.7%
95%
100%
100%
85%
95%
100%
90%
95%
100%
90%
100%
100%
95%
100%
100%
21
22
20
19
18
23
19
22
22
22
23
21
21
23
22
3.7%
3.4%
2.8%
7.3%
2.5%
4.7%
2.2%
2.9%
6.4%
3.4%
2.6%
2.5%
3.8%
2.9%
3.1%
105%
110%
100%
95%
90%
115%
95%
110%
110%
110%
115%
105%
105%
115%
110%
22
21
19
17
18
23
17
21
21
22
22
21
21
22
21
8.2%
1.3%
3.5%
5.6%
3.0%
1.3%
2.2%
0.90%
7.7%
2.6%
1.8%
2.0%
4.0%
2.0%
2.1%
110%
105%
95%
85%
90%
115%
85%
105%
105%
110%
110%
105%
105%
110%
105%

524.2-44
TABLE 8. ACCURACY AND PRECISION FROM FOUR DETERMINATIONS OF METHOD ANALYTES IN THREEWATER MATRICES FORTIFIED AT 20 µG/La
Reagent Water Raw Water Tap Water
CompoundMean(µg/L)
Dev.(%)
(% of TrueValue)
Mean(µg/L)
Dev.(%)
(% of TrueValue)
Mean(µg/L)
Dev.(%)
(% of TrueValue)
Methyl Iodide
Methylmethacrylate
4-Methyl-2-Pentanone
Methyl-tert-Butylether
Nitrobenzene
2-Nitropropane
Pentachloroethane
Propionitrile
Tetrahydrofuran
20
20
19
19
20
20
19
20
20
4.4%
3.7%
8.7%
3.5%
5.4%
6.1%
5.2%
4.5%
2.8%
100%
100%
95%
95%
100%
100%
95%
100%
100%
19
23
21
22
22
23
21
23
24
3.8%
3.3%
5.5%
2.5%
4.8%
5.1%
2.6%
3.9%
3.2%
95%
115%
105%
110%
110%
115%
105%
115%
120%
19
23
22
22
21
22
22
23
21
3.0%
2.7%
7.2%
3.6%
2.4%
3.2%
1.7%
2.4%
2.9%
95%
115%
110%
110%
105%
110%
110%
115%
105%
Data obtained using Column 4 with the open-split interface and an ion trap mass spectrometer with all Table 8 analysesa
in the same reagent water solution.1

524.2-45

524.2-46

524.2-47

524.2-48