chapter - 7 chapter 777 - shodhgangashodhganga.inflibnet.ac.in › bitstream › 10603 › 15915 ›...
TRANSCRIPT

142
CHAPTER CHAPTER CHAPTER CHAPTER - 7777
ANALYSIS OF THE PRIMARY ANALYSIS OF THE PRIMARY ANALYSIS OF THE PRIMARY ANALYSIS OF THE PRIMARY
DATADATADATADATA

143
Survey was undertaken in Jammu and Kashmir to have first hand information
from various stakeholders at various levels. The survey was undertaken in a single
district. It was preferably done in Kashmir division and it was very easy and
convenient to do the survey in this region so far as the limitation of time and resources
is concerned. The survey has been done in order to have a fair picture of the status of
tourism, requirements for the development of tourism, potential of tourism, etc. the
main focus was to have the information on the economic impact of tourism.
7.1. SURVEY DESIGN:
Survey design for conducting this survey has been made keeping in view the
single district and the various stakeholders in the tourism industry in Jammu and
Kashmir.
A) Universe of the study.
Universe of the study is the whole state of Jammu and Kashmir.
B) Sampling plan.
Jammu and Kashmir consists of three regions namely Jammu, Kashmir and
Ladakh. All the three regions are distinct geographically and culturally and all three
regions are attracting tourists because of their unique special features. Among the
three regions of the state, the Kashmir region has been chosen for the study and again
it was very difficult to survey the whole Kashmir region at an individual level,
therefore, the district Srinagar has been selected for the survey as it attracts a huge
number of tourist and also it being a summer capital city of the J&K.

144
Sampling frame constituted all the people who are directly or indirectly
associated with tourism industry in Srinagar District.
C) Chart 7.1: Sample Size.
Jammu and Kashmir
Kashmir
Srinagar
2-Tourism
department
52-
Tourists
100-Service
providers at
higher level
40- Service
providers at
lower level

145
D) Data collection.
The primary data has been collected from various stakeholders.
E) Tools used.
The following tools have been used for primary data collection are:
� Questionnaire / Schedules.
� Interviews / Discussions.
F) Sources of Primary data collection.
The primary data has been collected from the following stakeholders in the
tourism set-up:-
� Official / Staff of hotels and other boarding and lodging facilities.
� Visiting tourists in the vicinity.
� Prospective tourists.
� Local inhabitants.
� Artisans, Craftsmen.
� Other related agencies and persons.
Interviews were held on a sample basis with the following stakeholders using
structured questionnaire / schedule:-
� Tourists both domestic and foreign.
� Hoteliers / Restaurant Owners / Houseboat Owners / Hut Owners etc.

146
� Local inhabitants / Shopkeepers / Tourists Guides.
� Travel Agents / Tour Operation, etc.
� Employees working in the J&K Tourism Department.
G) Places visited for data collection within district Srinagar.
� Ashaie Bagh
� Nigeen
� Shalimar
� Boulward Road
� Nishat
� Boulward road
� Lal Chowk
� Dalgate
� Khanyar
� Harwan
� Kon Khan Dalgate
� Hazratbal
� Tourist Taxi Stand
� Rainawari
� Pari Mahal
� Cheshma Shahi
� Botanical Garden
� Shankar Acharya
� Jamia Masjid Nowhatta

147
The aforementioned places are the few places within Srinagar district which
had been visited and attract tourists and most of the service providers were available
at these places. Therefore, during the primary data collection, the information has
been collected from these places only.
7.2. SURVEY FINDINGS HAS BEEN DIVIDED INTO THREE SECTIONS AS
FOLLOWS:
The impact of tourism on the economic development has been examined in
this study. The study has analyzed the secondary data which has found that there is
positive impact of tourism on the economic development. In support for this we have
also done primary survey, where it was found that tourism has a great impact on the
people’s lives. Whenever there has been an increase in tourism activities, there has
been found an increase in the standard of living of the people particularly for the
people who are working in tourism industry at lower level. Primary survey had given
a clear picture of the removal of poverty too which was not so evident from the
secondary data analysis. Therefore, the findings of the primary data are being
presented in the following sections as follows:

148
A) SECTION 1 (Survey findings of tourists).
The tourists coming to Jammu and Kashmir belonging to different age groups.
2% of the tourists were under the age group of less than 20 years of age. 14% of the
tourists were the young tourists and comes under the age group of 21 to 24 Years.
Only 2% of the tourists were of the age group of 62 years and above. So far as the
educational level is concerned, only 2% of the tourists were having the minimum
qualification i.e. below matriculation and 38% of the tourists were having the highest
qualification of Post graduation and above.
2%
14%
17%
19%15%
15%
4% 6%
2% 4%
2%
Age of the respondents
<= 20
21 - 24
26 - 29
30 - 34
34 - 38
39 - 42
44 - 47
48 - 52
52 - 56
57 - 60
62+
2%
8%
52%
38%
Educational level
Below
Matriculatio
n
Intermediat
e
Graduate
Post
graduate or
above

149
The tourist by occupation has also varied figures here. 33% of the tourists
were belonging to the category of the occupation of business/industry, 15% of the
tourist was doing some private jobs, 25% of the tourists were doing government
service, 15% of the tourists were coming under the category of students/researchers
and finally 12% were the house wives.
By gender, male tourists were having the highest percentage of 65% and
female tourists were having the percentage of 35% who were consulted during the
survey.
33%
15%25%
15%
12%
Occupation
Business/Industry
Private
Govt. Service
Student/researcher
Housewife
65%
35%
Tourists by gender
Male
Female

150
There were 85% of the tourists from the domestic tourist category and only
15% of the tourists were International tourists.
The State wise arrival of the tourists shows varied percentages. As the
maximum tourists arrival was from the state of West Bengal and the lowest arrival
was from Punjab. Only from the ten states the Jammu and Kashmir is receiving the
maximum tourist arrival. From Delhi which is the capital city of India, there has been
85%
15%
Tourists origin
Domestic
International
17%
15%
17%
6%
10%2%
8%
4%
4%
4%
13%
State wise arrival of torusits
West bengal
Gujarat
Maharashtra
Karnataka
Delhi
Punjab
U.P
M.P
Himachal Pradesh
Chandigarh
Other country states

151
only 10% of the tourist arrival to Jammu and Kashmir which was found during the
survey.
Most of the tourists have visited the state only once which shows the
percentage of 83%. And only 9% of the tourists have visited the state more than
thrice. 4% of the tourists have visited twice and also 4% of the tourists have visited
thrice to the state.
83%
4%4%
9%
Frequency of tourists visiting
Once
Twice
Thrice
73%
27%
Rating by cost for visiting by toursts
Most important
Least Important
81%
19%
Rating by popularity by tourists
Most important
Least Important

152
The tourists have also visited the state of Jammu and Kashmir keeping in mind
the cost and Popularity of this destination. So in this regard, 73% of the tourist has
rated the cost as most important factor for visiting the place and 27% of the tourists
have given least importance to this factor. Again 81% of the tourists have given most
importance to the popularity of the destination and 19% of the tourists have given the
least importance to it.
72% of the tourists were spending 5% to 20% of their income for
holidays/leisure and 18% of the tourists had reported that they are spending 21% to
50% of their income for holidays/leisure. Only 10% of the tourists were spending the
51% and above of their income for holiday/leisure purposes.
0
20
40
60
80
5-20-
21-50-
51 and above
72
18
10
Pe
rce
nta
ge
of
tou
rist
s
Percentage of income
Income spent by tourists

153
31% of the tourists were staying for 2 to 5 days in Jammu and Kashmir, the
maximum of 38% of the tourists were spending 6-10 days. 12% of the tourists were of
the opinion that they are spending 11-20 days and 19% of the tourist are of the
opinion that they are spending 20 days and above in Jammu and Kashmir.
The 77% of the toruists were coming for the purpose of leisure/holiday and
then the second highest percentage of tourists i.e. 9% were having more than one
purpose of visiting the place of Jammu and Kashmir. For business purposes only 2%
0
10
20
30
40
2-5- 6-10- 11-20- 20 days above
3138
1219
Pe
rce
nta
ge
Days
Time spent by tourists
2%
77%
2%
4% 6%
9%
Tourists purpose of visiting
Business
Leisure/Holiday
Religious/Pilgrimage
Social
Others specify
More than one purpose
154
of the tourists came to this place. There were 2% of the tourists who came for
religious/pilgrimage purposes. For social purpose there were only 4% of the tourists
and 6% of the tourists had given some other reasons for visiting.
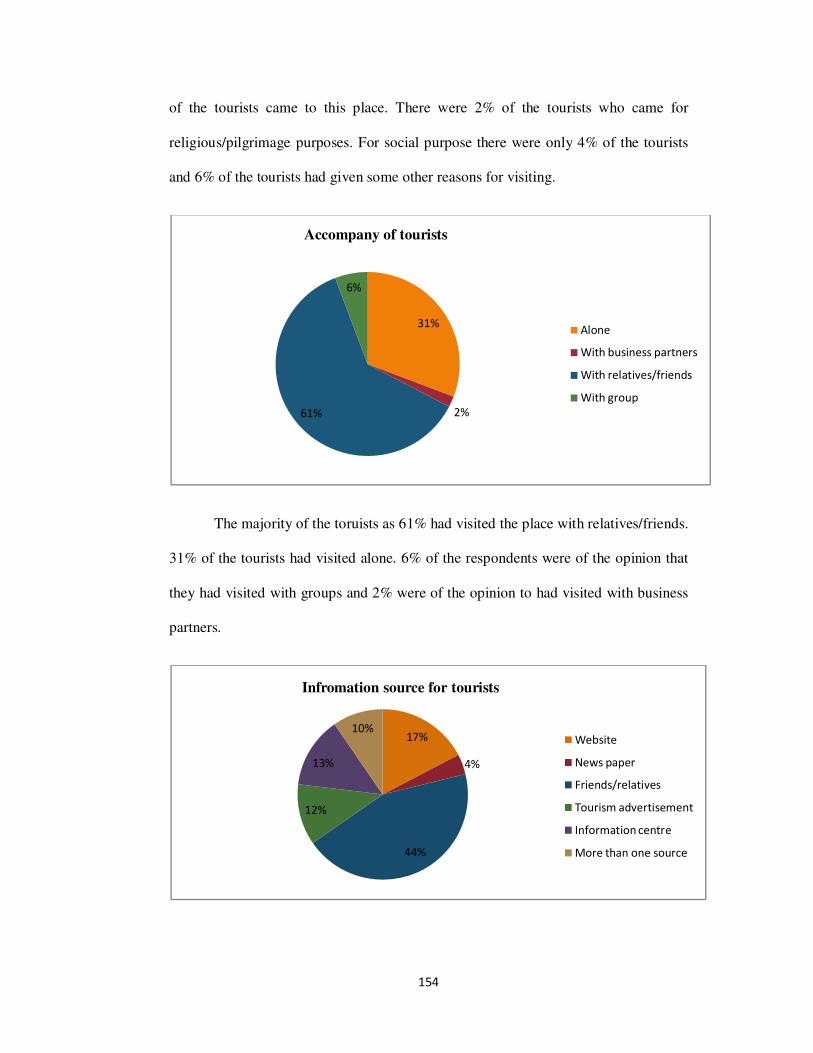
The majority of the toruists as 61% had visited the place with relatives/friends.
31% of the tourists had visited alone. 6% of the respondents were of the opinion that
they had visited with groups and 2% were of the opinion to had visited with business
partners.
31%
2%61%
6%
Accompany of tourists
Alone
With business partners
With relatives/friends
With group
17%
4%
44%
12%
13%
10%
Infromation source for tourists
Website
News paper
Friends/relatives
Tourism advertisement
Information centre
More than one source

155
The respondents had given the different references for information source for
visiting the place like majority of the 44% of the tourists had opined that they got the
informatin from friends/relatives. And lowest of the 4% of the tourists were of the
opinion that they got the information from news paper about this place.
Perceptions On Tourism Services:
The majority of the respondents (27%) were given neutral response to the
perception on information service and the minimum of 2% of the respondents were
very dissatisfied with the infromation service available in the state.
Again the majority of the tourists i.e. 42% were having neutral perception on
travel service providers. 31% of the tourists were very satisfied with travel service
19%
19%
27%
33%
2%
Perception of tourists on information service providers
Dissatisfied
Satisfied
Neutral
Very satisfied
very dissatisfied
14%
13%
42%
31%
Perception of tourists on travel service providers
Dissatisfied
Satisfied
Neutral
Very satisfied

156
providers in the state. And the 14% of the tourists were dissatisfied with this service
and 13% of the tourists were satisfied.
17% of the tourists were having neutral perception on hospitality in Jammu
and kashmir and 83% of the tourists were very satisfied with the hospitality services
in the state.
20% of the tourists were very satisfied with the food services and 16% were
very dissatisfied with the food services. 18% were dissatisfied and 20% were satisfied
with the food service. Then 26% of the tourists were having neutral response. 20% of
the tourists were very satisfied with the food services and 16% were very dissatisfied
with the food services. 18% were dissatisfied and 20% were satisfied with the food
service. Then 26% of the tourists were having neutral response.
17%
83%
Perception of tourists on hospitality
Neutral
Very satisfied
16%
18%
20%
26%
20%
Perception of tourists on food services
Very dissatisfied
Dissatisfied
Satisfied
Neutral
Very satisfied

157
Then the perception on other tourism services in the state, the 52%
respondents were very dissatisfied, 30% were dissatisfied and 18% of the respondents
were saatisfied.
The 29% of the tourists had rated the Jammu and Kashmir as an average place
for money value and 49% of the respondents had rated it as good and then 22% had
rated it as very good place so far as the value of money is concerned.
52%
30%
18%
Perception of tourists on other services
Very dissatisfied
Dissatisfied
Satisfied
29%
49%
22%
Tourists rating the place for money value
Average
Good
Very good

158
Majority of the respondents i.e. 98% had given positive response that they will
recommend this place to others and only 2% of the tourists had given negative
response.
98%
2%
Place recommended to others by tourists
Yes
No

159
B) SECTION 2 (Survey findings of service providers at higher and lower
level).
So far as the service area is concerned, 21% of the respondents were having
travel agencies which is the highest percentage among the service providers at higher
level in tourism industry of Jammu and Kashmir and 1% for each of the respondents
were having Kashmiri Arts Showrooms, cold drink shops, medical shop and also 1%
6%
16%
1%
6%
21%
10%
8%
3%
11%
2%
1%1%
1%12%
1%
Service area of higher level service providers
Guest house
Hotel
Dhaba
Restaurant
Travel agency
Shikara
Photo studio
Handicraft Showroom
Light passenger vihicle
Showroom of Shawls
Kashmiri Arts Showroom
Cold drinks shop
Medical Shop
House boat
others specify

160
of the respondents of this level were having some other service areas which is the
lowest percentage.
At lower level of the service providers in the tourism industry of Jammu and
Kashmir, the highest percentage of the respondents i.e. 57% were working in tourism
department itself doing some lower category jobs and the lowest percentage i.e. 2%
were working in hotels and restaurants.
25%
57%
2%
3% 5%
5%3%
Service area of lower level respondents
Handicraft
Tourism department
Hotel & restaurant
Tea stall
Papermachie industry
Vendor
Tourism department owned
restaurant
161
5%
2%2%
5% 2%
5%
12%
30%
5%
13%
8%
8%3%
Occupation of lower level respondents
Worker
Tea maker
Waiter
Eatable seller
Room delivery boy
Ticket collector
Casual labor
Gardner
Head Gardner
Sweeper
Papermachie worker
Shawl maker
Others specify
14%
6%
2%
2%
13%
8%
1%
2%
1%
10%
8%
2%
4%
26%
1%
Occupation of higher level respondents
Manager
Front office(receptionist)
Catering
Travel agent
Photographer
Ticketing Executive
Sale Man
Sales Manager
Shikara Rider
Driver/owner
Cook
Driver
Shikara Rider
Chemist
Others specify

162
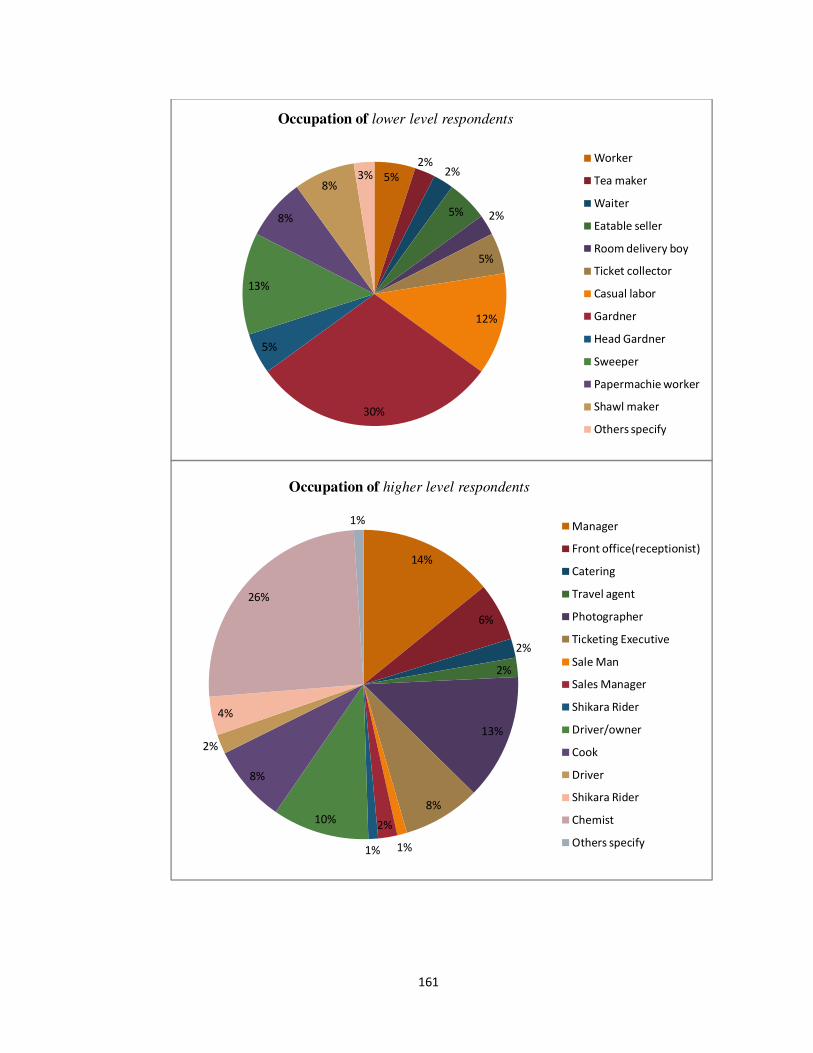
The comparative figures for the respondents at both lower level and higher
level by occupation can be seen from the figures above. The highest i.e. 30% and 26%
were working as ticket colletor and chemists respecttively.
The comparison of the respondents by gender at both level i.e. at lower level
and higher level can also be seen from the charts above. 87% of the males were
consulted who were as lower level service providers and 98% male respondents were
working as higher level service providers in Jammu and Kashmir tourism industry.
Among female respondents, 13% were working at lower level and 2% were higher
level service providers.
87%
13%
Gender of lower level service providers
Male
Female
98%
2%
Gender of higher level service providers
Male
Female

163
Within the lowest age group of 18 to 24 years, the 7% and 6% respondents
were consulted both at lower level and higher level service providers respectively.
And in case of lower level service providers there was none respondent between the
7%
30%
20%
20%
13%
10%
Age of respondents at lower level
18-24
25-31
32-38
39-45
46-52
53-59
6%
39%
25%
10%
10%
5%
1%
3%
1%
Age of respondents at higher level
18 - 24
25 - 31
32 - 38
39 - 45
46 - 52
53 - 59
60 - 66
67 - 73
74+

164
age group of 74 years and above but for the same age group at higher level, there were
25% of the respondents.
The highest percentage i.e. 47% of the respondents was having education level
of below matriculation but for the same education level there were 21% of the
respondents at higher level. At lower level there was none respondent who were
having the educational level of post graduation but in case of the respondents at
higher level there were 4% who falls within this level of education.
47%
28%
25%
level of education for lower level respondents
Below matriculation
Intermediate
Illiterate
21%
26%
29%
4%
20%
Level of education for higher level respondents
Below Matriculation
Intermediate
Graduate
Post-graduate
Illiterate
165
`
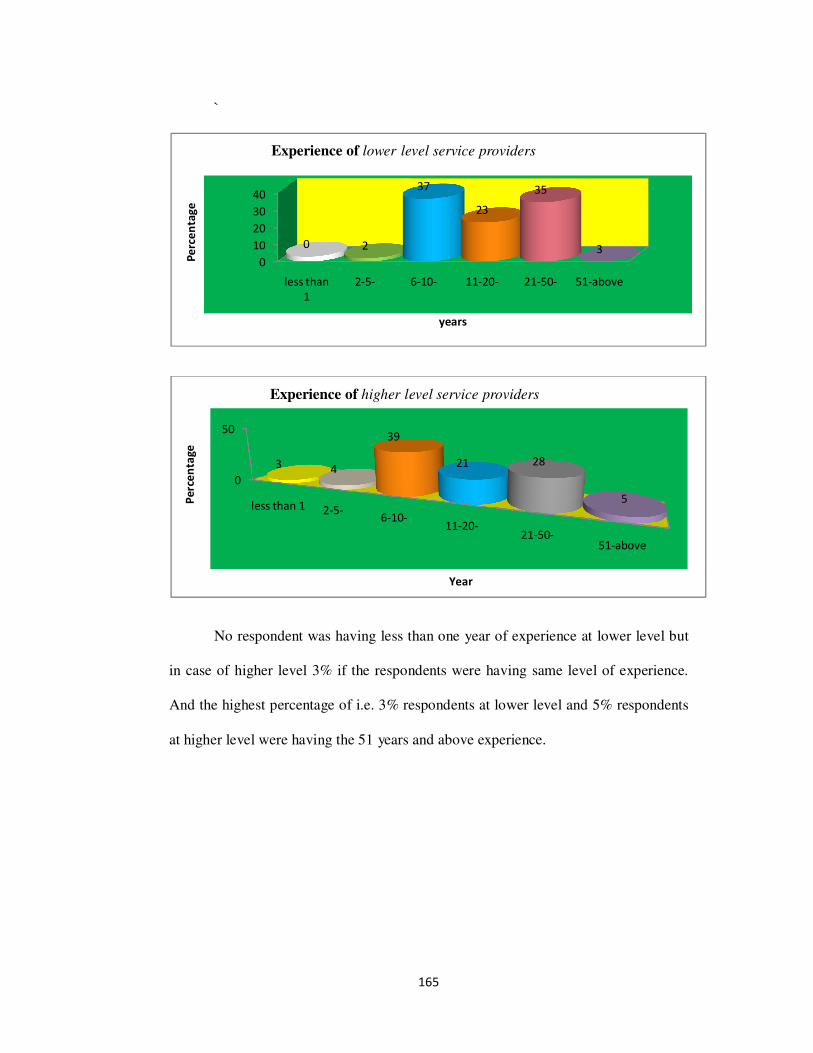
No respondent was having less than one year of experience at lower level but
in case of higher level 3% if the respondents were having same level of experience.
And the highest percentage of i.e. 3% respondents at lower level and 5% respondents
at higher level were having the 51 years and above experience.
0
10
20
30
40
less than
1
2-5- 6-10- 11-20- 21-50- 51-above
0 2
37
23
35
3
Pe
rce
nta
ge
years
Experience of lower level service providers
0
50
less than 1 2-5-6-10-
11-20-21-50-
51-above
3 4
39
21 28
5Pe
rce
nta
ge
Year
Experience of higher level service providers
166
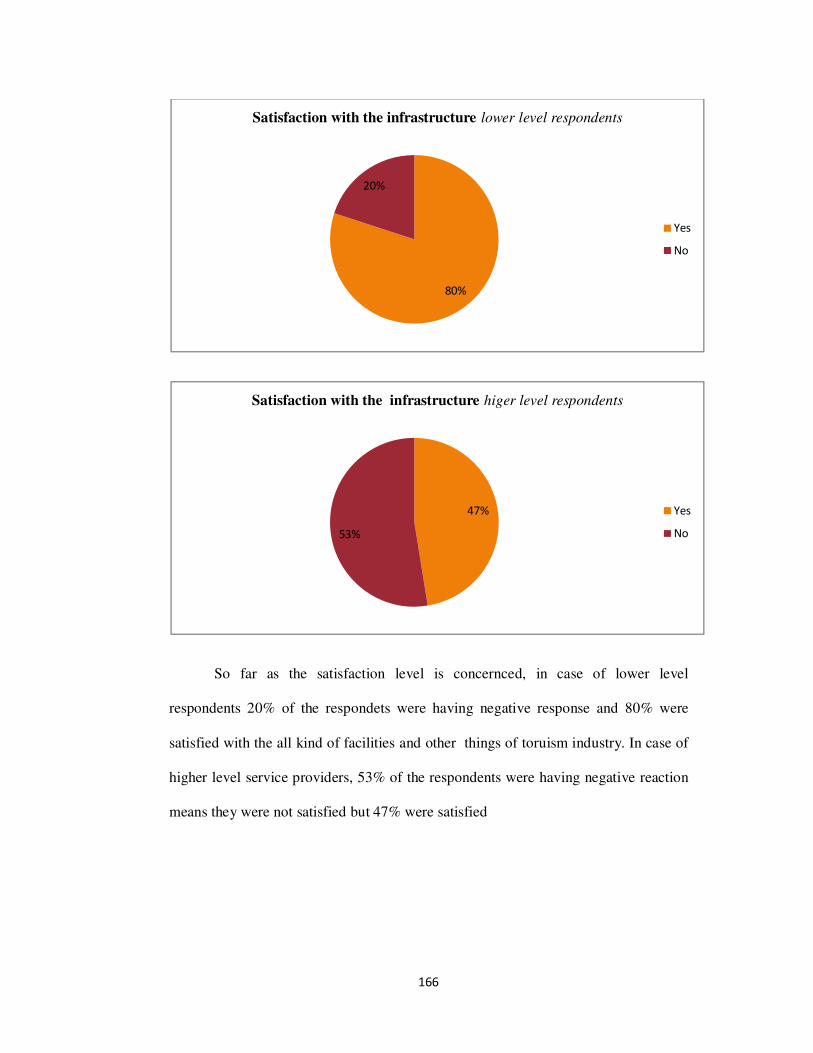
So far as the satisfaction level is concernced, in case of lower level
respondents 20% of the respondets were having negative response and 80% were
satisfied with the all kind of facilities and other things of toruism industry. In case of
higher level service providers, 53% of the respondents were having negative reaction
means they were not satisfied but 47% were satisfied
80%
20%
Satisfaction with the infrastructure lower level respondents
Yes
No
47%
53%
Satisfaction with the infrastructure higer level respondents
Yes
No
167
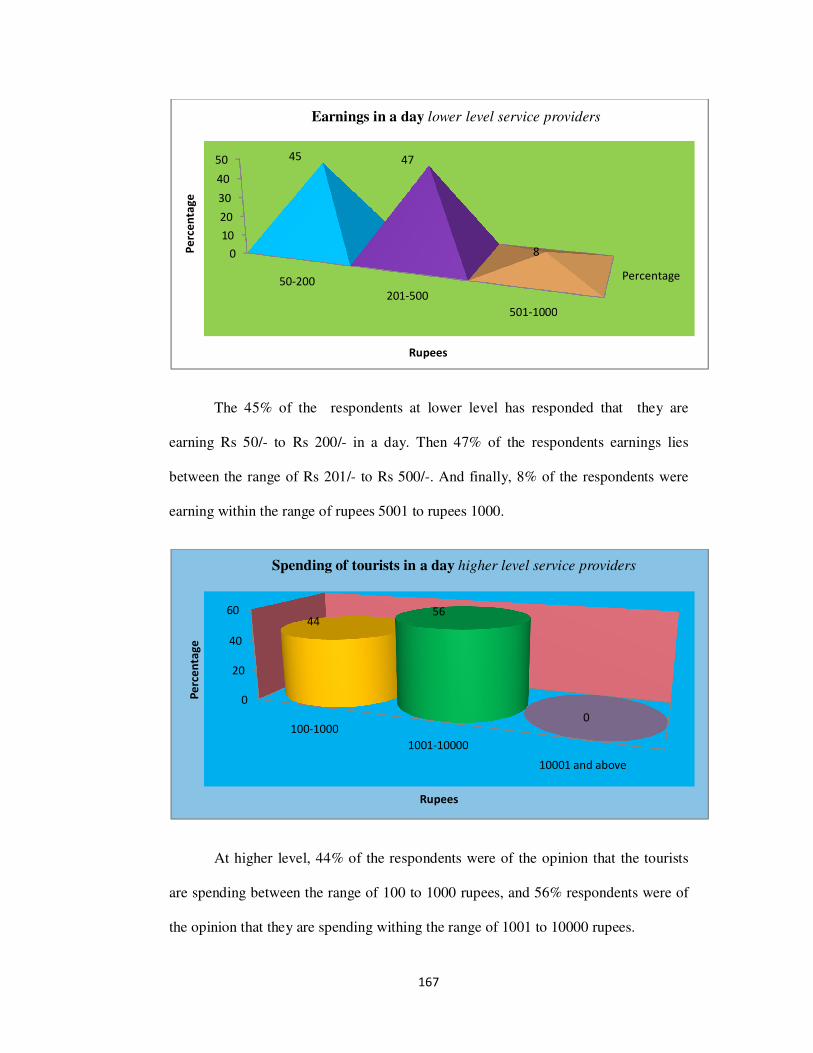
The 45% of the respondents at lower level has responded that they are
earning Rs 50/- to Rs 200/- in a day. Then 47% of the respondents earnings lies
between the range of Rs 201/- to Rs 500/-. And finally, 8% of the respondents were
earning within the range of rupees 5001 to rupees 1000.
At higher level, 44% of the respondents were of the opinion that the tourists
are spending between the range of 100 to 1000 rupees, and 56% respondents were of
the opinion that they are spending withing the range of 1001 to 10000 rupees.
Percentage
0
10
20
30
40
50
50-200201-500
501-1000
45 47
8Pe
rce
nta
ge
Rupees
Earnings in a day lower level service providers
0
20
40
60
100-1000
1001-10000
10001 and above
4456
0
Pe
rce
nta
ge
Rupees
Spending of tourists in a day higher level service providers

168
As per the information given by the respondents at higher level that 29% of
the tourists prefer Jammu region who are mainly domestic tourists, 62% of the
respondents has responded that tourists preferred region is Kashmir which includes
both domestic and International tourists and 9% of the respondents were of the
opinion that the tourists prefer Ladakh region of the state of Jammu and Kashmir.
The 33% of the respondents at higher level had given positive response that
they were having the professional qualification but 67% of the respondents had
responded that they were not having any professional qualification.
29%
62%
9%
Prefered region for tourists responsed by higher level service
providers
Jammu
Kashmir
Ladakh
33%
67%
Professional qualification at higher level
Yes
No

169
At lower level it is evident from the chart that 61% of the respondent’s
children had got the schooling or education at government institutions, 23% of the
respondents said that they got it in private institutions and 16% of the respondents had
told that their children had got their education from both private and government
institutions.
61%23%
16%
Schooling of lower level service providers childrens
Government institution
Private institution
Both
80%
20%
Total expenditure meating out of income by lower level Service
Providers
Yes
No

170
At lower level, the 80% of the respondents had responded positively that they
are meeting their expenditures from the earnings from tourism and 20% had
responded negatively that they don’t.
The 57% of the respondents at lower level had respoded positively that they
are saving some part of their income and 43% of the responded had responded
negatively that they don’t.
57%
43%
Savings of money by lower level respondents
Yes
No
45%
55%
Employment status of family memeber of lower level
Employed
Unemployed

171
The respondents at lower level had given some varied percentage figures so
far as the employment status of their family members is concerned. 45% of the
respondents had responded that their family members are employed and 55% had
responded that they are unemployed
C) SECTION 3 (Survey findings of the tourism department).
Only two officers were consulted from the Department of tourism government
of Jammu and Kashmir. But these two officers were of the high ranks. While
interviewing them they had given some valuable information like, there is not as such
remarkable growth in the industry, and however it all depends on the political
situation and infrastructural development. As compared to others states they were of
the opinion that the J&K sate is nowhere because of the continuous disturbance. They
were of the opinion that tourism is a multidimensional activity and spending of tourist
has multiplier effect as such it has pervasive impact on all sector in J&K. Assessing
the demand for various tourism facilities the level of existing supply of such facilities
is pre-requisition for development and promotion of tourism. They were of the
opinion that tourism in J&K has huge potential which needs to be tapped, but tourism
is a peace time activity. It can boost the economy and there can be employment at
large scale. They were also of the opinion that tourism had the greater impact on the
socio- economic development. Regarding the satisfaction about the infrastructural
facilities and policies and programmes for the development of tourism industry they
were of the opinion that present infrastructure is inadequate. Private investors can
help to upgrade and augment the infrastructure. But tourism in J&K is volatile
therefore the common investors does not response faith in this sector. Government
however has trial to fill in the gap and some good assets have been created like

172
RSGC, Nigeen clubs, TRC Nowgam, Golf Course etc. The development of industry
should not be at the cost of environmental damage of the destination areas is the
policy of the state government and had been opined by the respondents.
The primary survey has been done keeping in view the inadequate availability
of the data related to the objectives in this study. This survey has been done in a single
year i.e. 2009-10. It has been done at three levels. At all levels, a valuable source of
information has been acquainted which has supported inadequate secondary data and
also this study at large.