chapter 4 harmonic elimination in pwm ac...
TRANSCRIPT
68
CHAPTER 4
HARMONIC ELIMINATION IN PWM AC CHOPPER
4.1 INTRODUCTION
Power quality is the ability of the electric utilities to provide
electric power without interruption. Power quality encompasses even minimal
deviation from a perfect sinusoidal waveform. It includes EMI and Radio
Frequency Interference (RFI) noise, transients, surges, sags, brown outs, black
outs and any other distortions to the sinusoidal waveform. One distortion to
the sinusoidal waveform which has dangerous consequences is harmonics.
Harmonic is a sinusoidal component of a periodic wave or quantity
having a frequency that is an integer multiple of the fundamental frequency.
An AC periodic voltage or current can be represented by a Fourier series of
pure sinusoidal waves which contain the basic or fundamental frequency and
its multiple called harmonics. Harmonics can be present in voltage, current or
both. The effects of these harmonics are the failure of electrical and electronic
components, overheating of neutral wires, transformer heating, and the failure
of power factor correction capacitors, losses in power generation and
transmission, interference with protection, control and communication
networks as well as customer loads.
It is forecasted that in future, half of all electrical devices will
operate with nonlinear current. These nonlinear loads are the cause of current
harmonics. The term harmonic currents are a common word in the power
69
quality industry and it needs to be realized that they can be a serious problem
if not treated properly.
The AC voltage regulator is used as one of the power electronic
systems to control output AC voltage for power ranges from a few watts (as in
light dimmers) up to fractions of megawatts (as in starting systems for large
induction motors). Phase angle control line commutated voltage controllers
and integral cycle control of thyristors have been traditionally used in these
types of regulators. Some techniques offer such advantages as simplicity and
the ability of controlling a large amount of power economically. The
controllers suffer from inherent disadvantages, such as retardation of the
ring angle, causing a lagging power factor at the input side, in particular, at
large ring angles and high low order harmonic contents in both load and
supply voltages/currents (Rashid 2005).
The recent developments in the eld of power electronics make it
possible to improve the electrical power system utility interface. Line
commutated AC controllers can be replaced by PWM AC chopper controllers,
which have better overall performance and the above problems can be
improved if these controllers are designed to operate in the chopping mode. In
this case, the input supply voltage is chopped into segments, and the output
voltage level is decided by controlling the duty cycle of the chopper switching
function. The advantages to be gained include nearly sinusoidal waveforms,
better input power factor, better transient response, elimination of the low
order harmonics and consequently, smaller input output lter parameters
(Deib et al 1993).
4.2 EVOLUTION OF AC CHOPPER
The growth in the field of power electronics has made it possible to
improve the performance of electrical system utilities through various means.
The solid state power switching devices are employed in source conditioning
70
by changing either its magnitude or frequency such as converters, inverters,
choppers, regulators and cycloconverter. The advantages of using these
devices are listed out by Addoweesh et al (2003). The advantages are
mentioned below:
Fast response
Compactness
Loss free control
Low power demands of control circuitry
Medium, large motor drives, Uninterruptible Power Supply and
high power inverters in flexible alternate current transmission systems need
switching elements which can bear high voltages and currents. To overcome
the limitations of semiconductor switches, several new techniques and
topologies have been developed, such as multiple switching elements in one
leg of an inverter, series connected inverters, parallel connected inverters,
multilevel reactive power compensators, multiple rectifiers for unity power
factor correction, optimization of motor performance indexes (such as
harmonic current, torque ripple, common mode voltage and bearing currents),
and neutral point clamped inverters. In the present research work the control
technique is based on the SHEPWM. The SHEPWM based methods can
theoretically provide the highest quality output among all the PWM methods.
4.2.1 Advantages of AC Chopper over AC Voltage Controller
The advantages of AC chopper over AC voltage controller are
listed below,
Improved load power factor due to high frequency switching
Control range is wide in terms of firing angles regardless of
load power factor
71
The low order harmonics are eliminated compared to the phase
angle control
The order of the dominant load voltage harmonics can be
controlled through changing chopper frequency.
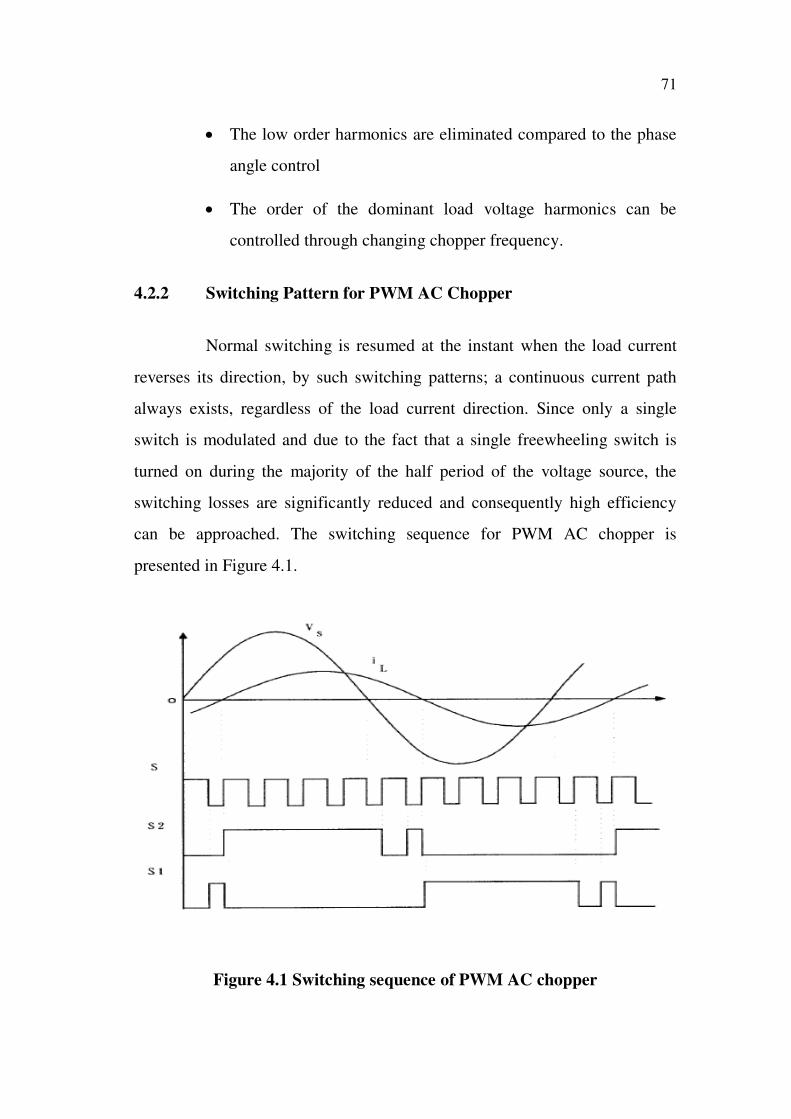
4.2.2 Switching Pattern for PWM AC Chopper
Normal switching is resumed at the instant when the load current
reverses its direction, by such switching patterns; a continuous current path
always exists, regardless of the load current direction. Since only a single
switch is modulated and due to the fact that a single freewheeling switch is
turned on during the majority of the half period of the voltage source, the
switching losses are significantly reduced and consequently high efficiency
can be approached. The switching sequence for PWM AC chopper is
presented in Figure 4.1.
Figure 4.1 Switching sequence of PWM AC chopper
72
4.2.3 Advantages of PWM
The advantages of practicing the PWM switching for PWM AC
choppers are listed below,
The output voltage control can be obtained without any
additional components.
With this type of control, lower order harmonics can be
eliminated .or minimized along with its output voltage control.
4.3 PWM AC CHOPPER
The PWM AC chopper has been widely used to drive the induction
motors. It is a very well known fact that the industrial processes for day to day
activities are carried out by induction motors. In a world where power
shortage is so acute it necessary to improve the performance of electrical
systems which drives the induction motors. This work considers the harmonic
elimination in the output parameters of AC chopper. The comparison is also
done between open loop and closed loop models of AC chopper and the
harmonics are eliminated with the application of evolutionary algorithms
namely DE.
Line frequency AC choppers are widely used in applications such
as industrial heating, lighting control, soft starting of induction motors, and
speed controllers for fans and pumps. Many of these are conventional phase
controlled AC controllers using thyristors, which have the advantages of
simplicity of the control circuit and large power capability. However, these
have the inherent drawbacks that power factor decreases when the firing angle
increases and control by switching is often accompanied by extra losses due
to time harmonics presented in output voltage waveforms, added to lower
values of system power factor.
73
The performance of the regulator can be improved if it is designed
to operate as a chopper (Choe et al 1989). In this case, input supply voltage is
chopped into segments and output voltage level is decided by the ratio
between ON/OFF. Chopper mode of operation can be realized by using two
ac switches, one connected in series and the other in parallel with the load as
shown in Figure 4.2. The operation of the AC voltage regulator in chopping
mode has the following advantages:
Phase controlled AC choppers are well known and are being widely
used to obtain variable AC voltage from a fixed AC voltage source. They are
used for the speed control of ac series motors, fan motors, industrial heating,
light dimming and for obtaining the regulated ac supplies. The output voltage
of the phase controlled ac chopper is load dependent and contains a good
amount of odd order harmonic components. Hence, adequate filtering may be
required at the output. If the output voltage is not filtered, an increased
heating will take place in the load. The presence of harmonics also introduces
distortion components in the supply current and reduces the input power
factor and efficiency of the system.
Sundareswaran et al (2004) proposed a method of voltage harmonic
elimination in a PWM AC to AC voltage converter using GA. The output
voltage of the AC chopper with k pulses per half cycle is written in terms of
switching angles using Fourier series, and the best switching angles are
identified with the dual objectives of harmonic elimination and output voltage
regulation.
The performance of the PWM AC chopper is observed under open
loop and closed loop conditions in the way of simulation through
MATLAB/Simulink and the development of hardware. The PWM AC
chopper is developed using two IGBT switches whose switching pulses are
generated by the DSP processor.
74
4.3.1 Configuration of PWM AC Chopper
In 1822, J.B.J. Fourier postulated that any continuous function
repetitive in an interval T can be represented by the summation of a DC
component, a fundamental sinusoidal component and a series of higher order
sinusoidal components (called harmonics) at frequencies which are integer
multiples of the fundamental frequency. Harmonic analysis is then the process
of calculating the magnitudes and phases of the fundamental and higher order
harmonics of the periodic waveform. The resulting series, known as the
Fourier series, establishes a relationship between a time domain function and
that function in the frequency domain.
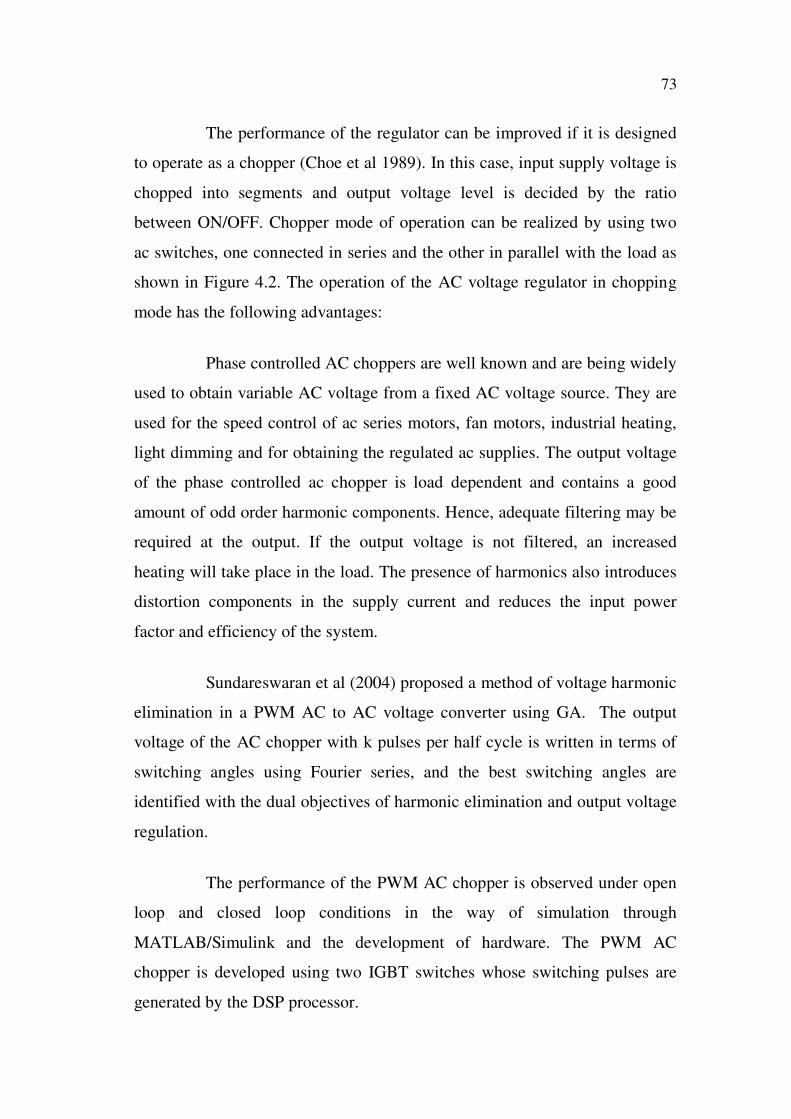
Figure 4.2 PWM controlled AC chopper
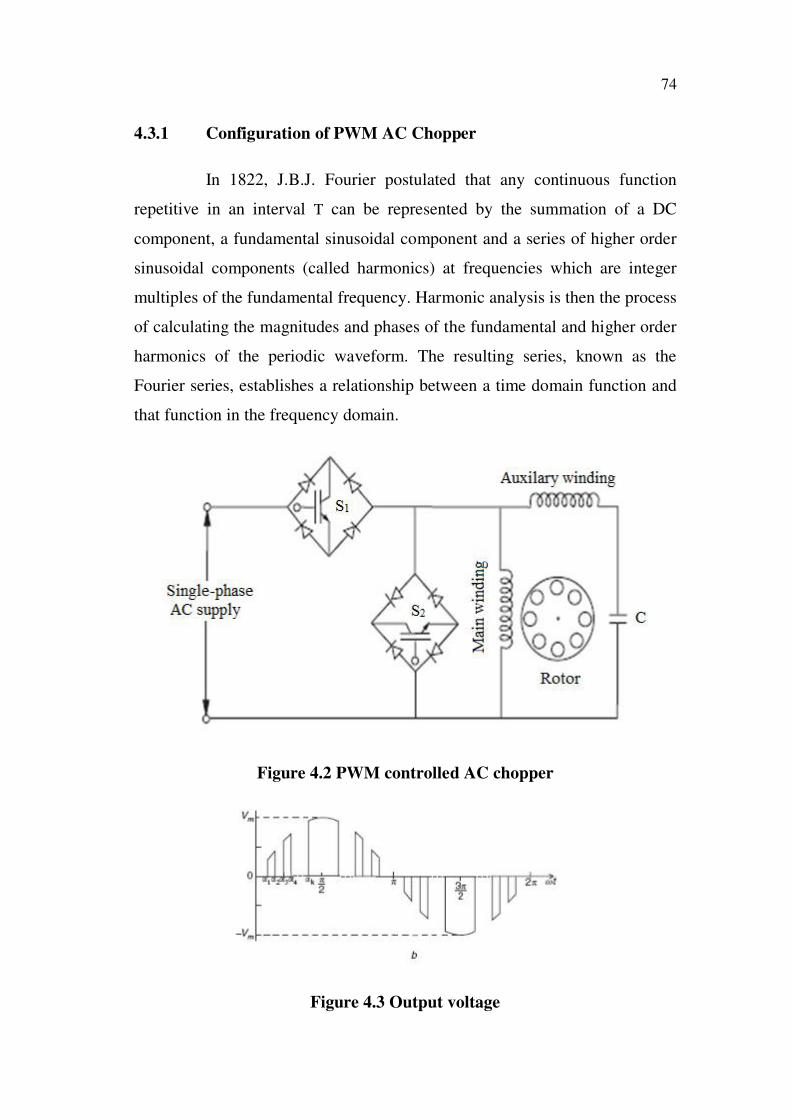
Figure 4.3 Output voltage
75
The circuit of a PWM AC chopper is shown in Figure 4.2 and the
output voltage in Figure 4.3. In this circuit, IGBT are used as switches and are
marked as S1 and S2. The switch S1 is connected to the load. The switch S2 is
included in the circuit to allow freewheeling of the load current when switch
S1 is turned OFF. The switch S1 is turned ON at various firing angles such as
1, 3, k-1, and are turned OFF at the switching angles 2, 4, 6,…. k. The
switching pulse with m number of pulses per half cycle is shown in the above
figure. They are symmetrical with respect to /2.
4.3.2 Analysis of PWM AC Chopper
The output voltage can be expressed using Fourier series as,
n
0 0 n n
1
V a (A cos n t B sin n t) (4.1)
Where,
n = 1, 2, 3,……….
The Fourier series basically consists of odd and even harmonics.
The even harmonics are absent and the coefficients An and a0 are reduced to
zero as the output voltage waveform is purely symmetrical. The above
equation is thus reduced to,
n
0 n
1
V B sin n t (4.2)
Where,
n=1, 3, 5,…………
76
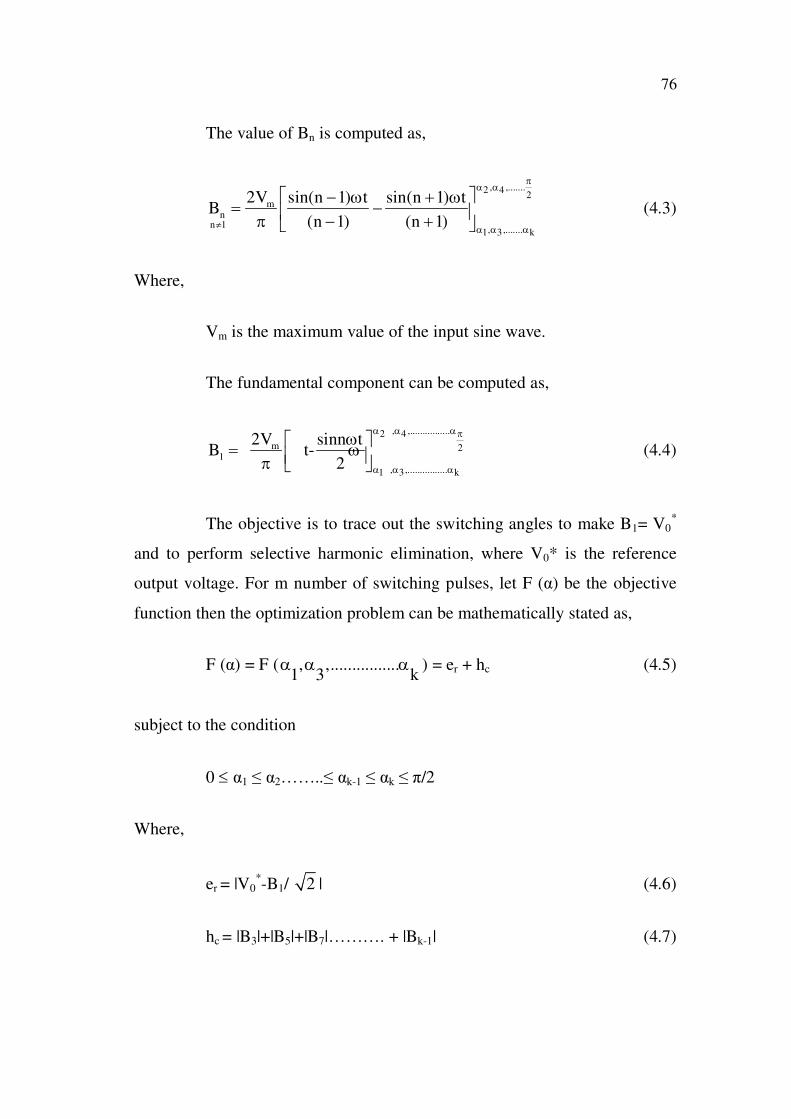
The value of Bn is computed as,
, ,.......2 42
mn
n 1, ,.......1 3 k
2V sin(n 1) t sin(n 1) tB
(n 1) (n 1) (4.3)
Where,
Vm is the maximum value of the input sine wave.
The fundamental component can be computed as,
, ,................2 4
m 21
, ,................1 3 k
2V sinn tB t-
2 (4.4)
The objective is to trace out the switching angles to make B1= V0*
and to perform selective harmonic elimination, where V0* is the reference
output voltage. For m number of switching pulses, let F ( ) be the objective
function then the optimization problem can be mathematically stated as,
F ( ) = F ( , ,................1 3 k
) = er + hc (4.5)
subject to the condition
0 1 2…….. k-1 k /2
Where,
er = |V0*-B1/ 2 | (4.6)
hc = |B3|+|B5|+|B7|………. + |Bk-1| (4.7)
77
Thus the DE algorithm has to be framed as MATLAB program for
the objective function mentioned in Equation 4.5. subject to the condition
mentioned in the Equation 4.6 and Equation 4.7.
4.4 HARDWARE MODULE
The hardware model of the AC chopper is developed using the
below mentioned modules. This section deals with components and
techniques which are used in hardware and the explanations of each
components is presented in this section.
Pulse Generator
IGBT
Diode
DSP Processor
Fast Fourier Transform
The MATLAB/Simulink software is used to verify the simulation
results based on the hardware model developed for PWM AC chopper.
4.4.1 Pulse Generator
Pulse Width Modulation, as it applies to motor control, is a way of
delivering energy through a succession of pulses rather than a continuously
varying (analog) signal. By increasing or decreasing pulse width, the energy
flow to the motor shaft can be regulated. The motor’s own inductance acts
like a filter, storing energy during the ON cycle while releasing it at a rate
corresponding to the input or reference signal. In other words, energy flows
into the load not so much the switching frequency, but at the reference
frequency.
78
The energy of each push is stored in the inertia of the heavy
platform, which accelerates gradually with harder, more frequent, or longer
lasting pushes. The riders receive the kinetic energy in a very different
manner than how it’s applied.
4.4.2 IGBT
The Insulated Gate Bipolar Transistor is a minority carrier device
with high input impedance and large bipolar current carrying capability.
Many designers view IGBT as a device with MOSFET input characteristics
and bipolar output characteristic that is a voltage controlled bipolar device. To
make use of the advantages of both Power MOSFET and Bipolar Junction
Transistor (BJT), the IGBT has been introduced. It’s a functional integration
of Power MOSFET and BJT devices in monolithic form. It combines the best
attributes of both to achieve optimal device characteristics.
4.4.3 DSP Processor
Digital signal processing is carried out by mathematical operations.
In comparison, word processing and similar programs merely rearrange stored
data. This means that computers designed for business and other general
applications are not optimized for algorithms such as digital filtering and
Fourier analysis. DSP are microprocessors specifically designed to handle
digital signal processing tasks. These devices have seen tremendous growth in
the last decade, finding use in everything from cellular telephones to
advanced devices. The majority of the DSP can interface with external
converters through serial or parallel ports.
79
4.5 OPEN LOOP AND CLOSED LOOP PWM AC CHOPPER
The circuit of a PWM AC chopper is shown in Figure 4.2 and the
output voltage in Figure 4.2. The operation of the PWM AC chopper is
explained in section 4.5.1.
4.5.1 Open loop PWM AC Chopper
The performance of the PWM AC chopper is observed under open
loop condition in this section. The PWM AC chopper circuit is simulated
using MATLAB/ Simulink. The simulation results are presented.
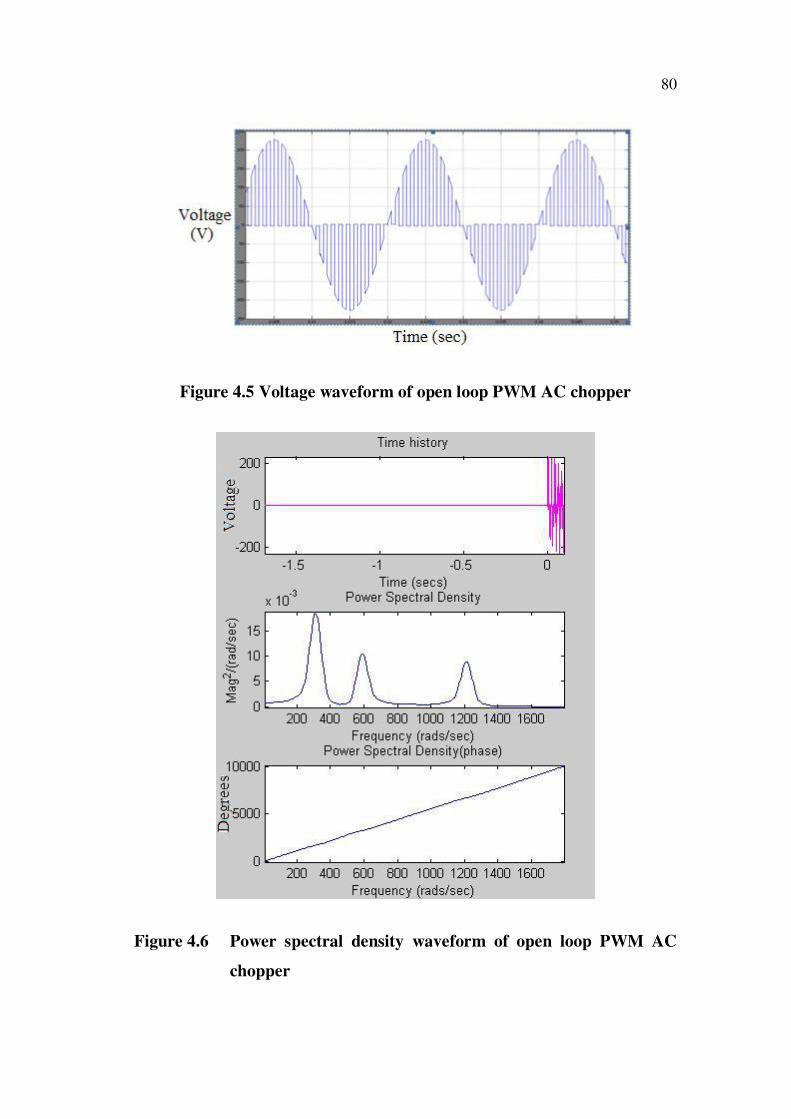
4.5.1.1 Results of Simulation
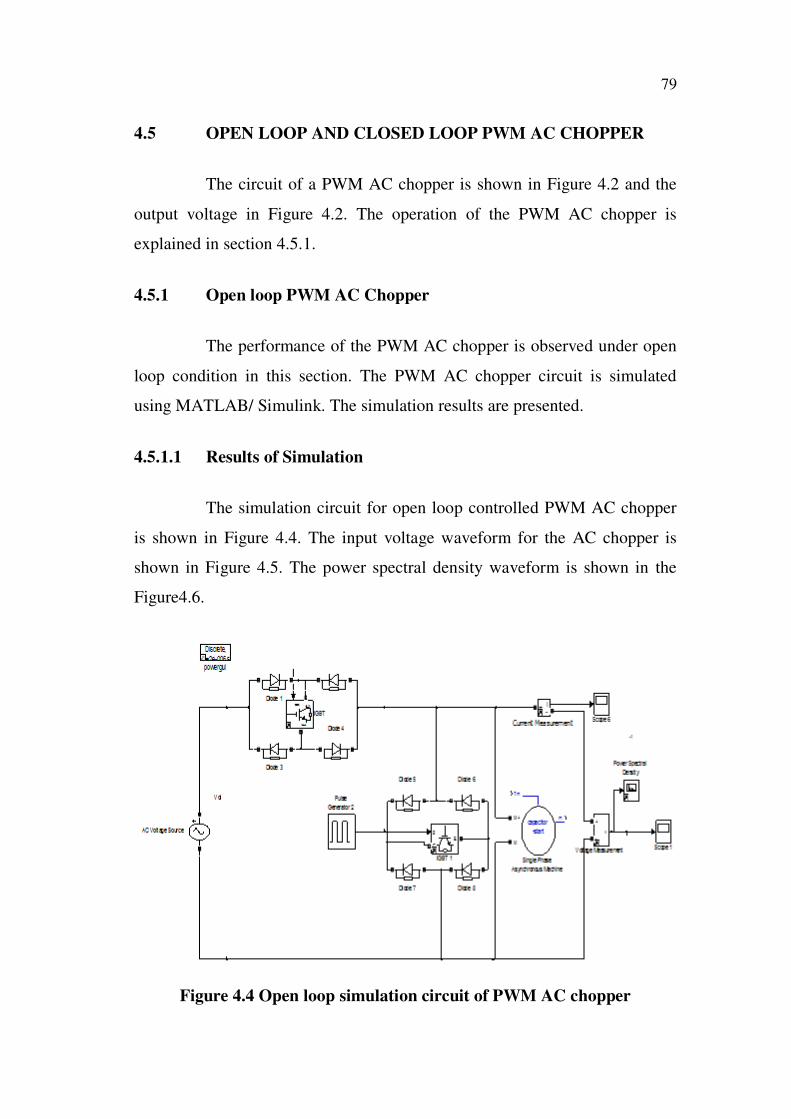
The simulation circuit for open loop controlled PWM AC chopper
is shown in Figure 4.4. The input voltage waveform for the AC chopper is
shown in Figure 4.5. The power spectral density waveform is shown in the
Figure4.6.
Figure 4.4 Open loop simulation circuit of PWM AC chopper
80
Figure 4.5 Voltage waveform of open loop PWM AC chopper
Figure 4.6 Power spectral density waveform of open loop PWM AC
chopper
81
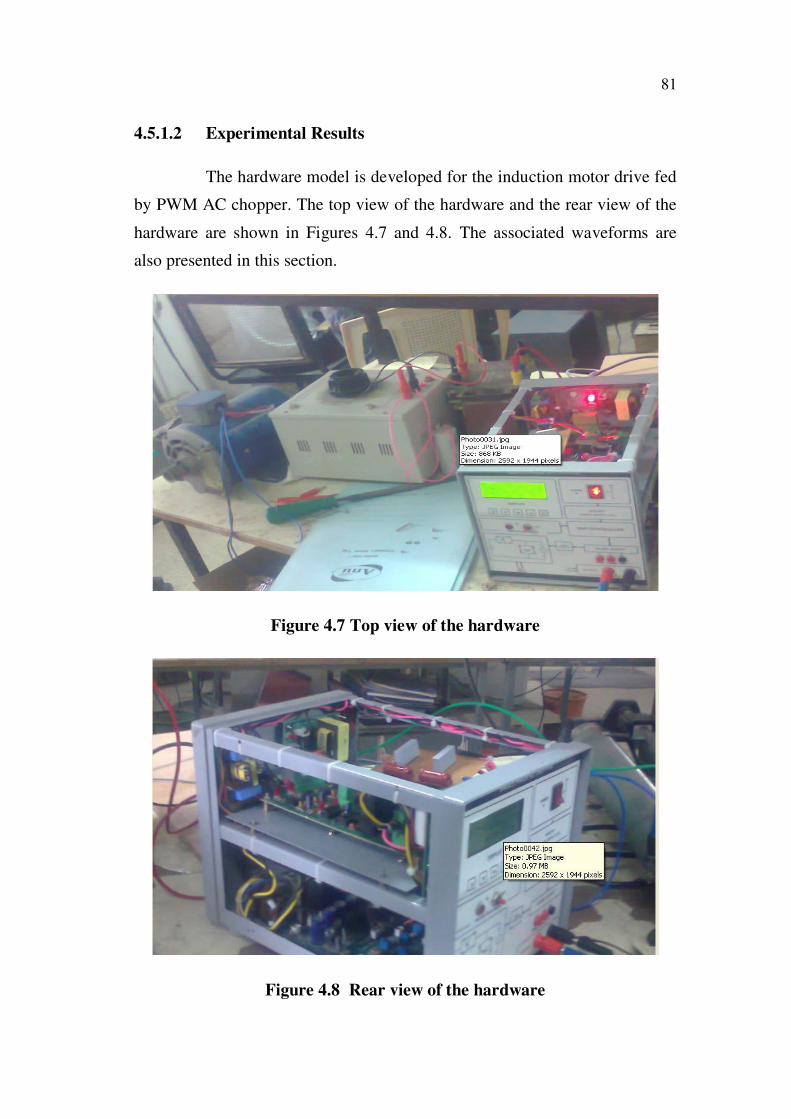
4.5.1.2 Experimental Results
The hardware model is developed for the induction motor drive fed
by PWM AC chopper. The top view of the hardware and the rear view of the
hardware are shown in Figures 4.7 and 4.8. The associated waveforms are
also presented in this section.
Figure 4.7 Top view of the hardware
Figure 4.8 Rear view of the hardware
82
The above figure shows the hardware developed for induction
motor drive. The hardware developed consists of the power circuit, switching
circuit along with the sufficient arrangements for the measurement of input
and output waveforms.
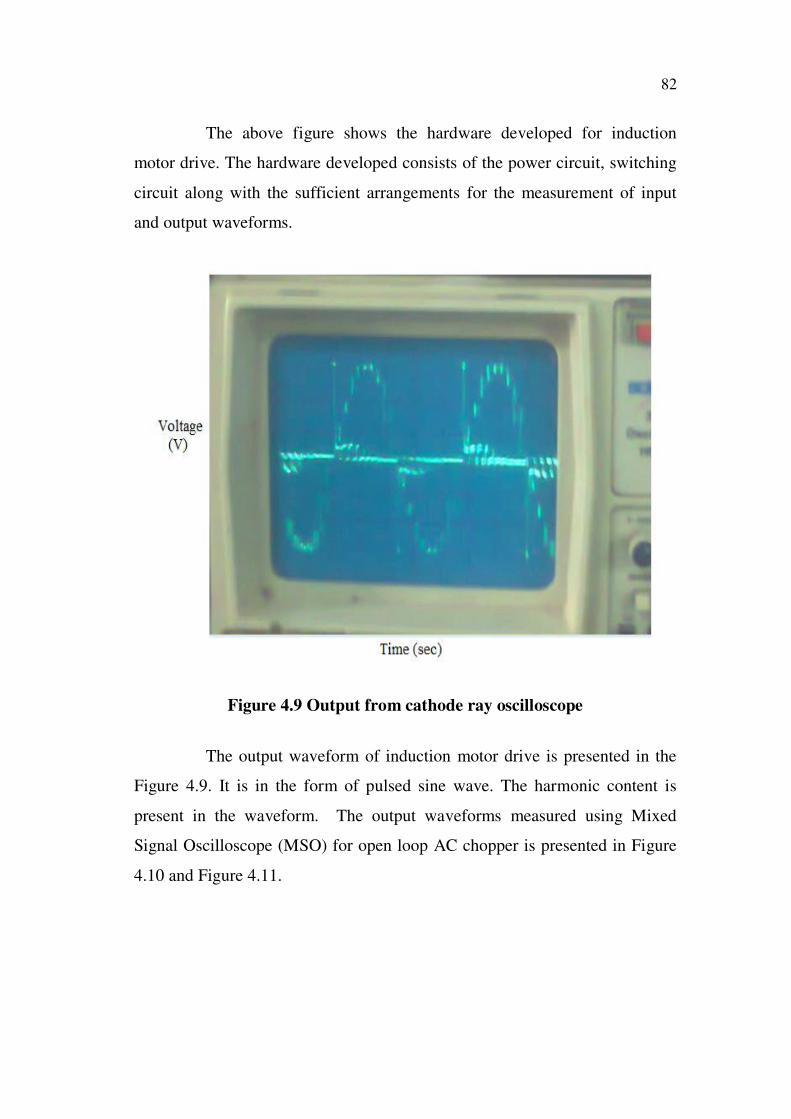
Figure 4.9 Output from cathode ray oscilloscope
The output waveform of induction motor drive is presented in the
Figure 4.9. It is in the form of pulsed sine wave. The harmonic content is
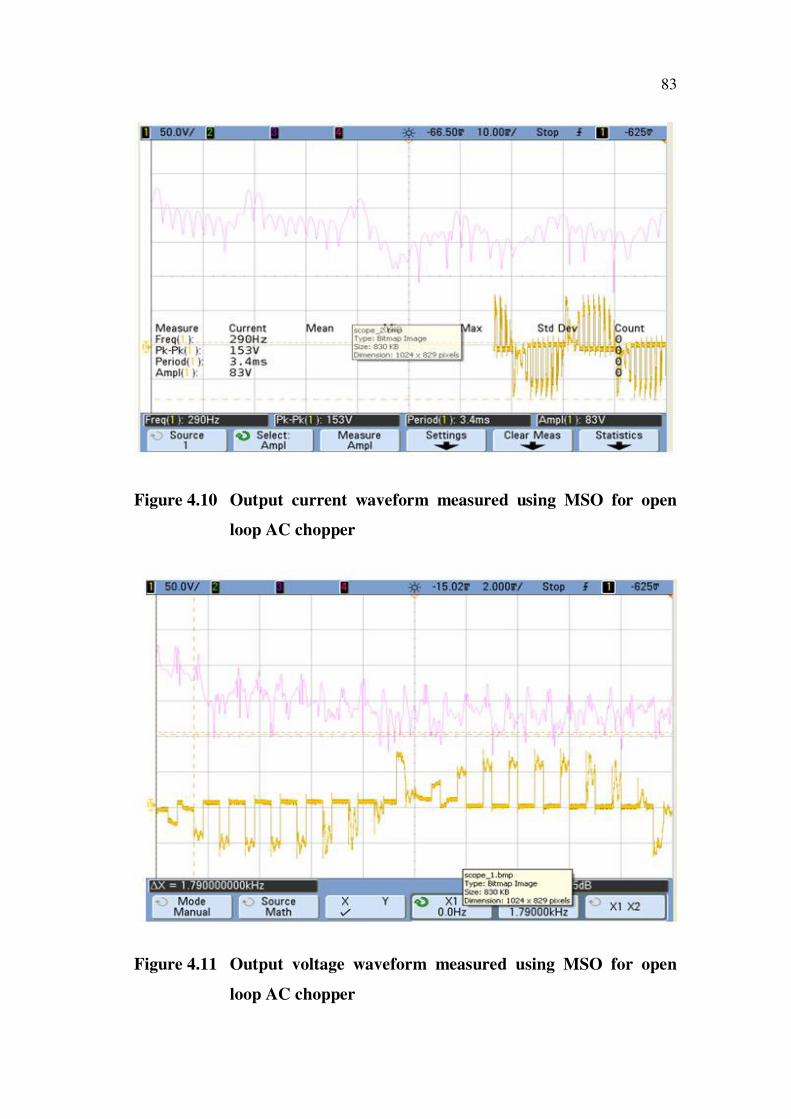
present in the waveform. The output waveforms measured using Mixed
Signal Oscilloscope (MSO) for open loop AC chopper is presented in Figure
4.10 and Figure 4.11.
83
Figure 4.10 Output current waveform measured using MSO for open
loop AC chopper
Figure 4.11 Output voltage waveform measured using MSO for open
loop AC chopper
84
4.5.2 Closed loop PWM AC Chopper
The performance of the PWM AC chopper is observed under
closed loop condition in this section. The PWM AC chopper circuit is
simulated using MATLAB/Simulink. The simulation results are presented.
4.5.2.1 Results of Simulation
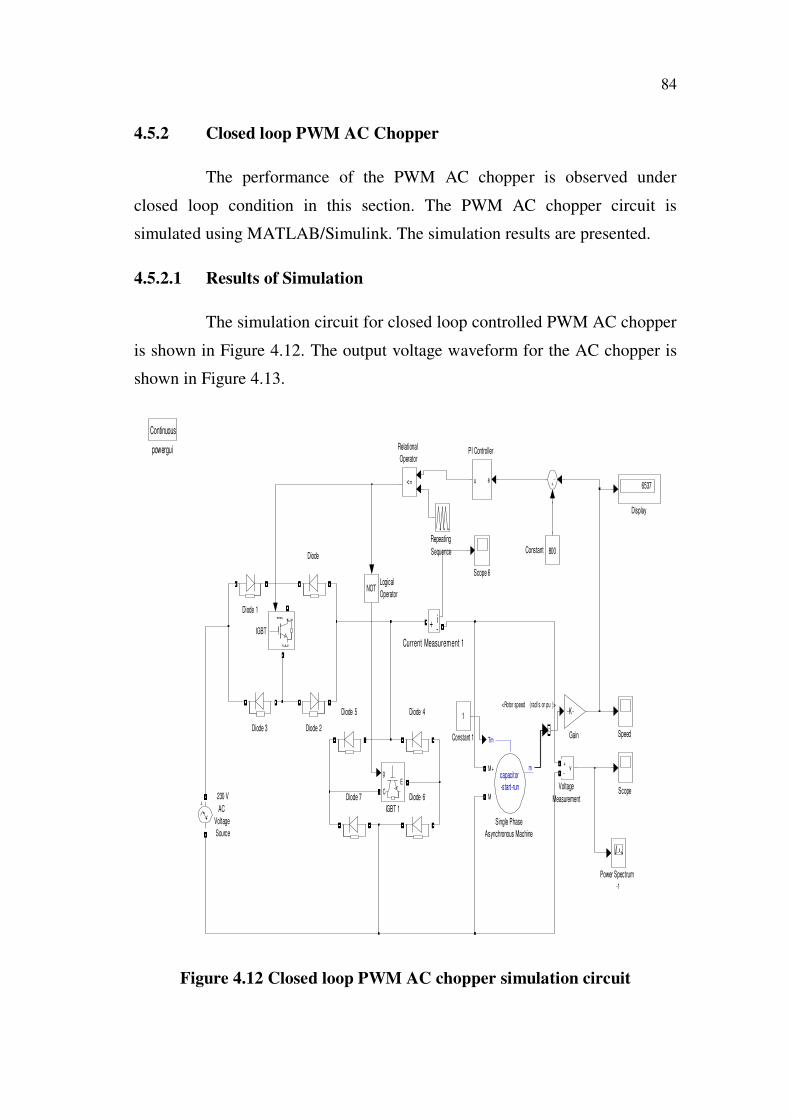
The simulation circuit for closed loop controlled PWM AC chopper
is shown in Figure 4.12. The output voltage waveform for the AC chopper is
shown in Figure 4.13.
powergui
Continuous
Voltage
Measurement
v+
-
Speed
Single Phase
Asynchronous Machine
Tm
mM+
M
capacitor
-start-run
Scope 6
Scope
Repeating
Sequence
Relational
Operator
<=
Power Spectrum
-1
PI Controller
eu
Logical
OperatorNOT
IGBT 1
g
C
E
IGBT
g CE
Gain
-K-
Display
6537
Diode 7 Diode 6
Diode 5 Diode 4
Diode 3 Diode 2
Diode 1
Diode
Current Measurement 1
i+-
Constant 1
1
Constant 800
230 V
AC
Voltage
Source
<Rotor speed (rad/s or pu )>
Figure 4.12 Closed loop PWM AC chopper simulation circuit
85
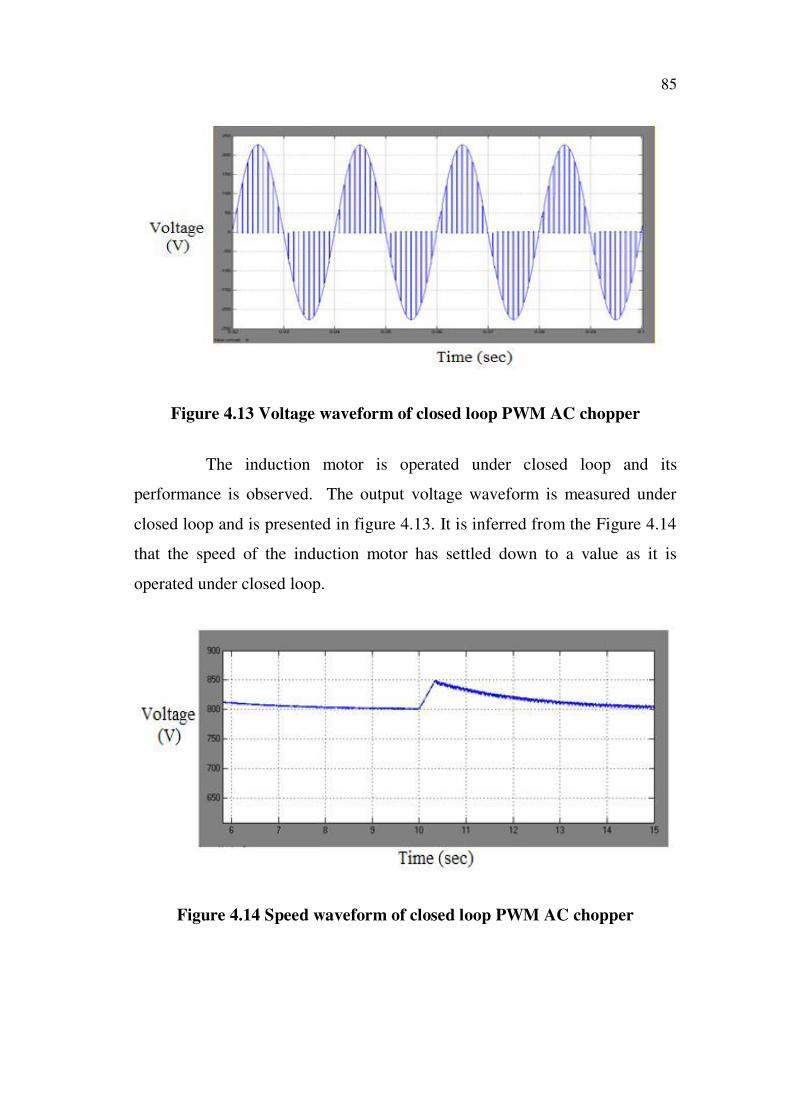
Figure 4.13 Voltage waveform of closed loop PWM AC chopper
The induction motor is operated under closed loop and its
performance is observed. The output voltage waveform is measured under
closed loop and is presented in figure 4.13. It is inferred from the Figure 4.14
that the speed of the induction motor has settled down to a value as it is
operated under closed loop.
Figure 4.14 Speed waveform of closed loop PWM AC chopper
86
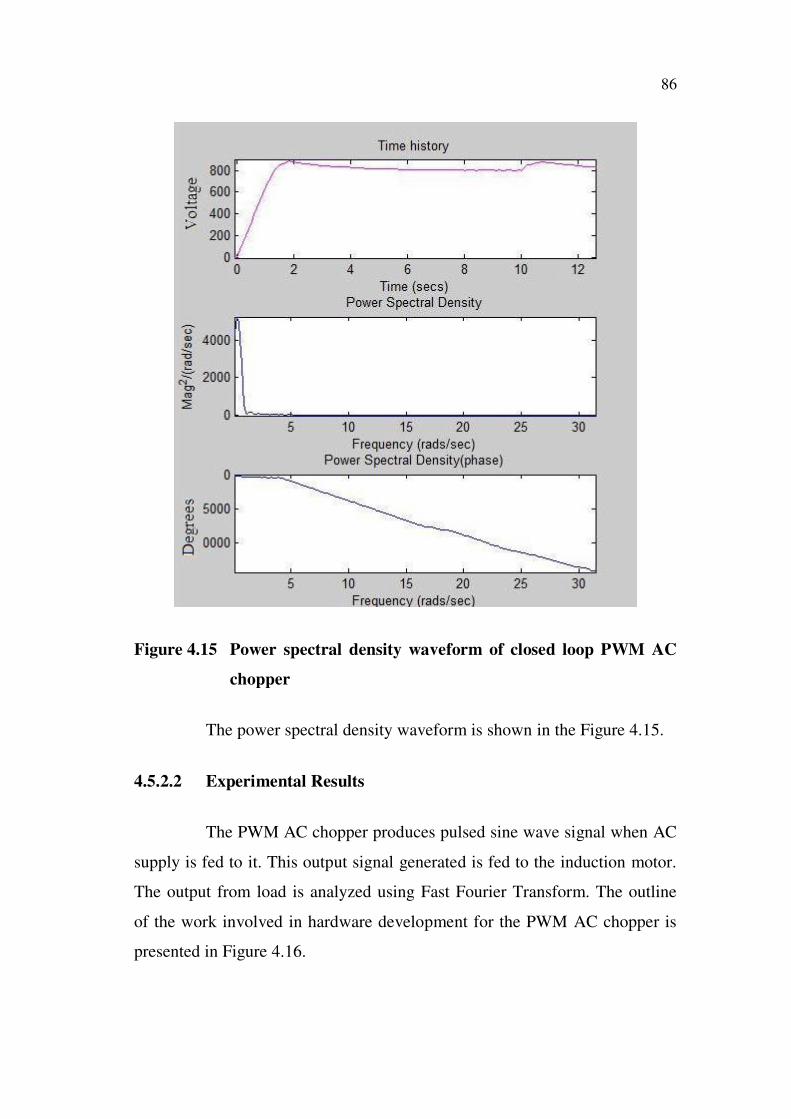
Figure 4.15 Power spectral density waveform of closed loop PWM AC
chopper
The power spectral density waveform is shown in the Figure 4.15.
4.5.2.2 Experimental Results
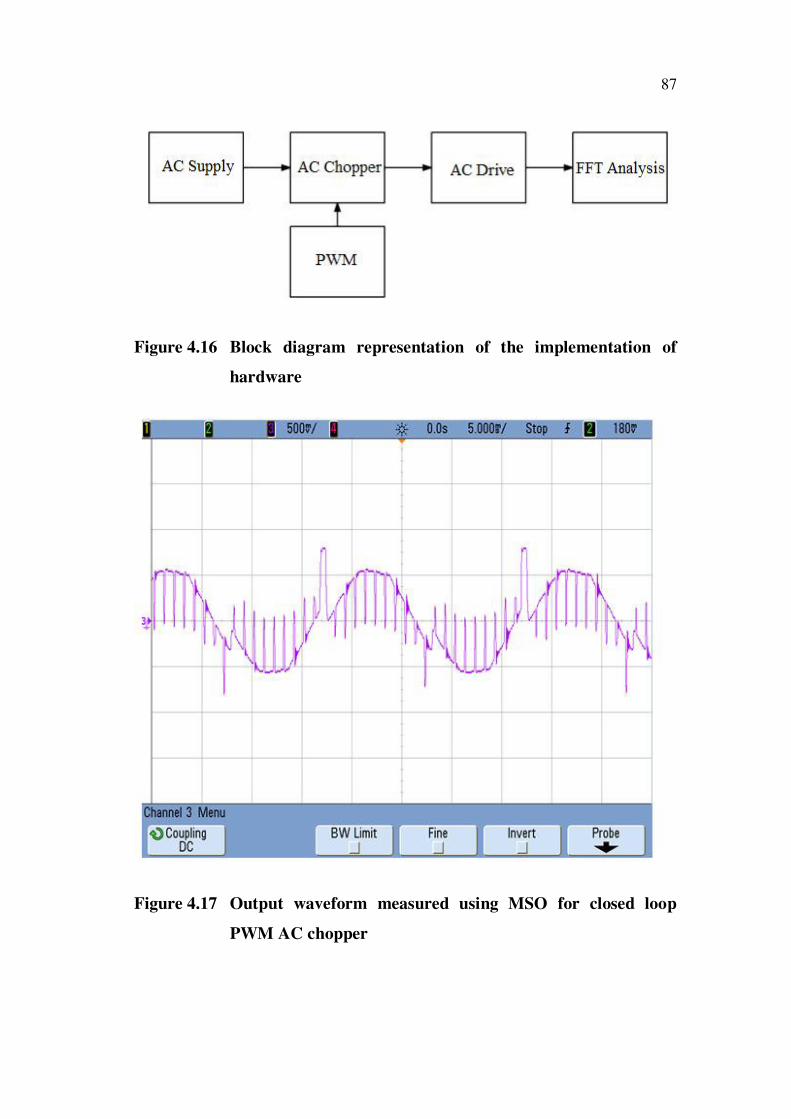
The PWM AC chopper produces pulsed sine wave signal when AC
supply is fed to it. This output signal generated is fed to the induction motor.
The output from load is analyzed using Fast Fourier Transform. The outline
of the work involved in hardware development for the PWM AC chopper is
presented in Figure 4.16.
87
Figure 4.16 Block diagram representation of the implementation of
hardware
Figure 4.17 Output waveform measured using MSO for closed loop
PWM AC chopper
88
The Figure 4.17 represents the output waveforms measured using
MSO for closed loop AC chopper. This section presents the overall view of
closed loop operation of the PWM AC chopper and also its performance
analysis.
4.5.3 Fast Fourier Transform
FFT is a mathematical algorithm that is used to indicate any
algorithm attempting to determine the power versus frequency graph for a
signal. FFT is also used for digital signal processing and to remove or
enhance patterns of periodic noise in an image or other related signals.
4.5.3.1 Implementation of FFT
Under some operating conditions, power system devices exhibit
nonlinear characteristics such as magnetic saturation, resulting in distorted
voltage and current waveforms that can interfere with other devices on the
power system. The first step in controlling the distortions is measuring them
accurately.
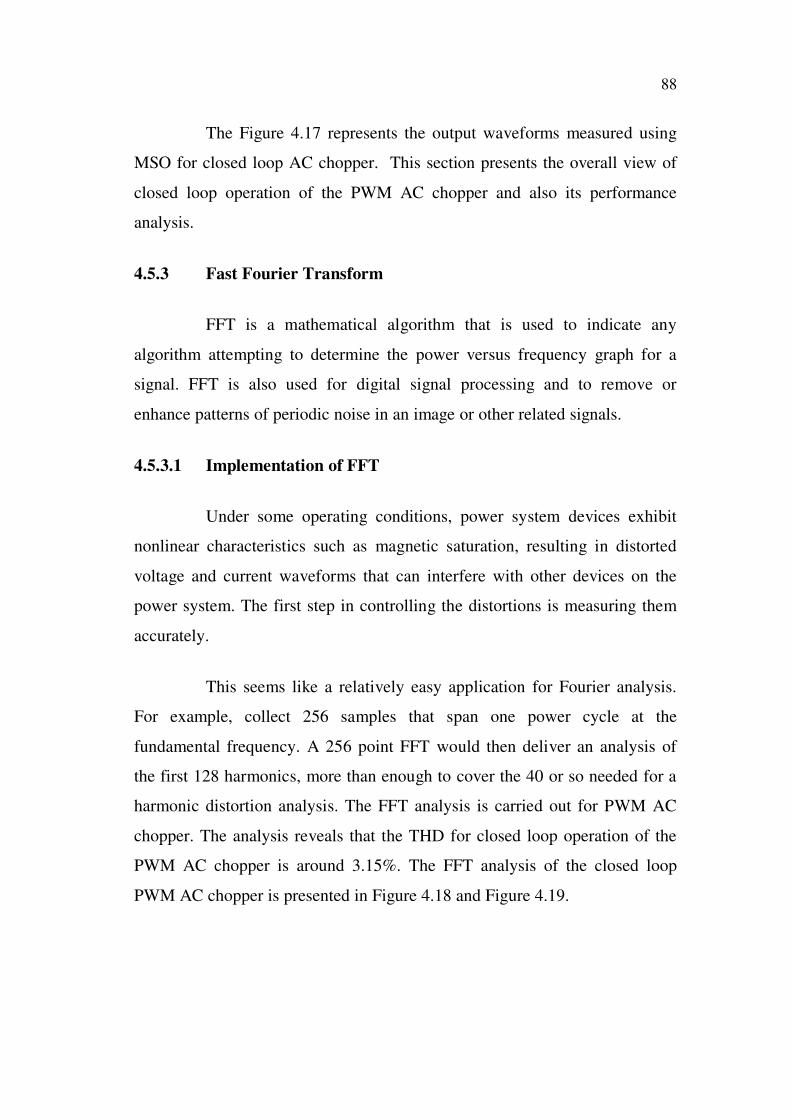
This seems like a relatively easy application for Fourier analysis.
For example, collect 256 samples that span one power cycle at the
fundamental frequency. A 256 point FFT would then deliver an analysis of
the first 128 harmonics, more than enough to cover the 40 or so needed for a
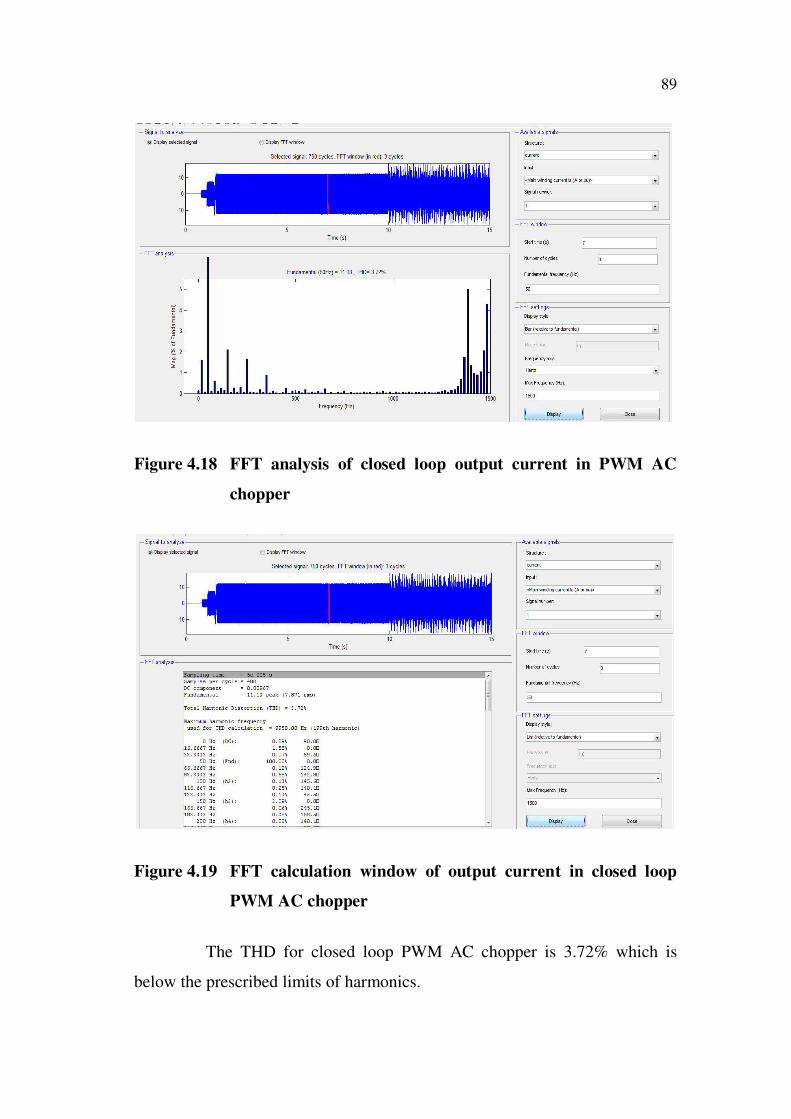
harmonic distortion analysis. The FFT analysis is carried out for PWM AC
chopper. The analysis reveals that the THD for closed loop operation of the
PWM AC chopper is around 3.15%. The FFT analysis of the closed loop
PWM AC chopper is presented in Figure 4.18 and Figure 4.19.
89
Figure 4.18 FFT analysis of closed loop output current in PWM AC
chopper
Figure 4.19 FFT calculation window of output current in closed loop
PWM AC chopper
The THD for closed loop PWM AC chopper is 3.72% which is
below the prescribed limits of harmonics.
90
4.6 COMPARSION OF HARMONIC CONTENT IN OPEN
LOOP AND CLOSED LOOP TECHNIQUE
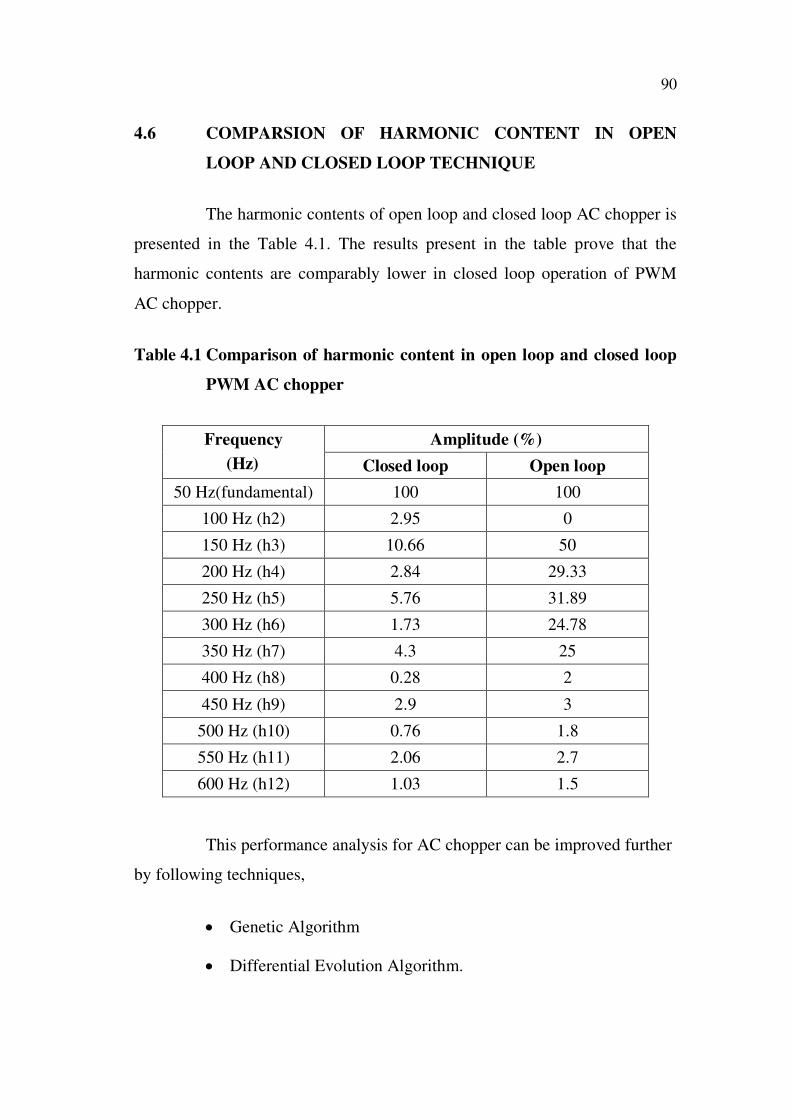
The harmonic contents of open loop and closed loop AC chopper is
presented in the Table 4.1. The results present in the table prove that the
harmonic contents are comparably lower in closed loop operation of PWM
AC chopper.
Table 4.1 Comparison of harmonic content in open loop and closed loop
PWM AC chopper
Frequency
(Hz)
Amplitude (%)
Closed loop Open loop
50 Hz(fundamental) 100 100
100 Hz (h2) 2.95 0
150 Hz (h3) 10.66 50
200 Hz (h4) 2.84 29.33
250 Hz (h5) 5.76 31.89
300 Hz (h6) 1.73 24.78
350 Hz (h7) 4.3 25
400 Hz (h8) 0.28 2
450 Hz (h9) 2.9 3
500 Hz (h10) 0.76 1.8
550 Hz (h11) 2.06 2.7
600 Hz (h12) 1.03 1.5
This performance analysis for AC chopper can be improved further
by following techniques,
Genetic Algorithm
Differential Evolution Algorithm.
91
4.7 OPTIMIZING THE PERFORMANCE OF PWM AC
CHOPPER
As optimization methods evolve, new methods appear which are
based on other methods but may outperform them for specific problems. DE
is one of these relatively new techniques, which is an adapted version of a GA
incorporating vector differences for perturbing the vector population.
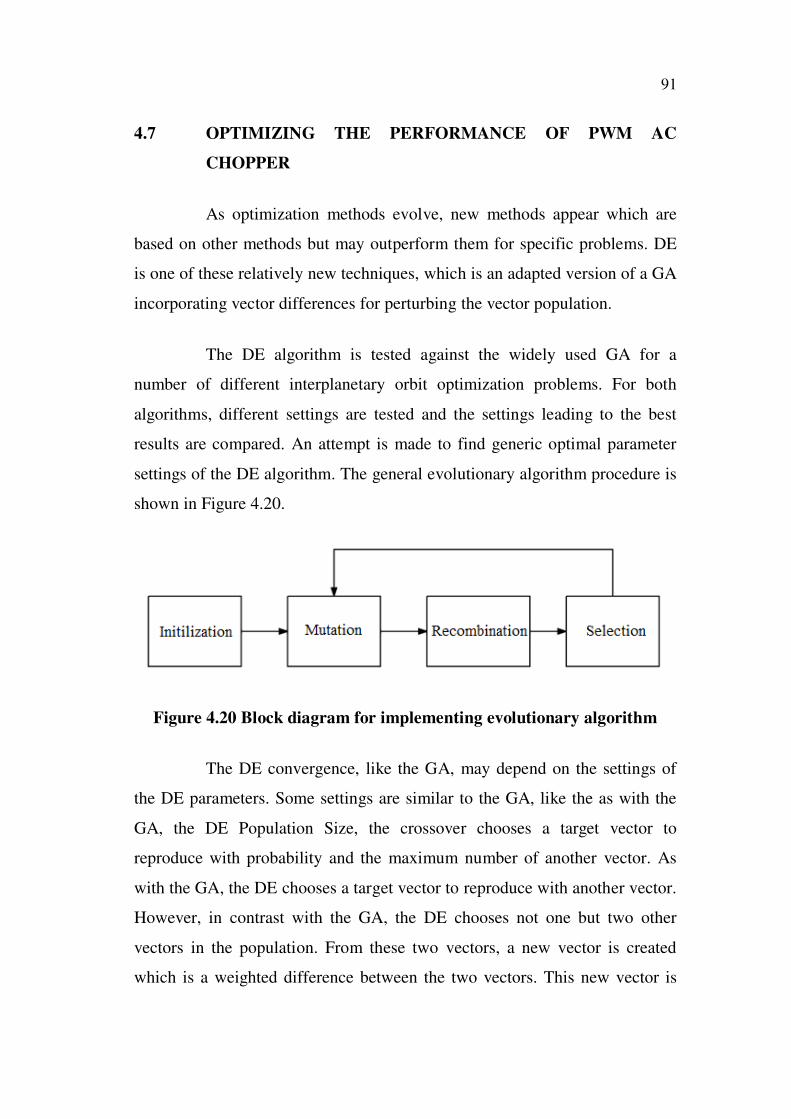
The DE algorithm is tested against the widely used GA for a
number of different interplanetary orbit optimization problems. For both
algorithms, different settings are tested and the settings leading to the best
results are compared. An attempt is made to find generic optimal parameter
settings of the DE algorithm. The general evolutionary algorithm procedure is
shown in Figure 4.20.
Figure 4.20 Block diagram for implementing evolutionary algorithm
The DE convergence, like the GA, may depend on the settings of
the DE parameters. Some settings are similar to the GA, like the as with the
GA, the DE Population Size, the crossover chooses a target vector to
reproduce with probability and the maximum number of another vector. As
with the GA, the DE chooses a target vector to reproduce with another vector.
However, in contrast with the GA, the DE chooses not one but two other
vectors in the population. From these two vectors, a new vector is created
which is a weighted difference between the two vectors. This new vector is
92
then added to a third randomly chosen vector. This is then the new vector to
‘mate’ with the first randomly chosen vector. After applying only a crossover
between these two vectors, the newly obtained vector is then compared to the
original (first that was randomly chosen) vector. The vector leading to the
highest objective is the one that passes on to the next generation. No mutation
is applied, which is another difference with the GA.
Evolutionary algorithms are optimization techniques that solve
problems using a simplified model of the evolution process. These algorithms
are based on the concept of a population of individuals that evolve and
improve their fitness through probabilistic operators like recombination and
mutation. These individuals are evaluated and those that perform better are
selected to compose the population in the next generation. After several
generations these individuals should improve their fitness as they explore the
solution space for the optimal value.
One extremely powerful algorithm from evolutionary computation
due to convergence characteristics and few control parameters is differential
evolution. Differential evolution is an optimization algorithm that solves real
valued problems using natural evolution using a population P of Np floating
point individuals that evolve over G generation s to reach an optimal solution.
Each individual or candidate solution is a vector that contains as many
parameters as the decision variables D. In differential evolution, the
population P remains constant throughout the optimization process. The steps
that are involved in differential evolution are being summarized here.
Step 1
Select the control variables, population size Np, scaling factor F,
crossover constant CR
93
Here the control variables are the switching angles of the switch S1
in the circuit. There are m number of switching angles that are chosen which
will act as the control variables, population size Np is five, scaling factor can
range from 0 to 1, crossover constant also ranges from 0 to1. Based on all
these data the initial population matrix is generated based on the given
formula below. The matrix size depends on the control variables D and
population size Np.
(0) min max min
j,i j j j j PX X X X ,i 1,....N ; j 1,...,D (4.6)
Step 2
The initial population matrix (different values of optimum angles)
consists of number of vectors. Select the target vector from the initial
population matrix. The target vector that is chosen should be satisfying a
condition i.e., the target vector that is chose should be different from the other
vectors that constitute the initial population matrix.
Step3
Three other random indices should be chosen which are different
from the target vector. The random indices are also vectors form the initial
population matrix (which forms another set of switching angles).
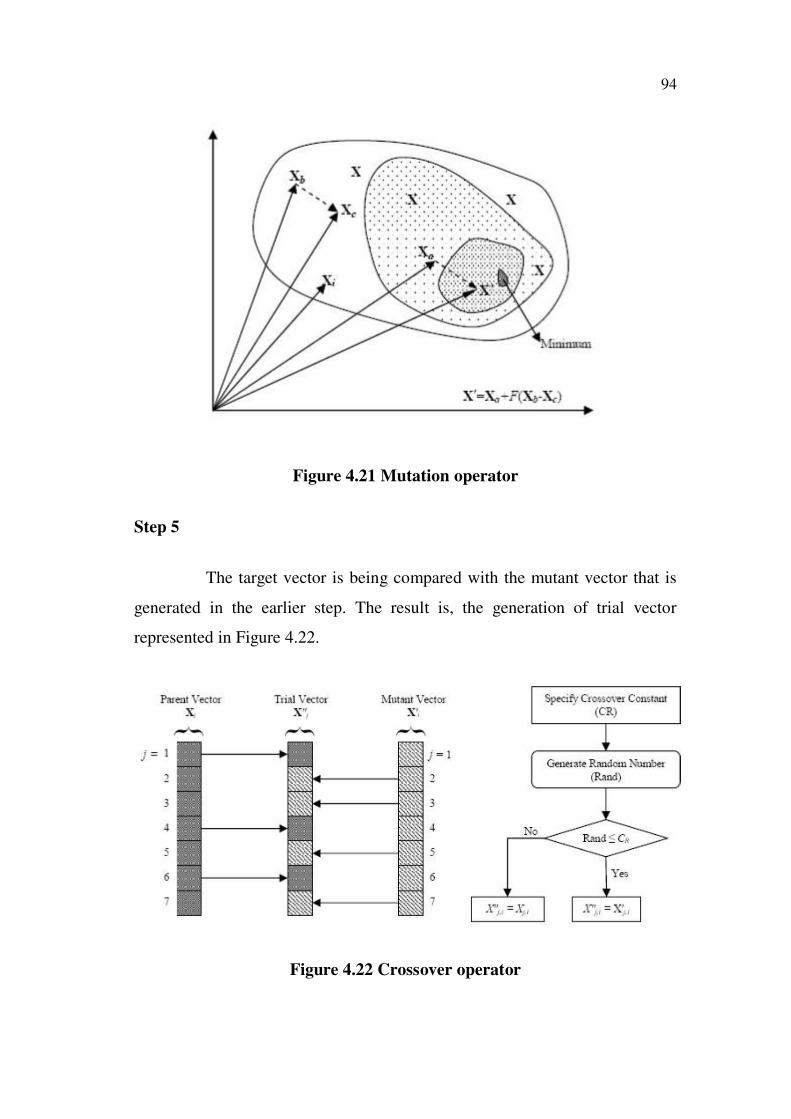
Step 4
A mutant vector represented in Figure 4.21 is created based upon
the random indices that are chosen. The mutant vector is created based upon
the formula stated below.
'(G) (G) (G) (G)
i a b c PX X F X X , i 1,....N (4.7)
94
Figure 4.21 Mutation operator
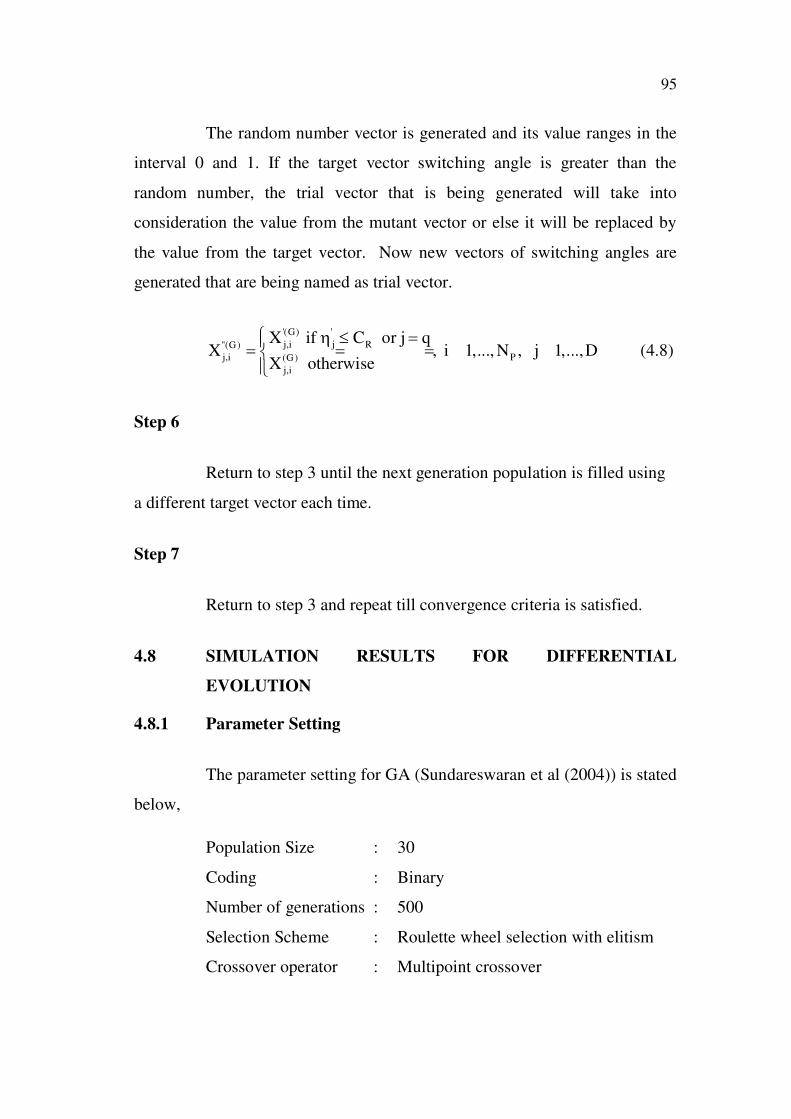
Step 5
The target vector is being compared with the mutant vector that is
generated in the earlier step. The result is, the generation of trial vector
represented in Figure 4.22.
Figure 4.22 Crossover operator
95
The random number vector is generated and its value ranges in the
interval 0 and 1. If the target vector switching angle is greater than the
random number, the trial vector that is being generated will take into
consideration the value from the mutant vector or else it will be replaced by
the value from the target vector. Now new vectors of switching angles are
generated that are being named as trial vector.
'(G) '
j,i j R"(G)
j,i P(G)
j,i
X if C or j qX , i 1,..., N , j 1,...,D
X otherwise (4.8)
Step 6
Return to step 3 until the next generation population is filled using
a different target vector each time.
Step 7
Return to step 3 and repeat till convergence criteria is satisfied.
4.8 SIMULATION RESULTS FOR DIFFERENTIAL
EVOLUTION
4.8.1 Parameter Setting
The parameter setting for GA (Sundareswaran et al (2004)) is stated
below,
Population Size : 30
Coding : Binary
Number of generations : 500
Selection Scheme : Roulette wheel selection with elitism
Crossover operator : Multipoint crossover
96
Crossover probability : 0.8
Mutation probability : 0.06
Termination criterion : 500
The parameter setting for DE is stated below,
Decision variables : 5
Population size : 75
Scaling constant : 0.9
Crossover constant : 0.8
Number of generations : 10000
The optimization task of reduction of harmonics in the output
voltage is realized with the help of coding written in C language in
MATLAB. The parameters of DE such as crossover constant, mutation
probability, population size and the number of generations are selected based
on the values by trial and error process, which is discussed in the following
section.
The parameters of DE such as population size, scaling constant and
cross over constant are selected by trial and error, such that they may yield the
best optimal solution. The decision variables are selected depending on the
problem under consideration.
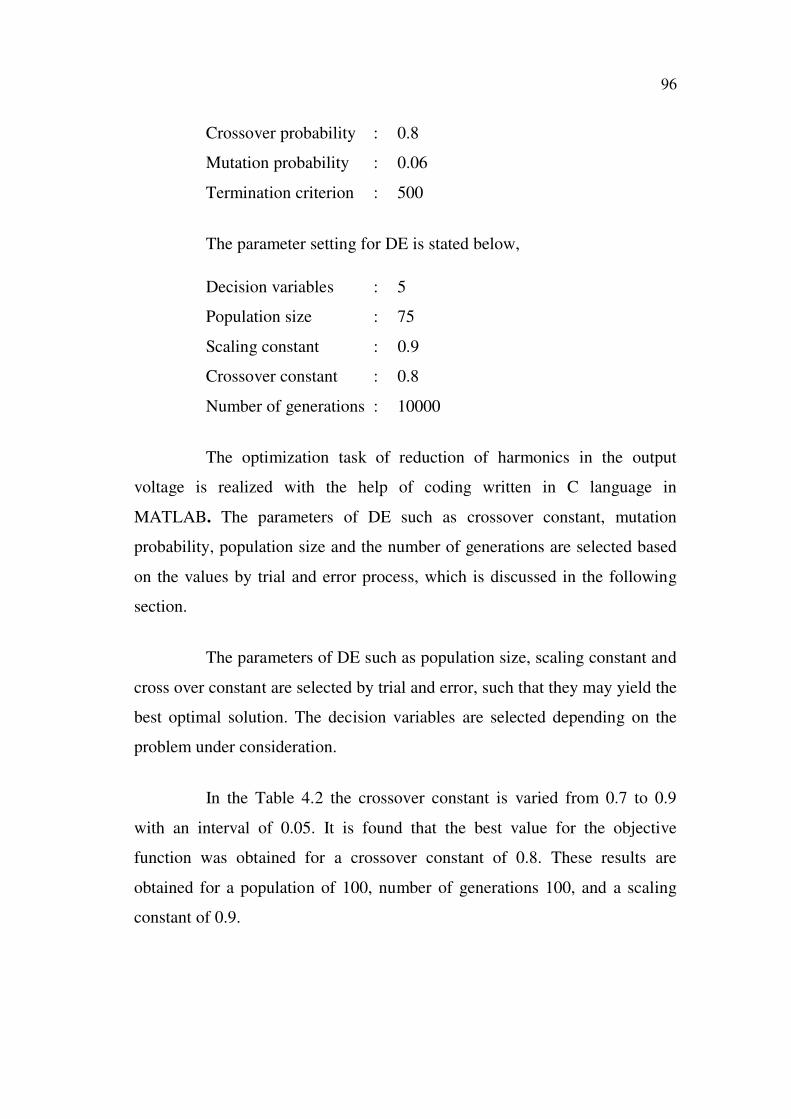
In the Table 4.2 the crossover constant is varied from 0.7 to 0.9
with an interval of 0.05. It is found that the best value for the objective
function was obtained for a crossover constant of 0.8. These results are
obtained for a population of 100, number of generations 100, and a scaling
constant of 0.9.
97
Table 4.2 Comparison of number of generations and F ( )
Cross over
constant
Population
size
Number of
generations
Scaling
constant
Best F( )
value
0.7 100 100 0.9 0.0272
0.75 100 100 0.9 0.0510
0.8 100 100 0.9 0.0206
0.85 100 100 0.9 0.0319
0.9 100 100 0.9 0.0253
From the Table 4.2, it is found that the best optimal solution could
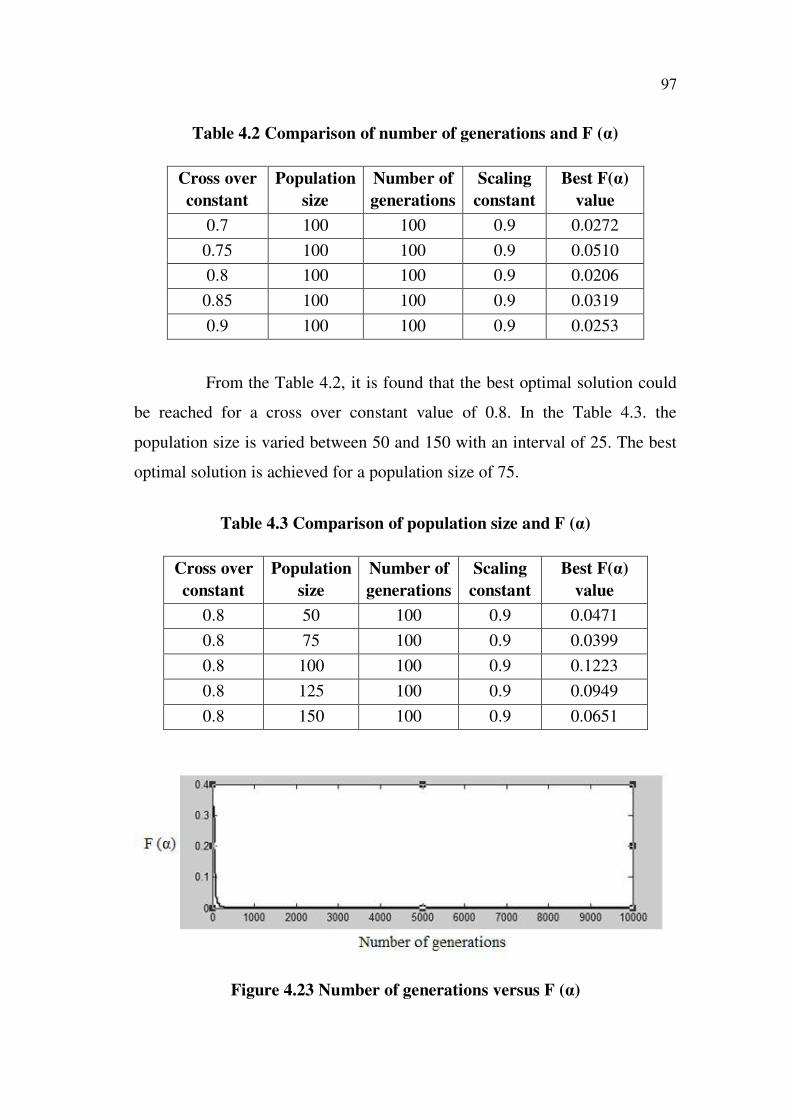
be reached for a cross over constant value of 0.8. In the Table 4.3. the
population size is varied between 50 and 150 with an interval of 25. The best
optimal solution is achieved for a population size of 75.
Table 4.3 Comparison of population size and F ( )
Cross over
constant
Population
size
Number of
generations
Scaling
constant
Best F( )
value
0.8 50 100 0.9 0.0471
0.8 75 100 0.9 0.0399
0.8 100 100 0.9 0.1223
0.8 125 100 0.9 0.0949
0.8 150 100 0.9 0.0651
Figure 4.23 Number of generations versus F ( )
98
In the Figure 4.23 the graph is plotted between number of
generations taken along the x axis and F ( ) along the y axis. It is found that
the F ( ) value significantly drops as the number of generations increase. It
has a faster convergence rate when compared to the earlier methods of
evolutionary computation such as GA for the task of extenuating the voltage
harmonics.
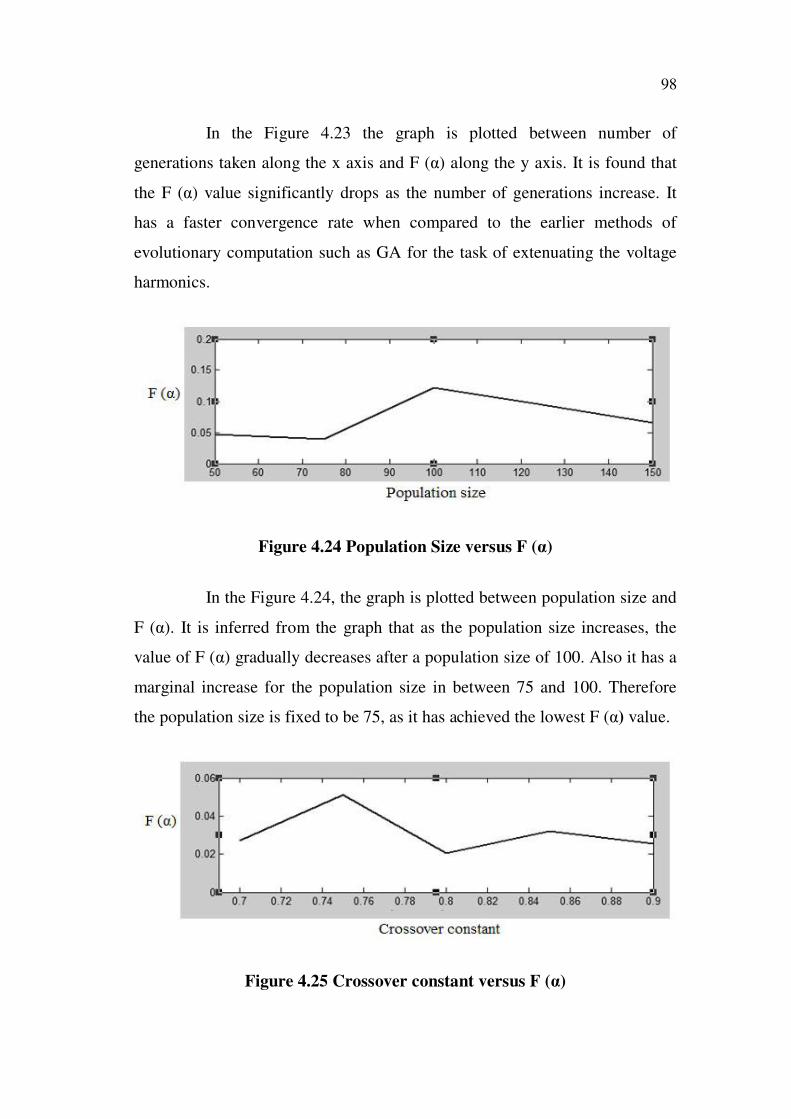
Figure 4.24 Population Size versus F ( )
In the Figure 4.24, the graph is plotted between population size and
F ( ). It is inferred from the graph that as the population size increases, the
value of F ( ) gradually decreases after a population size of 100. Also it has a
marginal increase for the population size in between 75 and 100. Therefore
the population size is fixed to be 75, as it has achieved the lowest F ( ) value.
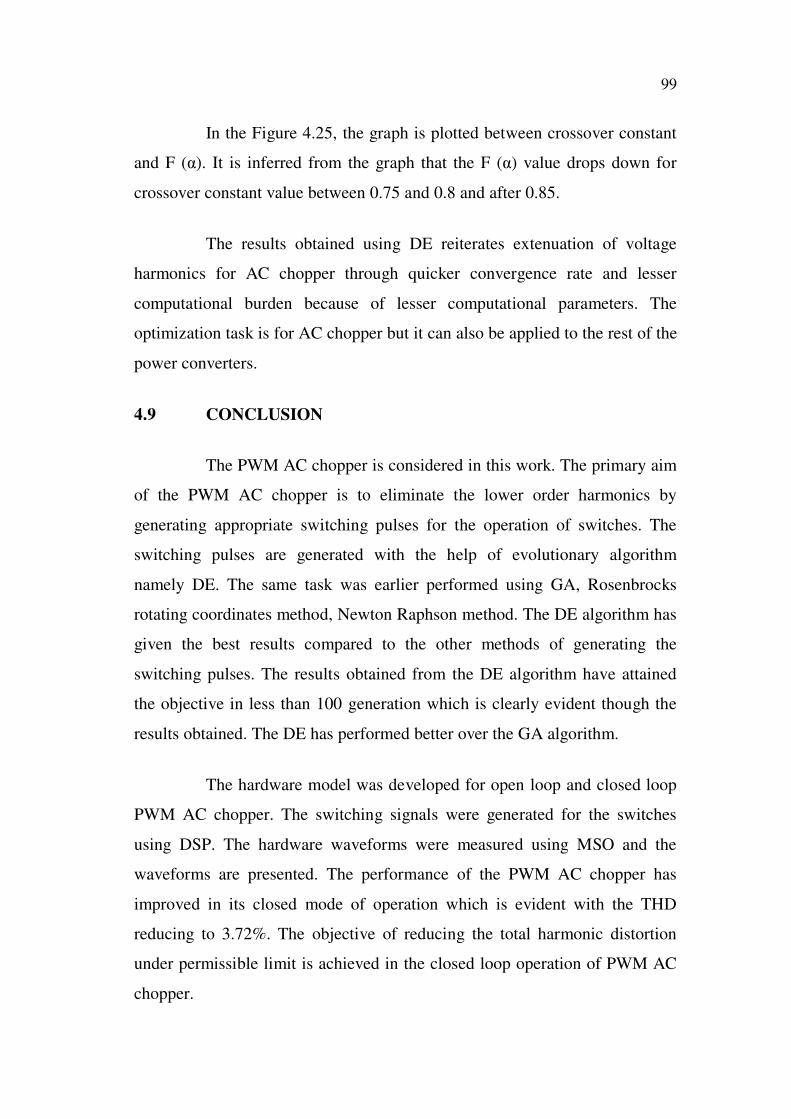
Figure 4.25 Crossover constant versus F ( )
99
In the Figure 4.25, the graph is plotted between crossover constant
and F ( ). It is inferred from the graph that the F ( ) value drops down for
crossover constant value between 0.75 and 0.8 and after 0.85.
The results obtained using DE reiterates extenuation of voltage
harmonics for AC chopper through quicker convergence rate and lesser
computational burden because of lesser computational parameters. The
optimization task is for AC chopper but it can also be applied to the rest of the
power converters.
4.9 CONCLUSION
The PWM AC chopper is considered in this work. The primary aim
of the PWM AC chopper is to eliminate the lower order harmonics by
generating appropriate switching pulses for the operation of switches. The
switching pulses are generated with the help of evolutionary algorithm
namely DE. The same task was earlier performed using GA, Rosenbrocks
rotating coordinates method, Newton Raphson method. The DE algorithm has
given the best results compared to the other methods of generating the
switching pulses. The results obtained from the DE algorithm have attained
the objective in less than 100 generation which is clearly evident though the
results obtained. The DE has performed better over the GA algorithm.
The hardware model was developed for open loop and closed loop
PWM AC chopper. The switching signals were generated for the switches
using DSP. The hardware waveforms were measured using MSO and the
waveforms are presented. The performance of the PWM AC chopper has
improved in its closed mode of operation which is evident with the THD
reducing to 3.72%. The objective of reducing the total harmonic distortion
under permissible limit is achieved in the closed loop operation of PWM AC
chopper.