chapter 3 mathematical sciences bachelors degrees and
TRANSCRIPT
75
Mathematics and statistics departments in the nation’s four-year colleges and universities offer a wide spectrum of undergraduate mathematical sciences courses and majors, sometimes including mathematics education, actuarial science, operations research, and computer science as well as mathematics and statis-tics. This chapter’s fourteen tables describe
• thenumberofbachelorsdegreesawardedthroughthe nation’s mathematics and statistics depart-ments(TableE.1),
• enrollments in mathematical sciences courses(TablesE.2–E.4),
• thekindsofinstructorswhoteachundergraduatecoursesinmathematicsandstatisticsdepartments(TablesE.5–E.12),and
• averageclasssizesandaveragesizesofrecitationsectionsusedinlecture/recitationclasses(TablesE.13–E.14).
Because there is considerable variation among departmental practices based on highest degree offered, we present the data by type of department as well as by level and type of course.
The tables in this chapter expand upon Tables S.2 and S.4 of Chapter 1, and Chapter 5 provides addi-tional detail about first-year courses. Mathematics and statistics courses and enrollments in two-year colleges are discussed in Chapter 6.
Highlights
• The total number of mathematical sciencesbachelors degrees granted through the nation’smathematics and statistics departments in the2004–2005academicyearwasaboutfivepercentbelowthenumbergrantedfiveyearsearlier.Thiswascausedbysharpdeclinesinbachelorsdegreesinmathematics education and computer sciencethatweregrantedthroughmathematicsandstatis-tics departments, declines that more than offsetincreases in the numbers of mathematics andstatisticsmajors.SeeTableE.1.
• Hiddenwithinthefivepercentdecreaseinoverallmathematical sciences bachelors degrees was amajorshiftinthesourceofmathematicalsciences
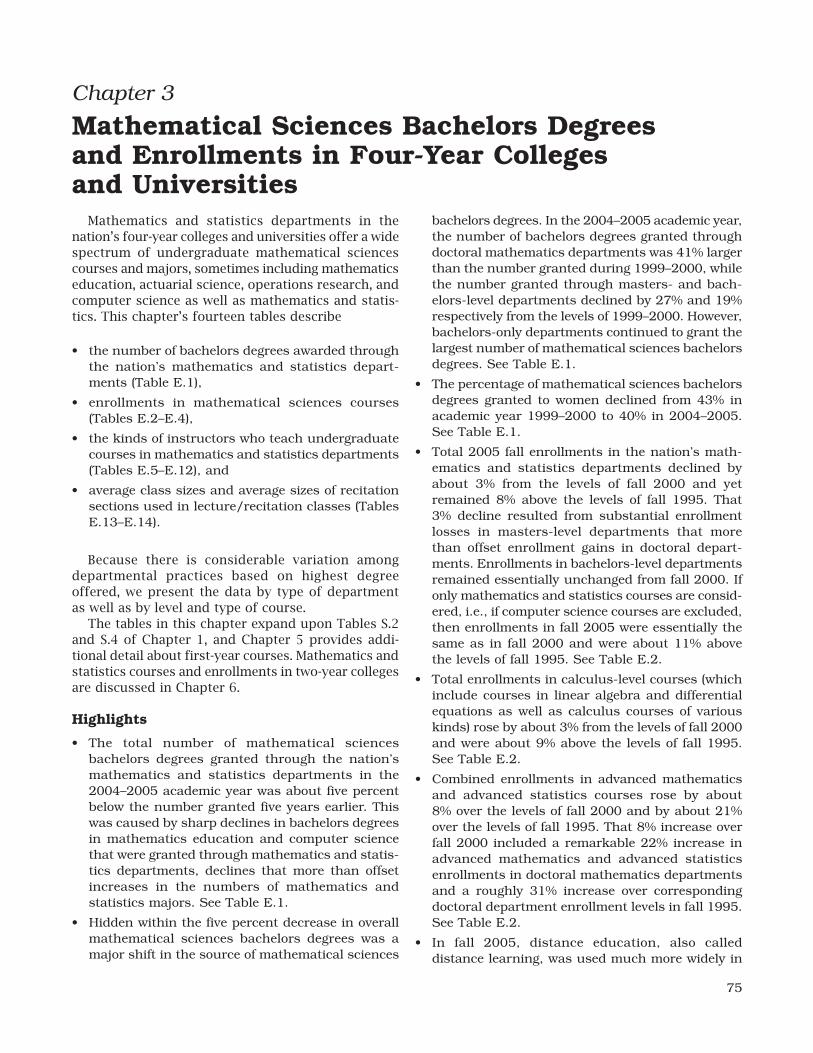
bachelorsdegrees.Inthe2004–2005academicyear,thenumberofbachelorsdegreesgrantedthroughdoctoralmathematicsdepartmentswas41%largerthanthenumbergrantedduring1999–2000,whilethenumbergrantedthroughmasters-andbach-elors-leveldepartmentsdeclinedby27%and19%respectivelyfromthelevelsof1999–2000.However,bachelors-onlydepartmentscontinuedtograntthelargestnumberofmathematicalsciencesbachelorsdegrees.SeeTableE.1.
• Thepercentageofmathematicalsciencesbachelorsdegrees granted towomendeclined from43% inacademicyear1999–2000to40%in2004–2005.SeeTableE.1.
• Total2005fallenrollmentsinthenation’smath-ematics and statistics departments declined byabout 3% from the levels of fall 2000 and yetremained 8% above the levels of fall 1995. That3% decline resulted from substantial enrollmentlosses in masters-level departments that morethan offset enrollment gains in doctoral depart-ments.Enrollmentsinbachelors-leveldepartmentsremainedessentiallyunchangedfromfall2000.Ifonlymathematicsandstatisticscoursesareconsid-ered,i.e.,ifcomputersciencecoursesareexcluded,thenenrollmentsinfall2005wereessentiallythesameas in fall2000andwereabout11%abovethelevelsoffall1995.SeeTableE.2.
• Totalenrollmentsincalculus-levelcourses(whichincludecourses in linearalgebraanddifferentialequations aswell as calculus courses of variouskinds)rosebyabout3%fromthelevelsoffall2000andwereabout9%abovethe levelsof fall1995.SeeTableE.2.
• Combined enrollments in advancedmathematicsand advanced statistics courses rose by about8%overthelevelsoffall2000andbyabout21%overthelevelsoffall1995.That8%increaseoverfall2000includedaremarkable22%increase inadvanced mathematics and advanced statisticsenrollmentsindoctoralmathematicsdepartmentsand a roughly 31% increase over correspondingdoctoraldepartmentenrollmentlevelsinfall1995.SeeTableE.2.
• In fall 2005, distance education, also calleddistancelearning,wasusedmuchmorewidelyin
Chapter 3
Mathematical Sciences Bachelors Degrees and Enrollments in Four-Year Colleges and Universities

76 2005 CBMS Survey of Undergraduate Programs
two-year colleges than in four-year colleges anduniversities.(CBMSstudies,includingCBMS2005,havedefineddistanceeducationasany teachingmethodinwhichatleasthalfofthestudentsinacoursereceivethemajorityoftheirinstructioninsituations where the instructor is not physicallypresent.)Abouttwo-tenthsofonepercentofenroll-mentsinCalculusIcoursesinfour-yearcollegesand universities in fall 2005 were taught usingdistanceeducationtechniques,comparedtoabout5%ofCalculusIenrollmentsintwo-yearcolleges.Inelementarystatisticscourses,abouttwopercentof enrollments in themathematicsandstatisticsdepartmentsoffour-yearcollegesanduniversitiesweretaughtusingdistancelearning,comparedtoover8%ofcorrespondingenrollmentsintwo-yearcolleges.SeeTableE.4.
• The decline in the percentage of mathematicalscience courses taught by tenured and tenure-eligible faculty that was observed in CBMS2000continued, coupled with an increase in thepercentage of courses taught by “other full-timefaculty,”acategorythatincludespostdocs,visitingfaculty,andalargecohortofnon-doctoralfull-timefaculty.SeeTablesE.5throughE.12.
• Exceptinadvanced-levelcourses,averagesectionsizes in mathematical science courses declinedslightly from the levels recorded in CBMS2000but remained above the size recommended byMathematical Association of America guidelines[MAAGuidelines].SeeTableE.13.
• CBMS2005presentsdataonthesizeofrecitationsectionsusedincalculusandelementarystatisticscoursestaughtinthelecture/recitationformat(seeTable E.14), and distinguishes between doctoralandnon-doctoralfacultyinastudyofwhoteachesfreshmanandsophomorecourses.SeeTablesE.6throughE.12.
Terminology: The two preceding CBMS surveyreportsarecalledCBMS1995andCBMS2000.
RecallthatinCBMS2005,theterm“mathematicsdepartment” includes departments of mathematics,applied mathematics, mathematical sciences, anddepartments of mathematics and statistics. Theterm“statisticsdepartment”referstodepartmentsofstatisticsthatofferundergraduatestatisticscourses.Theterm“mathematicalsciencescourses”coversallcoursesthataretaughtbythenation’smathematicsand statistics departments and includes coursesin mathematics education, actuarial sciences, andoperationsresearchtaughtinamathematicsorstatis-ticsdepartment,aswellascoursesinmathematics,appliedmathematics,andstatistics.Computersciencecourses (and majors) are included in CBMS2005totalswhen the courses (andmajors) are taught in
(grantedthrough)amathematicsorstatisticsdepart-ment.CBMS2005datadoesnotincludeanycoursesor majors that are taught in, or granted through,separate departments of computer science, actu-arialscience,operationsresearch,etc.Departmentsareclassifiedonthebasisofhighestdegreeoffered.Forexample, the term “bachelors-leveldepartment”referstoonethatdoesnotoffermastersordoctoraldegrees.
Table E.1: Bachelors degrees granted between July 1, 2004 and June 30, 2005
CBMS2000 revealed a one percent decrease inthe number of bachelors degrees awarded throughthenation’smathematicsandstatisticsdepartmentsbetweenthe1994–1995academicyearandthe1999–2000academicyear.CBMS2005foundacontinuationof that trend, with the total number of bachelorsdegrees granted through the nation’s mathematicsandstatisticsdepartmentsdroppingfrom22,614inthe1999–2000academicyearto21,440inthe2004–2005academicyear,adeclineofabout5%.
If one looks only at the nation’s mathematicsdepartments(whichgrantedabout97%ofthe21,440U.S.bachelorsdegreesinmathematicsandstatistics),oneseesavarietyofbachelorsdegreeprogramsinabroadrangeofmathematicalsciences—mathematics,applied mathematics, statistics, actuarial science,mathematics education, and (particularly amongdepartments in four-year colleges) also computerscience. The total number of bachelors degreesgranted through the nation’s mathematics depart-mentsdeclinedslightly(aboutone-halfof1%)betweenthe1995and2000CBMSsurveysandfellbyanother6%between2000and2005,withtheresultthatthetotal number of bachelors degrees granted throughmathematicsdepartmentsinthe2004–2005academicyear was about 94% of the number granted in the1994–1995academicyear.
The number of statistics majors receiving theirbachelorsdegreesthroughstatisticsdepartmentsinthe2004–2005academicyearrosebyabout56%fromthelevelsreportedinCBMS2000for1999–2000andwasabout9%abovethe1994–1995level.Althoughthisgrowthrateisimpressive,itdoesnothaveamajorimpactonthetotalnumberofmathematicalsciencesbachelorsdegreesproducedintheU.S.becausebach-elorsdegreesawardedthroughstatisticsdepartmentsmakeuplessthan3%ofthenation’stotalnumberofmathematicsandstatisticsmajors.
TableE.1presentsdataonseveralsubcategoriesof the broad mathematical sciences major withinmathematics departments. Mathematics education,statistics,andcomputersciencearelistedseparately,withallothermajorsgranted throughmathematicsdepartmentslumpedintothemathematicscategory.Thenumberofmajorsinthatremaindercategoryrose

Enrollments in Four-Year Colleges and Universities 77
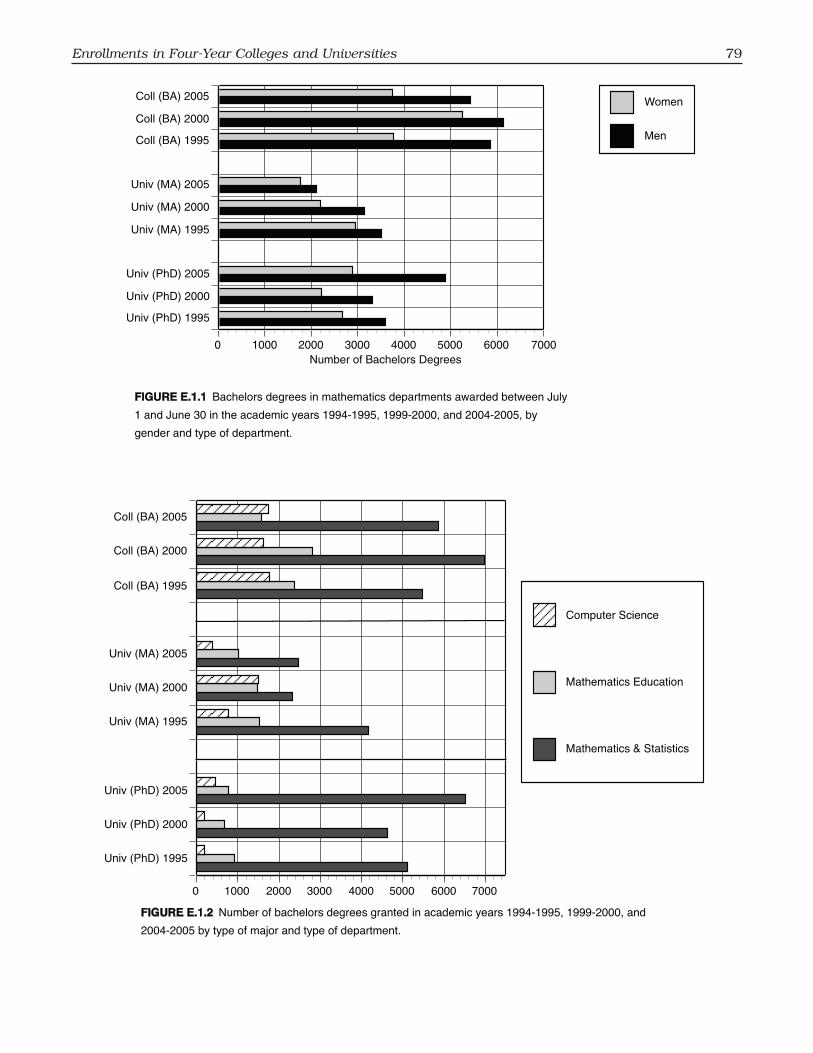
byabout7%overCBMS2000 levelsandwasabout2% higher in 2004–2005 than in 1994–1995. That7% increase was counterbalanced by decreases ineachoftheothersurveyedbachelors-degreecatego-ries(statistics,mathematicseducation,andcomputerscience)inmathematicsdepartments.Forexample,thenumberofmathematicseducationmajorsinmath-ematicsdepartmentsdecreasedfrom4,991reportedin CBMS2000 to 3,370 in CBMS2005, a decline ofabout 32%, and the number of computer sciencemajors graduating from mathematics departmentsfell from3,315 in the1999–2000academic year to2,604inthe2004–2005year,adeclineofabout21%.SeeFigureE.1.2.
Table E.1 in CBMS1995, CBMS2000, andCBMS2005canbeused tostudy thegenderdistri-butionofmathematicalsciencesbachelorsdegrees.Inthe1994–1995academicyear,about42%ofthemath-ematicalsciencesbachelorsdegreesgrantedthroughmathematicsandstatisticsdepartmentswereawardedtowomen,about43%in1999–2000,andabout40%inthe2004–2005academicyear.Thereissomevaria-tionbasedontypeofdepartment.Forexample,thepercentageofbachelorsdegreesawarded towomenbydoctoralmathematicsdepartmentsdeclinedfrom43% in 1994–1995 to 40% in 1999–2000, and to37% in 2004–2005. The corresponding percentagesin masters-only and bachelors-only mathematicsdepartments bounced around between 1994–1995and2004–2005anddonotrevealasteadytrend.Thepercentageofmathematicseducationdegreesawardedtowomenthroughmathematicsdepartmentsrosefrom49%in1994–1995toabout60%in2004–2005(withmost of the increase occurring between1994–1995and1999–2000).Amongcomputersciencebachelorsdegrees granted through mathematics departmentsin2004–2005,only18%wenttowomen,downfrom24%in1999–2000.Inthenation’sstatisticsdepart-ments,about38%ofbachelorsdegreeswereawardedtowomenin1994–1995,about43%in1999–2000,and about 42% in 2004–2005. In mathematicsdepartments,womenaccountedforabout48%ofallbachelorsdegreesawardedin2004–2005,downfrom59%in1999–2000.SeealsoFigureE.1.2.
Table E.1 reveals a potentially important shiftin the kinds of mathematics departments throughwhich mathematical sciences majors earned theirbachelors degrees. Figure E.1.3 shows a jump inthepercentage of all bachelors degrees frommath-
ematics departments that were awarded throughdoctoral mathematics departments, with a corre-spondingdropinthepercentageofbachelorsdegreesawardedbynon-doctoraldepartmentsbetween1999–2000and2004–2005.Thedeclinesformasters-levelmathematicsdepartmentsareparticularlylarge;thenumber of majors produced by those departmentsdropped 27% from levels reported in CBMS2000.Someofthatdeclinemayhavebeenaconsequenceofchangesbetween2000and2005intheAmericanMathematicalSociety(AMS)departmentalclassifica-tion that was the basis for CBMS studies in 2000and2005.However,CBMS2005isnotthefirstCBMSsurvey to report a major decline in the number ofbachelors degrees granted through masters-levelmathematics departments; CBMS2000 reported a17% decline in bachelors degrees granted throughmasters-level departments between the academicyears1994–1995and1999–2000.
Asseparatedepartmentsofcomputersciencearecreated, mathematics departments lose computerscience enrollments and majors. Consequently, itmakessensetotrackthenumberofbachelorsdegreesawardedthroughmathematicsdepartments,excludingcomputersciencedegrees, inorder tostudybache-lorsdegreeproductivityofmathematicsdepartments.CBMS1995showedthatinthe1994–1995academicyear,19,593non-computer-sciencebachelorsdegreeswere awarded through the nation’s mathematicsdepartments.CBMS2000andCBMS2005showthattotaldroppedbyabout4%between the1994–1995and1999–2000academicyears,andbyanother4%between the 1999–2000 and 2004–2005 academicyears,reaching18,222inacademicyear2004–2005foratotaldeclineofabout7%fromtenyearsearlier.
DatafromCBMS1995,CBMS2000,andCBMS2005showthatbachelors-levelmathematicsdepartmentsconsistently produced at least 40% of the non-computer-sciencebachelorsdegreesgrantedthroughmathematicsdepartments,withdoctoraldepartments’percentagerisingfrom31%in1995to40%in2005.The percentage of non-computer-science bachelorsdegreesgrantedthroughmasters-levelmathematicsdepartmentsdropped from30%in1995, to20%in2000,to19%in2005.AgraphofthesepercentagescloselyresemblesthegraphinFigureE.1.3.

78 2005 CBMS Survey of Undergraduate Programs
4112
2282
(36%)
6393
296
470
(61%)
766
64
69
(52%)
133
413
58
(12%)
471
4884
2879
(37%)
7763
1350
1027
(43%)
2377
401
628
(61%)
1029
44
41
(48%)
85
314
72
(19%)
386
2109
1768
(46%)
3877
3358
2482
(43%)
5839
645
930
(59%)
1575
17
6
(26%)
23
1412
335
(19%)
1747
5431
3752
(41%)
9183
8820
5791
(40%)
14610
1341
2028
(60%)
3369
125
116
(48%)
241
2139
465
(18%)
2603
12424
8399
(40%)
20823
237
184
(44%)
421
237
184
(44%)
421
120
73
(38%)
193
120
73
(38%)
193
357
257
(42%)
614
357
257
(42%)
614
8820
5791
(40%)
14610
1341
2028
(60%)
3369
482
373
(44%)
855
2139
465
(18%)
2603
12780
8656
(40%)
21437
Mathematics majors
(including Act Sci, Oper
Res, and joint degrees)
Men
Women
(Percentage of women)
Total Math degrees
Mathematics Education
majors
Men
Women
Total Math Ed degrees
Statistics majors
Men
Women
Total Stat degrees
Computer Science majors
Men
Women
Total CS degrees
Total degrees - Men
Total degrees - Women
Total all degrees
Univ
(PhD)
Univ
(MA)
Coll
(BA)
Total
Math
Depts
Univ
(PhD)
Univ
(MA)
Total
Stat
Depts
Total
Math &
Stat Depts
Bachelors degrees in
Math and Stat Depts
Mathematics Departments Statistics Departments
TABLE E.1 Bachelors degrees in mathematics, mathematics education, statistics, and computer science in
mathematics departments and in statistics departments awarded between July 1, 2004 and June 30, 2005, by
gender of degree recipient and type of department.Jan 2, 07; Sept 18; 8/8, 2006
Note: Round-off may make row and column sums seem inaccurate.
Enrollments in Four-Year Colleges and Universities 79
Univ (PhD) 1995
Univ (PhD) 2000
Univ (PhD) 2005
Univ (MA) 1995
Univ (MA) 2000
Univ (MA) 2005
Coll (BA) 1995
Coll (BA) 2000
Coll (BA) 2005
0 1000 2000 3000 4000 5000 6000 7000Number of Bachelors Degrees
Men
Women
FIGURE E.1.1 Bachelors degrees in mathematics departments awarded between July
1 and June 30 in the academic years 1994-1995, 1999-2000, and 2004-2005, by
gender and type of department.
August 8, 2006; April 23, 2007
Univ (PhD) 1995
Univ (PhD) 2000
Univ (PhD) 2005
Univ (MA) 1995
Univ (MA) 2000
Univ (MA) 2005
Coll (BA) 1995
Coll (BA) 2000
Coll (BA) 2005
0 1000 2000 3000 4000 5000 6000 7000
Mathematics & Statistics
Mathematics Education
Computer Science
FIGURE E.1.2 Number of bachelors degrees granted in academic years 1994-1995, 1999-2000, and
2004-2005 by type of major and type of department.
Sept 18; August 8, 2006

80 2005 CBMS Survey of Undergraduate Programs
BB
B
J
J
J
H
H
H
F F F
1994-1995 1999-2000 2004-2005
0
10
20
30
40
50
B Mathematics, PhD Departments
J Mathematics, MA Departments
H Mathematics, BA Departments
F Statistics Departments
FIGURE E.1.3 Percentage of mathematical sciences bachelors degrees (including computer
science) awarded through mathematics and statistics departments of various kinds in academic
years 1994-1995, 1999-2000, and 2004-2005.
Oct 27; Oct 10
BB
B
J
J J
H
H
H
F F F
1994-1995 1999-2000 2004-20050
10
20
30
40
50
60
B Mathematics, PhD Departments
J Mathematics, MA Departments
H Mathematics, BA Departments
F Statistics Departments
FIGURE E.1.4 Percentage of mathematics and statistics bachelors degrees (excluding computer
science) awarded through mathematics and statistics departments of various kinds in academic
years 1994-1995, 1999-2000, and 2004-2005.
Oct 27; April 23, 2007
Enrollments in Four-Year Colleges and Universities 81
Tables E.2 and E.3: Undergraduate enrollments and number of sections offered in mathematics and statistics departments
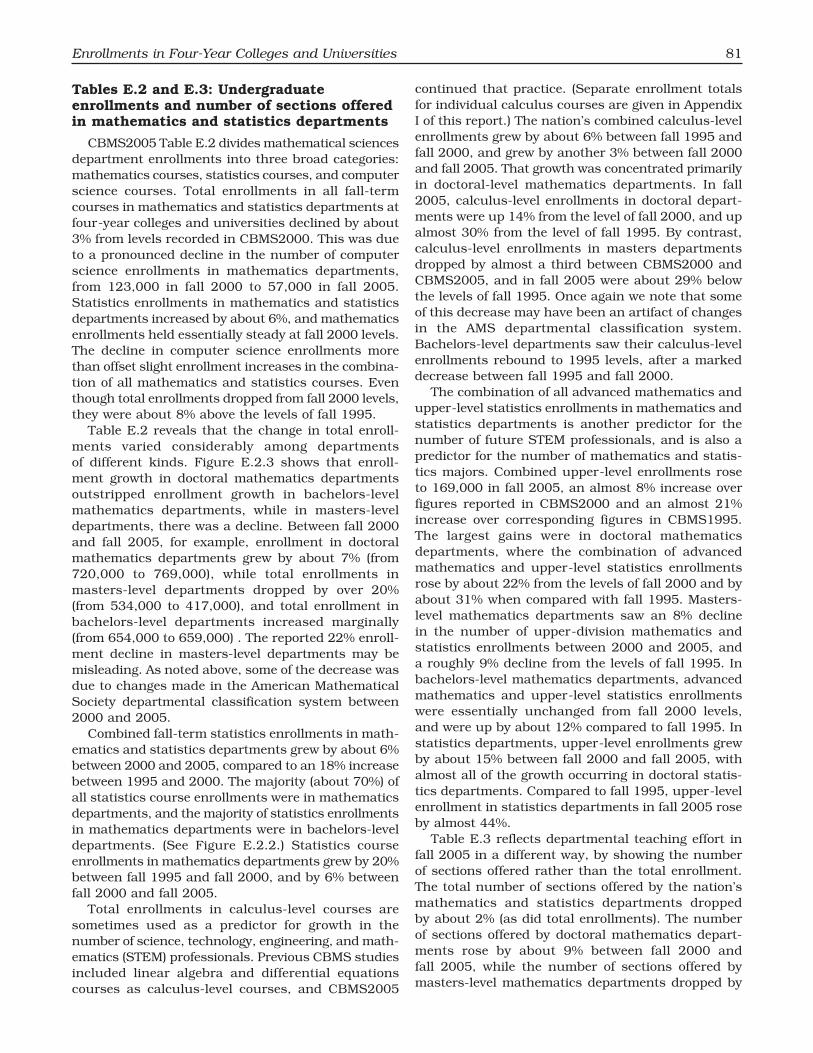
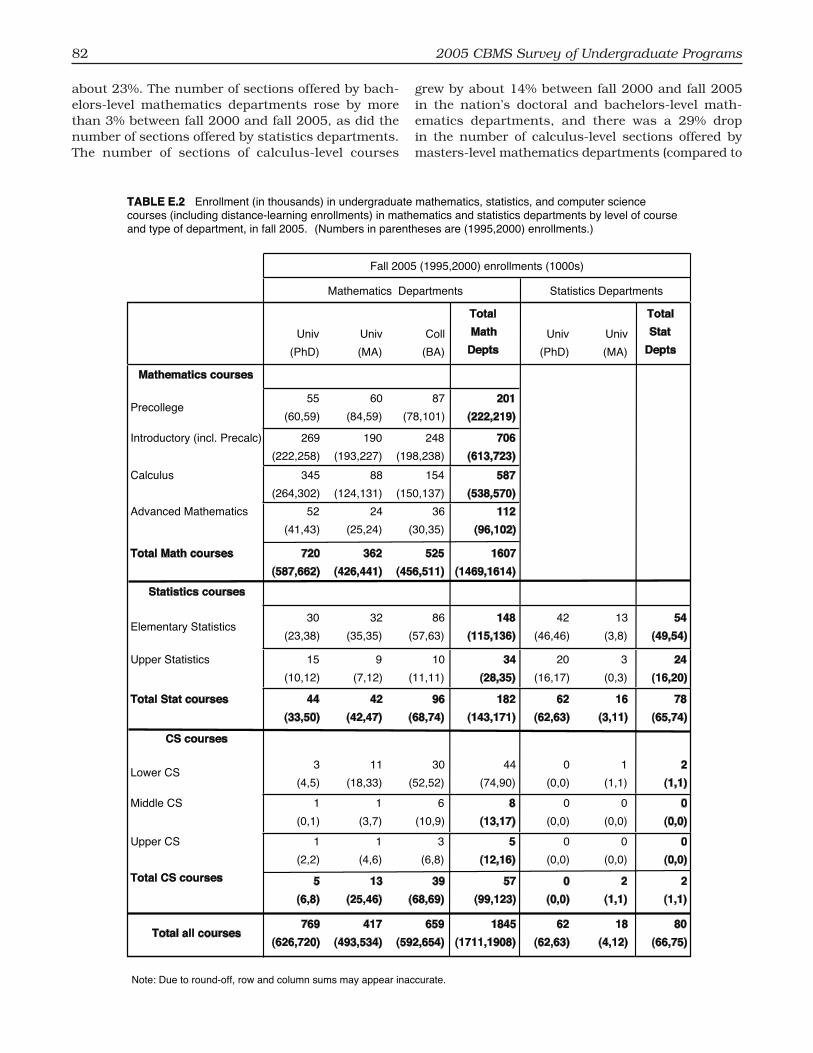
CBMS2005TableE.2dividesmathematicalsciencesdepartmentenrollmentsintothreebroadcategories:mathematicscourses,statisticscourses,andcomputerscience courses. Total enrollments in all fall-termcoursesinmathematicsandstatisticsdepartmentsatfour-yearcollegesanduniversitiesdeclinedbyabout3%fromlevelsrecordedinCBMS2000.Thiswasduetoapronounceddeclineinthenumberofcomputerscience enrollments in mathematics departments,from 123,000 in fall 2000 to 57,000 in fall 2005.Statisticsenrollmentsinmathematicsandstatisticsdepartmentsincreasedbyabout6%,andmathematicsenrollmentsheldessentiallysteadyatfall2000levels.The decline in computer science enrollments morethanoffsetslightenrollmentincreasesinthecombina-tionofallmathematicsandstatisticscourses.Eventhoughtotalenrollmentsdroppedfromfall2000levels,theywereabout8%abovethelevelsoffall1995.
TableE.2reveals that thechange in totalenroll-ments varied considerably among departmentsof different kinds. Figure E.2.3 shows that enroll-ment growth in doctoral mathematics departmentsoutstripped enrollment growth in bachelors-levelmathematics departments, while in masters-leveldepartments,therewasadecline.Betweenfall2000and fall 2005, for example, enrollment in doctoralmathematics departments grew by about 7% (from720,000 to 769,000), while total enrollments inmasters-level departments dropped by over 20%(from 534,000 to 417,000), and total enrollment inbachelors-level departments increased marginally(from654,000to659,000).Thereported22%enroll-ment decline in masters-level departments may bemisleading.Asnotedabove,someofthedecreasewasduetochangesmadeintheAmericanMathematicalSociety departmental classification system between2000and2005.
Combinedfall-termstatisticsenrollmentsinmath-ematicsandstatisticsdepartmentsgrewbyabout6%between2000and2005,comparedtoan18%increasebetween1995and2000.Themajority(about70%)ofallstatisticscourseenrollmentswereinmathematicsdepartments,andthemajorityofstatisticsenrollmentsinmathematicsdepartmentswereinbachelors-leveldepartments. (See Figure E.2.2.) Statistics courseenrollmentsinmathematicsdepartmentsgrewby20%betweenfall1995andfall2000,andby6%betweenfall2000andfall2005.
Total enrollments in calculus-level courses aresometimes used as a predictor for growth in thenumberofscience,technology,engineering,andmath-ematics(STEM)professionals.PreviousCBMSstudiesincluded linear algebra and differential equationscourses as calculus-level courses, and CBMS2005
continuedthatpractice. (SeparateenrollmenttotalsforindividualcalculuscoursesaregiveninAppendixIofthisreport.)Thenation’scombinedcalculus-levelenrollmentsgrewbyabout6%betweenfall1995andfall2000,andgrewbyanother3%betweenfall2000andfall2005.Thatgrowthwasconcentratedprimarilyin doctoral-level mathematics departments. In fall2005,calculus-levelenrollments indoctoraldepart-mentswereup14%fromtheleveloffall2000,andupalmost30%fromtheleveloffall1995.Bycontrast,calculus-level enrollments in masters departmentsdroppedbyalmostathirdbetweenCBMS2000andCBMS2005,andinfall2005wereabout29%belowthelevelsoffall1995.Onceagainwenotethatsomeofthisdecreasemayhavebeenanartifactofchangesin the AMS departmental classification system.Bachelors-leveldepartmentssawtheircalculus-levelenrollmentsreboundto1995levels,afteramarkeddecreasebetweenfall1995andfall2000.
Thecombinationofalladvancedmathematicsandupper-levelstatisticsenrollmentsinmathematicsandstatistics departments is another predictor for thenumberoffutureSTEMprofessionals,andisalsoapredictorforthenumberofmathematicsandstatis-ticsmajors.Combinedupper-levelenrollmentsroseto169,000infall2005,analmost8%increaseoverfigures reported in CBMS2000 and an almost 21%increase over corresponding figures in CBMS1995.The largest gains were in doctoral mathematicsdepartments, where the combination of advancedmathematics and upper-level statistics enrollmentsrosebyabout22%fromthelevelsoffall2000andbyabout31%whencomparedwithfall1995.Masters-level mathematics departments saw an 8% declinein the number of upper-division mathematics andstatisticsenrollmentsbetween2000and2005,andaroughly9%declinefromthelevelsoffall1995.Inbachelors-levelmathematicsdepartments,advancedmathematics and upper-level statistics enrollmentswere essentially unchanged from fall 2000 levels,andwereupbyabout12%comparedtofall1995.Instatisticsdepartments,upper-levelenrollmentsgrewbyabout15%betweenfall2000andfall2005,withalmostallofthegrowthoccurringindoctoralstatis-ticsdepartments.Comparedtofall1995,upper-levelenrollmentinstatisticsdepartmentsinfall2005rosebyalmost44%.
TableE.3reflectsdepartmentalteachingeffort infall2005inadifferentway,byshowingthenumberofsectionsofferedratherthanthetotalenrollment.Thetotalnumberofsectionsofferedbythenation’smathematics and statistics departments droppedbyabout2%(asdidtotalenrollments).Thenumberofsectionsofferedbydoctoralmathematicsdepart-ments rose by about 9% between fall 2000 andfall 2005, while the number of sections offered bymasters-levelmathematicsdepartmentsdroppedby
82 2005 CBMS Survey of Undergraduate Programs
about23%.Thenumberofsectionsofferedbybach-elors-level mathematics departments rose by morethan3%betweenfall2000andfall2005,asdidthenumberofsectionsofferedbystatisticsdepartments.The number of sections of calculus-level courses
grewbyabout14%betweenfall2000andfall2005in the nation’s doctoral and bachelors-level math-ematics departments, and there was a 29% dropin the number of calculus-level sections offered bymasters-levelmathematicsdepartments(comparedto
55
(60,59)
269
(222,258)
345
(264,302)
52
(41,43)
720
(587,662)
30
(23,38)
15
(10,12)
44
(33,50)
3
(4,5)
1
(0,1)
1
(2,2)
5
(6,8)
769
(626,720)
60
(84,59)
190
(193,227)
88
(124,131)
24
(25,24)
362
(426,441)
32
(35,35)
9
(7,12)
42
(42,47)
11
(18,33)
1
(3,7)
1
(4,6)
13
(25,46)
417
(493,534)
87
(78,101)
248
(198,238)
154
(150,137)
36
(30,35)
525
(456,511)
86
(57,63)
10
(11,11)
96
(68,74)
30
(52,52)
6
(10,9)
3
(6,8)
39
(68,69)
659
(592,654)
201
(222,219)
706
(613,723)
587
(538,570)
112
(96,102)
1607
(1469,1614)
148
(115,136)
34
(28,35)
182
(143,171)
44
(74,90)
8
(13,17)
5
(12,16)
57
(99,123)
1845
(1711,1908)
42
(46,46)
20
(16,17)
62
(62,63)
0
(0,0)
0
(0,0)
0
(0,0)
0
(0,0)
62
(62,63)
13
(3,8)
3
(0,3)
16
(3,11)
1
(1,1)
0
(0,0)
0
(0,0)
2
(1,1)
18
(4,12)
54
(49,54)
24
(16,20)
78
(65,74)
2
(1,1)
0
(0,0)
0
(0,0)
2
(1,1)
80
(66,75)
Mathematics courses
Precollege
Introductory (incl. Precalc)
Calculus
Advanced Mathematics
Total Math courses
Statistics courses
Elementary Statistics
Upper Statistics
Total Stat courses
CS courses
Lower CS
Middle CS
Upper CS
Total CS courses
Total all courses
Univ
(PhD)
Univ
(MA)
Coll
(BA)
Total
Math
Depts
Univ
(PhD)
Univ
(MA)
Total
Stat
Depts
Mathematics Departments Statistics Departments
TABLE E.2 Enrollment (in thousands) in undergraduate mathematics, statistics, and computer science
courses (including distance-learning enrollments) in mathematics and statistics departments by level of course
and type of department, in fall 2005. (Numbers in parentheses are (1995,2000) enrollments.)
Fall 2005 (1995,2000) enrollments (1000s)Jan 2, 07; Sept
18;Sept 2, 2006;
Note: Due to round-off, row and column sums may appear inaccurate.

Enrollments in Four-Year Colleges and Universities 83
a23%enrollmentdeclineincalculus-levelcoursesinsuchdepartments).Thenumberofadvancedmathe-maticsandstatisticssectionsindoctoralmathematicsdepartments grew by about 18% (compared with a22%enrollment increase).Thenumberofadvancedsections in masters-level departments dropped by
about9%(comparedtoan8%enrollmentdecrease),andthenumberofadvancedsectionsofferedbybach-elors-levelmathematicsdepartmentsgrewbyabout3%eventhoughenrollmentwasunchangedfromfall2000.
All Computer Science
Adv. Mathematics & Statistics
Calculus-level Courses
Elementary Statistics
Introductory Mathematics
Precollege-level Courses
0 100 200 300 400 500 600 700 800
Enrollment in Thousands
Univ (PhD)
Univ (MA)
Coll (BA)
FIGURE E.2.1 Enrollment (thousands) in undergraduate mathematics, statistics, and computer science
courses in four-year college and university mathematics departments by type of course and type of
department in fall 2005.
Sept 18, 2006
Statistics, MA
Statistics, PhD
Mathematics, BA
Mathematics, MA
Mathematics, PhD
0 10 20 30 40 50 60 70 80 90 100
Enrollment in Thousands
Elementary Statistics
Upper-level Statistics
FIGURE E.2.2 Enrollment (thousands) in undergraduate statistics courses by level of course and type
of department in fall 2005.
Sept 18; Sept 2, 2006

84 2005 CBMS Survey of Undergraduate Programs
B
B
B
JJ
J
H
H H
F F F
Fall 1995 Fall 2000 Fall 2005
0
100
200
300
400
500
600
700
800
En
rollm
en
ts in
Th
ou
sa
nd
s
B PhD, Mathematics
J MA, Mathematics
H BA, Mathematics
F MA+PhD, Statistics
FIGURE E.2.3 Undergraduate enrollment (in thousands) in doctoral, masters, and bachelors
mathematics departments, and in a combination of all masters and doctoral-level statistics
departments, in fall 1995, fall 2000, and fall 2005.
Jan 2, 07; Sept 2, 2006

Enrollments in Four-Year Colleges and Universities 85
1363
(1493)
5518
(5032)
7696
(6768)
2625
(2392)
17202
(15685)
629
(827)
869
(580)
1498
(1407)
114
(92)
61
(24)
61
(98)
236
(214)
18935
(17306)
1902
(1772)
5543
(6506)
3237
(4551)
1622
(1936)
12303
(14765)
924
(1064)
714
(638)
1638
(1702)
512
(1553)
121
(465)
83
(527)
715
(2545)
14656
(19012)
3862
(4388)
9895
(8987)
7388
(6438)
3507
(3415)
24652
(23228)
3191
(2372)
771
(728)
3962
(3100)
1629
(2557)
739
(590)
444
(868)
2811
(4015)
31425
(30343)
7126
(7653)
20955
(20525)
18321
(17757)
7754
(7743)
54157
(53678)
4744
(4263)
2354
(1946)
7098
(6209)
2254
(4202)
921
(1079)
587
(1493)
3762
(6774)
65017
(66661)
696
(786)
499
(476)
1195
(1262)
11
(4)
2
(0)
0
(0)
13
(4)
1208
(1266)
186
(123)
156
(122)
342
(245)
22
(12)
14
(2)
0
(8)
36
(22)
378
(267)
882
(909)
654
(598)
1537
(1507)
33
(16)
16
(2)
0
(8)
49
(26)
1586
(1533)
Mathematics courses
Precollege level
Introductory (incl. Precalc)
Calculus
Advanced Mathematics
Total Math courses
Statistics courses
Elementary Statistics
Upper Statistics
Total Stat courses
CS courses
Lower CS
Middle CS
Upper CS
Total CS courses
Total all courses
Univ
(Phd)
Univ
(MA)
Coll
(BA)
Total
Math
Depts
Univ
(PhD)
Univ
(MA)
Total
Stat
Depts
Mathematics Departments
Number of sections: Fall 2005 (Fall 2000)
Statistics Departments
TABLE E.3 Number of sections (not including distance-learning) of undergraduate mathematics, statistics,
and computer science courses in mathematics and statistics departments, by level of course and type of
department, in fall 2005 with fall 2000 figures in parentheses. (CBMS2000 data from Table E.10.)
Sept 19; 8/8/ 2006
Note: Round-off may make row and column sums seem inaccurate.

86 2005 CBMS Survey of Undergraduate Programs
Table E.4: Distance education in four-year colleges and universities
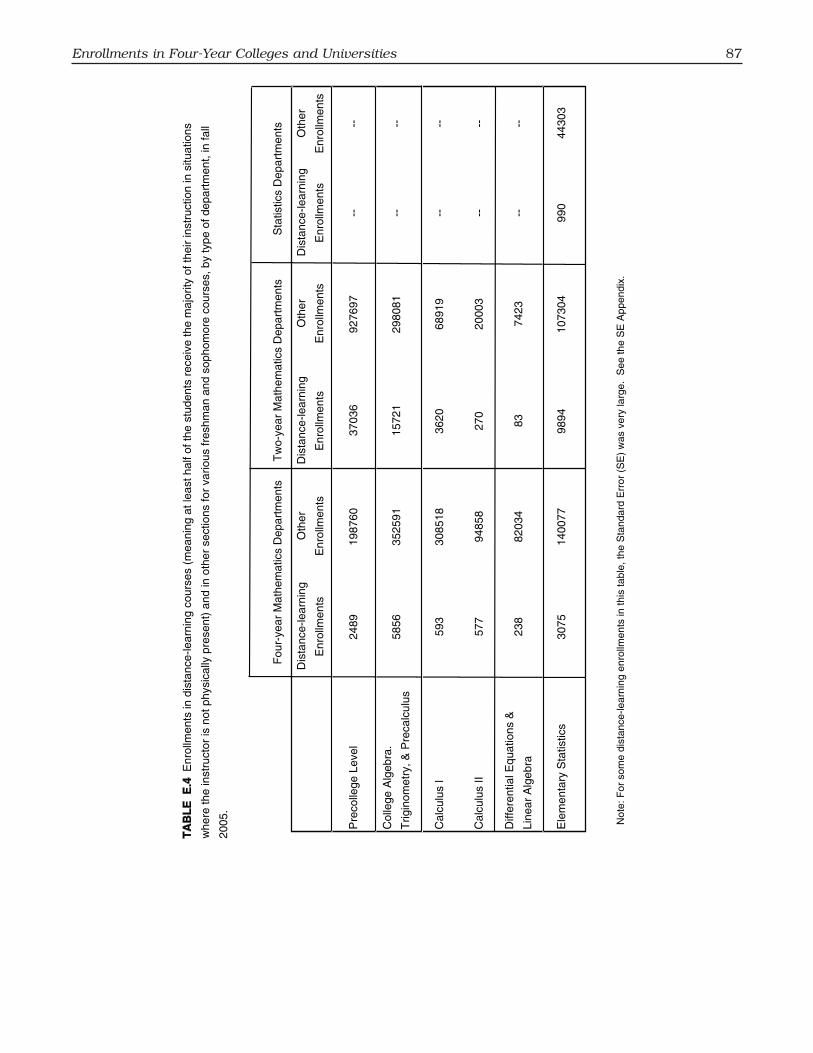
The terms “distance education” and “distancelearning”havebeenbroadlydefinedinrecentCBMSstudies to mean any learning format in which themajority of students receive at least half of theirinstructioninsituationswheretheinstructorisnotphysicallypresent.Thisincludes,forexample,corre-spondencecourses(electronicorpaper),coursesthatuse broadcast lectures, and courses taught via theinternet.Someuniversitieshave experimentedwithteachingtheircalculuscoursesinlargecomputerlabs,where students interact with sophisticated tutorialprogramsinlieuofinteractingwithaninstructor.
CBMS2000askedaboutthenumberofsectionsofagivencoursetaughtusingdistance-learningmethods,andfollow-upcallsinfall2000revealedthattobethewrongquestion.Insomecases,alldistance-learningstudentswereenrolledinasinglesectionofacourse,with the result that average section size estimatesmay have been inflated in the CBMS2000 report.Withthatinmind,CBMS2005askeddepartmentsto
reportseparatelythenumberofstudentsenrolledindistance-learningsectionsofagivencourseandthenumberofstudentsenrolledinnon-distance-learningsections. Table E.4 summarizes the results for thetypesofcoursesmostfrequentlytaughtusingdistanceeducationinfall2005andshowsthat,infall2005,distanceeducationwasnotwidelyusedinfour-yearcolleges and universities. Among four-year math-ematics departments, only in elementary statisticscoursesdiddistanceenrollmentsexceed2%oftotalenrollments,andinCalculusIcoursesthepercentagewas insignificant. The middle column of Table E.4allows comparisons with the situation in two-yearcolleges,wheredistanceeducationismorecommon.Forexample,attwo-yearcolleges,distance-educationenrollments were about five percent of total enroll-mentincertainprecalculusandCalculusIcourses,andaccountedformorethan8%oftotalenrollmentsinelementarystatisticscourses.Formoredetailsonthe use of distance education in two-year colleges,seeChapter6.
Enrollments in Four-Year Colleges and Universities 87
2489
5856
593
577
238
3075
1987
60
3525
91
3085
18
9485
8
8203
4
1400
77
3703
6
1572
1
3620
270
83
9894
9276
97
2980
81
6891
9
2000
3
7423
1073
04
-- -- -- -- -- 990
-- -- -- -- --
4430
3
Pre
colle
ge L
evel
Col
lege
Alg
ebra
.
Trig
inom
etry
, & P
reca
lcul
us
Cal
culu
s I
Cal
culu
s II
Diff
eren
tial E
quat
ions
&
Line
ar A
lgeb
ra
Ele
men
tary
Sta
tistic
s
Dis
tanc
e-le
arni
ng
Enr
ollm
ents
Oth
er
Enr
ollm
ents
Dis
tanc
e-le
arni
ng
Enr
ollm
ents
Oth
er
Enr
ollm
ents
Dis
tanc
e-le
arni
ng
Enr
ollm
ents
Oth
er
Enr
ollm
ents
TA
BL
E E
.4E
nrol
lmen
ts in
dis
tanc
e-le
arni
ng c
ours
es (
mea
ning
at l
east
hal
f of t
he s
tude
nts
rece
ive
the
maj
ority
of t
heir
inst
ruct
ion
in s
ituat
ions
whe
re th
e in
stru
ctor
is n
ot p
hysi
cally
pre
sent
) an
d in
oth
er s
ectio
ns fo
r va
rious
fres
hman
and
sop
hom
ore
cour
ses,
by
type
of d
epar
tmen
t, in
fall
2005
.
Fou
r-ye
ar M
athe
mat
ics
Dep
artm
ents
Tw
o-ye
ar M
athe
mat
ics
Dep
artm
ents
Sta
tistic
s D
epar
tmen
ts
Jan
2, 0
7; N
ov
19;
Sep
t 18
; S
ept
5, 2
006;
FO
RM
ER
LY
DIS
T.1
6 IN
CH
2;
Ap
r 23
, 200
7
Not
e: F
or s
ome
dist
ance
-lear
ning
enr
ollm
ents
in th
is ta
ble,
the
Sta
ndar
d E
rror
(S
E)
was
ver
y la
rge.
See
the
SE
App
endi
x.

88 2005 CBMS Survey of Undergraduate Programs
Tables E.5 to E.12: Who taught undergraduate mathematics and statistics in fall 2005?
Chapter 3 of the CBMS2000 report containedseveralsetsoftables,allproducedfromthesamedataset.CBMS2000TablesE.4toE.9presentedresultsaspercentagesofenrollments,e.g.,thepercentageofintroductory-levelenrollments taughtby tenuredortenure-eligible faculty.TablesE.12 throughE.18ofthatreportpresentedthesameinformationintermsofthenumber of sections.Becausethedatatransfor-mationneeded toproducepercentage-of-enrollmenttablesfromresponsestoCBMS2000questionnairesmadecertainproblematicassumptions,standarderror(SE)valuesforTablesE.4toE.9werenotcalculated.ThisconcernledtheCBMS2005projectdirectorstopresent2005dataintermsofnumbersandpercent-agesofsectionsofvariouskinds.As longasone iscarefultocomparethepercentage-of-sectionstablesinCBMS2005withpercentage-of-sectionstablesfromCBMS2000,historicaltrendscanbestudied,andtheheadingofTablesE.5toE.12inCBMS2005containsa reference to the proper comparison table fromCBMS2000. For example, Table E.5 of CBMS2005shouldbecomparedwithTableE.12ofCBMS2000.
ThefacultycategoriesusedinCBMS2005TablesE.5toE.12aretenuredandtenure-eligible(TTE)faculty,other full-time faculty (OFT),which is thesetofallfull-timefacultywhoarenotintheTTEcategory,part-time (PT) faculty, and graduate teaching assistants(GTAs). In caseswheredepartmental responsesdidnotaccountforallsectionsofagiventypeofcourse,there is also an “unknown” column. For example,postdoctoralfacultyandscholarlyvisitorswhoteachcourseswouldbeincludedintheOFTcategory.
Table E.12 of the CBMS2000 study reportedmarkedchangesbetweenfall1995andfall2000inthepercentageofsectionstaughtbyvarioustypesoffaculty in mathematics and statistics departments.CBMS2000 reported that, when comparedwith fall1995data, thepercentageofsectionstaught in fall2000 by tenured and tenure-eligible (TTE) facultyhaddropped,sometimesbya largeamount,withacorrespondingincreaseinthepercentageofsectionstaughtbyotherfull-time(OFT)faculty,acategorythatincludesscholarlyvisitors,postdocs,full-timeinstruc-torsandlecturers,andanincreaseinthenumberofsectionstaughtbypart-timefaculty.CBMS2000alsofoundapronounceddropinthenumberofsectionstaughtbygraduateteachingassistants(GTAs)betweenfall 1995 and fall 2000. (See also [LM].) (In CBMSsurveys,tosaythataGTAteachesasectionmeansthat she or he is the instructor of record for thatsection.Teachingassistantswhosuperviserecitationsectionsforalargerlecturecoursearenotcountedasteachingtheirownsectionofthecourse.)
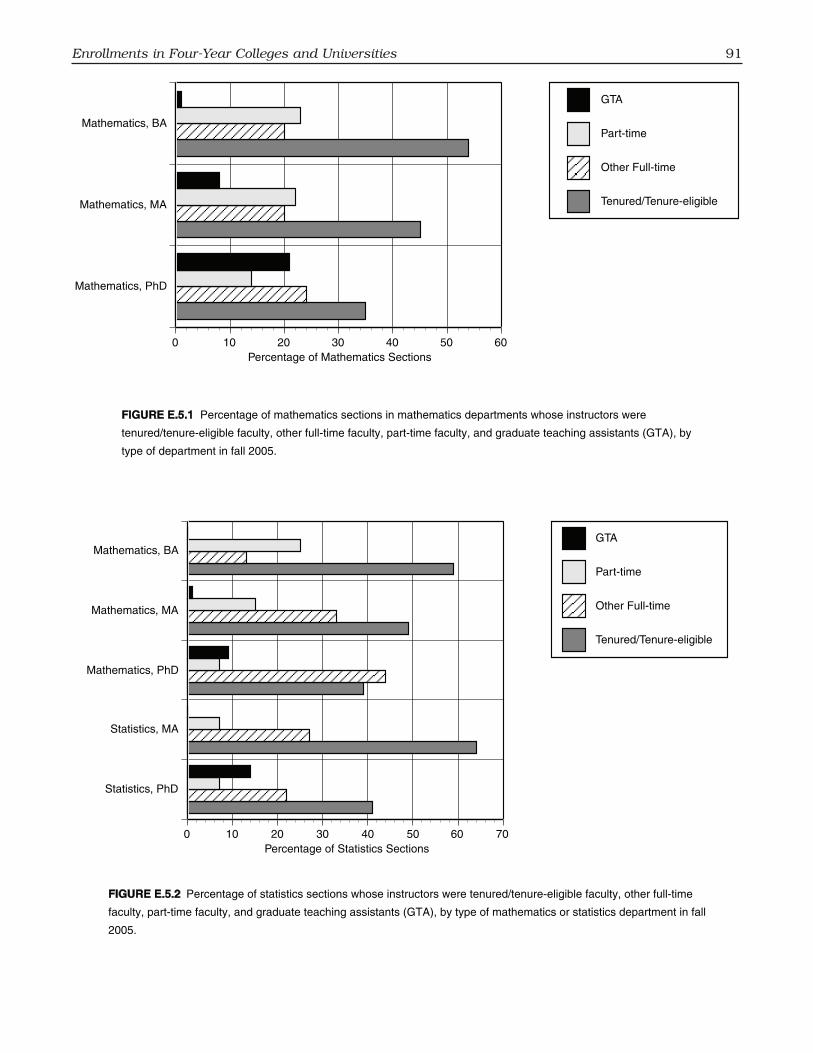
TableE.5inthecurrentreportshowsthatbetweenfall2000andfall2005,thedeclineinthepercentageofsectionstaughtbyTTEfacultycontinued,exceptamong sections of computer science courses. Formathematics courses as a whole, the percentagetaught by TTE faculty dropped by six percentagepoints, from 52% in fall 2000 to 46% in fall 2005.At the same time, the percentage of mathematicssections taught by OFT faculty rose by six points,andthepercentageofmathematicssectionstaughtbyGTAsrosebytwopercentagepoints,from7%to9%.The percentage of statistics courses taught by TTEfacultydroppedbyelevenandtenpercentagepointsin mathematics and statistics departments respec-tively,withacorrespondingriseinteachingbyOFTfaculty.OnlyincomputersciencesectionswasthereamarkedincreaseinthepercentageofsectionstaughtbyTTEfaculty.
In some cases the change in the percentage ofsections taught by TTE faculty was surprisinglylarge.Forexample,betweenfall2000andfall2005,the percentage of statistics sections taught by TTEfacultyindoctoralmathematicsdepartmentsdroppedfrom63%to39%,andtheanalogouspercentageinmasters-levelmathematicsdepartmentsdroppedfrom72% to 49%. Figures E.4.1, E.4.2, and E.4.3 showthepercentagesofvarioustypesofcoursestaughtbydifferentkindsofinstructorsinfall2005.
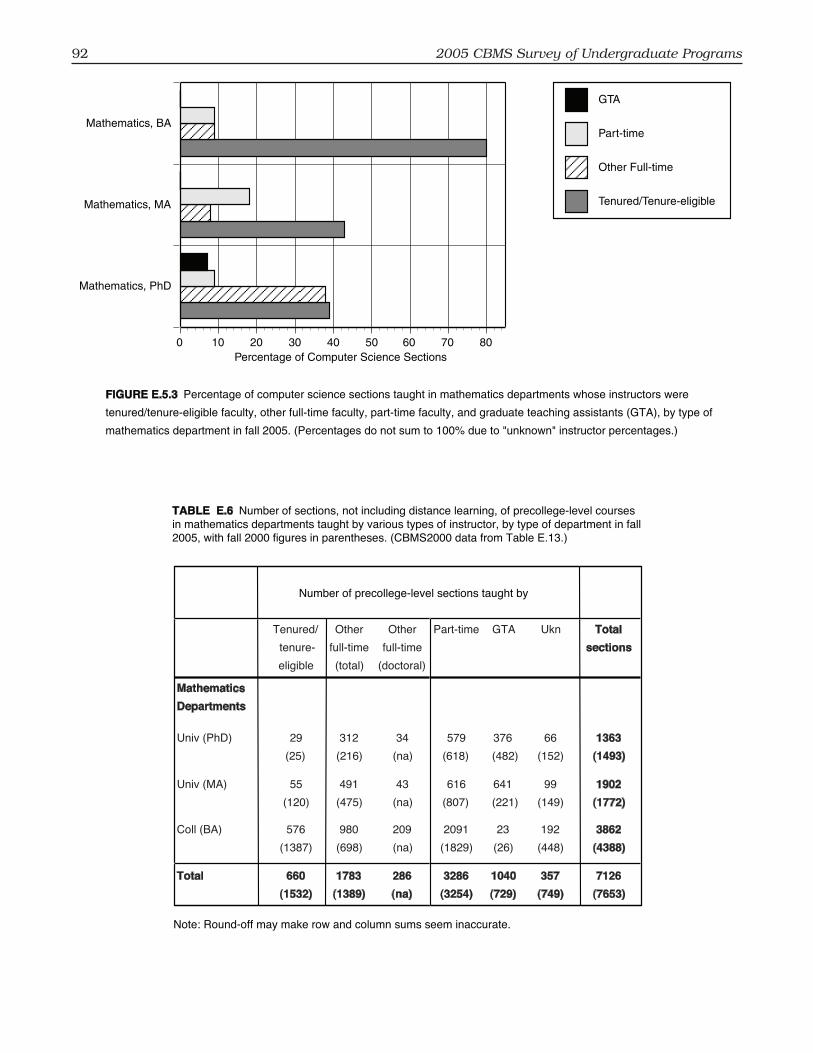
CBMS2005 Tables E.6 through E.12 examinethe fine structure of the global data in Table E.5,presenting data on courses at various levels of thecurriculum(pre-college-level,introductory-level,andcalculus-level,elementarystatistics,introductory-levelcomputerscience,middle-levelcomputerscience,andadvanced-levelmathematicsandstatisticscourses).The tables show the numbers of sections taughtby different types of instructors, and they includeimportant new data: the category of OFT faculty issubdivided into those who had a doctoral degreeand those who did not. In order to allow compar-isons with previous CBMS studies, one column ofthe tables presents the number of sections taughtby all OFT faculty, independent of degree earned,andasecondcolumnshowsthenumberofsectionstaughtbydoctoralOFTfaculty.Thisrefinementwasintroduced to make a distinction between sectionstaughtbypostdocsandscholarlyvisitorsontheonehand, and by non-doctoral full-time instructors ontheother.Forexample,TableE.6showsthatofthe7,126sectionsofpre-college-levelcoursesofferedinmathematicsdepartmentsinfall2005,about9%weretaughtbyTTE faculty,4%bydoctoralOFT faculty,21%bynon-doctoralOFT faculty, etc. (It is also ofinteresttonotethatthenumberofpre-collegesectionsdroppedbetweenfall2000andfall2005,from7,653to7,126.)Bycontrast,TableE.8shows thatof the18,321 sections of calculus-level courses taught in

Enrollments in Four-Year Colleges and Universities 89
mathematicsdepartments,about61%weretaughtbyTTEfaculty,about10%bydoctoralOFTfaculty,andabout7%bynon-doctoralOFTfaculty.
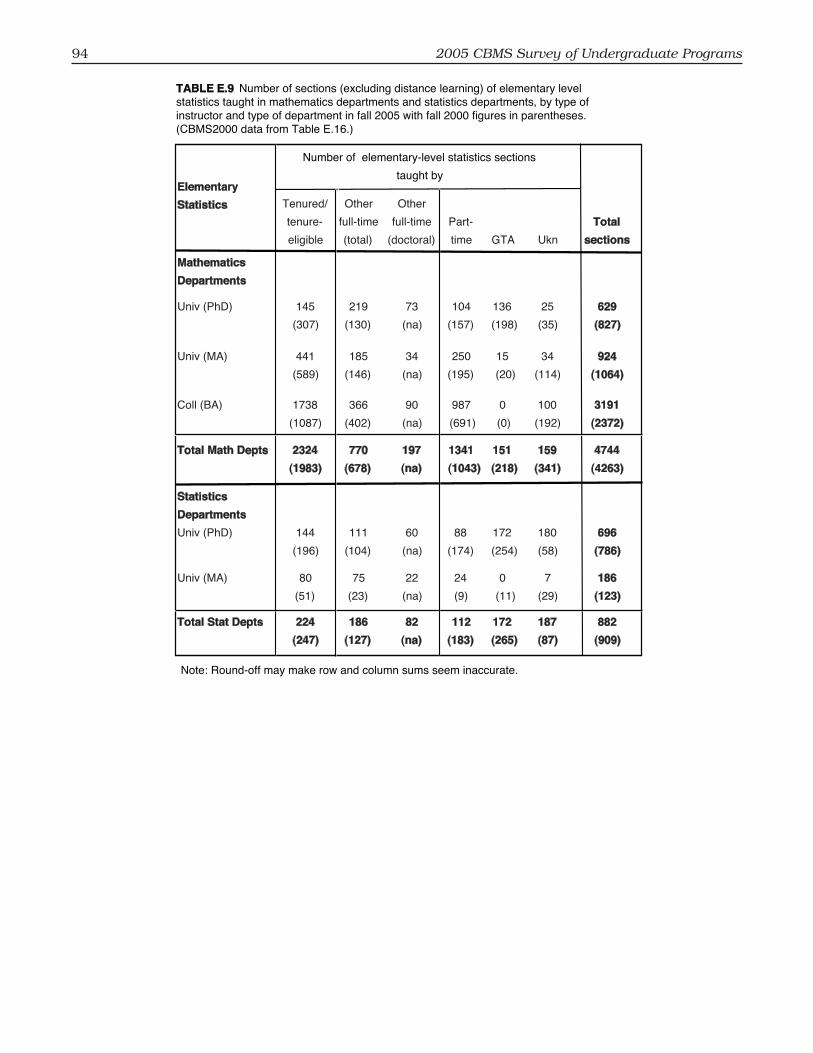
CBMS2000 reported that between fall 1995 andfall2000,thepercentageofmathematicsdepartmentsectionstaughtbygraduateteachingassistants(GTAs)declined,often toapronounceddegree.CBMS2005datasuggestsareversalofthattrend.Forexample,infall2000,about9.5%ofprecollegesectionsweretaught by GTAs, while in fall 2005 the percentagewas14.6%. In introductory-level courses (includingCollegeAlgebra,Precalculus,MathematicsforLiberalArts,etc.),thepercentageofsectionstaughtbyGTAswasessentiallyunchanged from fall2000 levels. Incalculus-levelsections,thepercentagerosefrom6.4%to7.6%.Onlyinelementarystatisticsandlower-levelcomputersciencewasthereadeclineinthepercentageofsectionstaughtbyGTAs.Inelementarystatistics,thepercentagedroppedfromabout9%ofallelemen-tary statistics sections taught in mathematics andstatisticsdepartmentscombinedtoabout6%(TableE.9).
Tables E.5 and E.6 contain what appears to beanomalousdata;theyreportthatsomemathematicssections in bachelors-only departments are taughtbyGTAs.Follow-uptelephonecallstovariousbach-elors-level mathematics departments revealed that
some departments “borrow” GTAs from graduatedepartments at their own universities, and somedepartments classified as bachelors-level when theCBMS2005 sample frame was set up subsequentlycreated masters programs, often Master of Arts inTeachingprograms,andwereusingtheirnewGTAstoteachcoursesinfall2005.Thisanomalywillreap-pearinChapter5,whichlooksatfirst-yearcoursesinconsiderabledetail.
Table E.12 in CBMS2005 is new. Earlier CBMSstudiesmadetheassumptionthatallupper-divisionsectionsweretaughtbytenuredandtenure-eligible(TTE) faculty. To test that assumption, CBMS2005asked departments to specify how many of theirupper-divisionsectionsweretaughtbyTTEfaculty.In mathematics departments, about 78% of allupper-division mathematics and statistics coursesweretaughtbyTTEfaculty.Lookingatmathematicsand statistics courses in these departments sepa-rately,onesees thatTTE faculty taughtabout84%ofallupper-divisionmathematicscoursesofferedinfall2005andabout59%ofallupper-levelstatisticscourses.Instatisticsdepartments,74%ofallupper-levelcoursesweretaughtbyTTEfacultyinfall2005.CBMS2005hasnodataonwhotaughttheremainingupper-divisioncourses.

90 2005 CBMS Survey of Undergraduate Programs
35
(42)
45
(48)
54
(60)
46
(52)
24
(16)
20
(19)
20
(13)
21
(15)
14
(17
)
22
(22
)
23
(21
)
20
(20
)
21
(21
)
8 (5)
1 (0)
9 (7)
6 (4)
6 (6)
3 (6)
5 (6)
172
02
(156
85
)
123
03
(147
65
)
246
52
(232
28
)
541
57
(536
78
)
39
(63
)
49
(72
)
59
(59
)
52
(63)
41
(53
)
64
(71
)
46
(56)
44
(9)
33
(9)
13
(13
)
24
(11
)
22
(8)
27
(9)
23
(8)
7
(11
)
15
(11
)
25
(22
)
19
(17
)
7
(14
)
7 (5)
7
(12
)
9
(14
)
1 (1
)
0
(0
)
2
(4
)
14
(20
)
0 (4
)
11
(18
)
2 (3)
2 (7)
3 (6)
2 (5)
15
(5)
2
(12
)
12
(6)
14
98
(14
07
)
16
39
(17
02
)
39
62
(31
00
)
70
99
(62
09
)
11
95
(12
62
)
342
(24
5)
15
37
(15
07
)
39
(59
)
43
(47
)
80
(56
)
70
(53
)
38
(17
)
8
(11
)
9
(18
)
11
(15
)
9 (6)
18
(35
)
9
(15
)
11
(22
)
7 (3)
0 (0)
0 (0)
0 (0)
6
(15
)
30
(7)
1
(11
)
7
(10
)
236
(21
4)
715
(2545
)
2811
(4015
)
3762
(6774
)
13
(4
)
36
(22)
49
(26)
Math
Dep
ts
Univ
(P
hD
)
Univ
(M
A)
Coll
(BA
)
To
tal M
ath
Dep
ts
Sta
t D
ep
ts
Univ
(P
hD
)
Univ
(M
A)
To
tal S
tat
Dep
ts
TT
E
%
OF
T
%
PT
%
GT
As
%
Ukn
%
No
. o
f
Math
se
cti
on
s
TT
E
%
OF
T
%
PT
%
GT
As
%
Ukn
%
No
. o
f
Sta
t
secti
on
s
TT
E
%
OF
T
%
PT
%
GT
As
%
Ukn
%
No
. o
f
CS
se
cti
on
s
Perc
enta
ge
of
ma
the
ma
tics
sectio
ns t
au
gh
t b
y
Pe
rce
nta
ge
of
sta
tistics
se
ctio
ns t
au
gh
t b
y
Pe
rce
nta
ge
of C
S
se
ctio
ns ta
ug
ht b
y
To
o fe
w c
ase
s in
the
sa
mp
le to
ma
ke
relia
ble
estim
ate
s
To
o f
ew
ca
se
s in
the
sa
mp
le t
o m
ake
relia
ble
estim
ate
s
TA
BL
E E
.5P
erc
enta
ge o
f se
ctio
ns,
exclu
din
g d
ista
nce
le
arn
ing
, o
f m
ath
em
atics,
sta
tistics,
an
d c
om
pu
ter
scie
nce
co
urs
es ta
ug
ht b
y
tenure
d/t
enure
-elig
ible
(T
TE
), o
the
r fu
ll-tim
e (
OF
T),
pa
rt-t
ime
(P
T),
gra
du
ate
te
ach
ing
assis
tan
ts (
GT
As),
an
d u
nkn
ow
n (
Ukn
) in
ma
the
ma
tics
depart
ments
and s
tatistics d
ep
art
me
nts
by t
yp
e o
f d
ep
art
me
nt
in f
all
20
05
, w
ith
fa
ll 2
00
0 fi
gu
res in
pa
ren
the
se
s. (C
BM
S2
00
0 d
ata
fro
m T
ab
le E
.12
.)
De
c 8
;Se
pt
19
; 8
/14
/06
; fo
rme
r E
12
Enrollments in Four-Year Colleges and Universities 91
Mathematics, PhD
Mathematics, MA
Mathematics, BA
0 10 20 30 40 50 60Percentage of Mathematics Sections
Tenured/Tenure-eligible
Other Full-time
Part-time
GTA
FIGURE E.5.1 Percentage of mathematics sections in mathematics departments whose instructors were
tenured/tenure-eligible faculty, other full-time faculty, part-time faculty, and graduate teaching assistants (GTA), by
type of department in fall 2005.
Oct 15(darken TTE color); Sept 18; 8/14/06; Apr 23, 2007
Statistics, PhD
Statistics, MA
Mathematics, PhD
Mathematics, MA
Mathematics, BA
0 10 20 30 40 50 60 70Percentage of Statistics Sections
Tenured/Tenure-eligible
Other Full-time
Part-time
GTA
FIGURE E.5.2 Percentage of statistics sections whose instructors were tenured/tenure-eligible faculty, other full-time
faculty, part-time faculty, and graduate teaching assistants (GTA), by type of mathematics or statistics department in fall
2005.
Oct 15(darken TTE color); Sept 18;August 14, 2006; Apr 23, 2007
92 2005 CBMS Survey of Undergraduate Programs
Mathematics, PhD
Mathematics, MA
Mathematics, BA
0 10 20 30 40 50 60 70 80Percentage of Computer Science Sections
Tenured/Tenure-eligible
Other Full-time
Part-time
GTA
FIGURE E.5.3 Percentage of computer science sections taught in mathematics departments whose instructors were
tenured/tenure-eligible faculty, other full-time faculty, part-time faculty, and graduate teaching assistants (GTA), by type of
mathematics department in fall 2005. (Percentages do not sum to 100% due to "unknown" instructor percentages.)
Dec 8;Oct15(darken TTE color); Sept 18;rev 8/14/06; April 23, 2007
Tenured/
tenure-
eligible
29
(25)
55
(120)
576
(1387)
660
(1532)
Other
full-time
(total)
312
(216)
491
(475)
980
(698)
1783
(1389)
Other
full-time
(doctoral)
34
(na)
43
(na)
209
(na)
286
(na)
Part-time
579
(618)
616
(807)
2091
(1829)
3286
(3254)
GTA
376
(482)
641
(221)
23
(26)
1040
(729)
Ukn
66
(152)
99
(149)
192
(448)
357
(749)
Total
sections
1363
(1493)
1902
(1772)
3862
(4388)
7126
(7653)
Mathematics
Departments
Univ (PhD)
Univ (MA)
Coll (BA)
Total
TABLE E.6 Number of sections, not including distance learning, of precollege-level courses
in mathematics departments taught by various types of instructor, by type of department in fall
2005, with fall 2000 figures in parentheses. (CBMS2000 data from Table E.13.)
Number of precollege-level sections taught by
Jan 2, 07; Dec 8;Sept 19; rev 8/14/06;
former E13; SRU=E5
Note: Round-off may make row and column sums seem inaccurate.

Enrollments in Four-Year Colleges and Universities 93
588
(683)
1849
(2007)
4079
(4397)
6517
(7087)
1457
(1159)
1373
(1747)
2385
(1407)
5215
(4313)
341
(na)
197
(na)
423
(na)
960
(na)
1176
(1261)
1657
(1760)
2998
(2676)
5831
(5697)
1902
(1714)
295
(419)
0
(0)
2196
(2133)
394
(215)
369
(573)
432
(507)
1196
(1295)
5517
(5032)
5543
(6506)
9895
(8987)
20955
(20525)
Mathematics
Departments
Univ (PhD)
Univ (MA)
Coll (BA)
Total
Tenured/
tenure-
eligible
Other
full-time
(total)
Other
full-time
(doctoral) Part-time GTA Ukn
Total
sections
TABLE E.7 Number of sections (excluding distance learning) of introductory-level courses
(including precalculus) in mathematics departments taught by various types of instructors, by
type of department in fall 2005, with fall 2000 figures in parentheses. (CBMS2000 data from
Table E.14.)
Number of introductory-level sections taught by
Jan 2,07;Sept 19; 8/14/06; former E14;
SRU=E.6
Note: Round-off may make row and column sums seem inaccurate.
3199
(3522)
2196
(3053)
5754
(4854)
11149
(11429)
1860
(1134)
375
(614)
900
(820)
3135
(2568)
1155
(na)
159
(na)
526
(na)
1841
(na)
726
(762)
402
(652)
520
(409)
1648
(1823)
1261
(1087)
16
(42)
107
(0)
1384
(1129)
650
(263)
249
(190)
108
(355)
1006
(808)
7696
(6768)
3237
(4551)
7388
(6438)
18321
(17757)
Mathematics
Departments
Univ (PhD)
Univ (MA)
Coll (BA)
Total
Tenured/
tenure-
eligible
Other
full-time
(total)
Other
full-time
(doctoral) Part-time GTA Ukn
Total
sections
TABLE E.8 Number of sections (excluding distance learning) of calculus-level courses in
mathematics departments taught by various types of instructor, by type of department in fall
2005, with fall 2000 figures in parentheses. (CBMS2000 data from Table E.15.)
Number of calculus-level sections taught by
Dec 8;Sept 19; August 14, 2006 ;SRU = E7
94 2005 CBMS Survey of Undergraduate Programs
145
(307)
441
(589)
1738
(1087)
2324
(1983)
144
(196)
80
(51)
224
(247)
219
(130)
185
(146)
366
(402)
770
(678)
111
(104)
75
(23)
186
(127)
73
(na)
34
(na)
90
(na)
197
(na)
60
(na)
22
(na)
82
(na)
104
(157)
250
(195)
987
(691)
1341
(1043)
88
(174)
24
(9)
112
(183)
136
(198)
15
(20)
0
(0)
151
(218)
172
(254)
0
(11)
172
(265)
25
(35)
34
(114)
100
(192)
159
(341)
180
(58)
7
(29)
187
(87)
629
(827)
924
(1064)
3191
(2372)
4744
(4263)
696
(786)
186
(123)
882
(909)
Mathematics
Departments
Univ (PhD)
Univ (MA)
Coll (BA)
Total Math Depts
Statistics
Departments
Univ (PhD)
Univ (MA)
Total Stat Depts
Tenured/
tenure-
eligible
Other
full-time
(total)
Other
full-time
(doctoral)
Part-
time GTA Ukn
Total
sections
Elementary
Statistics
Number of elementary-level statistics sections
taught by
TABLE E.9 Number of sections (excluding distance learning) of elementary level
statistics taught in mathematics departments and statistics departments, by type of
instructor and type of department in fall 2005 with fall 2000 figures in parentheses.
(CBMS2000 data from Table E.16.)
Jan 2, 07; Dec 8; Sept
19;rev 8/14/06; former
E16 then E9; SRU = E9
Note: Round-off may make row and column sums seem inaccurate.

Enrollments in Four-Year Colleges and Universities 95
31
(41)
187
(559)
1199
(1162)
1416
(1762)
44
(26)
50
(204)
168
(549)
262
(779)
24
(na)
0
(na)
55
(na)
79
(na)
10
(8)
127
(677)
256
(504)
393
(1189)
14
(6)
0
(0)
0
(12)
14
(18)
15
(11)
149
(113)
6
(330)
169
(454)
114
(92)
512
(1553)
1629
(2557)
2254
(4202)
Mathematics
Departments
Univ (PhD)
Univ (MA)
Coll (BA)
Total Mathematics
Depts
Tenured/
tenure-
eligible
Other full-
time
(total)
Other full-
time
(doctoral)
Part-
time GTA Ukn
Total
sections
Number of lower-level computer science
sections taught by
TABLE E.10 Number of sections (excluding distance learning) of lower-level computer science
taught in mathematics departments, by type instructor and type of department in fall 2005, with
fall 2000 figures in parentheses. (CBMS2000 data from Table E.17.)
Jan 2, 07; Sept 19; August 14, 2006 former E17, then E9,then E8.E9; SRU = E10
Note: Round-off may make row and column sums seem inaccurate.
19
(12)
72
(286)
613
(422)
703
(720)
36
(8)
11
(27)
98
(93)
145
(128)
19
(na)
0
(na)
70
(na)
89
(na)
3
(0)
6
(106)
6
(65)
15
(171)
3
(0)
0
(0)
0
(0)
3
(0)
0
(4)
33
(46)
22
(10)
55
(60)
61
(24)
121
(465)
739
(590)
921
(1079)
Mathematics
Departments
Univ (PhD)
Univ (MA)
Coll (BA)
Total Math Depts
Tenured/
tenure-
eligible
Other full-
time
(total)
Other full-
time
(doctoral)
Part-
time GTA Ukn
Total
sections
Number of middle-level computer science sections
taught by
TABLE E.11 Number of sections (excluding distance learning) of middle-level computer science
taught in mathematics departments, by type of instructor and type of department in fall 2005, with
fall 2000 figures in parentheses. (CBMS2000 data from Table E.18.)
Jan 2, 07; Sept 19; August 14, 2006; former E.18 then E11 then
E10;SRU=E11
Note: Round-off may make row and column sums seem inaccurate.
96 2005 CBMS Survey of Undergraduate Programs
Tables E.13 and E.14: Data on section sizes
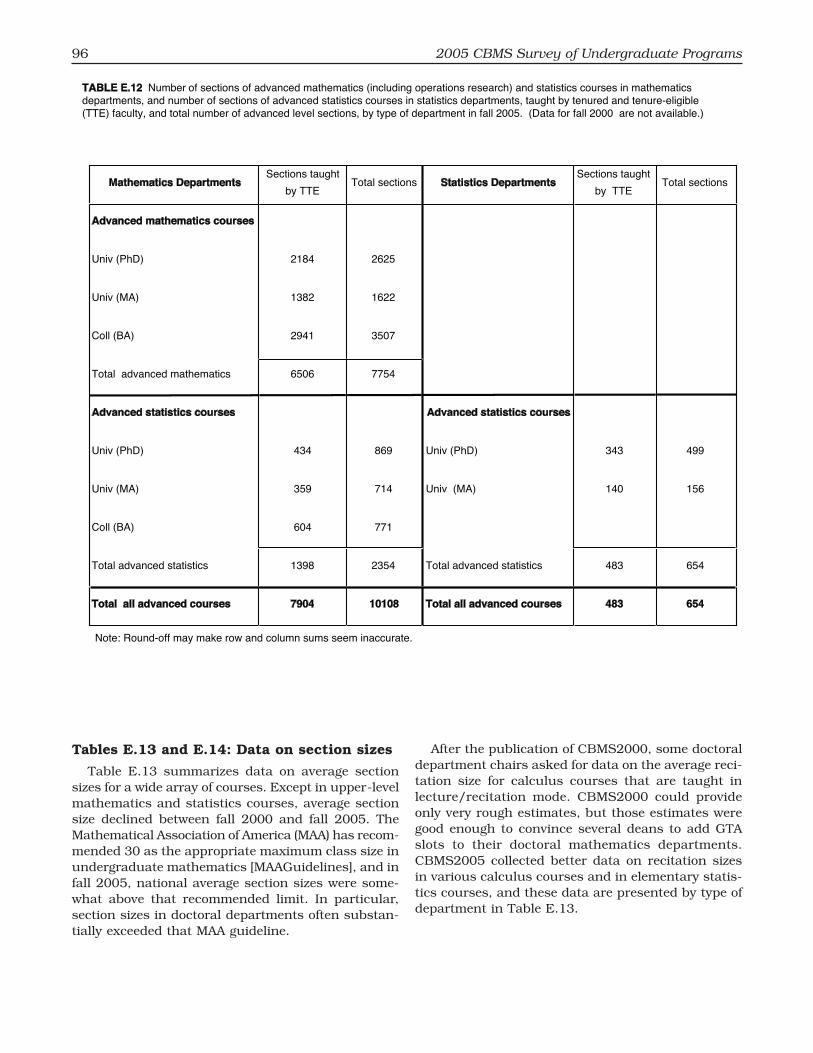
Table E.13 summarizes data on average sectionsizesforawidearrayofcourses.Exceptinupper-levelmathematicsandstatisticscourses,averagesectionsize declined between fall 2000 and fall 2005. TheMathematicalAssociationofAmerica(MAA)hasrecom-mended30astheappropriatemaximumclasssizeinundergraduatemathematics[MAAGuidelines],andinfall2005,nationalaveragesectionsizesweresome-what above that recommended limit. In particular,sectionsizesindoctoraldepartmentsoftensubstan-tiallyexceededthatMAAguideline.
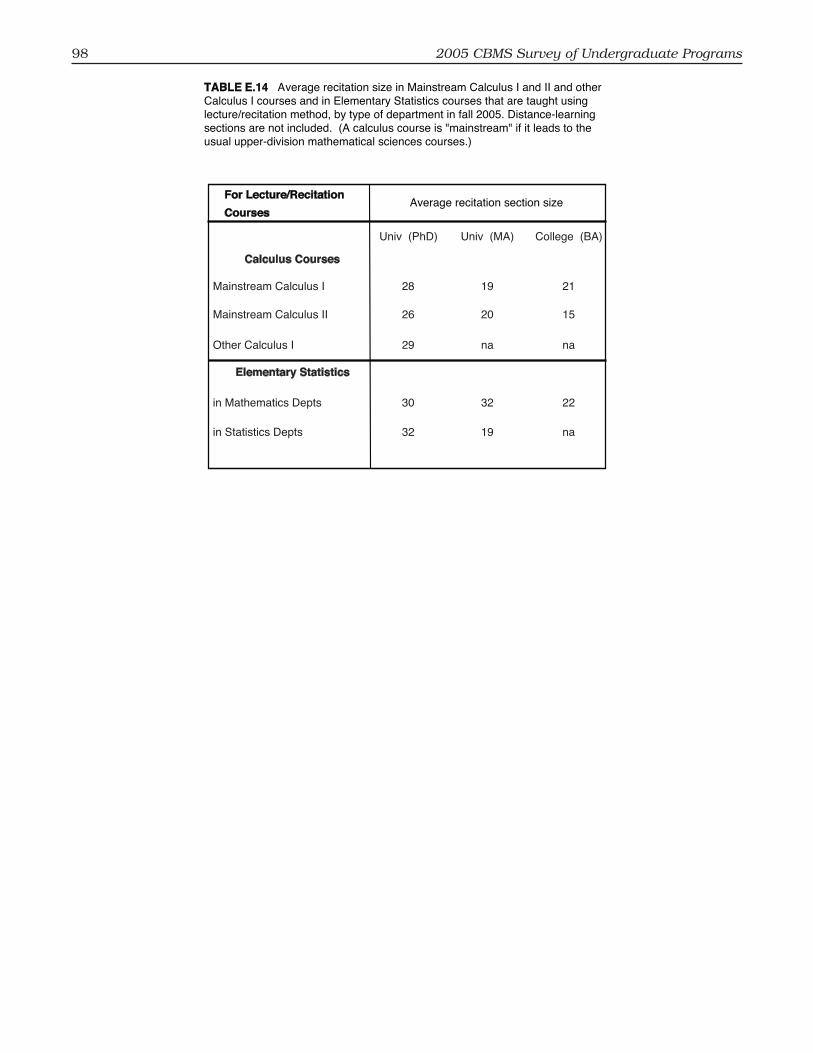
AfterthepublicationofCBMS2000,somedoctoraldepartmentchairsaskedfordataontheaveragereci-tation size for calculus courses that are taught inlecture/recitation mode. CBMS2000 could provideonlyveryroughestimates,butthoseestimatesweregoodenough toconvinceseveraldeans toaddGTAslots to their doctoral mathematics departments.CBMS2005 collected better data on recitation sizesinvariouscalculuscoursesandinelementarystatis-ticscourses,andthesedataarepresentedbytypeofdepartmentinTableE.13.
2184
1382
2941
6506
434
359
604
1398
7904
2625
1622
3507
7754
869
714
771
2354
10108
Advanced statistics courses
Univ (PhD)
Univ (MA)
Total advanced statistics
Total all advanced courses
343
140
483
483
499
156
654
654
Advanced mathematics courses
Univ (PhD)
Univ (MA)
Coll (BA)
Total advanced mathematics
Advanced statistics courses
Univ (PhD)
Univ (MA)
Coll (BA)
Total advanced statistics
Total all advanced courses
Sections taught
by TTETotal sections Statistics Departments
Sections taught
by TTETotal sectionsMathematics Departments
TABLE E.12 Number of sections of advanced mathematics (including operations research) and statistics courses in mathematics
departments, and number of sections of advanced statistics courses in statistics departments, taught by tenured and tenure-eligible
(TTE) faculty, and total number of advanced level sections, by type of department in fall 2005. (Data for fall 2000 are not available.)
Dec 8;Sept 18; 08/14/2006; new table; formerly E8, E11; SRU = E8
Note: Round-off may make row and column sums seem inaccurate.

Enrollments in Four-Year Colleges and Universities 97
40
(39)
48
(51)
45
(45)
20
(18)
47
(46)
17
(21)
25
(50)
19
(39)
15
(21)
31
(33)
34
(35)
27
(29)
15
(12)
34
(33)
13
(19)
22
(21)
8
(16)
8
(12)
22
(23)
25
(26)
21
(21)
10
(10)
26
(27)
13
(15)
18
(20)
8
(16)
7
(10)
60
(58)
40
(36)
16
(13)
48
(na)
0
(na)
63
(65)
22
(25)
66
(58)
16
(90)
0
(30)
31
35
35
16
37
24
24
15
14
31
34
31
12
38
19
22
14
12
29
35
32
13
37
22
22
22
11
28
33
32
14
35
19
19
9
8
Mathematics courses
Precollege
Introductory (incl. Precalc)
Calculus
Advanced Mathematics
Statistics courses
Elementary Statistics
Upper Statistics
CS courses
Lower CS
Middle CS
Upper CS
Univ
(PhD)
Univ
(MA)
Coll
(BA)
Univ
(PhD)
Univ
(MA)
All
Depts
1990
All
Depts
1995
All
Depts
2000
All
Depts
2005
TABLE E.13 Average section size (excluding distance learning) for undergraduate mathematics, statistics, and
computer science courses in mathematics and statistics departments, by level of course and type of department in
fall 2005, with fall 2000 data in parentheses. Also, all departments' average section sizes from previous CBMS
surveys. (CBMS2000 data from Table E.11.)
Average section size Fall 2005 (2000)
Mathematics Depts Statistics Depts
Jan 2, 07; Dec 8;Sept 19; Sept 2, 2006 from SRU data "E12new" ; former E11,E12 SRU=
E12new
98 2005 CBMS Survey of Undergraduate Programs
28
26
29
30
32
19
20
na
32
19
21
15
na
22
na
Calculus Courses
Mainstream Calculus I
Mainstream Calculus II
Other Calculus I
Elementary Statistics
in Mathematics Depts
in Statistics Depts
Univ (PhD) Univ (MA) College (BA)
TABLE E.14 Average recitation size in Mainstream Calculus I and II and other
Calculus I courses and in Elementary Statistics courses that are taught using
lecture/recitation method, by type of department in fall 2005. Distance-learning
sections are not included. (A calculus course is "mainstream" if it leads to the
usual upper-division mathematical sciences courses.)
Average recitation section size
Jan 2, 07; Dec 8;Sept 18; August 14, 2006; from 2nd SRU data
revision; SRU = E13
For Lecture/Recitation
Courses