chapter 2.0 – airport role and forecasts 2.0 – airport role and forecasts ... (uuu) operational...
TRANSCRIPT
Newport State Airport Airport Master Plan Colonel Robert F. Wood Airpark DRAFT
Rhode Island Airport Corporation The Louis Berger Group, Inc. October 26, 2007 – Page 2 - 1
Chapter 2.0 – Airport Role and Forecasts Forecasts are an essential step in the airport master process1. The forecasts reflect the projected levels of aviation demand at the airport. By developing a forecast, timely and cost effective improvements can be undertaken by the airport to serve the projected demand. Forecasts are an estimate of future activity levels and provide guidance that assists decision makers in making judgments for future airport development scenarios. It is important to understand that unforeseen changes in the aviation industry or economy can result in deviations between the forecast for a particular time period and actual events. The airport sponsor should be alerted to those changes and how those changes may affect the airport’s service level and needed facilities. It is also a basis for reviewing the master planning on a timely basis, (recommended at least every 5-years), to remain current on the impact of changes. In this Chapter, aviation forecasts are developed to reflect Newport State Airport’s (UUU) operational activity levels in five, ten and twenty year periods. They are also prepared in terms of a base case, as well as a low range and high range forecast. This format helps understand the airport’s needs under varying conditions and therefore is less sensitive to a specific change in an airport or industry condition. It is also effective where the historical data is more difficult to assemble for various reasons. The forecast for UUU involved multiple processes. It includes: identification of the service area, analyzing the historical growth, and evaluating the relationship between the number of based aircraft and the level of operations (take-offs and landings), demographics, business trends within the area, and new and emerging technologies in general aviation (GA). All this is more fully explained in this chapter. 2.1 Forecast Methodologies and Data In developing a forecast for general aviation airports, aircraft operations and based aircraft are the two key forecasts that guide the decisions as to the ultimate development needs of an airport. Furthermore, it should be understood that aviation forecasting is not an “exact science” so experienced aviation judgment and practical considerations will also influence the level of detail and effort required to establish reasonable forecast and the development decisions that result from them. The FAA Advisory Circular 150/5070-6B, Airport Master Plans, dated July 29, 2005, outlines the six standard steps in the forecasting process to include:
Identify aviation activity measures; Review previous airport forecasts; Gather the various types of data; Select the forecasting methodology; Apply the forecast methods and evaluate the results; and Compare the forecast results with the Federal Aviation Administration’s Terminal Area Forecast.
The FAA has outlined several acceptable forecasting methodologies and the selected methodology should be representative of the airport’s unique characteristics and the validity of the historical data. Some common forecasting methodologies include: 1 Reference: FAA Advisory Circular 150-5070-6B Airport Master Plans, July 29, 2005

Newport State Airport Airport Master Plan Colonel Robert F. Wood Airpark DRAFT
Rhode Island Airport Corporation The Louis Berger Group, Inc. October 26, 2007 – Page 2 - 2
Regression analysis – A statistical technique that ties aviation demand to economic measures. Regression analysis should be restricted to relatively simple models with independent variables for which reliable forecasts are available.
Trend analysis and extrapolation – Typically the historical pattern of an activity and projects this
trend into the future. This approach is useful where unusual local conditions differentiate the study airport from other airports in the region.
Market share analysis or ration analysis – This technique assumes a top-down relationship
between national, regional, and local forecasts. Local forecasts are a market share percentage of regional forecasts, which are a market share percentage of national forecasts. Historical market shares are calculated and used as a basis for projecting future market shares.
Smoothing – A statistical technique applied to historical data, given greater weight to the latest
trend and conditions at the airport; it can be effective in generating short-term forecasts.
Expert Judgment – This effort simply looks to utilize a combination of the methods presented above, but applies a level of expert judgment from local, regional and national aviation industry knowledge.
Choosing the appropriate forecasting methodology is as important as developing different forecasting scenarios to properly plan the future. Over the life of a forecast, unanticipated events (trend breakers like September 11, 2001, Severe Acute Respiratory Syndrome, Avian Flu, etc.) may take place that impact the anticipated activity levels at the airport. It is critical that the Airport, consistently review the developed forecast to determine how those unanticipated events impact the need for new or expanded facilities. For UUU, the master plan forecasts incorporate:
Socioeconomic data associated with the State of Rhode Island; Historical operations and based aircraft data; Forecasts developed for the General Aviation Manufacturers Association (GAMA); Federal Aviation Administration Aerospace Forecasts FY 2006-2017; Terminal Area Forecasts (TAF); and Rhode Island State Airport System Plan (RISASP) forecast December 2004.
For airports with greater than 100,000 total annual operations, or 100 based aircraft the five and ten year forecast must be approved by FAA prior to proceeding to the Facility Requirements analysis. The forecasts developed for UUU do not attain those levels and therefore the FAA only reviewed the forecasts. 2.1.1 Airport Service Area The market area served by UUU is designated in this report as the “airport service area”. The airport service area is defined by its proximity to other airports serving the needs of the general aviation community. Aviation demand corresponds with local and regional growth trends related to economic and demographic characteristics, geographic attributes, aviation related factors and other factors that may influence the demand for airport services. Aviation activity levels result from the interaction of demand and supply factors.
Newport State Airport Airport Master Plan Colonel Robert F. Wood Airpark DRAFT
Rhode Island Airport Corporation The Louis Berger Group, Inc. October 26, 2007 – Page 2 - 3
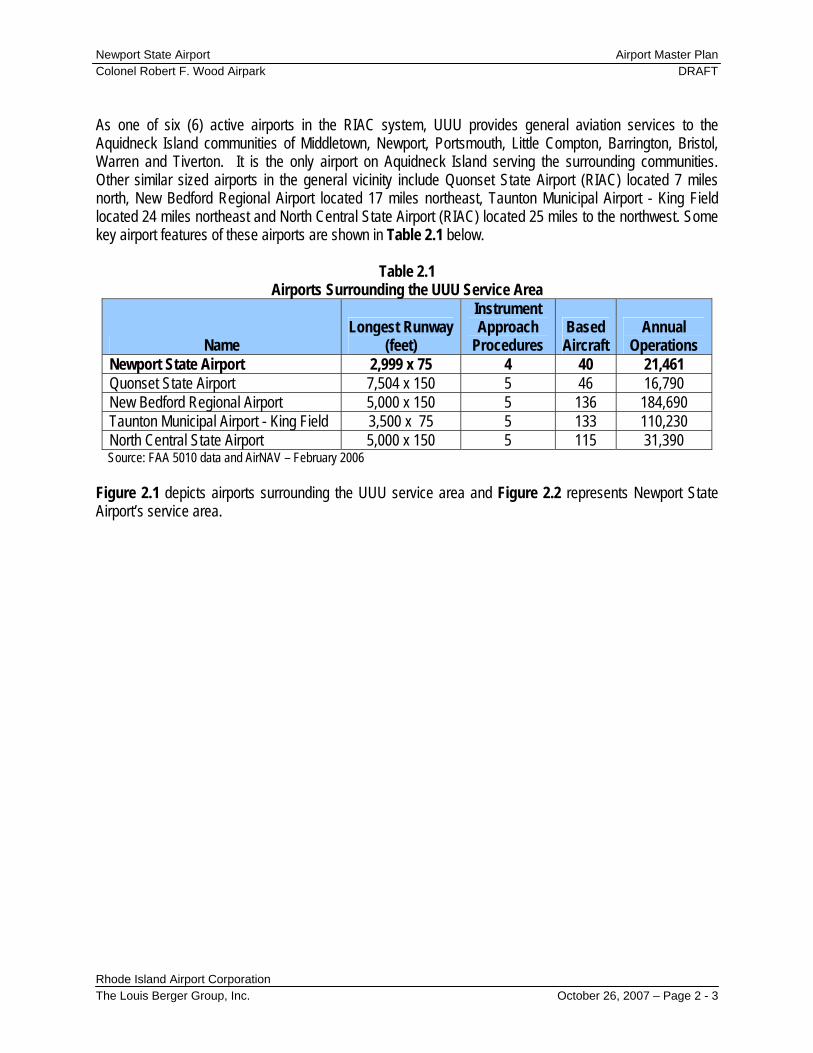
As one of six (6) active airports in the RIAC system, UUU provides general aviation services to the Aquidneck Island communities of Middletown, Newport, Portsmouth, Little Compton, Barrington, Bristol, Warren and Tiverton. It is the only airport on Aquidneck Island serving the surrounding communities. Other similar sized airports in the general vicinity include Quonset State Airport (RIAC) located 7 miles north, New Bedford Regional Airport located 17 miles northeast, Taunton Municipal Airport - King Field located 24 miles northeast and North Central State Airport (RIAC) located 25 miles to the northwest. Some key airport features of these airports are shown in Table 2.1 below.
Table 2.1 Airports Surrounding the UUU Service Area
Name Longest Runway
(feet)
Instrument Approach
Procedures Based
Aircraft Annual
Operations Newport State Airport 2,999 x 75 4 40 21,461 Quonset State Airport 7,504 x 150 5 46 16,790 New Bedford Regional Airport 5,000 x 150 5 136 184,690 Taunton Municipal Airport - King Field 3,500 x 75 5 133 110,230 North Central State Airport 5,000 x 150 5 115 31,390 Source: FAA 5010 data and AirNAV – February 2006
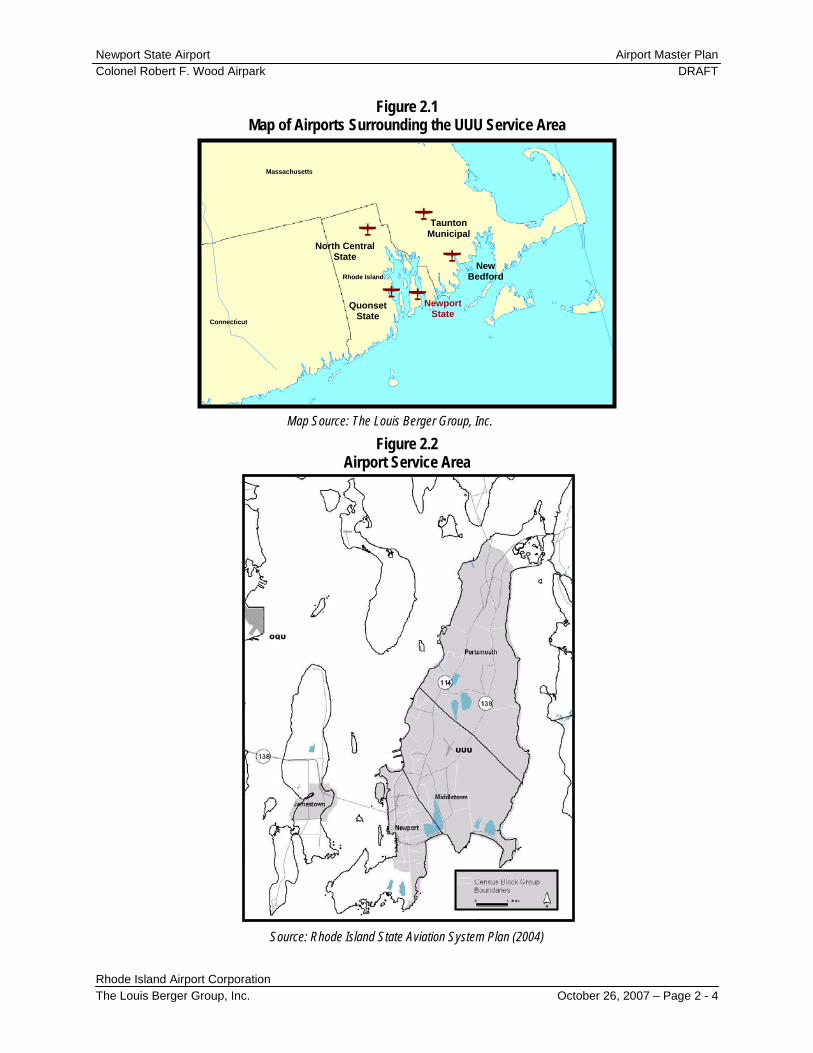
Figure 2.1 depicts airports surrounding the UUU service area and Figure 2.2 represents Newport State Airport’s service area.
Newport State Airport Airport Master Plan Colonel Robert F. Wood Airpark DRAFT
Rhode Island Airport Corporation The Louis Berger Group, Inc. October 26, 2007 – Page 2 - 4
Figure 2.1 Map of Airports Surrounding the UUU Service Area
Map Source: The Louis Berger Group, Inc.
Figure 2.2 Airport Service Area
Source: Rhode Island State Aviation System Plan (2004)
Massachusetts
Connecticut
Rhode Island
Newport State
North Central State
New Bedford
Quonset State
Taunton Municipal
Newport State Airport Airport Master Plan Colonel Robert F. Wood Airpark DRAFT
Rhode Island Airport Corporation The Louis Berger Group, Inc. October 26, 2007 – Page 2 - 5
2.1.2 Socioeconomic Data
In this section, a discussion of relevant socioeconomic data will helped depict operational demand at UUU. Socioeconomic trends are often an important indicator of an airport’s operational demand as a strong correlation exists between the economic activities of a market area and an airport’s operational demand. The correlation is supported by information on population, employment and economic data in a particular area as well as information on business and locations of airport users. In general, if an area experiences rapid increases in population, employment and strong economic figures, this generally leads to greater operational demand for an airport. Thus, it can be beneficial to understand the region’s socioeconomic data in order to anticipate airport growth. 2.1.2.1 Population
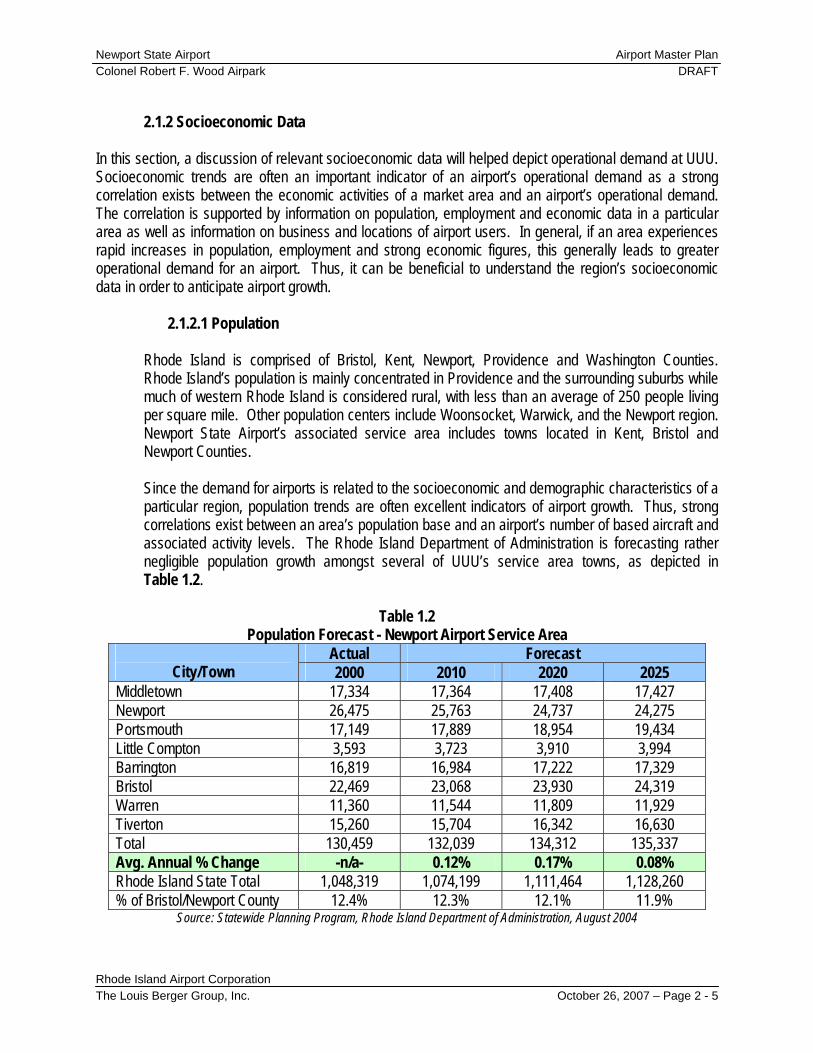
Rhode Island is comprised of Bristol, Kent, Newport, Providence and Washington Counties. Rhode Island’s population is mainly concentrated in Providence and the surrounding suburbs while much of western Rhode Island is considered rural, with less than an average of 250 people living per square mile. Other population centers include Woonsocket, Warwick, and the Newport region. Newport State Airport’s associated service area includes towns located in Kent, Bristol and Newport Counties. Since the demand for airports is related to the socioeconomic and demographic characteristics of a particular region, population trends are often excellent indicators of airport growth. Thus, strong correlations exist between an area’s population base and an airport’s number of based aircraft and associated activity levels. The Rhode Island Department of Administration is forecasting rather negligible population growth amongst several of UUU’s service area towns, as depicted in Table 1.2.
Table 1.2
Population Forecast - Newport Airport Service Area Actual Forecast
City/Town 2000 2010 2020 2025 Middletown 17,334 17,364 17,408 17,427 Newport 26,475 25,763 24,737 24,275 Portsmouth 17,149 17,889 18,954 19,434 Little Compton 3,593 3,723 3,910 3,994 Barrington 16,819 16,984 17,222 17,329 Bristol 22,469 23,068 23,930 24,319 Warren 11,360 11,544 11,809 11,929 Tiverton 15,260 15,704 16,342 16,630 Total 130,459 132,039 134,312 135,337 Avg. Annual % Change -n/a- 0.12% 0.17% 0.08% Rhode Island State Total 1,048,319 1,074,199 1,111,464 1,128,260 % of Bristol/Newport County 12.4% 12.3% 12.1% 11.9%
Source: Statewide Planning Program, Rhode Island Department of Administration, August 2004

Newport State Airport Airport Master Plan Colonel Robert F. Wood Airpark DRAFT
Rhode Island Airport Corporation The Louis Berger Group, Inc. October 26, 2007 – Page 2 - 6
It is anticipated that the population of Rhode Island will reach 1.12 million people by 2025, representing a 7.6% increase through the forecasting period. On average the State of Rhode Island’s population base will increase 0.3% annually over the next twenty-five years; however the Town of Newport’s population is forecasted to decrease 0.3% annually through the forecasting period. Although the Town of Newport’s population is decreasing, surrounding towns within the UUU service area are forecasted to marginally increase.
1.2.2.2 Employment
The Rhode Island Department of Labor and Training recently issued the State’s occupational outlook through 2014 and it is important to note that for this AMP, the Department’s forecast was extrapolated to 2025 to provide consistency with other figures used in this forecasting section. Table 2.3 depicts the extrapolated State of Rhode Island area employment forecast. The forecast’s occupational projections were based on changes in industry employment and changes in the mix of occupations that industries use. Declines in occupational projections were attributed to decreasing industry employment and technological advances with the particular industry.
Table 2.3
Area Employment - State of Rhode Island 2004 2006 2010 2015 2025
Total RI Employment1 518,145 529,203 551,792 581,234 612,246 % Change -n/a- 2.13% 4.26% 5.33% 5.33%
1Employment figures extrapolated to 2025. Source: Rhode Island Department of Labor and Training
The Department projected that the Rhode Island economy will generate 94,101 new jobs during the 2004-2025 forecasting period. The largest employment gains would occur in the health care and social assistance and accommodation and food services sectors, while the retail trade sector was forecasted to have the next largest increase. The largest employment decline is forecasted to occur in the manufacturing sector which follows a national trend. The loss of jobs will be spread across textile mills, fabricated metals and miscellaneous manufacturing businesses. Chemical manufacturing is one of the few industries within the manufacturing sector to expect an increase in employment. On average, minimal employment growth is expected to occur within the State of Rhode Island as supported in Table 2.3. The average annual growth rate in employment for the State equates to less than 1% annually over the forecasting period. These figures parallel previous employment area forecasts for the region.
1.2.2.3 U.S. Economy
The FAA traditionally publishes an annual Aerospace Forecast that covers a 12-year period. The FAA uses economic forecasts developed by the Executive Office of the President, Office of Management and Budget (OMB) to project domestic aviation demand within the published forecast. OMB develops both short and long-term economic outlooks to support the forecast that is used for manpower and facility planning as well as for policy and regulatory analysis. OMB’s long-term economic forecast was extrapolated to 2017 in order to better assess long-term growth. The
Newport State Airport Airport Master Plan Colonel Robert F. Wood Airpark DRAFT
Rhode Island Airport Corporation The Louis Berger Group, Inc. October 26, 2007 – Page 2 - 7
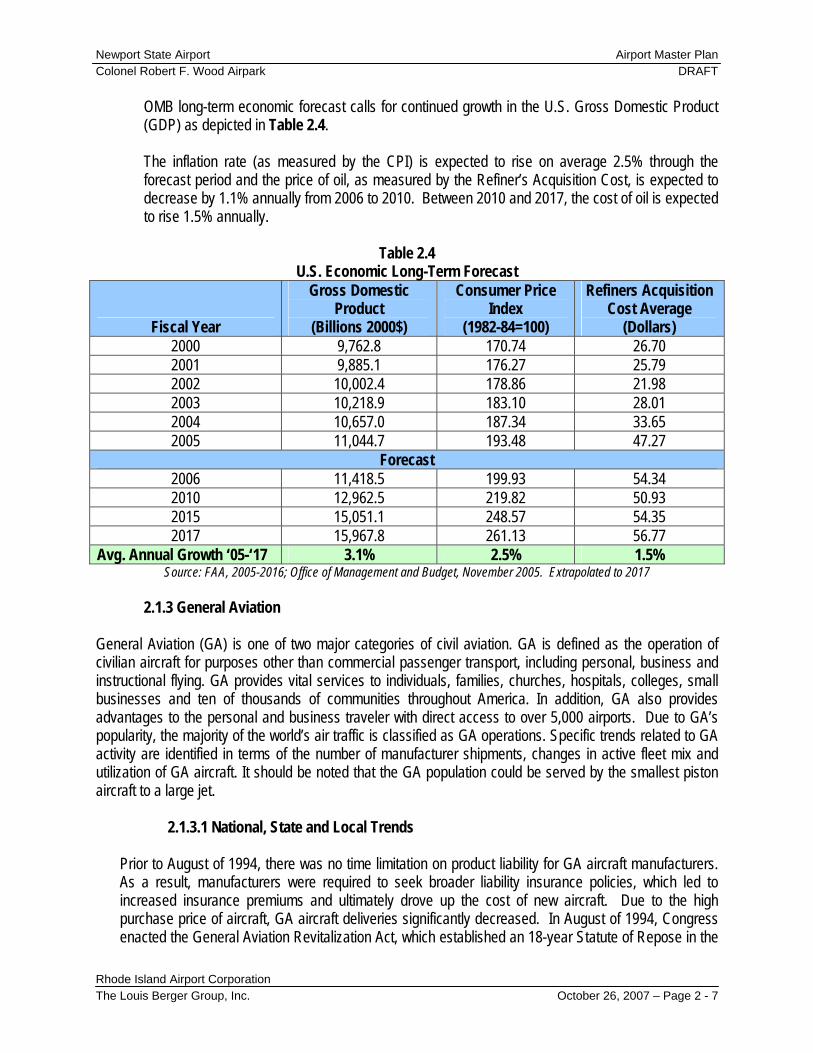
OMB long-term economic forecast calls for continued growth in the U.S. Gross Domestic Product (GDP) as depicted in Table 2.4. The inflation rate (as measured by the CPI) is expected to rise on average 2.5% through the forecast period and the price of oil, as measured by the Refiner’s Acquisition Cost, is expected to decrease by 1.1% annually from 2006 to 2010. Between 2010 and 2017, the cost of oil is expected to rise 1.5% annually.
Table 2.4
U.S. Economic Long-Term Forecast
Fiscal Year
Gross Domestic Product
(Billions 2000$)
Consumer Price Index
(1982-84=100)
Refiners Acquisition Cost Average
(Dollars) 2000 9,762.8 170.74 26.70 2001 9,885.1 176.27 25.79 2002 10,002.4 178.86 21.98 2003 10,218.9 183.10 28.01 2004 10,657.0 187.34 33.65 2005 11,044.7 193.48 47.27
Forecast 2006 11,418.5 199.93 54.34 2010 12,962.5 219.82 50.93 2015 15,051.1 248.57 54.35 2017 15,967.8 261.13 56.77
Avg. Annual Growth ‘05-‘17 3.1% 2.5% 1.5% Source: FAA, 2005-2016; Office of Management and Budget, November 2005. Extrapolated to 2017
2.1.3 General Aviation
General Aviation (GA) is one of two major categories of civil aviation. GA is defined as the operation of civilian aircraft for purposes other than commercial passenger transport, including personal, business and instructional flying. GA provides vital services to individuals, families, churches, hospitals, colleges, small businesses and ten of thousands of communities throughout America. In addition, GA also provides advantages to the personal and business traveler with direct access to over 5,000 airports. Due to GA’s popularity, the majority of the world’s air traffic is classified as GA operations. Specific trends related to GA activity are identified in terms of the number of manufacturer shipments, changes in active fleet mix and utilization of GA aircraft. It should be noted that the GA population could be served by the smallest piston aircraft to a large jet. 2.1.3.1 National, State and Local Trends
Prior to August of 1994, there was no time limitation on product liability for GA aircraft manufacturers. As a result, manufacturers were required to seek broader liability insurance policies, which led to increased insurance premiums and ultimately drove up the cost of new aircraft. Due to the high purchase price of aircraft, GA aircraft deliveries significantly decreased. In August of 1994, Congress enacted the General Aviation Revitalization Act, which established an 18-year Statute of Repose in the
Newport State Airport Airport Master Plan Colonel Robert F. Wood Airpark DRAFT
Rhode Island Airport Corporation The Louis Berger Group, Inc. October 26, 2007 – Page 2 - 8
manufacture of all GA industry aircraft and their components, in terms of liability. This change has led to several advances in the development of fixed-wing aircraft including:
New GA aircraft manufacturers entering the marketplace; Construction of new aircraft manufacturing facilities; Expansion of existing manufacturing facilities; and Increased expenditures on research and development of aircraft and avionics to make flying
safer and easier to learn.
As a result, GA manufacturers experienced increased aircraft deliveries, flight safety, and popularity. The positive trends associated with the GA industry as a result of this Congressional Act are anticipated to last well into the future.
2.1.3.2 FAA Terminal Area Forecast
2.1.3.2.1 Terminal Area Forecast: State of Rhode Island
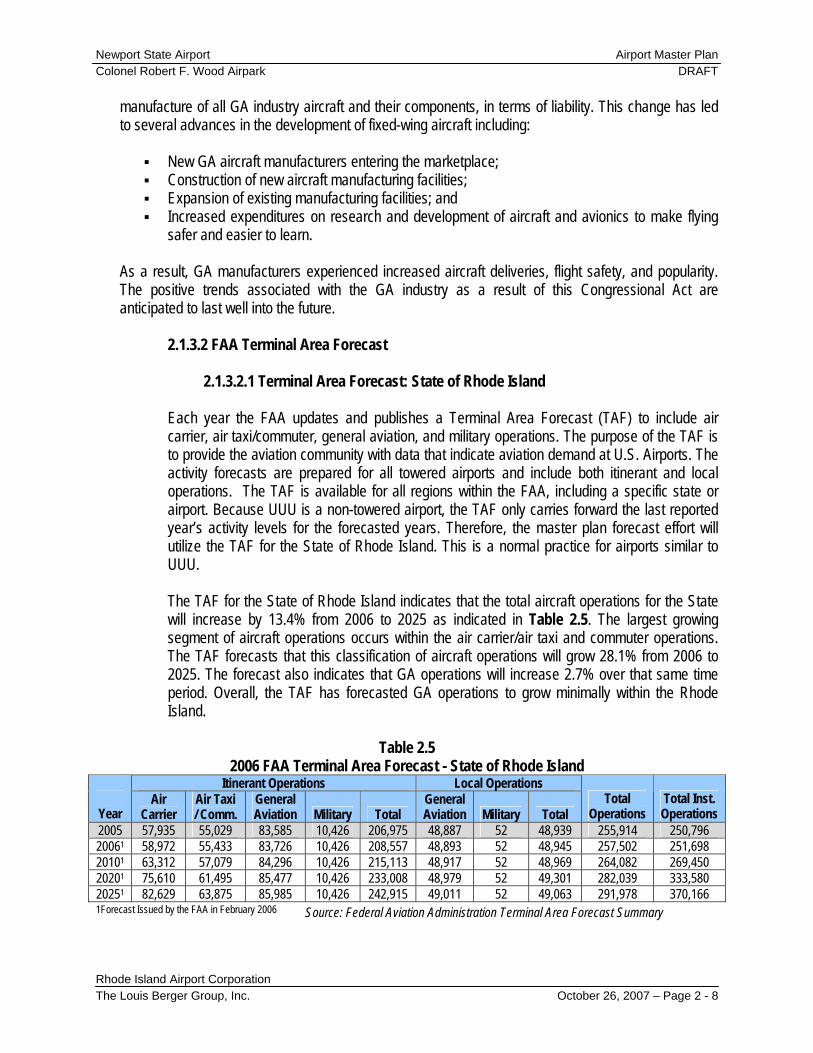
Each year the FAA updates and publishes a Terminal Area Forecast (TAF) to include air carrier, air taxi/commuter, general aviation, and military operations. The purpose of the TAF is to provide the aviation community with data that indicate aviation demand at U.S. Airports. The activity forecasts are prepared for all towered airports and include both itinerant and local operations. The TAF is available for all regions within the FAA, including a specific state or airport. Because UUU is a non-towered airport, the TAF only carries forward the last reported year’s activity levels for the forecasted years. Therefore, the master plan forecast effort will utilize the TAF for the State of Rhode Island. This is a normal practice for airports similar to UUU. The TAF for the State of Rhode Island indicates that the total aircraft operations for the State will increase by 13.4% from 2006 to 2025 as indicated in Table 2.5. The largest growing segment of aircraft operations occurs within the air carrier/air taxi and commuter operations. The TAF forecasts that this classification of aircraft operations will grow 28.1% from 2006 to 2025. The forecast also indicates that GA operations will increase 2.7% over that same time period. Overall, the TAF has forecasted GA operations to grow minimally within the Rhode Island.
Table 2.5
2006 FAA Terminal Area Forecast - State of Rhode Island Itinerant Operations Local Operations
Year
Air Carrier
Air Taxi / Comm.
General Aviation Military Total
General Aviation Military Total
Total Operations
Total Inst. Operations
2005 57,935 55,029 83,585 10,426 206,975 48,887 52 48,939 255,914 250,796 20061 58,972 55,433 83,726 10,426 208,557 48,893 52 48,945 257,502 251,698 20101 63,312 57,079 84,296 10,426 215,113 48,917 52 48,969 264,082 269,450 20201 75,610 61,495 85,477 10,426 233,008 48,979 52 49,301 282,039 333,580 20251 82,629 63,875 85,985 10,426 242,915 49,011 52 49,063 291,978 370,166 1Forecast Issued by the FAA in February 2006 Source: Federal Aviation Administration Terminal Area Forecast Summary

Newport State Airport Airport Master Plan Colonel Robert F. Wood Airpark DRAFT
Rhode Island Airport Corporation The Louis Berger Group, Inc. October 26, 2007 – Page 2 - 9
2.1.3.2.2 Aerospace Forecast FY 2006 – 2017: U.S. Active General Aviation and Air Taxi Forecast
The FAA Aerospace Forecast is another source of information that details a variety of forecasts for the aviation industry. The FAA develops forecasts in this document related to economic activity, commercial aviation, air cargo, commercial space transportation and general aviation to indicate aviation demand and activity. The FAA publishes this document to indicate industry trends and help guide the FAA to adjust policy accordingly. In this particular forecast, the FAA has included a new classification of aircraft titled “Sport Aircraft”, which is not currently included in the FAA’s registry counts. This classification was created in 2005 and the forecast assumes that registration of over 13,500 aircraft by 2017 will occur for the 12-year period. The FAA defines the sport aircraft classification as an aircraft with a maximum gross takeoff weight of less than 1,320 pounds for aircraft designed to operate from land; a maximum airspeed in level flight of 120 knots; either one or two seats; a fixed pitch or ground adjustable propeller; and a single reciprocating engine. An example of an aircraft in this classification of aircraft includes the Piper Cub. As indicated in Table 2.6, the active general aviation fleet is forecasted to increase at an average annual rate of 1.4% over the next 12-years. The largest amount of growth will occur in the fixed wing turbo jet classification. The anticipated growth would effectively double the fleet (100.2%) over the forecasting period. Piston type aircraft (single/multi-engine) are anticipated to experience negligible growth; however turbine aircraft (fixed-wing and rotorcraft) are anticipated to increase by 4.9% annually over the forecasting period.
Table 2.6
FAA - U.S. Active General Aviation and Air Taxi Aircraft Forecast FIXED WING
PISTON TURBINE ROTOCRAFT
Year Single Engine
Multi-Engine
Turbo Prop
Turbo Jet Piston Turbine
Exper-imental
Sport Aircraft Other Total
2005* 144,530 17,481 8,030 8,628 2,760 4,835 22,300 -n/a- 6,027 214,591 2007 145,660 17,520 8,430 9,520 3,460 5,095 22,900 2,295 5,965 220,845 2012 148,005 17,605 9,430 13,165 4945 5,820 24,350 10,940 5,820 240,080 2017 149,670 17,690 10,430 17,270 6,025 6,660 25,730 13,625 5,675 252,775 AAG 0.3% 0.1% 2.2% 6.0% 6.7% 2.7% 1.2% -n/a- -0.5% 1.4%
* denotes estimation Source: FAA Aerospace Forecasts, FY 2007-2017 2.1.3.3 General Aviation Manufactures Association (GAMA)
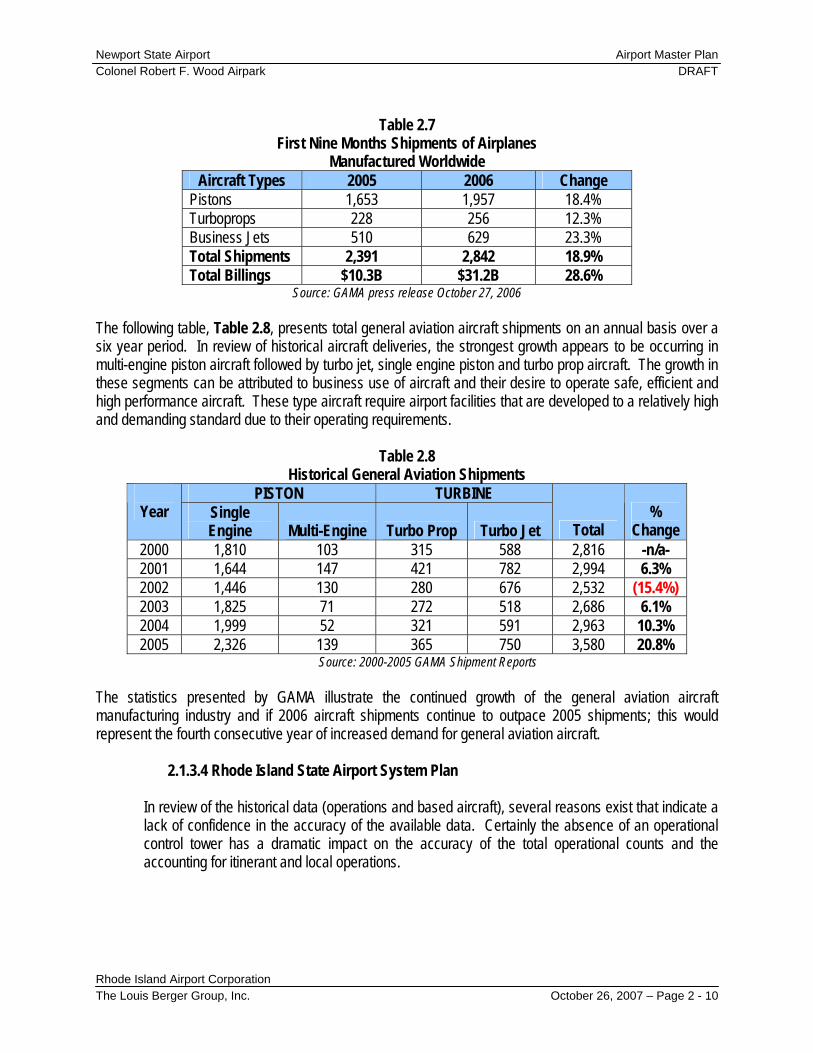
GAMA tracks and reports total shipments and billings of general aviation aircraft. GAMA statistics comparing the first nine months of 2005 and 2006 indicate relatively strong growth in sales of all types of general aviation aircraft as indicated in Table 2.7. A number of factors contribute to increased general aviation aircraft shipments to include the general strength of the U.S. economy, recreational flight, fractional ownership arrangements, microjets, and corporate businesses utilizing general aviation aircraft.
Newport State Airport Airport Master Plan Colonel Robert F. Wood Airpark DRAFT
Rhode Island Airport Corporation The Louis Berger Group, Inc. October 26, 2007 – Page 2 - 10
Table 2.7
First Nine Months Shipments of Airplanes Manufactured Worldwide
Aircraft Types 2005 2006 Change Pistons 1,653 1,957 18.4% Turboprops 228 256 12.3% Business Jets 510 629 23.3% Total Shipments 2,391 2,842 18.9% Total Billings $10.3B $31.2B 28.6%
Source: GAMA press release October 27, 2006 The following table, Table 2.8, presents total general aviation aircraft shipments on an annual basis over a six year period. In review of historical aircraft deliveries, the strongest growth appears to be occurring in multi-engine piston aircraft followed by turbo jet, single engine piston and turbo prop aircraft. The growth in these segments can be attributed to business use of aircraft and their desire to operate safe, efficient and high performance aircraft. These type aircraft require airport facilities that are developed to a relatively high and demanding standard due to their operating requirements.
Table 2.8
Historical General Aviation Shipments PISTON TURBINE
Year Single Engine Multi-Engine Turbo Prop Turbo Jet Total
% Change
2000 1,810 103 315 588 2,816 -n/a- 2001 1,644 147 421 782 2,994 6.3% 2002 1,446 130 280 676 2,532 (15.4%) 2003 1,825 71 272 518 2,686 6.1% 2004 1,999 52 321 591 2,963 10.3% 2005 2,326 139 365 750 3,580 20.8%
Source: 2000-2005 GAMA Shipment Reports The statistics presented by GAMA illustrate the continued growth of the general aviation aircraft manufacturing industry and if 2006 aircraft shipments continue to outpace 2005 shipments; this would represent the fourth consecutive year of increased demand for general aviation aircraft.
2.1.3.4 Rhode Island State Airport System Plan
In review of the historical data (operations and based aircraft), several reasons exist that indicate a lack of confidence in the accuracy of the available data. Certainly the absence of an operational control tower has a dramatic impact on the accuracy of the total operational counts and the accounting for itinerant and local operations.
Newport State Airport Airport Master Plan Colonel Robert F. Wood Airpark DRAFT
Rhode Island Airport Corporation The Louis Berger Group, Inc. October 26, 2007 – Page 2 - 11
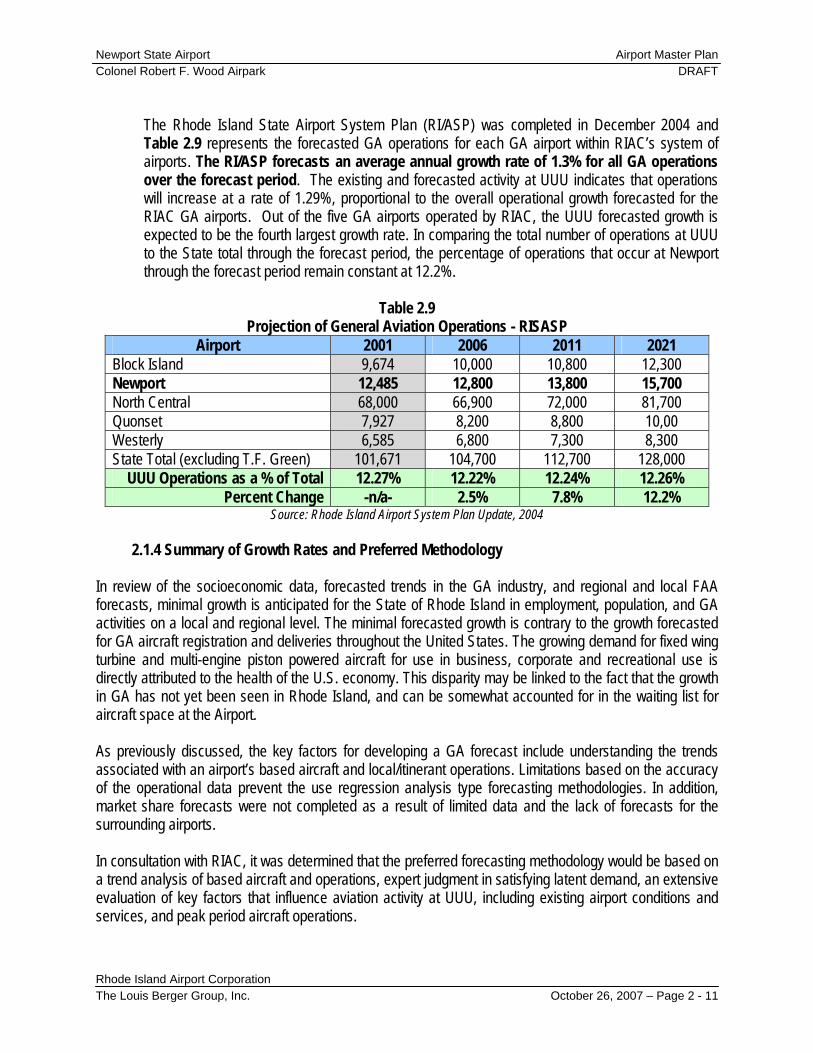
The Rhode Island State Airport System Plan (RI/ASP) was completed in December 2004 and Table 2.9 represents the forecasted GA operations for each GA airport within RIAC’s system of airports. The RI/ASP forecasts an average annual growth rate of 1.3% for all GA operations over the forecast period. The existing and forecasted activity at UUU indicates that operations will increase at a rate of 1.29%, proportional to the overall operational growth forecasted for the RIAC GA airports. Out of the five GA airports operated by RIAC, the UUU forecasted growth is expected to be the fourth largest growth rate. In comparing the total number of operations at UUU to the State total through the forecast period, the percentage of operations that occur at Newport through the forecast period remain constant at 12.2%.
Table 2.9
Projection of General Aviation Operations - RISASP Airport 2001 2006 2011 2021
Block Island 9,674 10,000 10,800 12,300 Newport 12,485 12,800 13,800 15,700 North Central 68,000 66,900 72,000 81,700 Quonset 7,927 8,200 8,800 10,00 Westerly 6,585 6,800 7,300 8,300 State Total (excluding T.F. Green) 101,671 104,700 112,700 128,000
UUU Operations as a % of Total 12.27% 12.22% 12.24% 12.26% Percent Change -n/a- 2.5% 7.8% 12.2%
Source: Rhode Island Airport System Plan Update, 2004
2.1.4 Summary of Growth Rates and Preferred Methodology In review of the socioeconomic data, forecasted trends in the GA industry, and regional and local FAA forecasts, minimal growth is anticipated for the State of Rhode Island in employment, population, and GA activities on a local and regional level. The minimal forecasted growth is contrary to the growth forecasted for GA aircraft registration and deliveries throughout the United States. The growing demand for fixed wing turbine and multi-engine piston powered aircraft for use in business, corporate and recreational use is directly attributed to the health of the U.S. economy. This disparity may be linked to the fact that the growth in GA has not yet been seen in Rhode Island, and can be somewhat accounted for in the waiting list for aircraft space at the Airport. As previously discussed, the key factors for developing a GA forecast include understanding the trends associated with an airport’s based aircraft and local/itinerant operations. Limitations based on the accuracy of the operational data prevent the use regression analysis type forecasting methodologies. In addition, market share forecasts were not completed as a result of limited data and the lack of forecasts for the surrounding airports. In consultation with RIAC, it was determined that the preferred forecasting methodology would be based on a trend analysis of based aircraft and operations, expert judgment in satisfying latent demand, an extensive evaluation of key factors that influence aviation activity at UUU, including existing airport conditions and services, and peak period aircraft operations.
Newport State Airport Airport Master Plan Colonel Robert F. Wood Airpark DRAFT
Rhode Island Airport Corporation The Louis Berger Group, Inc. October 26, 2007 – Page 2 - 12
The annual activity forecasts at UUU were derived from (1) the number of based aircraft, (2) an evaluation of the average number of operations per based aircraft, and (3) input from Airport users and RIAC staff. 2.2 Demand Factors
Future airport demand is driven by many factors, including the local and regional economy, competing airports, and new and emerging technologies. For the purposes of this Study, analyses of the following were performed to gain insight into the demand factors affecting UUU:
Based aircraft owner survey; Review of business and military use of UUU; and Other outside influences.
2.2.1 Based Aircraft Owner Survey
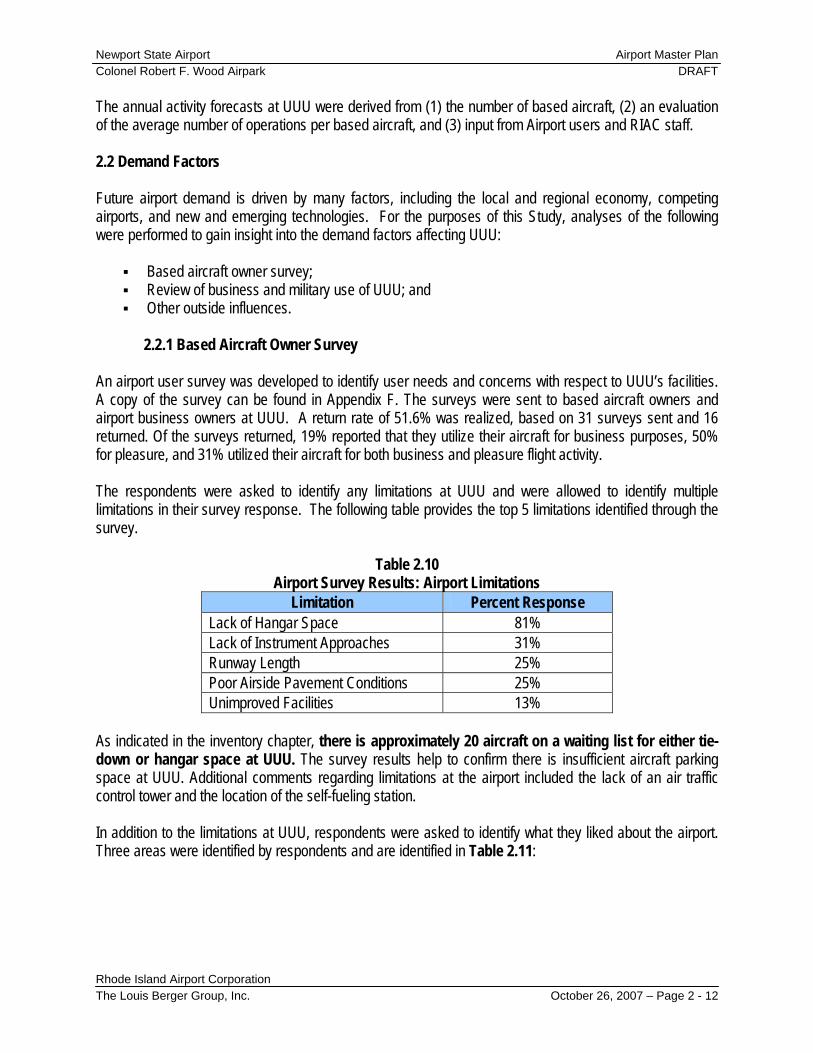
An airport user survey was developed to identify user needs and concerns with respect to UUU’s facilities. A copy of the survey can be found in Appendix F. The surveys were sent to based aircraft owners and airport business owners at UUU. A return rate of 51.6% was realized, based on 31 surveys sent and 16 returned. Of the surveys returned, 19% reported that they utilize their aircraft for business purposes, 50% for pleasure, and 31% utilized their aircraft for both business and pleasure flight activity. The respondents were asked to identify any limitations at UUU and were allowed to identify multiple limitations in their survey response. The following table provides the top 5 limitations identified through the survey.
Table 2.10 Airport Survey Results: Airport Limitations
Limitation Percent Response Lack of Hangar Space 81% Lack of Instrument Approaches 31% Runway Length 25% Poor Airside Pavement Conditions 25% Unimproved Facilities 13%
As indicated in the inventory chapter, there is approximately 20 aircraft on a waiting list for either tie-down or hangar space at UUU. The survey results help to confirm there is insufficient aircraft parking space at UUU. Additional comments regarding limitations at the airport included the lack of an air traffic control tower and the location of the self-fueling station. In addition to the limitations at UUU, respondents were asked to identify what they liked about the airport. Three areas were identified by respondents and are identified in Table 2.11:
Newport State Airport Airport Master Plan Colonel Robert F. Wood Airpark DRAFT
Rhode Island Airport Corporation The Louis Berger Group, Inc. October 26, 2007 – Page 2 - 13
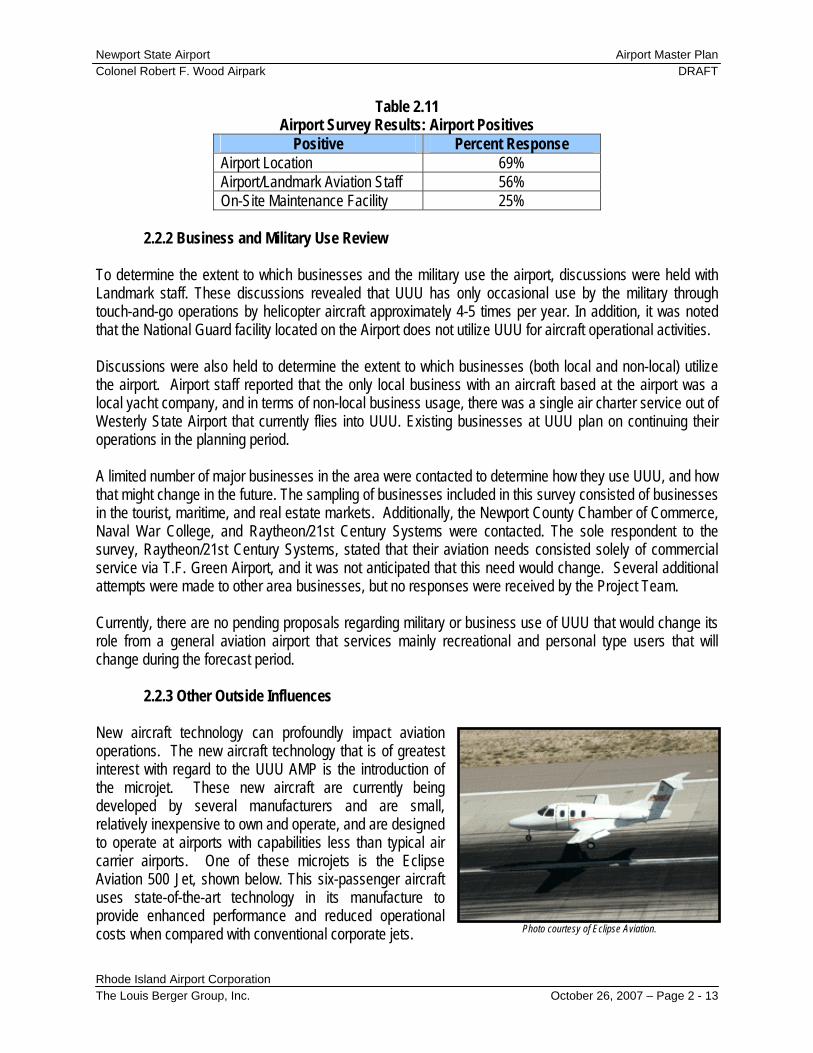
Table 2.11 Airport Survey Results: Airport Positives
Positive Percent Response Airport Location 69% Airport/Landmark Aviation Staff 56% On-Site Maintenance Facility 25%
2.2.2 Business and Military Use Review
To determine the extent to which businesses and the military use the airport, discussions were held with Landmark staff. These discussions revealed that UUU has only occasional use by the military through touch-and-go operations by helicopter aircraft approximately 4-5 times per year. In addition, it was noted that the National Guard facility located on the Airport does not utilize UUU for aircraft operational activities. Discussions were also held to determine the extent to which businesses (both local and non-local) utilize the airport. Airport staff reported that the only local business with an aircraft based at the airport was a local yacht company, and in terms of non-local business usage, there was a single air charter service out of Westerly State Airport that currently flies into UUU. Existing businesses at UUU plan on continuing their operations in the planning period. A limited number of major businesses in the area were contacted to determine how they use UUU, and how that might change in the future. The sampling of businesses included in this survey consisted of businesses in the tourist, maritime, and real estate markets. Additionally, the Newport County Chamber of Commerce, Naval War College, and Raytheon/21st Century Systems were contacted. The sole respondent to the survey, Raytheon/21st Century Systems, stated that their aviation needs consisted solely of commercial service via T.F. Green Airport, and it was not anticipated that this need would change. Several additional attempts were made to other area businesses, but no responses were received by the Project Team. Currently, there are no pending proposals regarding military or business use of UUU that would change its role from a general aviation airport that services mainly recreational and personal type users that will change during the forecast period.
2.2.3 Other Outside Influences
New aircraft technology can profoundly impact aviation operations. The new aircraft technology that is of greatest interest with regard to the UUU AMP is the introduction of the microjet. These new aircraft are currently being developed by several manufacturers and are small, relatively inexpensive to own and operate, and are designed to operate at airports with capabilities less than typical air carrier airports. One of these microjets is the Eclipse Aviation 500 Jet, shown below. This six-passenger aircraft uses state-of-the-art technology in its manufacture to provide enhanced performance and reduced operational costs when compared with conventional corporate jets. Photo courtesy of Eclipse Aviation.
Newport State Airport Airport Master Plan Colonel Robert F. Wood Airpark DRAFT
Rhode Island Airport Corporation The Louis Berger Group, Inc. October 26, 2007 – Page 2 - 14
Microjets are still in their infancy. Of all the microjets currently in development, the Eclipse 500 is the first microjet certified by the FAA. It is anticipated that actual production of the Eclipse will begin in 2007, with initial deliveries later in the year and 2008. In some cases, these airplanes will replace older business jets of similar capacity, and in other cases, the microjets may replace older turboprop aircraft. While less expensive than other jets (assuming the current cost estimate is maintained), the close to $1 million price tag will generally limit potential owners to those who already fly jets or turboprops. Charter operators may use the airplane, but again this will generally be to replace the existing fleet. 2.3 Activity Forecasts Activity forecasts of the master plan represent a range of annual aviation activity that UUU may experience through 2026. The forecasted activity levels are presented in five, ten and twenty year periods. Operational forecasting provides the basis for evaluating the type of facilities needed to meet demand. By comparing the existing facilities at the airport with the facilities needed to meet future demand, timely and cost effective improvements can be planned. FAA Order 5090.3C, Field Formulation of the National Plan of Integrated Airport Systems (NPIAS), dated December 4, 2000, says forecasts should be:
Realistic; Based on the latest available data; Reflect the current conditions at the airport; Supported by information in the study; and Provide an adequate justification for the airport planning and development.
The forecasts presented in this section reflect an analysis conducted on historical and forecasted data representative of both the airport and various regional, state and local indicators. An analysis was conducted to determine the number of based aircraft, based aircraft type, the average number of operations per based aircraft, and determine the airport’s total operations by type of operation (itinerant, local, military and air taxi). As previously indicated, a degree of uncertainty exists amongst the historical data and therefore certain forecasting techniques would prove to yield unrealistic figures. In lieu of the historical data deficiencies, a level of confidence can be placed on the specific historical data that was compiled by RIAC dating back to 1997. It is for these reasons that the forecast for UUU will be derived from historical data dating back to 1997 and considers other outside influences.
2.3.1 Historical Activity Review
Reviewing historical figures and examining the outside influences to an airport’s forecast is critical to its validity. Certain trends, correlations and growth figures were obtained and applied to developing the forecast. In UUU’s case, historical data such as based aircraft, total operations, population and employment figures, the U.S. economic outlook, the TAF for the State of Rhode Island, the GAMA forecast, and the current RISASP were examined. In review, the following are the average annual growth rates for the forecasted period:
Newport State Airport Airport Master Plan Colonel Robert F. Wood Airpark DRAFT
Rhode Island Airport Corporation The Louis Berger Group, Inc. October 26, 2007 – Page 2 - 15
FAA TAF State of Rhode Island – GA Operations .............0.1% Population .........................................................................0.3% FAA TAF State of Rhode Island – All Operations...............0.7% Employment ......................................................................0.8% Rhode Island State Airport System Plan ............................1.3% U.S. Economy ...................................................................3.7% General Aviation Manufactures Associations.....................5.6%
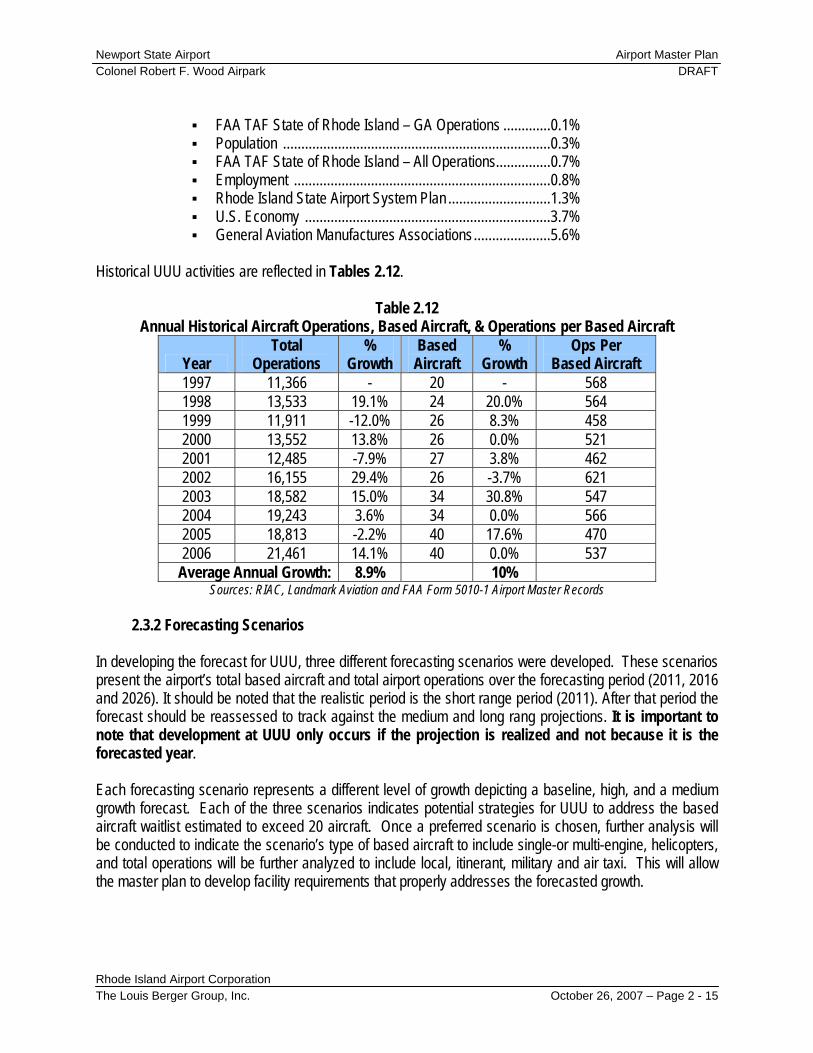
Historical UUU activities are reflected in Tables 2.12.
Table 2.12 Annual Historical Aircraft Operations, Based Aircraft, & Operations per Based Aircraft
Year Total
Operations %
Growth Based
Aircraft %
Growth Ops Per
Based Aircraft 1997 11,366 - 20 - 568 1998 13,533 19.1% 24 20.0% 564 1999 11,911 -12.0% 26 8.3% 458 2000 13,552 13.8% 26 0.0% 521 2001 12,485 -7.9% 27 3.8% 462 2002 16,155 29.4% 26 -3.7% 621 2003 18,582 15.0% 34 30.8% 547 2004 19,243 3.6% 34 0.0% 566 2005 18,813 -2.2% 40 17.6% 470 2006 21,461 14.1% 40 0.0% 537
Average Annual Growth: 8.9% 10% Sources: RIAC, Landmark Aviation and FAA Form 5010-1 Airport Master Records
2.3.2 Forecasting Scenarios
In developing the forecast for UUU, three different forecasting scenarios were developed. These scenarios present the airport’s total based aircraft and total airport operations over the forecasting period (2011, 2016 and 2026). It should be noted that the realistic period is the short range period (2011). After that period the forecast should be reassessed to track against the medium and long rang projections. It is important to note that development at UUU only occurs if the projection is realized and not because it is the forecasted year. Each forecasting scenario represents a different level of growth depicting a baseline, high, and a medium growth forecast. Each of the three scenarios indicates potential strategies for UUU to address the based aircraft waitlist estimated to exceed 20 aircraft. Once a preferred scenario is chosen, further analysis will be conducted to indicate the scenario’s type of based aircraft to include single-or multi-engine, helicopters, and total operations will be further analyzed to include local, itinerant, military and air taxi. This will allow the master plan to develop facility requirements that properly addresses the forecasted growth.

Newport State Airport Airport Master Plan Colonel Robert F. Wood Airpark DRAFT
Rhode Island Airport Corporation The Louis Berger Group, Inc. October 26, 2007 – Page 2 - 16
Forecast Scenario One – Baseline
This scenario utilizes a judgment growth rate of 1.5% annually. Forecast Scenario Two – High Growth
This scenario utilizes the trend analysis growth rates for based aircraft and operations of 3.97% and 3.63% respectively.
Forecast Scenario Three – Medium Growth
This scenario utilizes expert judgment and applies a “middle of the road” growth scenario from scenario one and two for based aircraft and operations of 2.47% and 2.13% respectively.
2.3.2.1 Forecast Scenario One - Baseline
Scenario One, represents the UUU baseline forecast. It continues growth without addressing the airport’s based aircraft waitlist. The judgment was made that given UUU surpassing the RI/ASP 1.3% annual growth rate that a 1.5% average annual growth rate was a conservative estimate. It is indicative of the UUU total operational growth as compared to other forecasted growth rates in the region’s employment, population and airport activity. It also includes consideration of the ten year average annual growth rate of 8.9% for operations and 10.0% for based aircraft. Therefore in this forecasting scenario, total operations and based aircraft were forecasted utilizing the average annual growth rate of 1.5%. Table 2.13 indicates that by not addressing the based aircraft waitlist and growth continues on the same rate, UUU is projected to reach 53 based aircraft and a total of 28,905 total operations by 2026.
Table 2.13
Forecasting Scenario One: Baseline Forecast
Year: Historical
2006 2011 2016 2026 Total Based Aircraft: 40 43 46 53
Total Airport Operations: 21,461 23,120 24,906 28,905 2.3.2.2 Forecast Scenario Two – High Growth
Scenario Two represents the high growth forecast. It addresses a significant amount of the based aircraft waitlist. This forecasting scenario indicates UUU is projected to reach 87 based aircraft and 43,703 total operations by 2026. In this forecast, trending was applied to both the UUU total local and itinerant operations, and based aircraft utilizing the “least squares” method, a trend analysis technique. The least squares method creates a predictive model and forecasts data in a linear trend to minimize error and yields a high degree of accuracy. Subsequent operational totals were derived based upon further calculations and the UUU historical operational averages. The average annual growth rate in this forecasting scenario was calculated at 3.63% for total operations and based aircraft grew at an average annual rate of 3.97%. Table 2.14 indicates the forecasted figures for this particular scenario.
Newport State Airport Airport Master Plan Colonel Robert F. Wood Airpark DRAFT
Rhode Island Airport Corporation The Louis Berger Group, Inc. October 26, 2007 – Page 2 - 17
Table 2.14
Forecasting Scenario Two: High Growth Forecast
Year: Historical
2006 2011 2016 2026 Based Aircraft: 40 52 63 87
Total Airport Operations: 21,461 27,126 32,431 43,703
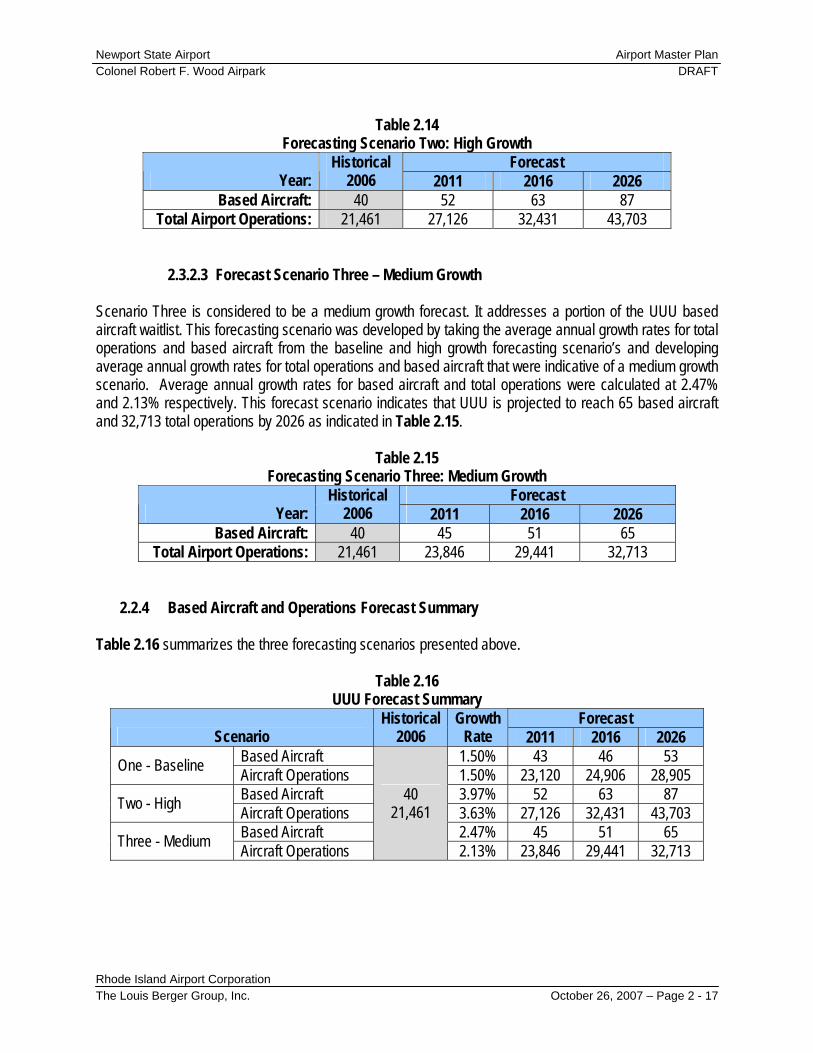
2.3.2.3 Forecast Scenario Three – Medium Growth Scenario Three is considered to be a medium growth forecast. It addresses a portion of the UUU based aircraft waitlist. This forecasting scenario was developed by taking the average annual growth rates for total operations and based aircraft from the baseline and high growth forecasting scenario’s and developing average annual growth rates for total operations and based aircraft that were indicative of a medium growth scenario. Average annual growth rates for based aircraft and total operations were calculated at 2.47% and 2.13% respectively. This forecast scenario indicates that UUU is projected to reach 65 based aircraft and 32,713 total operations by 2026 as indicated in Table 2.15.
Table 2.15 Forecasting Scenario Three: Medium Growth
Forecast Year:
Historical 2006 2011 2016 2026
Based Aircraft: 40 45 51 65 Total Airport Operations: 21,461 23,846 29,441 32,713
2.2.4 Based Aircraft and Operations Forecast Summary Table 2.16 summarizes the three forecasting scenarios presented above.
Table 2.16 UUU Forecast Summary
Forecast Scenario
Historical 2006
Growth Rate 2011 2016 2026
Based Aircraft 1.50% 43 46 53 One - Baseline Aircraft Operations 1.50% 23,120 24,906 28,905 Based Aircraft 3.97% 52 63 87 Two - High Aircraft Operations 3.63% 27,126 32,431 43,703 Based Aircraft 2.47% 45 51 65 Three - Medium Aircraft Operations
40 21,461
2.13% 23,846 29,441 32,713
Newport State Airport Airport Master Plan Colonel Robert F. Wood Airpark DRAFT
Rhode Island Airport Corporation The Louis Berger Group, Inc. October 26, 2007 – Page 2 - 18
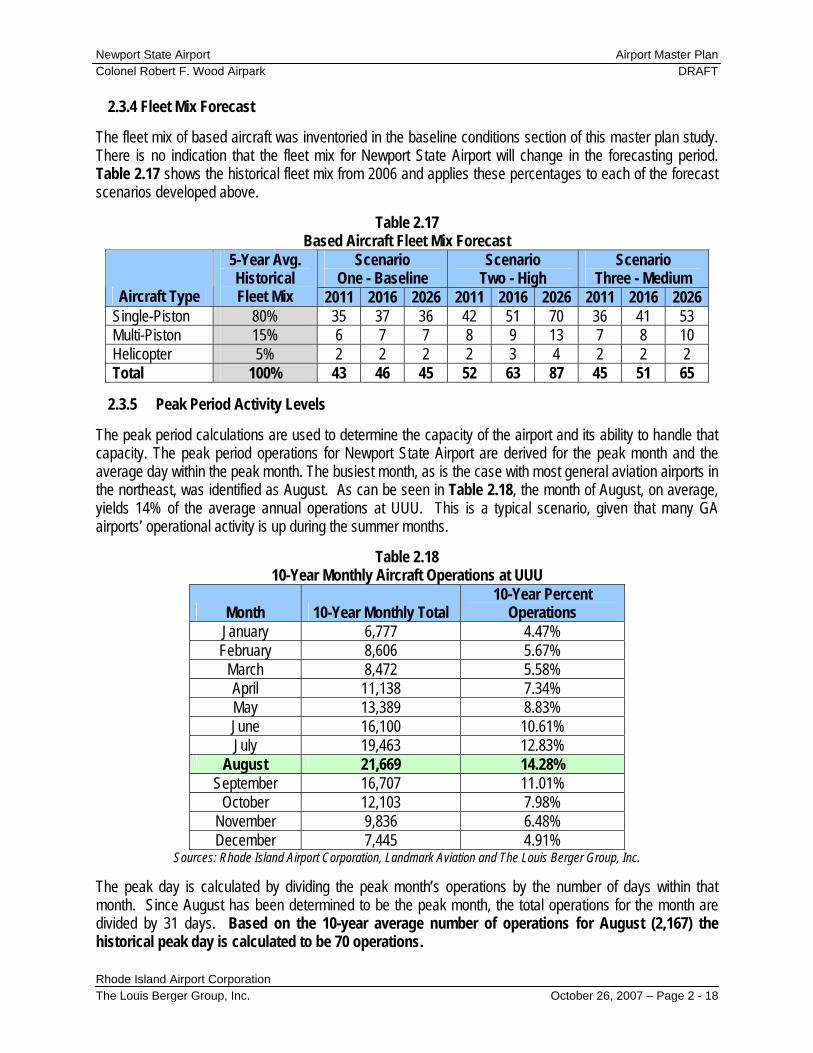
2.3.4 Fleet Mix Forecast The fleet mix of based aircraft was inventoried in the baseline conditions section of this master plan study. There is no indication that the fleet mix for Newport State Airport will change in the forecasting period. Table 2.17 shows the historical fleet mix from 2006 and applies these percentages to each of the forecast scenarios developed above.
Table 2.17 Based Aircraft Fleet Mix Forecast
Scenario One - Baseline
Scenario Two - High
Scenario Three - Medium
Aircraft Type
5-Year Avg. Historical Fleet Mix 2011 2016 2026 2011 2016 2026 2011 2016 2026
Single-Piston 80% 35 37 36 42 51 70 36 41 53 Multi-Piston 15% 6 7 7 8 9 13 7 8 10 Helicopter 5% 2 2 2 2 3 4 2 2 2 Total 100% 43 46 45 52 63 87 45 51 65
2.3.5 Peak Period Activity Levels
The peak period calculations are used to determine the capacity of the airport and its ability to handle that capacity. The peak period operations for Newport State Airport are derived for the peak month and the average day within the peak month. The busiest month, as is the case with most general aviation airports in the northeast, was identified as August. As can be seen in Table 2.18, the month of August, on average, yields 14% of the average annual operations at UUU. This is a typical scenario, given that many GA airports’ operational activity is up during the summer months.
Table 2.18 10-Year Monthly Aircraft Operations at UUU
Month 10-Year Monthly Total 10-Year Percent
Operations January 6,777 4.47% February 8,606 5.67%
March 8,472 5.58% April 11,138 7.34% May 13,389 8.83% June 16,100 10.61% July 19,463 12.83%
August 21,669 14.28% September 16,707 11.01%
October 12,103 7.98% November 9,836 6.48% December 7,445 4.91%
Sources: Rhode Island Airport Corporation, Landmark Aviation and The Louis Berger Group, Inc. The peak day is calculated by dividing the peak month’s operations by the number of days within that month. Since August has been determined to be the peak month, the total operations for the month are divided by 31 days. Based on the 10-year average number of operations for August (2,167) the historical peak day is calculated to be 70 operations.
Newport State Airport Airport Master Plan Colonel Robert F. Wood Airpark DRAFT
Rhode Island Airport Corporation The Louis Berger Group, Inc. October 26, 2007 – Page 2 - 19
2.4 Airport Role The Airport role for UUU is based on the type of aircraft using the facility and the aviation activity it services. In part it is also dependent by the role defined by in the RI/ASP. These factors are considered before the airport role is defined in the FAA National Plan of Integrated Airport System (NPIAS). Not to be discounted is the location of UUU on Aquidneck Island. It serves an important emergency relief role. UUU serves as a point of ingress and egress to the Island via air for necessary medical and life safety supply services.
2.4.1 Airport Classification
The FAA established the NPIAS as a result of the Airport and Airways Improvement Act of 1982. The plan identifies 3,431 airports that are significant to national air transportation, and therefore, eligible to receive grants under the FAA Airport Improvement Program (AIP). It is a assessment report to Congress on the airport system and the needs of eligible infrastructure development. Within the NPIAS, airports are classified by their type of service, such as general aviation, commercial, and primary service. The NPIAS also defines each airport’s role, that is, the routes and markets served by the facility Since Newport Airport has no regularly scheduled air service, the NPIAS only reports based aircraft numbers. The 2007-2011 NPIAS classifies UUU as a “General Aviation” airport. This is also consistent with the role assigned in the Rhode Island Airport System Plan, December 2004.
2.4.2 Services
The FAA Advisory Circular (AC) 150/5300-13, Airport Design, recommends the applicable design parameters critical for airports to consider during the master planning process. It is based on an airport’s classification and design aircraft, which in turn is related to current and future demand. Services and design features to be considered include the runway, taxiway, apron, service facilities and life safety systems of the airport. For the purposes of this study, service and life safety support facilities are defined as the terminal and hangar facilities, fuel farm, maintenance storage facilities, aircraft parking, and the emergency electrical vault.
2.4.3 Design Aircraft
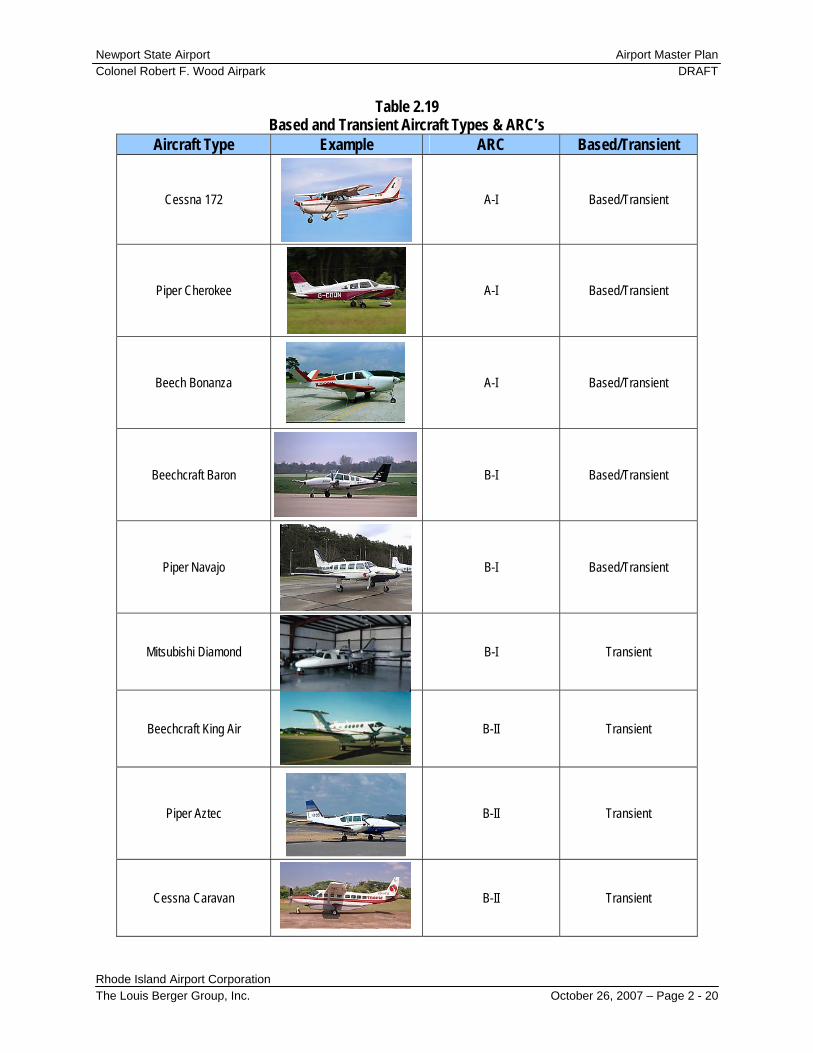
As stated in Section 1, the Airport Reference Code (ARC) is related to the operational and physical characteristics of the aircraft operating at the field. Defining the ARC is a critical step in any airport master plan update because it drives the airfield requirements. The ARC influences the FAA design criteria for the design of runways, taxiways, aprons, aprons, and servicing facilities. They in turn will help define the constraints that may evolve during airport alternatives analysis that is conducted in the subsequent chapter of the AMP report. In previous studies UUU has been identified as serving aircraft from Approach Category B and Design Group II (B-II). Based on discussions with Landmark Aviation, who operates the airport, the existing fleet reflects the aircraft that primarily utilizes the airport and it is their opinion that it will not change over the planning period. Table 2.19 identifies typical based and transient aircraft that use UUU and their associated ARC.
Newport State Airport Airport Master Plan Colonel Robert F. Wood Airpark DRAFT
Rhode Island Airport Corporation The Louis Berger Group, Inc. October 26, 2007 – Page 2 - 20
Table 2.19 Based and Transient Aircraft Types & ARC’s
Aircraft Type Example ARC Based/Transient
Cessna 172
A-I Based/Transient
Piper Cherokee
A-I Based/Transient
Beech Bonanza
A-I Based/Transient
Beechcraft Baron
B-I Based/Transient
Piper Navajo
B-I Based/Transient
Mitsubishi Diamond
B-I Transient
Beechcraft King Air
B-II Transient
Piper Aztec
B-II Transient
Cessna Caravan
B-II Transient

Newport State Airport Airport Master Plan Colonel Robert F. Wood Airpark DRAFT
Rhode Island Airport Corporation The Louis Berger Group, Inc. October 26, 2007 – Page 2 - 21
The forecast analysis conducted in this chapter of the UUU airport master plan reaffirms the conclusion arrived at during the recent RI Airport System Plan dated December 2004 and the consensus of operators at the airport. We therefore conclude that the family of aircraft anticipated to be served by UUU during the forecast period is Approach Category B and Design Group II2 or an ARC designation of B-II. This means that the airport is designed to serve aircraft that have an approach speed of 91 knots or more, but less than 121 knots, and a wingspan of 49 feet or more, but less than 79 feet. Representative aircraft in this category can include anything from the Beech King Air C-90 to the Cessna 441 Conquest. Table 2.19 above identifies some of these aircraft. The facility requirements section of this study will review the adequacies of the airport in serving B-II type aircraft.
2 See FAA Advisory Circular 150/5300-13 Appendix 9 and 13
Newport State Airport Airport Master Plan Colonel Robert F. Wood Airpark DRAFT
Rhode Island Airport Corporation The Louis Berger Group, Inc. October 26, 2007 – Page 2 - 22
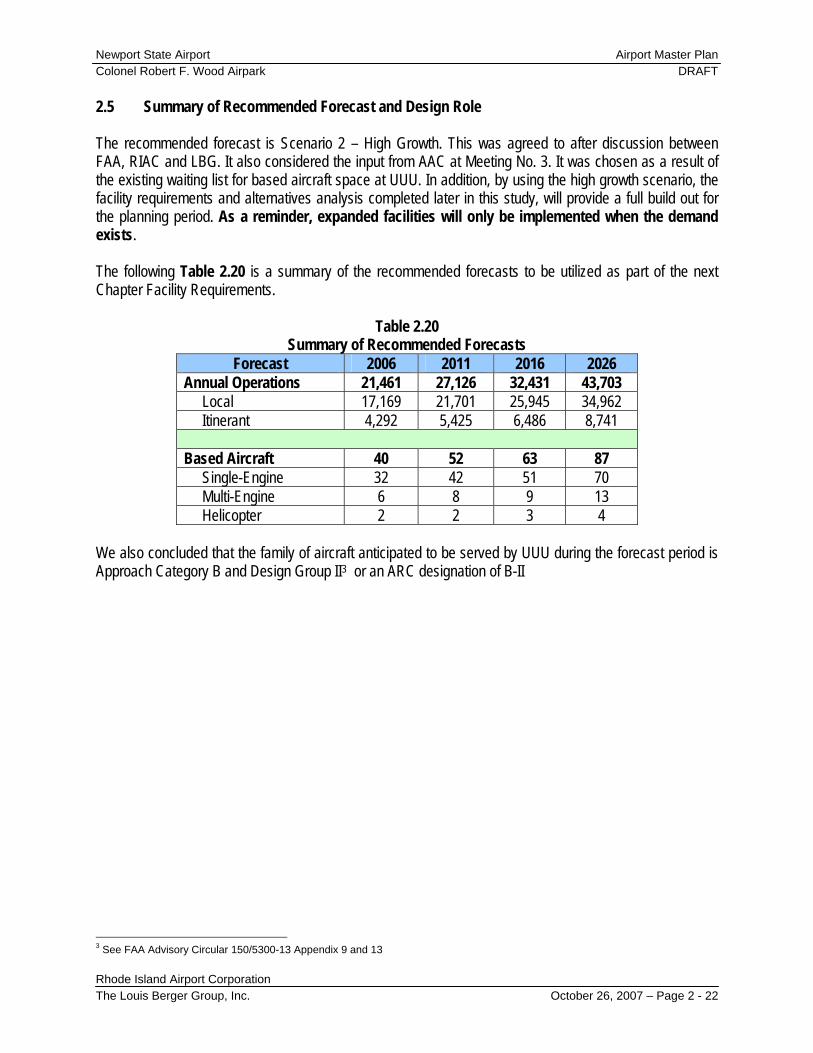
2.5 Summary of Recommended Forecast and Design Role The recommended forecast is Scenario 2 – High Growth. This was agreed to after discussion between FAA, RIAC and LBG. It also considered the input from AAC at Meeting No. 3. It was chosen as a result of the existing waiting list for based aircraft space at UUU. In addition, by using the high growth scenario, the facility requirements and alternatives analysis completed later in this study, will provide a full build out for the planning period. As a reminder, expanded facilities will only be implemented when the demand exists. The following Table 2.20 is a summary of the recommended forecasts to be utilized as part of the next Chapter Facility Requirements.
Table 2.20 Summary of Recommended Forecasts
Forecast 2006 2011 2016 2026 Annual Operations 21,461 27,126 32,431 43,703 Local 17,169 21,701 25,945 34,962 Itinerant 4,292 5,425 6,486 8,741
Based Aircraft 40 52 63 87 Single-Engine 32 42 51 70 Multi-Engine 6 8 9 13 Helicopter 2 2 3 4
We also concluded that the family of aircraft anticipated to be served by UUU during the forecast period is Approach Category B and Design Group II3 or an ARC designation of B-II
3 See FAA Advisory Circular 150/5300-13 Appendix 9 and 13