wellington international airport air traffic forecasts wial runway... · wellington international...
TRANSCRIPT
z
Wellington International Airport Air Traffic Forecasts
PREPARED FOR
Wellington International Airport Limited
PREPARED BY
InterVISTAS Consulting Inc.
DRAFT OF 20 October 2015
DRAFT REPORT
Draft Results - May Be Subject to Change
Wellington International Airport Air Traffic Forecasts – DRAFT of 20 October 2015 i
Executive Summary
Wellington International Airport Limited commissioned InterVISTAS Consulting Inc. (InterVISTAS) to
produce airport activity forecasts for Wellington International Airport (WLG) over the years 2015-2060.
This work consists of two parts:
Part A: Business As Usual Airport Traffic Forecast consisting of both passenger and aircraft
movement forecasts under a scenario where WLG’s runway infrastructure is unchanged (i.e., no
lengthening of the runway).
Part B: Forecast of a Runway Extension Scenario consisting of both passenger and aircraft
movement forecast under a scenario where WLG’s runway length is extended allowing the
operation of larger aircraft types. Services are assumed to start on the extended runway in FY2021.
Risk analysis was also conducted to examine the impact of multiple risk factors on the air traffic
outlook and to determine the criteria for the high and low forecast outcomes. The risk analysis is
documented in the body of the report.
Air Passenger Forecasts
Constrained Business as Usual Forecast
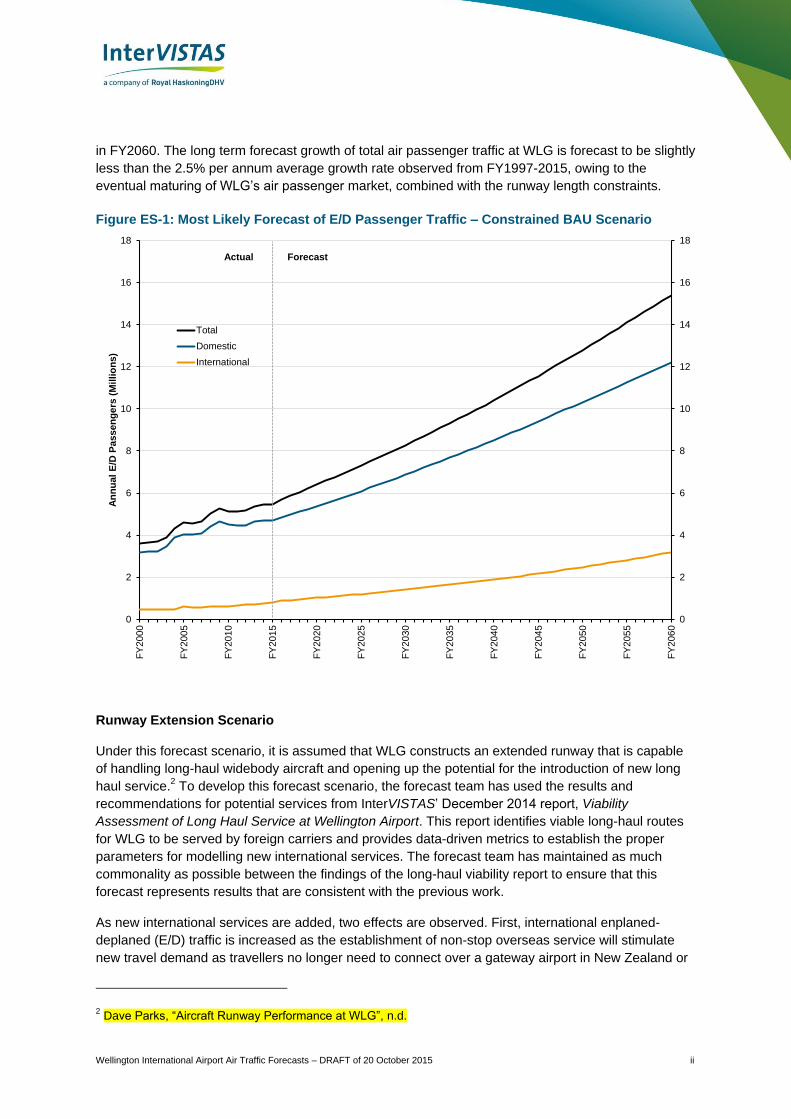
The Most Likely constrained Business as Usual (BAU) forecast of passenger traffic at WLG is
presented in Figure ES-1. Domestic traffic is forecast to grow by an average of 2.1% per annum
over the forecast period (up to FY2060). Domestic passenger growth in the BAU scenario is projected
to accelerate over the period FY2015-2020 as new domestic trunk and regional capacity is added and
Air New Zealand phases out its 737-300 aircraft from service at WLG and adds additional ATR72
services on trunk and regional routes. This additional capacity is expected to stimulate demand, either
by meeting underserved demand for domestic air travel or indirectly through pricing. In the longer
term, domestic traffic is expected to grow as the New Zealand economy grows, although the rate of
growth is projected to attenuate as the market matures.1 By FY2035, domestic air passenger traffic is
forecast to reach approximately 7.7 million passengers, and by FY2060 about 12.2 million
passengers.
International traffic at WLG is forecast to grow at a faster rate than domestic traffic in the
constrained BAU scenario given the continuations of the operational limitations placed on carriers by
the runway’s current length with service only available to Australia and the Pacific Islands. Growth is
forecast to average 3.7% per annum in the coming 20 years (to FY2035) and average 3.1% per
annum overall from FY2015-FY2060. International seat capacity is projected to grow strongly in
FY2016/17 with Jetstar significantly increasing capacity to Australia from WLG. Fiji Airways is
introducing year-round service to Nadi beginning in FY2016, which is projected to treble seat capacity
to the Pacific Islands. International air passengers are forecast to grow to 1.6 million passengers in
FY2035 and to 3.2 million passengers in FY2060.
Total traffic at WLG is forecast to grow at an average annual rate of 2.3% per annum over the
forecast period (to FY2060), reaching 9.3 million passengers in FY2035 and 15.4 million passengers
1 The reason for the attenuation is twofold: firstly, as the potential of the airport is realized, the easier
opportunities for service expansions are exploited reducing opportunities for further growth; the second reasons is arithmetical – higher traffic increases are required to achieve the same growth rate, e.g., a 5% increase on a base of 10 million passengers requires twice as much traffic growth on a base of 5 million passengers.
Wellington International Airport Air Traffic Forecasts – DRAFT of 20 October 2015 ii
in FY2060. The long term forecast growth of total air passenger traffic at WLG is forecast to be slightly
less than the 2.5% per annum average growth rate observed from FY1997-2015, owing to the
eventual maturing of WLG’s air passenger market, combined with the runway length constraints.
Figure ES-1: Most Likely Forecast of E/D Passenger Traffic – Constrained BAU Scenario
Runway Extension Scenario
Under this forecast scenario, it is assumed that WLG constructs an extended runway that is capable
of handling long-haul widebody aircraft and opening up the potential for the introduction of new long
haul service.2 To develop this forecast scenario, the forecast team has used the results and
recommendations for potential services from InterVISTAS’ December 2014 report, Viability
Assessment of Long Haul Service at Wellington Airport. This report identifies viable long-haul routes
for WLG to be served by foreign carriers and provides data-driven metrics to establish the proper
parameters for modelling new international services. The forecast team has maintained as much
commonality as possible between the findings of the long-haul viability report to ensure that this
forecast represents results that are consistent with the previous work.
As new international services are added, two effects are observed. First, international enplaned-
deplaned (E/D) traffic is increased as the establishment of non-stop overseas service will stimulate
new travel demand as travellers no longer need to connect over a gateway airport in New Zealand or
2 Dave Parks, “Aircraft Runway Performance at WLG”, n.d.
0
2
4
6
8
10
12
14
16
18
0
2
4
6
8
10
12
14
16
18
FY
200
0
FY
200
5
FY
201
0
FY
201
5
FY
202
0
FY
202
5
FY
203
0
FY
203
5
FY
204
0
FY
204
5
FY
205
0
FY
205
5
FY
206
0
An
nu
al
E/D
Pa
ss
en
ge
rs (
Mil
lio
ns
)
Total
Domestic
International
Actual Forecast
Wellington International Airport Air Traffic Forecasts – DRAFT of 20 October 2015 iii
Australia to reach WLG. The second effect is that some portions of those travellers on the long-haul
international flights represent existing origin-destination (O/D) passengers which had previously
connected via a domestic or Australian gateway. The reallocation of those passengers to non-stop
international flights causes a reduction in E/D domestic and Australian traffic, slightly lowering those
forecast outcomes. The runway extension scenario forecast also models a slight stimulation of
domestic connecting passengers, as the introduction of new international services makes WLG a
more attractive gateway for connecting itineraries, most likely driven from regional airports in the
southern half of the North Island and from airports in the northern portion of the South Island.
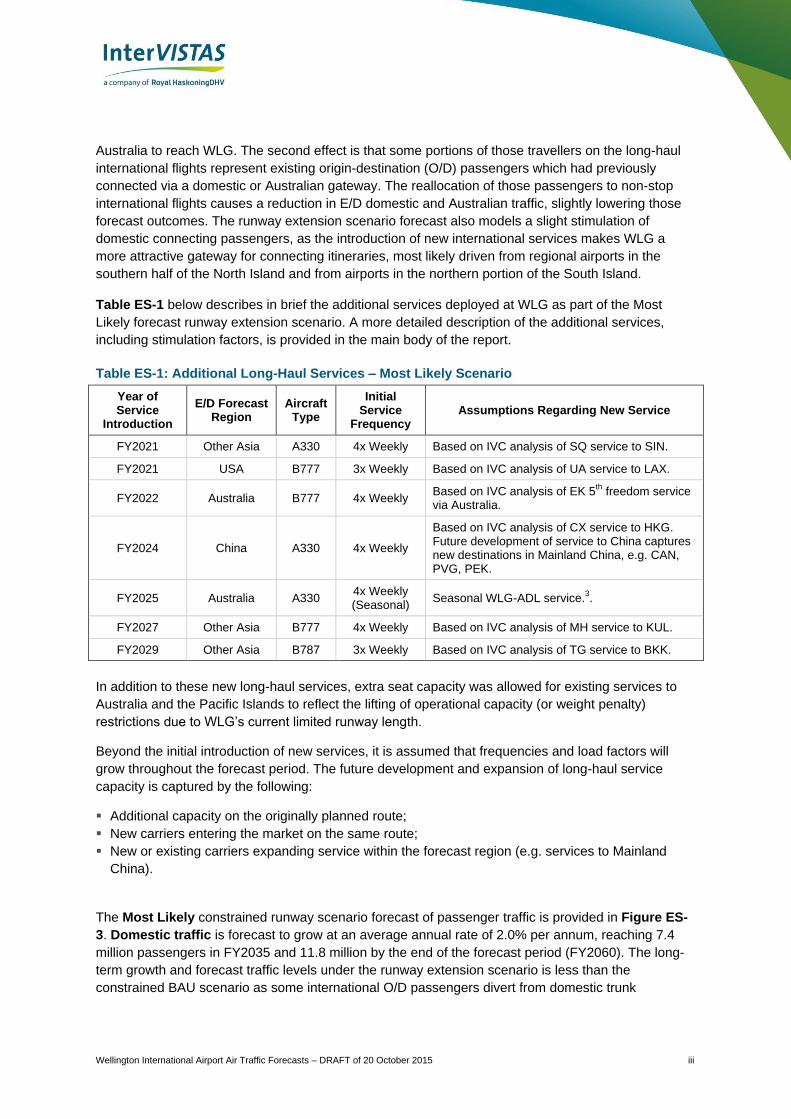
Table ES-1 below describes in brief the additional services deployed at WLG as part of the Most
Likely forecast runway extension scenario. A more detailed description of the additional services,
including stimulation factors, is provided in the main body of the report.
Table ES-1: Additional Long-Haul Services – Most Likely Scenario
Year of Service
Introduction
E/D Forecast Region
Aircraft Type
Initial Service
Frequency Assumptions Regarding New Service
FY2021 Other Asia A330 4x Weekly Based on IVC analysis of SQ service to SIN.
FY2021 USA B777 3x Weekly Based on IVC analysis of UA service to LAX.
FY2022 Australia B777 4x Weekly Based on IVC analysis of EK 5
th freedom service
via Australia.
FY2024 China A330 4x Weekly
Based on IVC analysis of CX service to HKG. Future development of service to China captures new destinations in Mainland China, e.g. CAN, PVG, PEK.
FY2025 Australia A330 4x Weekly (Seasonal)
Seasonal WLG-ADL service.3.
FY2027 Other Asia B777 4x Weekly Based on IVC analysis of MH service to KUL.
FY2029 Other Asia B787 3x Weekly Based on IVC analysis of TG service to BKK.
In addition to these new long-haul services, extra seat capacity was allowed for existing services to
Australia and the Pacific Islands to reflect the lifting of operational capacity (or weight penalty)
restrictions due to WLG’s current limited runway length.
Beyond the initial introduction of new services, it is assumed that frequencies and load factors will
grow throughout the forecast period. The future development and expansion of long-haul service
capacity is captured by the following:
Additional capacity on the originally planned route;
New carriers entering the market on the same route;
New or existing carriers expanding service within the forecast region (e.g. services to Mainland
China).
The Most Likely constrained runway scenario forecast of passenger traffic is provided in Figure ES-
3. Domestic traffic is forecast to grow at an average annual rate of 2.0% per annum, reaching 7.4
million passengers in FY2035 and 11.8 million by the end of the forecast period (FY2060). The long-
term growth and forecast traffic levels under the runway extension scenario is less than the
constrained BAU scenario as some international O/D passengers divert from domestic trunk

Wellington International Airport Air Traffic Forecasts – DRAFT of 20 October 2015 iv
itineraries as not all passengers need to connect via AKL and CHC (domestic trunk routes) to reach
international destinations.
International traffic is forecast to grow at 3.8% per annum over the forecast period, and have 2.4
million passengers in FY2035 and 4.3 million in FY2060. Those 4.3 million passengers in FY2060 are
less than half of AKL’s 2015 international traffic for the 12-month period ending March 31st 2015.
International E/D traffic is forecast to see its highest growth in the ten years following the assumed
construction of the extended runway in FY2020, growing at 8.5% p.a. from FY2020-25 and 5.5% p.a.
from FY2025-2030. As WLG’s new international markets begin to mature, growth rates of international
E/D traffic will gradually attenuate towards the long-term average.
Total traffic in the runway extension scenario is forecast to grow to 16.1 million passengers by
FY2060, at an average annual rate of 2.4% - nearly matching the high average historical growth rate
observed from FY2017-2015.
Figure ES-3: Most Likely Forecast of E/D Passenger Traffic – Runway Extension Scenario
0
2
4
6
8
10
12
14
16
18
0
2
4
6
8
10
12
14
16
18
FY
200
0
FY
200
5
FY
201
0
FY
201
5
FY
202
0
FY
202
5
FY
203
0
FY
203
5
FY
204
0
FY
204
5
FY
205
0
FY
205
5
FY
206
0
An
nu
al
E/D
Pa
ss
en
ge
rs (
Mil
lio
ns
)
Total
Domestic
International
Actual Forecast
Wellington International Airport Air Traffic Forecasts – DRAFT of 20 October 2015 v
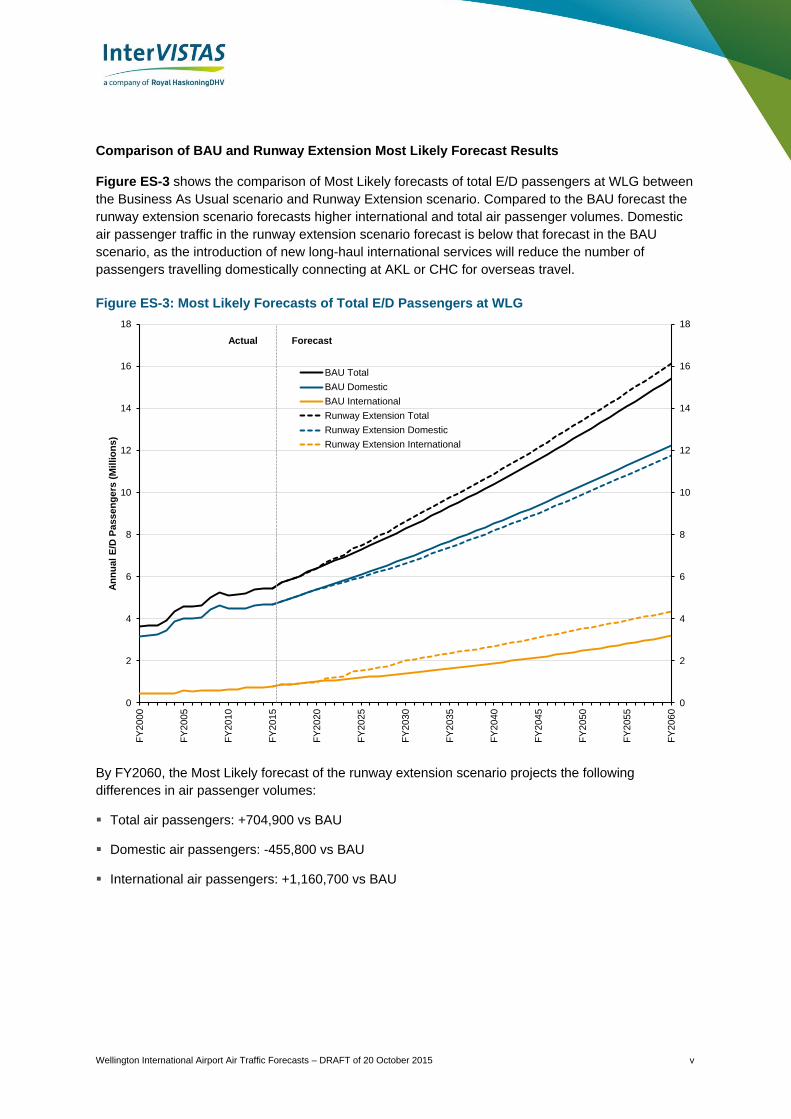
Comparison of BAU and Runway Extension Most Likely Forecast Results
Figure ES-3 shows the comparison of Most Likely forecasts of total E/D passengers at WLG between
the Business As Usual scenario and Runway Extension scenario. Compared to the BAU forecast the
runway extension scenario forecasts higher international and total air passenger volumes. Domestic
air passenger traffic in the runway extension scenario forecast is below that forecast in the BAU
scenario, as the introduction of new long-haul international services will reduce the number of
passengers travelling domestically connecting at AKL or CHC for overseas travel.
Figure ES-3: Most Likely Forecasts of Total E/D Passengers at WLG
By FY2060, the Most Likely forecast of the runway extension scenario projects the following
differences in air passenger volumes:
Total air passengers: +704,900 vs BAU
Domestic air passengers: -455,800 vs BAU
International air passengers: +1,160,700 vs BAU
0
2
4
6
8
10
12
14
16
18
0
2
4
6
8
10
12
14
16
18
FY
200
0
FY
200
5
FY
201
0
FY
201
5
FY
202
0
FY
202
5
FY
203
0
FY
203
5
FY
204
0
FY
204
5
FY
205
0
FY
205
5
FY
206
0
An
nu
al
E/D
Pa
ss
en
ge
rs (
Mil
lio
ns
)
BAU Total
BAU Domestic
BAU International
Runway Extension Total
Runway Extension Domestic
Runway Extension International
Actual Forecast
Wellington International Airport Air Traffic Forecasts – DRAFT of 20 October 2015 vi
Risk Analysis – Air Passenger Forecast
The final set of air passenger forecasts were generated using a risk analysis process. The risk
analysis involved simulating 10,000 iterations of the BAU forecasts of O/D passenger traffic using
different randomly generated set of input factors. The median value generated by the 10,000
iterations was selected as the Most Likely forecast.
To generate low and high scenario forecasts, the 5th percentile and 95
th percentile outcomes were
selected as the criteria for each of those traffic scenarios. As determined by the risk analysis, the low
scenario implies that there is less than a 5% chance that traffic at WLG will drop below the low
scenario forecast (or a 95% chance that realized traffic will be above the low scenario forecast).
Similarly, there is less than a 5% chance that actual future traffic will exceed the high scenario
forecast (or a 95% chance that realized traffic will be less than the high scenario forecast).
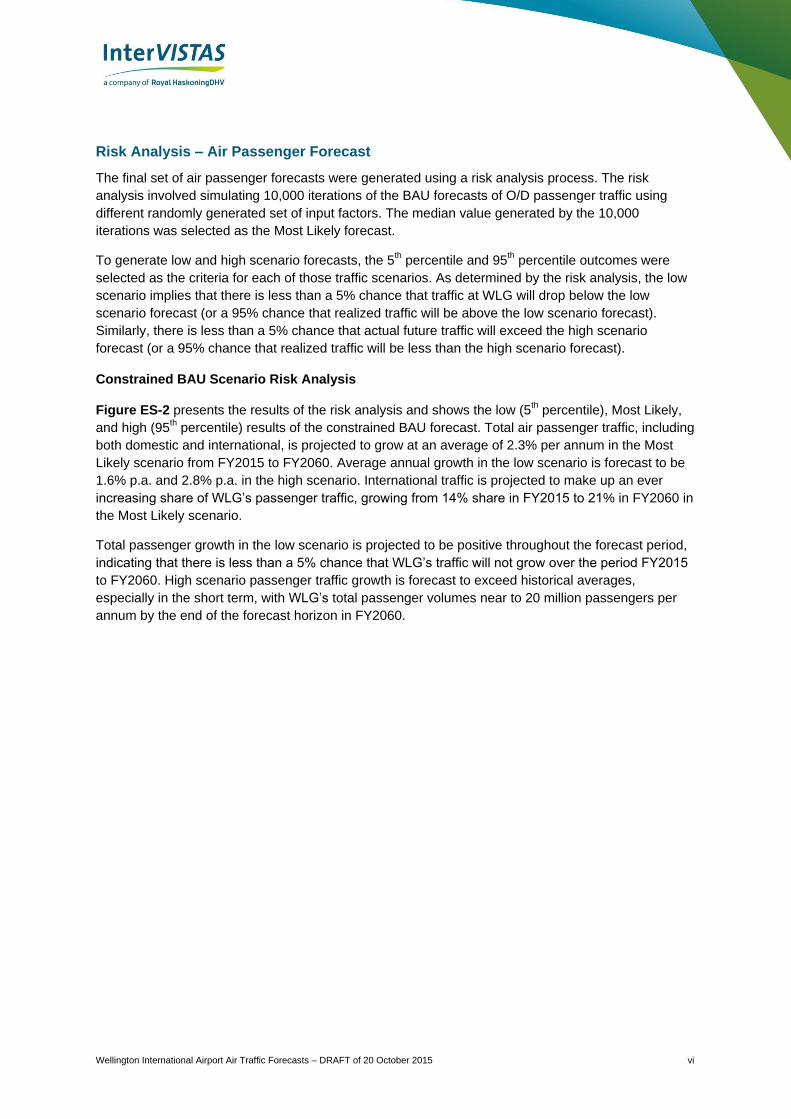
Constrained BAU Scenario Risk Analysis
Figure ES-2 presents the results of the risk analysis and shows the low (5th percentile), Most Likely,
and high (95th percentile) results of the constrained BAU forecast. Total air passenger traffic, including
both domestic and international, is projected to grow at an average of 2.3% per annum in the Most
Likely scenario from FY2015 to FY2060. Average annual growth in the low scenario is forecast to be
1.6% p.a. and 2.8% p.a. in the high scenario. International traffic is projected to make up an ever
increasing share of WLG’s passenger traffic, growing from 14% share in FY2015 to 21% in FY2060 in
the Most Likely scenario.
Total passenger growth in the low scenario is projected to be positive throughout the forecast period,
indicating that there is less than a 5% chance that WLG’s traffic will not grow over the period FY2015
to FY2060. High scenario passenger traffic growth is forecast to exceed historical averages,
especially in the short term, with WLG’s total passenger volumes near to 20 million passengers per
annum by the end of the forecast horizon in FY2060.
Wellington International Airport Air Traffic Forecasts – DRAFT of 20 October 2015 vii
Figure ES-2: Risk Analysis of Total E/D Passengers at WLG – BAU Constrained Scenarios
Runway Extension Scenario Risk Analysis
To develop the low and high scenarios for the runway extension forecast, the same low and high
scenario O/D forecasts from the constrained BAU scenario risk modelling analysis were used.
Furthermore, adjustments based on InterVISTAS’ expert judgement were made to the new long-haul
services. In general, the following adjustments were made:
Timing of service introduction.
Removal of new services (low forecast only)
Initial service frequency and future increases to frequencies.
Initial load factors and future development of load factor increases.
Market stimulation levels.
To develop the low forecast, service introduction was delayed or entirely absent, featured lower load
factors, reduced frequencies, and diminished market stimulation. In contrast, new services in the high
scenario feature an accelerated build-up of service frequencies, higher load factors, earlier service
introduction dates, and enhanced market stimulation. In conjunction with the underlying high/low O/D
forecasts, these adjustments resulted in high and lower E/D forecast results, respectively.
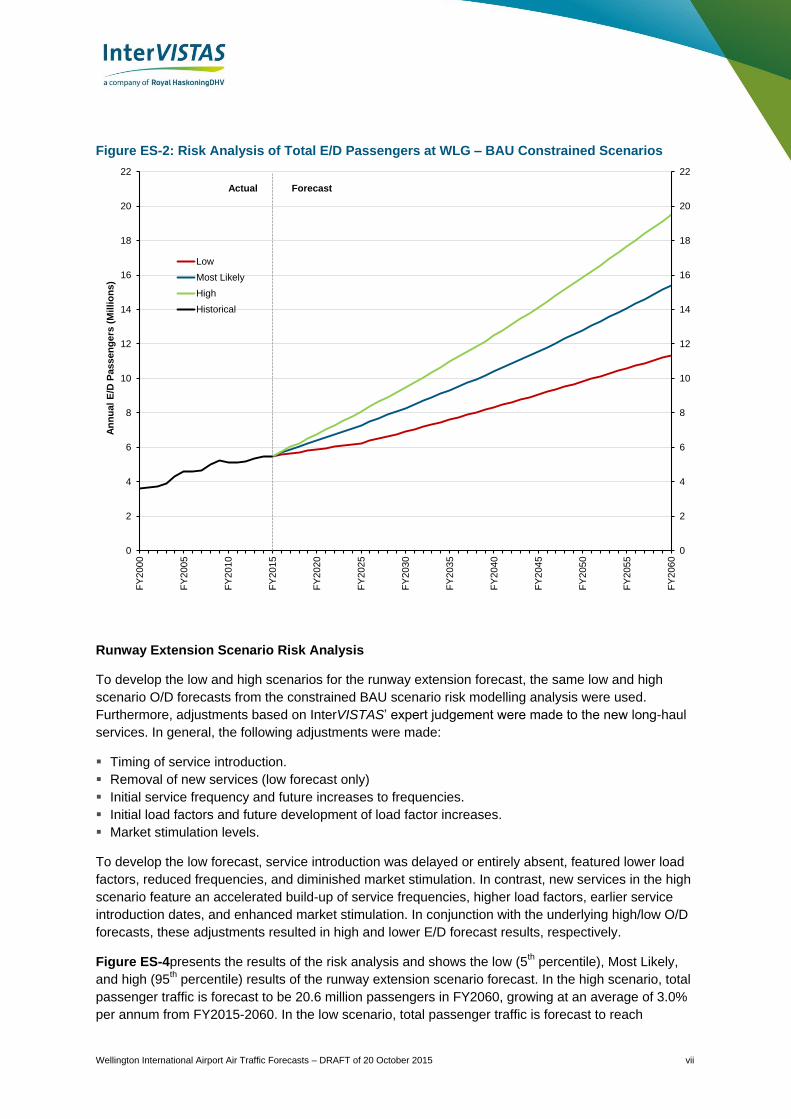
Figure ES-4presents the results of the risk analysis and shows the low (5th percentile), Most Likely,
and high (95th percentile) results of the runway extension scenario forecast. In the high scenario, total
passenger traffic is forecast to be 20.6 million passengers in FY2060, growing at an average of 3.0%
per annum from FY2015-2060. In the low scenario, total passenger traffic is forecast to reach
0
2
4
6
8
10
12
14
16
18
20
22
0
2
4
6
8
10
12
14
16
18
20
22
FY
200
0
FY
200
5
FY
201
0
FY
201
5
FY
202
0
FY
202
5
FY
203
0
FY
203
5
FY
204
0
FY
204
5
FY
205
0
FY
205
5
FY
206
0
An
nu
al
E/D
Pa
ss
en
ge
rs (
Mil
lio
ns
)
Low
Most Likely
High
Historical
Actual Forecast
Wellington International Airport Air Traffic Forecasts – DRAFT of 20 October 2015 viii
approximately 11.7 million passengers by FY2060, growing at an average rate of 1.7% per annum
from FY2015-2060. In all three scenarios, total passenger traffic at WLG is forecast to be higher with
an extended runway compared to the constrained BAU scenario in which an extended runway is not
constructed.
As in the constrained BAU forecast, there is a considerable range of traffic outcomes between the low
and high scenarios relative to the Most Likely. The relative difference between the low and high
forecasts in relation to the Most Likely forecast under the runway extension is similar to the results of
the BAU constrained forecast.
Figure ES-4: Risk Analysis of Total E/D Passengers at WLG – Runway Extension Scenarios
Aircraft Movement Forecasts
Constrained Business as Usual Scenario
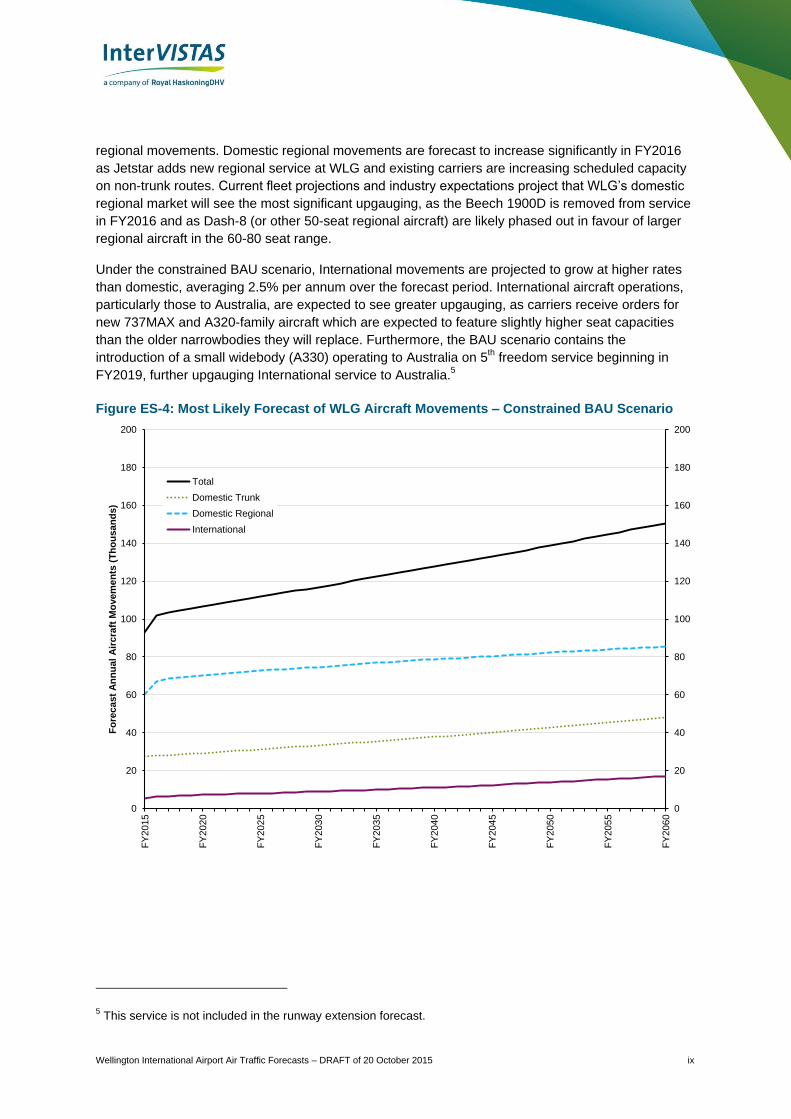
The Most Likely constrained BAU forecast of aircraft movements is provided in Figure ES-4. In the
Most Likely forecast, total aircraft movements are forecast to grow from 93,032 in FY2015 to 150,500
movements in FY2060, at an average annual rate of 1.1% per annum. Due to increasing average
aircraft size through fleet upgauging and higher load factors, aircraft movements are forecast to grow
at significantly slow rates than passenger volumes. This is a continuation of industry trends seen
today towards larger aircraft and higher seat capacity at the expense of high-frequency service.
Domestic trunk movements in the constrained BAU scenario are projected grow at an average rate
1.2% through to the end of the forecast period, while a 0.8% average growth is forecast in domestic
0
2
4
6
8
10
12
14
16
18
20
22
24
0
2
4
6
8
10
12
14
16
18
20
22
24
FY
200
0
FY
200
5
FY
201
0
FY
201
5
FY
202
0
FY
202
5
FY
203
0
FY
203
5
FY
204
0
FY
204
5
FY
205
0
FY
205
5
FY
206
0
An
nu
al
E/D
Pa
ss
en
ge
rs (
Mil
lio
ns
)
Low
Most Likely
High
Historical
Actual Forecast
Wellington International Airport Air Traffic Forecasts – DRAFT of 20 October 2015 ix
regional movements. Domestic regional movements are forecast to increase significantly in FY2016
as Jetstar adds new regional service at WLG and existing carriers are increasing scheduled capacity
on non-trunk routes. Current fleet projections and industry expectations project that WLG’s domestic
regional market will see the most significant upgauging, as the Beech 1900D is removed from service
in FY2016 and as Dash-8 (or other 50-seat regional aircraft) are likely phased out in favour of larger
regional aircraft in the 60-80 seat range.
Under the constrained BAU scenario, International movements are projected to grow at higher rates
than domestic, averaging 2.5% per annum over the forecast period. International aircraft operations,
particularly those to Australia, are expected to see greater upgauging, as carriers receive orders for
new 737MAX and A320-family aircraft which are expected to feature slightly higher seat capacities
than the older narrowbodies they will replace. Furthermore, the BAU scenario contains the
introduction of a small widebody (A330) operating to Australia on 5th freedom service beginning in
FY2019, further upgauging International service to Australia.5
Figure ES-4: Most Likely Forecast of WLG Aircraft Movements – Constrained BAU Scenario
5 This service is not included in the runway extension forecast.
0
20
40
60
80
100
120
140
160
180
200
0
20
40
60
80
100
120
140
160
180
200
FY
201
5
FY
202
0
FY
202
5
FY
203
0
FY
203
5
FY
204
0
FY
204
5
FY
205
0
FY
205
5
FY
206
0
Fo
rec
ast
An
nu
al
Air
cra
ft M
ove
me
nts
(T
ho
usa
nd
s)
Total
Domestic Trunk
Domestic Regional
International
Wellington International Airport Air Traffic Forecasts – DRAFT of 20 October 2015 x
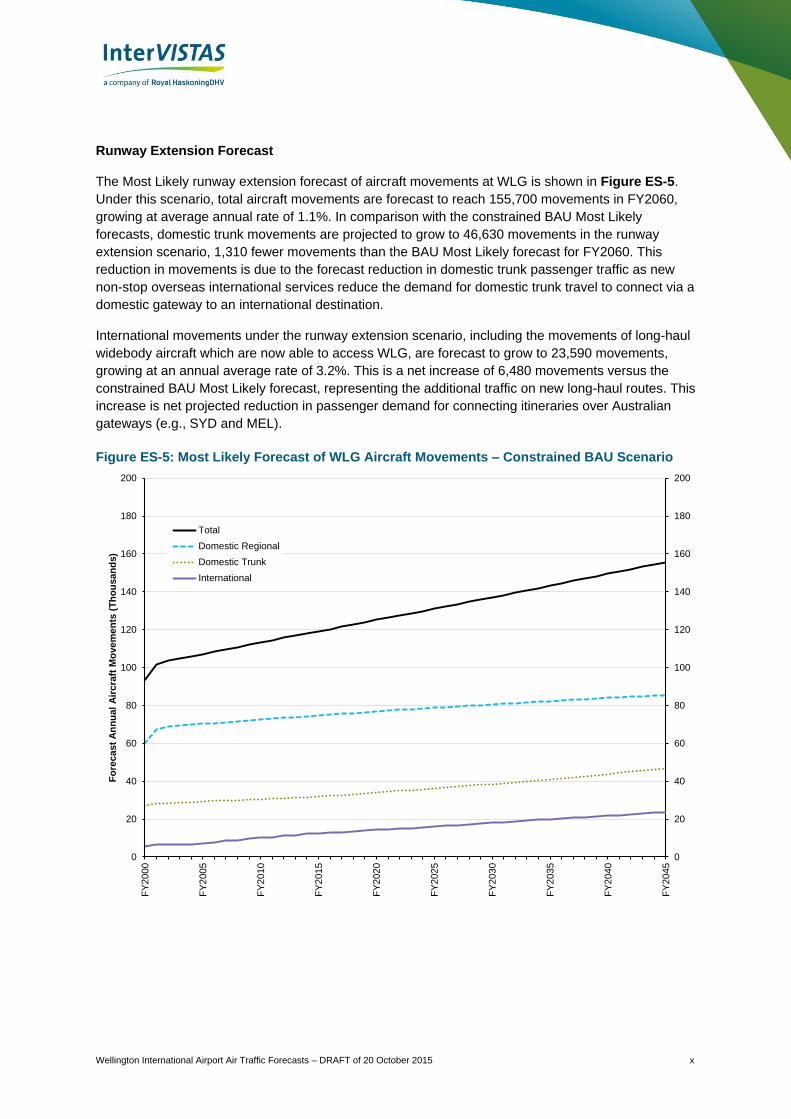
Runway Extension Forecast
The Most Likely runway extension forecast of aircraft movements at WLG is shown in Figure ES-5.
Under this scenario, total aircraft movements are forecast to reach 155,700 movements in FY2060,
growing at average annual rate of 1.1%. In comparison with the constrained BAU Most Likely
forecasts, domestic trunk movements are projected to grow to 46,630 movements in the runway
extension scenario, 1,310 fewer movements than the BAU Most Likely forecast for FY2060. This
reduction in movements is due to the forecast reduction in domestic trunk passenger traffic as new
non-stop overseas international services reduce the demand for domestic trunk travel to connect via a
domestic gateway to an international destination.
International movements under the runway extension scenario, including the movements of long-haul
widebody aircraft which are now able to access WLG, are forecast to grow to 23,590 movements,
growing at an annual average rate of 3.2%. This is a net increase of 6,480 movements versus the
constrained BAU Most Likely forecast, representing the additional traffic on new long-haul routes. This
increase is net projected reduction in passenger demand for connecting itineraries over Australian
gateways (e.g., SYD and MEL).
Figure ES-5: Most Likely Forecast of WLG Aircraft Movements – Constrained BAU Scenario
0
20
40
60
80
100
120
140
160
180
200
0
20
40
60
80
100
120
140
160
180
200
FY
200
0
FY
200
5
FY
201
0
FY
201
5
FY
202
0
FY
202
5
FY
203
0
FY
203
5
FY
204
0
FY
204
5
Fo
rec
ast
An
nu
al
Air
cra
ft M
ove
me
nts
(T
ho
usa
nd
s)
Total
Domestic Regional
Domestic Trunk
International
Wellington International Airport Air Traffic Forecasts – DRAFT of 20 October 2015 xi
Contents
Executive Summary ......................................................................................................... i
1 Introduction .............................................................................................................. 1
1.1 Objective ........................................................................................................................ 1
1.2 Forecast Output ............................................................................................................. 1
1.3 Report Structure ............................................................................................................. 2
1.4 About InterVISTAS ......................................................................................................... 2
2 Overview of the Aviation Market ............................................................................. 3
2.1 Current and Historical Aviation Activity .......................................................................... 3
3 Economy Conditions ............................................................................................. 11
3.1 Population .................................................................................................................... 11
3.2 New Zealand’s Gross Domestic Product ..................................................................... 11
3.3 Economy in Major Markets ........................................................................................... 13
4 Forecasting Methodology ..................................................................................... 21
4.1 Air Passenger Forecast Methodology .......................................................................... 21
4.2 Risk Analysis ................................................................................................................ 26
4.3 Aircraft Movement Forecast Methodology ................................................................... 31
4.4 Additional Services for Runway Extension Scenarios ................................................. 31
4.5 Comment on Very Long Term Traffic Forecasts .......................................................... 34
5 Air Passenger Forecasts ....................................................................................... 35
5.1 BAU Constrained Forecast .......................................................................................... 35
5.2 Runway Extension Scenario ........................................................................................ 44
5.3 Comparison of Forecast Scenarios .............................................................................. 55
5.4 Comparison of O/D Forecasts...................................................................................... 56
6 Aircraft Movement Forecasts ................................................................................ 58
6.1 Assumptions Underlying Aircraft Movement Forecasts ............................................... 58
6.2 BAU Constrained Forecast .......................................................................................... 59
6.3 Runway Extension Scenario ........................................................................................ 63
Appendix A: Econometric Analysis ............................................................................ 68
Appendix B: Passenger Splits ..................................................................................... 72
Wellington International Airport Air Traffic Forecasts – DRAFT of 20 October 2015 1
1 Introduction
1.1 Objective
Wellington International Airport Limited commissioned InterVISTAS Consulting Inc. (InterVISTAS) to
produce airport activity forecasts for Wellington International Airport (WLG) over the years 2015-2060.
This work consists of two parts:
Part A: Business As Usual Airport Traffic Forecast consisting of both passenger and aircraft
movement forecasts under a scenario where WLG’s runway infrastructure is unchanged (i.e., no
lengthening of the runway).
Part B: Forecast of a Runway Extension Scenario consisting of both passenger and aircraft
movement forecast under a scenario where WLG’s runway length is extended allowing the
operation of larger aircraft types to further destinations.
Both forecast parts employed InterVISTAS risk-based forecasting methodology to provide a range of
possible forecast outcomes with associated probabilities.
For the purposes of this report, annual summaries of passenger traffic and aircraft activity at WLG are
measured by fiscal year, running from 1 April to 31 March.
1.2 Forecast Output
Forecasts are provided for both origin/destination (O/D) and enplaned/deplaned (E/D) passenger
traffic. O/D traffic captures the final origin and destination of the passenger, regardless of their
routing. For example, O/D traffic between Wellington and China would count all the passenger traffic
between Wellington and China regardless the routing they take. For example, Wellington-China can
travel via Auckland, Christchurch or an Australian airport.
E/D traffic measures the number of aircraft enplanements and deplanements at the airport based on
the passenger’s immediate origin or endpoint airport. It can differ from the O/D traffic in the
geographic categorization of the passenger. For example, a passenger travelling China-Auckland-
Wellington is categorised as an international passenger on an O/D basis whereas they are a domestic
passenger on an E/D basis (their next immediate airport is Auckland). In addition, E/D traffic includes
passengers connecting at WLG whereas O/D traffic does not.
In addition, the traffic forecasts are broken down as follows:
Domestic trunk vs. regional passengers,
International traffic broken down into the following sectors:
Australia, China, Japan, Other Asia, United Kingdom, United States of America, Pacific Islands,
and Other (rest of the world)
Additionally, O/D traffic forecasts are divided into inbound international visitors and outbound
New Zealand residents
Aircraft movements, by segment and aircraft type.
Wellington International Airport Air Traffic Forecasts – DRAFT of 20 October 2015 2
1.3 Report Structure
This report presents the air traffic forecasts prepared by InterVISTAS, as well as documentation of the
methodology and assumptions underlying the forecasts. It also details the risk analysis
The report is structured as follows:
Chapter 2 describes the current and historical aviation activity at the airport.
Chapter 3 describes the background on the local population and economy, as well as the
economies of major trading and tourism partners.
Chapter 4 describes the air traffic forecasting methodology and assumptions, including details of
the risk analysis.
Chapter 5 provides the passenger forecasts, including the risk analysis.
Chapter 6 provides the forecasts of aircraft movements.
The appendices provide additional information on the forecasting methodology and assumptions.
1.4 About InterVISTAS
InterVISTAS Consulting Inc. is a global consulting firm specializing in aviation, transportation, and
tourism. In our aviation practice we provide support to airports, airlines, governments, and regulators
on a wide variety of projects including forecasts, air service development, airline network planning,
economic analysis, regulatory review and expert witness support.
InterVISTAS has extensive experience in air traffic forecasting. We have prepared air traffic forecasts
for airports in Australasia, Asia, Europe, Australia, North and South America and Africa. Although
each traffic forecast has its unique characteristics and dynamics, we have extensive experience in
New Zealand and other air transport markets featuring similar trends.
Wellington International Airport Air Traffic Forecasts – DRAFT of 20 October 2015 3
2 Overview of the Aviation Market
2.1 Current and Historical Aviation Activity
2.1.1 Air Passenger Traffic
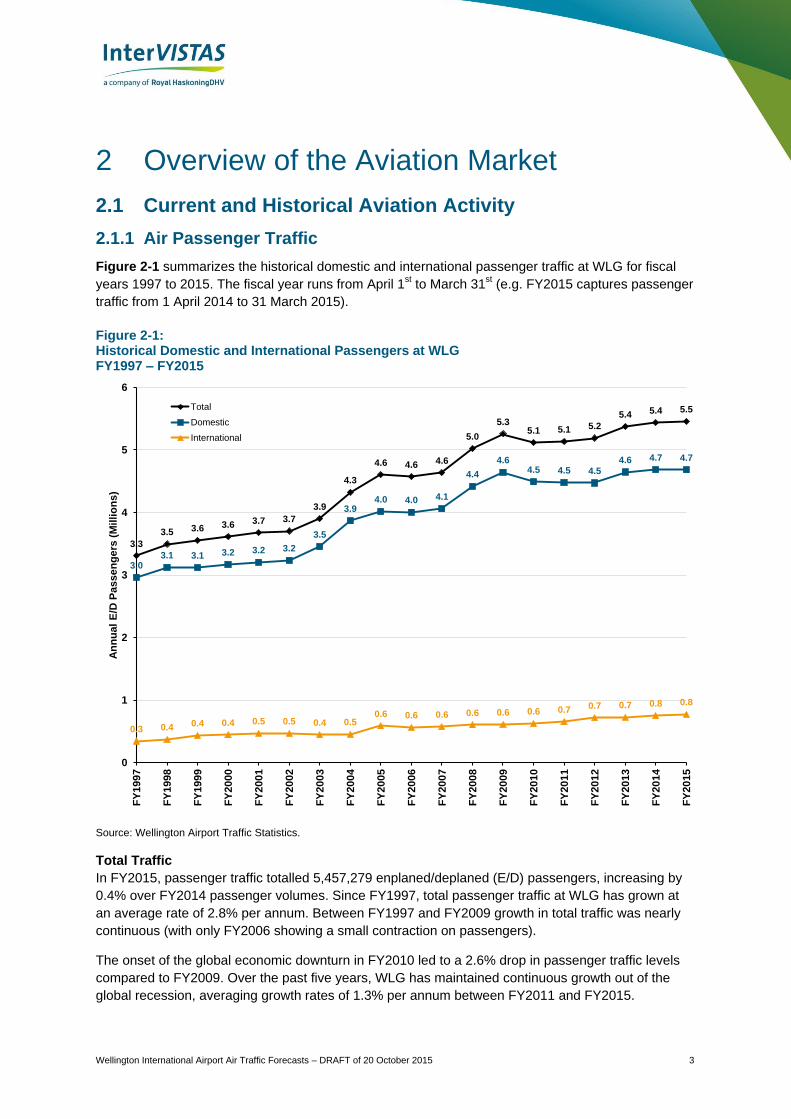
Figure 2-1 summarizes the historical domestic and international passenger traffic at WLG for fiscal
years 1997 to 2015. The fiscal year runs from April 1st to March 31
st (e.g. FY2015 captures passenger
traffic from 1 April 2014 to 31 March 2015).
Figure 2-1: Historical Domestic and International Passengers at WLG FY1997 – FY2015
Source: Wellington Airport Traffic Statistics.
Total Traffic
In FY2015, passenger traffic totalled 5,457,279 enplaned/deplaned (E/D) passengers, increasing by
0.4% over FY2014 passenger volumes. Since FY1997, total passenger traffic at WLG has grown at
an average rate of 2.8% per annum. Between FY1997 and FY2009 growth in total traffic was nearly
continuous (with only FY2006 showing a small contraction on passengers).
The onset of the global economic downturn in FY2010 led to a 2.6% drop in passenger traffic levels
compared to FY2009. Over the past five years, WLG has maintained continuous growth out of the
global recession, averaging growth rates of 1.3% per annum between FY2011 and FY2015.
3.3
3.5 3.6 3.6 3.7 3.7
3.9
4.3
4.6 4.6 4.6
5.0
5.35.1 5.1 5.2
5.4 5.4 5.5
3.03.1 3.1 3.2 3.2 3.2
3.5
3.94.0 4.0 4.1
4.4
4.64.5 4.5 4.5
4.6 4.7 4.7
0.3 0.4 0.4 0.4 0.5 0.5 0.4 0.50.6 0.6 0.6 0.6 0.6 0.6 0.7 0.7 0.7 0.8 0.8
0
1
2
3
4
5
6
FY
19
97
FY
19
98
FY
19
99
FY
20
00
FY
20
01
FY
20
02
FY
20
03
FY
20
04
FY
20
05
FY
20
06
FY
20
07
FY
200
8
FY
20
09
FY
20
10
FY
20
11
FY
20
12
FY
20
13
FY
20
14
FY
20
15
An
nu
al
E/D
Pa
ss
en
gers
(M
illi
on
s)
Total
Domestic
International
Wellington International Airport Air Traffic Forecasts – DRAFT of 20 October 2015 4
Domestic Traffic
In FY2015, domestic traffic reached 4,682,086 E/D passengers, making up 85% of WLG total
passenger volume in that year. Domestic passenger growth was essentially flat between FY2014 and
FY2015, but has averaged 0.8% per annum growth between FY2011 and FY2015. Between FY1997
and FY2002 domestic traffic averaged 1.8% per annum, and then underwent a period of accelerated
growth between FY2003 and FY2005, averaging 7.5% per annum (annual domestic traffic growth
peaked in FY2004, gaining 12% over the previous year). The strong growth in the early 2000s was
largely due to the restructuring and expansion of Air New Zealand’s domestic product.
Domestic traffic experienced another high growth period between FY2008 and FY2009, which was
associated with Virgin Blue’s entry into the domestic market, with domestic traffic at WLG growing by
8.3% and 4.7% in FY2008 and FY2009, respectively.6 Domestic traffic declined by 3.3% in FY2009
due to the global economic recession, and continued to decline (though only a 0.2% per annum)
through FY2010 and FY2011 (though some of the declined in FY2011 was due to the earthquake in
Christchurch in February 2011). In more recent years, domestic traffic grew by 3.8%, 0.8%, and 0% in
FY2013, FY2014, and FY2015, respectively. Between FY1997 and FY2015, domestic traffic averaged
growth of 2.5% per annum.
International Traffic
In FY2015, international passenger traffic at WLG totalled 775,193 E/D passengers, an increase of
2.9% compared to international traffic levels in FY2014. International passenger traffic has more than
doubled since FY1997, growing on average at 4.5% per annum. Of those international E/D
passengers, 768,438 were Australia E/D passengers while 6,759 were Pacific Islands passengers. As
of the writing of this report, International passenger traffic at WLG has grown 17% YTD (March-
August FY2016) as a result of additional capacity provided by Jetstar to MEL and OOL, as well as the
introduction of year-round service by Fiji Airways.
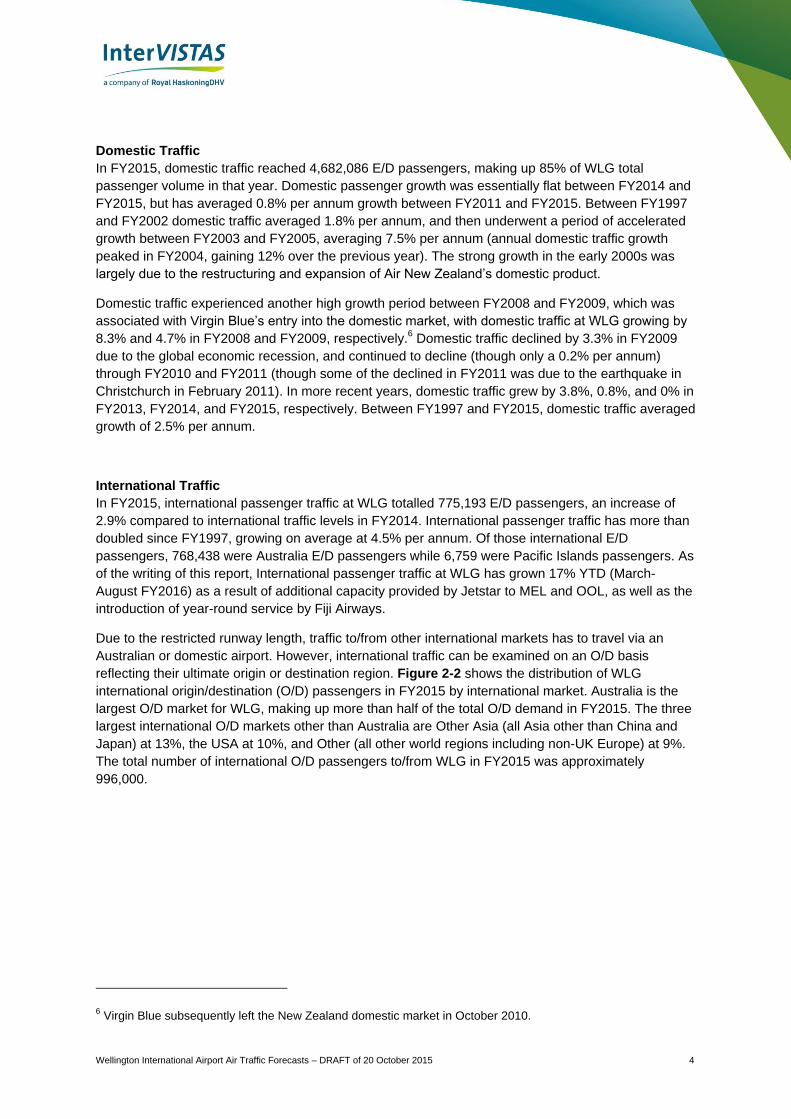
Due to the restricted runway length, traffic to/from other international markets has to travel via an
Australian or domestic airport. However, international traffic can be examined on an O/D basis
reflecting their ultimate origin or destination region. Figure 2-2 shows the distribution of WLG
international origin/destination (O/D) passengers in FY2015 by international market. Australia is the
largest O/D market for WLG, making up more than half of the total O/D demand in FY2015. The three
largest international O/D markets other than Australia are Other Asia (all Asia other than China and
Japan) at 13%, the USA at 10%, and Other (all other world regions including non-UK Europe) at 9%.
The total number of international O/D passengers to/from WLG in FY2015 was approximately
996,000.
6 Virgin Blue subsequently left the New Zealand domestic market in October 2010.
Wellington International Airport Air Traffic Forecasts – DRAFT of 20 October 2015 5
Figure 2-2 Market Share of International Origin/Destination Passengers by International Market FY2015
Source: Diio FMg.
Table 2-1 shows the share of inbound and outbound O/D travellers by international market. WLG’s
international O/D market is primarily dominated by outbound NZ residents, with only Australia and
Japan having more inbound travellers than outbound NZ residents. In total, 54% of WLG’s
international O/D passengers in FY2015 were outbound NZ residents. The remaining 46% were
inbound visitors, primarily from Australia. Note that these are inbound Australian residents destined
ultimately for WLG, highlighting the importance of the Australian market to WLG and the Wellington
Region.
Table 2-1 Inbound/Outbound Origin/Destination Passenger Shares FY2015
O/D Market Australia Other Asia
USA Other UK Pacific China Japan
International Travellers Inbound
60% 24% 36% 33% 37% 11% 45% 56%
NZ Residents Outbound
40% 76% 64% 67% 63% 89% 55% 44%
Source: Diio FMg Point of Sale data.
Australia52%
Other Asia13%
USA10%
Other9%
UK6%
Pacific5%
China3%
Japan2%

Wellington International Airport Air Traffic Forecasts – DRAFT of 20 October 2015 6
Monthly Traffic
Figure 2-3 presents the monthly traffic levels for the past four fiscal years (2012-2015). Historically,
WLG experiences its highest traffic levels in the early autumn (March) and its lowest traffic levels in
early summer (January). Traffic volumes exhibit a relatively low degree of seasonality, with the peak
and trough months being within +/- 10% of the average month (based on FY2015 data).
Figure 2-3 Total Monthly E/D Passengers FY2012 – FY2015
Source: Wellington Airport Traffic Statistics.
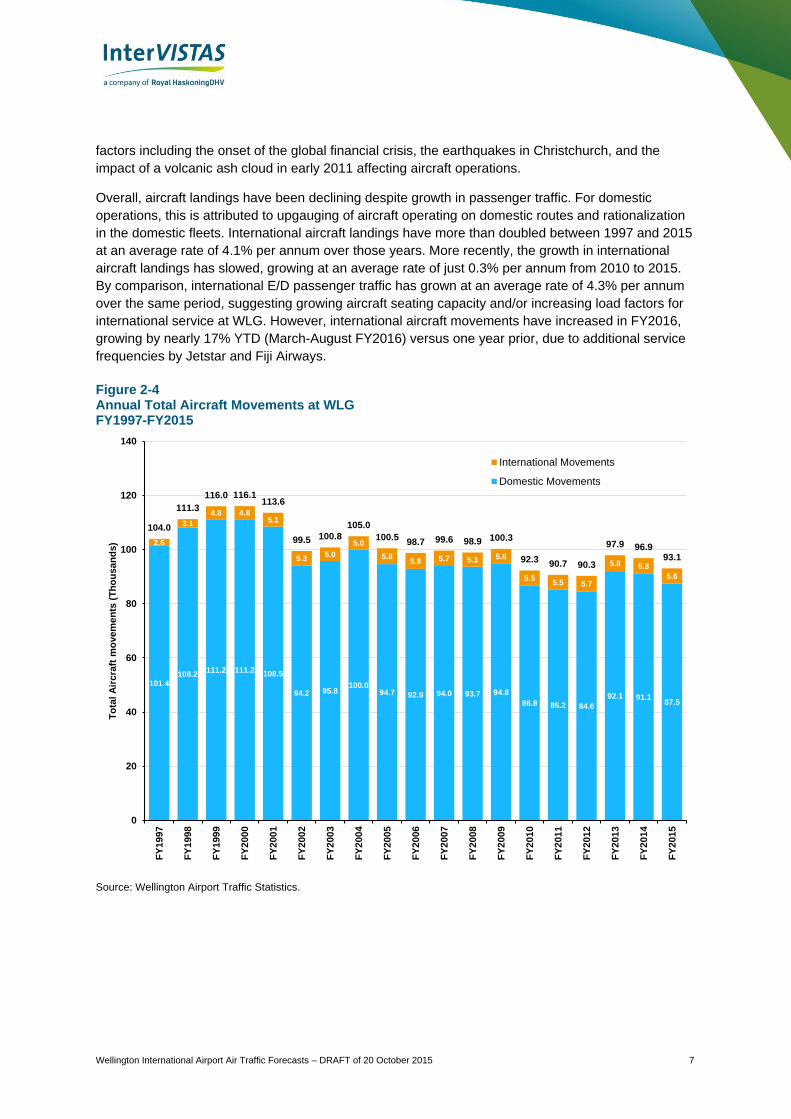
2.1.2 Aircraft Movements
Figure 2-4 shows historical aircraft movements, both domestic and international, at WLG from
FY1997 to FY2015. In 2015, WLG handled 93,032 aircraft movements, of which 87,512 (94%) were
domestic and 5,520 were from international destinations. Total movements have decreased by nearly
20% since their peak in FY2000, despite the growth in passenger traffic over the past fifteen years.
Since FY1997, aircraft movements at WLG have experienced two major shifts. First, in FY2002 with
the collapse of Ansett New Zealand (a subsidiary of Ansett Australia which liquiated in 2001) and
subsequent difficulties in the New Zealand domestic market, where landings dropped by nearly 13%
in a single year. The next structural shift occurred between FY2010-2012, owing to a combination of
0
100
200
300
400
500
600
0
100
200
300
400
500
600
Apr May Jun Jul Aug Sep Oct Nov Dec Jan Feb Mar
Mo
nth
ly T
ota
l E
/D P
as
se
ng
ers
(T
ho
usa
nd
s)
FY2012
FY2013
FY2014
FY2015
Wellington International Airport Air Traffic Forecasts – DRAFT of 20 October 2015 7
factors including the onset of the global financial crisis, the earthquakes in Christchurch, and the
impact of a volcanic ash cloud in early 2011 affecting aircraft operations.
Overall, aircraft landings have been declining despite growth in passenger traffic. For domestic
operations, this is attributed to upgauging of aircraft operating on domestic routes and rationalization
in the domestic fleets. International aircraft landings have more than doubled between 1997 and 2015
at an average rate of 4.1% per annum over those years. More recently, the growth in international
aircraft landings has slowed, growing at an average rate of just 0.3% per annum from 2010 to 2015.
By comparison, international E/D passenger traffic has grown at an average rate of 4.3% per annum
over the same period, suggesting growing aircraft seating capacity and/or increasing load factors for
international service at WLG. However, international aircraft movements have increased in FY2016,
growing by nearly 17% YTD (March-August FY2016) versus one year prior, due to additional service
frequencies by Jetstar and Fiji Airways.
Figure 2-4 Annual Total Aircraft Movements at WLG FY1997-FY2015
Source: Wellington Airport Traffic Statistics.
101.4108.2
111.2 111.2108.5
94.2 95.8100.0
94.7 92.9 94.0 93.7 94.8
86.8 85.2 84.6
92.1 91.187.5
2.6
3.1
4.8 4.85.1
5.35.0
5.0
5.85.8 5.7 5.3 5.6
5.55.5 5.7
5.8 5.8
5.6
104.0
111.3
116.0 116.1113.6
99.5 100.8
105.0
100.598.7 99.6 98.9 100.3
92.390.7 90.3
97.9 96.993.1
0
20
40
60
80
100
120
140
FY
199
7
FY
199
8
FY
199
9
FY
200
0
FY
200
1
FY
200
2
FY
200
3
FY
2004
FY
200
5
FY
200
6
FY
200
7
FY
200
8
FY
200
9
FY
201
0
FY
201
1
FY
201
2
FY
201
3
FY
201
4
FY
201
5
To
tal A
irc
raft
mo
ve
me
nts
(T
ho
usa
nd
s)
International Movements
Domestic Movements
Wellington International Airport Air Traffic Forecasts – DRAFT of 20 October 2015 8
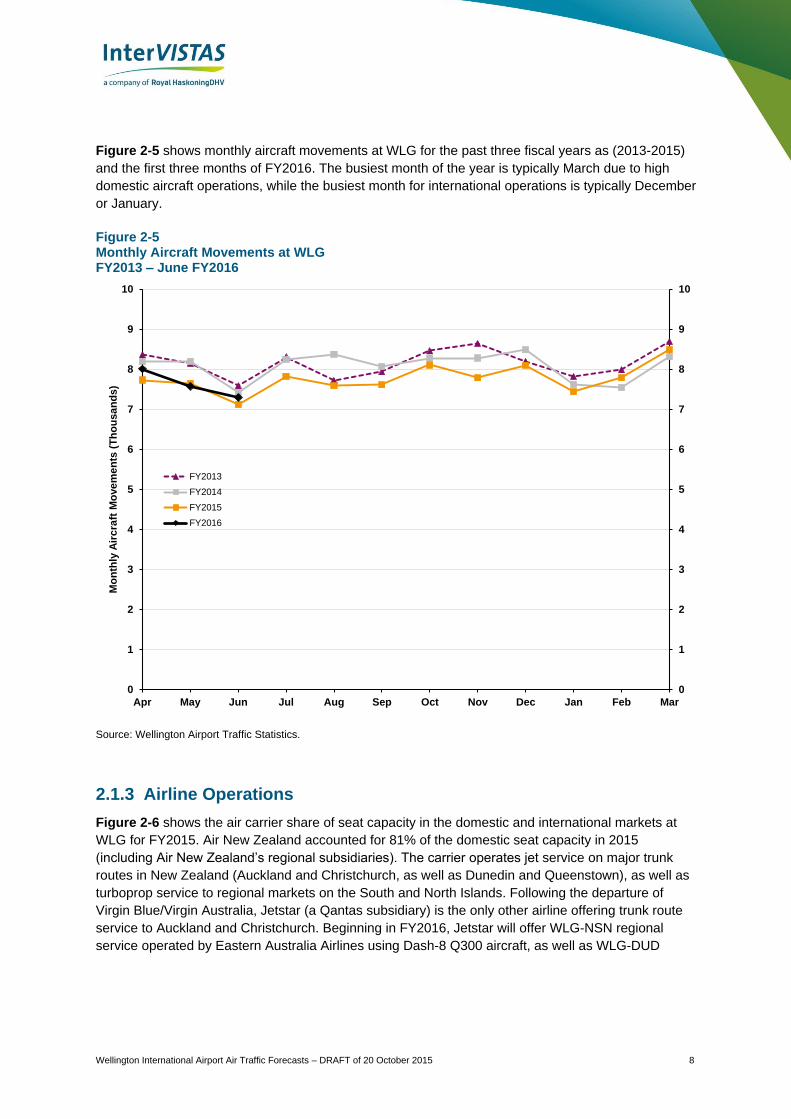
Figure 2-5 shows monthly aircraft movements at WLG for the past three fiscal years as (2013-2015)
and the first three months of FY2016. The busiest month of the year is typically March due to high
domestic aircraft operations, while the busiest month for international operations is typically December
or January.
Figure 2-5 Monthly Aircraft Movements at WLG FY2013 – June FY2016
Source: Wellington Airport Traffic Statistics.
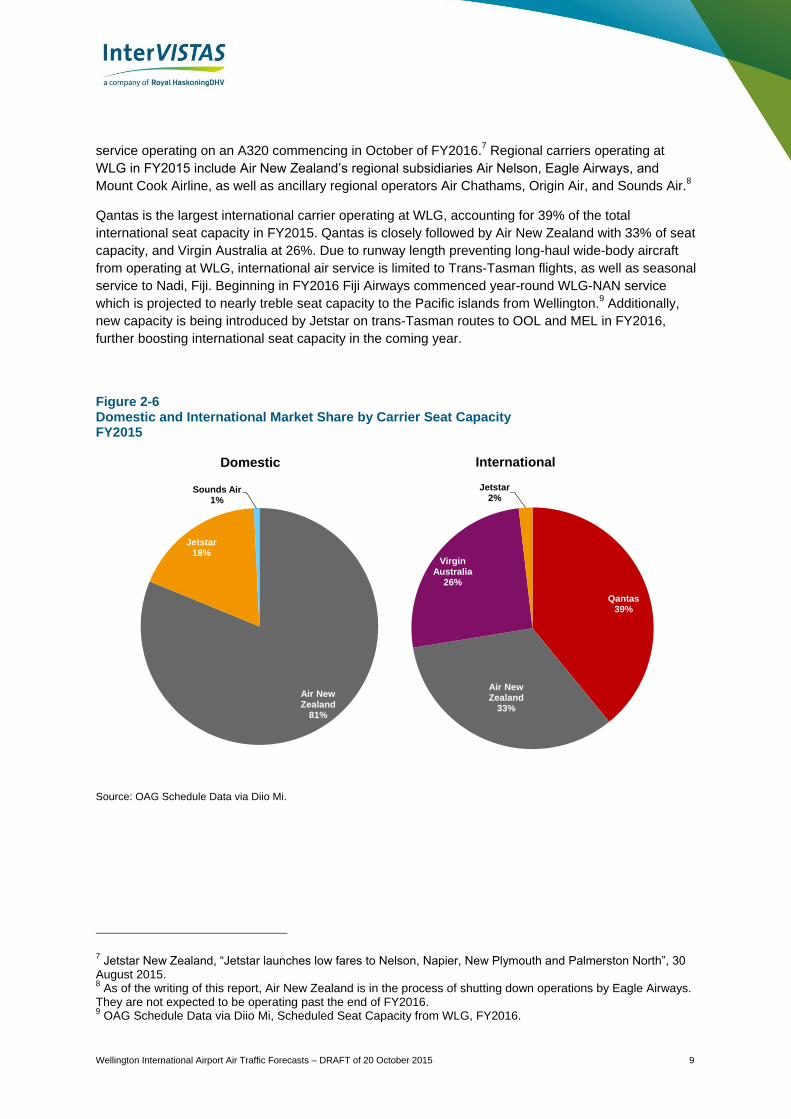
2.1.3 Airline Operations
Figure 2-6 shows the air carrier share of seat capacity in the domestic and international markets at
WLG for FY2015. Air New Zealand accounted for 81% of the domestic seat capacity in 2015
(including Air New Zealand’s regional subsidiaries). The carrier operates jet service on major trunk
routes in New Zealand (Auckland and Christchurch, as well as Dunedin and Queenstown), as well as
turboprop service to regional markets on the South and North Islands. Following the departure of
Virgin Blue/Virgin Australia, Jetstar (a Qantas subsidiary) is the only other airline offering trunk route
service to Auckland and Christchurch. Beginning in FY2016, Jetstar will offer WLG-NSN regional
service operated by Eastern Australia Airlines using Dash-8 Q300 aircraft, as well as WLG-DUD
0
1
2
3
4
5
6
7
8
9
10
0
1
2
3
4
5
6
7
8
9
10
Apr May Jun Jul Aug Sep Oct Nov Dec Jan Feb Mar
Mo
nth
ly A
irc
raft
Mo
ve
me
nts
(T
ho
usa
nd
s)
FY2013
FY2014
FY2015
FY2016
Wellington International Airport Air Traffic Forecasts – DRAFT of 20 October 2015 9
service operating on an A320 commencing in October of FY2016.7 Regional carriers operating at
WLG in FY2015 include Air New Zealand’s regional subsidiaries Air Nelson, Eagle Airways, and
Mount Cook Airline, as well as ancillary regional operators Air Chathams, Origin Air, and Sounds Air.8
Qantas is the largest international carrier operating at WLG, accounting for 39% of the total
international seat capacity in FY2015. Qantas is closely followed by Air New Zealand with 33% of seat
capacity, and Virgin Australia at 26%. Due to runway length preventing long-haul wide-body aircraft
from operating at WLG, international air service is limited to Trans-Tasman flights, as well as seasonal
service to Nadi, Fiji. Beginning in FY2016 Fiji Airways commenced year-round WLG-NAN service
which is projected to nearly treble seat capacity to the Pacific islands from Wellington.9 Additionally,
new capacity is being introduced by Jetstar on trans-Tasman routes to OOL and MEL in FY2016,
further boosting international seat capacity in the coming year.
Figure 2-6 Domestic and International Market Share by Carrier Seat Capacity FY2015
Source: OAG Schedule Data via Diio Mi.
7 Jetstar New Zealand, “Jetstar launches low fares to Nelson, Napier, New Plymouth and Palmerston North”, 30
August 2015. 8 As of the writing of this report, Air New Zealand is in the process of shutting down operations by Eagle Airways.
They are not expected to be operating past the end of FY2016. 9 OAG Schedule Data via Diio Mi, Scheduled Seat Capacity from WLG, FY2016.
Air New Zealand
81%
Jetstar18%
Sounds Air1%
Qantas39%
Air New Zealand
33%
Virgin Australia
26%
Jetstar2%
Domestic International
Wellington International Airport Air Traffic Forecasts – DRAFT of 20 October 2015 10
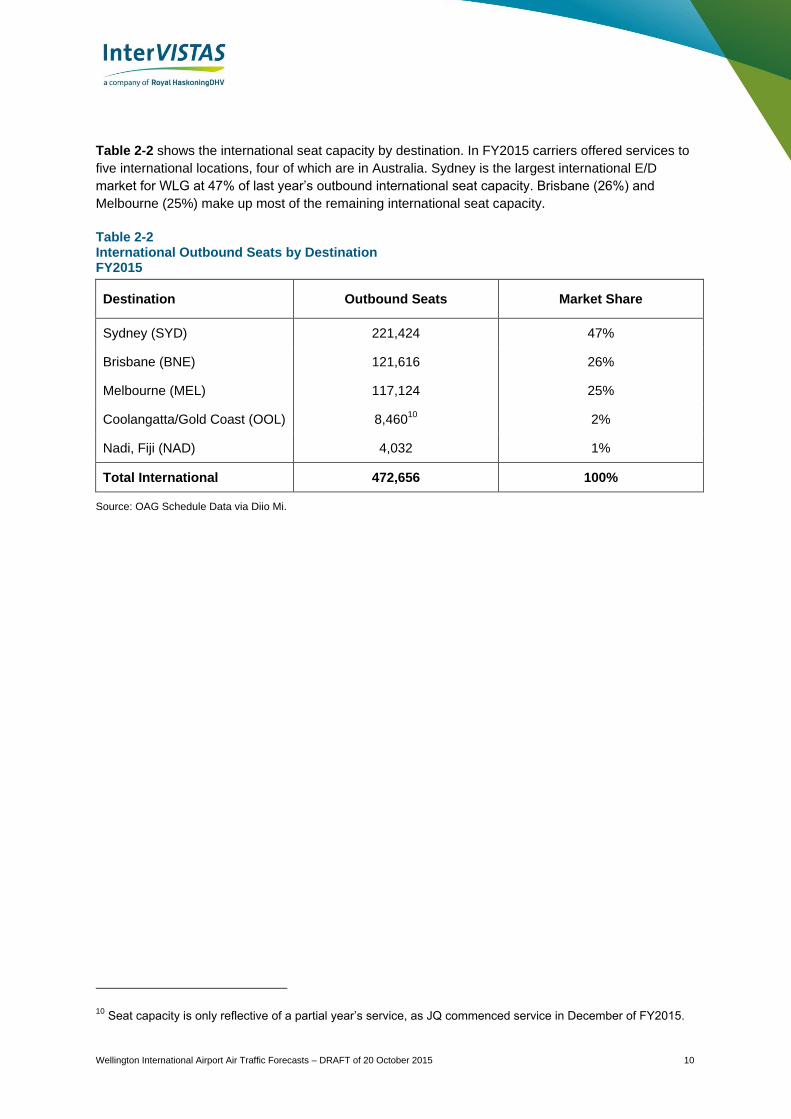
Table 2-2 shows the international seat capacity by destination. In FY2015 carriers offered services to
five international locations, four of which are in Australia. Sydney is the largest international E/D
market for WLG at 47% of last year’s outbound international seat capacity. Brisbane (26%) and
Melbourne (25%) make up most of the remaining international seat capacity.
Table 2-2 International Outbound Seats by Destination FY2015
Destination Outbound Seats Market Share
Sydney (SYD) 221,424 47%
Brisbane (BNE) 121,616 26%
Melbourne (MEL) 117,124 25%
Coolangatta/Gold Coast (OOL) 8,46010
2%
Nadi, Fiji (NAD) 4,032 1%
Total International 472,656 100%
Source: OAG Schedule Data via Diio Mi.
10 Seat capacity is only reflective of a partial year’s service, as JQ commenced service in December of FY2015.
Wellington International Airport Air Traffic Forecasts – DRAFT of 20 October 2015 11
3 Economy Conditions
Economic conditions are expected to have meaningful impacts on traffic levels at WLG. New
Zealand’s economy is highly dependent on international trade. Its main trading partners are Australia,
China, the U.S., and Japan. The following provides an overview of the economic conditions in and
around Wellington, New Zealand and its major international trade and tourism markets.
3.1 Population
In 2014, the population of the Wellington Region11
was approximately 490,000 persons, while the
population of Wellington city proper is just under 200,000 persons, or 40% of the regional population.
The population of New Zealand is approximately 4.5 million persons, meaning that the Wellington
Region accounts for approximately 11% of the national population, and Wellington city accounts for
approximately 4% of the national population.
WLG’s catchment area also includes much of Manawatu-Wanganui (directly north of the Wellington
Region), which in 2014 had a population of approximately 233,000 persons. Combining the
Wellington Region and Manawatu-Wanganui gives a combined direct catchment area population of
approximately 723,000 persons in 2014, or 16% of the national population. While not all residents in
Manawatu-Wanganui would travel to WLG as their primary airport, the size of this catchment area is
an important metric in understanding WLG’s local market.12
Over the next 40 years, the total population of New Zealand is projected to grow at an annual rate of
0.7% per annum on average.13
Over the same time period, the Wellington Region is projected to grow
at 0.4% per annum, Manawatu-Wanganui at 0.05% per annum, and the combined catchment area of
those administrative regions at 0.3% per annum, on average.14
Population growth in WLG’s primary
catchment area is projected to be centred on the Wellington Region and Wellington city proper, while
the outlying regions in its catchment area are not projected to grow their population as fast.
3.2 New Zealand’s Gross Domestic Product
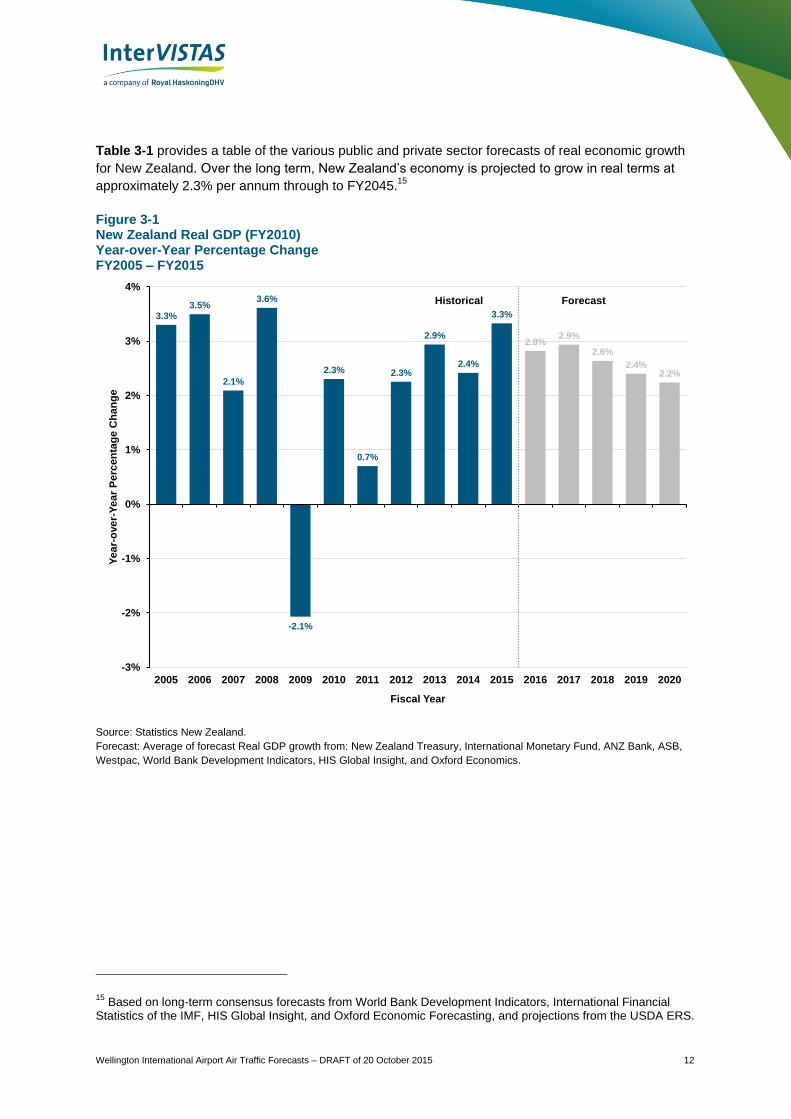
Figure 3-1 shows New Zealand’s real Gross Domestic Product (GDP) growth over the past ten years
and a short-term forecast to FY2020. New Zealand’s economy was impacted by the global economic
recession in FY2009, with GDP contracting by more than 2% in that year. The economy quickly
rebounded, posting positive growth from FY2010 to FY2015. Growth in FY2011 was impacted by the
Christchurch earthquake in February 2011, in particular.
Over the past five years, New Zealand’s economy has grown, in real terms, at an average of 2.3% per
annum. This is slightly below the 25-year average annual growth rate of 2.7%. The outlook for New
Zealand’s real GDP is for moderating growth, averaging 2.7% for FY2016-18, and then slowing to
around 2% per annum for FY2019-20.
11 Including the local authorities of Wellington, Lower Hutt, Upper Hutt, Porirua.Kapiti Coast, and the Wairarapa –
within approximately 1 hours drive of the airport 12
Based on InterVISTAS’ 2014 analysis of WLG’s catchment area, WLG draws travellers from the following regions in addition to those listed above: Marlborough, Hawke’s Bay, Taranaki, Nelson and Tasman. InterVISTAS, Viability Assessment of Long Haul Service at Wellington Airport, December 2014. 13
Statistics New Zealand, Population Projections (Median Case), 2014-2068. 14
Statistics New Zealand, Subnational Population Projections (Medium Scenario), 2013-2043.
Wellington International Airport Air Traffic Forecasts – DRAFT of 20 October 2015 12
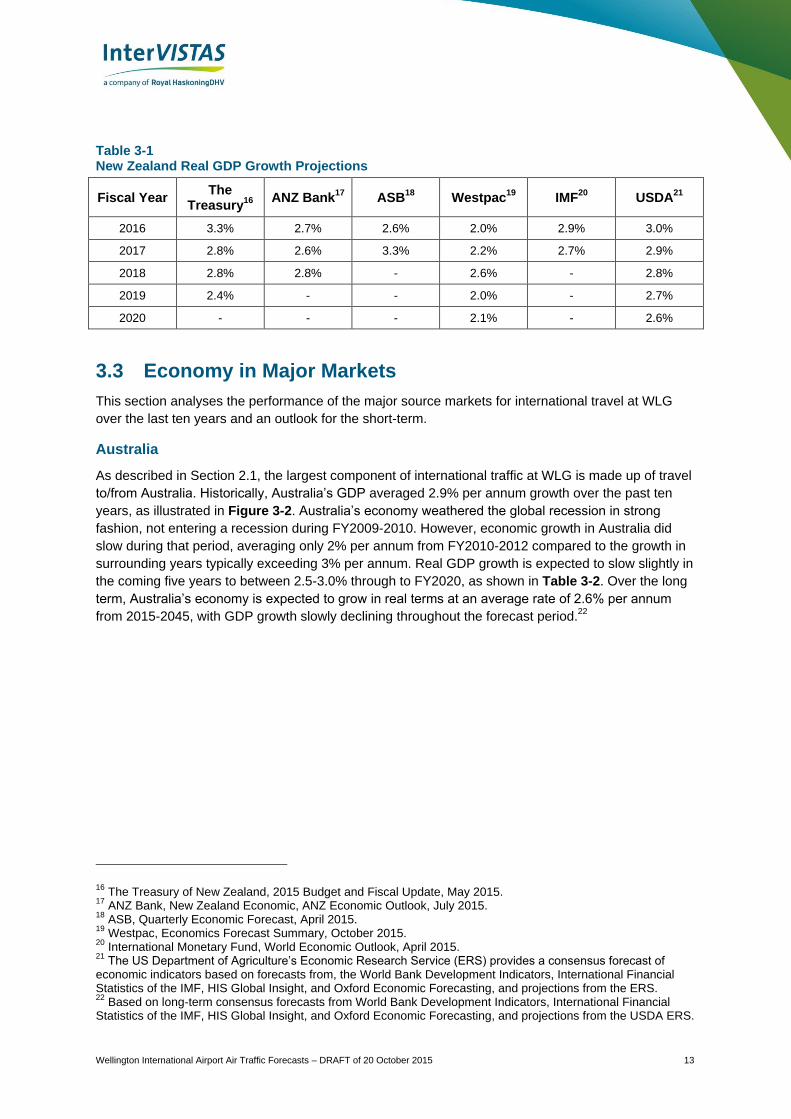
Table 3-1 provides a table of the various public and private sector forecasts of real economic growth
for New Zealand. Over the long term, New Zealand’s economy is projected to grow in real terms at
approximately 2.3% per annum through to FY2045.15
Figure 3-1 New Zealand Real GDP (FY2010) Year-over-Year Percentage Change FY2005 – FY2015
Source: Statistics New Zealand.
Forecast: Average of forecast Real GDP growth from: New Zealand Treasury, International Monetary Fund, ANZ Bank, ASB,
Westpac, World Bank Development Indicators, HIS Global Insight, and Oxford Economics.
15 Based on long-term consensus forecasts from World Bank Development Indicators, International Financial
Statistics of the IMF, HIS Global Insight, and Oxford Economic Forecasting, and projections from the USDA ERS.
3.3%3.5%
2.1%
3.6%
-2.1%
2.3%
0.7%
2.3%
2.9%
2.4%
3.3%
2.8%2.9%
2.6%
2.4%2.2%
-3%
-2%
-1%
0%
1%
2%
3%
4%
2005 2006 2007 2008 2009 2010 2011 2012 2013 2014 2015 2016 2017 2018 2019 2020
Ye
ar-
ove
r-Y
ea
r P
erc
en
tag
e C
han
ge
Fiscal Year
Historical Forecast
Wellington International Airport Air Traffic Forecasts – DRAFT of 20 October 2015 13
Table 3-1 New Zealand Real GDP Growth Projections
Fiscal Year The
Treasury16
ANZ Bank
17 ASB
18 Westpac
19 IMF
20 USDA
21
2016 3.3% 2.7% 2.6% 2.0% 2.9% 3.0%
2017 2.8% 2.6% 3.3% 2.2% 2.7% 2.9%
2018 2.8% 2.8% - 2.6% - 2.8%
2019 2.4% - - 2.0% - 2.7%
2020 - - - 2.1% - 2.6%
3.3 Economy in Major Markets
This section analyses the performance of the major source markets for international travel at WLG
over the last ten years and an outlook for the short-term.
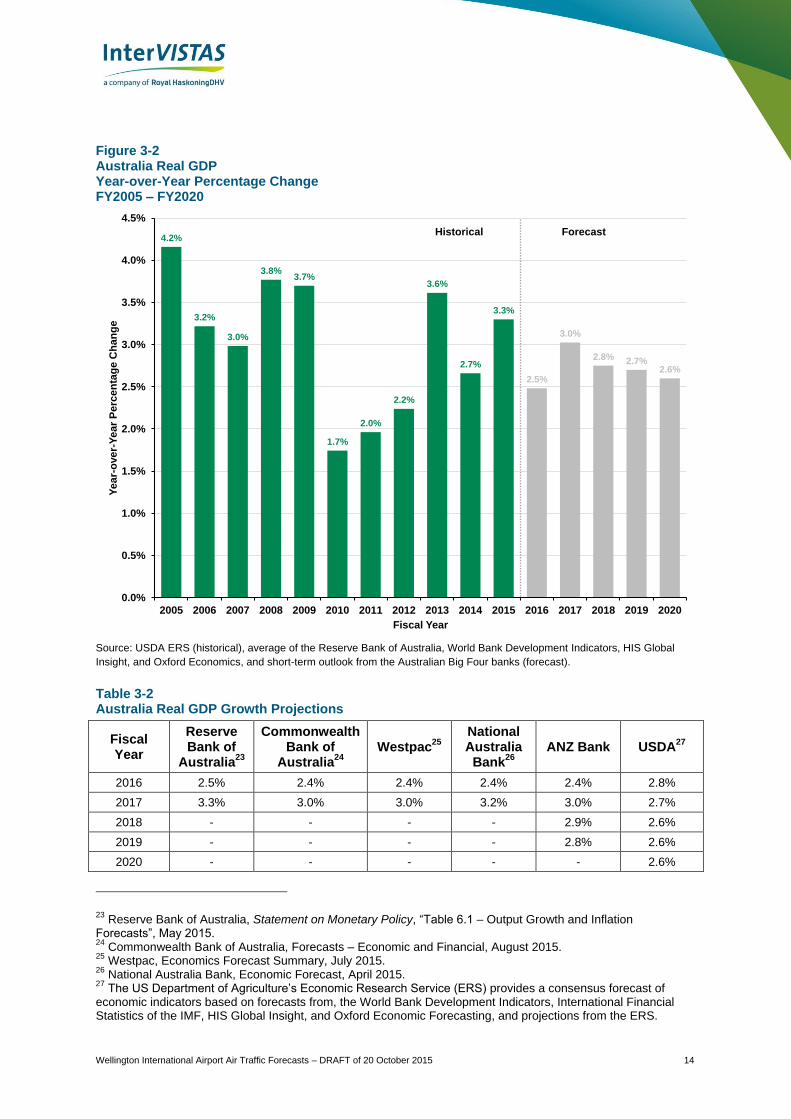
Australia
As described in Section 2.1, the largest component of international traffic at WLG is made up of travel
to/from Australia. Historically, Australia’s GDP averaged 2.9% per annum growth over the past ten
years, as illustrated in Figure 3-2. Australia’s economy weathered the global recession in strong
fashion, not entering a recession during FY2009-2010. However, economic growth in Australia did
slow during that period, averaging only 2% per annum from FY2010-2012 compared to the growth in
surrounding years typically exceeding 3% per annum. Real GDP growth is expected to slow slightly in
the coming five years to between 2.5-3.0% through to FY2020, as shown in Table 3-2. Over the long
term, Australia’s economy is expected to grow in real terms at an average rate of 2.6% per annum
from 2015-2045, with GDP growth slowly declining throughout the forecast period.22
16 The Treasury of New Zealand, 2015 Budget and Fiscal Update, May 2015.
17 ANZ Bank, New Zealand Economic, ANZ Economic Outlook, July 2015.
18 ASB, Quarterly Economic Forecast, April 2015.
19 Westpac, Economics Forecast Summary, October 2015.
20 International Monetary Fund, World Economic Outlook, April 2015.
21 The US Department of Agriculture’s Economic Research Service (ERS) provides a consensus forecast of
economic indicators based on forecasts from, the World Bank Development Indicators, International Financial Statistics of the IMF, HIS Global Insight, and Oxford Economic Forecasting, and projections from the ERS. 22
Based on long-term consensus forecasts from World Bank Development Indicators, International Financial Statistics of the IMF, HIS Global Insight, and Oxford Economic Forecasting, and projections from the USDA ERS.
Wellington International Airport Air Traffic Forecasts – DRAFT of 20 October 2015 14
Figure 3-2 Australia Real GDP Year-over-Year Percentage Change FY2005 – FY2020
Source: USDA ERS (historical), average of the Reserve Bank of Australia, World Bank Development Indicators, HIS Global
Insight, and Oxford Economics, and short-term outlook from the Australian Big Four banks (forecast).
Table 3-2 Australia Real GDP Growth Projections
Fiscal Year
Reserve Bank of
Australia23
Commonwealth Bank of
Australia24
Westpac
25
National Australia
Bank26
ANZ Bank USDA
27
2016 2.5% 2.4% 2.4% 2.4% 2.4% 2.8%
2017 3.3% 3.0% 3.0% 3.2% 3.0% 2.7%
2018 - - - - 2.9% 2.6%
2019 - - - - 2.8% 2.6%
2020 - - - - - 2.6%
23 Reserve Bank of Australia, Statement on Monetary Policy, “Table 6.1 – Output Growth and Inflation
Forecasts”, May 2015. 24
Commonwealth Bank of Australia, Forecasts – Economic and Financial, August 2015. 25
Westpac, Economics Forecast Summary, July 2015. 26
National Australia Bank, Economic Forecast, April 2015. 27
The US Department of Agriculture’s Economic Research Service (ERS) provides a consensus forecast of economic indicators based on forecasts from, the World Bank Development Indicators, International Financial Statistics of the IMF, HIS Global Insight, and Oxford Economic Forecasting, and projections from the ERS.
4.2%
3.2%
3.0%
3.8%3.7%
1.7%
2.0%
2.2%
3.6%
2.7%
3.3%
2.5%
3.0%
2.8% 2.7%2.6%
0.0%
0.5%
1.0%
1.5%
2.0%
2.5%
3.0%
3.5%
4.0%
4.5%
2005 2006 2007 2008 2009 2010 2011 2012 2013 2014 2015 2016 2017 2018 2019 2020
Ye
ar-
ove
r-Y
ea
r P
erc
en
tag
e C
ha
ng
e
Fiscal Year
Historical Forecast
Wellington International Airport Air Traffic Forecasts – DRAFT of 20 October 2015 15
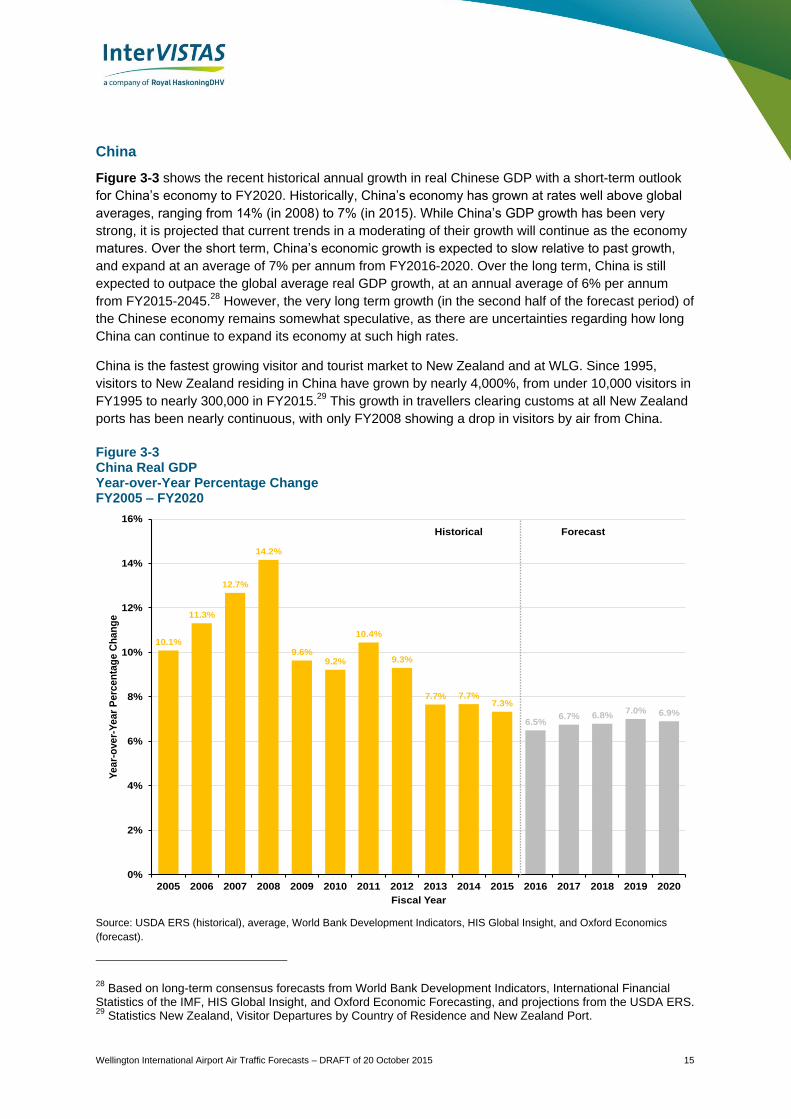
China
Figure 3-3 shows the recent historical annual growth in real Chinese GDP with a short-term outlook
for China’s economy to FY2020. Historically, China’s economy has grown at rates well above global
averages, ranging from 14% (in 2008) to 7% (in 2015). While China’s GDP growth has been very
strong, it is projected that current trends in a moderating of their growth will continue as the economy
matures. Over the short term, China’s economic growth is expected to slow relative to past growth,
and expand at an average of 7% per annum from FY2016-2020. Over the long term, China is still
expected to outpace the global average real GDP growth, at an annual average of 6% per annum
from FY2015-2045.28
However, the very long term growth (in the second half of the forecast period) of
the Chinese economy remains somewhat speculative, as there are uncertainties regarding how long
China can continue to expand its economy at such high rates.
China is the fastest growing visitor and tourist market to New Zealand and at WLG. Since 1995,
visitors to New Zealand residing in China have grown by nearly 4,000%, from under 10,000 visitors in
FY1995 to nearly 300,000 in FY2015.29
This growth in travellers clearing customs at all New Zealand
ports has been nearly continuous, with only FY2008 showing a drop in visitors by air from China.
Figure 3-3 China Real GDP Year-over-Year Percentage Change FY2005 – FY2020
Source: USDA ERS (historical), average, World Bank Development Indicators, HIS Global Insight, and Oxford Economics
(forecast).
28 Based on long-term consensus forecasts from World Bank Development Indicators, International Financial
Statistics of the IMF, HIS Global Insight, and Oxford Economic Forecasting, and projections from the USDA ERS. 29
Statistics New Zealand, Visitor Departures by Country of Residence and New Zealand Port.
10.1%
11.3%
12.7%
14.2%
9.6%9.2%
10.4%
9.3%
7.7% 7.7%7.3%
6.5%6.7% 6.8%
7.0% 6.9%
0%
2%
4%
6%
8%
10%
12%
14%
16%
2005 2006 2007 2008 2009 2010 2011 2012 2013 2014 2015 2016 2017 2018 2019 2020
Ye
ar-
ove
r-Y
ea
r P
erc
en
tag
e C
ha
ng
e
Fiscal Year
Historical Forecast
Wellington International Airport Air Traffic Forecasts – DRAFT of 20 October 2015 16
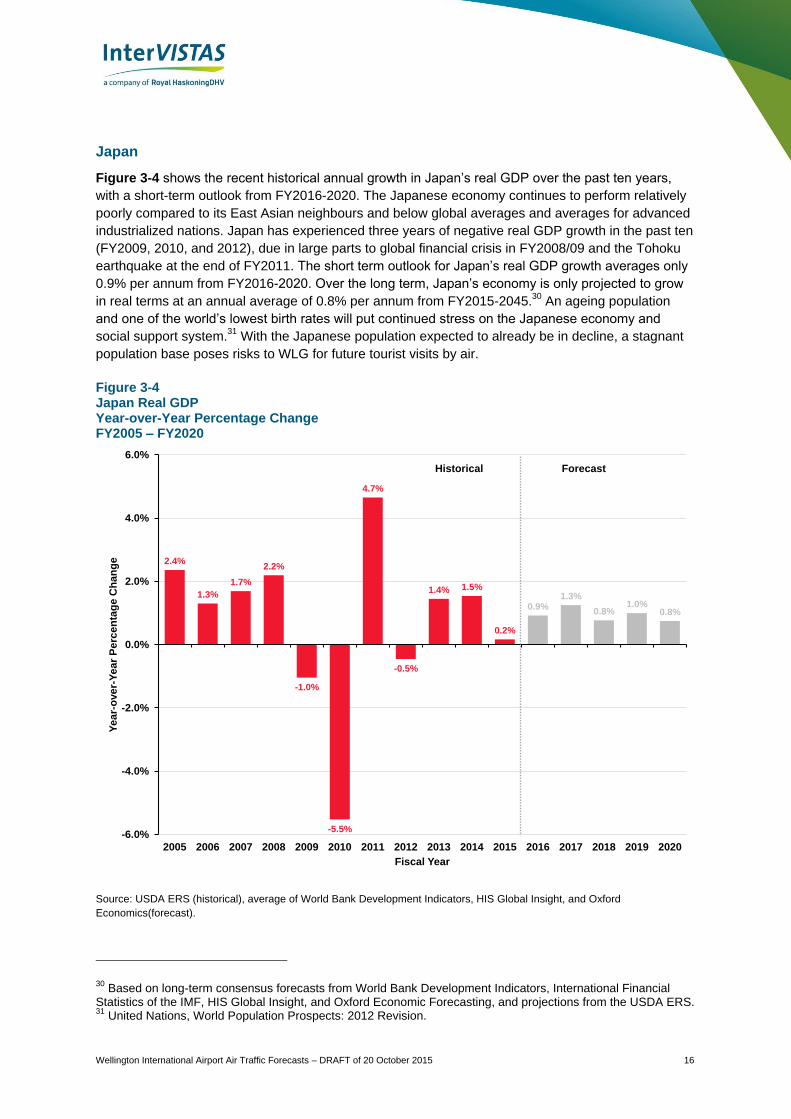
Japan
Figure 3-4 shows the recent historical annual growth in Japan’s real GDP over the past ten years,
with a short-term outlook from FY2016-2020. The Japanese economy continues to perform relatively
poorly compared to its East Asian neighbours and below global averages and averages for advanced
industrialized nations. Japan has experienced three years of negative real GDP growth in the past ten
(FY2009, 2010, and 2012), due in large parts to global financial crisis in FY2008/09 and the Tohoku
earthquake at the end of FY2011. The short term outlook for Japan’s real GDP growth averages only
0.9% per annum from FY2016-2020. Over the long term, Japan’s economy is only projected to grow
in real terms at an annual average of 0.8% per annum from FY2015-2045.30
An ageing population
and one of the world’s lowest birth rates will put continued stress on the Japanese economy and
social support system.31
With the Japanese population expected to already be in decline, a stagnant
population base poses risks to WLG for future tourist visits by air.
Figure 3-4 Japan Real GDP Year-over-Year Percentage Change FY2005 – FY2020
Source: USDA ERS (historical), average of World Bank Development Indicators, HIS Global Insight, and Oxford
Economics(forecast).
30 Based on long-term consensus forecasts from World Bank Development Indicators, International Financial
Statistics of the IMF, HIS Global Insight, and Oxford Economic Forecasting, and projections from the USDA ERS. 31
United Nations, World Population Prospects: 2012 Revision.
2.4%
1.3%
1.7%
2.2%
-1.0%
-5.5%
4.7%
-0.5%
1.4% 1.5%
0.2%
0.9%1.3%
0.8%1.0%
0.8%
-6.0%
-4.0%
-2.0%
0.0%
2.0%
4.0%
6.0%
2005 2006 2007 2008 2009 2010 2011 2012 2013 2014 2015 2016 2017 2018 2019 2020
Ye
ar-
ove
r-Y
ea
r P
erc
en
tag
e C
ha
ng
e
Fiscal Year
Historical Forecast
Wellington International Airport Air Traffic Forecasts – DRAFT of 20 October 2015 17
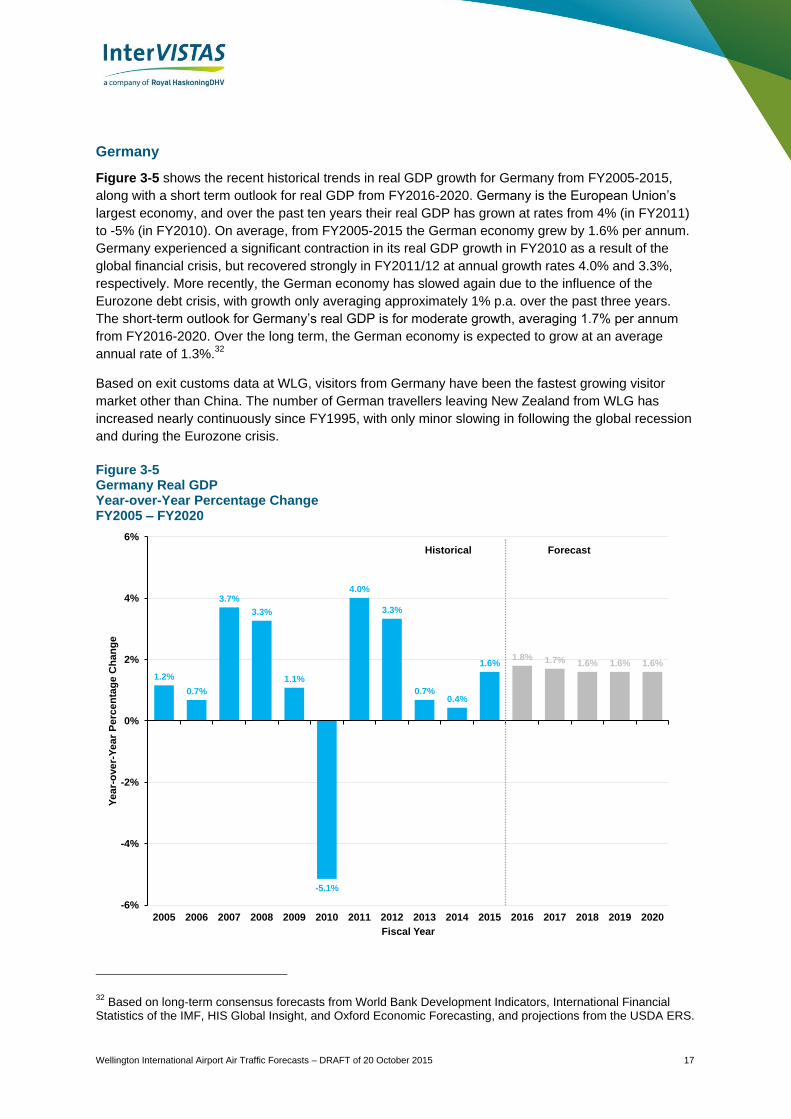
Germany
Figure 3-5 shows the recent historical trends in real GDP growth for Germany from FY2005-2015,
along with a short term outlook for real GDP from FY2016-2020. Germany is the European Union’s
largest economy, and over the past ten years their real GDP has grown at rates from 4% (in FY2011)
to -5% (in FY2010). On average, from FY2005-2015 the German economy grew by 1.6% per annum.
Germany experienced a significant contraction in its real GDP growth in FY2010 as a result of the
global financial crisis, but recovered strongly in FY2011/12 at annual growth rates 4.0% and 3.3%,
respectively. More recently, the German economy has slowed again due to the influence of the
Eurozone debt crisis, with growth only averaging approximately 1% p.a. over the past three years.
The short-term outlook for Germany’s real GDP is for moderate growth, averaging 1.7% per annum
from FY2016-2020. Over the long term, the German economy is expected to grow at an average
annual rate of 1.3%.32
Based on exit customs data at WLG, visitors from Germany have been the fastest growing visitor
market other than China. The number of German travellers leaving New Zealand from WLG has
increased nearly continuously since FY1995, with only minor slowing in following the global recession
and during the Eurozone crisis.
Figure 3-5 Germany Real GDP Year-over-Year Percentage Change FY2005 – FY2020
32 Based on long-term consensus forecasts from World Bank Development Indicators, International Financial
Statistics of the IMF, HIS Global Insight, and Oxford Economic Forecasting, and projections from the USDA ERS.
1.2%
0.7%
3.7%
3.3%
1.1%
-5.1%
4.0%
3.3%
0.7%0.4%
1.6%1.8% 1.7% 1.6% 1.6% 1.6%
-6%
-4%
-2%
0%
2%
4%
6%
2005 2006 2007 2008 2009 2010 2011 2012 2013 2014 2015 2016 2017 2018 2019 2020
Ye
ar-
ove
r-Y
ea
r P
erc
en
tag
e C
ha
ng
e
Fiscal Year
Historical Forecast
Wellington International Airport Air Traffic Forecasts – DRAFT of 20 October 2015 18
Source: USDA ERS (historical), average of, World Bank Development Indicators, HIS Global Insight, and Oxford
Economics(forecast).
United Kingdom
As discussed in Section 2.1, the UK is the second-largest tourist market for WLG and is also the
second-largest inbound tourist/visitor market for New Zealand as a whole. While the number of
visitors arriving in New Zealand through WLG from the UK is relatively small compared to the
Australian market, the economic impact of the UK economy on international visitors to WLG is
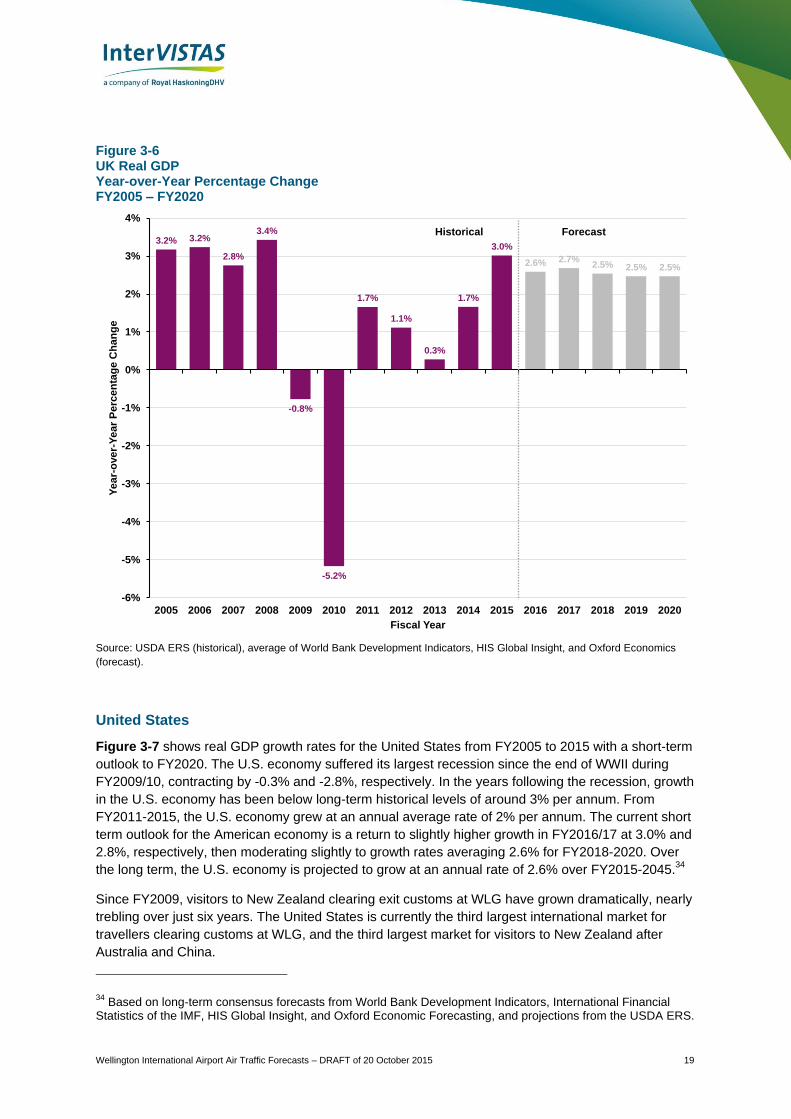
important. Figure 3-6 shows the recent historical growth in the United Kingdom’s real GDP over the
years FY2005 to 2015, as well as a short-term outlook on real GDP growth. In the past 10 years, the
UK economy has grown at rates ranging from 3.4% (in FY2008) to -5.2% (in FY2010). The UK
suffered two years of recession during the global financial crisis, posting negative GDP growth in
FY2009/10. The UK economy has experienced positive growth following the recession, but generally
at rates below pre-recession levels. The short-term outlook for the UK economy is positive but
moderate, with real GDP projected to grow at an average of 2.6% per annum from FY2016-2020.
Over the long term, real GDP growth is projected to remain at around 2.5% per annum from FY2015-
2045.33
33 Based on long-term consensus forecasts from World Bank Development Indicators, International Financial
Statistics of the IMF, HIS Global Insight, and Oxford Economic Forecasting, and projections from the USDA ERS.
Wellington International Airport Air Traffic Forecasts – DRAFT of 20 October 2015 19
Figure 3-6 UK Real GDP Year-over-Year Percentage Change FY2005 – FY2020
Source: USDA ERS (historical), average of World Bank Development Indicators, HIS Global Insight, and Oxford Economics
(forecast).
United States
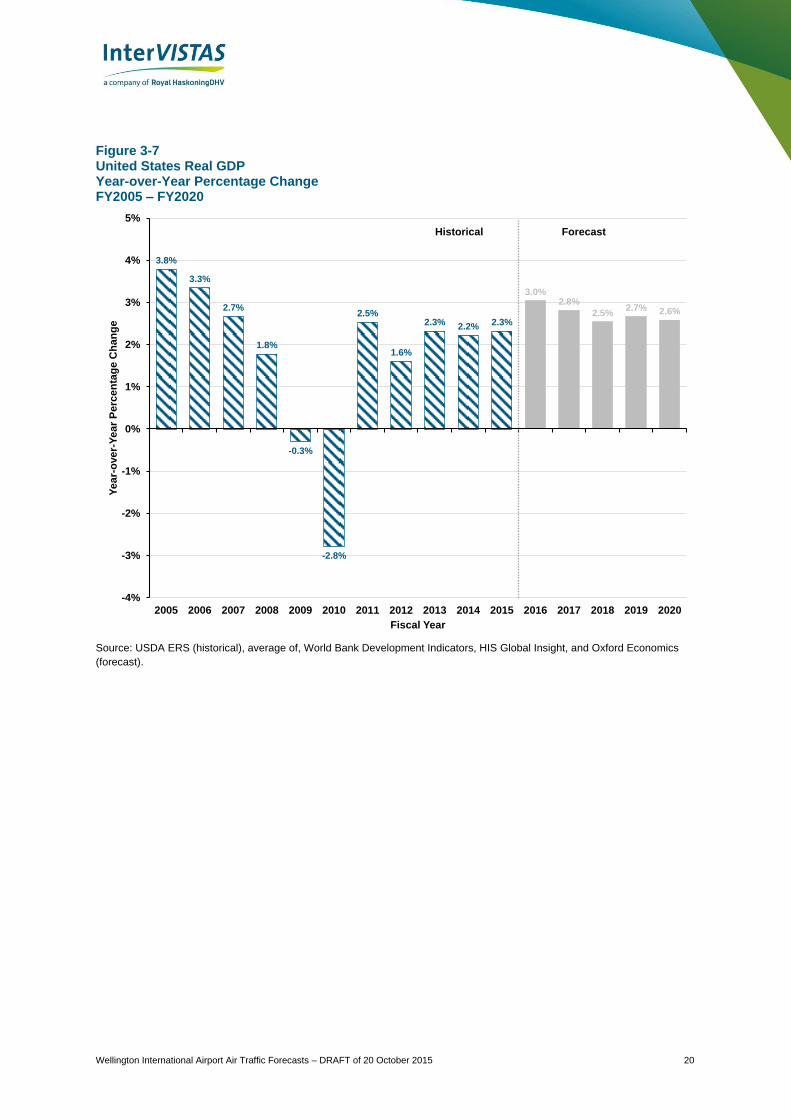
Figure 3-7 shows real GDP growth rates for the United States from FY2005 to 2015 with a short-term
outlook to FY2020. The U.S. economy suffered its largest recession since the end of WWII during
FY2009/10, contracting by -0.3% and -2.8%, respectively. In the years following the recession, growth
in the U.S. economy has been below long-term historical levels of around 3% per annum. From
FY2011-2015, the U.S. economy grew at an annual average rate of 2% per annum. The current short
term outlook for the American economy is a return to slightly higher growth in FY2016/17 at 3.0% and
2.8%, respectively, then moderating slightly to growth rates averaging 2.6% for FY2018-2020. Over
the long term, the U.S. economy is projected to grow at an annual rate of 2.6% over FY2015-2045.34
Since FY2009, visitors to New Zealand clearing exit customs at WLG have grown dramatically, nearly
trebling over just six years. The United States is currently the third largest international market for
travellers clearing customs at WLG, and the third largest market for visitors to New Zealand after
Australia and China.
34 Based on long-term consensus forecasts from World Bank Development Indicators, International Financial
Statistics of the IMF, HIS Global Insight, and Oxford Economic Forecasting, and projections from the USDA ERS.
3.2% 3.2%
2.8%
3.4%
-0.8%
-5.2%
1.7%
1.1%
0.3%
1.7%
3.0%
2.6% 2.7%2.5% 2.5% 2.5%
-6%
-5%
-4%
-3%
-2%
-1%
0%
1%
2%
3%
4%
2005 2006 2007 2008 2009 2010 2011 2012 2013 2014 2015 2016 2017 2018 2019 2020
Ye
ar-
ove
r-Y
ea
r P
erc
en
tag
e C
ha
ng
e
Fiscal Year
Historical Forecast
Wellington International Airport Air Traffic Forecasts – DRAFT of 20 October 2015 20
Figure 3-7 United States Real GDP Year-over-Year Percentage Change FY2005 – FY2020
Source: USDA ERS (historical), average of, World Bank Development Indicators, HIS Global Insight, and Oxford Economics
(forecast).
3.8%
3.3%
2.7%
1.8%
-0.3%
-2.8%
2.5%
1.6%
2.3% 2.2% 2.3%
3.0%2.8%
2.5%2.7% 2.6%
-4%
-3%
-2%
-1%
0%
1%
2%
3%
4%
5%
2005 2006 2007 2008 2009 2010 2011 2012 2013 2014 2015 2016 2017 2018 2019 2020
Ye
ar-
ove
r-Y
ea
r P
erc
en
tag
e C
ha
ng
e
Fiscal Year
Historical Forecast
Wellington International Airport Air Traffic Forecasts – DRAFT of 20 October 2015 21
4 Forecasting Methodology
The objective of the study is to forecast future traffic levels at WLG and to quantify the impact of
extending the runway at Wellington International Airport on air traffic activity levels. As such,
constrained (no runway extension) and unconstrained (with the runway extension) forecasts were
produced:
A forecast of a Business As Usual (BAU) traffic at the airport over 45 years
A forecast of a Runway Extension scenario over the same forecast horizon.
InterVISTAS has taken a forecasting approach combining traditional econometric modelling and a
stochastic, scenario-based assessment of future demand and airport traffic levels. This approach
allowed for the forecast team to utilize data-driven econometric analysis and risk-based scenario
modelling while integrating internal and external expert judgement to most accurately account for
current market trends and future developments.
This study produced the following traffic forecasts:
Origin/destination and enplaned-deplaned traffic broken down into:
Domestic trunk vs. regional passengers,
International traffic broken down into the following sectors:
Australia, China, Japan, Other Asia, United Kingdom, United States of America, Pacific
Islands, and Other (rest of the world)
Additionally, O/D traffic forecasts are divided into inbound international visitors and outbound
New Zealand residents
Aircraft movements, by segment and aircraft type.
This chapter describes the forecasting methodologies used to produce the above traffic forecasts.
Additional discussion on the assumptions and results are described in Chapter 5 and Chapter 6.
4.1 Air Passenger Forecast Methodology
Air travel is a derived demand. Demand for air transportation between origin and destination markets
is derived from the socio-economic interactions between these markets, shaped by carriers’ networks
and available airlift capacity. Generally, business/trade activity, tourism/visitor activity as well as
visiting friends and relatives (VFR) constitute the primary components of air travel at an airport.
Dependable forecasting practice requires awareness of the uncertainties surrounding the forecasts.
Considerable effort by the project team went into analysing the factors affecting traffic activity at
Wellington International Airport. A combination of statistical analysis, market and industry outlook plus
professional judgement was used to produce the air passenger forecasts.
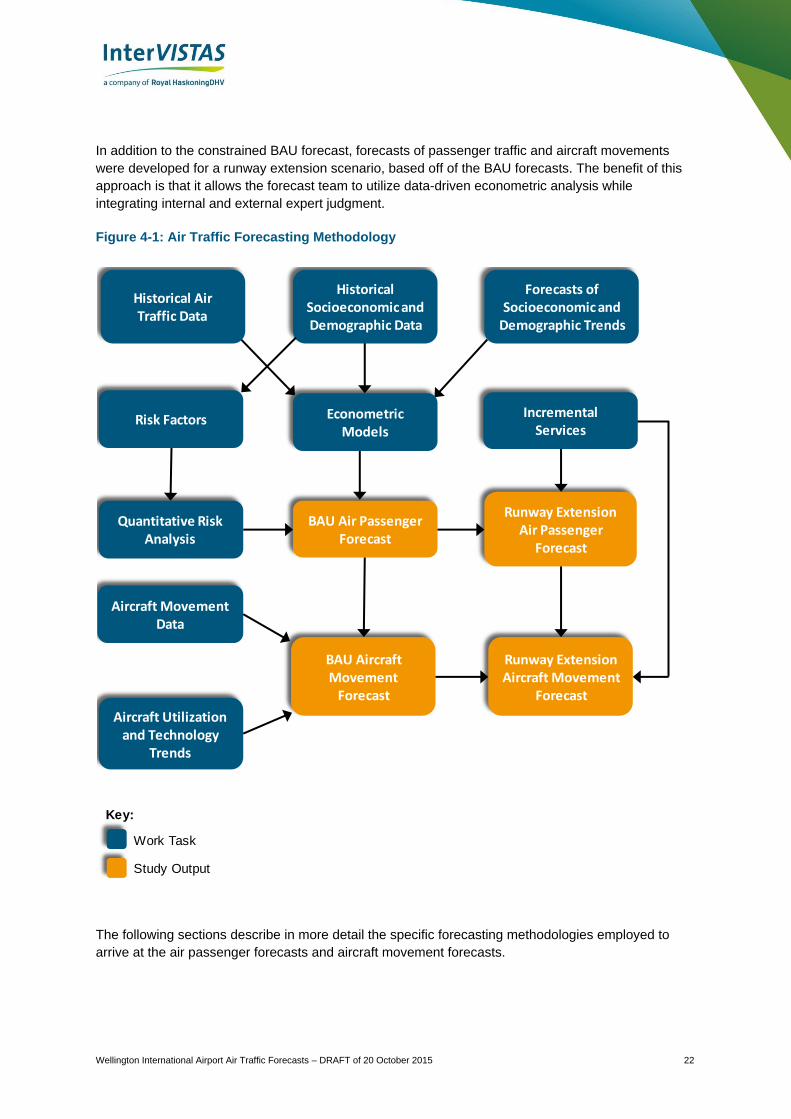
Figure 4-1 provides an overview of the forecasting model components and sequence, highlighting
key components which are discussed in more detail below. In essence, air passenger forecasts were
generated using a combination of econometric analysis, risk analysis and scenario development.
Wellington International Airport Air Traffic Forecasts – DRAFT of 20 October 2015 22
In addition to the constrained BAU forecast, forecasts of passenger traffic and aircraft movements
were developed for a runway extension scenario, based off of the BAU forecasts. The benefit of this
approach is that it allows the forecast team to utilize data-driven econometric analysis while
integrating internal and external expert judgment.
Figure 4-1: Air Traffic Forecasting Methodology
The following sections describe in more detail the specific forecasting methodologies employed to
arrive at the air passenger forecasts and aircraft movement forecasts.
Key:
Study Output
Work Task
Historical Air Traffic Data
Historical Socioeconomic and Demographic Data
Forecasts of Socioeconomic and
Demographic Trends
Quantitative Risk Analysis
BAU Aircraft Movement
Forecast
Aircraft Movement Data
Aircraft Utilization and Technology
Trends
BAU Air Passenger Forecast
Econometric Models
Risk Factors
Runway Extension Aircraft Movement
Forecast
Runway Extension Air Passenger
Forecast
IncrementalServices
Wellington International Airport Air Traffic Forecasts – DRAFT of 20 October 2015 23
4.1.1 Econometric Forecasts
The econometric modelling approach used regression analysis relating historical passenger traffic at
WLG to various socio-economic and industry factors, such as economic growth, incomes, population
growth, etc. Using projections of these factors, it was possible to produce forecasts of air traffic at
WLG through the econometric models. Separate models were estimated for the following:
Domestic traffic;
New Zealand outbound international traffic to: Australia, Pacific Islands, Asia including China, UK,
USA and other world regions;
Inbound international traffic from Australia, China, Japan, South Korea, Germany, UK, USA,
Canada, and all other world regions.
The dependent variables describing the various traffic markets were obtained from two sources:
1. Wellington International Airport Authority: providing historical domestic enplaned/deplaned traffic.
2. Statistics New Zealand data providing New Zealand resident traveller departure data (NZ
outbound international traffic) and international visitor arrivals by country of residence (inbound
international traffic) in combination with data from Diio FMg (a well-established third party provider
of aviation data) capturing ticketed itineraries.
The forecast team examined the statistical significance of a wide range of variables to produce the
final models, including real Gross Domestic Product (GDP) of the source countries, population, and
dummy variables to capture specific factors or events (e.g. the Ansett collapse and subsequent
difficulties in Air New Zealand, the introduction of new carriers on Trans-Tasman routes in the mid-
2000s, etc.). Numerous model estimations were conducted using a variety of reasonable
combinations of the above variables. The final models were selected on the basis of statistical fit,
coefficient estimate robustness, and the plausibility of the coefficient estimates produced.35
For most
markets, it was found that national GDP was the most effective variable to explain the determinants of
air traffic.36
Details of the final model specifications and parameter estimates can be found in
Appendix A.
4.1.2 Estimation of O/D Markets at WLG
The econometric forecasts produced parameter estimates of the elasticity of GDP to the demand for
air travel. InterVISTAS thus estimated the size of WLG’s domestic O/D market, and international O/D
markets (by direction) to base the forecast from.
InterVISTAS, using its experience and expertise with air travel data, estimated FY2015 inbound and
outbound international O/D traffic in the following markets:
Australia
China
Japan
35 Different model specifications were chosen for models of each traffic segment to allow for more accurate and
segment-specific forecasting based on the segment’s historical data and trends. 36
In the final forecasts, some international markets were aggregated to best reflect the underlying data available for both inbound and outbound international travellers.
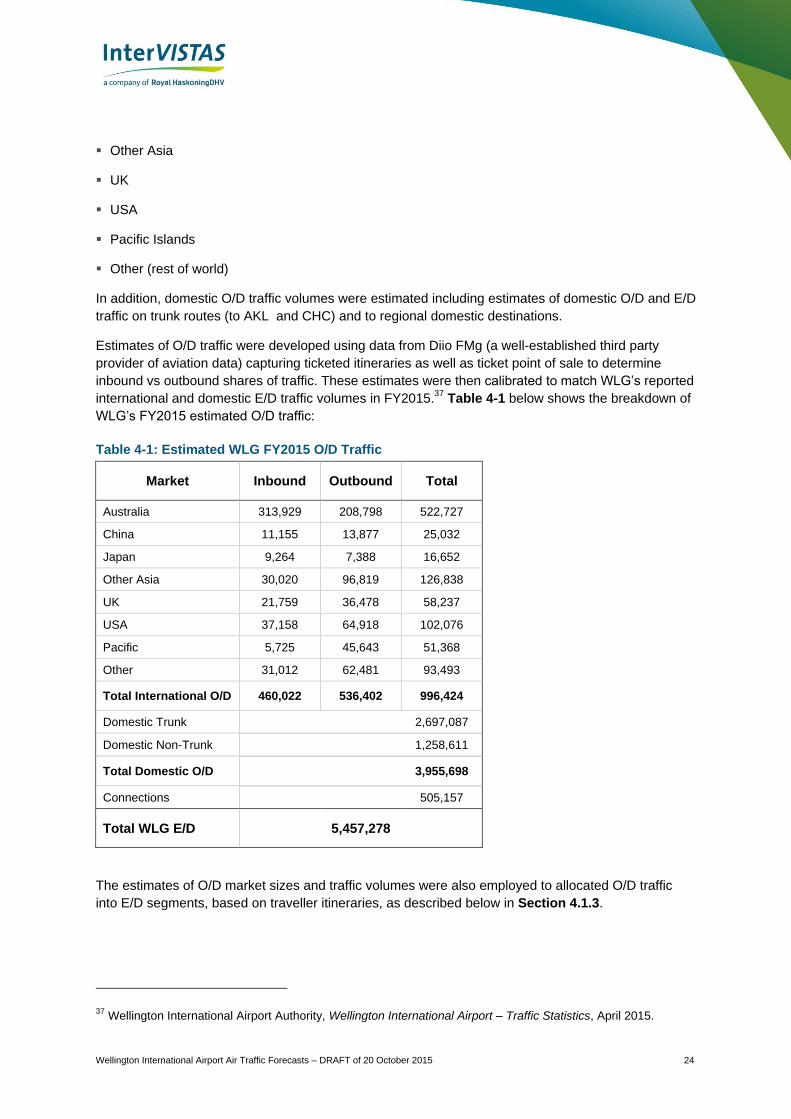
Wellington International Airport Air Traffic Forecasts – DRAFT of 20 October 2015 24
Other Asia
UK
USA
Pacific Islands
Other (rest of world)
In addition, domestic O/D traffic volumes were estimated including estimates of domestic O/D and E/D
traffic on trunk routes (to AKL and CHC) and to regional domestic destinations.
Estimates of O/D traffic were developed using data from Diio FMg (a well-established third party
provider of aviation data) capturing ticketed itineraries as well as ticket point of sale to determine
inbound vs outbound shares of traffic. These estimates were then calibrated to match WLG’s reported
international and domestic E/D traffic volumes in FY2015.37
Table 4-1 below shows the breakdown of
WLG’s FY2015 estimated O/D traffic:
Table 4-1: Estimated WLG FY2015 O/D Traffic
Market Inbound Outbound Total
Australia 313,929 208,798 522,727
China 11,155 13,877 25,032
Japan 9,264 7,388 16,652
Other Asia 30,020 96,819 126,838
UK 21,759 36,478 58,237
USA 37,158 64,918 102,076
Pacific 5,725 45,643 51,368
Other 31,012 62,481 93,493
Total International O/D 460,022 536,402 996,424
Domestic Trunk 2,697,087
Domestic Non-Trunk
1,258,611
Total Domestic O/D
3,955,698
Connections
505,157
Total WLG E/D 5,457,278
The estimates of O/D market sizes and traffic volumes were also employed to allocated O/D traffic
into E/D segments, based on traveller itineraries, as described below in Section 4.1.3.
37 Wellington International Airport Authority, Wellington International Airport – Traffic Statistics, April 2015.
Wellington International Airport Air Traffic Forecasts – DRAFT of 20 October 2015 25
Connecting Passengers
In FY2015 there were approximately 505,000 connecting passengers at WLG, representing
approximately 9% of the E/D passenger traffic at the airport. Connecting traffic at WLG is dominated
by domestic connections. Domestic connecting traffic at WLG serves to connect the North and South
Islands by transferring regional passengers on turboprop aircraft to jets on trunk and other regional
routes. Domestic connections on trunk routes also direct traffic to AKL and CHC where passengers
may be making onward connections to overseas locations. Domestic to international traffic captures
both regional traffic destined to and originating from Australia and the Pacific, as well as traffic
accessing Australian gateways for onward long-haul overseas journeys. The estimated mix of
connections in FY2015 is as follows:
Domestic-Domestic: 93%
Domestic-International: 7%
The proportion of connecting traffic in the constrained BAU forecast is expected to increase broadly in
line with overall traffic, albeit at a slightly higher rate reflecting increased opportunities for connections
as air services development. The mix of domestic-domestic and domestic-international traffic is
expected grow in line with the volumes of domestic and international traffic. In the runway extension
forecast, domestic-international connecting traffic is anticipated to increase, as the introduction of new
services will stimulate additional demand from regional communities linked to WLG which could in
turn access new international destinations through only a single connection.38
Further discussion of
the methodology used to estimate and model the stimulation of domestic connections in the runway
extension forecast is described in Section 4.4.
4.1.3 Allocating Traffic to Routes
The analysis described above is based on the source market of the passengers using WLG. However,
there are a number of routes choices that travellers can selected from travelling to/from WLG, many of
which are constrained by the lack of long-haul international service. For example, a visitor from the
UK can travel to Wellington via Asia (e.g. Hong Kong via AKL), the U.S./Canada (e.g. Los Angeles via
AKL), or Australia (direct to WLG from SYD or MEL or via CHC). Similarly, a traveller from China
could travel via a point in Asia or via Australia. For airport planning purposes, the passenger routing is
important as it dictates the type of aircraft serving WLG and if Wellington is their point of customs
clearance to New Zealand.
Therefore, the origin/destination passenger forecasts were converted into enplaned/deplaned
passengers, by splitting the source markets (both inbound and outbound traffic) into “gateway”
regions: domestic, Australia, China, Japan, Other Asia, UK, USA, Pacific Islands, and Other (rest of
world). A current FY2015 split was determined based on O/D and E/D traffic data from Diio FMg. For
example, O/D passengers from the UK were split 39% via a domestic E/D segment (over AKL or
CHC) and 61% over Australia.
The split is projected to change over the forecast period as new services emerge at WLG. For
example, for traffic to/from China, a greater proportion is expected to arrive via Australia in the future
rather than through a domestic gateway. This reflects the expect growth in capacity from Chinese
38 As opposed to an existing itinerary which would require a minimum double connection, e.g., connecting
through WLG then on to AKL, CHC, SYD, or MEL for long-haul international services.
Wellington International Airport Air Traffic Forecasts – DRAFT of 20 October 2015 26
carrier to Australia as well as potential 5th-freedom services to New Zealand via Australia.
Nevertheless, the strong competition dynamics and connection potential via New Zealand gateways
will mean that domestic gateways will retain the majority of international air traffic routings. The
assumed splits are provided in Appendix B.
4.2 Risk Analysis
As with any projection of future activity, the air traffic forecasts for WLG are subject to a degree of risk
and uncertainty. The forecasts are based on underlying assumptions regarding economic growth,
traffic development, fuel prices, aviation technology, etc. which are developed from the best available
intelligence and analysis. However, it is not possible to determine how these factors might vary over
time and when certain events may occur; .e.g., the timing of recessions, fuel price spikes, etc.
Furthermore, one-off events may have an impact on traffic but are impossible to predict, such as
terrorist attacks and major natural disasters.
The traditional approach to this issue in air traffic forecasting is to supplement the base case forecasts
with high and low case forecasts. This conveys that there is uncertainty in the forecast, and provides a
rough range for likely outcomes. However, the low case should not be interpreted as a “worst” case,
but rather a conceivable though low probability outcome. The low scenario typically embodies slower
growth in airport traffic over the medium to long term due to the combined effect of a slower economy,
high air fares, high fuel prices, etc.
An approach to better understanding the range of possible future scenarios is to apply quantitative
risk analysis to the forecast. Quantitative risk analysis recognises that there are a number of key
drivers of the forecast (economy, fares, fuel prices, etc.) and that each of these drivers has its own
level of uncertainty or its own probability distribution. This type of risk analysis utilises the probabilities
of these drivers to create a large number of potential scenarios. One scenario might be normal
economic performance but with high fuel costs and a terrorism event. Another might be weak
economic performance and high fuel costs but with no terrorism event. Typically, the quantitative
forecasts will create thousands of such scenarios, each time randomly generating values for each of
the forecast drivers. This is often referred to as Monte Carlo simulation.
Monte Carlo simulation (or the Monte Carlo method) is a computerized simulation technique which
makes use of randomization and probability statistics to investigate problems involving uncertainty.
Typically, it involves a computer model of a system or project (e.g., air traffic at an airport). The inputs
to the model, instead of being fixed numbers or variables, are specified as probability distributions.
For example, rather than traffic growth being set at X% per annum, it might be defined as having
Normal (bell-curve) distribution with a mean of X% and a standard deviation of Y%. Using computer
software, the model is run multiple times, each time randomly sampling from the input distributions,
resulting in different outcomes each time. Often, the model will be run (known as iterations) thousands
or tens of thousands of times and the results are collected from each run.
With enough iterations of the model, the output can demonstrate the range of possible outcomes and
provide statistical estimates of the probabilities of various outcomes. Depending on the complexity of
the model and input distributions assumed, the range of outcomes can be large and are not always
linear. Expected or “most likely” values can also be generated.
Monte Carlo can be seen as a powerful “what-if” or scenario-generating exercise where every
possible what-if or scenario is generated (within the confines of the model specification), including
interactions between the various input factors. Another way of looking at it, is that each iteration of the
model represents one possible future for the system being modelled. By running the model thousands
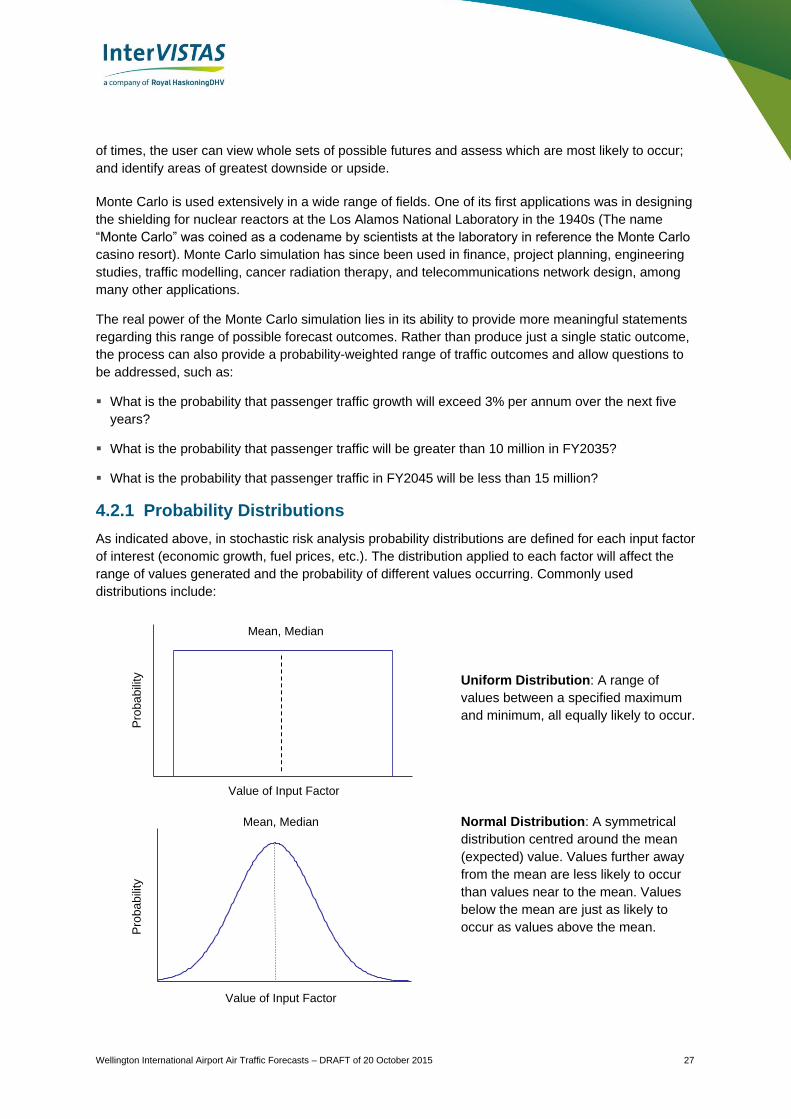
Wellington International Airport Air Traffic Forecasts – DRAFT of 20 October 2015 27
of times, the user can view whole sets of possible futures and assess which are most likely to occur;
and identify areas of greatest downside or upside.
Monte Carlo is used extensively in a wide range of fields. One of its first applications was in designing
the shielding for nuclear reactors at the Los Alamos National Laboratory in the 1940s (The name
“Monte Carlo” was coined as a codename by scientists at the laboratory in reference the Monte Carlo
casino resort). Monte Carlo simulation has since been used in finance, project planning, engineering
studies, traffic modelling, cancer radiation therapy, and telecommunications network design, among
many other applications.
The real power of the Monte Carlo simulation lies in its ability to provide more meaningful statements
regarding this range of possible forecast outcomes. Rather than produce just a single static outcome,
the process can also provide a probability-weighted range of traffic outcomes and allow questions to
be addressed, such as:
What is the probability that passenger traffic growth will exceed 3% per annum over the next five
years?
What is the probability that passenger traffic will be greater than 10 million in FY2035?
What is the probability that passenger traffic in FY2045 will be less than 15 million?
4.2.1 Probability Distributions
As indicated above, in stochastic risk analysis probability distributions are defined for each input factor
of interest (economic growth, fuel prices, etc.). The distribution applied to each factor will affect the
range of values generated and the probability of different values occurring. Commonly used
distributions include:
Uniform Distribution: A range of
values between a specified maximum
and minimum, all equally likely to occur.
Normal Distribution: A symmetrical
distribution centred around the mean
(expected) value. Values further away
from the mean are less likely to occur
than values near to the mean. Values
below the mean are just as likely to
occur as values above the mean.
Value of Input Factor
Pro
ba
bili
ty
Mean, Median
Value of Input Factor
Pro
ba
bili
ty
Mean, Median
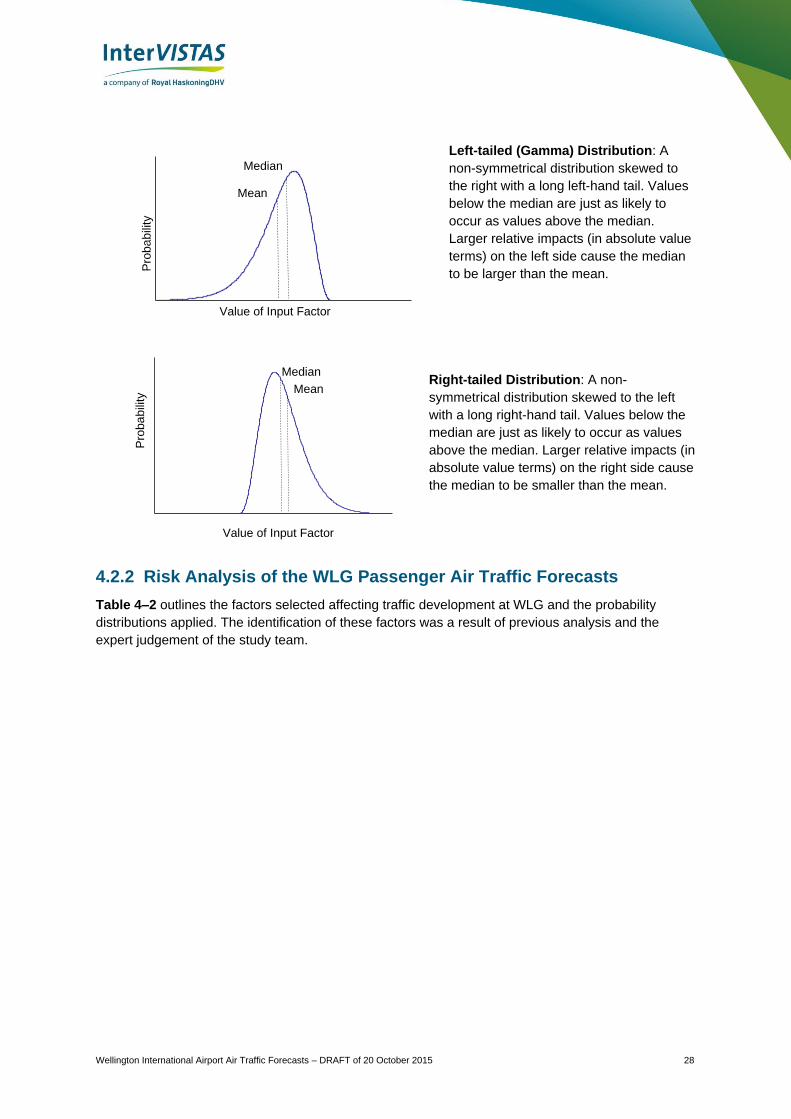
Wellington International Airport Air Traffic Forecasts – DRAFT of 20 October 2015 28
Left-tailed (Gamma) Distribution: A
non-symmetrical distribution skewed to
the right with a long left-hand tail. Values
below the median are just as likely to
occur as values above the median.
Larger relative impacts (in absolute value
terms) on the left side cause the median
to be larger than the mean.
Right-tailed Distribution: A non-
symmetrical distribution skewed to the left
with a long right-hand tail. Values below the
median are just as likely to occur as values
above the median. Larger relative impacts (in
absolute value terms) on the right side cause
the median to be smaller than the mean.
4.2.2 Risk Analysis of the WLG Passenger Air Traffic Forecasts
Table 4–2 outlines the factors selected affecting traffic development at WLG and the probability
distributions applied. The identification of these factors was a result of previous analysis and the
expert judgement of the study team.
Pro
ba
bili
ty
Value of Input Factor 0
0.05
0.1
0.15
0.2
0.25
0 50 100 150 200
Mean
Median
0
0.02
0.04
0.06
0.08
0.1
0.12
0.14
0.16
0.18
-102 -52 -2 48 98 148 198
Mean
Value of Input Factor
Pro
ba
bili
ty
Median
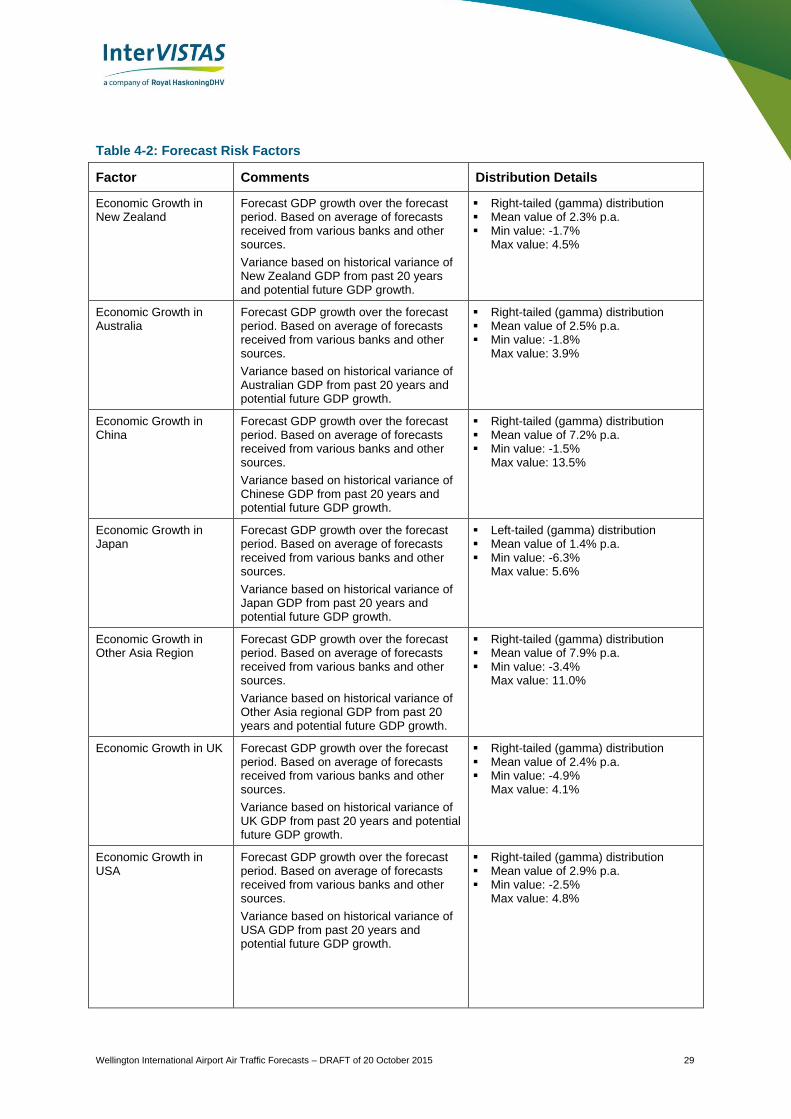
Wellington International Airport Air Traffic Forecasts – DRAFT of 20 October 2015 29
Table 4-2: Forecast Risk Factors
Factor Comments Distribution Details
Economic Growth in New Zealand
Forecast GDP growth over the forecast period. Based on average of forecasts received from various banks and other sources.
Variance based on historical variance of New Zealand GDP from past 20 years and potential future GDP growth.
Right-tailed (gamma) distribution Mean value of 2.3% p.a. Min value: -1.7%
Max value: 4.5%
Economic Growth in Australia
Forecast GDP growth over the forecast period. Based on average of forecasts received from various banks and other sources.
Variance based on historical variance of Australian GDP from past 20 years and potential future GDP growth.
Right-tailed (gamma) distribution Mean value of 2.5% p.a. Min value: -1.8%
Max value: 3.9%
Economic Growth in China
Forecast GDP growth over the forecast period. Based on average of forecasts received from various banks and other sources.
Variance based on historical variance of Chinese GDP from past 20 years and potential future GDP growth.
Right-tailed (gamma) distribution Mean value of 7.2% p.a. Min value: -1.5%
Max value: 13.5%
Economic Growth in Japan
Forecast GDP growth over the forecast period. Based on average of forecasts received from various banks and other sources.
Variance based on historical variance of Japan GDP from past 20 years and potential future GDP growth.
Left-tailed (gamma) distribution Mean value of 1.4% p.a. Min value: -6.3%
Max value: 5.6%
Economic Growth in Other Asia Region
Forecast GDP growth over the forecast period. Based on average of forecasts received from various banks and other sources.
Variance based on historical variance of Other Asia regional GDP from past 20 years and potential future GDP growth.
Right-tailed (gamma) distribution Mean value of 7.9% p.a. Min value: -3.4%
Max value: 11.0%
Economic Growth in UK Forecast GDP growth over the forecast period. Based on average of forecasts received from various banks and other sources.
Variance based on historical variance of UK GDP from past 20 years and potential future GDP growth.
Right-tailed (gamma) distribution Mean value of 2.4% p.a. Min value: -4.9%
Max value: 4.1%
Economic Growth in USA
Forecast GDP growth over the forecast period. Based on average of forecasts received from various banks and other sources.
Variance based on historical variance of USA GDP from past 20 years and potential future GDP growth.
Right-tailed (gamma) distribution Mean value of 2.9% p.a. Min value: -2.5%
Max value: 4.8%
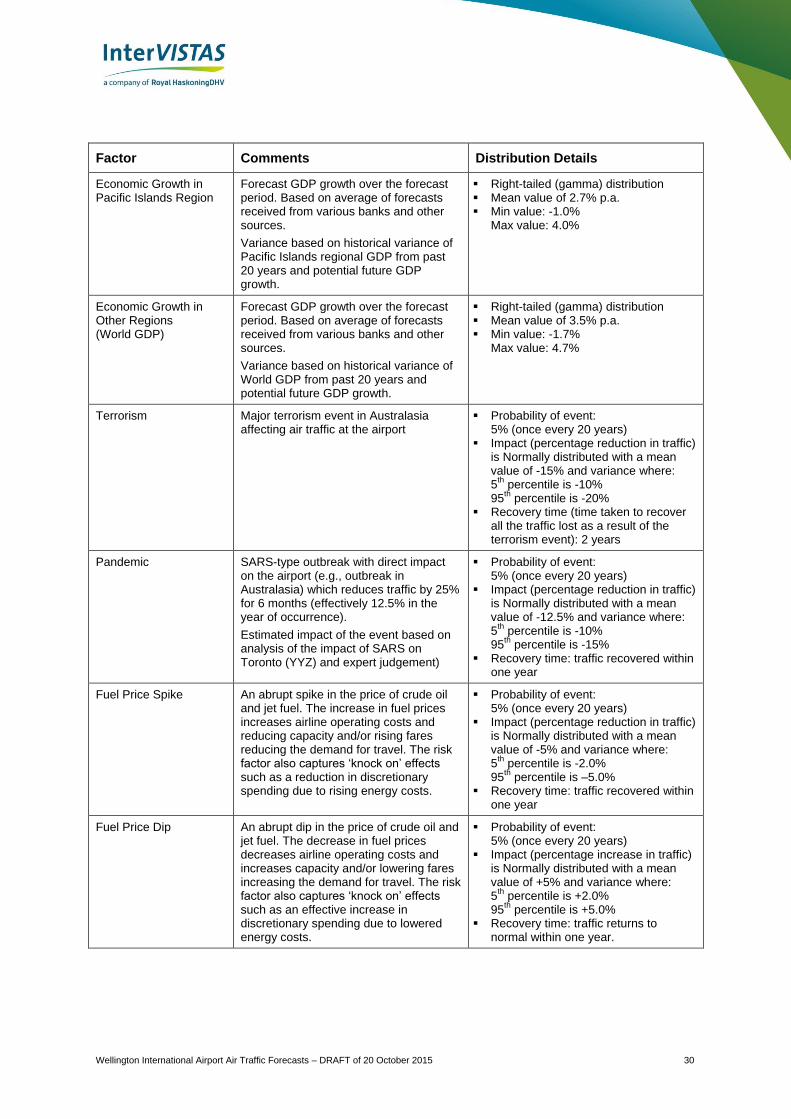
Wellington International Airport Air Traffic Forecasts – DRAFT of 20 October 2015 30
Factor Comments Distribution Details
Economic Growth in Pacific Islands Region
Forecast GDP growth over the forecast period. Based on average of forecasts received from various banks and other sources.
Variance based on historical variance of Pacific Islands regional GDP from past 20 years and potential future GDP growth.
Right-tailed (gamma) distribution Mean value of 2.7% p.a. Min value: -1.0%
Max value: 4.0%
Economic Growth in Other Regions (World GDP)
Forecast GDP growth over the forecast period. Based on average of forecasts received from various banks and other sources.
Variance based on historical variance of World GDP from past 20 years and potential future GDP growth.
Right-tailed (gamma) distribution Mean value of 3.5% p.a. Min value: -1.7%
Max value: 4.7%
Terrorism Major terrorism event in Australasia affecting air traffic at the airport
Probability of event: 5% (once every 20 years)
Impact (percentage reduction in traffic) is Normally distributed with a mean value of -15% and variance where: 5
th percentile is -10%
95th
percentile is -20% Recovery time (time taken to recover
all the traffic lost as a result of the terrorism event): 2 years
Pandemic SARS-type outbreak with direct impact on the airport (e.g., outbreak in Australasia) which reduces traffic by 25% for 6 months (effectively 12.5% in the year of occurrence).
Estimated impact of the event based on analysis of the impact of SARS on Toronto (YYZ) and expert judgement)
Probability of event: 5% (once every 20 years)
Impact (percentage reduction in traffic) is Normally distributed with a mean value of -12.5% and variance where: 5
th percentile is -10%
95th
percentile is -15% Recovery time: traffic recovered within
one year
Fuel Price Spike An abrupt spike in the price of crude oil and jet fuel. The increase in fuel prices increases airline operating costs and reducing capacity and/or rising fares reducing the demand for travel. The risk factor also captures ‘knock on’ effects such as a reduction in discretionary spending due to rising energy costs.
Probability of event: 5% (once every 20 years)
Impact (percentage reduction in traffic) is Normally distributed with a mean value of -5% and variance where: 5
th percentile is -2.0%
95th
percentile is –5.0% Recovery time: traffic recovered within
one year
Fuel Price Dip An abrupt dip in the price of crude oil and jet fuel. The decrease in fuel prices decreases airline operating costs and increases capacity and/or lowering fares increasing the demand for travel. The risk factor also captures ‘knock on’ effects such as an effective increase in discretionary spending due to lowered energy costs.
Probability of event: 5% (once every 20 years)
Impact (percentage increase in traffic) is Normally distributed with a mean value of +5% and variance where: 5
th percentile is +2.0%
95th
percentile is +5.0% Recovery time: traffic returns to
normal within one year.
Wellington International Airport Air Traffic Forecasts – DRAFT of 20 October 2015 31
4.3 Aircraft Movement Forecast Methodology
Passenger carrier aircraft movements are generally a function of passenger traffic demand and air
service development, shaped by carriers’ networks and average aircraft size. Forecasts of future
aircraft operations are derived forecasts, taking into consideration passenger traffic demand, potential
service improvements/expansion, changes to airline fleets, and load factors.
Forecasts of annual aircraft movements were based on forecast passenger traffic demand. Passenger
aircraft movements depend on the average aircraft size and average load factor (i.e., average
passengers per flights), as represented by the formula below:
Aircraft Movements =E/D Passenger Forecasts
Average Aircraft Size ⋅ Average Load Factor
Where: Average Aircraft Size ⋅Average Load Factor = Average Passengers per Aircraft Movement
To provide an additional level of detail to aircraft movement forecasts, InterVISTAS developed a
bottom-up approach to produce aircraft movement forecasts by aircraft type. Projections of average
load factor by forecast region (e.g. domestic trunk, domestic regional, Australia, etc.) were applied to
a projected mix of aircraft types operating at WLG in the future on an annual basis. The projections of
average load factor and forecast sector aircraft mix average aircraft size determined the number of
annual movements required to serve the E/D passenger demand. Forecast movements by aircraft
type were then established using the projected mix of aircraft and the forecast sector’s total annual
required movements.
Projections of load factors, type aircraft in operation, mix of operating aircraft, and average aircraft
size reflect:
Current airline and fleet mix;
Market development and new air services;
Carrier fleet replacement plans and improved aircraft utilization.
Details of the assumptions underlying the forecasts regarding projected aircraft mix and load factors
are provided with the resulting forecasts in Chapter 6.
4.4 Additional Services for Runway Extension Scenarios
To develop the Part B runway extension scenario, InterVISTAS modified the constrained Part A
forecast by introducing new long-haul services. These services, only available under the scenarios in
which WLG constructs an extended runway, affect O/D and E/D passenger forecasts as well as
aircraft movement forecasts.
The selection of potential long-haul services added in the runway extension scenario forecasts was
derived from InterVISTAS’ previous analysis contained in the report Viability Assessment of Long-
Haul Service at Wellington Airport submitted in December 2014. In this report, InterVISTAS assessed
the potential demand from the airline’s perspective for new long-haul services should WLG’s runway
be extended to allow for long-haul widebody operations. This analysis demonstrated the viability of
long haul services given underlying demand conditions.
Given the operational limitations imposed by WLG’s current runway length, long-haul widebody
services are not available. Thus passengers wishing to travel beyond New Zealand and eastern
Wellington International Airport Air Traffic Forecasts – DRAFT of 20 October 2015 32
Australia must connect through an airport in either New Zealand (AKL or CHC) or Australia (e.g., SYD
or MEL) which features long-haul or overseas service. Under the runway extension scenarios, new
direct services to WLG will emerge. A portion of the traffic on that new service will be passengers
which previously flowed over a connecting airport in New Zealand or Australia to reach their
destination. The development of new long-haul services will then remove some E/D traffic from the
domestic and Australia sectors as some of those passengers will transfer to the direct international
service. However, not all passengers on a new service will come from existing E/D passengers. The
introduction of a new route generates new demand, an effect called market stimulation.
The addition of new long-haul services will also stimulate the O/D passenger demand to and from
WLG. This market stimulation arising from new services is widely accepted in the airline industry
based on the analysis of new route launches in various markets and the impact these have had on
traffic levels. When a new service is added it provides more convenient options for travellers which, in
turn, can stimulate additional demand. Specifically, new services provide direct services with
significantly shorter journey times without the inconvenience and the missed connection risk (or
missed baggage risk) of connecting options. Even passengers making onward travel beyond the new
destination will find the service more convenient as it reduces the number of connections (e.g.,
passengers will be able to travel Wellington-Singapore-London rather than Wellington-Auckland-
Singapore-London). In summary, the new services can provide additional travel options, greater
competition and increased market visibility, which in turn results in demand from O/D passengers that
would not have travelled before deciding to do so due to the improvement in air access.
Stimulation occurs both in the local market but also in connecting markets where travel times and/or
airfares are improved. The forecast accounts for this beyond market stimulation by allocating a portion
of the stimulated O/D demand to the local market and to other markets in which connections can be
made. The distribution of stimulated O/D demand is based on the analysis conducted as part of the
Viability Assessment of Long-Haul Service at Wellington Airport report.
Additionally, new services by foreign carriers generally result in a higher level of inbound stimulation
from new visitors, as foreign carriers usually have stronger market presence in their home country. In
this forecast we have adopted the findings of previous analyses for the distribution of stimulated
international traffic between inbound (i.e. international visitors) and outbound O/D traffic.
Finally, the introduction of new long-haul international service at WLG will also stimulate connecting
domestic passengers at WLG (behind market stimulation). Travellers originating or destined to
secondary airports in New Zealand without international air access may be induced to connect via
WLG to new international routes, instead of connecting through AKL or CHC. The quantification of the
domestic connecting stimulation is also derived from InterVISTAS’ long-haul viability assessment
report.
For each new service added, the following metrics were used as inputs to determine the impact on
O/D and E/D traffic, as well as on aircraft movements:
Forecast region for new service (e.g., China, Other Asia, USA, etc.).
Aircraft type and number of seats.
Average weekly frequency.
Load factors.
International O/D stimulation factor.
Wellington International Airport Air Traffic Forecasts – DRAFT of 20 October 2015 33
Domestic connecting stimulation factor.
Attraction of existing E/D travellers on the potential new service previously connecting via domestic
and Australian airports.
The aircraft seat count, average weekly frequency, and load factor determine the total number of
annual E/D passengers to be added each year for each service. Over time, frequencies and load
factors were gradually increased to reflect additional capacity on that service. Increases to average
weekly frequencies may also be used to represent an additional airline or new destination within a
forecast region coming online. For example, a new service is added operated by a foreign carrier
beginning service between Singapore and Wellington, allocated to the Other Asia region.
Market stimulation percentages are then employed. For example, if a new service were forecast to
handle 100,000 passenger per annum (based on aircraft size, frequency and load factor), then a
specified percentage (say, 40%) of passengers would be newly stimulated travellers, and the rest
(60%) would be diverted from existing E/D travellers flowing over international gateways in New
Zealand and Australia. The allocation of diverted existing E/D passengers is based on an analysis of
FY2015 O/D travel itineraries.39
For example, in FY 2015, 78% of travellers to/from Other Asia
connected via a domestic E/D segment (e.g., over AKL) while 22% connected via an Australia E/D
segment (e.g. over SYD or MEL). In the case of Singapore service, these diverted passengers are
removed from the relevant domestic or Australia E/D traffic and reallocated to Other Asia.
The stimulation of new O/D passengers was then allocated to international markets based on
InterVISTAS’ long-haul route viability analysis, allocating stimulated O/D passengers both to the local
market (Singapore in the SIN-WLG example) as well as potential connecting markets such as the UK
and China. The amount of stimulation depends on traffic conditions and the other travel options
available to travellers. For example, the first direct service to Asia will have a higher level of
stimulation as this the first direct service made available to this market. Later services to additional
destinations in Asia were modelled to have a smaller stimulation factor, since there is already direct
capacity serving this market. The reduction in market stimulation factors is also representative of
overlapping connecting service to beyond/behind markets, which will be stimulated less when an
existing long-haul service is already in place providing direct or connecting service to a given market.
Finally, the domestic connecting stimulation percentage is employed to add additional stimulated
connecting passengers. Based on InterVISTAS’ long-haul viability assessment, this effect is quite
small – typically less than 5% of the total E/D traffic of a new route. This metric then captures the
stimulated increase in domestic connecting traffic as WLG becomes a more desirable location for
travellers to connect through when travelling international to/from regional locations in New Zealand.
Details of the new long-haul services introduced in the runway extension forecast can be found in
Section 5.2.1.
39 Diio FMg, Origin Destination travel itineraries from New Zealand to the world.
Wellington International Airport Air Traffic Forecasts – DRAFT of 20 October 2015 34
4.5 Comment on Very Long Term Traffic Forecasts
Forecasts are required for a relatively long period – up to 2060 (45 years). The forecasts up to 2045
are based on a fully developed model using a combination of econometric analysis and Monte Carlo
simulation. As reliable forecasts of economic growth and air market trends are not available beyond
2045, a basic extrapolation approach was used for the forecast period after 2045. The approach
assumed that air traffic growth rates beyond 2045 would gradually attenuate from pre-2045 levels due
to market maturity.
While every effort was made to produce accurate and robust forecasts, forecasts beyond 30 years in
the future should be treated with caution. Beyond 30 years, it is much more difficult to capture effects
of long term changes in:
Consumer attitudes (e.g., climate change concerns impacting behaviour);
General rate of economic growth (i.e., no meaningful economic forecasts past 2040);
Changes in population birth rates (in a 10-20 year period, population forecasts are reasonably
accurate. Beyond 20 years, the effects of potential changes in attitudes toward birth rates,
immigration, etc. begin to affect the population level); and
Aircraft technology and fleet acquisition.
In particular, the forecasts of aircraft movements by specific aircraft type must be considered as
general guidelines. While we have good information that the type of aircraft operating in 20 years will
be similar to those operating today, the type of aircraft operating 30, 40, and 45 years in the future
remain more uncertain. It is highly unlikely that an Airbus A320 in service today will be operating in
FY2060, but more likely that an aircraft of a similar size will be in operation. Thus aircraft specific
movement forecasts beyond FY2035 should be interpreted as indicative of the general size of aircraft
expecting to be operating, not necessarily that exact aircraft model.
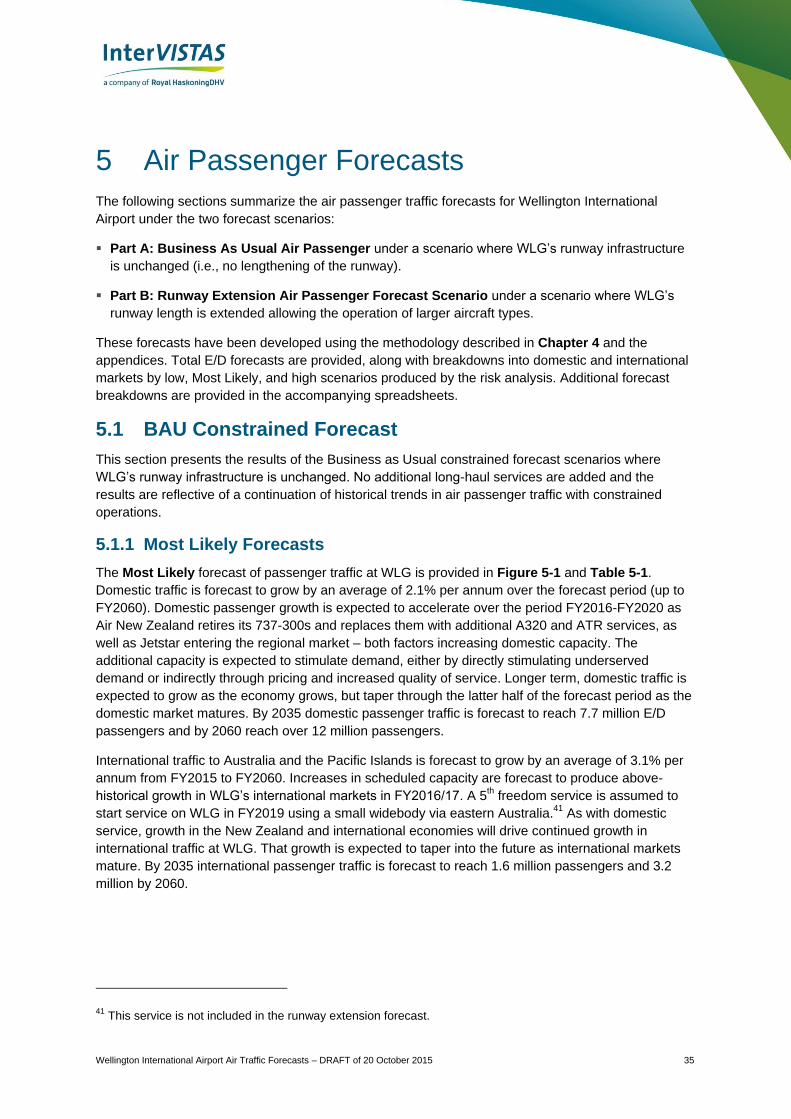
Wellington International Airport Air Traffic Forecasts – DRAFT of 20 October 2015 35
5 Air Passenger Forecasts
The following sections summarize the air passenger traffic forecasts for Wellington International
Airport under the two forecast scenarios:
Part A: Business As Usual Air Passenger under a scenario where WLG’s runway infrastructure
is unchanged (i.e., no lengthening of the runway).
Part B: Runway Extension Air Passenger Forecast Scenario under a scenario where WLG’s
runway length is extended allowing the operation of larger aircraft types.
These forecasts have been developed using the methodology described in Chapter 4 and the
appendices. Total E/D forecasts are provided, along with breakdowns into domestic and international
markets by low, Most Likely, and high scenarios produced by the risk analysis. Additional forecast
breakdowns are provided in the accompanying spreadsheets.
5.1 BAU Constrained Forecast
This section presents the results of the Business as Usual constrained forecast scenarios where
WLG’s runway infrastructure is unchanged. No additional long-haul services are added and the
results are reflective of a continuation of historical trends in air passenger traffic with constrained
operations.
5.1.1 Most Likely Forecasts
The Most Likely forecast of passenger traffic at WLG is provided in Figure 5-1 and Table 5-1.
Domestic traffic is forecast to grow by an average of 2.1% per annum over the forecast period (up to
FY2060). Domestic passenger growth is expected to accelerate over the period FY2016-FY2020 as
Air New Zealand retires its 737-300s and replaces them with additional A320 and ATR services, as
well as Jetstar entering the regional market – both factors increasing domestic capacity. The
additional capacity is expected to stimulate demand, either by directly stimulating underserved
demand or indirectly through pricing and increased quality of service. Longer term, domestic traffic is
expected to grow as the economy grows, but taper through the latter half of the forecast period as the
domestic market matures. By 2035 domestic passenger traffic is forecast to reach 7.7 million E/D
passengers and by 2060 reach over 12 million passengers.
International traffic to Australia and the Pacific Islands is forecast to grow by an average of 3.1% per
annum from FY2015 to FY2060. Increases in scheduled capacity are forecast to produce above-
historical growth in WLG’s international markets in FY2016/17. A 5th freedom service is assumed to
start service on WLG in FY2019 using a small widebody via eastern Australia.41
As with domestic
service, growth in the New Zealand and international economies will drive continued growth in
international traffic at WLG. That growth is expected to taper into the future as international markets
mature. By 2035 international passenger traffic is forecast to reach 1.6 million passengers and 3.2
million by 2060.
41 This service is not included in the runway extension forecast.
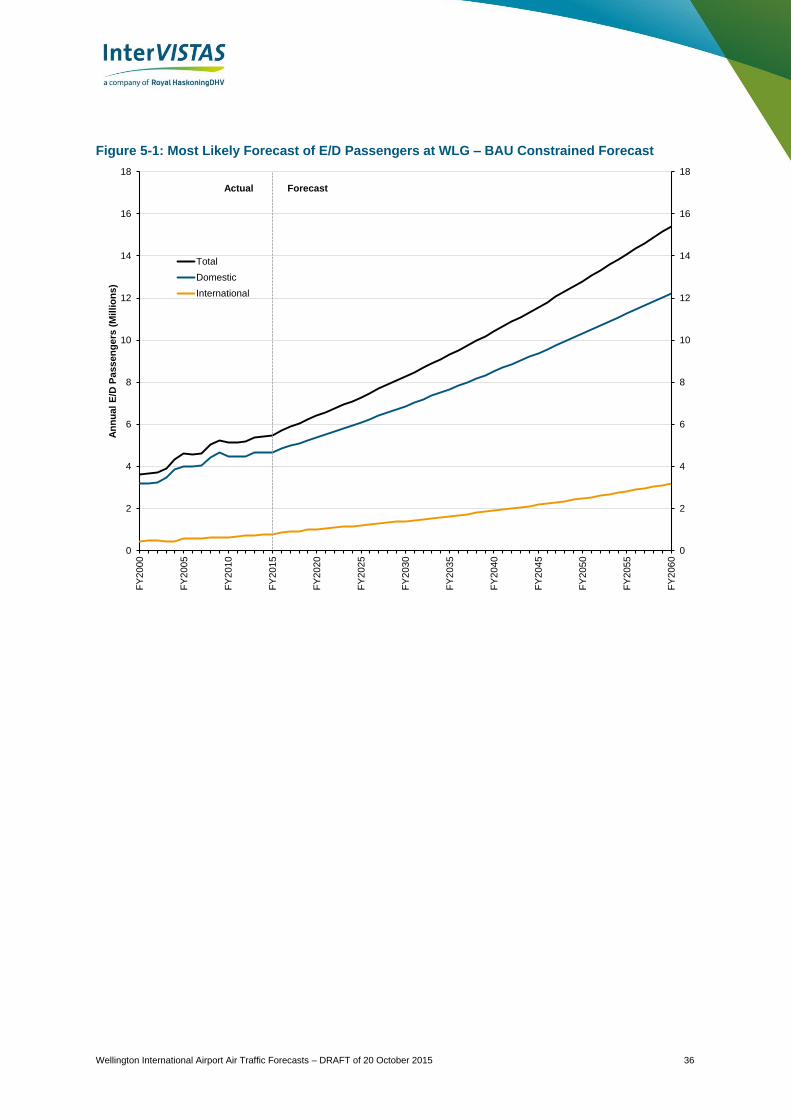
Wellington International Airport Air Traffic Forecasts – DRAFT of 20 October 2015 36
Figure 5-1: Most Likely Forecast of E/D Passengers at WLG – BAU Constrained Forecast
0
2
4
6
8
10
12
14
16
18
0
2
4
6
8
10
12
14
16
18
FY
200
0
FY
200
5
FY
201
0
FY
201
5
FY
202
0
FY
202
5
FY
203
0
FY
203
5
FY
204
0
FY
204
5
FY
205
0
FY
205
5
FY
206
0
An
nu
al
E/D
Pa
ss
en
ge
rs (
Mil
lio
ns
)
Total
Domestic
International
Actual Forecast

Wellington International Airport Air Traffic Forecasts – DRAFT of 20 October 2015 37
Table 5-1: Most Likely Forecast of E/D Passengers at WLG (Thousands) – BAU Constrained Forecast
Year
Domestic International
To
tal
Pa
ss
en
ge
rs
Trunk Regional Total Australia China Japan Other Asia
UK USA Pacific Other Total
FY2015 (Actual)
3,248 1,435 4,682 768 0 0 0 0 0 7 0 775 5,457
FY2016 4,834 3,329 1,506 849 0 0 0 0 0 22 0 870 5,705
FY2017 4,979 3,412 1,568 875 0 0 0 0 0 22 0 896 5,875
FY2018 5,105 3,498 1,607 902 0 0 0 0 0 22 0 924 6,029
FY2019 5,240 3,594 1,646 964 0 0 0 0 0 23 0 986 6,226
FY2020 5,382 3,695 1,687 994 0 0 0 0 0 24 0 1,017 6,399
FY2025 6,089 4,202 1,887 1,168 0 0 0 0 0 28 0 1,196 7,285
FY2030 6,400 4,426 1,974 1,251 0 0 0 0 0 30 0 1,281 7,681
FY2035 7,673 5,348 2,324 1,599 0 0 0 0 0 39 0 1,638 9,311
FY2040 8,006 5,593 2,413 1,698 0 0 0 0 0 42 0 1,739 9,745
FY2045 9,390 6,612 2,778 2,117 0 0 0 0 0 53 0 2,169 11,559
FY2050 10,322 7,304 3,018 2,415 0 0 0 0 0 61 0 2,476 12,797
FY2055 11,272 8,016 3,256 2,743 0 0 0 0 0 70 0 2,812 14,084
FY2060 12,226 8,737 3,489 3,102 0 0 0 0 0 79 0 3,181 15,407
Long-Term Growth Rates
FY2015-20 2.6% 3.3% 2.8% 5.3% N/A N/A N/A N/A N/A 28.4% N/A 5.6% 3.2%
FY2015-25 2.6% 2.8% 2.7% 4.3% N/A N/A N/A N/A N/A 15.3% N/A 4.4% 2.9%
FY2015-35 2.5% 2.4% 2.5% 3.7% N/A N/A N/A N/A N/A 9.2% N/A 3.8% 2.7%
FY2015-45 2.4% 2.2% 2.3% 3.4% N/A N/A N/A N/A N/A 7.1% N/A 3.5% 2.5%
FY2015-60 2.2% 2.0% 2.2% 3,1% N/A N/A N/A N/A N/A 5.6% N/A 3.2% 2.3%
Note: The split of forecast international passengers is based on immediate origin/destination (or E/D segment) rather than final origin/destination. For example, UK passengers are allocated to
domestic and Australia based on their connecting point into WLG.
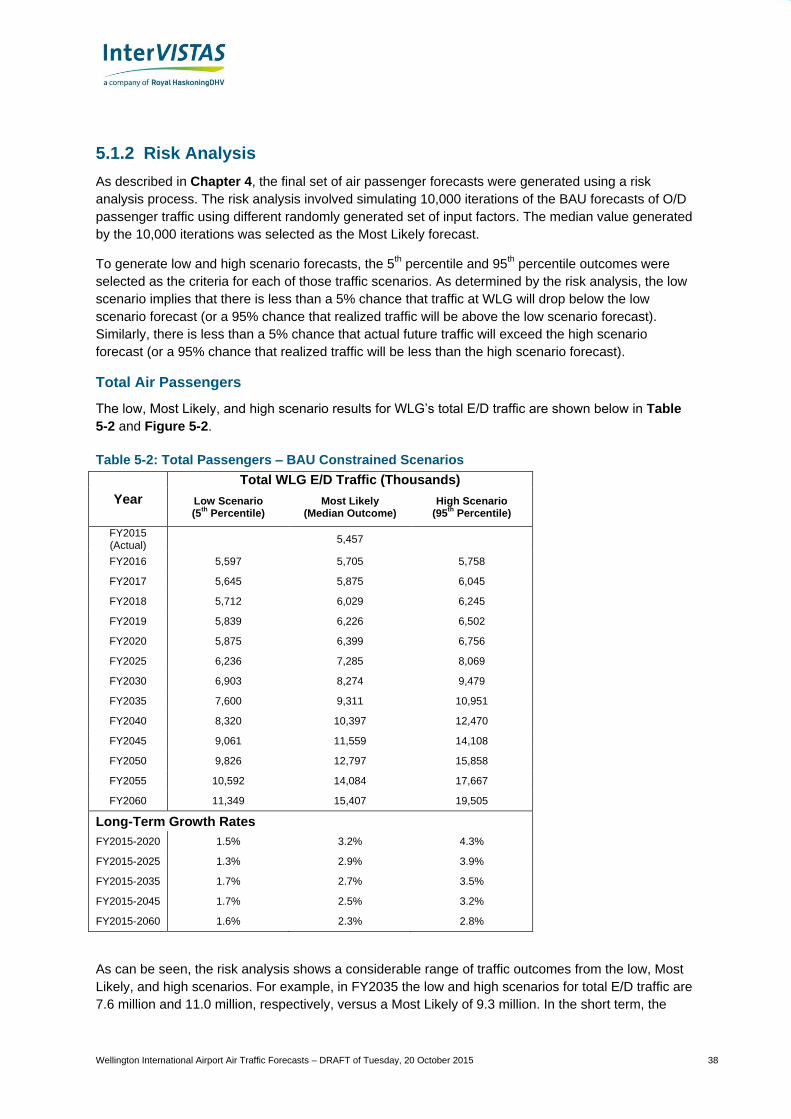
Wellington International Airport Air Traffic Forecasts – DRAFT of Tuesday, 20 October 2015 38
5.1.2 Risk Analysis
As described in Chapter 4, the final set of air passenger forecasts were generated using a risk
analysis process. The risk analysis involved simulating 10,000 iterations of the BAU forecasts of O/D
passenger traffic using different randomly generated set of input factors. The median value generated
by the 10,000 iterations was selected as the Most Likely forecast.
To generate low and high scenario forecasts, the 5th percentile and 95
th percentile outcomes were
selected as the criteria for each of those traffic scenarios. As determined by the risk analysis, the low
scenario implies that there is less than a 5% chance that traffic at WLG will drop below the low
scenario forecast (or a 95% chance that realized traffic will be above the low scenario forecast).
Similarly, there is less than a 5% chance that actual future traffic will exceed the high scenario
forecast (or a 95% chance that realized traffic will be less than the high scenario forecast).
Total Air Passengers
The low, Most Likely, and high scenario results for WLG’s total E/D traffic are shown below in Table
5-2 and Figure 5-2.
Table 5-2: Total Passengers – BAU Constrained Scenarios
Year
Total WLG E/D Traffic (Thousands)
Low Scenario (5
th Percentile)
Most Likely (Median Outcome)
High Scenario (95
th Percentile)
FY2015 (Actual)
5,457
FY2016 5,597 5,705 5,758
FY2017 5,645 5,875 6,045
FY2018 5,712 6,029 6,245
FY2019 5,839 6,226 6,502
FY2020 5,875 6,399 6,756
FY2025 6,236 7,285 8,069
FY2030 6,903 8,274 9,479
FY2035 7,600 9,311 10,951
FY2040 8,320 10,397 12,470
FY2045 9,061 11,559 14,108
FY2050 9,826 12,797 15,858
FY2055 10,592 14,084 17,667
FY2060 11,349 15,407 19,505
Long-Term Growth Rates
FY2015-2020 1.5% 3.2% 4.3%
FY2015-2025 1.3% 2.9% 3.9%
FY2015-2035 1.7% 2.7% 3.5%
FY2015-2045 1.7% 2.5% 3.2%
FY2015-2060 1.6% 2.3% 2.8%
As can be seen, the risk analysis shows a considerable range of traffic outcomes from the low, Most
Likely, and high scenarios. For example, in FY2035 the low and high scenarios for total E/D traffic are
7.6 million and 11.0 million, respectively, versus a Most Likely of 9.3 million. In the short term, the
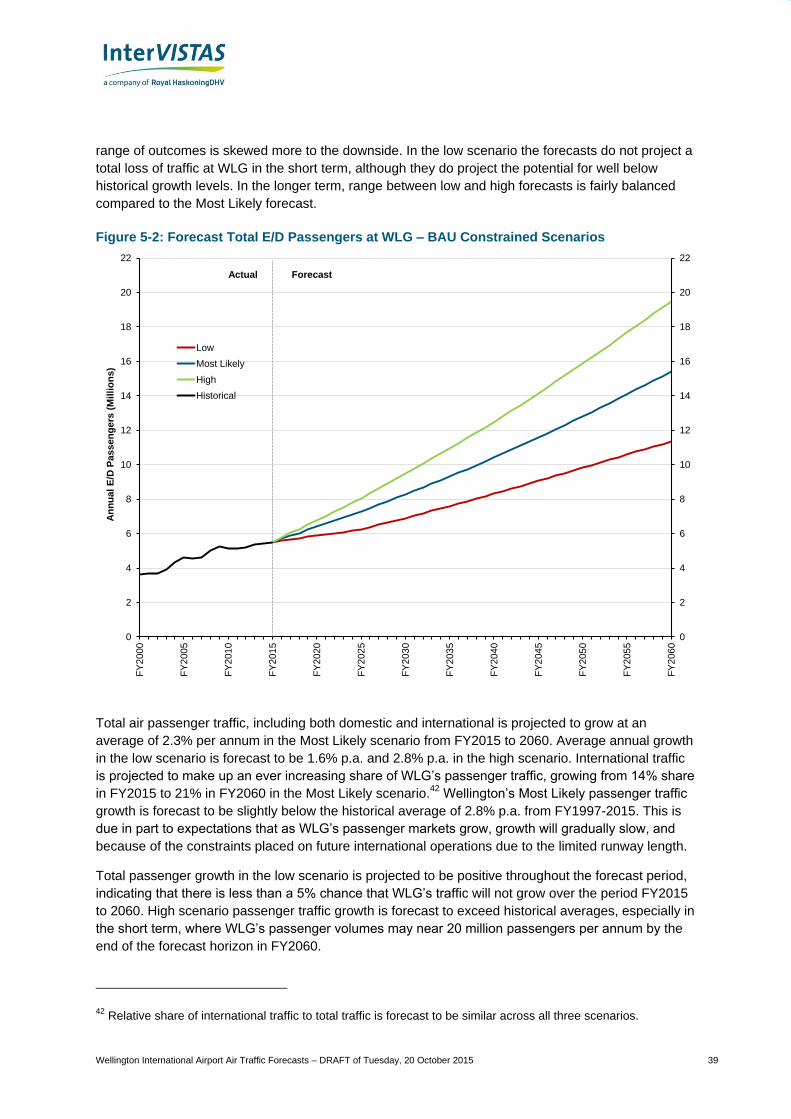
Wellington International Airport Air Traffic Forecasts – DRAFT of Tuesday, 20 October 2015 39
range of outcomes is skewed more to the downside. In the low scenario the forecasts do not project a
total loss of traffic at WLG in the short term, although they do project the potential for well below
historical growth levels. In the longer term, range between low and high forecasts is fairly balanced
compared to the Most Likely forecast.
Figure 5-2: Forecast Total E/D Passengers at WLG – BAU Constrained Scenarios
Total air passenger traffic, including both domestic and international is projected to grow at an
average of 2.3% per annum in the Most Likely scenario from FY2015 to 2060. Average annual growth
in the low scenario is forecast to be 1.6% p.a. and 2.8% p.a. in the high scenario. International traffic
is projected to make up an ever increasing share of WLG’s passenger traffic, growing from 14% share
in FY2015 to 21% in FY2060 in the Most Likely scenario.42
Wellington’s Most Likely passenger traffic
growth is forecast to be slightly below the historical average of 2.8% p.a. from FY1997-2015. This is
due in part to expectations that as WLG’s passenger markets grow, growth will gradually slow, and
because of the constraints placed on future international operations due to the limited runway length.
Total passenger growth in the low scenario is projected to be positive throughout the forecast period,
indicating that there is less than a 5% chance that WLG’s traffic will not grow over the period FY2015
to 2060. High scenario passenger traffic growth is forecast to exceed historical averages, especially in
the short term, where WLG’s passenger volumes may near 20 million passengers per annum by the
end of the forecast horizon in FY2060.
42 Relative share of international traffic to total traffic is forecast to be similar across all three scenarios.
0
2
4
6
8
10
12
14
16
18
20
22
0
2
4
6
8
10
12
14
16
18
20
22
FY
200
0
FY
200
5
FY
201
0
FY
201
5
FY
202
0
FY
202
5
FY
203
0
FY
203
5
FY
204
0
FY
204
5
FY
205
0
FY
205
5
FY
206
0
An
nu
al
E/D
Pa
ss
en
ge
rs (
Mil
lio
ns
)
Low
Most Likely
High
Historical
Actual Forecast
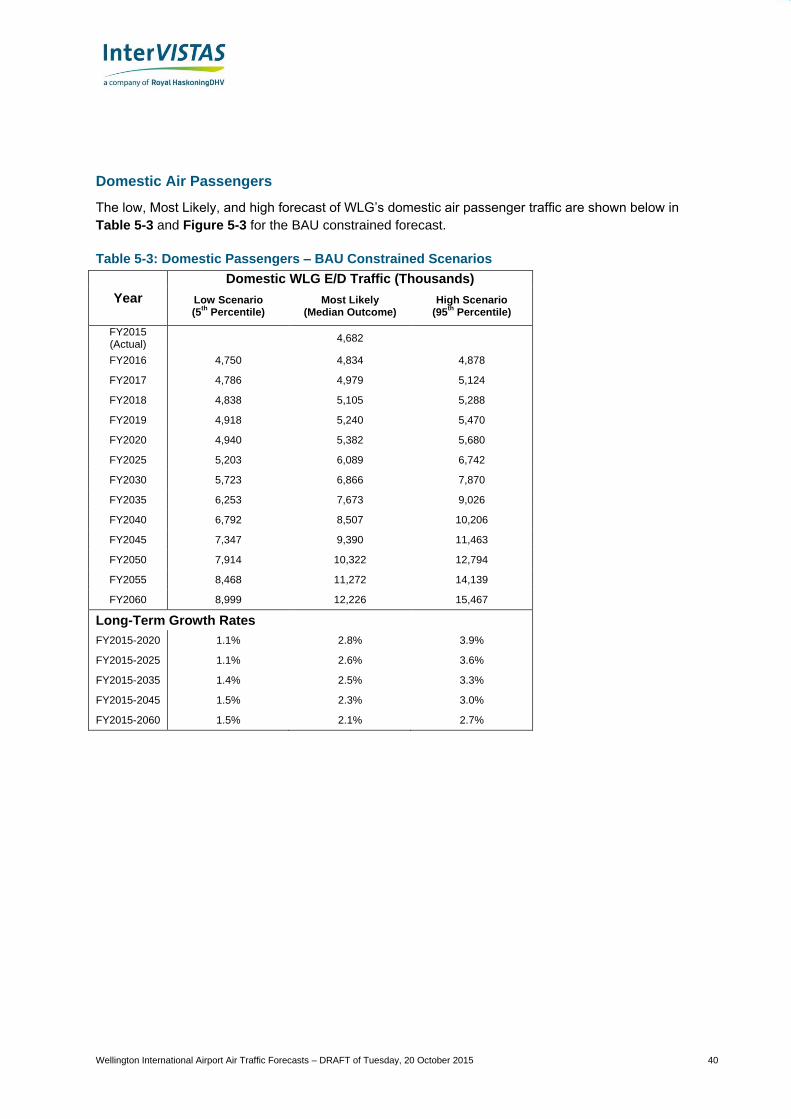
Wellington International Airport Air Traffic Forecasts – DRAFT of Tuesday, 20 October 2015 40
Domestic Air Passengers
The low, Most Likely, and high forecast of WLG’s domestic air passenger traffic are shown below in
Table 5-3 and Figure 5-3 for the BAU constrained forecast.
Table 5-3: Domestic Passengers – BAU Constrained Scenarios
Year
Domestic WLG E/D Traffic (Thousands)
Low Scenario (5
th Percentile)
Most Likely (Median Outcome)
High Scenario (95
th Percentile)
FY2015 (Actual)
4,682
FY2016 4,750 4,834 4,878
FY2017 4,786 4,979 5,124
FY2018 4,838 5,105 5,288
FY2019 4,918 5,240 5,470
FY2020 4,940 5,382 5,680
FY2025 5,203 6,089 6,742
FY2030 5,723 6,866 7,870
FY2035 6,253 7,673 9,026
FY2040 6,792 8,507 10,206
FY2045 7,347 9,390 11,463
FY2050 7,914 10,322 12,794
FY2055 8,468 11,272 14,139
FY2060 8,999 12,226 15,467
Long-Term Growth Rates
FY2015-2020 1.1% 2.8% 3.9%
FY2015-2025 1.1% 2.6% 3.6%
FY2015-2035 1.4% 2.5% 3.3%
FY2015-2045 1.5% 2.3% 3.0%
FY2015-2060 1.5% 2.1% 2.7%
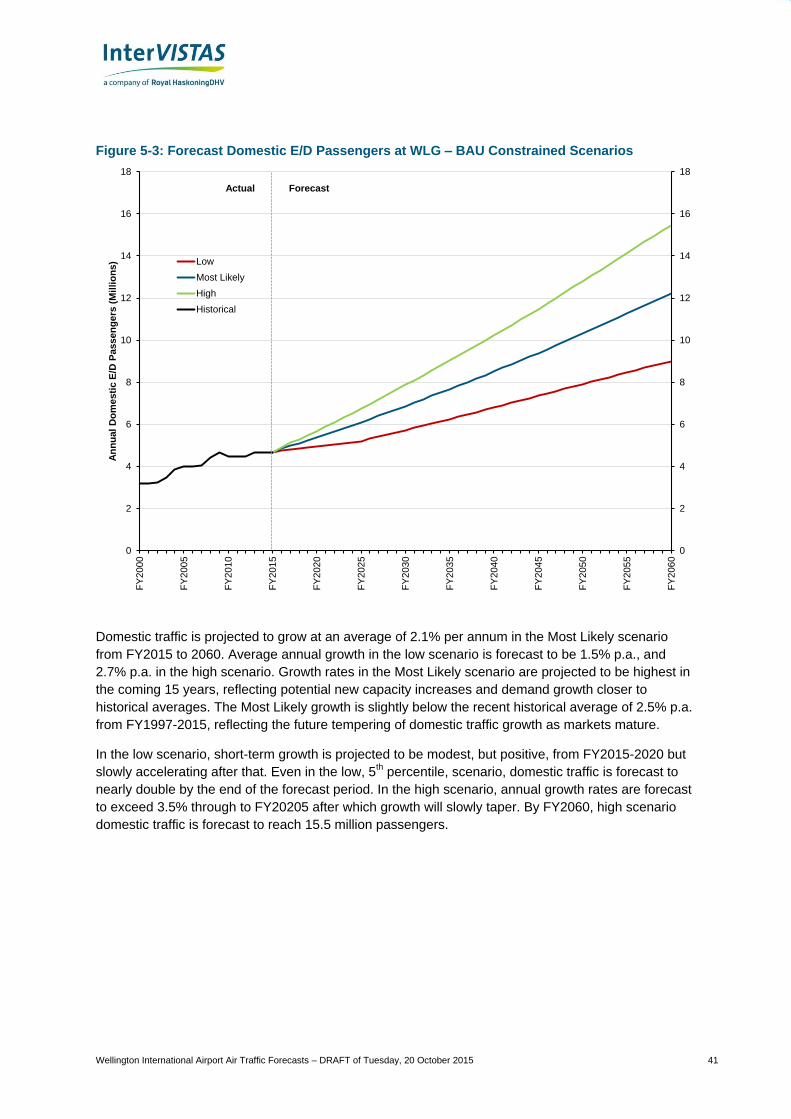
Wellington International Airport Air Traffic Forecasts – DRAFT of Tuesday, 20 October 2015 41
Figure 5-3: Forecast Domestic E/D Passengers at WLG – BAU Constrained Scenarios
Domestic traffic is projected to grow at an average of 2.1% per annum in the Most Likely scenario
from FY2015 to 2060. Average annual growth in the low scenario is forecast to be 1.5% p.a., and
2.7% p.a. in the high scenario. Growth rates in the Most Likely scenario are projected to be highest in
the coming 15 years, reflecting potential new capacity increases and demand growth closer to
historical averages. The Most Likely growth is slightly below the recent historical average of 2.5% p.a.
from FY1997-2015, reflecting the future tempering of domestic traffic growth as markets mature.
In the low scenario, short-term growth is projected to be modest, but positive, from FY2015-2020 but
slowly accelerating after that. Even in the low, 5th percentile, scenario, domestic traffic is forecast to
nearly double by the end of the forecast period. In the high scenario, annual growth rates are forecast
to exceed 3.5% through to FY20205 after which growth will slowly taper. By FY2060, high scenario
domestic traffic is forecast to reach 15.5 million passengers.
0
2
4
6
8
10
12
14
16
18
0
2
4
6
8
10
12
14
16
18
FY
200
0
FY
200
5
FY
201
0
FY
201
5
FY
202
0
FY
202
5
FY
203
0
FY
203
5
FY
204
0
FY
204
5
FY
205
0
FY
205
5
FY
206
0
An
nu
al
Do
me
sti
c E
/D P
ass
en
ge
rs (
Mil
lio
ns
) Low
Most Likely
High
Historical
Actual Forecast
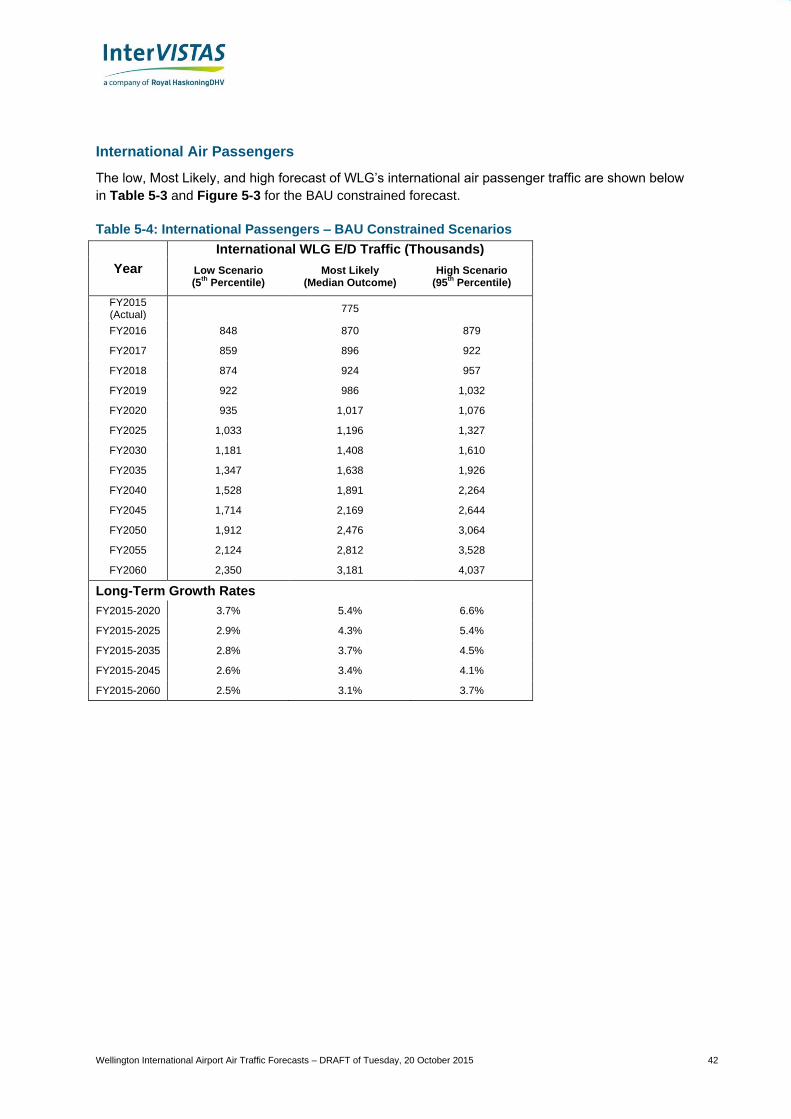
Wellington International Airport Air Traffic Forecasts – DRAFT of Tuesday, 20 October 2015 42
International Air Passengers
The low, Most Likely, and high forecast of WLG’s international air passenger traffic are shown below
in Table 5-3 and Figure 5-3 for the BAU constrained forecast.
Table 5-4: International Passengers – BAU Constrained Scenarios
Year
International WLG E/D Traffic (Thousands)
Low Scenario (5
th Percentile)
Most Likely (Median Outcome)
High Scenario (95
th Percentile)
FY2015 (Actual)
775
FY2016 848 870 879
FY2017 859 896 922
FY2018 874 924 957
FY2019 922 986 1,032
FY2020 935 1,017 1,076
FY2025 1,033 1,196 1,327
FY2030 1,181 1,408 1,610
FY2035 1,347 1,638 1,926
FY2040 1,528 1,891 2,264
FY2045 1,714 2,169 2,644
FY2050 1,912 2,476 3,064
FY2055 2,124 2,812 3,528
FY2060 2,350 3,181 4,037
Long-Term Growth Rates
FY2015-2020 3.7% 5.4% 6.6%
FY2015-2025 2.9% 4.3% 5.4%
FY2015-2035 2.8% 3.7% 4.5%
FY2015-2045 2.6% 3.4% 4.1%
FY2015-2060 2.5% 3.1% 3.7%
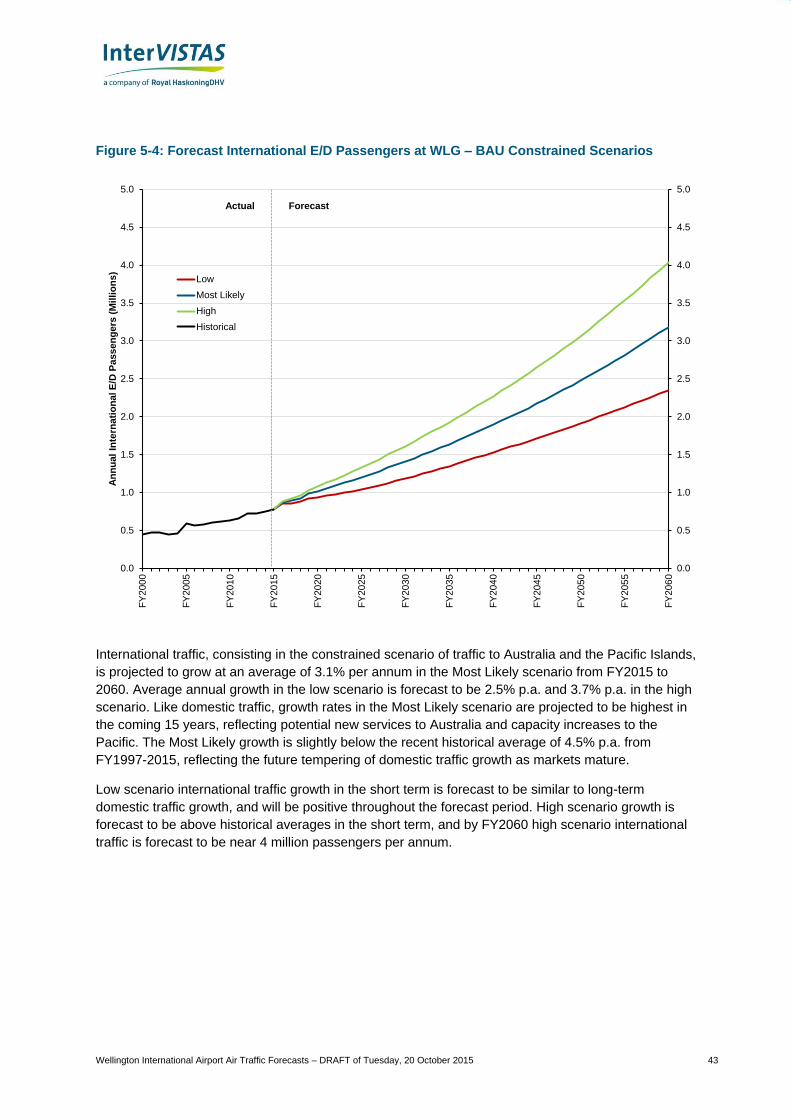
Wellington International Airport Air Traffic Forecasts – DRAFT of Tuesday, 20 October 2015 43
Figure 5-4: Forecast International E/D Passengers at WLG – BAU Constrained Scenarios
International traffic, consisting in the constrained scenario of traffic to Australia and the Pacific Islands,
is projected to grow at an average of 3.1% per annum in the Most Likely scenario from FY2015 to
2060. Average annual growth in the low scenario is forecast to be 2.5% p.a. and 3.7% p.a. in the high
scenario. Like domestic traffic, growth rates in the Most Likely scenario are projected to be highest in
the coming 15 years, reflecting potential new services to Australia and capacity increases to the
Pacific. The Most Likely growth is slightly below the recent historical average of 4.5% p.a. from
FY1997-2015, reflecting the future tempering of domestic traffic growth as markets mature.
Low scenario international traffic growth in the short term is forecast to be similar to long-term
domestic traffic growth, and will be positive throughout the forecast period. High scenario growth is
forecast to be above historical averages in the short term, and by FY2060 high scenario international
traffic is forecast to be near 4 million passengers per annum.
0.0
0.5
1.0
1.5
2.0
2.5
3.0
3.5
4.0
4.5
5.0
0.0
0.5
1.0
1.5
2.0
2.5
3.0
3.5
4.0
4.5
5.0
FY
200
0
FY
200
5
FY
201
0
FY
201
5
FY
202
0
FY
202
5
FY
203
0
FY
203
5
FY
204
0
FY
204
5
FY
205
0
FY
205
5
FY
206
0
An
nu
al
Inte
rna
tio
na
l E
/D P
ass
en
ge
rs (
Mil
lio
ns
)
Low
Most Likely
High
Historical
Actual Forecast
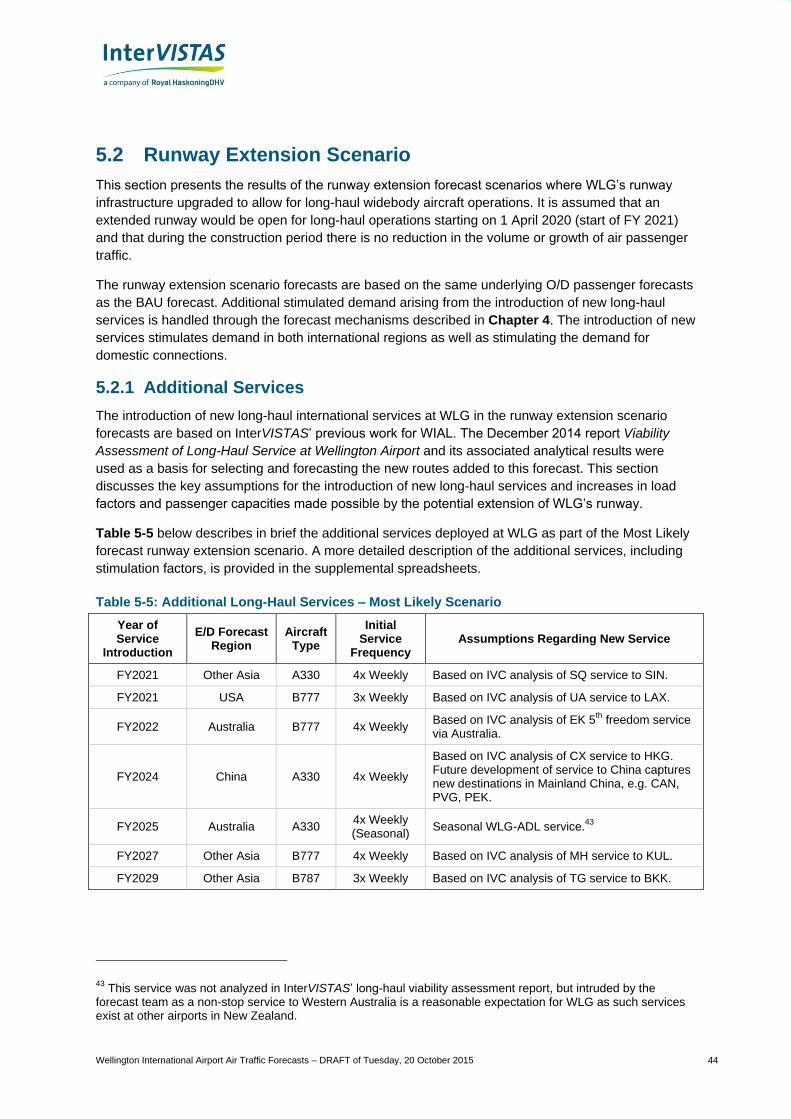
Wellington International Airport Air Traffic Forecasts – DRAFT of Tuesday, 20 October 2015 44
5.2 Runway Extension Scenario
This section presents the results of the runway extension forecast scenarios where WLG’s runway
infrastructure upgraded to allow for long-haul widebody aircraft operations. It is assumed that an
extended runway would be open for long-haul operations starting on 1 April 2020 (start of FY 2021)
and that during the construction period there is no reduction in the volume or growth of air passenger
traffic.
The runway extension scenario forecasts are based on the same underlying O/D passenger forecasts
as the BAU forecast. Additional stimulated demand arising from the introduction of new long-haul
services is handled through the forecast mechanisms described in Chapter 4. The introduction of new
services stimulates demand in both international regions as well as stimulating the demand for
domestic connections.
5.2.1 Additional Services
The introduction of new long-haul international services at WLG in the runway extension scenario
forecasts are based on InterVISTAS’ previous work for WIAL. The December 2014 report Viability
Assessment of Long-Haul Service at Wellington Airport and its associated analytical results were
used as a basis for selecting and forecasting the new routes added to this forecast. This section
discusses the key assumptions for the introduction of new long-haul services and increases in load
factors and passenger capacities made possible by the potential extension of WLG’s runway.
Table 5-5 below describes in brief the additional services deployed at WLG as part of the Most Likely
forecast runway extension scenario. A more detailed description of the additional services, including
stimulation factors, is provided in the supplemental spreadsheets.
Table 5-5: Additional Long-Haul Services – Most Likely Scenario
Year of Service
Introduction
E/D Forecast Region
Aircraft Type
Initial Service
Frequency Assumptions Regarding New Service
FY2021 Other Asia A330 4x Weekly Based on IVC analysis of SQ service to SIN.
FY2021 USA B777 3x Weekly Based on IVC analysis of UA service to LAX.
FY2022 Australia B777 4x Weekly Based on IVC analysis of EK 5
th freedom service
via Australia.
FY2024 China A330 4x Weekly
Based on IVC analysis of CX service to HKG. Future development of service to China captures new destinations in Mainland China, e.g. CAN, PVG, PEK.
FY2025 Australia A330 4x Weekly (Seasonal)
Seasonal WLG-ADL service.43
FY2027 Other Asia B777 4x Weekly Based on IVC analysis of MH service to KUL.
FY2029 Other Asia B787 3x Weekly Based on IVC analysis of TG service to BKK.
43 This service was not analyzed in InterVISTAS’ long-haul viability assessment report, but intruded by the
forecast team as a non-stop service to Western Australia is a reasonable expectation for WLG as such services exist at other airports in New Zealand.
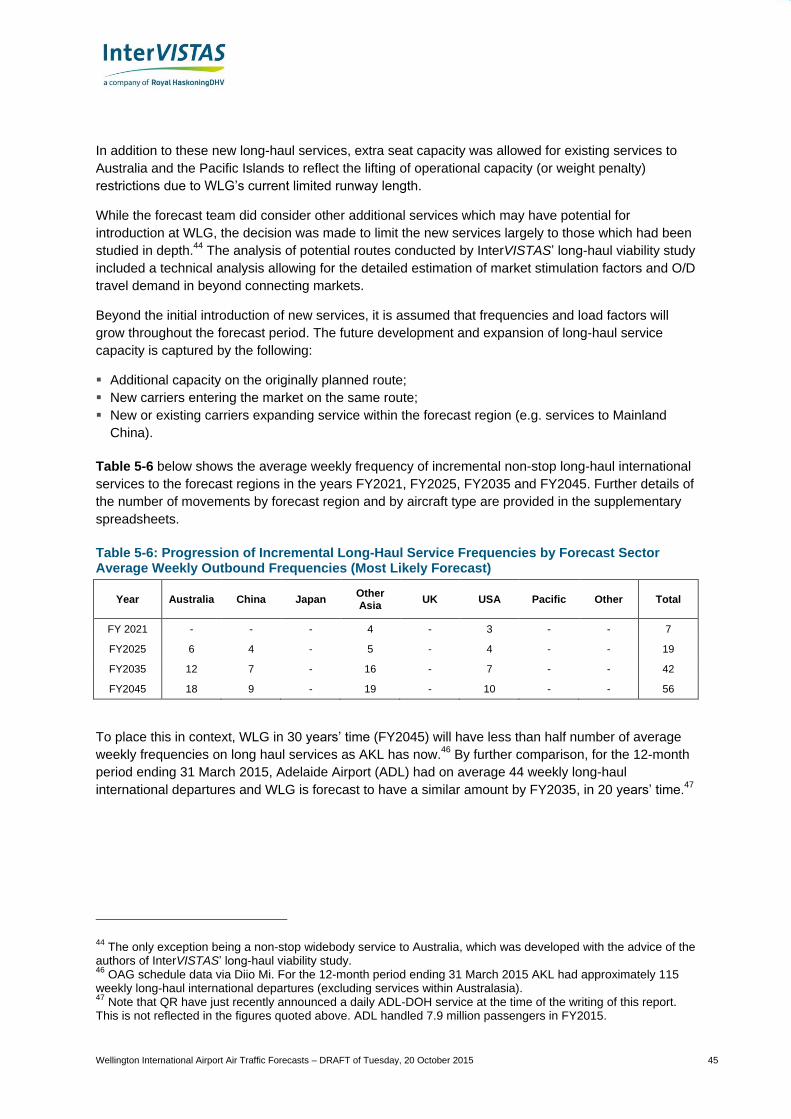
Wellington International Airport Air Traffic Forecasts – DRAFT of Tuesday, 20 October 2015 45
In addition to these new long-haul services, extra seat capacity was allowed for existing services to
Australia and the Pacific Islands to reflect the lifting of operational capacity (or weight penalty)
restrictions due to WLG’s current limited runway length.
While the forecast team did consider other additional services which may have potential for
introduction at WLG, the decision was made to limit the new services largely to those which had been
studied in depth.44
The analysis of potential routes conducted by InterVISTAS’ long-haul viability study
included a technical analysis allowing for the detailed estimation of market stimulation factors and O/D
travel demand in beyond connecting markets.
Beyond the initial introduction of new services, it is assumed that frequencies and load factors will
grow throughout the forecast period. The future development and expansion of long-haul service
capacity is captured by the following:
Additional capacity on the originally planned route;
New carriers entering the market on the same route;
New or existing carriers expanding service within the forecast region (e.g. services to Mainland
China).
Table 5-6 below shows the average weekly frequency of incremental non-stop long-haul international
services to the forecast regions in the years FY2021, FY2025, FY2035 and FY2045. Further details of
the number of movements by forecast region and by aircraft type are provided in the supplementary
spreadsheets.
Table 5-6: Progression of Incremental Long-Haul Service Frequencies by Forecast Sector Average Weekly Outbound Frequencies (Most Likely Forecast)
Year Australia China Japan Other Asia
UK USA Pacific Other Total
FY 2021 - - - 4 - 3 - - 7
FY2025 6 4 - 5 - 4 - - 19
FY2035 12 7 - 16 - 7 - - 42
FY2045 18 9 - 19 - 10 - - 56
To place this in context, WLG in 30 years’ time (FY2045) will have less than half number of average
weekly frequencies on long haul services as AKL has now.46
By further comparison, for the 12-month
period ending 31 March 2015, Adelaide Airport (ADL) had on average 44 weekly long-haul
international departures and WLG is forecast to have a similar amount by FY2035, in 20 years’ time.47
44 The only exception being a non-stop widebody service to Australia, which was developed with the advice of the
authors of InterVISTAS’ long-haul viability study. 46
OAG schedule data via Diio Mi. For the 12-month period ending 31 March 2015 AKL had approximately 115 weekly long-haul international departures (excluding services within Australasia). 47
Note that QR have just recently announced a daily ADL-DOH service at the time of the writing of this report. This is not reflected in the figures quoted above. ADL handled 7.9 million passengers in FY2015.
Wellington International Airport Air Traffic Forecasts – DRAFT of Tuesday, 20 October 2015 46
Additional Services in the Low and High Scenarios
To develop the low and high scenarios for the runway extension forecast, the same low and high
scenario O/D forecasts from the risk modelling were used. Furthermore, adjustments based on
InterVISTAS’ expert judgement were made to the new long-haul services. In general, the following
adjustments were made:
Timing of service introduction.
Removal of new services (low forecast only).
Initial service frequency and future increases to frequencies.
Initial load factors and future development of load factor increases.
Market stimulation levels.
To develop the low forecast, service introduction was delayed or entirely absent, featured lower load
factors, reduced frequencies, and diminished market stimulation. In contrast, new services in the high
scenario feature an accelerated build-up of service frequencies, higher load factors, earlier service
introduction dates, and enhanced market stimulation. In conjunction with the underlying high/low O/D
forecasts, these adjustments resulted in high and lower E/D forecast results, respectively.
5.2.2 Most Likely Forecast Results
The Most Likely forecast of passenger traffic at WLG is provided in Figure 5-5 and Table 5-7. In the
Most Likely runway extension scenario, WLG’s total air passenger traffic is forecast to grow at 2.4%
per annum and exceed 16 million passengers by FY2060. Domestic traffic is forecast to grow by an
average of 2.0% per annum over the forecast period (up to FY2060). The runway extension scenario
forecasts slightly lower growth for domestic traffic due to the introduction of new long-haul services at
WLG which do not require travellers to make domestic connections to AKL or CHC. However, this
loss of traffic from new services only affects domestic trunk traffic; regional traffic is left unchanged.
New long-haul services will stimulate demand for domestic connections at WLG, but this effect is
projected to be relatively minor.
With the runway extension assumed to be built, international traffic is forecast to make up a much
larger share of WLG’s total passenger traffic. From a share of 14% in FY2015 to 27% of total traffic in
FY2060, the addition of new long-haul services at WLG will significantly accelerate the growth of
international traffic. Beginning in FY2021 (when the runway construction is assumed to have been
completed),49
international traffic is projected to grow at an average of 8.5% per annum from FY2020-
2025 and then grow at rates exceeding 5% p.a. through to FY2030. As in the constrained BAU
forecast, international O/D demand growth is expected to taper as WLG’s international travel markets
mature. In the Most Likely forecast, international air passenger traffic at WLG is forecast to reach
approximately 4.3 million passengers in FY2060, adding an extra 1.2 million incremental international
E/D passengers compared to the constrained BAU Most Likely international forecast.
49 While the runway extension is assumed to be available for operations on 1 January 2015, additional long-haul
services do not begin until 1 April 2015 (the first day of FY2021) as that coincides with the start of the airline scheduling season.

Wellington International Airport Air Traffic Forecasts – DRAFT of Tuesday, 20 October 2015 47
To put this in context, the 3.1 million international passengers forecast by 2045 is approximately 36%
of international traffic Auckland airport (AKL) in 2015, and the 4.3 forecast by 2060 is half of AKL’s
current international traffic.50
Forecasts including the additional long-haul services project that Australia will remain WLG’s top
international destination by E/D passenger volumes, reflecting continued growth in demand for travel
across the Tasman Sea, as well as to utilize 5th freedom and connecting services via Australia. Other
Asia, the USA, and China are forecast to be the next three largest regions for international E/D
passengers by FY2060. Most Likely passenger volumes to the Pacific Islands are also forecast to
grow relative to the constrained BAU forecast, due primarily to the lifting of current payload restrictions
(i.e., available seat) as a result of the lengthened runway allowing unrestricted operations for
narrowbody and smaller widebody aircraft.
Figure 5-5: Most Likely Forecast of E/D Passengers at WLG – Runway Extension Forecast
50 Based on 12-month period ending March 31
st 2015.
Source: Auckland Airport, March 2015 Monthly Traffic Update.
0
2
4
6
8
10
12
14
16
18
0
2
4
6
8
10
12
14
16
18
FY
200
0
FY
200
5
FY
201
0
FY
201
5
FY
202
0
FY
202
5
FY
203
0
FY
203
5
FY
204
0
FY
204
5
FY
205
0
FY
205
5
FY
206
0
An
nu
al
E/D
Pa
ss
en
ge
rs (
Mil
lio
ns
)
Total
Domestic
International
Actual Forecast
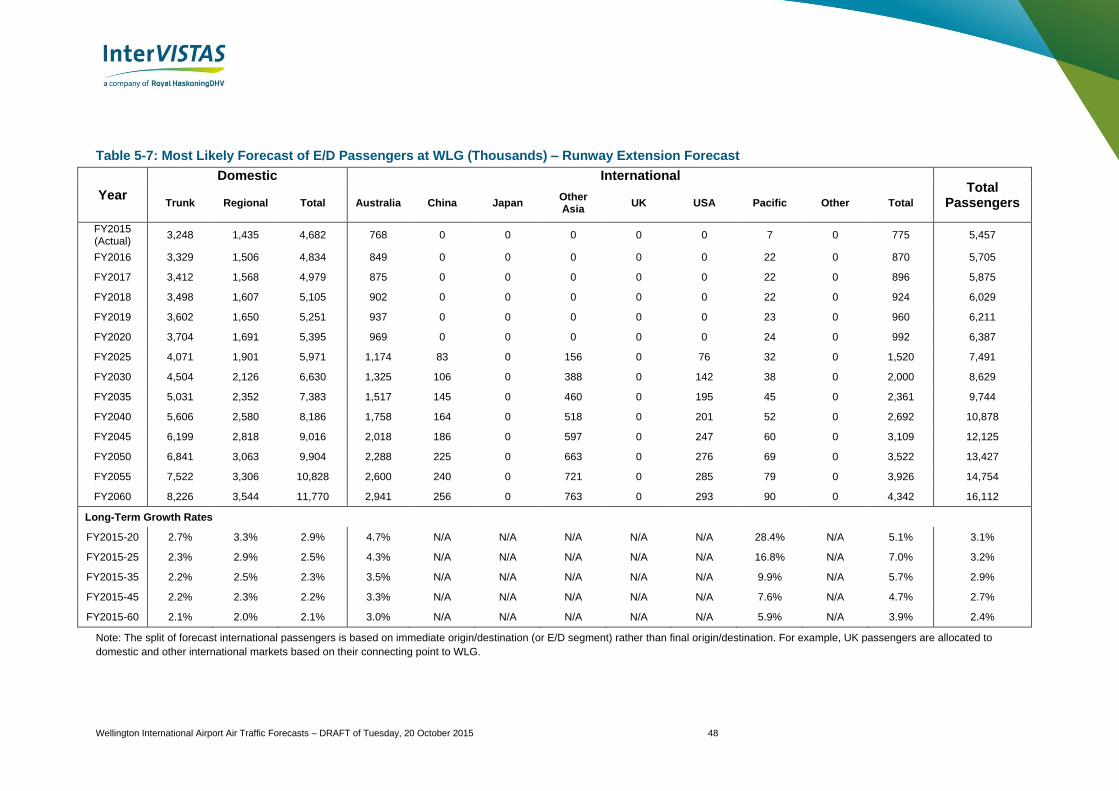
Wellington International Airport Air Traffic Forecasts – DRAFT of Tuesday, 20 October 2015 48
Table 5-7: Most Likely Forecast of E/D Passengers at WLG (Thousands) – Runway Extension Forecast
Year
Domestic International Total
Passengers Trunk Regional Total Australia China Japan Other Asia
UK USA Pacific Other Total
FY2015 (Actual)
3,248 1,435 4,682 768 0 0 0 0 0 7 0 775 5,457
FY2016 3,329 1,506 4,834 849 0 0 0 0 0 22 0 870 5,705
FY2017 3,412 1,568 4,979 875 0 0 0 0 0 22 0 896 5,875
FY2018 3,498 1,607 5,105 902 0 0 0 0 0 22 0 924 6,029
FY2019 3,602 1,650 5,251 937 0 0 0 0 0 23 0 960 6,211
FY2020 3,704 1,691 5,395 969 0 0 0 0 0 24 0 992 6,387
FY2025 4,071 1,901 5,971 1,174 83 0 156 0 76 32 0 1,520 7,491
FY2030 4,504 2,126 6,630 1,325 106 0 388 0 142 38 0 2,000 8,629
FY2035 5,031 2,352 7,383 1,517 145 0 460 0 195 45 0 2,361 9,744
FY2040 5,606 2,580 8,186 1,758 164 0 518 0 201 52 0 2,692 10,878
FY2045 6,199 2,818 9,016 2,018 186 0 597 0 247 60 0 3,109 12,125
FY2050 6,841 3,063 9,904 2,288 225 0 663 0 276 69 0 3,522 13,427
FY2055 7,522 3,306 10,828 2,600 240 0 721 0 285 79 0 3,926 14,754
FY2060 8,226 3,544 11,770 2,941 256 0 763 0 293 90 0 4,342 16,112
Long-Term Growth Rates
FY2015-20 2.7% 3.3% 2.9% 4.7% N/A N/A N/A N/A N/A 28.4% N/A 5.1% 3.1%
FY2015-25 2.3% 2.9% 2.5% 4.3% N/A N/A N/A N/A N/A 16.8% N/A 7.0% 3.2%
FY2015-35 2.2% 2.5% 2.3% 3.5% N/A N/A N/A N/A N/A 9.9% N/A 5.7% 2.9%
FY2015-45 2.2% 2.3% 2.2% 3.3% N/A N/A N/A N/A N/A 7.6% N/A 4.7% 2.7%
FY2015-60 2.1% 2.0% 2.1% 3.0% N/A N/A N/A N/A N/A 5.9% N/A 3.9% 2.4%
Note: The split of forecast international passengers is based on immediate origin/destination (or E/D segment) rather than final origin/destination. For example, UK passengers are allocated to
domestic and other international markets based on their connecting point to WLG.
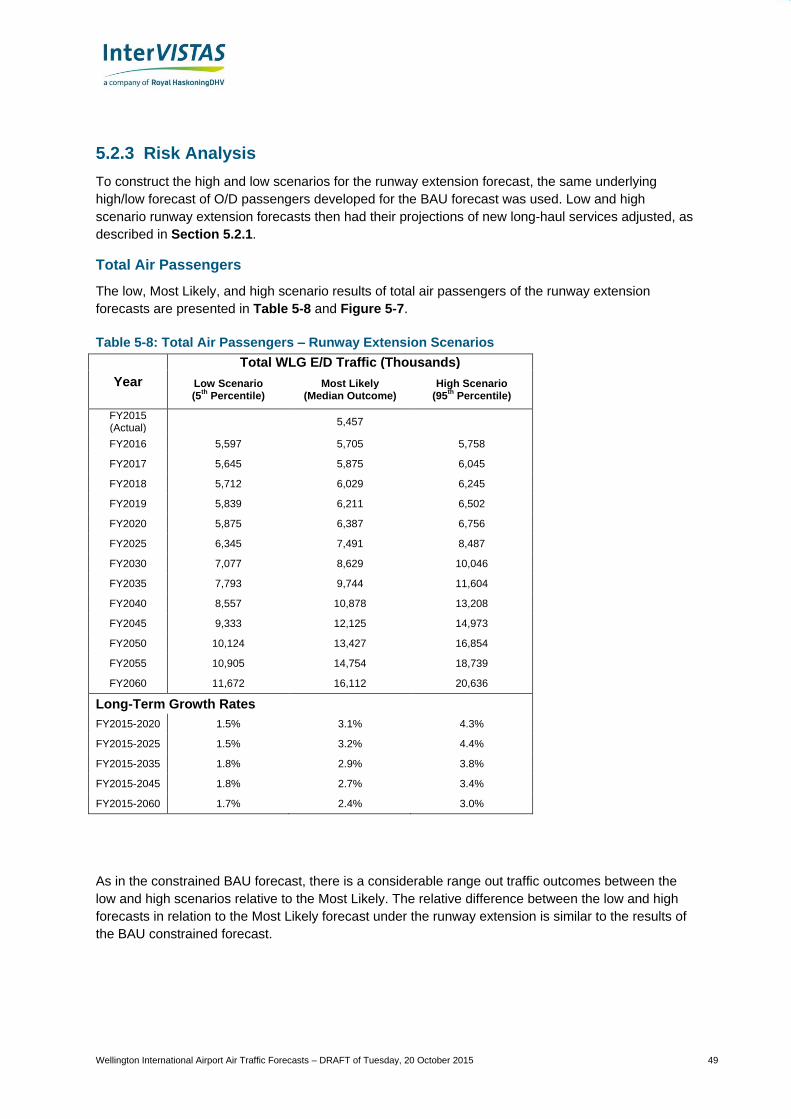
Wellington International Airport Air Traffic Forecasts – DRAFT of Tuesday, 20 October 2015 49
5.2.3 Risk Analysis
To construct the high and low scenarios for the runway extension forecast, the same underlying
high/low forecast of O/D passengers developed for the BAU forecast was used. Low and high
scenario runway extension forecasts then had their projections of new long-haul services adjusted, as
described in Section 5.2.1.
Total Air Passengers
The low, Most Likely, and high scenario results of total air passengers of the runway extension
forecasts are presented in Table 5-8 and Figure 5-7.
Table 5-8: Total Air Passengers – Runway Extension Scenarios
Year
Total WLG E/D Traffic (Thousands)
Low Scenario (5
th Percentile)
Most Likely (Median Outcome)
High Scenario (95
th Percentile)
FY2015 (Actual)
5,457
FY2016 5,597 5,705 5,758
FY2017 5,645 5,875 6,045
FY2018 5,712 6,029 6,245
FY2019 5,839 6,211 6,502
FY2020 5,875 6,387 6,756
FY2025 6,345 7,491 8,487
FY2030 7,077 8,629 10,046
FY2035 7,793 9,744 11,604
FY2040 8,557 10,878 13,208
FY2045 9,333 12,125 14,973
FY2050 10,124 13,427 16,854
FY2055 10,905 14,754 18,739
FY2060 11,672 16,112 20,636
Long-Term Growth Rates
FY2015-2020 1.5% 3.1% 4.3%
FY2015-2025 1.5% 3.2% 4.4%
FY2015-2035 1.8% 2.9% 3.8%
FY2015-2045 1.8% 2.7% 3.4%
FY2015-2060 1.7% 2.4% 3.0%
As in the constrained BAU forecast, there is a considerable range out traffic outcomes between the
low and high scenarios relative to the Most Likely. The relative difference between the low and high
forecasts in relation to the Most Likely forecast under the runway extension is similar to the results of
the BAU constrained forecast.
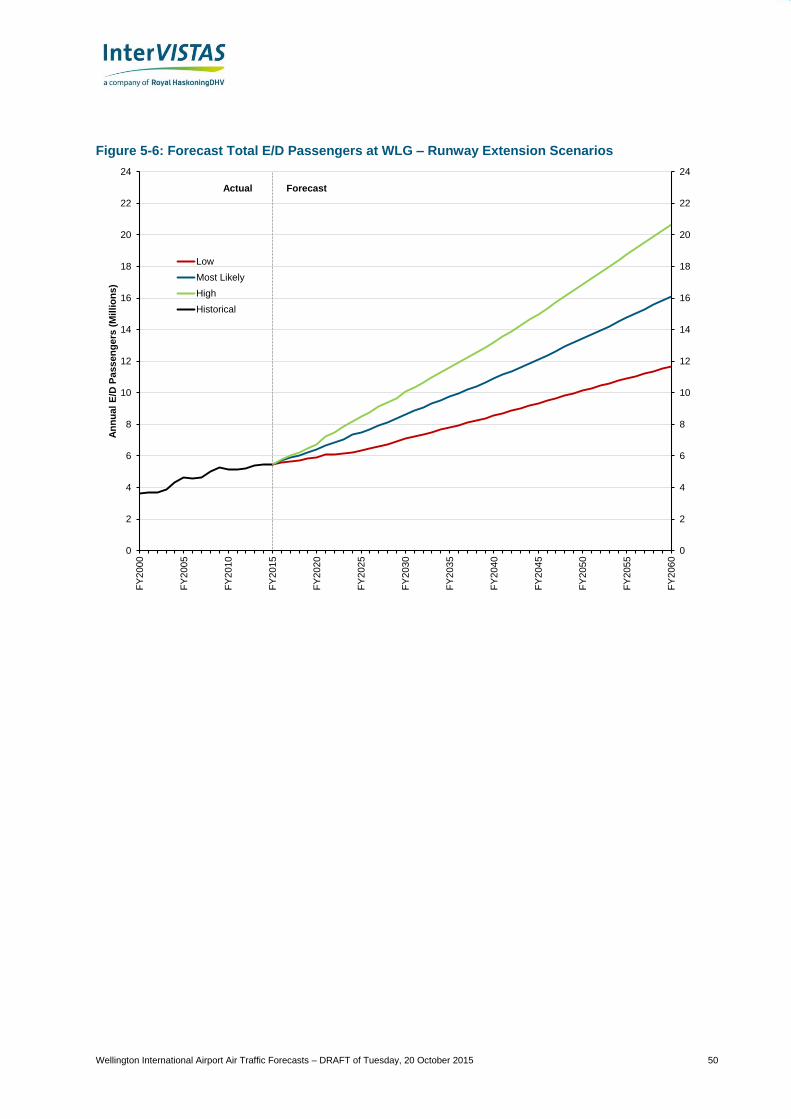
Wellington International Airport Air Traffic Forecasts – DRAFT of Tuesday, 20 October 2015 50
Figure 5-6: Forecast Total E/D Passengers at WLG – Runway Extension Scenarios
0
2
4
6
8
10
12
14
16
18
20
22
24
0
2
4
6
8
10
12
14
16
18
20
22
24
FY
200
0
FY
200
5
FY
201
0
FY
201
5
FY
202
0
FY
202
5
FY
203
0
FY
203
5
FY
204
0
FY
204
5
FY
205
0
FY
205
5
FY
206
0
An
nu
al
E/D
Pa
ss
en
ge
rs (
Mil
lio
ns
)
Low
Most Likely
High
Historical
Actual Forecast
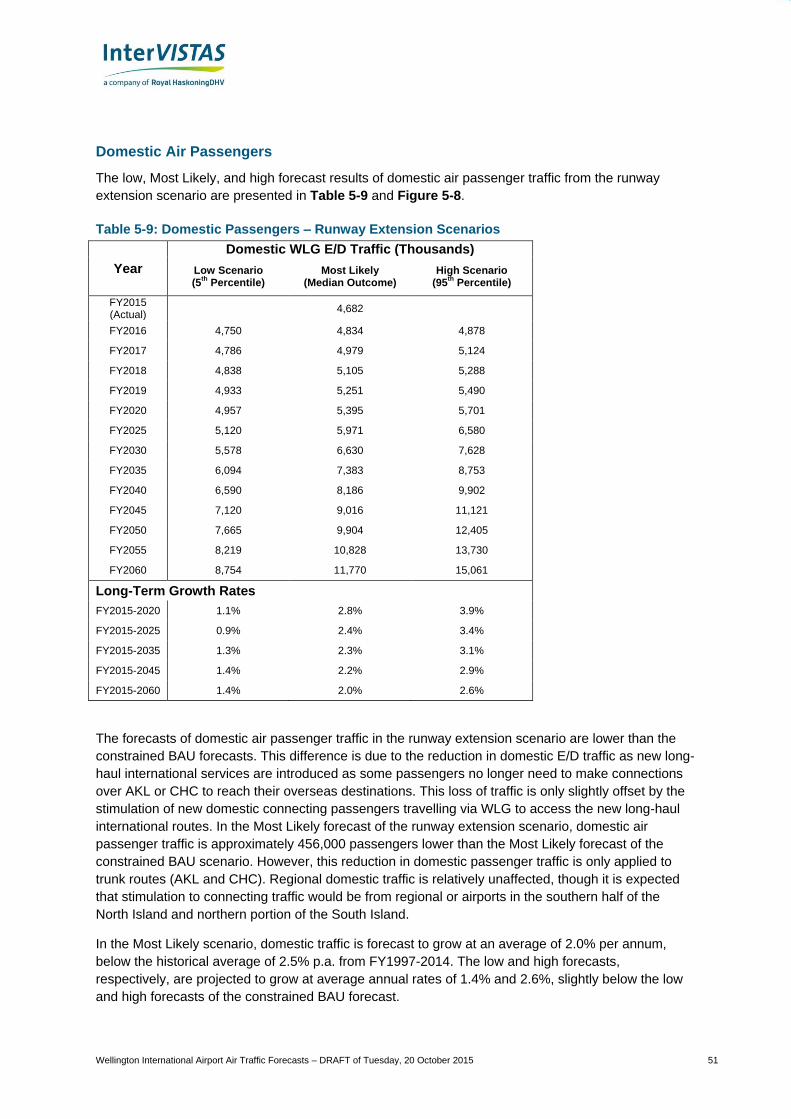
Wellington International Airport Air Traffic Forecasts – DRAFT of Tuesday, 20 October 2015 51
Domestic Air Passengers
The low, Most Likely, and high forecast results of domestic air passenger traffic from the runway
extension scenario are presented in Table 5-9 and Figure 5-8.
Table 5-9: Domestic Passengers – Runway Extension Scenarios
Year
Domestic WLG E/D Traffic (Thousands)
Low Scenario (5
th Percentile)
Most Likely (Median Outcome)
High Scenario (95
th Percentile)
FY2015 (Actual)
4,682
FY2016 4,750 4,834 4,878
FY2017 4,786 4,979 5,124
FY2018 4,838 5,105 5,288
FY2019 4,933 5,251 5,490
FY2020 4,957 5,395 5,701
FY2025 5,120 5,971 6,580
FY2030 5,578 6,630 7,628
FY2035 6,094 7,383 8,753
FY2040 6,590 8,186 9,902
FY2045 7,120 9,016 11,121
FY2050 7,665 9,904 12,405
FY2055 8,219 10,828 13,730
FY2060 8,754 11,770 15,061
Long-Term Growth Rates
FY2015-2020 1.1% 2.8% 3.9%
FY2015-2025 0.9% 2.4% 3.4%
FY2015-2035 1.3% 2.3% 3.1%
FY2015-2045 1.4% 2.2% 2.9%
FY2015-2060 1.4% 2.0% 2.6%
The forecasts of domestic air passenger traffic in the runway extension scenario are lower than the
constrained BAU forecasts. This difference is due to the reduction in domestic E/D traffic as new long-
haul international services are introduced as some passengers no longer need to make connections
over AKL or CHC to reach their overseas destinations. This loss of traffic is only slightly offset by the
stimulation of new domestic connecting passengers travelling via WLG to access the new long-haul
international routes. In the Most Likely forecast of the runway extension scenario, domestic air
passenger traffic is approximately 456,000 passengers lower than the Most Likely forecast of the
constrained BAU scenario. However, this reduction in domestic passenger traffic is only applied to
trunk routes (AKL and CHC). Regional domestic traffic is relatively unaffected, though it is expected
that stimulation to connecting traffic would be from regional or airports in the southern half of the
North Island and northern portion of the South Island.
In the Most Likely scenario, domestic traffic is forecast to grow at an average of 2.0% per annum,
below the historical average of 2.5% p.a. from FY1997-2014. The low and high forecasts,
respectively, are projected to grow at average annual rates of 1.4% and 2.6%, slightly below the low
and high forecasts of the constrained BAU forecast.
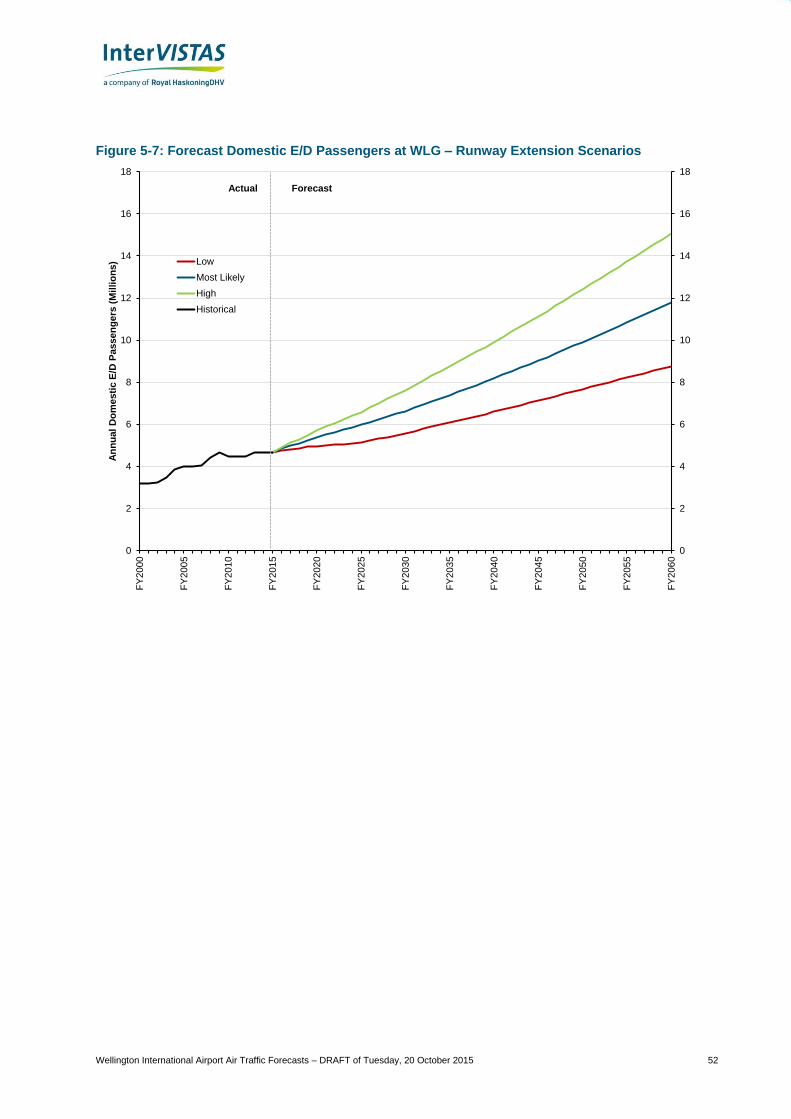
Wellington International Airport Air Traffic Forecasts – DRAFT of Tuesday, 20 October 2015 52
Figure 5-7: Forecast Domestic E/D Passengers at WLG – Runway Extension Scenarios
0
2
4
6
8
10
12
14
16
18
0
2
4
6
8
10
12
14
16
18
FY
200
0
FY
200
5
FY
201
0
FY
201
5
FY
202
0
FY
202
5
FY
203
0
FY
203
5
FY
204
0
FY
204
5
FY
205
0
FY
205
5
FY
206
0
An
nu
al
Do
me
sti
c E
/D P
ass
en
ge
rs (
Mil
lio
ns
) Low
Most Likely
High
Historical
Actual Forecast
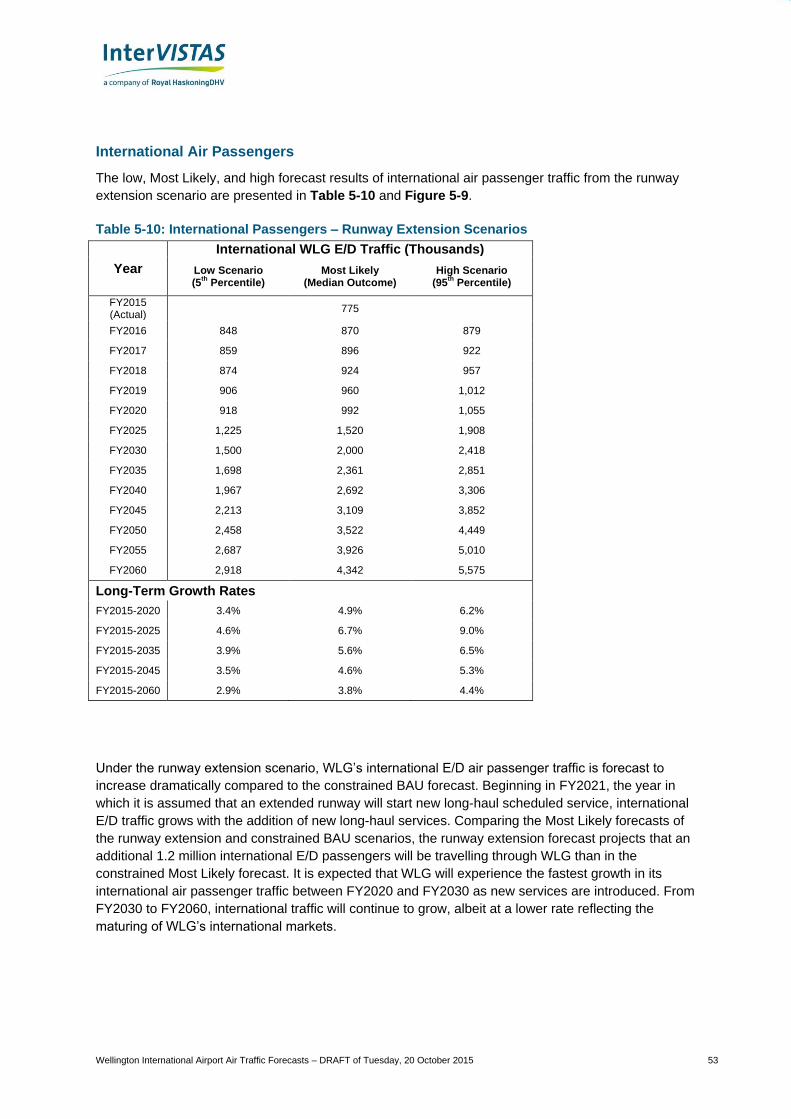
Wellington International Airport Air Traffic Forecasts – DRAFT of Tuesday, 20 October 2015 53
International Air Passengers
The low, Most Likely, and high forecast results of international air passenger traffic from the runway
extension scenario are presented in Table 5-10 and Figure 5-9.
Table 5-10: International Passengers – Runway Extension Scenarios
Year
International WLG E/D Traffic (Thousands)
Low Scenario (5
th Percentile)
Most Likely (Median Outcome)
High Scenario (95
th Percentile)
FY2015 (Actual)
775
FY2016 848 870 879
FY2017 859 896 922
FY2018 874 924 957
FY2019 906 960 1,012
FY2020 918 992 1,055
FY2025 1,225 1,520 1,908
FY2030 1,500 2,000 2,418
FY2035 1,698 2,361 2,851
FY2040 1,967 2,692 3,306
FY2045 2,213 3,109 3,852
FY2050 2,458 3,522 4,449
FY2055 2,687 3,926 5,010
FY2060 2,918 4,342 5,575
Long-Term Growth Rates
FY2015-2020 3.4% 4.9% 6.2%
FY2015-2025 4.6% 6.7% 9.0%
FY2015-2035 3.9% 5.6% 6.5%
FY2015-2045 3.5% 4.6% 5.3%
FY2015-2060 2.9% 3.8% 4.4%
Under the runway extension scenario, WLG’s international E/D air passenger traffic is forecast to
increase dramatically compared to the constrained BAU forecast. Beginning in FY2021, the year in
which it is assumed that an extended runway will start new long-haul scheduled service, international
E/D traffic grows with the addition of new long-haul services. Comparing the Most Likely forecasts of
the runway extension and constrained BAU scenarios, the runway extension forecast projects that an
additional 1.2 million international E/D passengers will be travelling through WLG than in the
constrained Most Likely forecast. It is expected that WLG will experience the fastest growth in its
international air passenger traffic between FY2020 and FY2030 as new services are introduced. From
FY2030 to FY2060, international traffic will continue to grow, albeit at a lower rate reflecting the
maturing of WLG’s international markets.
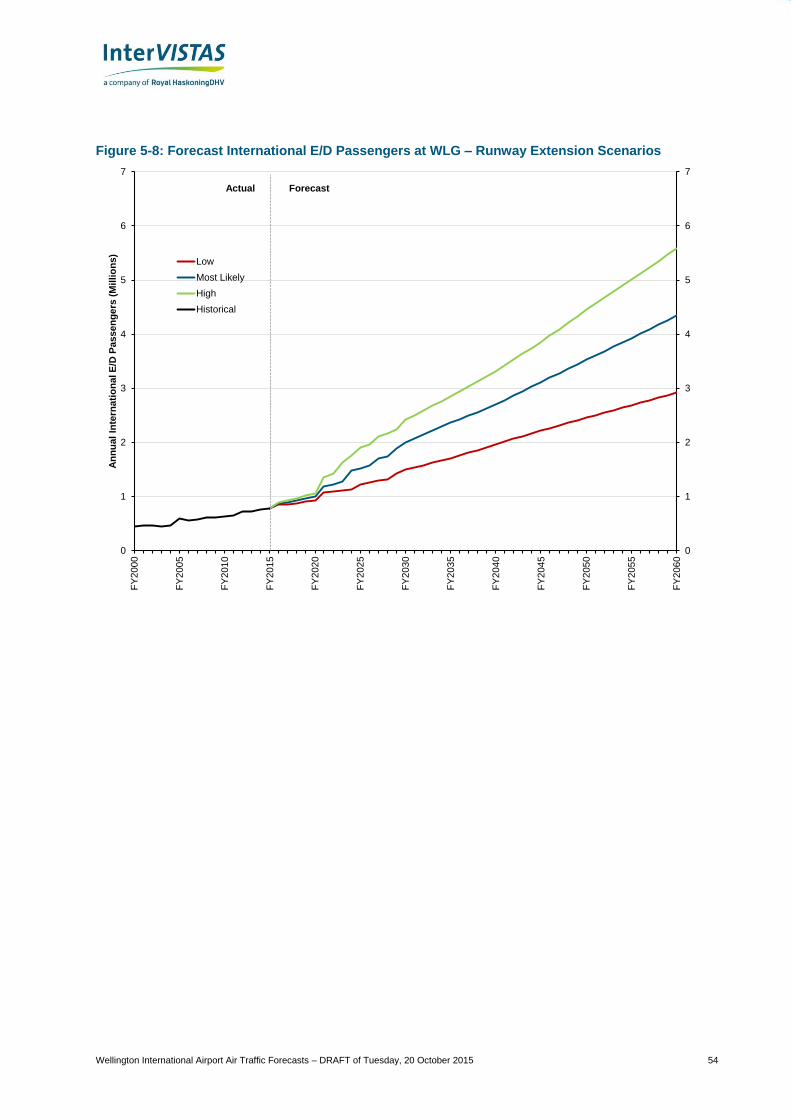
Wellington International Airport Air Traffic Forecasts – DRAFT of Tuesday, 20 October 2015 54
Figure 5-8: Forecast International E/D Passengers at WLG – Runway Extension Scenarios
0
1
2
3
4
5
6
7
0
1
2
3
4
5
6
7
FY
200
0
FY
200
5
FY
201
0
FY
201
5
FY
202
0
FY
202
5
FY
203
0
FY
203
5
FY
204
0
FY
204
5
FY
205
0
FY
205
5
FY
206
0
An
nu
al
Inte
rna
tio
na
l E
/D P
ass
en
ge
rs (
Mil
lio
ns
)
Low
Most Likely
High
Historical
Actual Forecast
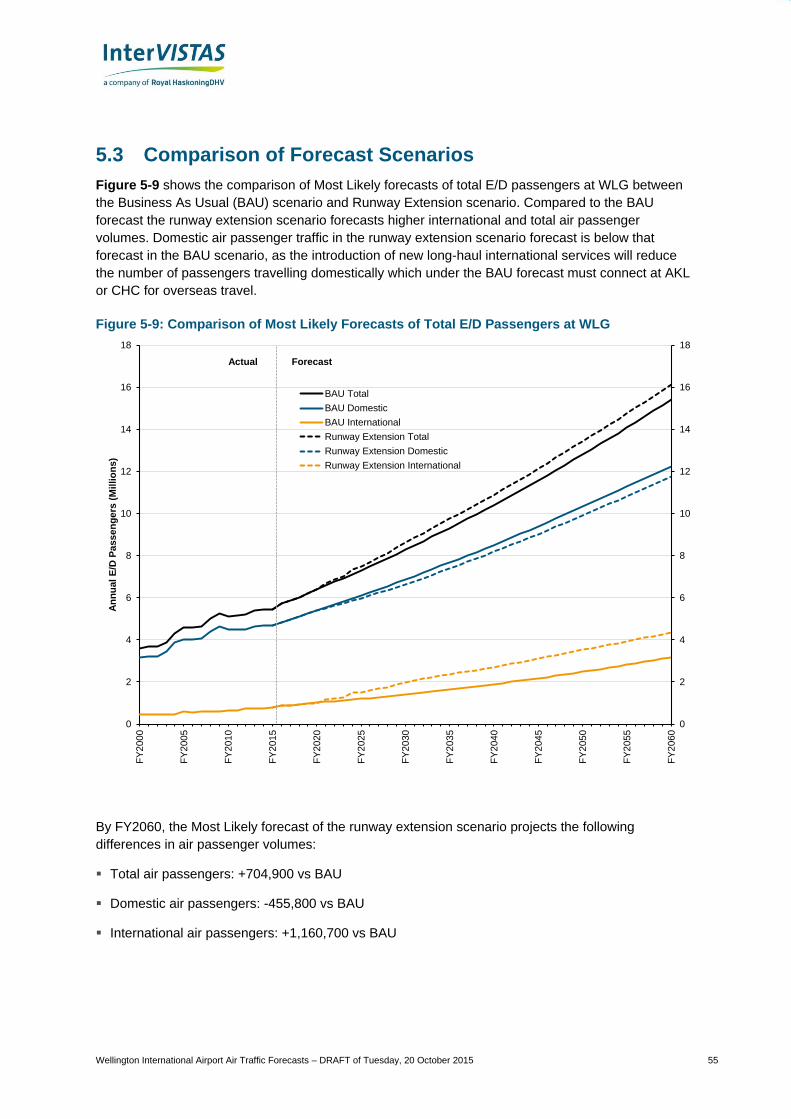
Wellington International Airport Air Traffic Forecasts – DRAFT of Tuesday, 20 October 2015 55
5.3 Comparison of Forecast Scenarios
Figure 5-9 shows the comparison of Most Likely forecasts of total E/D passengers at WLG between
the Business As Usual (BAU) scenario and Runway Extension scenario. Compared to the BAU
forecast the runway extension scenario forecasts higher international and total air passenger
volumes. Domestic air passenger traffic in the runway extension scenario forecast is below that
forecast in the BAU scenario, as the introduction of new long-haul international services will reduce
the number of passengers travelling domestically which under the BAU forecast must connect at AKL
or CHC for overseas travel.
Figure 5-9: Comparison of Most Likely Forecasts of Total E/D Passengers at WLG
By FY2060, the Most Likely forecast of the runway extension scenario projects the following
differences in air passenger volumes:
Total air passengers: +704,900 vs BAU
Domestic air passengers: -455,800 vs BAU
International air passengers: +1,160,700 vs BAU
0
2
4
6
8
10
12
14
16
18
0
2
4
6
8
10
12
14
16
18
FY
200
0
FY
200
5
FY
201
0
FY
201
5
FY
202
0
FY
202
5
FY
203
0
FY
203
5
FY
204
0
FY
204
5
FY
205
0
FY
205
5
FY
206
0
An
nu
al
E/D
Pa
ss
en
ge
rs (
Mil
lio
ns
)
BAU Total
BAU Domestic
BAU International
Runway Extension Total
Runway Extension Domestic
Runway Extension International
Actual Forecast
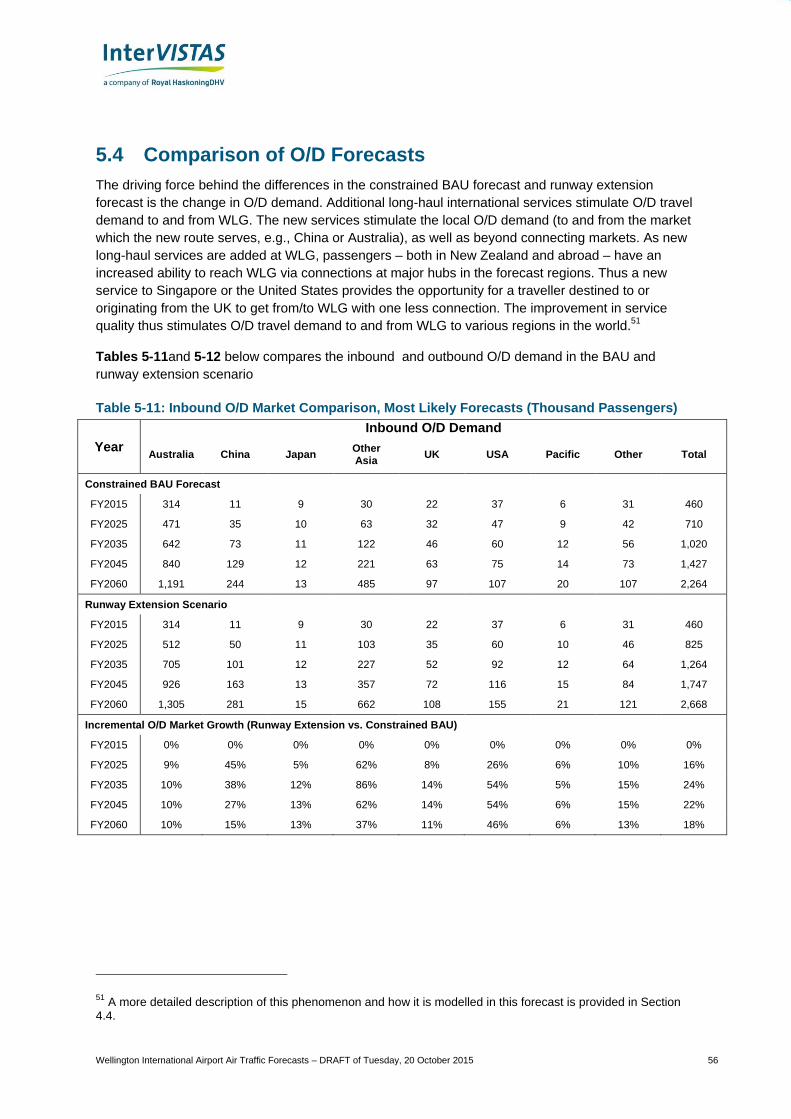
Wellington International Airport Air Traffic Forecasts – DRAFT of Tuesday, 20 October 2015 56
5.4 Comparison of O/D Forecasts
The driving force behind the differences in the constrained BAU forecast and runway extension
forecast is the change in O/D demand. Additional long-haul international services stimulate O/D travel
demand to and from WLG. The new services stimulate the local O/D demand (to and from the market
which the new route serves, e.g., China or Australia), as well as beyond connecting markets. As new
long-haul services are added at WLG, passengers – both in New Zealand and abroad – have an
increased ability to reach WLG via connections at major hubs in the forecast regions. Thus a new
service to Singapore or the United States provides the opportunity for a traveller destined to or
originating from the UK to get from/to WLG with one less connection. The improvement in service
quality thus stimulates O/D travel demand to and from WLG to various regions in the world.51
Tables 5-11and 5-12 below compares the inbound and outbound O/D demand in the BAU and
runway extension scenario
Table 5-11: Inbound O/D Market Comparison, Most Likely Forecasts (Thousand Passengers)
Year
Inbound O/D Demand
Australia China Japan Other Asia
UK USA Pacific Other Total
Constrained BAU Forecast
FY2015 314 11 9 30 22 37 6 31 460
FY2025 471 35 10 63 32 47 9 42 710
FY2035 642 73 11 122 46 60 12 56 1,020
FY2045 840 129 12 221 63 75 14 73 1,427
FY2060 1,191 244 13 485 97 107 20 107 2,264
Runway Extension Scenario
FY2015 314 11 9 30 22 37 6 31 460
FY2025 512 50 11 103 35 60 10 46 825
FY2035 705 101 12 227 52 92 12 64 1,264
FY2045 926 163 13 357 72 116 15 84 1,747
FY2060 1,305 281 15 662 108 155 21 121 2,668
Incremental O/D Market Growth (Runway Extension vs. Constrained BAU)
FY2015 0% 0% 0% 0% 0% 0% 0% 0% 0%
FY2025 9% 45% 5% 62% 8% 26% 6% 10% 16%
FY2035 10% 38% 12% 86% 14% 54% 5% 15% 24%
FY2045 10% 27% 13% 62% 14% 54% 6% 15% 22%
FY2060 10% 15% 13% 37% 11% 46% 6% 13% 18%
51 A more detailed description of this phenomenon and how it is modelled in this forecast is provided in Section
4.4.
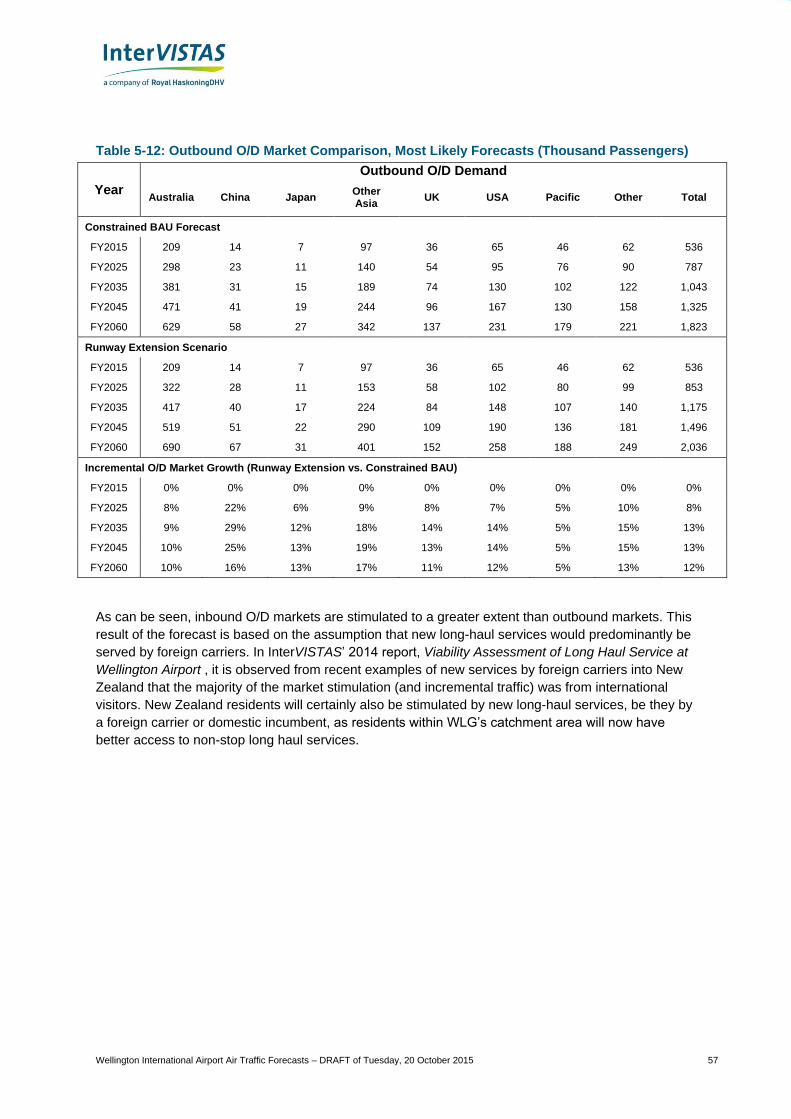
Wellington International Airport Air Traffic Forecasts – DRAFT of Tuesday, 20 October 2015 57
Table 5-12: Outbound O/D Market Comparison, Most Likely Forecasts (Thousand Passengers)
Year
Outbound O/D Demand
Australia China Japan Other Asia
UK USA Pacific Other Total
Constrained BAU Forecast
FY2015 209 14 7 97 36 65 46 62 536
FY2025 298 23 11 140 54 95 76 90 787
FY2035 381 31 15 189 74 130 102 122 1,043
FY2045 471 41 19 244 96 167 130 158 1,325
FY2060 629 58 27 342 137 231 179 221 1,823
Runway Extension Scenario
FY2015 209 14 7 97 36 65 46 62 536
FY2025 322 28 11 153 58 102 80 99 853
FY2035 417 40 17 224 84 148 107 140 1,175
FY2045 519 51 22 290 109 190 136 181 1,496
FY2060 690 67 31 401 152 258 188 249 2,036
Incremental O/D Market Growth (Runway Extension vs. Constrained BAU)
FY2015 0% 0% 0% 0% 0% 0% 0% 0% 0%
FY2025 8% 22% 6% 9% 8% 7% 5% 10% 8%
FY2035 9% 29% 12% 18% 14% 14% 5% 15% 13%
FY2045 10% 25% 13% 19% 13% 14% 5% 15% 13%
FY2060 10% 16% 13% 17% 11% 12% 5% 13% 12%
As can be seen, inbound O/D markets are stimulated to a greater extent than outbound markets. This
result of the forecast is based on the assumption that new long-haul services would predominantly be
served by foreign carriers. In InterVISTAS’ 2014 report, Viability Assessment of Long Haul Service at
Wellington Airport , it is observed from recent examples of new services by foreign carriers into New
Zealand that the majority of the market stimulation (and incremental traffic) was from international
visitors. New Zealand residents will certainly also be stimulated by new long-haul services, be they by
a foreign carrier or domestic incumbent, as residents within WLG’s catchment area will now have
better access to non-stop long haul services.
Wellington International Airport Air Traffic Forecasts – DRAFT of Tuesday, 20 October 2015 58
6 Aircraft Movement Forecasts
As discussed in Section 4.3, aircraft movements are generally a function of passenger traffic demand
and air service development, shaped by carriers’ network and the average aircraft size. Forecasts of
future aircraft movements are derived forecast, taking into consideration passenger traffic demand,
potential service improvement/expansion, change in carrier fleets and aircraft sizes, and load factors.
The forecasts of aircraft movements were constructed using a bottom-up approach, identifying and
projecting the proportion of aircraft movements by aircraft type in a given forecast sector, the average
seat capacity of aircraft operating in that sector, and a sector average load factor. From these inputs,
sector total aircraft movements were calculated based on the formula below (reproduced from Section
4.3):
Aircraft Movements =E/D Passenger Forecasts
Average Aircraft Size ⋅ Average Load Factor
Where: Average Aircraft Size ⋅ Average Load Factor = Average Passengers per Aircraft Movement
The total number of aircraft movements required for a given sector was then allocated to aircraft
movements by specific aircraft type based on the projected mix of aircraft operating in a given
forecast year. The results presented in this chapter of the report describe the total aircraft movements
at WLG and by forecast sector. Details of the aircraft movement forecasts by aircraft type are
presented in the accompanying spreadsheets.
6.1 Assumptions Underlying Aircraft Movement Forecasts
To generate the derived aircraft movement forecasts, the forecast team analysed historical data on
aircraft movements by sector at WLG and complimented that data with airline schedule data to
identify the number of scheduled movements by aircraft type.52
An analysis of historical average load
factors by sector was also conducted to determine the current and projected future load factors for
aircraft operations at WLG.
In the short- and medium-term, market intelligence and research on known fleet plans was used to
identify changes in the mix of aircraft operating at WLG. In the long- and very long-term, expert
judgement was used to project the type and mix of aircraft operating at WLG under the BAU and
runway extension forecast scenarios. Overall it is assumed that the average number of passengers
per aircraft movement will continue to increase at WLG into the future. This is due a combination of
increasing average aircraft size (e.g. retirement of sub-50 seat turboprop aircraft to be replaced with
70+ seat aircraft) and increasing load factors.
Determination of future average passengers per aircraft was based on the known fleet plans of
carriers serving WLG as well as sector specific average load factors. The average number of
passengers per aircraft in domestic trunk operations is projected to grow from an average of 119 in
FY2015 to 166 in FY2045. In the short term this is due to Air New Zealand’s retirement of 737-300
from its fleet early in FY2016 which is to be replaced by additional A320 services and an increase in
operations from ATR72-600 turboprops. Further into the future it is projected that Dash-8 services will
be slowly phased out from domestic trunk operations as the youngest aircraft in the fleets are
transferred to regional routes and operators. Those turboprop services are assumed to be taken up
52 OAG schedule data via Diio Mi.
Wellington International Airport Air Traffic Forecasts – DRAFT of Tuesday, 20 October 2015 59
by ATR72 operations or longer term, some other regional aircraft in the 60-80 seat range. Larger jet
aircraft will also enter the domestic trunk fleet, such as the A321, further increasing average aircraft
size.
The average number of passengers per aircraft movement for domestic regional operations is
forecast to increase from 24 in FY2015 to 35 passengers per movement in FY2045. While in the
short-term load factors are projected to decrease as additional capacity is introduced at WLG (i.e.,
Jetstar beginning regional service to NSN with Dash-8 operations in FY2016/17), overall average
aircraft sizes are projected to increase throughout the forecast. In FY2016 Eagle Airways is ceasing
Beech 1900D service at WLG (operating for Air New Zealand Link), to be replaced by additional
Dash-8 and ATR72 services. By FY2025, older Dash-8 aircraft will begin to be retired from the fleets
of regional operators, as additional ATR72 services are introduced. While the more detailed forecasts
provided in the supplementary spreadsheets to indicate that Dash-8 aircraft will be in operation
throughout the forecast period, it is more likely that these will be some form of 50-seat regional
aircraft. Bombardier ceased production of the Dash-8 100 and 300 in 2009 but is now offering an
extended service program for these aircraft, which will increase the number of life cycles of the aircraft
by 50%.53
In addition, ATR is currently offering the ATR42-600 for sale, further indicating the
possibility that 50-seat turboprops will remain in operations in 2045.
Aircraft operating on trans-Tasman and Pacific Islands routes are also expected to increase in
average size over the forecast period. The average number of passengers per aircraft operating to
Australia is expected to increase from 145 in FY2015 to 179 in FY2045. This is reflective of current
orders by Virgin Australia for higher capacity 737MAX aircraft, the eventual retirement of 737-800
aircraft and introduction of A321 aircraft (potentially by NZ or QF), as well as the expected operations
of a small widebody (A330) operating 5th freedom flights at WLG via Australia. For operations to/from
the Pacific Islands, the average passengers per aircraft is forecast to increase from 142 to 156 from
FY2015 to FY2045. Growth in average passengers per aircraft is largely dominated by future
increases in load factors, as well as a potential upgauging of aircraft to higher capacity A321 versus
existing A320 operations. Fiji Airways’ introduction of year-round non-stop service at WLG is projected
to nearly treble Pacific seat capacity by FY2017, likely leading to lower load factors in the short term
(which is supported by year to date traffic data). Over time, load factors are projected to increase
throughout the forecast period.
6.2 BAU Constrained Forecast
The resulting constrained BAU forecasts of aircraft movements are provided in Figure 6-1 and Table
6-1. The average passengers per aircraft, based on projected mix of aircraft types by sector, were
applied to each sector’s E/D passenger traffic to arrive at the Most Likely forecast portrayed below.
Total aircraft movements at WLG are, in the Most Likely forecast, projected to grow from 93,032
movements in FY2015 to 150,500 in FY2060, growing at an average annual rate of 1.1%. Compared
to the constrained BAU Most Likely average annual forecast growth of total E/D traffic at WLG of 2.3%
over the same period, the aircraft movement forecast projects the continuation of current trends for
aircraft movements to grow at a fraction of the rate of passenger traffic. This is due largely to
upgauging of aircraft, forecasts of higher load factors, and reduction in the relatively frequency of
operations of small sub-50 seat aircraft.
53 http://chorusaviation.ca/2015-02-02-Bombardier-and-Chorus-Sign-Purchase-Agreement-for-up-to-23-Q400-
NextGen-Aircraft-and-Launch-New-Extended-Service-Program-for-Dash-8-300-Aircraft.
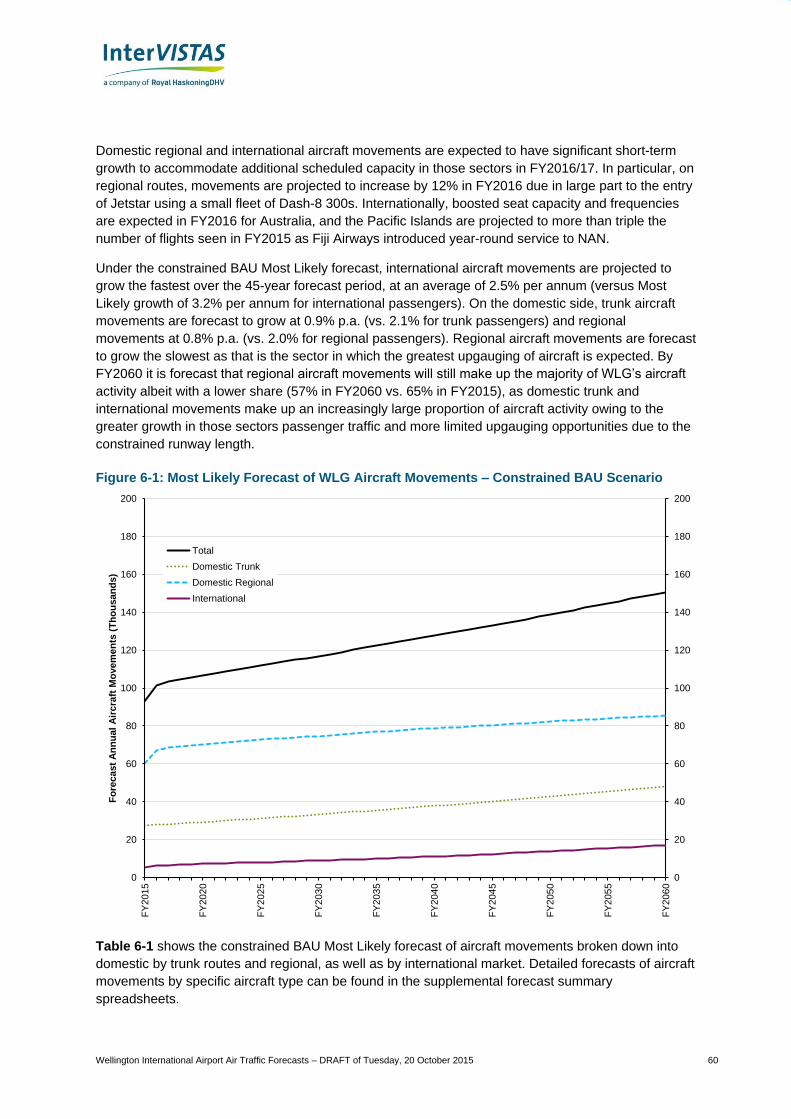
Wellington International Airport Air Traffic Forecasts – DRAFT of Tuesday, 20 October 2015 60
Domestic regional and international aircraft movements are expected to have significant short-term
growth to accommodate additional scheduled capacity in those sectors in FY2016/17. In particular, on
regional routes, movements are projected to increase by 12% in FY2016 due in large part to the entry
of Jetstar using a small fleet of Dash-8 300s. Internationally, boosted seat capacity and frequencies
are expected in FY2016 for Australia, and the Pacific Islands are projected to more than triple the
number of flights seen in FY2015 as Fiji Airways introduced year-round service to NAN.
Under the constrained BAU Most Likely forecast, international aircraft movements are projected to
grow the fastest over the 45-year forecast period, at an average of 2.5% per annum (versus Most
Likely growth of 3.2% per annum for international passengers). On the domestic side, trunk aircraft
movements are forecast to grow at 0.9% p.a. (vs. 2.1% for trunk passengers) and regional
movements at 0.8% p.a. (vs. 2.0% for regional passengers). Regional aircraft movements are forecast
to grow the slowest as that is the sector in which the greatest upgauging of aircraft is expected. By
FY2060 it is forecast that regional aircraft movements will still make up the majority of WLG’s aircraft
activity albeit with a lower share (57% in FY2060 vs. 65% in FY2015), as domestic trunk and
international movements make up an increasingly large proportion of aircraft activity owing to the
greater growth in those sectors passenger traffic and more limited upgauging opportunities due to the
constrained runway length.
Figure 6-1: Most Likely Forecast of WLG Aircraft Movements – Constrained BAU Scenario
Table 6-1 shows the constrained BAU Most Likely forecast of aircraft movements broken down into
domestic by trunk routes and regional, as well as by international market. Detailed forecasts of aircraft
movements by specific aircraft type can be found in the supplemental forecast summary
spreadsheets.
0
20
40
60
80
100
120
140
160
180
200
0
20
40
60
80
100
120
140
160
180
200
FY
201
5
FY
202
0
FY
202
5
FY
203
0
FY
203
5
FY
204
0
FY
204
5
FY
205
0
FY
205
5
FY
206
0
Fo
rec
ast
An
nu
al
Air
cra
ft M
ove
me
nts
(T
ho
usa
nd
s)
Total
Domestic Trunk
Domestic Regional
International
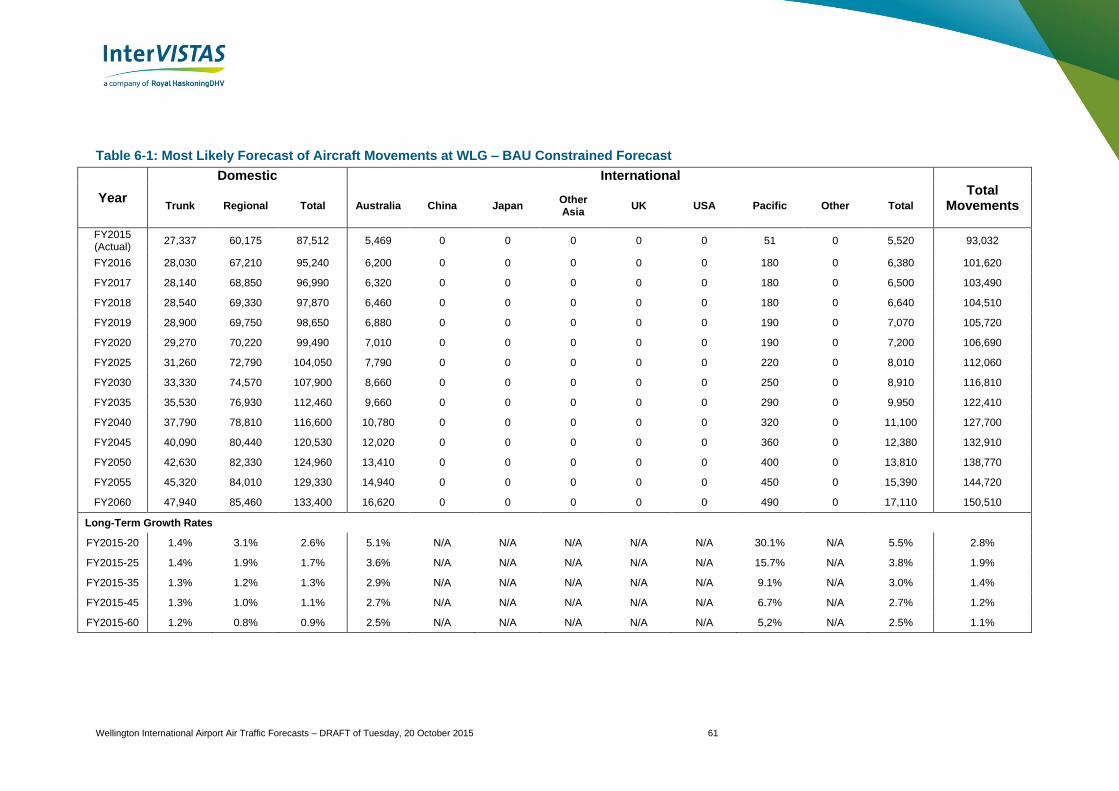
Wellington International Airport Air Traffic Forecasts – DRAFT of Tuesday, 20 October 2015 61
Table 6-1: Most Likely Forecast of Aircraft Movements at WLG – BAU Constrained Forecast
Year
Domestic International Total
Movements Trunk Regional Total Australia China Japan Other Asia
UK USA Pacific Other Total
FY2015 (Actual)
27,337 60,175 87,512 5,469 0 0 0 0 0 51 0 5,520 93,032
FY2016 28,030 67,210 95,240 6,200 0 0 0 0 0 180 0 6,380 101,620
FY2017 28,140 68,850 96,990 6,320 0 0 0 0 0 180 0 6,500 103,490
FY2018 28,540 69,330 97,870 6,460 0 0 0 0 0 180 0 6,640 104,510
FY2019 28,900 69,750 98,650 6,880 0 0 0 0 0 190 0 7,070 105,720
FY2020 29,270 70,220 99,490 7,010 0 0 0 0 0 190 0 7,200 106,690
FY2025 31,260 72,790 104,050 7,790 0 0 0 0 0 220 0 8,010 112,060
FY2030 33,330 74,570 107,900 8,660 0 0 0 0 0 250 0 8,910 116,810
FY2035 35,530 76,930 112,460 9,660 0 0 0 0 0 290 0 9,950 122,410
FY2040 37,790 78,810 116,600 10,780 0 0 0 0 0 320 0 11,100 127,700
FY2045 40,090 80,440 120,530 12,020 0 0 0 0 0 360 0 12,380 132,910
FY2050 42,630 82,330 124,960 13,410 0 0 0 0 0 400 0 13,810 138,770
FY2055 45,320 84,010 129,330 14,940 0 0 0 0 0 450 0 15,390 144,720
FY2060 47,940 85,460 133,400 16,620 0 0 0 0 0 490 0 17,110 150,510
Long-Term Growth Rates
FY2015-20 1.4% 3.1% 2.6% 5.1% N/A N/A N/A N/A N/A 30.1% N/A 5.5% 2.8%
FY2015-25 1.4% 1.9% 1.7% 3.6% N/A N/A N/A N/A N/A 15.7% N/A 3.8% 1.9%
FY2015-35 1.3% 1.2% 1.3% 2.9% N/A N/A N/A N/A N/A 9.1% N/A 3.0% 1.4%
FY2015-45 1.3% 1.0% 1.1% 2.7% N/A N/A N/A N/A N/A 6.7% N/A 2.7% 1.2%
FY2015-60 1.2% 0.8% 0.9% 2.5% N/A N/A N/A N/A N/A 5,2% N/A 2.5% 1.1%
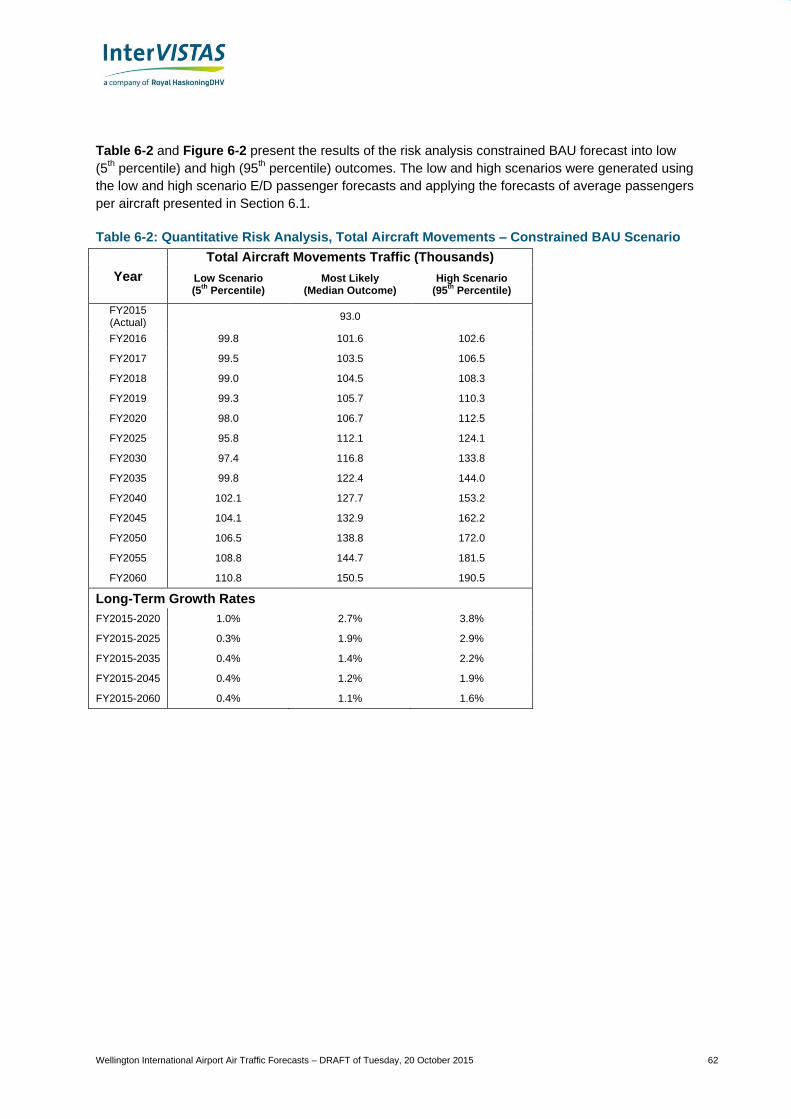
Wellington International Airport Air Traffic Forecasts – DRAFT of Tuesday, 20 October 2015 62
Table 6-2 and Figure 6-2 present the results of the risk analysis constrained BAU forecast into low
(5th percentile) and high (95
th percentile) outcomes. The low and high scenarios were generated using
the low and high scenario E/D passenger forecasts and applying the forecasts of average passengers
per aircraft presented in Section 6.1.
Table 6-2: Quantitative Risk Analysis, Total Aircraft Movements – Constrained BAU Scenario
Year
Total Aircraft Movements Traffic (Thousands)
Low Scenario (5
th Percentile)
Most Likely (Median Outcome)
High Scenario (95
th Percentile)
FY2015 (Actual)
93.0
FY2016 99.8 101.6 102.6
FY2017 99.5 103.5 106.5
FY2018 99.0 104.5 108.3
FY2019 99.3 105.7 110.3
FY2020 98.0 106.7 112.5
FY2025 95.8 112.1 124.1
FY2030 97.4 116.8 133.8
FY2035 99.8 122.4 144.0
FY2040 102.1 127.7 153.2
FY2045 104.1 132.9 162.2
FY2050 106.5 138.8 172.0
FY2055 108.8 144.7 181.5
FY2060 110.8 150.5 190.5
Long-Term Growth Rates
FY2015-2020 1.0% 2.7% 3.8%
FY2015-2025 0.3% 1.9% 2.9%
FY2015-2035 0.4% 1.4% 2.2%
FY2015-2045 0.4% 1.2% 1.9%
FY2015-2060 0.4% 1.1% 1.6%
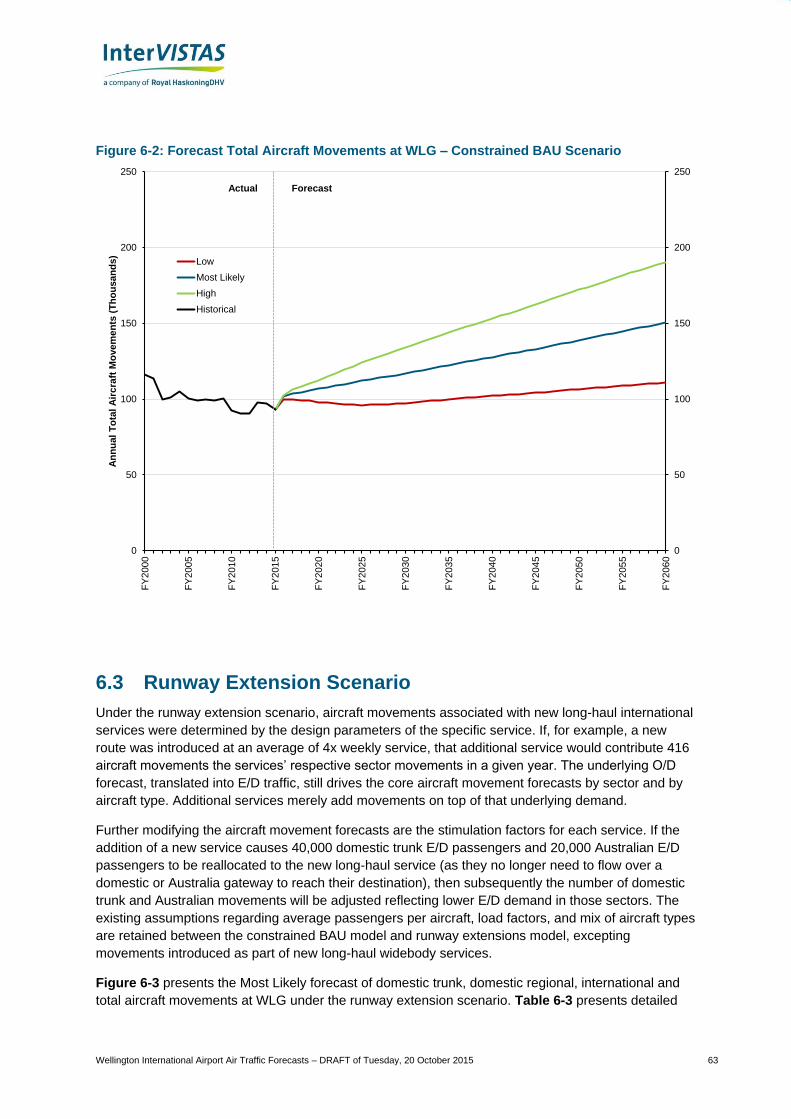
Wellington International Airport Air Traffic Forecasts – DRAFT of Tuesday, 20 October 2015 63
Figure 6-2: Forecast Total Aircraft Movements at WLG – Constrained BAU Scenario
6.3 Runway Extension Scenario
Under the runway extension scenario, aircraft movements associated with new long-haul international
services were determined by the design parameters of the specific service. If, for example, a new
route was introduced at an average of 4x weekly service, that additional service would contribute 416
aircraft movements the services’ respective sector movements in a given year. The underlying O/D
forecast, translated into E/D traffic, still drives the core aircraft movement forecasts by sector and by
aircraft type. Additional services merely add movements on top of that underlying demand.
Further modifying the aircraft movement forecasts are the stimulation factors for each service. If the
addition of a new service causes 40,000 domestic trunk E/D passengers and 20,000 Australian E/D
passengers to be reallocated to the new long-haul service (as they no longer need to flow over a
domestic or Australia gateway to reach their destination), then subsequently the number of domestic
trunk and Australian movements will be adjusted reflecting lower E/D demand in those sectors. The
existing assumptions regarding average passengers per aircraft, load factors, and mix of aircraft types
are retained between the constrained BAU model and runway extensions model, excepting
movements introduced as part of new long-haul widebody services.
Figure 6-3 presents the Most Likely forecast of domestic trunk, domestic regional, international and
total aircraft movements at WLG under the runway extension scenario. Table 6-3 presents detailed
0
50
100
150
200
250
0
50
100
150
200
250
FY
200
0
FY
200
5
FY
201
0
FY
201
5
FY
202
0
FY
202
5
FY
203
0
FY
203
5
FY
204
0
FY
204
5
FY
205
0
FY
205
5
FY
206
0
An
nu
al
To
tal
Air
cra
ft M
ove
me
nts
(T
ho
usa
nd
s)
Low
Most Likely
High
Historical
Actual Forecast
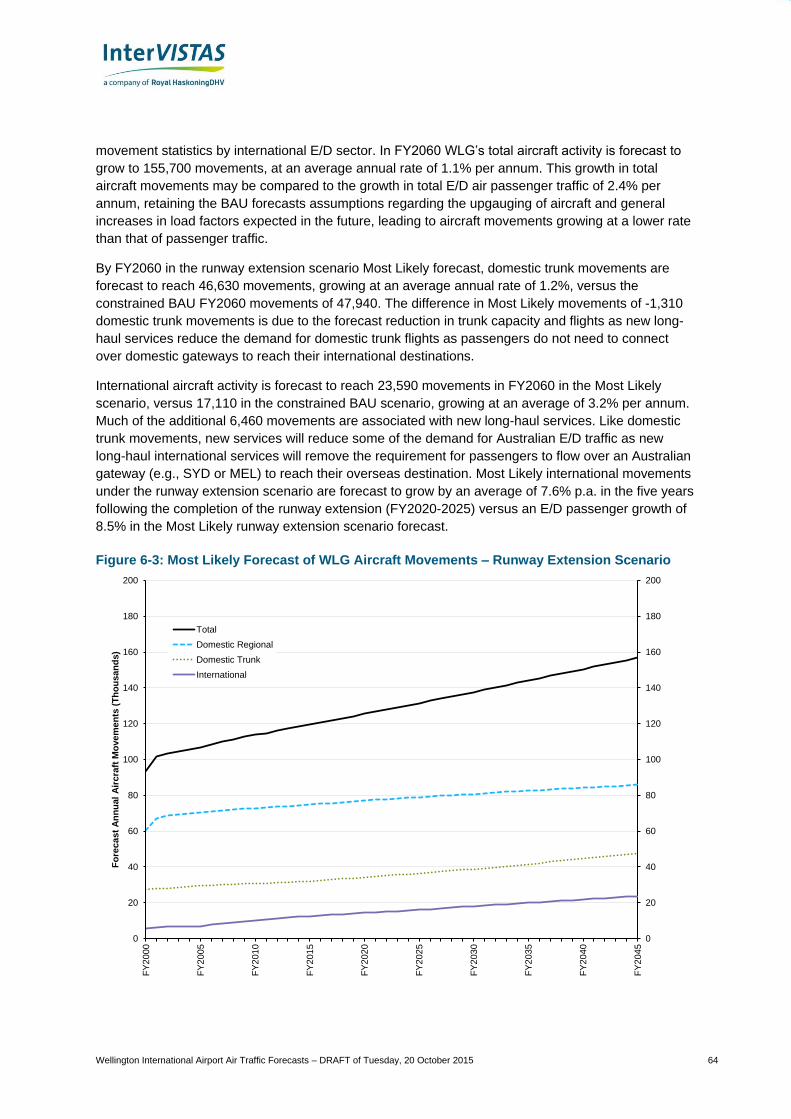
Wellington International Airport Air Traffic Forecasts – DRAFT of Tuesday, 20 October 2015 64
movement statistics by international E/D sector. In FY2060 WLG’s total aircraft activity is forecast to
grow to 155,700 movements, at an average annual rate of 1.1% per annum. This growth in total
aircraft movements may be compared to the growth in total E/D air passenger traffic of 2.4% per
annum, retaining the BAU forecasts assumptions regarding the upgauging of aircraft and general
increases in load factors expected in the future, leading to aircraft movements growing at a lower rate
than that of passenger traffic.
By FY2060 in the runway extension scenario Most Likely forecast, domestic trunk movements are
forecast to reach 46,630 movements, growing at an average annual rate of 1.2%, versus the
constrained BAU FY2060 movements of 47,940. The difference in Most Likely movements of -1,310
domestic trunk movements is due to the forecast reduction in trunk capacity and flights as new long-
haul services reduce the demand for domestic trunk flights as passengers do not need to connect
over domestic gateways to reach their international destinations.
International aircraft activity is forecast to reach 23,590 movements in FY2060 in the Most Likely
scenario, versus 17,110 in the constrained BAU scenario, growing at an average of 3.2% per annum.
Much of the additional 6,460 movements are associated with new long-haul services. Like domestic
trunk movements, new services will reduce some of the demand for Australian E/D traffic as new
long-haul international services will remove the requirement for passengers to flow over an Australian
gateway (e.g., SYD or MEL) to reach their overseas destination. Most Likely international movements
under the runway extension scenario are forecast to grow by an average of 7.6% p.a. in the five years
following the completion of the runway extension (FY2020-2025) versus an E/D passenger growth of
8.5% in the Most Likely runway extension scenario forecast.
Figure 6-3: Most Likely Forecast of WLG Aircraft Movements – Runway Extension Scenario
0
20
40
60
80
100
120
140
160
180
200
0
20
40
60
80
100
120
140
160
180
200
FY
2000
FY
2005
FY
2010
FY
2015
FY
2020
FY
2025
FY
2030
FY
2035
FY
2040
FY
2045
Fo
recast
An
nu
al
Air
cra
ft M
ovem
en
ts (
Th
ou
san
ds)
Total
Domestic Regional
Domestic Trunk
International
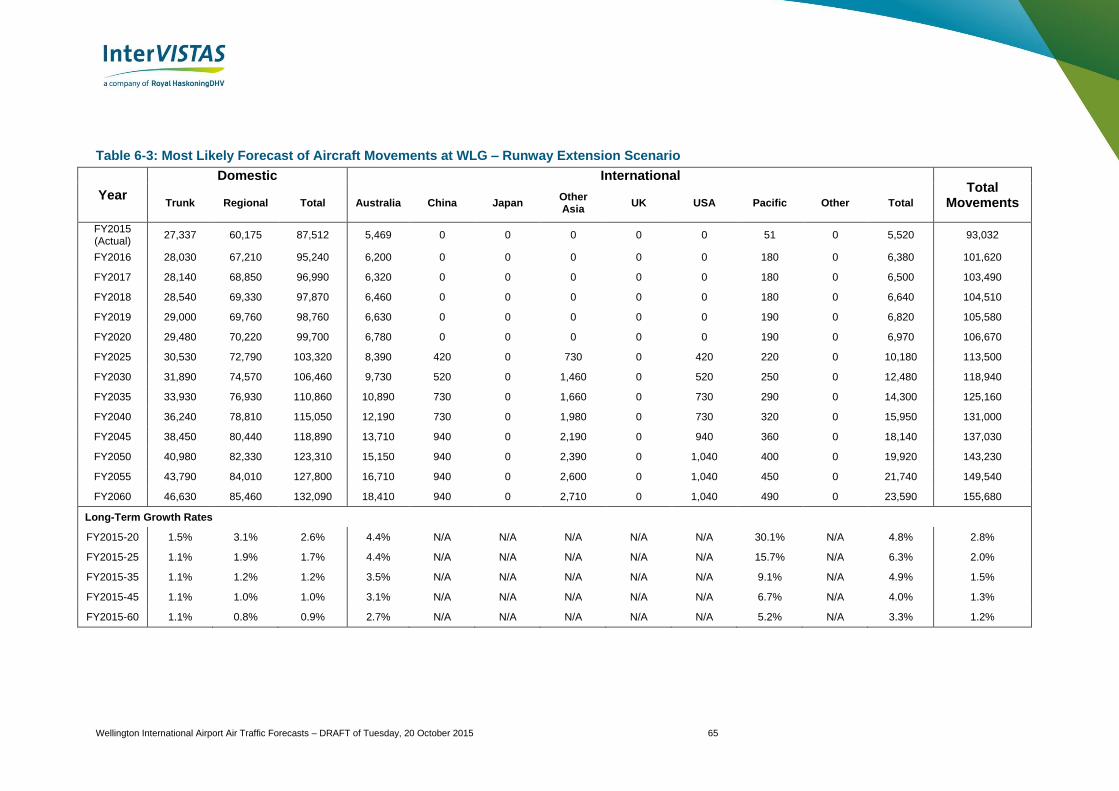
Wellington International Airport Air Traffic Forecasts – DRAFT of Tuesday, 20 October 2015 65
Table 6-3: Most Likely Forecast of Aircraft Movements at WLG – Runway Extension Scenario
Year
Domestic International Total
Movements Trunk Regional Total Australia China Japan Other Asia
UK USA Pacific Other Total
FY2015 (Actual)
27,337 60,175 87,512 5,469 0 0 0 0 0 51 0 5,520 93,032
FY2016 28,030 67,210 95,240 6,200 0 0 0 0 0 180 0 6,380 101,620
FY2017 28,140 68,850 96,990 6,320 0 0 0 0 0 180 0 6,500 103,490
FY2018 28,540 69,330 97,870 6,460 0 0 0 0 0 180 0 6,640 104,510
FY2019 29,000 69,760 98,760 6,630 0 0 0 0 0 190 0 6,820 105,580
FY2020 29,480 70,220 99,700 6,780 0 0 0 0 0 190 0 6,970 106,670
FY2025 30,530 72,790 103,320 8,390 420 0 730 0 420 220 0 10,180 113,500
FY2030 31,890 74,570 106,460 9,730 520 0 1,460 0 520 250 0 12,480 118,940
FY2035 33,930 76,930 110,860 10,890 730 0 1,660 0 730 290 0 14,300 125,160
FY2040 36,240 78,810 115,050 12,190 730 0 1,980 0 730 320 0 15,950 131,000
FY2045 38,450 80,440 118,890 13,710 940 0 2,190 0 940 360 0 18,140 137,030
FY2050 40,980 82,330 123,310 15,150 940 0 2,390 0 1,040 400 0 19,920 143,230
FY2055 43,790 84,010 127,800 16,710 940 0 2,600 0 1,040 450 0 21,740 149,540
FY2060 46,630 85,460 132,090 18,410 940 0 2,710 0 1,040 490 0 23,590 155,680
Long-Term Growth Rates
FY2015-20 1.5% 3.1% 2.6% 4.4% N/A N/A N/A N/A N/A 30.1% N/A 4.8% 2.8%
FY2015-25 1.1% 1.9% 1.7% 4.4% N/A N/A N/A N/A N/A 15.7% N/A 6.3% 2.0%
FY2015-35 1.1% 1.2% 1.2% 3.5% N/A N/A N/A N/A N/A 9.1% N/A 4.9% 1.5%
FY2015-45 1.1% 1.0% 1.0% 3.1% N/A N/A N/A N/A N/A 6.7% N/A 4.0% 1.3%
FY2015-60 1.1% 0.8% 0.9% 2.7% N/A N/A N/A N/A N/A 5.2% N/A 3.3% 1.2%

Wellington International Airport Air Traffic Forecasts – DRAFT of Tuesday, 20 October 2015 66
Table 6-4 and Figure 6-4 present the results of the risk analysis for the runway extension scenario,
comparing the low (5th percentile) and high (95
th percentile) traffic outcomes along with the Most
Likely. The low and high scenarios were generated using the low and high scenario E/D passenger
forecasts and applying the forecasts of average passengers per aircraft presented in Section 6.1. In
addition, adjustments were made in the low and high scenario to the additional services, through a
combination of delaying or removing service introduction in the low forecast, moving up service
introduction in the high forecast, and adjusting service frequencies, stimulation rates, and the
expansion or growth of services up or down in the high and low scenarios, respectively. These
adjustments impact the number of new international aircraft movements added, as well as the number
of flights (via E/D passenger demand) removed based on passengers no longer connecting over
domestic or Australian gateways to reach international destinations.54
Table 6-4: Quantitative Risk Analysis, Total Aircraft Movements – Runway Extension Scenario
Year
Total Aircraft Movements Traffic (Thousands)
Low Scenario (5
th Percentile)
Most Likely (Median Outcome)
High Scenario (95
th Percentile)
FY2015 (Actual)
93.0
FY2016 99.8 101.6 102.6
FY2017 99.5 103.5 106.5
FY2018 99.0 104.5 108.3
FY2019 99.2 105.6 110.5
FY2020 98.1 106.7 112.8
FY2025 96.5 113.5 127.2
FY2030 98.3 118.9 137.2
FY2035 101.0 125.2 147.9
FY2040 103.7 131.0 158.0
FY2045 106.1 137.0 168.0
FY2050 108.6 143.2 178.4
FY2055 111.1 149.5 188.5
FY2060 113.3 155.7 198.0
Long-Term Growth Rates
FY2015-2020 1.1% 2.7% 3.8%
FY2015-2025 0.4% 2.0% 3.1%
FY2015-2035 0.4% 1.5% 2.3%
FY2015-2045 0.4% 1.3% 2.0%
FY2015-2060 0.4% 1.1% 1.7%
Compared to the constrained BAU scenario, the runway extension scenario low forecast is only 2,500
movements higher than the BAU forecast (113,300 vs 110,800 in the BAU forecast). This small
difference is largely dependent on the reduced deployment of new long-haul services in the runway
54 Under the low scenario there would be fewer losses to domestic trunk and Australian traffic as fewer new
services are introduced and there is less capacity available (albeit under a situation of reduced O/D demand). Under the high scenario, the converse is true: increased capacity on long-haul services leads to more passengers shifting away from connecting itineraries using domestic trunk and Australian E/D gateway segments.
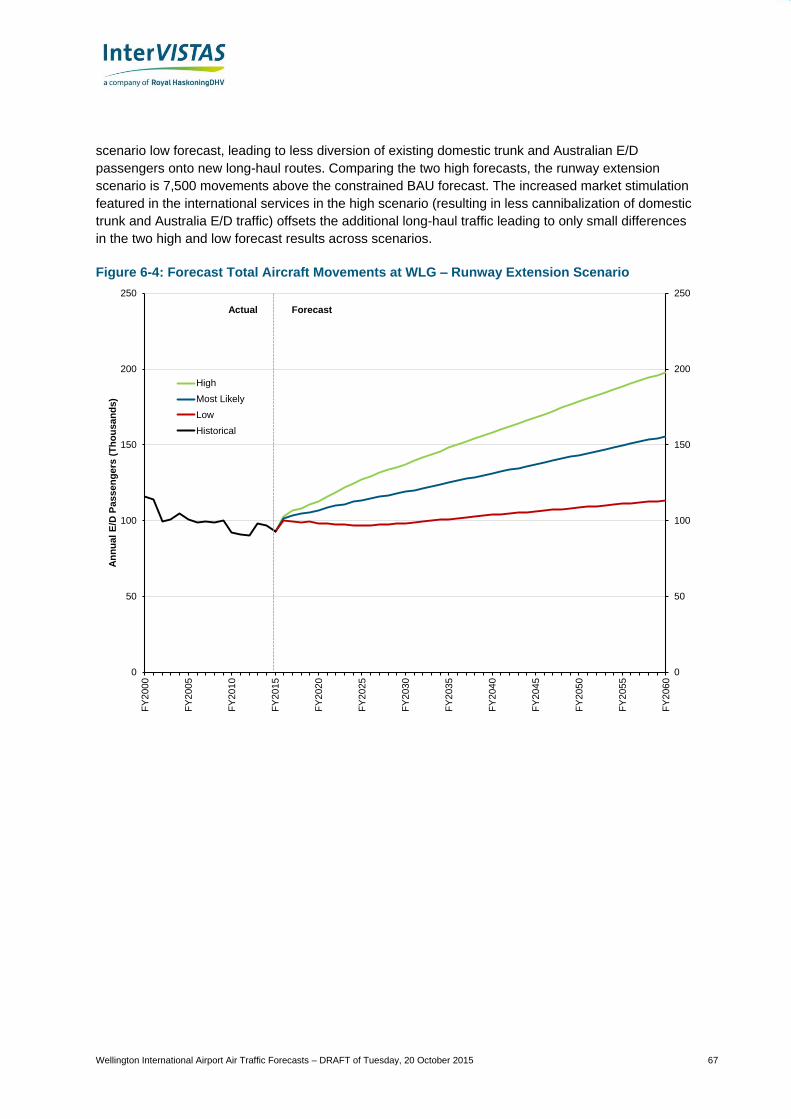
Wellington International Airport Air Traffic Forecasts – DRAFT of Tuesday, 20 October 2015 67
scenario low forecast, leading to less diversion of existing domestic trunk and Australian E/D
passengers onto new long-haul routes. Comparing the two high forecasts, the runway extension
scenario is 7,500 movements above the constrained BAU forecast. The increased market stimulation
featured in the international services in the high scenario (resulting in less cannibalization of domestic
trunk and Australia E/D traffic) offsets the additional long-haul traffic leading to only small differences
in the two high and low forecast results across scenarios.
Figure 6-4: Forecast Total Aircraft Movements at WLG – Runway Extension Scenario
0
50
100
150
200
250
0
50
100
150
200
250
FY
200
0
FY
200
5
FY
201
0
FY
201
5
FY
202
0
FY
202
5
FY
203
0
FY
203
5
FY
204
0
FY
204
5
FY
205
0
FY
205
5
FY
206
0
An
nu
al
E/D
Pa
ss
en
ge
rs (
Th
ou
sa
nd
s)
High
Most Likely
Low
Historical
Actual Forecast
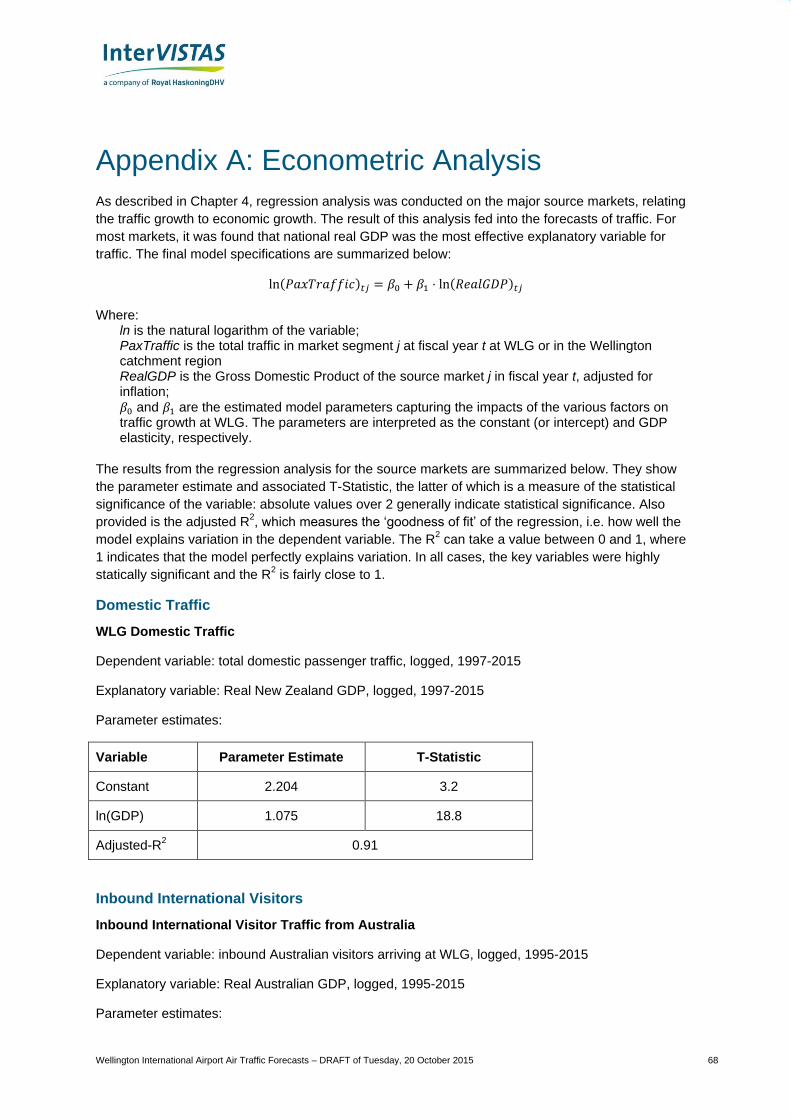
Wellington International Airport Air Traffic Forecasts – DRAFT of Tuesday, 20 October 2015 68
Appendix A: Econometric Analysis
As described in Chapter 4, regression analysis was conducted on the major source markets, relating
the traffic growth to economic growth. The result of this analysis fed into the forecasts of traffic. For
most markets, it was found that national real GDP was the most effective explanatory variable for
traffic. The final model specifications are summarized below:
ln(𝑃𝑎𝑥𝑇𝑟𝑎𝑓𝑓𝑖𝑐)𝑡𝑗 = 𝛽0 + 𝛽1 ⋅ ln(𝑅𝑒𝑎𝑙𝐺𝐷𝑃)𝑡𝑗
Where: ln is the natural logarithm of the variable; PaxTraffic is the total traffic in market segment j at fiscal year t at WLG or in the Wellington catchment region RealGDP is the Gross Domestic Product of the source market j in fiscal year t, adjusted for inflation; 𝛽0 and 𝛽1 are the estimated model parameters capturing the impacts of the various factors on traffic growth at WLG. The parameters are interpreted as the constant (or intercept) and GDP elasticity, respectively.
The results from the regression analysis for the source markets are summarized below. They show
the parameter estimate and associated T-Statistic, the latter of which is a measure of the statistical
significance of the variable: absolute values over 2 generally indicate statistical significance. Also
provided is the adjusted R2, which measures the ‘goodness of fit’ of the regression, i.e. how well the
model explains variation in the dependent variable. The R2 can take a value between 0 and 1, where
1 indicates that the model perfectly explains variation. In all cases, the key variables were highly
statically significant and the R2 is fairly close to 1.
Domestic Traffic
WLG Domestic Traffic
Dependent variable: total domestic passenger traffic, logged, 1997-2015
Explanatory variable: Real New Zealand GDP, logged, 1997-2015
Parameter estimates:
Variable Parameter Estimate T-Statistic
Constant 2.204 3.2
ln(GDP) 1.075 18.8
Adjusted-R2 0.91
Inbound International Visitors
Inbound International Visitor Traffic from Australia
Dependent variable: inbound Australian visitors arriving at WLG, logged, 1995-2015
Explanatory variable: Real Australian GDP, logged, 1995-2015
Parameter estimates:
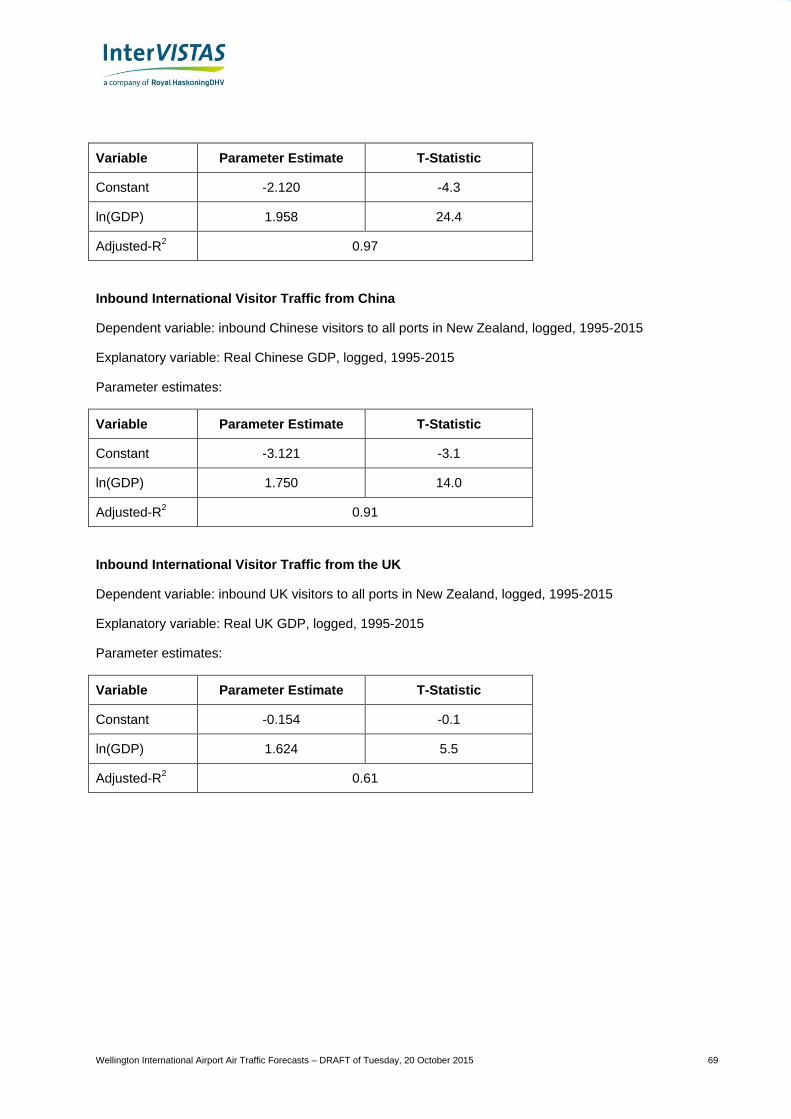
Wellington International Airport Air Traffic Forecasts – DRAFT of Tuesday, 20 October 2015 69
Variable Parameter Estimate T-Statistic
Constant -2.120 -4.3
ln(GDP) 1.958 24.4
Adjusted-R2 0.97
Inbound International Visitor Traffic from China
Dependent variable: inbound Chinese visitors to all ports in New Zealand, logged, 1995-2015
Explanatory variable: Real Chinese GDP, logged, 1995-2015
Parameter estimates:
Variable Parameter Estimate T-Statistic
Constant -3.121 -3.1
ln(GDP) 1.750 14.0
Adjusted-R2 0.91
Inbound International Visitor Traffic from the UK
Dependent variable: inbound UK visitors to all ports in New Zealand, logged, 1995-2015
Explanatory variable: Real UK GDP, logged, 1995-2015
Parameter estimates:
Variable Parameter Estimate T-Statistic
Constant -0.154 -0.1
ln(GDP) 1.624 5.5
Adjusted-R2 0.61
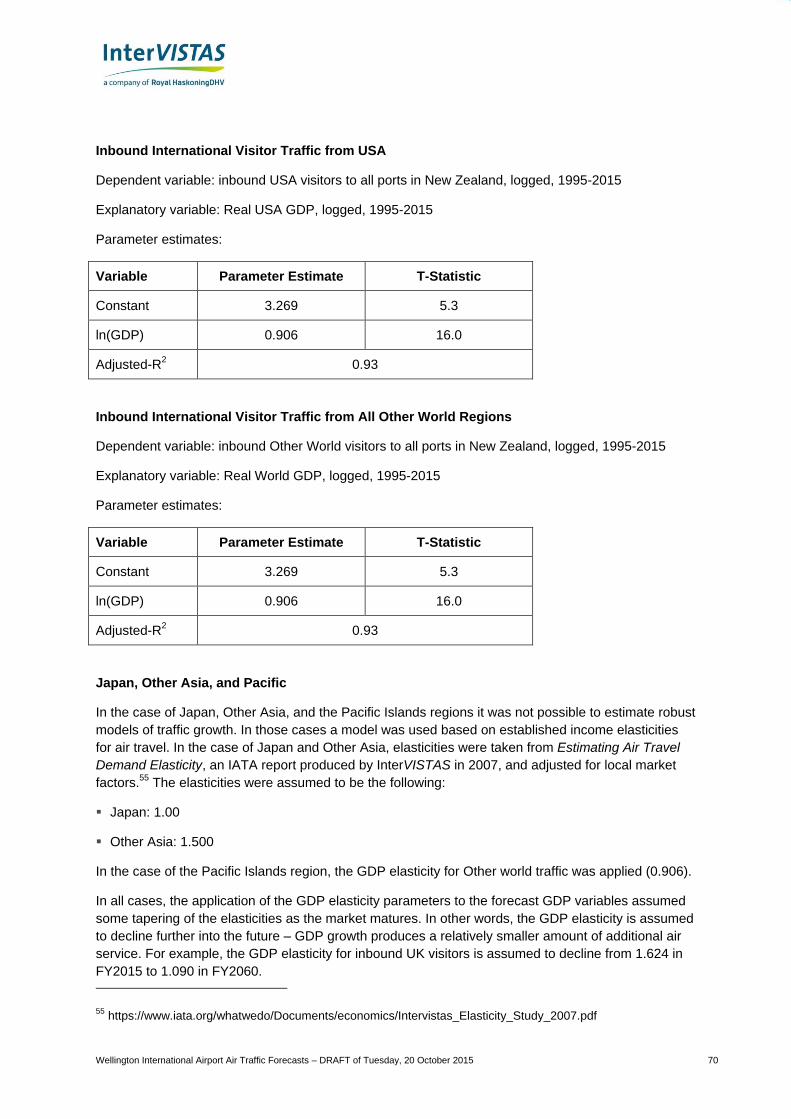
Wellington International Airport Air Traffic Forecasts – DRAFT of Tuesday, 20 October 2015 70
Inbound International Visitor Traffic from USA
Dependent variable: inbound USA visitors to all ports in New Zealand, logged, 1995-2015
Explanatory variable: Real USA GDP, logged, 1995-2015
Parameter estimates:
Variable Parameter Estimate T-Statistic
Constant 3.269 5.3
ln(GDP) 0.906 16.0
Adjusted-R2 0.93
Inbound International Visitor Traffic from All Other World Regions
Dependent variable: inbound Other World visitors to all ports in New Zealand, logged, 1995-2015
Explanatory variable: Real World GDP, logged, 1995-2015
Parameter estimates:
Variable Parameter Estimate T-Statistic
Constant 3.269 5.3
ln(GDP) 0.906 16.0
Adjusted-R2 0.93
Japan, Other Asia, and Pacific
In the case of Japan, Other Asia, and the Pacific Islands regions it was not possible to estimate robust
models of traffic growth. In those cases a model was used based on established income elasticities
for air travel. In the case of Japan and Other Asia, elasticities were taken from Estimating Air Travel
Demand Elasticity, an IATA report produced by InterVISTAS in 2007, and adjusted for local market
factors.55
The elasticities were assumed to be the following:
Japan: 1.00
Other Asia: 1.500
In the case of the Pacific Islands region, the GDP elasticity for Other world traffic was applied (0.906).
In all cases, the application of the GDP elasticity parameters to the forecast GDP variables assumed
some tapering of the elasticities as the market matures. In other words, the GDP elasticity is assumed
to decline further into the future – GDP growth produces a relatively smaller amount of additional air
service. For example, the GDP elasticity for inbound UK visitors is assumed to decline from 1.624 in
FY2015 to 1.090 in FY2060.
55 https://www.iata.org/whatwedo/Documents/economics/Intervistas_Elasticity_Study_2007.pdf
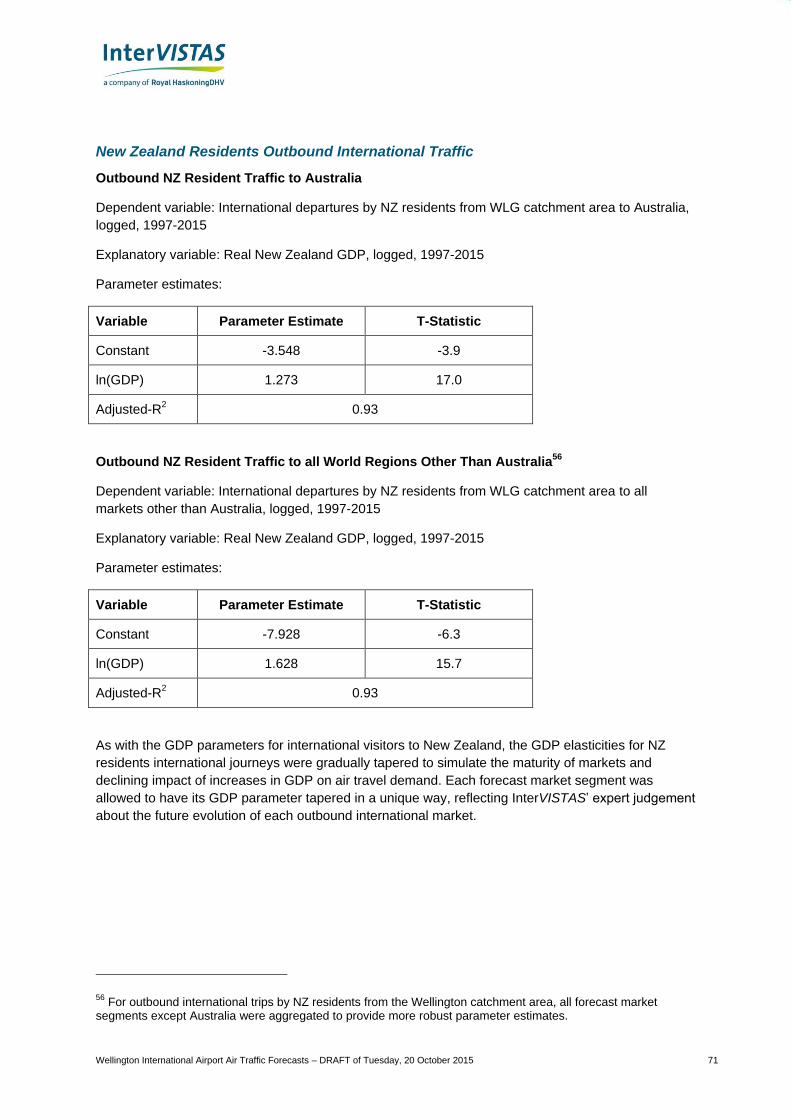
Wellington International Airport Air Traffic Forecasts – DRAFT of Tuesday, 20 October 2015 71
New Zealand Residents Outbound International Traffic
Outbound NZ Resident Traffic to Australia
Dependent variable: International departures by NZ residents from WLG catchment area to Australia,
logged, 1997-2015
Explanatory variable: Real New Zealand GDP, logged, 1997-2015
Parameter estimates:
Variable Parameter Estimate T-Statistic
Constant -3.548 -3.9
ln(GDP) 1.273 17.0
Adjusted-R2 0.93
Outbound NZ Resident Traffic to all World Regions Other Than Australia56
Dependent variable: International departures by NZ residents from WLG catchment area to all
markets other than Australia, logged, 1997-2015
Explanatory variable: Real New Zealand GDP, logged, 1997-2015
Parameter estimates:
Variable Parameter Estimate T-Statistic
Constant -7.928 -6.3
ln(GDP) 1.628 15.7
Adjusted-R2 0.93
As with the GDP parameters for international visitors to New Zealand, the GDP elasticities for NZ
residents international journeys were gradually tapered to simulate the maturity of markets and
declining impact of increases in GDP on air travel demand. Each forecast market segment was
allowed to have its GDP parameter tapered in a unique way, reflecting InterVISTAS’ expert judgement
about the future evolution of each outbound international market.
56 For outbound international trips by NZ residents from the Wellington catchment area, all forecast market
segments except Australia were aggregated to provide more robust parameter estimates.
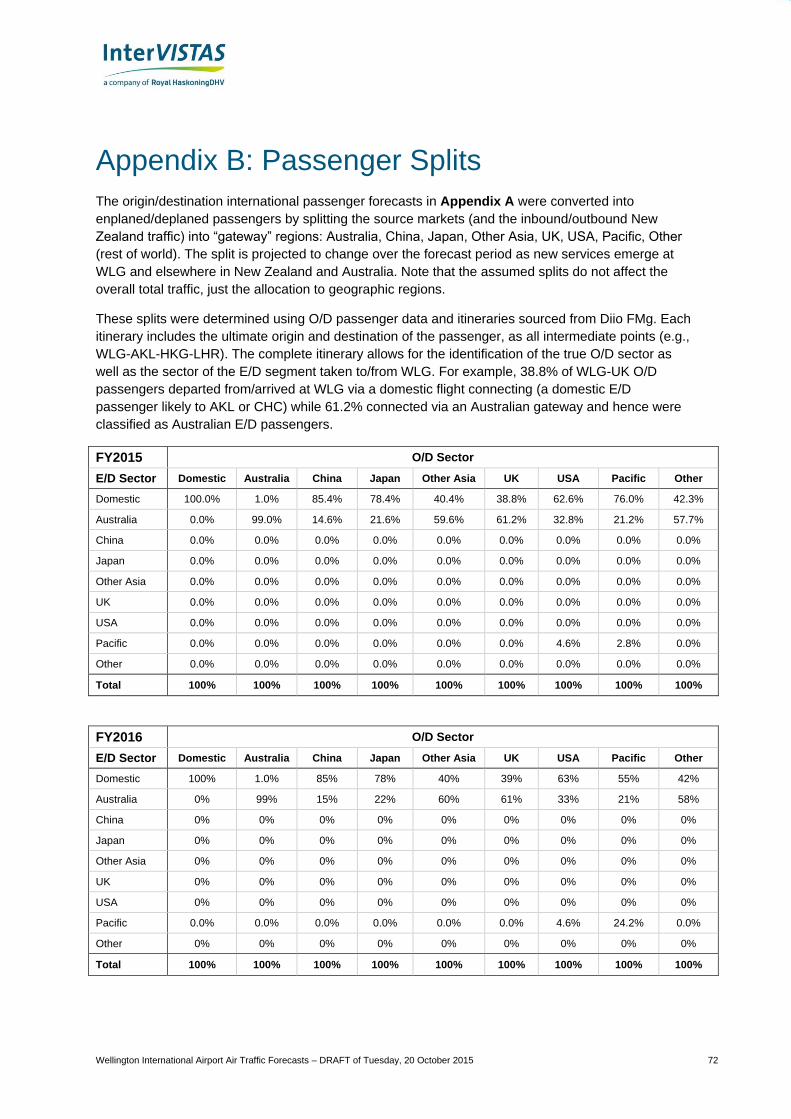
Wellington International Airport Air Traffic Forecasts – DRAFT of Tuesday, 20 October 2015 72
Appendix B: Passenger Splits
The origin/destination international passenger forecasts in Appendix A were converted into
enplaned/deplaned passengers by splitting the source markets (and the inbound/outbound New
Zealand traffic) into “gateway” regions: Australia, China, Japan, Other Asia, UK, USA, Pacific, Other
(rest of world). The split is projected to change over the forecast period as new services emerge at
WLG and elsewhere in New Zealand and Australia. Note that the assumed splits do not affect the
overall total traffic, just the allocation to geographic regions.
These splits were determined using O/D passenger data and itineraries sourced from Diio FMg. Each
itinerary includes the ultimate origin and destination of the passenger, as all intermediate points (e.g.,
WLG-AKL-HKG-LHR). The complete itinerary allows for the identification of the true O/D sector as
well as the sector of the E/D segment taken to/from WLG. For example, 38.8% of WLG-UK O/D
passengers departed from/arrived at WLG via a domestic flight connecting (a domestic E/D
passenger likely to AKL or CHC) while 61.2% connected via an Australian gateway and hence were
classified as Australian E/D passengers.
FY2015 O/D Sector
E/D Sector Domestic Australia China Japan Other Asia UK USA Pacific Other
Domestic 100.0% 1.0% 85.4% 78.4% 40.4% 38.8% 62.6% 76.0% 42.3%
Australia 0.0% 99.0% 14.6% 21.6% 59.6% 61.2% 32.8% 21.2% 57.7%
China 0.0% 0.0% 0.0% 0.0% 0.0% 0.0% 0.0% 0.0% 0.0%
Japan 0.0% 0.0% 0.0% 0.0% 0.0% 0.0% 0.0% 0.0% 0.0%
Other Asia 0.0% 0.0% 0.0% 0.0% 0.0% 0.0% 0.0% 0.0% 0.0%
UK 0.0% 0.0% 0.0% 0.0% 0.0% 0.0% 0.0% 0.0% 0.0%
USA 0.0% 0.0% 0.0% 0.0% 0.0% 0.0% 0.0% 0.0% 0.0%
Pacific 0.0% 0.0% 0.0% 0.0% 0.0% 0.0% 4.6% 2.8% 0.0%
Other 0.0% 0.0% 0.0% 0.0% 0.0% 0.0% 0.0% 0.0% 0.0%
Total 100% 100% 100% 100% 100% 100% 100% 100% 100%
FY2016 O/D Sector
E/D Sector Domestic Australia China Japan Other Asia UK USA Pacific Other
Domestic 100% 1.0% 85% 78% 40% 39% 63% 55% 42%
Australia 0% 99% 15% 22% 60% 61% 33% 21% 58%
China 0% 0% 0% 0% 0% 0% 0% 0% 0%
Japan 0% 0% 0% 0% 0% 0% 0% 0% 0%
Other Asia 0% 0% 0% 0% 0% 0% 0% 0% 0%
UK 0% 0% 0% 0% 0% 0% 0% 0% 0%
USA 0% 0% 0% 0% 0% 0% 0% 0% 0%
Pacific 0.0% 0.0% 0.0% 0.0% 0.0% 0.0% 4.6% 24.2% 0.0%
Other 0% 0% 0% 0% 0% 0% 0% 0% 0%
Total 100% 100% 100% 100% 100% 100% 100% 100% 100%
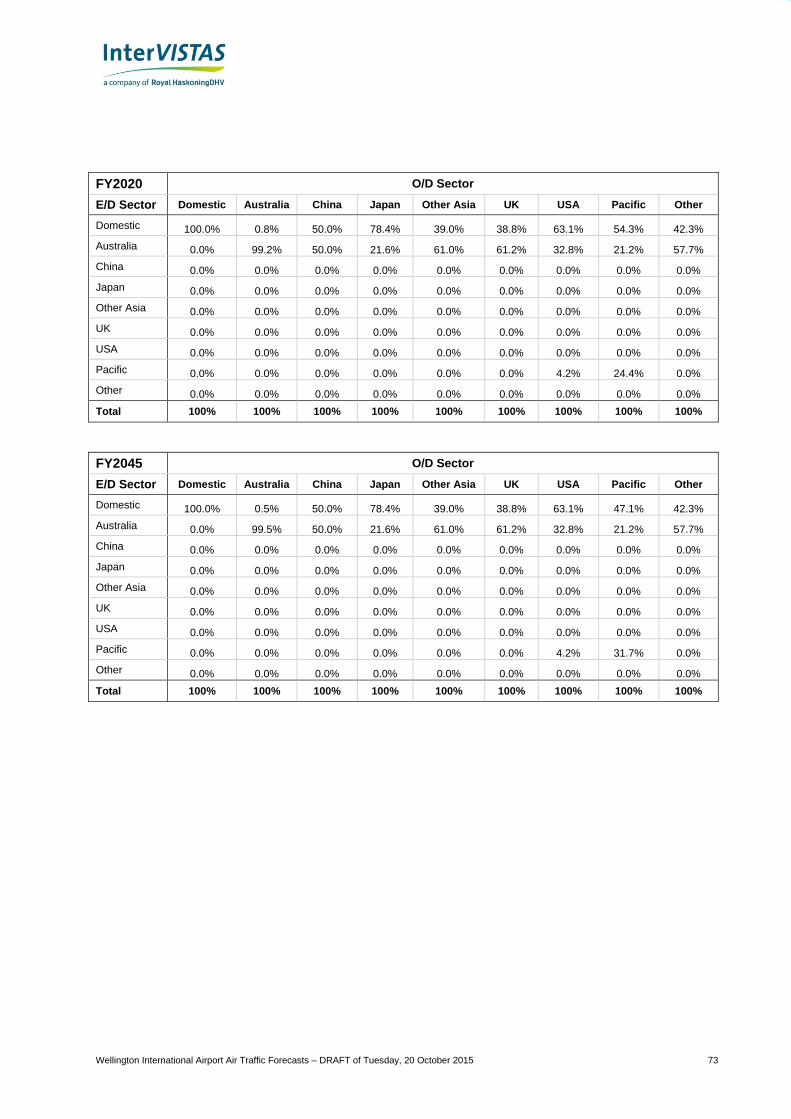
Wellington International Airport Air Traffic Forecasts – DRAFT of Tuesday, 20 October 2015 73
FY2020 O/D Sector
E/D Sector Domestic Australia China Japan Other Asia UK USA Pacific Other
Domestic 100.0% 0.8% 50.0% 78.4% 39.0% 38.8% 63.1% 54.3% 42.3%
Australia 0.0% 99.2% 50.0% 21.6% 61.0% 61.2% 32.8% 21.2% 57.7%
China 0.0% 0.0% 0.0% 0.0% 0.0% 0.0% 0.0% 0.0% 0.0%
Japan 0.0% 0.0% 0.0% 0.0% 0.0% 0.0% 0.0% 0.0% 0.0%
Other Asia 0.0% 0.0% 0.0% 0.0% 0.0% 0.0% 0.0% 0.0% 0.0%
UK 0.0% 0.0% 0.0% 0.0% 0.0% 0.0% 0.0% 0.0% 0.0%
USA 0.0% 0.0% 0.0% 0.0% 0.0% 0.0% 0.0% 0.0% 0.0%
Pacific 0.0% 0.0% 0.0% 0.0% 0.0% 0.0% 4.2% 24.4% 0.0%
Other 0.0% 0.0% 0.0% 0.0% 0.0% 0.0% 0.0% 0.0% 0.0%
Total 100% 100% 100% 100% 100% 100% 100% 100% 100%
FY2045 O/D Sector
E/D Sector Domestic Australia China Japan Other Asia UK USA Pacific Other
Domestic 100.0% 0.5% 50.0% 78.4% 39.0% 38.8% 63.1% 47.1% 42.3%
Australia 0.0% 99.5% 50.0% 21.6% 61.0% 61.2% 32.8% 21.2% 57.7%
China 0.0% 0.0% 0.0% 0.0% 0.0% 0.0% 0.0% 0.0% 0.0%
Japan 0.0% 0.0% 0.0% 0.0% 0.0% 0.0% 0.0% 0.0% 0.0%
Other Asia 0.0% 0.0% 0.0% 0.0% 0.0% 0.0% 0.0% 0.0% 0.0%
UK 0.0% 0.0% 0.0% 0.0% 0.0% 0.0% 0.0% 0.0% 0.0%
USA 0.0% 0.0% 0.0% 0.0% 0.0% 0.0% 0.0% 0.0% 0.0%
Pacific 0.0% 0.0% 0.0% 0.0% 0.0% 0.0% 4.2% 31.7% 0.0%
Other 0.0% 0.0% 0.0% 0.0% 0.0% 0.0% 0.0% 0.0% 0.0%
Total 100% 100% 100% 100% 100% 100% 100% 100% 100%

Prepared by
InterVISTAS Consulting Inc.
Airport Square – Suite 550
1200 West 73rd
Avenue
Vancouver, BC
Canada V6P 6G5
Telephone: +1-604-717-1800
Facsimile: +1-604-717-1818
www.intervistas.com