chapter 14 selection of roads for pre-feasibility study · 2010-04-26 · chapter 14 selection of...
TRANSCRIPT

CHAPTER 14
SELECTION OF ROADS FOR PRE-FEASIBILITY STUDY 14.1 SELECTION CRITERIA Selection Criteria of roads for pre-feasibility study was established as follows;
a) Implementation priority shall be high, i.e. within the 10th ranking.
b) Roads shall be located in the areas with less security problems, so that various surveys necessary for pre-F/S can be safely undertaken.
c) Roads which can be a model project for the agri-fishery development support.
d) Road projects which can be implemented easily and fast, i.e. no ROW acquisition, no serious environmental impacts and easy for funding (or project scale shall be reasonable for funding).
14.2 PROPOSED ROADS FOR PRE-FEASIBILITY STUDY
Based on the selection criteria, the following two (2) roads were proposed for pre-feasibility study due mainly to criteria b) above; Pinaring - Simsiman Road
Tamontaka-Tapian Road Location of 2 roads is shown in Figure 14.2-1. Characteristics of two roads are as follows;
1) Pinaring - Simsiman Road Provincial Road with gravel surface. To convert a Provincial Road to a
national road standard is one of the major strategies to improve road density in the area.
Implementation priority is rated 8th among 36 projects. The road serves for wide rice fields, corn fields and other agricultural land
use areas, thus this project can be a good model road development which vitally supports an agricultural development, particularly for rice and corn production increase.
Project area has less security problem. No ROW and no relocation of families is required.
14 - 1

Project cost was estimated at 513 Million Pesos which is reasonable scale for funding.
Seven (7) sub-projects under ARMM Social Fund Project have been
implemented along the road. Synergy effect of this road project with ARMM Social Fund Sub-projects can be expected.
2) Tamontaka-Tapian Road
Provincial Road with gravel surface. To convert a Provincial Road to a
national road standard is one of the major strategies to improve road density in the area.
Implementation priority is ranked 9th among 36 projects. The road serves for wide corn and coconut fields. The project can be a
good model of road development which vitally supports an agricultural development, particularly corn and coconut production increase.
Project area has less security problems. No ROW acquisition and no relocation of families required. Project cost was estimated at 510 Million Pesos which is reasonable scale
for funding. One sub-project under ARMM Social Fund Project was implemented. The road passes along the nice beach. Some beach resort facilities have
been developed, thus the project provide access to beach leisure facilities for citizens of Cotabato City.
14 - 2

FIG
UR
E 1
4.2-
1 L
OC
AT
ION
MA
P O
F O
BJE
CT
IVE
RO
DS
FO
R P
RF
E-F
/S
14 - 3

CHAPTER 15
PRE-FEASIBILITY STUDY ON SELECTED PRIORITY ROAD 15.1 OBJECTIVES OF THE PROJECT Pinaring-Simsiman Road
To provide an all-weather road to assure transportation of people and agricultural in-puts and out-puts throughout a year for agricultural development.
To provide an easier access to basic social and health facilities which are
mostly located at Cotabato City. To provide an alternative route to Cotabato City – Davao City Road.
To achieve higher agricultural production, particularly palay and corn
which will increase farmers’ income and eventually contribute to poverty reduction
Tamontaka-Tapian Road
To provide an all-weather road to assure transportation of people and agriculture and fishery in-puts and out-puts throughout a year for agri-fishery development.
To provide an easier access to basic social and health facilities which are
mostly located at Cotabato City. To provide an easier access to beach resorts which are major recreation
spots for Cotabato City citizens.
15.2 OUTLINE OF THE PROJECT Pinaring-Simsiman Road
Road length : 20.1 km. Already paved section by PCC pavement : 1.7 km. Section to be improved : 18.4 km. Number of bridges : 5 bridges Bridges to be maintained : 4 bridges Bridge to be replaced : 1 bridge
(Salam Bridge No. 1, L = 23 m)
Road condition : Gravel section becomes frequently impassable after heavy rain
Barangay roads to be improved : 13 Barangay Roads (L = 42 km.)
15-1

Tamontaka-Tapian Road
Road length : 20.4 km. Already paved section by PCC pavement : 4.4 km. Section to be improved : 16.0 km. Number of bridges : 6 bridges Bridges to be maintained : 5 bridges Bridge to be replaced : 1 bridge
(Salam Bridge No. 1, L = 25 m)
Road condition : Gravel section becomes frequently impassable after heavy rain
Barangay roads to be improved : 20 Barangay Roads (L = 24 km.)
15.3 DESIGN POLICIES Design policies adopted were as follows;
New road right-of-way acquisition shall be avoided as much as possible.
Existing road alignment, both horizontal and vertical alignments, shall be followed as much as possible to achieve above policy. Design standards shall be relaxed where required to achieve this policy.
Existing PCC pavement sections and bridges shall be utilized as much as
possible when they are judged to perform their functions. 5.4 TOPOGRAPHIC AND GEOLOGICAL CONDITIONS
Pinaring-Simsiman Road is passing through rolling terrain with 34 m elevation difference at the maximum. As for the soil condition, it is primarily composed of loose alluvial clay to the depth of 30 m except for Boring No-4. (See Figure 15.4-1). Tamontaka-Tapian Road is passing through a flood plane of Tamontaka River for the first 7 km and the rest is passing along Moro Gulf coastal line at bottom of Mt. Cabalalan. Terrain along the road is relatively that with elevation difference of 19 m at the maximum. According to boring tests conducted under the Study at the location of existing bridges, loose alluvium has been observed from the top to 25 to 30 m in depth (See Figure 15.4-2).
15-2

FIGURE-15.4-1 SOIL PROFILE OF PINARING-SIMSIMAN ROAD
FIGURE-15.4-2 SOIL PROFILE OF TAMONTAKA-TAPIAN ROAD
15.5 DESIGN CRITERIA 15.5.1 Geometric Design Standards
Based on DPWH’s Design Guidelines, Criteria and Standards, the geometric design standards were established as shown in Table 15.5.1-1.
15-3

TABLE 15.5.1-1 GEOMETRIC DESIGN STANDARDS
Unit
Main Road with ADT400-1000
at Rolling (at Mountainous)
Barangay Road with ADT 200 or less
at Rolling (at Mountainous)
Design Speed kph 60 (40) 40 (30)
No. of Lanes Lane 2 1
Lane Width M 3.05x2 4.0
Shoulder Width m 1.0*1 1.0
Min. Radius m 120 (50)*2 55 (30) Horizontal Alignment Max. Super elevation % 6 % -
Max. Gradient % 6% (8%)*3 8% (10%)
Sag m 1000 (450) 450 (250) Vertical Alignment Min. Radius
Crest m 1400 (450) 450 (250)
Min. Stopping Sight Distance m 70 (40) 40 (40)
PCC % 1.5% - Pavement Cross Fall Gravel % - 2.5% Source: Design Guidelines, Criteria and Standards, BOD, DPWH
*1: 0.5m as an exception was applied for residential area. *2: Minimum R=30m as an exception was applied for the section where ROW was limited. *3: i=9.75% as an exception was applied for the section where ROW was limited
15.5.2 Bridge Design Criteria
Bridge design criteria adopted were as follows;
(a) Typical Bridge Cross Section of the Bridge
DPWH Standard cross section of bridge shall be applied as below.
CROSS SECTION OF TWO-LANE
BRIDGES
(b) Codes and Standards
AASHTO Standard Specifications for Highway Bridges, Sixteenth Edition, 1996.
National Structural Code of the Philippines, Volume II, Bridges, 2nd Edition, 1997.
15-4

Specifications for Highway Bridges, Part IV, 2002, Japan Road
Association. Seismic design shall be done in accordance with the provisions of
Division I-A “Seismic Design” of the 1996 AASHTO Standard Specification for Highway Bridges and DPWH Department Order No. 75, Series of 1992, re: DPWH Advisory for Seismic Design of Bridges
(c) Design Loads and Loading Combinations
Dead Load Reinforced Concrete 24.0 kN/m3
Plain Concrete 23.0 kN/m3
Steel 77.0 kN/m3
Earth, compacted 19.0 kN/m3
Superimposed Dead Load
Asphalt wearing course 22.5 kN/m3. Earth Pressure Lateral Active Soil Pressures = by Mononobe-Okabe method
Max. Passive pressure = 239kN/m2 for seat type abutments = 370kN/m2 for diaphragm type abutments
Group I Load Combination
Group VII Load Combination (Earthquake)
Soil internal * angle of friction φ = 30°
Wall to soil friction angle δ = 0°
(A = 0.40) 0.493
(A = 0.45) 0.518
(A = 0.47) 0.529
(A = 0.50) 0.546
Active earth pressure 0.333
(A = 0.55) 0.575
Live load surcharge 0.6m of soil None * - to be verified from soil laboratory test results
15-5

Live Load
Live loading shall be AASHTO MS18 (HS20-44) Standard Truck or Lane Loading as shown in Figure 15.5.2-1.
CLEARANCE ANDLOAD LANE WIDTH
WHEELLOAD
WHEELLOAD
36 kN 144 kN 144 kN
18 kN 72 kN 72 kN
AXLE LOAD
WHEEL LOAD
MS-18 TRUCK LOAD
MS-18 LANE LOADING
80KN FOR MOMENT116 KN FOR SHEAR
UNIFORM LOAD 9.40KN PER LINEAR METER OF LOAD LANE
4.27m 4.27 to 9.15m
3.05m
1.8m
FIGURE 15.5.2-1 MS-18 LIVE LOAD Sidewalk Loading
Sidewalks and deck girders = 4.07 kN/m2 of sidewalk area. Temperature Load Thermal effects = ± 12.5°C Stream Forces P = 515 KV2
Where: P = pressure in Pa from the flowing water V = velocity of water in m/sec K = 2/3 for circular piers Accidental Loads At bridge railings = 44.5 kN Seismic Loads
In accordance with the AASHTO Standard Specifications for Highway Bridges, 17th Edition, 1996, Division I-A, Seismic Design, seismic
15-6

acceleration - adoption of 0.40g in the design shall be mandatory as per Fig 21.3 Seismic Zone Map of the Philippines, NSCP, Volume 2 Bridges, 2nd Edition, 1997.
Material Properties
i) Structural Steel
All structural steel shall conform to JRA SMA 400W and SMA 490W with a minimum yield strength, fy = 248 Mpa, 355 Mpa, respectively.
ii) Concrete
Description Concrete
Class fIc
(MPa) Max. Size of
Aggregate (mm) Thin Reinforced Sections, Parapet Railings, Posts, Curb and Sidewalk C 21 12.5
Precast RC Pile AA 28 20 Substructure and Superstructure A1 21 20
28 (at transfer) PCDG Girders P
35 (in service)
20
Lean Concrete - 17 38
Bored Piles, Concrete Slab on Steel Deck Girder A2 24 20
iii) Reinforcing Steel Minimum yield strength fy = 275 Mpa (Grade 40) ASTM A 615 iv) Prestressing Steel
Ultimate strength Fu = 1860 Mpa (Grade 270) ASTM A416 v) Elastomeric Bearing Pads
Elastomeric bearing pads = 100% virgin chloroprene, hardness 60 According to the requirements as prescribed in the Revised DPWH Standard Specification for Elastomeric Bearings, DPWH D.O. No. 25, Series of 1997.
Vertical Clearance ( Free Board Allowance )
The vertical clearance (FBA) between the Maximum Flood Water Level (MFWL) and the soffit of the superstructure shall not be less than 1.00 meter (without debris) and 1.50 meter (with debris).
15-7
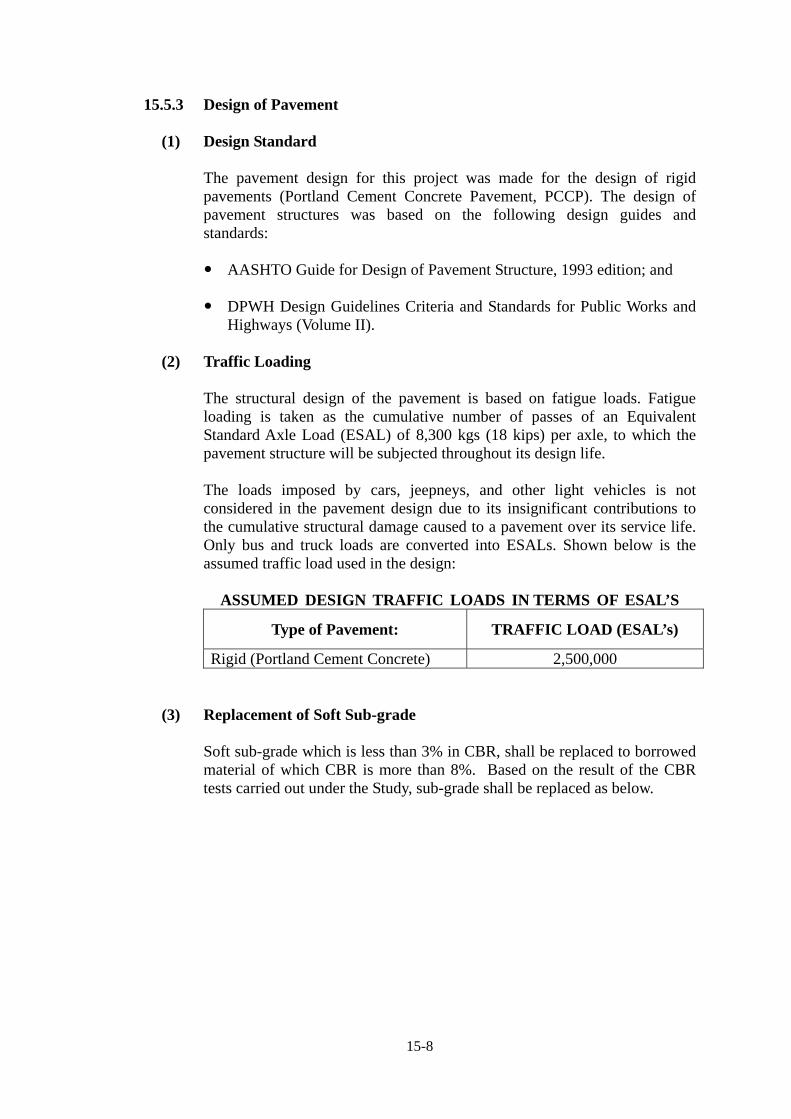
15.5.3 Design of Pavement (1) Design Standard
The pavement design for this project was made for the design of rigid pavements (Portland Cement Concrete Pavement, PCCP). The design of pavement structures was based on the following design guides and standards:
AASHTO Guide for Design of Pavement Structure, 1993 edition; and DPWH Design Guidelines Criteria and Standards for Public Works and
Highways (Volume II). (2) Traffic Loading
The structural design of the pavement is based on fatigue loads. Fatigue loading is taken as the cumulative number of passes of an Equivalent Standard Axle Load (ESAL) of 8,300 kgs (18 kips) per axle, to which the pavement structure will be subjected throughout its design life.
The loads imposed by cars, jeepneys, and other light vehicles is not considered in the pavement design due to its insignificant contributions to the cumulative structural damage caused to a pavement over its service life. Only bus and truck loads are converted into ESALs. Shown below is the assumed traffic load used in the design:
ASSUMED DESIGN TRAFFIC LOADS IN TERMS OF ESAL’S
Type of Pavement: TRAFFIC LOAD (ESAL’s)
Rigid (Portland Cement Concrete) 2,500,000
(3) Replacement of Soft Sub-grade
Soft sub-grade which is less than 3% in CBR, shall be replaced to borrowed material of which CBR is more than 8%. Based on the result of the CBR tests carried out under the Study, sub-grade shall be replaced as below.
15-8
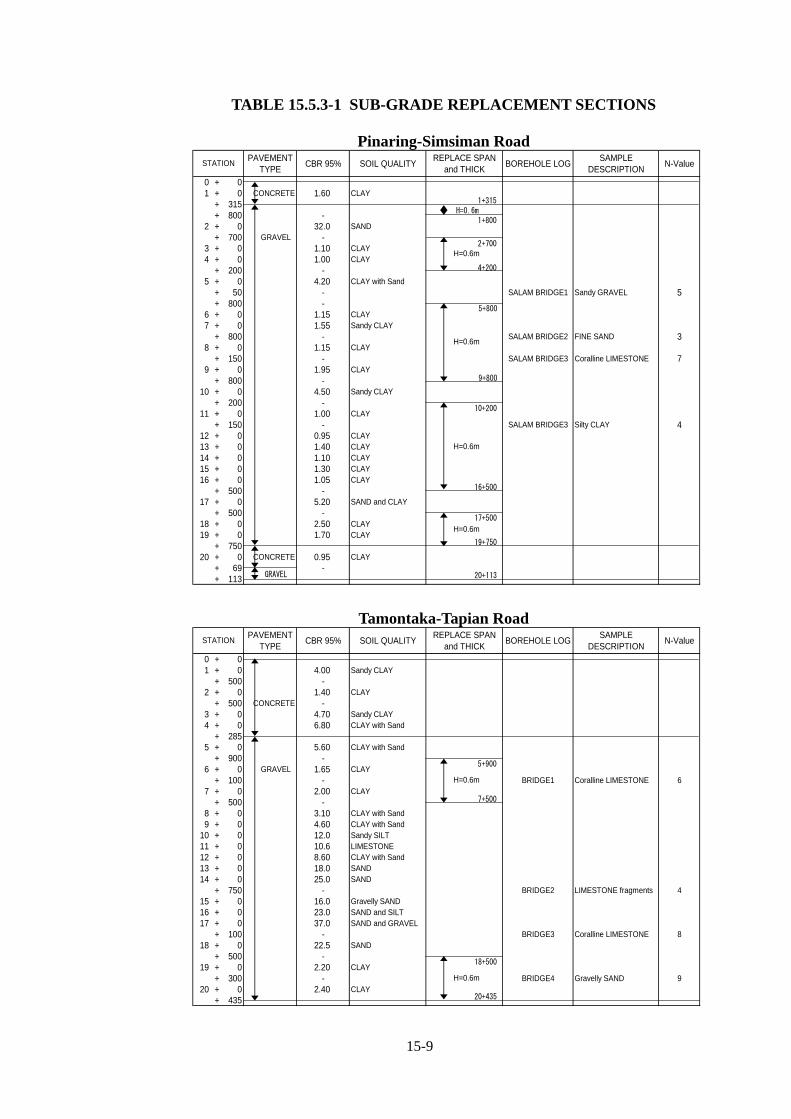
TABLE 15.5.3-1 SUB-GRADE REPLACEMENT SECTIONS
Pinaring-Simsiman Road PAVEMENT
TYPECBR 95% SOIL QUALITY
REPLACE SPANand THICK
BOREHOLE LOGSAMPLE
DESCRIPTIONN-Value
0 + 01 + 0 CONCRETE 1.60 CLAY
+ 315+ 800 -
2 + 0 32.0 SAND+ 700 GRAVEL -
3 + 0 1.10 CLAY4 + 0 1.00 CLAY
+ 200 -5 + 0 4.20 CLAY with Sand
+ 50 - SALAM BRIDGE1 Sandy GRAVEL 5+ 800 -
6 + 0 1.15 CLAY7 + 0 1.55 Sandy CLAY
+ 800 - SALAM BRIDGE2 FINE SAND 38 + 0 1.15 CLAY
+ 150 - SALAM BRIDGE3 Coralline LIMESTONE 79 + 0 1.95 CLAY
+ 800 -10 + 0 4.50 Sandy CLAY
+ 200 -11 + 0 1.00 CLAY
+ 150 - SALAM BRIDGE3 Silty CLAY 412 + 0 0.95 CLAY13 + 0 1.40 CLAY14 + 0 1.10 CLAY15 + 0 1.30 CLAY16 + 0 1.05 CLAY
+ 500 -17 + 0 5.20 SAND and CLAY
+ 500 -18 + 0 2.50 CLAY19 + 0 1.70 CLAY
+ 75020 + 0 CONCRETE 0.95 CLAY
+ 69 -+ 113
H=0.6m
STATION
H=0.6m
H=0.6m
H=0.6m
GRAVEL
1+315
1+800
2+700
4+200
5+800
9+800
10+200
16+500
17+500
20+113
H=0.6m
19+750
Tamontaka-Tapian Road PAVEMENT
TYPECBR 95% SOIL QUALITY
REPLACE SPANand THICK
BOREHOLE LOGSAMPLE
DESCRIPTIONN-Value
0 + 01 + 0 4.00 Sandy CLAY
+ 500 -2 + 0 1.40 CLAY
+ 500 CONCRETE -3 + 0 4.70 Sandy CLAY4 + 0 6.80 CLAY with Sand
+ 2855 + 0 5.60 CLAY with Sand
+ 900 -6 + 0 GRAVEL 1.65 CLAY
+ 100 - BRIDGE1 Coralline LIMESTONE 67 + 0 2.00 CLAY
+ 500 -8 + 0 3.10 CLAY with Sand9 + 0 4.60 CLAY with Sand
10 + 0 12.0 Sandy SILT11 + 0 10.6 LIMESTONE12 + 0 8.60 CLAY with Sand13 + 0 18.0 SAND14 + 0 25.0 SAND
+ 750 - BRIDGE2 LIMESTONE fragments 415 + 0 16.0 Gravelly SAND16 + 0 23.0 SAND and SILT17 + 0 37.0 SAND and GRAVEL
+ 100 - BRIDGE3 Coralline LIMESTONE 818 + 0 22.5 SAND
+ 500 -19 + 0 2.20 CLAY
+ 300 - BRIDGE4 Gravelly SAND 920 + 0 2.40 CLAY
+ 435
H=0.6m
H=0.6m
STATION
5+900
7+500
18+500
20+435
15-9

(4) Pavement Structural Design Parameters
Design parameters and variables used for pavement thickness calculations are shown in Table 15.5.3-2
TABLE 15.5.3-2 DESIGN PARAMETERS
1. Design Life 20 years 2. Design Traffic 2,500,000 ESAL 3. Serviceability Index 2.5 4. Reliability 80%
Standard Normal Deviate -0.8416 Overall Standard Deviation 0.39
5. Subgrade Strength Design CBR 1% / 4% Note: For road sections wherein subgrade CBR values are less than 4%, the weak subgrade material is proposed to be removed and then replaced by selected borrow for topping, having a minimum CBR value equal to 8% at 95% MDD. Thickness of the selected borrow for topping is 600 mm.
6. Concrete Properties Compressive Strength 4000 psi Flexural Strength / Modulus of rupture
630 psi
Elastic Modulus 3.6 E+06 psi 7. Drainage Coefficient 1.1 8. Load Transfer Coefficient 3.2
(5) Recommended Pavement Structures
Since DPWH-ARMM has less experience on maintenance of asphalt pavement, PCC pavement was recommended for the project. Recommended pavement thickness was as follows;
PCC Pavement - - - - - - 230 mm Aggregate Sub-base Course - - - - - - 200 mm
15-10

(6) Design Calculations
(a) Design CBR = 4 Design CBR= 4% : from TP results
MR =w18 = 2.50E+06
6,000
(W18 = predicted number of 80 kN (18,000 lb.) ESALs)log10 w18 = 6.3979 *Design Criteria
R = 80.0% ReliabilityZR =So =
PSI =
Pt =
-0.8416 standard normal deviate0.39
2.5
2.0 Assumed Sub Base Course Thickness = 150 mm.630 (psi) 632 modulus of rupture 5.9S'c = 1 in.
4000 (psi) concrete compressive strenf'c= gth3.60E+06 (psi) Note: Elastic modulus of PCC 51Ec = 0 (psi)
1.1 drainaCd = ge coefficient 3.5 MPa3.2 load factor efficiency
k = (pci) 400 modulus of subJ =
310 grade reaction1.0
k eff.= 130 (pci) Effective modulus of subL.S. =
grade reaction
Equation
D = 7.23 inches of PCCP183.58 mm of PCCP
Determination of Subbase ThicknessDesign Subgrade CBR = 4.0% Subbase CBR = 25%
w18 = 2.50E+06 (Assumed Traffic Load) w18 = 2.50E+06 (Assumed Traffic Load)log w18 = 6.3979 log w18 = 6.3979
R = 80.0% R = 80.0%
ZR = -0.8416 ZR = -0.8416So = 0.39 So = 0.39
dPSI = 2.0 dPSI = 2.0MR = 6,000 MR = 20,000
SN = 3.8919 SN = 2.5209
Original Subgrade SN = 3.8919 Subbase Layer:Subbase SN = 2.5209 a = 0.11 m = 1.2
SN = 1.3710 D = 10.39 inches263.82 mm.
use D = 265 mm.
230 mm PCCP, 200 mm Base Course
D a m SNinches mm
9.06 230 0.44 1.0 3.9843 230 mm0.00 0 0.14 1.1 0.0000 0 mm5.91 150 0.11 1.1 0.7145 200 mm15 4.6988 4.6988 430 mm
Design Subgrade CBR = 4%
FINAL PAVEMENTSTRUCTURE
New layer:
Item
PCCP Layer Crushed Aggregate Base Course Aggregate Subbase Course
Total
SNf
(required)
Overall standard deviation, combined standard errorof the traffic prediction and performance predictionDifference between the initial design serviceabilityindex, po, and the design terminal serviceability index,
Subgrade Level
230 mm Portland Cement Concrete Pavement
200 mm Crushed Aggregate Base Course
430 mm Total Pavement Thickness
15-11

(b) Design CBR = 1 Design CBR= 1% : Weak Soil Subgrade
MR = 1,500
(W18 = predicted number of 80 kN (18,000 lb.) ESALs)w18 = 2.50E+06
log10 w18 = 6.3979 *Design Criteria80.0% Reliabilit R = y
ZR = -0.8416 standard normal deviateSo = Overall standard deviation, combined standard error0.39
PSI =of the traffic prediction and performance predictionDifference between the initial design serviceability2.5
Pt = 2.0 Assumed Sub Base Course Thickness = 150 mm.630 (psi) 632 modulus of ruS'c = pture 5.91 in.
4000 (psi) concrete comf'c= pressive strength3.60E+06 (psi) Note: Elastic modulus of PCC 51Ec = 0 (psi)
1.1 drainaCd = ge coefficient 3.5 MPa3.2 load factor efficiency
k = (pci) 400 modulus of subJ =
g80 rade reaction1.0
k eff.= 0 (pci) Effective modulus of subL.S. =
grade reaction
Equation
D = 8.69 inches of PCCP220.81 mm of PCCP
PRELIMINARY PAVEMENT STRUCTURE225.00
use: PCCP 230 mm
Determination of Subbase Thicknessesign Subgrade CBR = 1.0% Subbase CBR = 25%
w18 = 2.50E+06 (Assumed Traffic Load) w18 = 2.50E+06 (Assumed Traffic Load)log w18 = 6.3979 log w18 = 6.3979
R = 80.0% R = 80.0%
ZR = -0.8416 ZR = -0.8416
So = 0.39 So = 0.39
dPSI = 2.0 dPSI = 2.0
MR = 1,500 MR = 20,000
SN = 6.0790 SN = 2.5209
Original Subgrade SN = 6.0790 Subbase Layer:Subbase SN = 2.5209 a = 0.11 m = 1.2
SN = 3.5580 D = 26.95 inches684.65 mm.
use D = 685 mm.
200 mm PCCP, 200 mm Base Course
D a m SNinches mm
9.06 230 0.44 1.0 3.9843 230 mm7.87 200 0.11 1.1 0.9528 200 mm
23.36 593 0.075 1.1 1.9272 600 mm40 6.8642 6.8642 1030 mm
index, po, and the design terminal serviceability index,
Total
SNf
(required)
FINAL PAVEMENT
STRUCTURE
New layer:
Item
Aggregate Subbase CourseSelected Borrow (min. CBR=8%)
PCCP Layer
Subgrade Level
230 mm Portland Cement Concrete Pavement
200 mm Crushed Aggregate Base Course
Existing ground
600 mm Selected Borrow, CBR>8%
15-12

15.5.4 Typical Cross Sections
A normal cross fall of 1.5% was used for the traveled way all throughout the PCC pavement and 3.0% shoulders. Superelevation was computed in accordance with the design guidelines used for this project.
The angles of slopes are based on the stability requirements but the designer used a slope 1.5:1 for embankment and cut considering there was a limited space. Typical cross-sections are shown in Figure 15.5.4-1.
i) Embanked Section ii) Cut and Embanked Section
iii) Super elevation Section iv) Residential Area Section
v) Over-flowed Section Note; Replacement of Sub-grade shall be applied only CBR<3.0%
FIGURE 15.5.4-1 TYPICAL CROSS-SECTIONS OF THE ROAD
15-13

15.6 DRAINAGE DESIGN 15.6.1 Hydrological Analysis
General Consideration Rainfall patterns was based from the nearest PAGASA rainfall gauging station located at the General Santos Rainfall Station. Run-off discharge was computed based on the Rational Equation (for drainage catchment area equal or less than 2.5 km2 and with adjusted rainfall intensity I values for catchment area greater than 2.5 km2). Rational Method The Rational Method was used to determine the design discharge run-offs necessary to determine the size of the drainage conveyance system. This method estimates the peak rate of runoff at any point in the system as a function of drainage area, land use and surface characteristics, and rainfall intensity. The method is expressed as a formula: Q = 0.278 CIA Where; Q : Maximum rate of runoff, m3/s C : Runoff coefficient representing the ration of runoff to rainfall, dimensionless I : Average rainfall intensity for a duration equal to the time of concentration, mm/hr A : Drainage area contributing to the drainage location, km2
Rainfall Intensity (I) The rainfall data used for the project was those of the General Santos and South Cotabato Station obtained from PAGASA’s published RIDF values. The RIDF data was used for the entire stretch of the project segment. The Rainfall Intensity-Duration Frequency Data is shown in Table 15.6.1-1.
The RIDF values were transformed into usable form as an equation to directly be substituted in a formula. The rainfall intensity is expressed in general form as:
I = A / (t + b) n
where: I = Rainfall intensity in mm/hour t = Duration of rainfall equal to the time of concentration in minutes A, b and n are constants derived either by graphical analysis or by analytical method.
15-14

The rainfall magnitudes werre based on design rainfall occurrences of 2 years for ditches, 5 years for culverts and cross drains and 50 years for bridges. The rainfall intensities for these return periods were based on the succeeding equations derived from the RIDF prevalent over the area. The followings were the resulting equations: i) 2-years Return Period I2 = 396.90 . ( t + 10.0) 0.6632 ii) 5-years Return Period I5 = 555.97 . ( t + 10.0) 0.6555 iii) 50-years Return Period I50 = 892.91 . ( t + 10) 0.6481 The preceding equations of the rainfall intensity can readily be substituted to solve the discharge in the Rational Formula. These take away the graphical estimation of the intensity value from a prepared data curve. TABLE 15.6.1-1 RAINFALL INTENSITY-DURATION FREQUENCY
DATA
15-15

15-16
Time of Concentration (tc) 5 minutes (min.) or length/velocity or through Kirpich’s empirical formula given as follows:
tc = 0.0196 L 1.15 * (dH) -0.385
where: tc = Time of Concentration L = Length of Channel dH = Difference in elevation between the outlet and the most
distant point in the watershed
In the delineation of the drainage tributaries or basins, topographic maps from NAMRIA were used. Land Use It was assumed that no major land use changes would occur within the project site and on sources of offsite inflows that would invalidate the hydrologic presumptions made for the area. Run-off Coefficient The run-off coefficients used for the project were 0.5 for steeped or rolling grassed areas and 0.4 for forested land (sandy to clay). Catchment Areas Delineation The drainage areas of each watershed were delineated from the 1: 50,000 NAMRIA / JICA maps. Catchment delineation is shown in Figure 15.6.1-1 for Pinaring-Simsiman Road and Figure 15.6.1.2 for Tamontaka-Tapian Road.

FIGURE 15.6.1-1 PINARING-SIMSIMAN ROAD: CATCHMENT AREA
FIGURE 15.6.1-2 TAMONTAKA-TAPIAN ROAD: CATCHMENT AREA
15-17

The hydrological computations are shown in Table 15.6.1-3 and Table 15.6.1-4. The tables show the different hydrological characteristics of the watersheds and related discharges.
TABLE 15.6.1-3 HYDROLOGICAL COMPUTATION FOR PINARING-SIMSIMAN ROAD
STATIONS DISCHARGE 2 year 5 year 50 year
BASIN NUMBER BEGINNING END
m³/sec m³/sec m³/sec 1 0 + 000 2 + 560 7.20 10.38 17.13 2 2 + 560 5 + 600 15.45 22.50 37.49 3 5 + 600 6 + 240 7.95 11.51 19.08 4 6 + 240 6 + 870 3.90 5.60 9.22 5 6 + 870 7 + 550 1.01 1.45 2.38 6 7 + 550 8 + 000 13.39 19.47 32.39 7 8 + 000 8 + 880 39.48 57.55 96.02 8 8 + 880 10 + 060 4.21 6.08 10.04 9 10 + 060 10 + 550 3.86 5.58 9.21
10 10 + 550 10 + 770 1.74 2.51 4.13 11 10 + 770 10 + 950 1.07 1.53 2.53 12 10 + 950 11 + 100 0.70 1.00 1.64 13 11 + 100 12 + 400 15.78 23.07 38.60 14 12 + 400 12 + 820 3.51 5.07 8.39 15 12 + 820 13 + 360 0.79 1.14 1.88 16 13 + 360 14 + 240 1.38 1.98 3.26 17 14 + 240 14 + 740 3.09 4.46 7.37 18 14 + 740 15 + 360 5.73 8.28 13.69 19 15 + 360 16 + 080 8.37 12.10 20.04 20 16 + 080 16 + 800 3.09 4.44 7.30 21 16 + 800 17 + 640 8.85 12.83 21.28 22 17 + 640 18 + 600 1.58 2.27 3.73 23 18 + 600 19 + 160 1.96 2.81 4.62 24 19 + 160 19 + 420 0.49 0.70 1.16 25 19 + 420 19 + 700 1.89 2.72 4.48 26 19 + 700 20 + 110 1.51 2.16 3.54
15-18

TABLE 15.6.1-4 HYDROLOGICAL COMPUTATION FOR TAMONTAKA-TAPIAN ROAD
STATIONS DISCHARGE 2 year 5 year 50 year
BASIN NUMBER BEGINNING END
m³/sec m³/sec m³/sec 1 0 + 000 1 + 300 14.46 21.16 35.41 2 1 + 300 1 + 700 4.22 6.08 10.04 3 1 + 700 2 + 300 2.13 3.07 5.05 4 2 + 300 3 + 000 0.91 1.30 2.14 5 3 + 000 4 + 000 111.80 163.15 272.50 6 4 + 000 4 + 420 0.66 0.95 1.56 7 4 + 420 4 + 800 0.73 1.05 1.74 8 4 + 800 5 + 500 3.47 4.99 8.21 9 5 + 500 6 + 000 3.14 4.54 7.51
10 6 + 000 6 + 400 34.92 50.57 83.86 11 6 + 400 6 + 800 13.28 19.09 31.41 12 6 + 800 7 + 400 12.77 18.36 30.22 13 7 + 400 7 + 800 10.83 15.58 25.66 14 7 + 800 8 + 750 4.45 6.38 10.47 15 8 + 750 9 + 500 6.57 9.43 15.49 16 9 + 500 9 + 700 9.48 13.61 22.37 17 9 + 700 10 + 850 5.14 7.35 12.06 18 10 + 850 12 + 000 8.57 12.30 20.20 19 12 + 000 12 + 300 4.34 6.22 10.21 20 12 + 300 12 + 700 4.13 5.92 9.72 21 12 + 700 13 + 500 46.23 66.72 110.28 22 13 + 500 14 + 300 7.05 10.12 16.64 23 14 + 300 14 + 800 45.02 65.14 107.90 24 14 + 800 16 + 200 3.30 4.74 7.80 25 16 + 200 17 + 000 8.37 12.00 19.71 26 17 + 000 17 + 400 10.42 15.00 24.73 27 17 + 400 17 + 600 2.48 3.56 5.85 28 17 + 600 18 + 050 0.69 0.99 1.62 29 18 + 050 18 + 150 4.47 6.39 10.48 30 18 + 150 19 + 100 2.63 3.76 6.17 31 19 + 100 19 + 600 27.59 39.85 65.90 32 19 + 600 19 + 850 1.99 2.85 4.67 33 19 + 850 20 + 250 3.40 4.87 7.99 34 20 + 250 20 + 600 0.89 1.27 2.09
15-19

15.6.2 Drainage Design
(1) Drainage System
The scheme used in conveying runoff across the road was by cross drains. The use of box culverts was not preferred due to limitations of the site conditions. Side ditches were designed to intercept and to take water away from the road as quickly as possible, thus protecting the pavement structure and subgrade.
(2) Drainage Structure
(a) Pipe Sizing
The principles/parameters that was used in the sizing of the pipes and drainage ditches is the Manning’s equation for open channel flow. The equation was used to compute pipe capacities:
V = (1/n) R 0.67 s 0.5
where: V = mean velocity normal to the flow cross-section, in m/s n = Manning’s roughness coefficient, dimensionless. R = A/P = hydraulic radius equal to the ratio of flow area to the wetted
perimeter, meter. A = the flow area is the cross-sectional area normal to the flow
direction, m2 P = the wetted perimeter is the length of line of intersection of the
wetted surface with a cross-sectional plane normal to the direction of flow, in meter.
s = slope of the energy grade line.
Manning’s equation is an empirical formula used to compute uniform flow in open channels. Since uniform flow is assumed, s = the bottom slope.
(b) Design Parameter
The design parameters used for the appurtenances were as follows:
i. Minimum pipe sizes = 900 mm for laterals. 900mm for cross-drains ii. Maximum pipe sizes = 1200mm for drainage mains iii. Minimum pipe cover = 0.6 meter iv. Minimum slope = 0.50%
(c) Materials
The design will consider concrete as the material for the pipelines as well as the appurtenances. The Manning’s roughness coefficient (n),
15-20
which is a parameter that determines pipe properties, varies with the description of the surface. Representative values for Manning’s roughness coefficient are given for various surface descriptions:
Concrete 0.010 to 0.017 Man-made earth ditch 0.017 to 0.025 Lined Ditch – grouted riprap 0.017 to 0.03
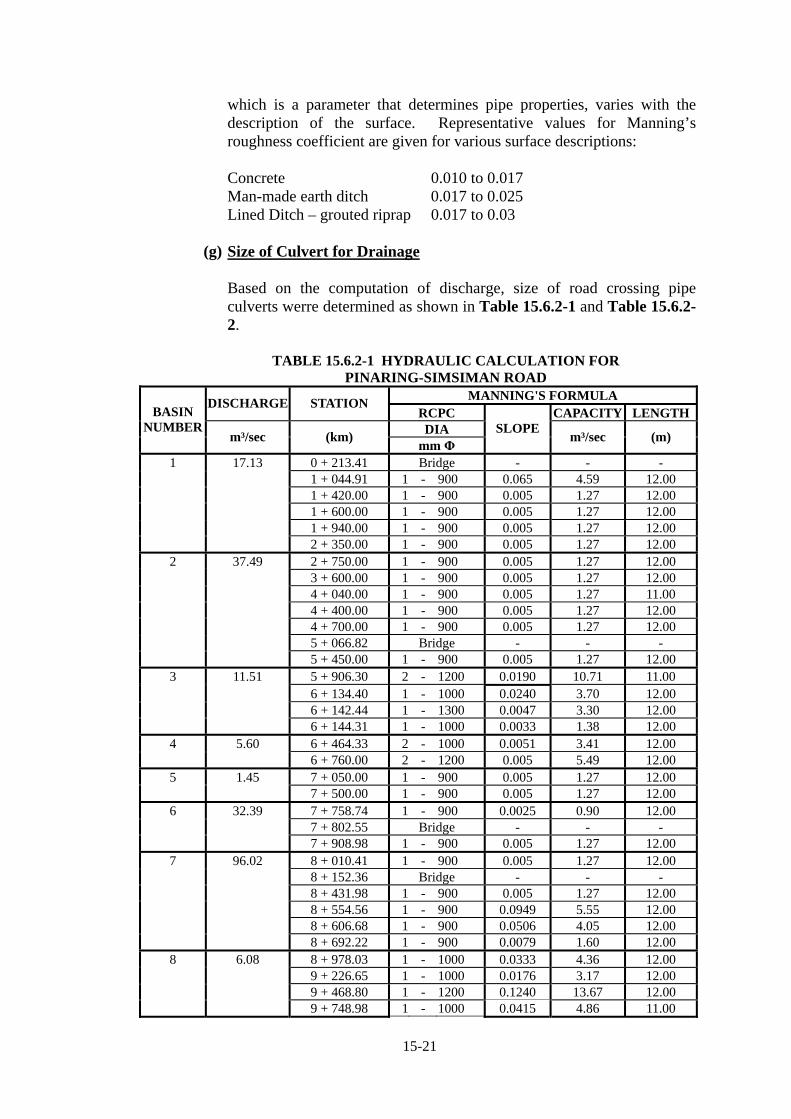
(g) Size of Culvert for Drainage
Based on the computation of discharge, size of road crossing pipe culverts werre determined as shown in Table 15.6.2-1 and Table 15.6.2-2.
TABLE 15.6.2-1 HYDRAULIC CALCULATION FOR
PINARING-SIMSIMAN ROAD MANNING'S FORMULA
DISCHARGE STATION RCPC CAPACITY LENGTHDIA
BASIN NUMBER
m³/sec (km) mm Φ
SLOPE m³/sec (m)
1 17.13 0 + 213.41 Bridge - - - 1 + 044.91 1 - 900 0.065 4.59 12.00 1 + 420.00 1 - 900 0.005 1.27 12.00 1 + 600.00 1 - 900 0.005 1.27 12.00 1 + 940.00 1 - 900 0.005 1.27 12.00 2 + 350.00 1 - 900 0.005 1.27 12.00
2 37.49 2 + 750.00 1 - 900 0.005 1.27 12.00 3 + 600.00 1 - 900 0.005 1.27 12.00 4 + 040.00 1 - 900 0.005 1.27 11.00 4 + 400.00 1 - 900 0.005 1.27 12.00 4 + 700.00 1 - 900 0.005 1.27 12.00 5 + 066.82 Bridge - - - 5 + 450.00 1 - 900 0.005 1.27 12.00
3 11.51 5 + 906.30 2 - 1200 0.0190 10.71 11.00 6 + 134.40 1 - 1000 0.0240 3.70 12.00 6 + 142.44 1 - 1300 0.0047 3.30 12.00 6 + 144.31 1 - 1000 0.0033 1.38 12.00
4 5.60 6 + 464.33 2 - 1000 0.0051 3.41 12.00 6 + 760.00 2 - 1200 0.005 5.49 12.00
5 1.45 7 + 050.00 1 - 900 0.005 1.27 12.00 7 + 500.00 1 - 900 0.005 1.27 12.00
6 32.39 7 + 758.74 1 - 900 0.0025 0.90 12.00 7 + 802.55 Bridge - - - 7 + 908.98 1 - 900 0.005 1.27 12.00
7 96.02 8 + 010.41 1 - 900 0.005 1.27 12.00 8 + 152.36 Bridge - - - 8 + 431.98 1 - 900 0.005 1.27 12.00 8 + 554.56 1 - 900 0.0949 5.55 12.00 8 + 606.68 1 - 900 0.0506 4.05 12.00 8 + 692.22 1 - 900 0.0079 1.60 12.00
8 6.08 8 + 978.03 1 - 1000 0.0333 4.36 12.00 9 + 226.65 1 - 1000 0.0176 3.17 12.00 9 + 468.80 1 - 1200 0.1240 13.67 12.00 9 + 748.98 1 - 1000 0.0415 4.86 11.00
15-21

9 5.58 10 + 338.06 2 - 1200 0.006 6.02 12.00 10 2.51 10 + 662.30 1 - 1000 0.0303 4.15 12.00 11 1.53 10 + 900.00 1 - 1000 0.005 1.69 12.00 12 1.00 11 + 036.19 1 - 900 0.005 1.27 12.00 13 38.60 11 + 250.00 1 - 900 0.005 1.27 12.00
11 + 363.22 1 - 900 0.0036 1.08 12.00 11 + 472.09 Bridge - - - 11 + 740.00 1 - 900 0.005 1.27 12.00 12 + 040.00 1 - 900 0.005 1.27 12.00
14 5.07 12 + 506.62 1 - 1200 0.005 2.75 12.00 12 + 800.00 1 - 1200 0.005 2.75 12.00
15 1.14 13 + 050.00 1 - 900 0.005 1.27 12.00 13 + 300.00 1 - 900 0.005 1.27 12.00
16 1.98 13 + 650.00 1 - 900 0.005 1.27 12.00 14 + 011.80 1 - 900 0.005 1.27 12.00
17 4.46 14 + 450.00 2 - 1200 0.005 5.49 12.00 18 8.28 14 + 860.00 2 - 1200 0.005 5.49 11.00
15 + 140.96 1 - 1300 0.0539 11.16 12.00 19 12.10 15 + 561.57 1 - 1000 0.0128 2.70 12.00
15 + 626.11 1 - 1000 0.0219 3.53 12.00 15 + 721.99 1 - 1000 0.0143 2.85 12.00 15 + 755.94 1 - 1000 0.005 1.69 12.00 15 + 900.00 1 - 1000 0.005 1.69 12.00
20 4.44 16 + 317.95 1 - 1000 0.002 0.98 12.00 16 + 385.24 1 - 1000 0.0077 2.09 12.00 16 + 600.00 1 - 1000 0.005 1.69 12.00
21 12.83 16 + 900.00 2 - 1200 0.005 5.49 12.00 17 + 451.66 1 - 900 0.0536 4.17 12.00 17 + 560.00 2 - 1200 0.005 5.49 12.00
22 2.27 17 + 758.72 1 - 900 0.040 3.59 12.00 18 + 050.00 1 - 900 0.005 1.27 12.00 18 + 209.83 1 - 900 0.0005 0.40 12.00 18 + 463.55 2 - 1200 0.000 0.00 12.00
23 2.81 18 + 609.91 1 - 900 0.005 1.27 12.00 18 + 768.65 1 - 900 0.005 1.27 11.00 18 + 906.06 1 - 1000 0.0250 3.77 12.00
24 0.70 19 + 282.84 1 - 1000 0.0417 4.87 12.00 19 + 382.70 1 - 900 0.0225 2.70 12.00
25 2.72 19 + 515.46 1 - 1000 0.0260 3.85 12.00 19 + 624.34 1 - 1000 0.0730 6.45 12.00
26 2.16 19 + 748.77 1 - 1000 0.0289 4.06 12.00 19 + 831.88 1 - 1000 0.0233 3.64 12.00
15-22

15-23
TABLE 15.6.2-2 HYDRAULIC CALCULATION FOR TAMONTAKA-TAPIAN ROAD
MANNING'S FORMULA DISCHARGE STATION
RCPC CAPACITY LENGTHDIA
BASIN NUMBER
m³/sec (km) mm Φ
SLOPE m³/sec (m)
1 35.77 0 + 512.02 Bridge - - - 0 + 922.23 1 - 1000 0.0637 6.02 11.77
2 6.08 1 + 355.91 1 - 1000 0.0166 3.07 11.48 1 + 357.66 1 - 600 0.0144 0.73 11.77 1 + 359.44 1 - 600 0.0160 0.77 10.65 1 + 489.59 3 - 1000 0.0109 7.47 8.25
3 3.07 1 + 712.38 1 - 600 0.0344 1.13 13.35 2 + 228.43 1 - 900 0.0193 2.50 11.90
4 1.30 2 + 393.68 1 - 900 0.0227 2.71 12.31 5 278.07 3 + 855.05 Bridge - - - 6 0.95 4 + 152.93 1 - 900 0.0000 0.00 11.57 4 + 400.00 1 - 900 0.0050 1.27 12.00
7 1.05 4 + 651.46 1 - 900 0.0050 1.27 12.00 8 4.99 4 + 850.00 1 - 900 0.0050 1.27 12.00 5 + 083.48 1 - 1000 0.0821 6.84 12.00 5 + 261.48 1 - 1000 0.0828 6.87 12.00 5 + 423.10 1 - 1000 0.0212 3.47 12.00
9 4.54 5 + 773.85 2 - 1200 0.0050 5.49 12.00 10 85.58 6 + 100.26 Bridge - - - 11 19.09 6 + 496.57 2 - 1200 0.0070 6.50 12.00 6 + 499.74 2 - 1200 0.0070 6.50 12.00 6 + 800.00 2 - 1200 0.0070 6.50 12.00
12 18.36 7 + 000.00 2 - 1200 0.0150 9.51 12.00 7 + 214.12 2 - 1200 0.0150 9.51 12.00
13 15.58 7 + 425.68 1 - 1200 0.0110 4.07 12.00 7 + 535.22 1 - 1200 0.0272 6.40 12.00 7 + 581.96 2 1200 0.0050 5.49 12.00
14 6.38 7 + 850.00 1 - 1200 0.0050 2.75 12.00 8 + 618.15 2 - 1200 0.0050 5.49 12.00
15 9.43 9 + 050.00 2 - 1200 0.0050 5.49 12.00 9 + 284.30 2 - 1200 0.0050 5.49 12.00
16 13.61 9 + 356.91 2 - 1200 0.0050 5.49 12.00 9 + 435.40 2 - 1200 0.0050 5.49 12.00 9 + 568.33 2 - 1000 0.1273 17.03 12.00
17 7.35 9 + 900.00 1 - 900 0.0050 1.27 12.00 10 + 300.00 1 - 900 0.0050 1.27 12.00 10 + 558.92 1 - 1000 0.0390 4.71 12.00 10 + 771.18 1 - 900 0.0586 4.36 12.00
18 12.30 11 + 031.15 2 - 1200 0.0260 12.52 12.00 19 6.22 11 + 500.00 1 - 1000 0.0050 1.69 12.00
11 + 750.00 1 - 1200 0.0050 2.75 12.00 12 + 097.13 1 - 1200 0.0050 2.75 12.00
20 5.92 12 + 550.00 2 - 1200 0.0060 6.02 12.00 21 91.80 13 + 040.00 2 - 1200 0.0850 22.64 12.00
13 + 270.33 5 - 1200 0.1300 70.00 12.00 22 10.12 13 + 648.34 1 - 1200 0.0500 8.68 12.00
13 + 850.00 1 - 1200 0.0050 2.75 12.00 14 + 100.00 2 - 1200 0.0050 5.49 12.00
23 108.99 14 + 550.00 1 - 900 0.0050 1.27 12.00

14 + 754.47 Bridge - - - 24 4.74 15 + 035.87 1 - 900 0.0050 1.27 12.00
15 + 530.00 1 - 900 0.0050 1.27 12.00 15 + 689.24 1 - 900 0.0050 1.27 12.00 15 + 861.68 1 - 1000 0.0081 2.15 12.00
25 12.00 16 + 400.00 1 - 1200 0.0050 2.75 12.00 16 + 650.00 2 - 1200 0.0050 5.49 12.00 16 + 850.00 2 - 1200 0.0050 5.49 12.00
26 24.73 17 + 129.70 Bridge - - - 27 3.56 17 + 500.00 2 - 1200 0.0050 5.49 12.00 28 0.99 17 + 800.00 1 - 900 0.0050 1.27 12.00 29 6.39 18 + 050.00 2 - 1200 0.0070 6.50 12.00 30 3.76 18 + 350.00 1 - 900 0.0050 1.27 12.00
18 + 650.00 1 - 900 0.0050 1.27 12.00 18 + 950.00 1 - 900 0.0050 1.27 12.00 19 + 300.00 1 - 900 0.0050 1.27 12.00
31 66.56 19 + 354.67 Bridge - - -
15.6.3 High Water Level at River Crossing Points
The flood levels were verified through computation and then compared to the observed flood height which was confirmed through interview to residents living near the rivers. The flood levels were then evaluated to come up with the appropriate design flood level for each area. As the result of above computation, Design High Water Level was determined as shown below. In case the computed HWL is below the observed one, the observed HWL is considered as Design High Water Level.
PINARING-SIMSIMAN ROAD
Observed
HWL Computed HWL (50y)
Flow Velocity
D.H.W.L
Salam Bridge 1 6.37 m. 5.24m 0.90 6.37 m Salam Bridge 2 9.60 m 8.65m 1.39 9.60 m. Salam Bridge 3 5.72 m. 4.44m 3.34 5.72 m Salam Bridge 4 9.76 m 9.66m 1.50 9.76 m
TAMONTAKA-TAPIAN ROAD
Observed Computed HWL (50y)
Flow Velocity
D.H.W.L
Salam Bridge 1 4.72 m. 4.72m 1.78 m/s 4.72 m Salam Bridge 2 1.97 m 1.74m 2.57 m/s 1.97m Salam Bridge 3 1.97 m 1.97m 10.98m/s 1.97 m Salam Bridge 4 2.59 m 2.71m 3.08m/s 2.71 m
Based on the above examination, it was concluded that Salam Bridge No.1 at Tamontaka-Tapian Road has not sufficient freeboard between said HWL and bottom of bridge girder. In this regard, the Salam Bridge No.1 at Tamontaka-Tapian Road needs to be replaced to accommodate appropriate freeboard on HWL and other bridges are currently satisfying the requirement for the freeboard.
15-24

15.7 BRIDGE DESIGN 15.7.1 Evaluation of Existing Bridges
PINARING-SIMSIMAN ROAD
No. Bridge Name ExistingBridge
Length (m)Type Station
No StructuralCondition Situation Measures to be
undertaken
1 LIMBO Br. 18.3 RCDG (2-Lane) 0+222 Fair Less damage
Close by houses None
2 SALAM Br.-1 27.4 Bailey (1-Lane) 5+080 Fair
Constructed in 2001.
Old concrete box culvert is
Bridge width is 3.5m (1-Lane) only.
Reconstruction of the Bridge
3 SALAM Br.-2 21.5 Bailey (2-Lane) 7+813 Fair
Constructed in 2001.
Abutment protection is damaged
Rehabilitation of Abutment Protection
4 SALAM Br.-3 36.8 Bailey (2-Lane) 8+170 Fair
Constructed in 2001.
Abutment protection is damaged
Rehabilitation of Abutment Protection
5 SALAM Br.-4 24.6 Bailey (2-Lane) 11+436 Fair
Constructed in 2001.
Abutment protection is damaged
Rehabilitation of Abutment Protection
TAMONTAKA-TAPIAN ROAD
No. Bridge Name ExistingBridge
Length (m)Type Station
No StructuralCondition Situation Measures to be
undertaken
1 SPDA Br. 15.5 RCDG (2-Lane) 0+520 Fair Less damage
Close by houses None
2 LINEK Br. 30.2 RCDG (2-Lane) 3+870 Fair Less damage None
3 SALAM Br.-1 21.6 Bailey (2-Lane) 6+111 Fair
Constructed in 2001.
Insufficient Freeboard on H.W.L
Reconstruction of the Bridge
4 SALAM Br.-2 52.1 Bailey (2-Lane) 14+780 Fair
Constructed in 2001.
River bank at up-stream of the bridge is suffering from erosion.
River bank protection to prevent from erosion
5 SALAM Br.-3 12.5 Bailey (2-Lane) 17+135 Fair
Constructed in 2001.
Abutment protection is damaged
Rehabilitation of Abutment Protection
6 SALAM Br.-4 33.8 Bailey (2-Lane) 19+370 Fair
River bank at up-stream of the bridge is suffering from erosion.
River bank protection to prevent from erosion
15-25

15-26
15.7.2 Comparative Study for Alternative Bridge Type
(a) Span Arrangement and Superstructure Type for Salam Bridge # 1, Length = 22.80 m (Pinaring Simsiman Road)
Since bridge length is short at 22 m, the following 3 schemes were compared (refer to Table 15.7.2-1). Bridge
Length Span
Arrangement Superstructure
Type Scheme A Scheme B Scheme C
22.0 m 22.0 m 22.0 m
1 span 1 span 3 spans
(6+10+6)
PCDG Steel H Girder
RC Slab
(b) Span Arrangement and Superstructure Type for Salam Bridge # 1,
Length = 24.80 m (Tamontaka-Tapian Road)
Since bridge length is short at 24 m, the following 3 schemes were compared (refer to Table 15.7.2-2), Bridge
Length Span
Arrangement Superstructure
Type Scheme A Scheme B Scheme C
24.0 m 24.0 m 24.0 m
1 span 1 span 3 spans
(6+12+6)
PCDG Steel H Girder
RC Slab

15-27
TABLE 15.7.2-1 SUPERSTRUCTURE TYPE FOR SALAM BRIDGE # 1 (PINARING-SIMSIMAN ROAD)
Scheme A PC Girder Bridge
Scheme B Steel H Girder Bridge
Scheme C Reinforced Concrete Deck Slab Bridge
ELEVATION
Height of the girder: 1.6m
Height of the girder : 1.25m
Height (Thickness) of the slab : 0.6m
OVERVIEW
This scheme has the highest finished grade elevation required. (+1.9m from existing level)
Advantageous where it is impossible to put the formworks for superstructure construction.
One span bridge having no piers will pose no threat of obstruction to free flow of water.
The finish grade elevation will be 1.6m higher than existing elevation.
Advantageous where it is impossible to put the formworks for superstructure construction.
One span bridge having no piers will pose no threat of obstruction to free flow of water.
This scheme has the least finished grade elevation required. (+0.7m from existing level)
The kind of soil strata as per geotechnical survey suggests possible settlement, so that a multi-span bridge designed as not continuous is best suited for this bridge to avoid affect of settlement.
Scouring around piers is to be considered.
CONSTRUCTION
Bigger crane capacity will be required for girder erection.
Least Construction Period.
Heavy vehicle will be required for transportation of the steel girders.
Coating will be carried out at the site.
Formworks required in the superstructure construction. This requires longer construction period than other schemes.
MAINTENANCE Easy and the least maintenance cost Expensive and frequent maintenance is required for steel members.
Maintenance work for crack on the concrete slab is required.
CONSTRUCTION COST
PhP 22.06 M PhP 23.93 M PhP 13.80 M
EVALUATION - - RECOMMENDED
15-27

Scheme A
PC Girder Bridge Scheme B
Steel H Girder Bridge Scheme C
Reinforced Concrete Deck Slab Bridge
ELEVATION
Height of the girder: 1.75m
Height of the girder: 1.4m
Height (Thickness) of the slab : 0.6m
OVERVIEW
This scheme has the highest finished grade elevation required. (+2.6m from existing level) Houses at the vicinity of the bridge will be affected.
Advantageous where it is impossible to put the formworks for superstructure construction.
One span bridge having no piers will pose no threat of obstruction to free flow of water.
The finish grade elevation will be 2.3m higher than existing elevation.
Advantageous where it is impossible to put the formworks for superstructure construction.
One span bridge having no piers will pose no threat of obstruction to free flow of water.
This scheme has the least finished grade elevation required. (+1.4m from existing level)
The kind of soil strata as per geotechnical survey suggests possible settlement, so that a multi-span bridge designed as not continuous is best suited for this bridge to avoid affect of settlement.
Scouring around piers is to be considered.
CONSTRUCTION
Bigger crane capacity will be required for girder erection.
Least Construction Period.
Heavy vehicle will be required for transportation of the steel girders.
Coating will be carried out at the site.
Formworks required in the superstructure construction. This requires longer construction period than other schemes.
MAINTENANCE Easy and the least maintenance cost Expensive and frequent maintenance is required for
steel members. Maintenance work for crack on the concrete slab is
required.
CONSTRUCTION COST
PhP 24.06 M PhP 26.10 M PhP 15.04 M
RECOMMENDATION - - RECOMMENDED
TABLE 15.7.2-2 SUPERSTRUCTURE TYPE FOR SALAM BRIDGE # 1 (TAMONTAKA-TA P I A N R OAD)
15-28
15-28

15.7.3 Substructures
(a) Abutments
A substructure unit which supports the end of a single span or extreme end of a multi-span superstructure, and which usually retains or supports the approach fill. Based on said comparison, Pile Bent Type was selected.
TABLE 15.7.2-3 TYPES OF ABUTMENTS Closed or Wall Type Pile Bent Type Spill Thru Type
This type is applicable for high embankment approaches. This type will aid in retaining high earth fill and is most practical to use when the existing soil that will be retained is not stable. The footing can either be on spread footing or piled foundation.
This type is used for short span bridges built integral to the superstructure like RC Flat Slab or RC Deck Girder.These substructures are used where the pile exposure above natural ground is not more than two meters.
This type maybe two column or multiple column bent and are used when the fill at the approach is more than three meters high and when the river bank is stable.
- Recommended -
(b) Piers
Bridge piers transmit the load from the superstructure to the foundation material and provide intermediate supports between abutments. Based on said comparison, Pile Bent Type was selected.
TABLE 15.7.2-4 TYPES OF PIERS
Wall Type Multi-Column Single Column Type Pile Bent Type
This type is used in river crossings where debris is present and the flow of stream is fast. The pier should be built parallel to the flow of stream to avoid much soil erosion.
When the river crossing has no debris or when debris amount is negligible, this type can be used.
This type of Pier is used to avoid skewed piers or in elevated highways where location of foundation is limited or restricted.
This type can be used for short span bridges usually the RC Slab type. The maximum height of pier bent shall be 4.00 m from the river bed to the top of top of bridge seat.
- - - Recommended
15-29

15.7.4 Preliminary Design of Bridges
Preliminary design drawings are presented in Annex 15-1. 15.8 BARANGAY ROAD 15.8.1 Subject Barangay Road to be Improved
There are 13-barangay road in Pinaring-Simsiman Road (Total Length=42km) and 20-Barangay Road (Total Length =24 km) in Tamontaka-Tapian Road. The target roads to be improved were selected through following considerations. 1) To contribute to agricultural production. 2) To contribute to fishery production. Following tables are showing existing length of the Barangay roads and target road to be improved.
TABLE 15.8.1-1 SUBJECT BARANGAY ROAD AT PINARING-SIMSIMAN ROAD
NO. STATION ROAD NAME LENGTH
(km) TARGET
(km)
1 01+254 BRGY. UNGAP - RICEFIELD 0.50
2 05+342 BRGY. PINARING - TANGUISAN 1.10 1.10
3 05+484 BRGY. PINARING - BRGY. LADIA 5.50
4 08+304 BRGY. IBOTIGEN - BRGY. NARA 3.20 3.20
5 08+900 BRGY. IBOTIGEN - BRGY. DAMANIOG 6.00
6 11+130 BRGY. PINARING - BRGY. BANATIN 2.20 2.20
7 11+130 BRGY. PANATAN - BRGY. ALAMADA 6.50
8 11+970 BRGY. DATU BINASING - BRGY. LOWER BAGUER
2.80 2.80
9 14+823 BRGY. SIMSIMAN - BRGY. LIBUNGAN TORRETA
8.70 8.70
10 15+380 BRGY. MALAGAKIT - RICEFIELD 0.20
11 16+362 BRGY. MALAGAKIT - CENTRAL PANATAN 4.10
12 16+468 BRGY. MALAGAKIT - RICEFIELD 0.75 0.75
13 19+240 BRGY. SOUTH MALAGAKIT - MANGO PLANTATION
0.20
TOTAL 41.75 18.75
15-30
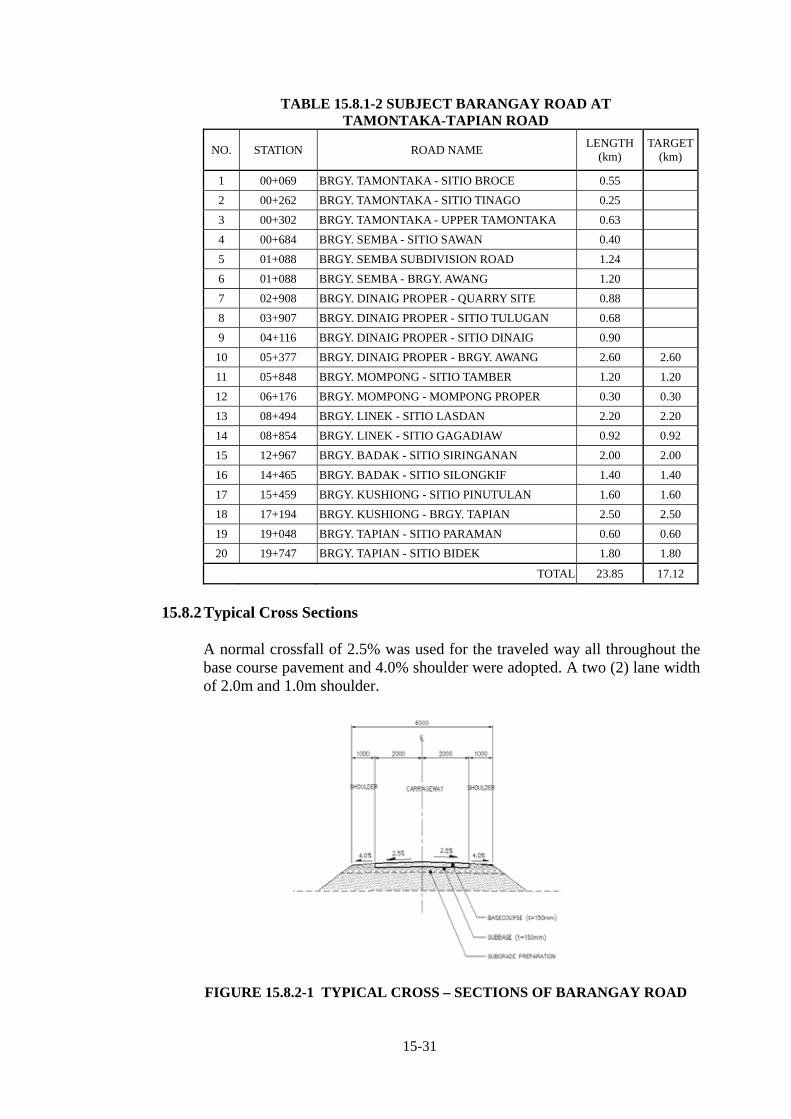
TABLE 15.8.1-2 SUBJECT BARANGAY ROAD AT TAMONTAKA-TAPIAN ROAD
NO. STATION ROAD NAME LENGTH
(km) TARGET
(km)
1 00+069 BRGY. TAMONTAKA - SITIO BROCE 0.55
2 00+262 BRGY. TAMONTAKA - SITIO TINAGO 0.25
3 00+302 BRGY. TAMONTAKA - UPPER TAMONTAKA 0.63
4 00+684 BRGY. SEMBA - SITIO SAWAN 0.40
5 01+088 BRGY. SEMBA SUBDIVISION ROAD 1.24
6 01+088 BRGY. SEMBA - BRGY. AWANG 1.20
7 02+908 BRGY. DINAIG PROPER - QUARRY SITE 0.88
8 03+907 BRGY. DINAIG PROPER - SITIO TULUGAN 0.68
9 04+116 BRGY. DINAIG PROPER - SITIO DINAIG 0.90
10 05+377 BRGY. DINAIG PROPER - BRGY. AWANG 2.60 2.60
11 05+848 BRGY. MOMPONG - SITIO TAMBER 1.20 1.20
12 06+176 BRGY. MOMPONG - MOMPONG PROPER 0.30 0.30
13 08+494 BRGY. LINEK - SITIO LASDAN 2.20 2.20
14 08+854 BRGY. LINEK - SITIO GAGADIAW 0.92 0.92
15 12+967 BRGY. BADAK - SITIO SIRINGANAN 2.00 2.00
16 14+465 BRGY. BADAK - SITIO SILONGKIF 1.40 1.40
17 15+459 BRGY. KUSHIONG - SITIO PINUTULAN 1.60 1.60
18 17+194 BRGY. KUSHIONG - BRGY. TAPIAN 2.50 2.50
19 19+048 BRGY. TAPIAN - SITIO PARAMAN 0.60 0.60
20 19+747 BRGY. TAPIAN - SITIO BIDEK 1.80 1.80
TOTAL 23.85 17.12
15.8.2 Typical Cross Sections
A normal crossfall of 2.5% was used for the traveled way all throughout the base course pavement and 4.0% shoulder were adopted. A two (2) lane width of 2.0m and 1.0m shoulder.
FIGURE 15.8.2-1 TYPICAL CROSS – SECTIONS OF BARANGAY ROAD
15-31

15-32
15.9 PROJECT COST ESTIMATE 15.9.1 Construction Cost
(1) Price Level The price level adopted was December 2009.
(2) Unit Price
Unit prices determined based on the unit price analysis (refer to Annex 15-2) are shown in Table 15.9.1-1.

15-33
UNIT COSTForeign Local Taxes (Php) Foreign Local Taxes
PART A: FACILITIES FOR THE ENGINEER % --- --- --- 3.00% --- --- ---Cost = ratio x total of Part C,D,E,F and G
PART B: OTHER GENERAL REQUIREMENT % --- --- --- 3.00% --- --- ---Cost = ratio x total of Part C,D,E,F and G
PART C: EARTHWORKS
100.2.1 Clearing and Grubbing ha 56.00% 26.00% 18.00% 202,500.00 113,400.00 52,700.00 36,400.00101.1.1 Removal of Existing Bridge ls 56.00% 26.00% 18.00% 150,000.00 84,000.00 39,000.00 27,000.00101.2.2 Removal of Existing Concrete Structure cum 56.00% 26.00% 18.00% 3,300.00 1,800.00 900.00 600.00101.2.4 Removal of Existing Concrete Pavement sqm 56.00% 26.00% 18.00% 710.00 400.00 180.00 130.00102.2.9 Roadway Excavation and Disposal (Including Section with CBR < 3) cum 58.00% 16.00% 26.00% 410.00 240.00 70.00 100.00103.1 Bridge Excavation Common Above O.W.L cum 52.00% 30.00% 18.00% 490.00 250.00 150.00 90.00103.2 Bridge Excavation Common Below O.W.L cum 50.00% 33.00% 17.00% 990.00 500.00 330.00 160.00103.3 Structural Backfill cum 53.00% 19.00% 28.00% 790.00 420.00 150.00 220.00103.4 Excavation for Pipe Culverts and Headwall Type F Inletes/Outlets Including Side Ditch cum 53.00% 19.00% 28.00% 510.00 270.00 100.00 140.00104.2.1 Selected Fill from Roadway Excavation cum 53.00% 19.00% 28.00% 600.00 320.00 110.00 170.00104.2.2 Selected Fill from Borrow Pit cum 55.00% 29.00% 16.00% 1,080.00 590.00 310.00 180.00104.2.4 Selected Fill for Replacement of Span with CBR < 3 cum 55.00% 29.00% 16.00% 1,080.00 590.00 310.00 180.00105.3 Sub-grade Preparation sqm 56.00% 26.00% 18.00% 50.00 30.00 10.00 10.00
PART D: SUBBASE AND BASE COURSE
200 Aggregate Subbase Course cum 53.00% 31.00% 16.00% 900.00 480.00 280.00 140.00202 Crushed Aggregate Base Course cum 53.00% 31.00% 16.00% 940.00 500.00 290.00 150.00
PART E: SURFACE COURSE
311 Portland Cement Concrete Pavement (230mm thick) sqm 61.00% 22.00% 17.00% 2,150.00 1,300.00 500.00 350.00
CONPONENTS, (%) CONPONENTS, PhpITEMNO.
DESCRIPTION UNIT
TABLE 15.9.1-1 UNIT PRICE LIST ((1/2)
15-33

UNIT COSTForeign Local Taxes (Php) Foreign Local Taxes
PART F: STRUCTURES
400.1 Pre-Cast Concrete Piles, 450mm x 450mm, Furnished lm 51.00% 27.00% 22.00% 11,500.00 5,900.00 3,100.00 2,500.00400.2 Pre-Cast Concrete Piles, 450mm x 450mm, Driven lm 51.00% 27.00% 22.00% 300.00 200.00 100.00 0.00400.3 Test Piles, 450mm x 450mm, Furnished and Driven lm 51.00% 34.00% 15.00% 19,900.00 10,100.00 6,800.00 3,000.00401 Concrete Railing lm 37.00% 48.00% 15.00% 500.00 200.00 200.00 100.00404 Reinforcing Steel Bars, Grade 40 kg 49.00% 36.00% 15.00% 100.00 50.00 40.00 10.00405.1 Structural Concrete, 28 MPa cum 33.00% 49.00% 18.00% 6,700.00 2,200.00 3,300.00 1,200.00405.2 Structural Concrete, 21 MPa cum 33.00% 49.00% 18.00% 5,800.00 1,900.00 2,800.00 1,100.00405.4 Lean Concrete, 17MPa cum 42.00% 36.00% 22.00% 5,100.00 2,100.00 1,800.00 1,200.00406 Elastomeric Bearing Pads each 54.00% 29.00% 17.00% 6,700.00 3,600.00 1,900.00 1,200.00407 Pre-formed Expansion Joint Filler with Sealant, 12mm thick lm 54.00% 29.00% 17.00% 10,900.00 5,900.00 3,200.00 1,800.00
PART G: DRAINAGE AND SLOPE PROTECTION STRUCTURES
500(1)a RCPC, 610mm diameter lm 56.00% 27.00% 17.00% 6,000.00 3,400.00 1,600.00 1,000.00500(1)b RCPC, 910mm diameter lm 56.00% 27.00% 17.00% 10,500.00 5,900.00 2,800.00 1,800.00500(1)c RCPC, 1000mm diameter lm 56.00% 27.00% 17.00% 16,800.00 9,400.00 4,500.00 2,900.00500(1)e RCPC, 1220mm diameter lm 56.00% 27.00% 17.00% 19,700.00 11,000.00 5,300.00 3,400.00500(2)1 RC Side Ditch, Type Cs-concrete Lined Ditch lm 37.00% 46.00% 17.00% 3,400.00 1,300.00 1,600.00 500.00500(2)2 RC Side Ditch, Type Bm-masonry Lined Ditch lm 37.00% 46.00% 17.00% 1,300.00 480.00 600.00 220.00500(2)3 RC Side Ditch, Type UD-C Ditch with Cover lm 37.00% 46.00% 17.00% 9,600.00 3,600.00 4,400.00 1,600.00500(2)a Inlet/Outlet Headwall, 610mm diameter, Type F each 27.00% 56.00% 17.00% 14,400.00 3,900.00 8,100.00 2,400.00500(2)b Inlet/Outlet Headwall, 910mm diameter, Type F each 27.00% 56.00% 17.00% 25,900.00 7,000.00 14,500.00 4,400.00500(2)c Inlet/Outlet Headwall, 1000mm diameter, Type F each 29.00% 54.00% 17.00% 32,200.00 9,300.00 17,400.00 5,500.00500(2)e Inlet/Outlet Headwall, 1220mm diameter, Type F each 30.00% 53.00% 17.00% 38,800.00 11,600.00 20,600.00 6,600.00504 Grouted Riprap cum 38.00% 45.00% 17.00% 3,500.00 1,300.00 1,600.00 600.00506 Hand Laid Rock Embankment (Loose Boulder Apron) cum 38.00% 45.00% 17.00% 2,300.00 870.00 1,040.00 390.00508 Stone Masonry cum 54.00% 29.00% 17.00% 3,000.00 1,600.00 900.00 500.00509 Gabion Mattress, 1.0m x 2.0m x 0.5m (Including Geotextile) cum 50.00% 33.00% 17.00% 5,700.00 2,900.00 1,900.00 900.00
PART H: MISCELLANEOUS km 57.00% 26.00% 17.00% 1,500,000.00 855,000.00 390,000.00 255,000.00
PART I: DAYWORKS % --- --- --- 2.00% --- --- ---Cost = ratio x total of Part C,D,E,F and G
PART J: PROVISIONAL SUMS % --- --- --- 2.00% --- --- ---Cost = ratio x total of Part C,D,E,F and G
PART K: PHISICAL CONTINGENCIES % --- --- --- 15.00% --- --- ---Cost = ratio x total of Part C,D,E,F and G
CONPONENTS, (%) CONPONENTS, PhpITEMNO.
DESCRIPTION UNIT
TABLE 15.9.1-1 UNIT PRICE LIST ((2/2)
15-34
15-34

(3) Estimated Construction Cost Estimated construction cost for Pinaring-Simsiman Road and Tamontaka-Tapia Road is shown in Table 15.9.1-2 and 15.9.1-3, respectively.
TABLE 15.9.1-2 ESTIMATED CONSTRUCTION COST (PINARING-SIMSIMAN ROAD)
(Unit: Million PhP)
Unskilled Laborer
Part A Facilities for the Engineer 13.95 7.89 3.69 0.48 2.37
Part B Other General Requirement 13.95 7.89 3.69 0.48 2.37
Part C Earthworks 99.25 55.52 23.77 1.18 19.96
Part D Subbase and Base Course 20.14 10.74 6.27 0.06 3.13
Part E Surface Course 298.06 175.93 73.77 13.36 48.36
Part F Structures 16.08 7.60 6.00 0.58 2.48
Part G Drainage & Slope Protection Structure 31.48 13.18 13.13 0.81 5.17
Part H Miscellaneous 27.66 15.77 7.19 0.43 4.70
Part I Dayworks 9.30 5.26 2.46 0.32 1.58
Part J Provisional Sums 9.30 5.26 2.46 0.32 1.58
Part K Physical Contingencies 69.76 39.45 18.44 2.40 11.87
608.93 344.49 160.87 20.42 103.57Grand Total
ITEM/DESCRIPTION Total Foreign Local Taxes
TABLE 15.9.1-3 ESTIMATED CONSTRUCTION COST (TAMONTAKA-TAPIAN ROAD)
(Unit: Million PhP)
Unskilled Laborer
Part A Facilities for the Engineer 11.98 6.73 3.25 0.41 2.00
Part B Other General Requirement 11.98 6.73 3.25 0.41 2.00
Part C Earthworks 64.65 36.06 16.43 0.73 12.16
Part D Subbase and Base Course 17.03 9.08 5.30 0.05 2.65
Part E Surface Course 255.83 150.77 63.56 11.30 41.50
Part F Structures 26.08 12.60 9.25 0.85 4.23
Part G Drainage & Slope Protection Structure 35.84 15.89 13.94 0.86 6.01
Part H Miscellaneous 23.25 13.25 6.05 0.36 3.95
Part I Dayworks 7.99 4.49 2.17 0.28 1.33
Part J Provisional Sums 7.99 4.49 2.17 0.28 1.33
Part K Physical Contingencies 59.91 33.66 16.27 2.07 9.98
522.53 293.75 141.64 17.60 87.14Grand Total
ITEM/DESCRIPTION Total Foreign Local Taxes
15-35

15.9.2 ENGINEERING SERVICES COST
The cost for engineering services is estimated as shown in Table 15.9.2-1 and 15.9.2-2, on the basis of the proposed manning schedule (refer to Annex 15-3).
TABLE 15.9.2-1 ENGINEERING SERVICES COST: PINARING-
SIMSIMAN ROAD
15-36
Detailed Design 25.37
Tender Assistance 10.74
Construction Supervision 60.84
Grand Total 96.95
DESCRIPTION TotalUnskilled Laborer
12.64 10.99 1.10 1.74
6.80 3.42 0.56 0.52
24.78 31.43 3.67 4.63
44.22 45.84 5.33 6.89
Local
(Unit: Million PHP)
Foreign Taxes
TABLE 15.9.2-1 ENGINEERING SERVICES COST: TAMONTAKA-TAPIAN ROAD
Unskilled Laborer
12.64 10.99 1.10 1.74
6.80 3.42 0.56 0.52
23.45 28.97 3.37 4.27
42.89 43.38 5.03 6.53
(Unit: Million PHP)
Foreign Local Taxes
Detailed Design 25.37
Tender Assistance 10.74
Construction Supervision 56.69
Grand Total 92.80
DESCRIPTION Total 15.10 PROJECT IMPLEMENTATION PLAN 15.10.1 Overall Implementation Schedule
Overall implementation schedule is shown in Table 15.10.1-1 for Pinaring-Simsiman Road and in Table 15.10.1-2 for Tamontaka-Tapian Road.

15-37
Preparation of the Tender Documents
Prequalification
Tendering
Tender Evaluation
Contracting
Mobilization
Construction Activities
1 Road Construction (Start - 1/4)
2 Road Construction (1/4 - 2/4)
3 Road Construction (2/4 - 3/4)
4 Road Construction (3/4 - End)
5 Drainage Work
6 Road Construction for Barangay Roads
7 Bridge Construction (Bridge No.1)
8 Slope Protection (Bridge No.2)
9 Slope Protection (Bridge No.3)
10 Slope Protection (Bridge No.4)
11 Traffic Facilities
Demobilization
2413 14 15 22211710 11 12 236 7 8 92 3 4 14 5 6 1
Designing
Evaluation & Approval on Tender Documents
8732 6
Fund Preparation Detailed Design Stage Tender Stage
411 510 12 1 2 3 4 7 39 510 2611 4 91
Const
ruct
ion S
tage
12
Distributing of Tender Documents
Supplemental Survey
4 76 8
Det
aile
dD
esig
n S
tage
Ten
der
Sta
ge
11 12 1
16
8
Construction Stage
2 3 4 5
Fund Preparation
Month 9
18
10
1 3 1 2 3
2012 2013Year
Stage
2010 2011
2
5
19 20
TABLE 15.10.1-1 IMPLEMENTATION SCHEDULE FOR PINARING-SIMSIMAN ROAD
15-37

Preparation of the Tender Documents
Prequalification
Tendering
Tender Evaluation
Contracting
Mobilization
Construction Activities
1 Road Construction (Start - 1/4)
2 Road Construction (1/4 - 2/4)
3 Road Construction (2/4 - 3/4)
4 Road Construction (3/4 - End)
5 Drainage Work
6 Road Construction for Barangay Roads
7 Bridge Construction (Bridge No.1)
8 Slope Protection (Bridge No.2)
9 Slope Protection (Bridge No.3)
10 Slope Protection (Bridge No.4)
11 Traffic Facilities
Demobilization
Const
ruct
ion S
tage
6
Distributing of Tender Documents
Supplemental Survey
1 1
Ten
der
Sta
ge
Designing
Evaluation & Approval on Tender Documents
14 20145 1918434 227 136 8 9 10 2113 2
Det
aile
dD
esig
n S
tage
2
Fund Preparation
2 11 12 155323
2012
6
16 17
911 3
Year 2010 2011
7 8 9 10Month 4 5 6 12 1 2 4 5 6 7 8 9 10 11 12 1 2 3 14 5 7 8
2013
2
StageFund Preparation Detailed Design Stage Tender Stage Construction Stage
10 11 12
TABLE 15.10.1-2 IMPLEMENTATION SCHEDULE FOR TAMONTAKA-TAPIAN ROAD
15-38
15-38

(1) Detailed Design Stage
In addition to the survey data prepared in the preliminary design stage, the following supplemental surveys are to be carried out during the detailed design stage:
- Cross-Sectional Survey at 20 m interval, - Geotechnical Survey (Boring, Penetration Test and Sampling) at 500 m
interval and - Geotechnical Survey (Boring, Penetration Test and Sampling) at the
locations of bridges
To be prepared in the detailed design stage are the tender documents, including the tender drawings and specifications for the construction works, which will be used mainly for the bidding and contracting procedures. The major construction work items are as listed below:
- Road construction including earthworks, pavement works and traffic
facilities; - Drainage construction including pipe culverts; and - Bridge construction.
The detailed design stage is estimated to be six (6) months, as shown in Table 15.10.1-3.
TABLE 15.10.1-3 DETAILED DESIGN PERIOD
Items of Work Estimated Period
1. Supplemental Survey including Reporting 1.5 months 2. Designing 3.0 months 3. Preparation of the Tender Documents 1.0 months 4. Evaluation and Approval of Tender Documents 0.5 months
Total 6.0 months
(2) Tender Stage
Fast-truck tendering was assumed as shown in Table 15.10.1-4.
TABLE 15.10.1-4 PERIOD OF TENDERING STAGE Items of Work Estimated Period
1. Prequalification of Bidders/Contractors 1.5 months 2. Distribution of Tender Documents 1.5 months 3. Tender Evaluation 0.5 months 4. Contracting 0.5 months
Total 4.0 months
15-39
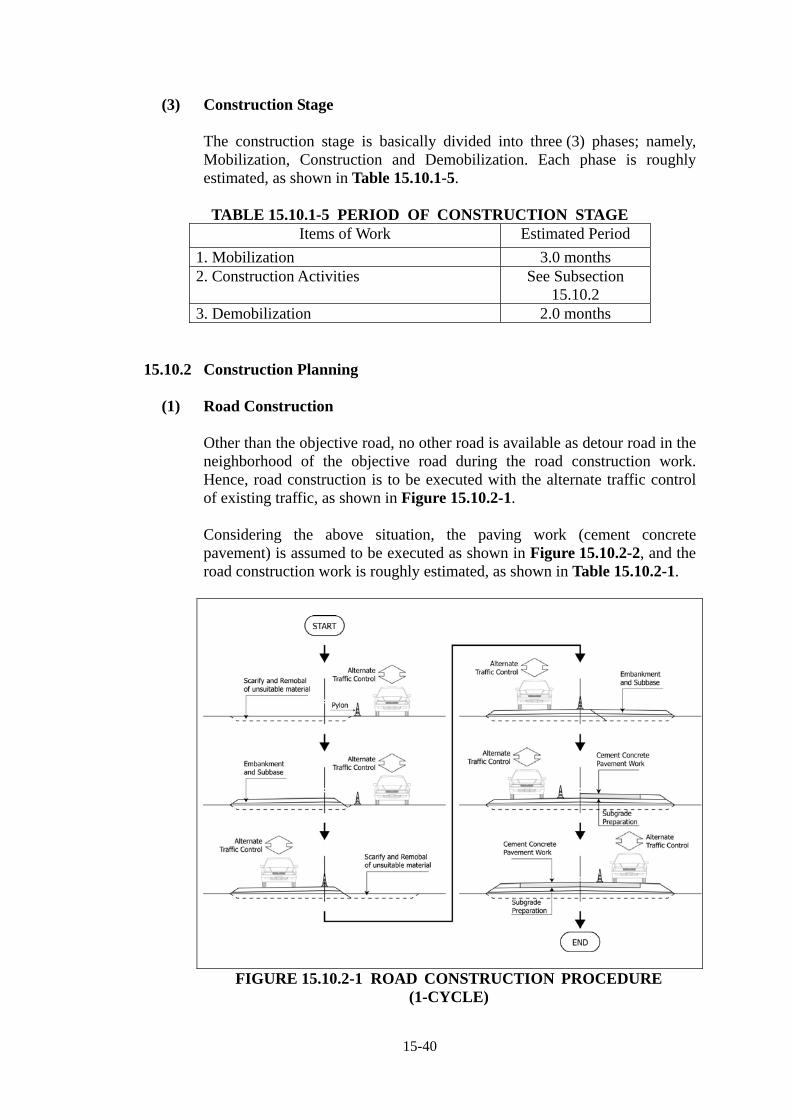
(3) Construction Stage
The construction stage is basically divided into three (3) phases; namely, Mobilization, Construction and Demobilization. Each phase is roughly estimated, as shown in Table 15.10.1-5.
TABLE 15.10.1-5 PERIOD OF CONSTRUCTION STAGE
Items of Work Estimated Period
1. Mobilization 3.0 months 2. Construction Activities See Subsection
15.10.2 3. Demobilization 2.0 months
15.10.2 Construction Planning
(1) Road Construction
Other than the objective road, no other road is available as detour road in the neighborhood of the objective road during the road construction work. Hence, road construction is to be executed with the alternate traffic control of existing traffic, as shown in Figure 15.10.2-1. Considering the above situation, the paving work (cement concrete pavement) is assumed to be executed as shown in Figure 15.10.2-2, and the road construction work is roughly estimated, as shown in Table 15.10.2-1.
FIGURE 15.10.2-1 ROAD CONSTRUCTION PROCEDURE (1-CYCLE)
15-40

FIGURE 15.10.2-2 SAMPLE OF PAVING PROCEDURE (1-CYCLE)
TABLE 15.10.2-1 PERIOD OF ROAD CONSTRUCTION WORK Period For 1-cycle (Length = 1,000m)
Work Items Quantities No. of Days Earthworks and Subbase 2,300 m3 17.0 daysScarifying and removal of unsuitable material @ left side
2,300 m3 17.0 days
Embankment @ left side 3,800 m3 32.0 daysSub-base work @ right side 4,600 m3 39.0 daysScarify and removal of unsuitable material @ right side
1,800 m3 14.0 days
Embankment @ right side 3,000 m3 25.0 daysSub-base work @ right side 3,600 m3 30.0 days
Total 157.0 daysCompressed 60.0 days
Paving Work Sub-grade preparation, Form and rebar work per 1 panel (100 m)
-- 2.0 days
Pouring Concrete per 1 panel (100 m) -- 1.0 daysFor 20 panels 20 x 3.0 days 60.0 days Total 60.0 days
Estimated Road Construction Period
Road Section Months
Pinaring-Simsiman Road
18.435 km / 4 parties = 4,600 m/party (4,600 m / 1,000 m) * 60 days / 25 days/month = 11.06 months 11.06 + 60 days / 25 days/month = 13.4 months → about 13.0 months
Tamontaka-Tapian Road
14.165 km / 4 parties = 3,500 m/party (3,500 m / 1,000 m) * 60 days / 25 days/month = 8.40 months 8.40 + 60 days / 25 days/month = 10.8 months → about 11.0 months
15-41

(2) Bridge Construction
As the results of the preliminary design, the following conditions are required for bridge construction:
- Temporary road is to be installed by using the timber bridge or pipe
culverts to detour the existing traffic prior to any bridge construction work;
- The existing bridge is to be removed; - The superstructure is to be built with the All Staging Method; and - The superstructure work is to be carried out during the dry season only.
The bridge construction period is roughly estimated, as shown in Table 15.10.2-1.
TABLE 15.10.2-1 BRIDGE CONSTRUCTION PERIOD
Items of Work Estimated Period 1. Installation of Temporary Road 0.50 months 2. Removal of the Existing Bridge 0.50 months 3. Piling Work 1.00 months 4. Bridge Excavation 0.25 months 5. Form & Rebar Work for Substructures 0.50 months 6. Concreting Work for Substructures including Curing 1.00 months 7. Installation of All Staging 1.00 months 8. Form & Rebar Work for Superstructures 1.00 months 9. Concreting Work for Superstructures including Curing 1.00 months 10. Guard-railing and Miscellaneous Work 1.50 months
Total 8.25 months Compressed 7.50 months
15.11 BARANGAY INTERVIEW SURVEY 15.11.1 Type of Surveys
Three types of survey were carried-out to get a better understanding on the socio-economic conditions of the people that are likely to benefit from the development of the two roads. These are shown in Table 15.11-1. Dates of barangay consultation meeting as well as detailed data of the surveys are presented in Annex 15-3.
TABLE 15.11-1 TYPE OF SURVEYS
Survey Type Pinaring –
Simsiman Road Tamontaka – Tapian Road
Total
Barangay Consultation Meeting (Focus Group Discussion)
28 barangays 7 barangays 35
barangays
Household Interview 560 H.H. 140 H.H. 700 H.H. Barangay Captain
Face-to-interview 28 captains 7 captains 35 captains
15-42

(1) Barangay Consultation Meeting (Focus Group Discussion)
The barangay consultation meeting is conducted to the 35 barangays within the influence are of the two roads. The participants are divided into three groups: members composing head of the family (adult male group), women group, and youth group. The idea is to collect all the needs of the barangay as perceived by its residents. Seven guide questions are then discuss with the help of facilitator. Among the questions is the identification of the three (3) most important needs of the barangay as well as their likely contribution to the project team if the road is improved.
(2) Household Interview
A four (4) page questionnaire is prepared for the household interview. A total of 20 households for each barangay were interviewed. The objective is to collect basic information that would describe their living condition such as family income and family expenditure. Source of livelihood is also sought as well as their farming practices. They were also asked on the negative impact brought by the poor road on their daily life as well as likely contribution they could provide to the project team if the road is improved.
(3) Barangay Captain Face-to-face Interview
A five (5) page questionnaire is prepared for the interview with the 35 barangay captains. The purpose is to collect basic information such as inventory of barangay facilities, presence of barangay cooperatives, volume of agricultural productions, size of farmland, size of irrigated rice paddy and other data relevant to agricultural activities.
15.11.2 Barangay Consultation Meeting
(1) Three (3) Important Barangay Needs
During the barangay consultation meeting, participants are asked by facilitator to enumerate all needs of the barangay that could support their livelihood. The list is then reduced to top three by pressing the participants to identify the top three most important needs of the barangay. Barangays under the Pinaring-Simsiman road have the following top priorities: road improvement, drinking water system, school building, and dyke (see Table 15.11.2-1). Of the following priorities, 61% of the barangays chose road improvement as top priority, 18% selected drinking water system and others chose school building, dyke and others (e.g. livelihood projects).
15-43

Barangays crossed by the Tamontaka – Tapian road on the other hand chose road improvement and livelihood projects. Of the seven (7) barangays, six (6) indicated that their top priority is improvement of the road. The lone barangay which did not selected road improvement chose livelihood projects. Detail needs of all barangays under the influence of the two roads are shown in Table 15.11.2-2.
Road Improvem
ent61%School
Building7%
Drinking Water
System18%
Dyke (Flood
control)7%
Others7%
Health Center14%
Irrigation4%
Others43%
School Building
7%
Drinking Water
System7%
Dryer14%
Livelihood
Projects11%
Drinking Water
System35%
Dryer4%
Dyke (Flood
control)4%
School Building
4%
Road Improvem
ent11%
Others24%
Livelihood
Projects7%
Health Center11%
First Priority Second Priority Third Priority
FIGURE 15.11.2-1 TOP 3 BARANGAY NEEDS (PINARING – SIMSIMAN ROAD)
Livelihood Projects
14%Health Center14%
School Building
14%
Drinking Water
System29%
Others29%
Road Improv
Livelihood Projects
14%
Others14%
Health Center29%
Drinking Water
System43%
ement
86%
Livelihood Projects
14%
First Priority Second Priority Third Priority
FIGURE 15.11.2-2 TOP 3 BARANGAY NEEDS (TAMONTAKA - TAPIAN ROAD)
15-44

15-45
TABLE 15.11.2-1 THREE (3) MOST IMPORTANT NEEDS BY BARANGAY 3 Most Important Needs of the Barangay Road
Name Mun. Barangay
First Second Third Ungap School building Barangay road Barangay trading center Raguisi Road improvement Drinking water system Foot Bridge
Pinaring Road improvement Drinking water system Dryer
Maidapa Drinking water system Barangay bridge Health center with facilities
Damaniog Road improvement School building Livelihood (farm inputs and equipment)
Ibotegen Road improvement Drinking water system Solar Dryer
Narra Road improvement Drinking water system School building (4 units for grade 3 to 6)
Katidtuan Drinking water system Elevated dryer Barangay pump boat
Kakar Dyke – to control the flood
Drinking water system Boat and fish landing
Banatin Road improvement Barangay bridge in Sitio Udzudan
Irrigation
Panatan Road improvement Health center with facilities
Bridge going to rice pad
Tula-tula (sitio of Alamada)
Road improvement Drinking water system Electricity from Alamada to Barangay Panatan
Sul
tan
Kud
arat
Limbo Road improvement Day care center Health center with facilities South Manuangan
Concreting the road Dyke for rice field Drainage
Banocagen Road Improvement Livelihood projects Warehouse
Bulocaon Drinking water system Road improvement School building
Malagakit Farm to market road Drainage
Simsiman Concrete road Drinking water system Health Center with facilities
Datu Binasing School building for Elementary and high school
Barangay road Drinking water system
Lower Baguer Barangay Road Drinking water system Health Center with facilities
Buricain Road improvement Drinking water system Dryer
Balacayon Barangay Road (Sitio Kulumpungan to Datu Binasing)
Health center Covered court
Matilac Housing project Livelihood programs Solar dryer Upper Pangangkalan
Dyke – to control the flood
Irrigation Livelihood project
Lower Pangangkalan
Drinking water system Boat and fish landing Livelihood project
Kadingilan Drinking water system Madrasah building Multi-purpose building
Datu Mantil Madrasah building Drinking water system Drinking water system
PIN
AR
ING
- S
IMS
IMA
N R
OA
D
Pigc
away
an
Libungan Torreta
Barangay road (Sitio Minanga)
Multi-purpose building Health center with facilities
Semba Road improvement Drinking water system Drainage
Dimapatoy Livelihood projects Drinking water system Post harvest facilities
Mompong Road improvement Barangay health center Additional school building
Linek Road improvement Drinking water system Boat and Fish landing
Badak Road improvement Barangay health center Madrasah
Kusiong Road improvement Livelihood projects Livelihood Projects TA
MO
NT
AK
A -
T
AP
IAN
RO
AD
Dat
u O
din
Sin
suat
Tapian Road improvement Public toilet for each sitio Drinking water system

(2) Negative Impact of the Poor Road
The barangay people attended the consultation meeting were also asked on the negative impact/difficulties cause by the poor condition of road. Answers often mentioned by the barangay people located on both roads are: delay in transporting their farm produce, high transportation cost, difficulty of students in attending their schools, low income due to the high transport cost, difficulty in bring patient to hospital and lack of business opportunities.
TABLE 15.11.2-2 PERCEIVED NEGATIVE IMPACT OF POOR
ROAD BY THE BARANGAY PEOPLE Road Name
Negative Impacts of the Poor Road
PIN
AR
ING
- S
IMS
IMA
N R
OA
D
Damage on the vehicles serving the barangay Damaged on farm products of farmers Delay on the business transactions of our barangay officials Delay of our transportation and transactions to the market Delay on transportation of farm products of farmer Difficult access of students to Madrasah Difficult access of students to school Difficult to bring patients to hospital Difficult to buy our daily needs from the market Very difficult to transport our farm products during rainy season Very dusty in the summer which causes illnesses High transportation cost/fare Isolation of barangay Low income for the farmers due to transportation cost Poor living condition due to lack of business opportunities and
high transportation cost Prone to accident because very slippery during rainy season Slow development of our barangay
TA
MO
NT
AK
A -
TA
PIA
N
RO
AD
Slow development of our barangay Prone to accident because very slippery during rainy season Delay on transportation of agricultural products Difficult access of students to school Difficult to deliver farm products Difficulties to bring patient to hospital in times of emergency Very dusty which causes illnesses Very high cost of transportation of people and farm products Very inconvenient for the people to go to Cotabato City Poor living condition because of high transport cost and lack of
business opportunity
15-46
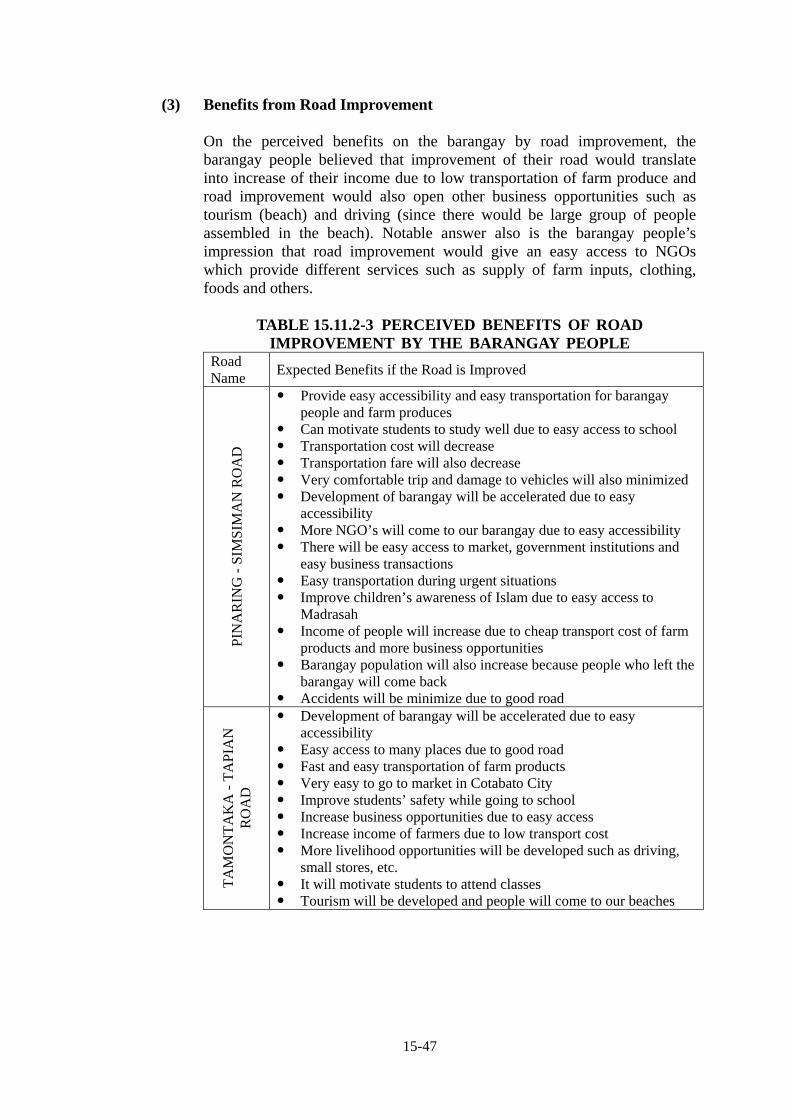
(3) Benefits from Road Improvement
On the perceived benefits on the barangay by road improvement, the barangay people believed that improvement of their road would translate into increase of their income due to low transportation of farm produce and road improvement would also open other business opportunities such as tourism (beach) and driving (since there would be large group of people assembled in the beach). Notable answer also is the barangay people’s impression that road improvement would give an easy access to NGOs which provide different services such as supply of farm inputs, clothing, foods and others.
TABLE 15.11.2-3 PERCEIVED BENEFITS OF ROAD
IMPROVEMENT BY THE BARANGAY PEOPLE Road Name
Expected Benefits if the Road is Improved
PIN
AR
ING
- S
IMS
IMA
N R
OA
D
Provide easy accessibility and easy transportation for barangay people and farm produces
Can motivate students to study well due to easy access to school Transportation cost will decrease Transportation fare will also decrease Very comfortable trip and damage to vehicles will also minimized Development of barangay will be accelerated due to easy
accessibility More NGO’s will come to our barangay due to easy accessibility There will be easy access to market, government institutions and
easy business transactions Easy transportation during urgent situations Improve children’s awareness of Islam due to easy access to
Madrasah Income of people will increase due to cheap transport cost of farm
products and more business opportunities Barangay population will also increase because people who left the
barangay will come back Accidents will be minimize due to good road
TA
MO
NT
AK
A -
TA
PIA
N
RO
AD
Development of barangay will be accelerated due to easy accessibility
Easy access to many places due to good road Fast and easy transportation of farm products Very easy to go to market in Cotabato City Improve students’ safety while going to school Increase business opportunities due to easy access Increase income of farmers due to low transport cost More livelihood opportunities will be developed such as driving,
small stores, etc. It will motivate students to attend classes Tourism will be developed and people will come to our beaches
15-47

(4) On Whether they Would Agree to Improve the Road
All people attended in the barangay consultation meeting held in the 35 barangays recognized the importance of good road. Their most common reasons for agreeing to have the road improved are: (i) this will make easy our delivery of farm products to market, (ii) this will increase our income and (iii) this will help develop our barangay.
TABLE 15.11.2-4 BARANGAY PEOPLE’S RESPONSE IF THEY
WOULD AGREE TO ROAD IMPROVEMENT Road Name
Mun. Barangay Agree/Not
Agree Reason(s)
Ungap Agree For comfortable transportation and fast transaction
Raguisi Agree For easy transactions like delivery of farm produce, buying household needs from the market
Pinaring Agree For comfortable transportation of people and farm produce
Maidapa Agree To easily accomplish activities necessary for living and for easy transportation
Damaniog Agree For easy delivery of farm produce
Ibotegen Agree For comfortable transportation
Narra Agree For easy delivery of produce and for easy access of tourists
Katidtuan Agree To improve living condition and easy transportation
Kakar Agree For easy delivery of farm produce
Banatin Agree For easy delivery of farm produce
Panatan Agree For easy delivery of farm produce
Tula-tula (sitio of Alamada) Agree For a comfortable community
Sul
tan
Kud
arat
Limbo Agree For easy access to city proper South Manuangan Agree For easy transportation of farm produce and people Banocagen Agree For comfortable life and help increase our income
Bulocaon Agree For easy transportation of farm produce and people
Malagakit Agree For easy and fast delivery of farm produce
Simsiman Agree For the development of our barangay
Datu Binasing Agree For the enhancement of the road, improvement of our barangay, and easy delivery of farm produce
Lower Baguer Agree So we can easily reach Cotabato City anytime we want
Buricain Agree For the development of our barangay, as well as for the attainment of peace and order to the community
Balacayon Agree For the betterment of the community
Matilac Agree For the development of barangay
Upper Pangangkalan Agree For the development of barangay
Lower Pangangkalan Agree For the development of the barangay and it can open up business opportunities
Kadingilan Agree For the development of the barangay
Datu Mantil Agree For the development of the barangay
PIN
AR
ING
- S
IMS
IMA
N R
OA
D
Pigc
away
an
Libungan Torreta Agree For the development of the barangay Semba Agree For improvement of living condition Dimapatoy Agree For improvement of living condition
Mompong Agree For easy access to Cotabato City to deliver farm produce and buy household needs
Linek Agree For easy transportation of farm produce
Badak Agree For more convenient transportation
Kusiong Agree For easy transportation of catches fish and easy access of tourists (beach)
TA
MO
NT
AK
A -
TA
PIA
N
RO
AD
Dat
u O
din
Sin
suat
Tapian Agree For the development of our barangay
15-48

(5) Employment Expectation of Barangay People
If the two roads under the feasibility study will be improved, it is necessary to take into account the expectation of the barangay people. During the meeting, they were asked if they expect to be hired as part of the team if the road is improved. All of them are expecting to be somehow part of the team as laborer or any other type of work that would suit them. Their main reason is to earn extra income aside from their permanent job. They also believed that having members of the barangay in the team would facilitate smooth implementation of the project since they could serve as the coordinator if problems arise.
TABLE 15.11.2-5 EMPLOYMENT EXPECTATIONS OF BARANGAY PEOPLE
Road Name Mun. Employment Expectation (from locals)
Ungap They want to be hired for any position for smooth implementation of the project
Raguisi They want to be hired for additional income
Pinaring They want to be hired as the project would generate employment from barangay people
Maidapa They want to join in the project if possible for employment
Damaniog They want to be hired for additional income
Ibotegen They want to be hired for any position for smooth implementation of the project
Narra They want to be hired for any position for smooth implementation of the project
Katidtuan They want to be hired for community employment and to earn extra income
Kakar They want to be hired for any position for smooth implementation of the project
Banatin They want to be hired for additional income
Panatan Yes, so that we can help also for the implementation of the said project.
Tula-tula They want to be hired for additional income
Sul
tan
Kud
arat
Limbo They want to join in the project if possible for employment
South Manuangan They want to join in the project if possible for employment
Banocagen They want to be hired for additional income
Bulocaon They want to be hired for additional income
Malagakit They want to be hired for additional income
Simsiman They want to join in the project if possible for employment
Datu Binasing Yes, we want to be hired to help the team and also for their security
Lower Baguer Yes, we want to join the project for whatever way we can help Buracain They want to be hired for additional income
Balacayon They want to join in the project if possible for employment
Matilac They want to be hired for additional income
Upper Pangangkalan They want to be hired for additional income
Lower Pangangkalan They want to join in the project if possible for employment
Kadingilan They want to join in the project if possible for employment
Datu Mantil They want to join in the project if possible for employment
PIN
AR
ING
- S
IMS
IMA
N R
OA
D
Pigc
away
an
Libungan Torreta They want to be hired for additional income
Semba They want to join in the project if possible for employment
Dimapatoy They want to join in the project if possible for employment and earn income
Mompong They want to be hired for additional income
Linek They want to be hired for additional income
Badak They want to join in the project if possible for employment and develop their skills
Kusiong They want to join in the project if possible for employment and earn income TA
MO
NT
AK
A -
T
AP
IAN
RO
AD
Dat
u O
din
Sin
suat
Tapian They want to join in the project if possible for employment
15-49

(6) Support from the Barangay People during the Implementation of the Project
A question of “in the future, if the road will be improved what support you could offer to the project team’ is posed to the barangay people during the meeting. Most of them are willing to offer security – meaning they will secure the equipment for construction as well as taking care of the staff working in the project.
TABLE 15.11.2-6 TYPE OF SUPPORT FROM THE BARANGAY PEOPLE
Road Name
Mun. Support from community
Ungap Security of materials and equipment
Raguisi Security of materials and equipment and assurance for the safety of workers
Pinaring Security of equipment and materials
Maidapa Assurance for the safety of workers
Damaniog Security of materials and equipment
Ibotegen Security of materials and equipment
Narra Security of materials and equipment and assurance for the safety of workers
Katidtuan Security of materials and equipment and assurance for the safety of workers
Kakar Security of materials and equipment and assurance for the safety of workers
Banatin Security of equipment and materials
Panatan Cooperation to the team working on the road
Tula-tula Security of materials and equipment
Sul
tan
Kud
arat
Limbo Security of materials and equipment
South Manuangan Security of materials and equipment and assurance for the safety of workers
Banocagen Security of materials and equipment
Bulocaon Cooperation to the team working on the road
Malagakit Security of materials and equipment and cooperation to the project team
Simsiman Security of equipment and materials
Datu Binasing Security of materials and equipment and assurance for the safety of workers
Lower Baguer Security of materials and equipment and assurance for the safety of workers
Buracain Security of materials and equipment and assurance for the safety of workers
Balacayon Security of materials and equipment and assurance for the safety of workers
Matilac Assurance for the safety of workers
Upper Pangangkalan Security of materials and equipment and assurance for the safety of workers
Lower Pangangkalan Security of materials and equipment and assurance for the safety of workers
Kadingilan Security of materials and equipment and assurance for the safety of workers
Datu Mantil Security of materials and equipment and assurance for the safety of workers
PIN
AR
ING
- S
IMS
IMA
N R
OA
D
Pigc
away
an
Libungan Torreta Security of materials and equipment and assurance for the safety of workers
Semba Security of materials and equipment and assurance for the safety of workers
Dimapatoy Security of materials and equipment
Mompong Security of materials and equipment
Linek Security of materials and equipment
Badak Security of materials and equipment
Kusiong Security of materials and equipment TA
MO
NT
AK
A -
T
AP
IAN
RO
AD
Dat
u O
din
Sin
suat
Tapian Security of materials and equipment and assurance for the safety of workers
15-50

(7) Name of Roads they Want to be Improved
The barangay people were also asked to identify important roads they want to be improved which they believed could help improve their livelihood. Table 15.11.2-7 shows the list of roads barangay people wanted for improvement.
TABLE 15.11.2-7 BARANGAY ROAD PEOPLE WANTED TO IMPROVE
Road Name
Mun.
Which Brgy. Road(s) to Improve
Ungap Crossing Pinaring to Manuangan (all-weather road)
Raguisi Crossing Pinaring to Brgy. Raguisi.
Pinaring Crossing Pinaring toNational Highway
Maidapa Maidapa to Crossing Pinaring
Damaniog Crossing Pinaring to Brgy. Damaniog and Barangay Damaniog to Brgy. Ladia
Ibotegen Crossing Pinaring to Brgy. Manuangan
Narra Crossing Pinaring to Brgy. Narra
Katidtuan Provincial road to Brgy Katidtuan
Kakar Brgy. road of Kakar going to Narra to Banatin
Banatin From Panatan to Sitio Udzudan (Brgy. Banatin)
Panatan Brgy. Panatan to Crossing Pinaring and Brgy. Panatan to Alamada
Tula-tula Brgy. Alamada to Brgy. Panatan
Sul
tan
Kud
arat
Limbo Datu Paisal Talusan Street – Limbo Proper Sitio Torres Street – Limbo Proper Datu Talusan Street – Limbo Proper
South Manuangan From South Manuangan to the boundary of Banucagon
Banocagen From South Manuangan to Banocagen
Bulocaon From Bulucaon to Banucagon
Malagakit From South Manuangan to Malagakit
Simsiman Provincial road to Sitio Bangon
Datu Binasing Datu Binasing to Pinaring and Datu Binasing to Manuangan
Lower Baguer Lower Baguer to Datu Binasing and Lower Baguer to Pangankalan
Buracain Provincial road to Brgy. Buricain
Balacayon Balacayon to Datu Binasing
Matilac Matilac to Sitio Silungan
Upper Pangangkalan Upper Pangankalan to Lower Baguer road
Lower Pangangkalan Lower Pangangkalan to Lower Baguer (dyke is necessary)
Kadingilan Sitio Sampalok to Kadingilan
Datu Mantil Provincial road to Datu Mantil
PIN
AR
ING
- S
IMS
IMA
N R
OA
D
Pig
caw
ayan
Libungan Torreta Provincial road to Sitio Minanga
Semba Proper Semba – Tamontaka Riverbank Sitio Siawan – Tamontaka Riverbank
Dimapatoy Sitio Nabilan – Provincial road Sitio Fishing landing – provincial road
Mompong Provincial road – Sitio Balalaan Provincial road – Sitio Tambir Provincial road – Sitio Ling
Linek Brgy. Linek proper – Sitio Lasdan Brgy. Linek proper – Sitio Gagadiao
Badak Provincial road – Sitio Siringanen – Sitio Kinuta Provincial road – Sitio Serung
Kusiong Sitio Madalay – Sitio Basalan – Upi Sitio Pinutulan – Provincial road T
AM
ON
TA
KA
- T
AP
IAN
RO
AD
Dat
u O
din
Sin
suat
Tapian Provincial road – Sitio Paraman
15-51

15.11.3 Household Interview Survey
1) Population
The total population of barangays under the influence of the Pinaring – Simsiman road is about 61,000. This figure represents 34% of the population living in the municipalities of Sultan Kudarat and Pigcawayan. On the other hand, barangays covered by the Tamontaka – Tapian road is about 18,000 which represent 18% of the total population of Datu Odin Sinsuat Municipality.
TABLE 15.11.3-1 POPULATION SHARE OF BARANGAYS UNDER THE
FS ROADS Total Population Percentage
2000 2007 2000 2007
PINARING - SIMSIMAN Sultan Kudarat & Pigcawayan
145,869 180,719 100% 100%
Barangays on FS Road 41,954 61,628 29% 34%
TAMONTAKA - TAPIAN
Datu Odin Sinsuat 71,569 103,765 100% 100%
Barangays on FS Road 13,958 18,200 20% 18% Source: NSCB, 2009
Table 15.11.3-2 shows the population, annual growth rate and number of household of the barangays under the roads for feasibility. As mention, the Pinaring – Simsiman road belongs to the municipalities of Sultan Kudarat and Pigcawayan. Population increase in the barangays of Sultan Kudarat under the FS road is rather high which is around 6.6% (average) compared to the municipal average of 3.6%. The same is true to the barangays of Pigkawayan under FS where municipal average is just 2.2% but the average annual growth rate of the barangays under the FS is around 3.9%. Population annual growth rate of barangays under the Tamontaka – Tapian road is also high where except to barangays Dinaig Proper and Mompong, all exceeded 3%.
15-52

TABLE 15.11.3-2 BARANGAY POPULATION, ANNUAL GROWTH RATE AND NUMBER OF HOUSEHOLD
Population Road Name
Municipality/Barangay Name 2000 2007
Annual Growth Rate
No. of Household (2000 data)
SULTAN KUDARAT
Limbo 4,173 7,223 8.2 762 Ungap 1,392 2,017 5.4 231 Raguisi 1,586 2,430 6.3 261 Pinaring 1,937 2,779 5.3 299 Maidapa 1,445 2,137 5.7 265 Damaniog 1,531 2,019 4.0 247 Ibotegen 3,179 6,060 9.7 465 Nara 1,693 2,332 4.7 290 Katidtuan 4,060 5,544 4.6 603 Kakar 1,196 2,026 7.8 216 Banatin 1,294 1,952 6.0 184 Panatan 1,795 2,731 6.2 263 Alamada 1,165 2,059 8.5 234 PIGKAWAYAN South Manuangan 1,675 1,581 (0.8) 332 Banucagon 1,079 1,131 0.7 212 Bulucaon 2,505 3,048 2.8 461 Malagakit 473 606 3.6 100 Simsiman 1,002 1,847 9.1 213 Datu Binasing 961 984 0.3 175 Lower Baguer 516 712 4.7 95 Buricain 1,244 1,987 6.9 210 Balacayon 1,017 1,354 4.2 192 Matilac 1,405 1,433 0.3 264 Upper Pangangkalan 577 880 6.2 124 Lower Pangangkalan 485 1,024 11.3 105 Kadingilan 1,243 1,596 3.6 223 Datu Mantil 536 706 4.0 102
Pin
arin
g -
Sim
sim
an
Libungan Torreta 790 1,430 8.8 150 DATU ODIN SINSUAT Semba 3,508 5,262 6.0 659 Dinaig Proper 3,153 3,378 1.0 584 Mompong 1,221 1,369 1.6 241 Linek 1,219 1,509 3.1 231 Badak 1,610 2,121 4.0 365 Kusiong 1,376 1,815 4.0 259 T
amon
taka
- T
apia
n
Tapian 1,871 2,746 5.6 357 Source: NSCB, 2009
2) Occupation
The occupation of barangay people living the influence area of the two FS roads is shown in Figure 15.11.3-1. Farming (43%) and working as barangay official (16%) have a share of more than half in the Pinaring – Simsiman road indicating that the area is suited for agricultural activities. Barangays closer to Liguasan Marsh have their livelihood relied mostly on fishing.
15-53

For the barangay people living along the Tamontaka - Tapian road, most people captured by the survey are housewives (24%), farmers (21%), fishermen (19%) and barangay officials (19%). Fishermen have a substantial share since these barangays are along a shoreline.
0%
5%
10%
15%
20%
25%
30%
35%
40%
45%D
river
Far
mer
Bar
anga
yO
ffici
al
Gov
ernm
ent
Em
ploy
ee
Ow
ned
Bus
ines
s
Bar
anga
yH
ealth
Sta
ff
Fis
herm
an
Hou
sew
ife
Tea
cher
Car
pent
er
Oth
ers
Pinaring-Simsiman
Tamontaka-Tapian
FIGURE 15.11.3-1 OCCUPATION OF BARANGAY PEOPLE UNDER
THE FS ROADS
3) Household Size
Most of the families living along the Pinaring – Simsiman road have 4 to 6 members. This is followed by families having members of 1 to 3 and followed closely by those having 7 to 9 members. For the families living along the Tamontaka – Tapian road, around 55% have 4 to 6 members. Families with 7 to 9 members have a share of 20% and families with 1 to 3 members have 14% share.
0%
10%
20%
30%
40%
50%
60%
1~3 4~6 7~9 Above 10
Household Size
Pinaring-SimsimanTamontaka-Tapian
FIGURE 15.11.3-2 HOUSEHOLD SIZE OF
BARANGAY PEOPLE UNDER THE FS ROADS
15-54

4) Monthly Income
According to the figure from the National Statistics Coordinating Board (NSCB), the average annual family income in the ARMM region in 2006 is 88,632 pesos which is equivalent to 7,386 pesos per month. This means that family income of most families living the FS roads is way below that average in the ARMM region as shown in the Figure 15.11.3-3.
0%
5%
10%
15%
20%
25%
30%
35%
40%
45%
~3000 3001~5000 5001~7000 7001~9000 9001~12000 12001~15000 Above 15000
Monthly Income (Pesos)
Pinaring-Simsiman
Tamontaka-Tapian
FIGURE 15.11.3-3 MONTHLY FAMILY BARANGAY PEOPLE
UNDER THE FS ROADS
5) Source of Income
As shown in the figure below, most of the families are earning their income from farming, fishing, driving and salary from their government positions such as barangay official. It should be noted that most of those interviewed who give driving as their profession are actually driving either passenger motorbike or tricycle as shown in Figure 15.11.3-5.
0%
10%
20%
30%
40%
50%
60%
Salary Farming Fishing Driving Others
Source of Income
Pinaring-Simsiman
Tamontaka-Tapian
FIGURE 15.11.3-4 SOURCE OF INCOME
15-55

Figure 15.11.3-5 (left) Passenger Motorbike which could carry up to 5 passenger including the driver; (right) Tricycle is serving mostly until the barangay with good road
6) Family Expenditure and Breakdown
Figure 15.11.3-6 shows that a large number of families have monthly expenditure from the range of 3,000 pesos to 7,000 pesos. These expenditures are mostly spent for foods (56% for Pinaring – Simsiman and 61% for Tamontaka – Tapain) and followed by those spent for education, medicine, electricity and water, and farm inputs. It should be noted that ‘others’ normally refers to daily needs aside from food such as shampoo, soap, and materials for fishing.
0%
5%
10%
15%
20%
25%
30%
35%
40%
45%
~300
0
3001
~500
0
5001
~700
0
7001
~900
0
9001
~120
00
1200
1~15
000
Abo
ve 1
5000
Monthly Expenditure (Pesos)
Pinaring-Simsiman
Tamontaka-Tapian
0%
10%
20%
30%
40%
50%
60%
70%
Foo
d
Edu
catio
n
Med
icar
e
Ele
ctric
ity &
Wat
er
Far
m In
puts
Oth
ers
Expenditure Breakdown
Pinaring-Simsiman
Tamontaka-Tapian
FIGURE 15.11.3-6 MONTHLY EXPENDITURE AND BREAKDOWN OF EXPENDITURE
7) Farmland Ownership and Average Size of Cultivated Farm
Tenant farmers comprise around 27% of farmers along the Pinaring – Simsiman road and around 30% for Tamontaka – Tapian road as shown in Figure 15.11.3-7. This means that most of the farmers in the two areas are owner of their farmland. For the size of cultivated farmland, tenant farmers have smaller farmland (1.4 hectare for Pinaring – Simsiman road and 2.0 hectare for Tamontaka – Tapian road). Size of cultivated farm land based on the type of crop is shown in Figure 15.11.3-8. A closer look reveals that farmland for palay is larger in those irrigated areas.
15-56

0%
10%
20%
30%
40%
50%
60%
70%
80%
Tenant Farmers Farmers Ow ned Land
Pinaring - Simsiman
Tamontaka - Tapian
0
0.5
1
1.5
2
2.5
3
3.5
Tenant Farmers Farmers Ow ned Land
Hec
tare
(H
a)
Pinaring - Simsiman
Tamontaka - Tapian
FIGURE 15.11.3-7 OWNERSHIP OF FARMLAND AND AVERAGE SIZE OF FARMLAND
2.202.00
1.50 1.50
2.40
1.70
0.90
1.90
0.00
0.50
1.00
1.50
2.00
2.50
3.00
Palay(Irrigated)
Palay(Rainfed)
YellowCorn
White Corn
Hec
tare
Pinaring - Simsiman
Tamontaka - Tapian
FIGURE 15.11.3-8 AVERAGE SIZE OF
CULTIVATED FARMLAND
8) Agricultural Production
(i) Palay and Corn Yield
Obviously, irrigated rice paddy has a higher yield compared to those without supply of irrigation as shown by the figure below. The obvious reason is the ability of farmers to control the supply of water depending on the needs of the planted palay. In the same figure, it is observed that yield per hectare is higher in the rice paddies located along the Pinaring – Simsiman road that those in Tamontak – Tapian. This is perhaps due to the fertility of soil of the former since it is closer to Liguasan Marsh. The national average of palay yield per hectare is 3.8 indicating that Pinaraing-Simsiman has a higher yield (3.9). Rice paddy in Tamontaka – Tapian however has a lower yield which is just the same to the average of ARMM as reflected in Figure 15.11.3-9. Typical rice paddy is shown in Figure 15.11.3-10 and corn field is presented in Figure 15.11.3-11.
15-57

0.0
0.5
1.0
1.5
2.0
2.5
3.0
3.5
4.0
4.5
Irrigated Rainfed
To
nn
e
Pinaring - Simsiman
Tamontaka - Tapian3.8 3.6
3.1
3.9
3.1
0.0
0.5
1.0
1.5
2.0
2.5
3.0
3.5
4.0
4.5
Phi
lippi
nes
Min
dana
o
AR
MM
Pin
arin
g -
Sim
sim
an
Tam
onta
ka-
Tap
ian
To
nn
e
FIGURE 15.11.3-9 PALAY YIELD (TONNE/HECTARE)
Yield per hectare for both yellow corn and white corn is shown in Figure 15.11.3-12. Corn fields along the Pinaring – Simsiman road have a higher yield to those located in Tamontaka – Tapian road. Comparison of yield per hectare to national average is shown in Figure 15.11.3-13.
FIGURE 15.11.3-10 RICE PADDY ON BOTH SIDE OF THE ROAD
(PINARING - SIMSIMAN)
FIGURE 15.11.3-11 CORN FIELDS (PINARING – SIMSIMAN ROAD)
0.0
0.5
1.0
1.5
2.0
2.5
3.0
3.5
Yellow Corn White Corn
To
nn
e
Pinaring - Simsiman Tamontaka - Tapian
FIGURE 15.11.3-12 YELLOW CORN AND WHITE CORN YIELD (TONNE/HECTARE)
15-58

2.5 2.52.9 3.0
2.5
0.0
0.5
1.0
1.5
2.0
2.5
3.0
3.5
Phi
lippi
nes
Min
dana
o
AR
MM
Pin
arin
g -
Sim
sim
an
Tam
onta
ka-
Tap
ian
Yellow Corn
To
nn
e
1.7
2.6 2.7 2.7
2.2
0.0
0.5
1.0
1.5
2.0
2.5
3.0
Phi
lippi
nes
Min
dana
o
AR
MM
Pin
arin
g -
Sim
sim
an
Tam
onta
ka-
Tap
ian
White Corn
To
nn
e
FIGURE 15.11.3-13 CORN YIELD IN TONNE/HECTARE (NATIONAL AVERAGE, MINDANAO AVERAGE, AND ARMM AVERAGE)
(ii) Coconut and Mango
According to Philippine Coconut Authority, coconut plantations are producing 800 kg/ha on average which is just 40% of the total production potential of the plantations. The plantation along the Pinaring – Simsiman road is producing about 865 kg/ha and about 773 kg/ha for Tamontaka – Tapian road. For mango production, depending on the type of planted mangoes, a hectare of mango is normally produces between 400 kg to 1000 kg. Mango plantation along the Pinaring –Simsiman road is producing about 578 kg/ha while plantation along the Tamontaka – Tapian road is about 556 kg/ha.
0.0
100.0
200.0
300.0
400.0
500.0
600.0
700.0
800.0
900.0
1000.0
Coconut Mango
Kilo
gram
Pinaring - Simsiman
Tamontaka - Tapian
FIGURE 15.11.3-14 COCONUT AND MANGO PRODUCTION
R HECTARPE E
COCONUT TREES ALONG THE TAMONTAKA – TAPIAN ROAD
9) Frequency of Harvest
Frequency of harvest for each type of crop is shown in the two figures below. It can be observed that despite the supply of irrigated water (Pinaring – Simsiman road), some farmers are still harvesting once a year. Interview shows that this partly due to weak supply of water which could not cover the entire rice paddies.
15-59

On the other hand, some farmers are able to harvest three times a year even without the water supply of irrigation. This is due to water impounding technique where substantial amount of water is kept to serve the rice paddies through out the year.
0%
10%
20%
30%
40%
50%
60%
70%
80%
90%
100%
Pal
ay(I
rrig
ated
)
Pal
ay(R
ainf
ed)
Cor
n(Y
ello
w)
Cor
n (W
hite
)
Coc
onut
Man
go
Cof
fee
Once a year Tw ice a year Thrice a year Four times a year
0%
10%
20%
30%
40%
50%
60%
70%
80%
90%
100%
Pal
ay(I
rrig
ated
)
Pal
ay(R
ainf
ed)
Cor
n(Y
ello
w)
Cor
n (W
hite
)
Coc
onut
Man
go
Once a year Tw ice a year Thrice a year Four times a year
FIGURE 15.11.3-15 FREQUENCY OF HARVEST (PINARING – SIMSIMAN
ROAD)
FIGURE 15.11.3-16 FREQUENCY OF HARVEST (TAMONTAKA – TAPIAN
ROAD)
10) Transportation Cost of Agricultural Produce
The share of transportation cost on agricultural produce and fisheries of barangays along the Pinaring – Simsiman road is as follows: 7% for palay, 9% for corn, 5% for coconut, 3% for fish and 4% for coffee. Shifting to Tamontaka – Tapian road, the following figures are arrived: 5% for palay, 8% for corn, 5% for coconut, 3% for fish and 4% for coffee.
11.2 9.4
17.0
25.8
62.655.5
0.81 0.81 0.86 0.85 2.40 0.860.0
10.0
20.0
30.0
40.0
50.0
60.0
70.0
80.0
Pal
ay
Cor
n
Coc
onut
Man
go
Fis
h
Cof
fee
Pinaring - Simsiman
Pes
os
Selling price per kiloTrasport cost per kilo
13.59.3
15.7
28.3
82.5
0.64 0.75 0.86 0.98 1.090.0
10.0
20.0
30.0
40.0
50.0
60.0
70.0
80.0
Pal
ay
Cor
n
Coc
onut
Man
go
Fis
h
Tamontaka - Tapian
Pes
os
Selling price per kiloTrasport cost per kilo
FIGURE 15.11.3-17 TRANSPORTATION COST
(PINARING – SIMSIMAN ROAD)
FIGURE 15.11.3-18 TRANSPORTATION COST
(TAMONTAKA – TAPIAN ROAD)
15-60

FIGURE 15.11.3-19 VEHICLE TRANSPORTING AGRI-
PRODUCTS SUCH AS BANANA, COPRA AND FIRE WOODS
(TAMONTAKA – TAPIAN ROAD)
FIGURE 15.11.3-20 MOTORBIKE USES TO TRANSPORT COCONUT COPRA (PINARING – SIMSIMAN
ROAD)
15-61

15.11.4 Barangay Captain Face-To-Face Interview
1) Cooperatives in the Barangay Cooperatives can be a source of farm inputs, post harvest facilities and even credit and financing from the Cooperative Development Authority. Most of the barangays located in the two roads have existing cooperatives. For the cooperative that is not active anymore, reasons include lost of interest by the members, dysfunctional organizations, etc.
TABLE 15.11.4-1 ACTIVE AND INACTIVE COOPERATIVES Cooperative Road
Name Mun. Barangay name
Active Not Ungap - - Raguisi - - Pinaring - - Maidapa 2 - Damaniog - - Ibotigen - 2 Narra 2 - Katidtuan 2 1 Kakar - - Banatin - - Panatan 2 - Alamada 1 -
Sul
tan
Kud
arat
Limbo 2 - South Manuangan - - Banucageon 1 - Bulucaon 1 - Malagakit - - Simsiman 2 - Datu Binasing - 1 Lower Baguer - - Buricain - 1 Balacayon - 2 Matilac 3 1 Upper Pangankalan - - Lower Pangankalan - - Kadingilan - - Datu Mantil - 1
PIN
AR
ING
- S
IMS
IMA
N R
OA
D
Pig
caw
ayan
Libungan Toreta 1 - Semba 2 - Dinaig Proper 1 - Brgy.Mompong 2 - Linek - - Badak 1 - Kusiong - -
TA
MO
NT
AK
A -
T
AP
IAN
RO
AD
Dat
u O
din
Sin
suat
Tapian 4 -
15-62

2) Barangay Facilities
An inventory of barangay facilities is also carried through interview to the barangay captain of each baragay where barangay facilities like boat landing and multi-purpose building as shown in Figures 15.11.4-1 and 15.11.4-2 are accounted. The following figures were obtained through interview:
Pinaring – Simsiman Road
22 of 28 barangays have school building for elementary students; 10 of 28 barangays have school building for high school students; 16 of 28 barangays have health center; 18 of 28 barangays have barangay hall (multi-purpose building); 9 of 28 barangays have drinking water system; 9 of 28 barangays have warehouse; 24 of 28 barangays have dryer; 21 of 28 barangays have daycare center.
Tamontaka - Tapian Road
6 of 7 barangays have school building for elementary students; 3 of 7 barangays have school building for high school students; 6 of 7 barangays have health center; 5 of 7 barangays have barangay hall (multi-purpose building); 3 of 7 barangays have drinking water system; 2 of 7 barangays have warehouse; 4 of 7 barangays have dryer; 5 of 7 barangays have daycare center.
15-63

TABLE 15.11.4-2 AVAILABLE FACILITIES TO EACH BARANGAY
Road Name Mun. Barangay Name
Elem
. Sch
ool
Hig
h Sc
hool
Hea
lth C
ente
r
Bara
ngay
H
all/M
ulti-
pu
rpos
e H
all
Wat
er S
uppl
y (n
ot d
eep
wel
l) W
areh
ouse
Dry
er
Day
care
Cen
ter
Chu
rch
Day
care
Cen
ter
Mad
rasa
h
Oth
ers
Ungap Raguisi Pinaring Maidapa Damaniog Ibotigen Irrigation Narra Katidtuan Kakar Banatin Panatan Alamada
Sulta
n Ku
dara
t
Limbo South Manuangan Banucageon Bulucaon Malagakit Simsiman Datu Binasing Lower Baguer Buricain Balacayon Matilac Upper Pangankalan Lower Pangankalan Kadingilan Datu Mantil
PIN
ARIN
G -
SIM
SIM
AN R
OAD
Pigc
away
an
Libungan Toreta Boat Landing Semba Dinaig Proper Boat Landing Brgy.Mompong Linek Badak Kusiong Beach Resort TA
MO
NTA
KA -
TAPI
AN R
OAD
Dat
u O
din
Sins
uat
Tapian Boat Landing Note:
Available
15-64

FIGURE 15.11.4-1 BOAT LANDING DONATED BY THE
USAID IN BARANGAY TAPIAN
FIGURE 15.11-4-2 MULTI-PURPOSE BUILDING DONATED BY THE ARMM SOCIAL FUND
IN BARANGAY BADAK
3) Size of Rice Paddy and Total Irrigated Area Based on the interview to the barangay captains, the total rice paddy of barangays along the Pinaring – Simsiman Road is about 5,583 hectares. Of these, 92% of the area is irrigable however only 1,062 ha of 5,174 irrigable have irrigation system. This means that around 80% of the rice paddy lacks supply of irrigation water. For the barangays located along the Tamontaka – Tapian Road, the total rice paddy is around 466 hectares. Thirty eight (38) hectares of the 354 irrigable areas are already supplied by irrigation water.
15-65

TABLE 15.11.4-3 SIZE OF RICE PADDY
Road Name
Mun. Barangay name Total Rice Paddy (Ha)
Irrigated (Ha)
Potential for Irrigation but
not yet Irrigated (Ha)
Ungap 10 0 15 Raguisi 840 0 800 Pinaring 300 11 40 Maidapa 150 0 150 Damaniog 70 0 70 Ibotigen 350 350 0 Narra 170 0 170 Katidtuan 257 0 257 Kakar 100 50 50 Banatin 60 0 60 Panatan 155 55 100 Alamada 20 0 20
Sul
tan
Kud
arat
Limbo 96 96 0 South Manuangan 50 20 30 Banucagen 200 150 160 Bulucaon 300 265 35 Malagakit 60 0 35 Simsiman 85 65 30 Datu Binasing 300 0 300 Lower Baguer 80 0 80 Buricain 50 0 30 Balacayon 50 0 50 Matilac 500 0 300 Upper Pangankalan 320 0 320 Lower Pangankalan 360 0 360 Kadingilan 450 0 450 Datu Mantil 120 0 120
PIN
AR
ING
- S
IMS
IMA
N R
OA
D
Pig
caw
ayan
Libungan Toreta 80 0 80
Sub-Total 5,583 1,062 4,112 Semba 30 0 80 Dinaig Proper 160 0 160 Brgy.Mompong 20 0 50 Linek 53 33 20 Badak 0 0 0 Kusiong 200 5 3 T
AM
ON
TA
KA
-
TA
PIA
N R
OA
D
Dat
u O
din
Sin
suat
Tapian 3 0 3
Sub - Total 466 38 316
15-66

FIGURE 15.11.4-3 IRRIGATED RICE PADDY ALONG THE PINARING –
SIMSIMAN ROAD
FIGURE 15.11.4.4 RICE PADDY ALONG THE TAMONTAKA – TAPIAN
ROAD 15.12 ENVIRONMENTAL IMPACT ASSESSMENT 15.12.1 Needs Assessment
During the Barangay consultation meetings, needs of most important projects were asked. As presented in Table 15.11.2-1, need of road improvement is quite high. Among 35 barangays, 22 barangays answered that “road improvement” is the top priority for them, and 5 barangays as second priority. Thus, road improvement is quite important for the residents in the project influence areas.
15.12.2 Disadvantages of Poor Road Condition
As presented in Table 15.11.2-2, barangay people pointed out disadvantages of poor road as follows; Delay in transporting their farm products High transportation cost Difficulty of students in attending their schools Low income due to high transport Difficulty in bringing patients to a hospital Poor business opportunity
15.12.3 Perceived Benefits from Road Improvement
As presented in Table 15.11.2-3, perceived benefits from road improvement answered by barangay people are as follows;
15-67

PERCEIVED BENEFITS OF ROAD IMPROVEMENT
Development of barangay will be accelerated due to better accessibility
Easy access to many places due to good road Fast and easy transportation of farm products Very easy to go to market in Cotabato City Improvement in students’ safety when going to school Increase business opportunities due to easy access Increase income of farmers due to low transport cost More livelihood opportunities will be developed such as car rentals,
small stores, etc. It will motivate students to attend classes Tourism will be developed and people will come to our beaches
15.12.4 Social Acceptability
When asked if road improvement is acceptable, as presented in Table 15.11.2-4, a very high 100% agreement of barangay people was obtained. It is important to note that the people, particularly the male population also requested that they be given a chance to participate during project implementation as hired labourers or any other type of job that would suit them. They also committed to help provide security to the equipments to be used as well as to personnel who will be assigned during the construction period.
15.12.5 Impact Assessment and Mitigation Measures
1) Pinaring-Simsiman Road Predicted impacts and mitigation measures during pre-construction and construction phases are summarized in Table 15.12.5-1, and operation phase in Table 15.12.5-2.
15-68

TABLE 15.12.5-1 PREDICTED IMPACTS AND MITIGATION MEASURES DURING PRE-CONSTRUCTION AND CONSTRUCTION PHASES
Predicted and Assessed Impacts
Rating Proposed Mitigating Measures
ROW Acquisition NO Detailed design shall follow the design policy not to require ROW acquisition.
Involuntary Resettlement No Detailed design shall follow the design policy not to require involuntary resettlement.
Increase in noise level
B Schedule equipment move-in to blend with regular non-peak hour-daytime vehicular traffic; no night time movements
Provide barriers in work areas where use equipment with high noise power level is expected
Slope modification B Minimize land modification; follow established design consideration
Decreased public/ community access to or through the area
B Minimize obstruction to areas Provide alternative access in the event total road
closure is necessary Disruption of service utilities and infrastructures
B Coordinate with appropriate utility firms prior to project implementation
Ensure prompt and proper relocation of utility lines
Demolition of structures
B Minor only; mainly fences and extensions. Proper notification of, and compensation to owners of affected structures
Construction wastes B Construction wastes such as unsuitable soils, demolished box culvert materials, etc., shall be dumped at the location specified by the Engineer
Noise due to pile driving B Pile driving shall be undertaken only during daytime.
Dust caused by construction work
B Prior to the start of the work activities, proper measures such as watering shall be undertaken to minimize dusting
Increased housing requirement for transient workers, and project management staff
B Provide temporary bunkhouse on site or rent houses in neighboring communities if housing requirements cannot be accommodated in the locality where the project is located
Traverse areas with historical significance
No Coordinate with Local Cultural and Historical Affairs Commission to ensure proper handling of archaeological finds, if any
Increased hazards due to construction activities
B Provide safety equipment and appropriate warning signs along the route
Provide alternative use of the construction yard/staging area once the project demobilizes
Clear construction debris, form works and equipment and remove all obstructions
Minimize construction clutter, manage construction debris properly and provide barriers to reduce eye sores
Screen laborers (particularly if they come from other localities other than the project area) to prevent possible spread of HIV / AIDS. This can be done by requiring applicants to submit blood tests (for HIV detection) prior to hiring.
Cutting trees B Cutting trees shall be minimized, and transplanted. If cutting trees is inevitable, new trees in double number shall be planted.
Rating: A: Serious Impact is expected B: Some impact is expected C: Extent of impact is unknown No: No impact is expected
15-69

TABLE 15.12.5-2 PREDICTED IMPACTS AND MITIGATION MEASURES DURING OPERATION PHASE
Predicted and Assessed Impacts
Rating Proposed Mitigating Measures
Increase of traffic accident
B Traffic regulatory signs, warning signs shall be properly maintained to be always visible. If necessary humps, to reduce vehicle speed, shall be installed.
Localized flooding B Side ditches and pipe / box culverts shall be always cleaned so as to properly function.
Travel cost increase B Paved carriageway shall be properly maintained so as to provide smooth travel.
Obstruction at bridge opening
B Obstruction at the bridge opening shall be always removed to assure smooth water flow at bridge sites.
Disorderly urbanization B Concerned LGUs shall strictly enforce the zoning ordinance along the road
Rating: A: Serious Impact is expected B: Some impact is expected C: Extent of impact is unknown No: No impact is expected
2) Tamontaka-Tapian Road Predicted impacts and mitigation measures during pre-construction and construction phases are summarized in Table 15.12.5-3 and operation phase in Table 15.12.5-4,
15-70

TABLE 15.12.5-3 PREDICTED IMPACTS AND MITIGATION MEASURES DURING PRE-CONSTRUCTION AND CONSTRUCTION PHASES
Predicted and Assessed Impacts
Rating Proposed Mitigating Measures
ROW Acquisition No Detailed design shall follow the design policy not to require ROW acquisition.
Involuntary Resettlement No
Detailed design shall follow the design policy not to require involuntary resettlement.
Increase in noise level B Schedule equipment move-in to blend with regular non-peak hour-daytime vehicular traffic; no night time movements
Provide barriers in work areas where use equipment with high noise power level is expected
Slope modification B Minimize land modification; follow established design consideration
Decreased public/ community access to or through the area
B Minimize obstruction to areas Provide alternative access in the event total road
closure is necessary Disruption of service utilities and infrastructure
B Coordinate with appropriate utility firms prior to project implementation
Ensure prompt and proper relocation of utility lines Demolition of structures B Minor only; mainly fences and extensions. Proper
notification of, and compensation to owners of affected structures
Construction wastes B Construction wastes such as unsuitable soils, demolished box culvert materials, etc., shall be dumped at the location specified by the Engineer
Noise due to pile driving B Pile driving shall be undertaken only during day time.
Dust caused by construction work
B Prior to the start of the work activities, proper measures such as watering shall be undertaken to minimize dusting
Increased housing requirement for transient workers, and project management staff
B Provide temporary bunkhouse on site or rent houses in neighboring communities if housing requirements cannot be accommodated in the locality where the project is located
Traverse areas with historical significance
No
Coordinate with Local Cultural and Historical Affairs Commission to ensure proper handling of archaeological finds, if any
Increased hazards due to construction activities
B Provide safety equipment and appropriate warning signs along the route
Provide alternative use of the construction yard/staging area once the project demobilizes
Clear construction debris, form works and equipment and remove all obstructions
Minimize construction clutter, manage construction debris properly and provide barriers to reduce eye sores
Screen laborers (particularly if they come from other localities other than the project area) to prevent possible spread of HIV / AIDS. This can be done by requiring applicants to submit blood tests (for HIV detection) prior to hiring.
Cutting trees B Cutting trees shall be minimized, and transplanted. If cutting trees is inevitable, new trees in double number shall be planted.
Rating: A: Serious Impact is expected B: Some impact is expected C: Extent of impact is unknown No: No impact is expected
15-71
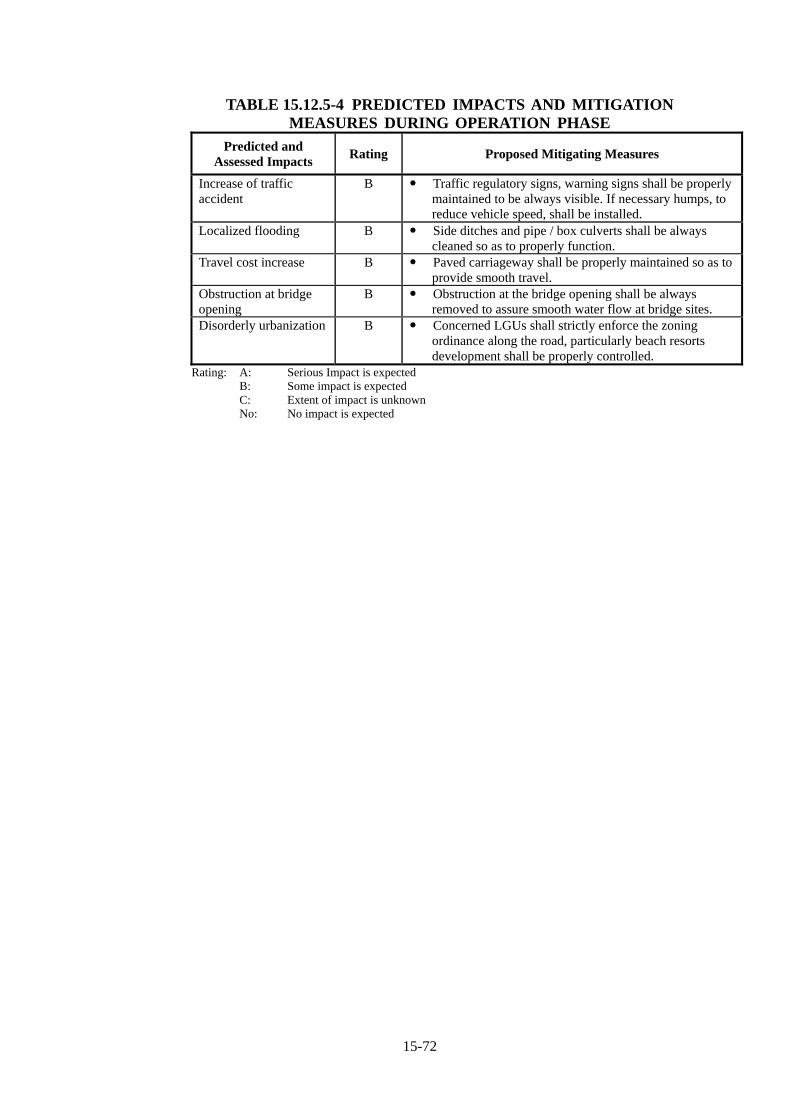
TABLE 15.12.5-4 PREDICTED IMPACTS AND MITIGATION MEASURES DURING OPERATION PHASE
Predicted and Assessed Impacts
Rating Proposed Mitigating Measures
Increase of traffic accident
B Traffic regulatory signs, warning signs shall be properly maintained to be always visible. If necessary humps, to reduce vehicle speed, shall be installed.
Localized flooding B Side ditches and pipe / box culverts shall be always cleaned so as to properly function.
Travel cost increase B Paved carriageway shall be properly maintained so as to provide smooth travel.
Obstruction at bridge opening
B Obstruction at the bridge opening shall be always removed to assure smooth water flow at bridge sites.
Disorderly urbanization B Concerned LGUs shall strictly enforce the zoning ordinance along the road, particularly beach resorts development shall be properly controlled.
Rating: A: Serious Impact is expected B: Some impact is expected C: Extent of impact is unknown No: No impact is expected
15-72

15.12.6 Environmental Management and Monitoring Plan
1) Environmental Management and Monitoring Plan Environmental management and monitoring plan (EMMP) is presented in Table 15.12.6-1.
2) Institutional Plan for EMMP Implementation
The institutional plan that will be implemented during project implementation of the project is presented in Figure 15.12.6-1. As shown in the said figure, the DPWH-ARMM shall be the Implementing Agency of the Project. The DPWH-ARMM Secretary shall have overall responsibility for all technical aspects of the project;
During the construction phase, the Contractor shall assign an Environment Safety and Health (ESH) Officer. In coordination with the DPWH-ARMM Environmental Specialist, he shall be responsible for implementing the Environmental Management and Monitoring Plan (EMMP) presented in Table 15.12.6-1 on the side of the Contractors.
Aside from the above mentioned tasks, the main duties of the ESH Officer shall be to:
(i) ensure that the other staff understand and properly carry out their
responsibilities; (ii) ensure that environmental monitoring activities are carried out in a
timely and accurate manner; (iii) implement an effective preventive and corrective control system,
particularly in terms of environmental emergency preparedness and response procedures;
(iv) collate performance data and prepare reports that includes an
assessment of performance vis-à-vis the EMMP objectives and targets, for submittal to DPWH-ARMM Environmental Specialist. To ensure effectiveness of the IEC, he shall also act as a liaison between DPWH-ARMM, DENR-ARMM, and the primary stakeholders, particularly the LGU of Datu Odin Sinsuat, other government agencies, and more importantly, the affected barangays. This task is particularly important in terms of receiving comments, views, complaints (if any), and other concerns from the stakeholders mentioned.
15-73

DPWH-ARMM
15-74
PROJECT MANAGEMENT TEAM
LOCAL SUPPORT STAFF/OFFICE ADMINISTRATION
ENVIRONMENTAL SAFETY/QUALITY ASSURANCE
SECTION
PROJECT MANAGEMENT
SUPPORT TEAM
CIVIL/ STRUCTURESECTION
CONTRACT ADMINISTRATION
QUALITY ASSURANCE
SECTION
PLANNING SECTION
FIGURE 15.12.6-1 INSTITUTIONAL PLAN FOR THE IMPLEMENTATION OF P I N A R I N G - S I M S I M A N R O A D A N D
TAMONTAKA-TAPIAN ROAD

15-75
TABLE 15.12.6-1 ENVIRONMENTAL MANAGEMENT AND MONITORING PLANCONSTRUCTION PHASE
Parameters to be Monitored
Stations to be Monitored Frequency of Monitoring
Methods of Analysis/Execution
DENR Standard Implementor
BIOLOGICAL Tree Cutting, if any Sites where trees will be cut Daily Site inspection Permit to Cut to be
secured by Contractor from DENR-ARMM prior to any cutting of trees
Environment, Safety, and Health (ESH) Personnel of Contractor, to be supervised by counterpart Environmental Specialist of DPWH-ARMM
PHYSICAL Daily Site inspection Visual only Pollution Control Officer (PCO) of Contractor to
be supervised by Environment, Safety, and Health (ESH) Personnel, also of Contractor
Air Quality (TSP, SO2 and NO2)
At all densely populated areas fronting construction site
Quarterly Air quality sampling and analysis: TPS (gravimetric method), SO2 (Pararosaniline method), NO2 (Griess-Saltzman method)
TSP – 300 uGN/NCM SO2 – 340 uGN/NCM NO2 – 260 uGN/NCM
Pollution Control Office (PCO) of Contractor to be supervised by Environment, Safety, and Health (ESH) Personnel, also of Contractor (Note: if Contractor does not have the necessary equipment, this maybe contracted out)
Noise Levels Particularly at areas where high noise generating equipment will be used
Daily for high noise level generating activities; Weekly for other activities during construction Investigation on a complaint basis shall be immediately undertaken
Noise Meter Noise = 85 dB(A) (For Areas fronting 2-lane roads)
Pollution Control Officer (PCO) of Contractor to be supervised by Environment, Safety, and Health (ESH) Personnel, also of Contractor
Solid waste management and disposal
Areas where hauling of unusable excavated materials and construction spoils are necessary Areas where temporary stockpiles are located
Daily Daily
Site inspection Site inspection
Based on IEE Pollution Control Officer (PCO) of Contractor to be supervised by Environment, Safety, and Health (ESH) Personnel, also of Contractor
15-75

15-76
SOCIAL Supply of Basic Utilities
Areas which will experience power/water supply interruptions due to disturbance utility lines (water, electricity, telecommunication) during construction
Depends on schedule of interruption. Investigation on a complaint basis shall be immediately undertaken
Site observation and receipt of complaints from affected population
Based on IEE Environment, Safety, and Health (ESH) Personnel of Contractor, to be supervised by counterpart Environmental Specialist of DPWH-ARMM in coordination with local offices of service provider
Traffic Management Road sections and crossings affected by construction activities
Daily Site observation shall be recorded
Based on IEE and Traffic Management Plan duly approved by DPWH-ARMM
Environment, Safety, and Health (ESH) Personnel of Contractor, to be supervised by counterpart Environmental Specialist of DPWH-ARMM
Safety of Pedestrians Construction areas along populated areas and other areas with commercial establishments, schools, and other institutional structures
Daily Investigation on a complaint basis shall be immediately undertaken
Site observation shall be recorded
Based on IEE Traffic Aides to be assigned by the Contractor Environment, Safety, and Health (ESH) Personnel of Contractor, to be supervised by counterpart Environmental Specialist of DPWH-ARMM
Compliance of Contractor to occupational health and safety rules and regulation
All construction areas Weekly Site inspection of work areas including sanitation facilities shall be recorded
Based on IEE Environment, Safety, and Health (ESH) Personnel of Contractor, to be checked by counterpart Environmental Specialist of DPWH-ARMM
15-76

15-77
OPERATION PHASE Parameters to be
Monitored Stations to be Monitored
Frequency of Monitoring
Methods of Analysis/Execution
DENR Standard Implementor
SOCIAL
Safety of Travel and Efficiency of System
Entire road section, including bridges
Monthly Check continuous, smooth, and safe travel along the road network, minimizing accidents
Based on DPWH Standard
DPWH –ARMM Bureau of Maintenance
Efficiency of traffic management measures and parking restrictions
Entire road section, including bridges
Monthly Site patrolling;
Strict implementation in traffic rules and regulations; and Stiff penalties for violators
Based on existing local Traffic Rules and Regulations
Traffic Patrol Group of concerned LGUs
Safety features for pedestrian traffic
Entire road section, particularly along populated areas, schools, hospitals
Monthly Site patrolling;
Strict implementation in usage of proper pedestrian crossings;
Strict implementation in traffic rules and regulations; and Stiff penalties for violators
Based Traffic Management Plan and existing local Traffic Rules and Regulations
Traffic Patrol Group of concerned LGUs
Cleanliness and aesthetic appeal
Entire road section, particularly along urban areas
Monthly Site monitoring;
Maintenance of landscaped areas; and
Stiff penalties for violators
Based on local ordinances
DPWH –ARMM Bureau of Maintenance
Concerned LGUs
15-77
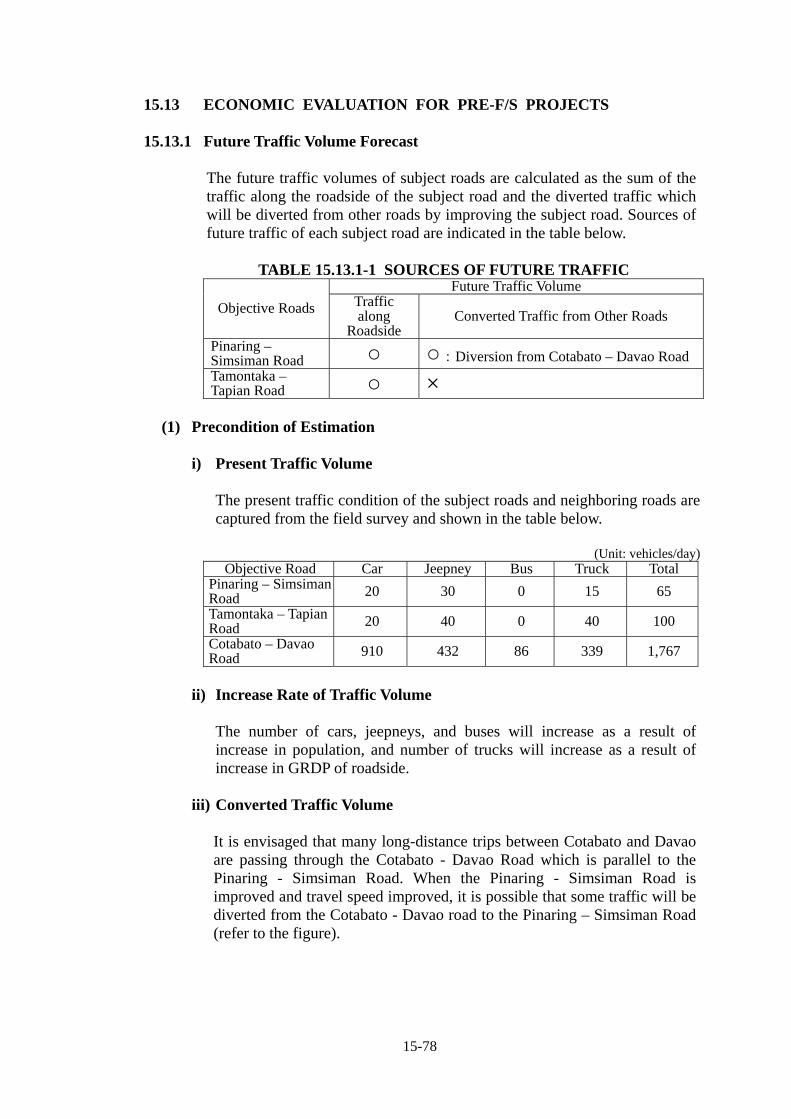
15.13 ECONOMIC EVALUATION FOR PRE-F/S PROJECTS 15.13.1 Future Traffic Volume Forecast
The future traffic volumes of subject roads are calculated as the sum of the traffic along the roadside of the subject road and the diverted traffic which will be diverted from other roads by improving the subject road. Sources of future traffic of each subject road are indicated in the table below.
TABLE 15.13.1-1 SOURCES OF FUTURE TRAFFIC
Future Traffic Volume
Objective Roads Traffic along
Roadside Converted Traffic from Other Roads
Pinaring – Simsiman Road ○ ○:Diversion from Cotabato – Davao Road Tamontaka – Tapian Road ○ ×
(1) Precondition of Estimation
i) Present Traffic Volume
The present traffic condition of the subject roads and neighboring roads are captured from the field survey and shown in the table below.
(Unit: vehicles/day)
Objective Road Car Jeepney Bus Truck Total Pinaring – Simsiman Road 20 30 0 15 65
Tamontaka – Tapian Road 20 40 0 40 100
Cotabato – Davao Road 910 432 86 339 1,767
ii) Increase Rate of Traffic Volume
The number of cars, jeepneys, and buses will increase as a result of increase in population, and number of trucks will increase as a result of increase in GRDP of roadside.
iii) Converted Traffic Volume
It is envisaged that many long-distance trips between Cotabato and Davao are passing through the Cotabato - Davao Road which is parallel to the Pinaring - Simsiman Road. When the Pinaring - Simsiman Road is improved and travel speed improved, it is possible that some traffic will be diverted from the Cotabato - Davao road to the Pinaring – Simsiman Road (refer to the figure).
15-78

Via Route ADistance 19.3 kmTime 20.7 minutes
Via Route BDistance 20.1 kmTime 20.1 minutes
12.8km(70km/h)
6.5km(40km/h)
20.1km(60km/h)
Route A
Route B
(Cotabato-Davao Route) (Pinaring-Simsiman Route)
FIGURE 15.13.1 COTABATO-DAVAO ROUTE AND PINARING-SIMSIMAN ROAD
It was assumed that around 10% of traffic of the Cotabato - Davao Road will be diverted to the Pinaring – Simsiman Road in 2013 after the road is improved, and 20% in 2015 and beyond.
(2) Result of Forecast
The results of traffic volume forecast are shown in Table 15.13.1-1. Traffic volume on the Pinaring – Simsiman Road is expected to reach 289 veh./day in 2013 after its improvement is complete. Traffic volume will further increase through diverted traffic from the Cotabato – Davao Road. As a result, 521 veh./day in 2015, 604 veh./day in 2020, 711 veh./day in 2025 are expected to use the road. On the other hand, the traffic volume on the Tamontaka - Tapian road is expected to reach 121 veh./day in 2013 after its improvement, to 131 veh./day in 2015, 158 veh./day in 2020, and 192 veh./day in 2025 as a result of increase of roadside population and economic development.
15-79
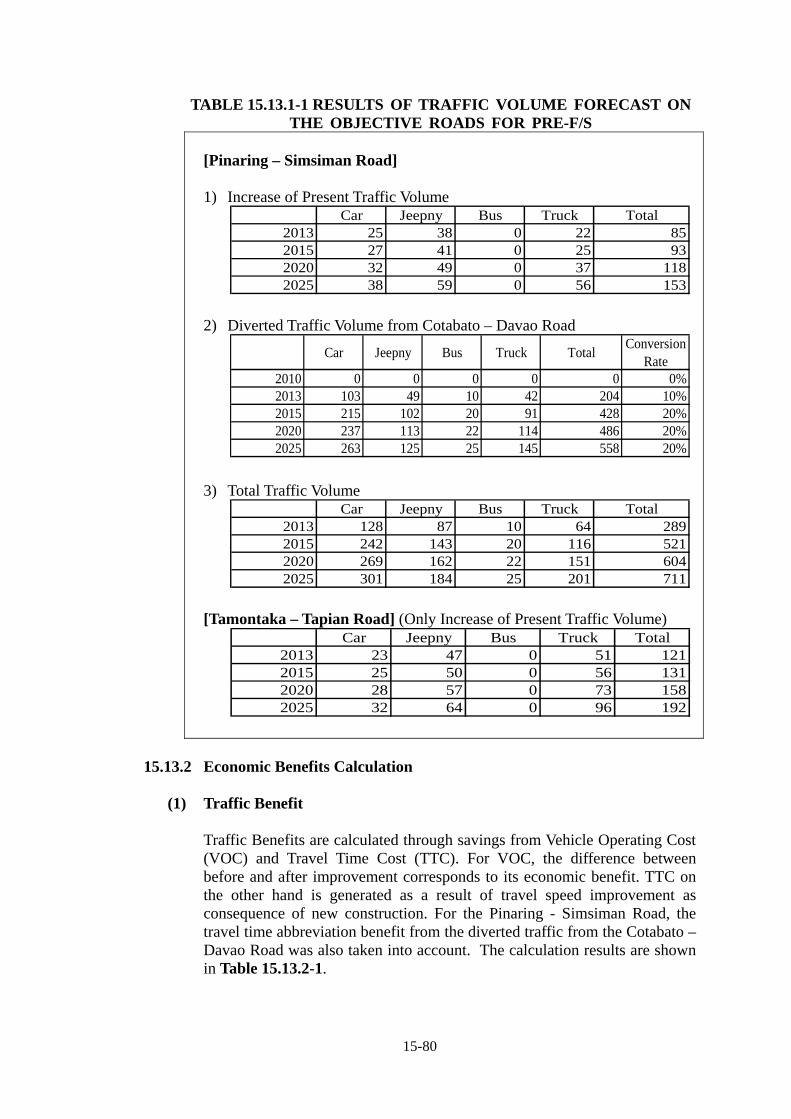
TABLE 15.13.1-1 RESULTS OF TRAFFIC VOLUME FORECAST ON THE OBJECTIVE ROADS FOR PRE-F/S
Car Jeepny Bus Truck Total2013 25 38 0 22 852015 27 41 0 25 932020 32 49 0 37 1182025 38 59 0 56 153
Car Jeepny Bus Truck TotalConversion
Rate2010 0 0 0 0 02013 103 49 10 42 204 10%2015 215 102 20 91 428 20%2020 237 113 22 114 486 20%2025 263 125 25 145 558 20%
0%
Car Jeepny Bus Truck Total2013 128 87 10 64 2892015 242 143 20 116 5212020 269 162 22 151 6042025 301 184 25 201 711
Car Jeepny Bus Truck Total2013 23 47 0 51 1212015 25 50 0 56 1312020 28 57 0 73 1582025 32 64 0 96 192
[Pinaring – Simsiman Road] 1) Increase of Present Traffic Volume
2) Diverted Traffic Volume from Cotabato – Davao Road
3) Total Traffic Volume
[Tamontaka – Tapian Road] (Only Increase of Present Traffic Volume)
15.13.2 Economic Benefits Calculation
(1) Traffic Benefit
Traffic Benefits are calculated through savings from Vehicle Operating Cost (VOC) and Travel Time Cost (TTC). For VOC, the difference between before and after improvement corresponds to its economic benefit. TTC on the other hand is generated as a result of travel speed improvement as consequence of new construction. For the Pinaring - Simsiman Road, the travel time abbreviation benefit from the diverted traffic from the Cotabato – Davao Road was also taken into account. The calculation results are shown in Table 15.13.2-1.
15-80

TABLE 15.13.2-1 TRAFFIC BENEFITS (SAVINGS OF VOC AND TTC) (Unit: 1,000PhP/year)
Year VOC TTC TOTAL Pinaring – Simsiman Road
2013 9,627.6 8,039.5 17,667.12015 10,770.5 8,677.5 19,378.02020 14,519.0 10,337.0 24,856.0
Traffic among Roadside Area
2025 20,256.4 12,380.1 32,636.52013 43.5 470.5 514.02015 89.2 981.2 1,070.42020 98.6 1,083.4 1,182.0
Converted Traffic
2025 110.1 1,200.9 1,311.02013 9,671.1 8,510.0 18,181.12015 10,789.7 9,658.7 20,448.42020 14,617.6 11,420.4 26,038.0
Total
2025 20,366.5 13,581.0 33,947.5Tamontaka – Tapian Road
2013 14,994.2 7,831.7 22,825.92015 16,363.4 8,390.0 24,753.42020 20,591.2 9,509.8 30,101.0
2025 26,179.3 10,739.3 36,918.6
(2) Saving of Operating and Maintenance Costs
The difference between paved and unpaved road in terms of operating and maintenance costs is about 130,100 pesos/km/year. The saving of operating and maintenance costs in both roads after improvement are shown in the table below.
TABLE 15.13.2-2 SAVING OF OPERATING AND MAINTENANCE
COSTS Saving of O&M Costs (1,000PhP/year) Pinaring – Simsiman Road 2,393.8 Tamontaka – Tapian Road 2,094.6
(3) Improvement in Agricultural Productivity
In the roadside area of the objective road for pre-F/S, agriculture is a main industry, and the income from agriculture serves as the main household income with 54% of household along the Pinaring-Simsiman Road and 30% along the Tamontaka-Tapian Road. In these areas, the impact to the agriculture is assumed by improving objective roads. That is, by improving those roads, the transportation cost of agricultural products is reduced and product damage in transit also decreases. Moreover, the impassable period in the rainy season is eliminated, and the number of times of shipment to market increases. As a result, the motivation for production of farmer increases and it is possible that productivity improves.
15-81

1) Setting of Affected Area
Affected area of the objected roads is shown in Figure 15.13.2-1.
FIGURE 15.13.2-1 DIRECT INFLUENCE AREA OF THE OBJECTIVE ROADS FOR F/S
2) Agricultural Productivity of Direct Influence Area
The main agricultural products in the affected/influenced area are rice and corn. The planted area of these agricultural products is calculated by multiplying the barangay’s area by the farmland rate (from analyses of aerial photography), and the planted area of rice and corn are calculated in consideration of the annual average planted area rate in ARMM. Moreover, the net income of farmhouse is calculated by multiplying these planted areas by frequency of harvest, the yield per unit area and farm gate price.
Planted Area by Agricultural Product = Barangay’s Area x Farmland Rate x Planted Area Rate Agricultural Productivity = Planted Area by Agricultural Product x Frequency of Harvest x Yield per Unit Area x Farm Gate Price
15-82

a) Planted Area Rate
Planted area rate of rice and corn, which are the main agricultural products in the affected area, was calculated using the rate of ARMM in 2008 as shown below.
% of Irrigated Palay 12.9% % of Rainfed Palay 27.5% % of White Corn 44.4% % of Yellow Corn 15.2%
b) Frequency of Harvest
Frequency of harvest was set as follows through the hearing survey results in the objective area.
(times/year) Pinaring – Simsiman
Road Tamontaka – Tapian
Road Palay (Irrigated) 2.2 2.4 Palay (Rainfed) 2.0 1.9 Corn (Yellow) 1.6 2.3 Corn (White) 1.7 2.0
Source: Study Team
c) Yield per Unit Area
The yield per unit area was calculated with actual data of ARMM in 2008 as shown below.
Palay (Irrigated) 4.0 metric ton/hectare Palay (Rainfed) 2.4 metric ton/hectare Corn (Yellow) 3.4 metric ton/hectare Corn (White) 2.5 metric ton/hectare
d) Farm Gate Price
Farm gate price is set using the average farm gate prices of ARMM in 2008.
(per kilogram) Farmgate Price of 2008 Palay (Paddy) Fancy, dry 14.97 Corngrain (Maize)Yellow, matured 9.67 Corngrain (Maize)White, matured 10.44
e) Agricultural Productivity in Related Area
The result of agricultural productivity in related area is shown as follows based on the above preconditions.
15-83

TABLE 15.13.2-3 AGRICULTURAL INCOME OF THE RELATED AREA
(1000Pesos/year) Pinaring – Simsiman
Road Tamontaka – Tapian
Road Palay (Irrigated) 88,690 83,466 Palay (Rainfed) 171,903 140,945 Yellow Corn 113,886 118,538 White Corn 37,824 49,203 Total 412,303 392,151
f) Benefit by Improvement Objective Road
By improving objective roads, the motivation for production of farmer increases and productivity improves. Specifically, the following effectiveness is expected.
- The productivity of the roadside area on Tamontaka - Tapian
Road is relatively low in Mindanao or ARMM area, and improvement in productivity by improvement of the road can be expected. For example, supposing productivity improves even to the Mindanao average, 16% (Palay) and 18% (White Corn) of productivity increase will be expected, respectively.
- According to the estimate of VOC, VOC of a rigid truck with 2-
axle decreases by about 65% by paving a road (travel speed rises from 20km/h to 50km/h, and VOC decreases in 56.0 Pesos/km to 19.45 Pesos/km). The rate of the transportation cost occupied to a shipment price is considered 7 to 9% (interview survey result to farmhouses), a transportation cost will decrease 5 to 6% by objective road improvement. This decrement is connected with the augmentation in farmhouses’ income.
- If a road is improved, the product damage in transit will decrease,
and it will lead to lifting of commodity value or the increase in the income by the decrease in a defective.
According to these expected effects, the agricultural productivity of farmhouses can be expected to increase about 40 to 60%. Increase-of-income effectiveness is calculated based on agricultural productivity of the related area calculated in section e). In the case of the increase in 40%, it becomes 164,900,000 pesos per annum along Pinaring-Simsiman Road area and 156,900,000 pesos per annum along Tamontaka-Road area as shown below.
15-84

TABLE 15.13.2-4 INCREASE IN AGRICULTURAL INCOME OF THE RELATED AREA
(Mil. PhP/year) Pinaring –
Simsiman Road Tamomtaka – Tapian Road
Improvement in Agricultural Productivity
164.9 156.9
15.13.3 Cost-Benefit Analysis
The results of cash flow analysis with costs and benefits per annum are shown in Table 15.13.3-1. Based on these results, each road project is economically feasible enough to be executed.
TABLE 15.13.3-1 ECONOMIC ANALYSIS RESULTS FOR PRE-F/S
ROADS
EIRR NPV (Mil. PhP)
(R=15%) B/C (R=15%)
Pinaring – Simsiman Road
18.4 113.6 1.27
Tamontaka – Tapian Road
19.8 139.3 1.37
15-85

TABLE 15.13.3-2 CASH FLOW ANALYSIS FOR PRE-F/S ROADS
Pinaring - Simsiman Road (Mil. PHP)
Construction Maintenance Total VOC TTCReduction ofMaintenance
Cost
Increase inAgriculturalProduction
Total
2010 23.5 0.0 23.5 0.0 0.0 0.0 0.0 0.02011 196.1 0.0 196.1 0.0 0.0 0.0 0.0 0.02012 279.0 0.0 279.0 0.0 0.0 0.0 0.0 0.02013 93.0 2.6 95.6 8.1 7.1 2.0 20.6 37.82014 0.0 3.2 3.2 10.2 9.1 2.4 41.2 62.9 59.72015 0.0 3.2 3.2 10.8 9.7 2.4 61.8 84.7 81.52016 0.0 3.2 3.2 11.6 10.0 2.4 82.5 106.4 103.22017 0.0 3.2 3.2 12.3 10.4 2.4 103.1 128.2 125.02018 0.0 3.2 3.2 13.1 10.7 2.4 123.7 149.9 146.72019 0.0 3.2 3.2 13.9 11.1 2.4 144.3 171.6 168.42020 0.0 3.2 3.2 14.6 11.4 2.4 164.9 193.4 190.22021 0.0 3.2 3.2 15.8 11.9 2.4 164.9 194.9 191.72022 0.0 3.2 3.2 16.9 12.3 2.4 164.9 196.5 193.32023 0.0 3.2 3.2 18.1 12.7 2.4 164.9 198.1 194.92024 0.0 3.2 3.2 19.2 13.1 2.4 164.9 199.7 196.52025 0.0 3.2 3.2 20.4 13.6 2.4 164.9 201.3 198.12026 0.0 3.2 3.2 21.0 14.0 2.4 164.9 202.4 199.22027 0.0 3.2 3.2 21.7 14.5 2.4 164.9 203.5 200.32028 0.0 3.2 3.2 22.5 15.0 2.4 164.9 204.7 201.52029 0.0 3.2 3.2 23.2 15.5 2.4 164.9 206.0 202.82030 0.0 3.2 3.2 24.0 16.0 2.4 164.9 207.3 204.12031 0.0 3.2 3.2 24.7 16.5 2.4 164.9 208.6 205.42032 0.0 3.2 3.2 25.6 17.0 2.4 164.9 209.9 206.7
Total 591.6 63.4 655.0 347.5 251.5 47.6 2,721.2 3,367.8 2,712.8
EIRR 18.4%NPV(R=15%) 113.6B/C(R=15%) 1.27
Cost Benefit
Net Cash Flow
-23.5-196.1-279.0
-57.8
Tamontaka - Tapian Road (Mil. PHP)
Construction Maintenance Total VOC TTCReduction ofMaintenance
Cost
Increase inAgriculturalProduction
Total
2010 23.5 0.0 23.5 0.0 0.0 0.0 0.0 0.02011 186.4 0.0 186.4 0.0 0.0 0.0 0.0 0.02012 264.4 0.0 264.4 0.0 0.0 0.0 0.0 0.02013 44.1 2.8 46.9 15.0 7.8 2.1 19.6 44.52014 0.0 2.8 2.8 15.7 8.1 2.1 39.2 65.1 62.32015 0.0 2.8 2.8 16.4 8.4 2.1 58.8 85.7 82.92016 0.0 2.8 2.8 17.2 8.6 2.1 78.4 106.4 103.62017 0.0 2.8 2.8 18.1 8.8 2.1 98.0 127.0 124.22018 0.0 2.8 2.8 18.9 9.1 2.1 117.6 147.7 144.92019 0.0 2.8 2.8 19.7 9.3 2.1 137.3 168.4 165.62020 0.0 2.8 2.8 20.6 9.5 2.1 156.9 189.1 186.32021 0.0 2.8 2.8 21.7 9.8 2.1 156.9 190.4 187.62022 0.0 2.8 2.8 22.8 10.0 2.1 156.9 191.8 189.02023 0.0 2.8 2.8 23.9 10.2 2.1 156.9 193.2 190.42024 0.0 2.8 2.8 25.1 10.5 2.1 156.9 194.5 191.72025 0.0 2.8 2.8 26.2 10.7 2.1 156.9 195.9 193.12026 0.0 2.8 2.8 27.0 11.1 2.1 156.9 197.1 194.32027 0.0 2.8 2.8 27.9 11.5 2.1 156.9 198.4 195.62028 0.0 2.8 2.8 28.9 11.8 2.1 156.9 199.7 196.92029 0.0 2.8 2.8 29.8 12.2 2.1 156.9 201.0 198.22030 0.0 2.8 2.8 30.8 12.6 2.1 156.9 202.4 199.62031 0.0 2.8 2.8 31.8 13.0 2.1 156.9 203.8 201.02032 0.0 2.8 2.8 32.9 13.5 2.1 156.9 205.3 202.5
Total 518.3 56.0 574.3 405.7 180.1 37.8 2,274.5 2,898.1 2,329.4
EIRR 19.8%NPV(R=15%) 139.3B/C(R=15%) 1.37
Cost Benefit
Net Cash Flow
-23.5-186.4-264.4
-2.3
15.14 CONCLUSION
It was concluded that two road projects are technically, environmentally and economically feasible. It is recommended that two road projects should be implemented at the earliest possible time.
15-86


CHAPTER 17
RECOMMENDATIONS 17.1 PEACE BUILDING
Peace building is the most important issue in the Study Area. Without attainment of peace in the region, people will continue to suffer from unstable life, harsh economic conditions, poverty and further deterioration of infrastructure. The National Government, the ARMM Government and the MILF should make all efforts to reach peace agreement at the earliest possible time. On the part of a road sector, road network development should be planned that universal area development can be achieved to erase hostility among people.
17.2 REALIZATION OF THE MASTER PLAN
The Master Plan was prepared. The next step is to plan how to realize the Master Plan. Proposed projects, institutional reinforcement, road maintenance improvement measures, etc., should be included in the forthcoming ARMM Medium-term Regional Development Plan to show ARMM Government’s strong will to implement the Master Plan and steadily implement them. The following should also be undertaken; ARMM Government relies on its fund from the National Government.
Now it has technical basis such as road projects, institutional improvement measures, road maintenance improvement, etc., to request funds for those to the National Government. All kinds of efforts should be exercised to obtain more funds from the National Government.
In order to get more funds from the National Government, the DPWH-
ARMM should show good performance. Planned and budgeted projects should be completed as scheduled.
17.3 COORDINATION WITH DPWH-NATIONAL
Much closer coordination with DPWH-National should be made and technical assistance from DPWH-National should be sought, particularly on the following; Road/Bridge Database and HDM-IV Analysis DPWH-ARMM’s road/bridge database should be integrated with DPWH-National, and HDM-IV analysis which will be the basis of allocation of MVUC fund should be undertaken for roads within ARMM. Although DPWH-National is, at present, rather reluctant to do so because of difficulty to
17-1

examine data reliability owing to peace and order situation of the region, DPWH-ARMM should continue to discuss it with DPWH National. Foreign-Assisted Projects Within ARMM Foreign-assisted projects within ARMM are implemented by DPWH-National. Implementation arrangement should be discussed with DPWH-National so that engineers of DPWH-ARMM can be involved in the implementation of foreign-assisted projects within ARMM. These projects will provide good opportunities for DPWH-ARMM staff to be trained. Implementation of Road Projects Which Extends Beyond ARMM Boundary Many road projects proposed under the Master Plan extend beyond ARMM boundary and ends in Region X or Region XII. Implementation of such projects should not be planned by DPWH-ARMM alone but with close coordination with DPWH-National.
17.4 FARM-TO-MARKET ROAD IMPROVEMENT
ARMM is the poorest region in the country and has the highest rate of poverty. The dominant industry in the Region is agro-fishery thus road sector should support agro-fishery development so as to increase farmers and fishermen’s income. Whenever a national or a provincial road improvement is planned, farm-to-market road improvement should also be included in the project.
17.5 INSTITUTIONAL REINFORCEMENT
Institutional weaknesses have been discussed in the course of the Study and a roadmap for institutional reinforcement was proposed by the Master Plan. Priority areas for institutional capacity development identified by DPWH-ARMM officials were as follows: Road database Traffic database Bridge management system Multi-year programming and scheduling Pavement management system Maintenance planning and programming Road network planning system Computerized road design system Budgeting within organizational performance indicator framework Project preparation: Feasibility Study
Since DPWH-National has already developed above system, DPWH-ARMM should coordinate with DPWH-National for technical assistance.
17-2

17-3
17.6 ROAD MAINTENANCE IMPROVEMENT
The Study recommended the following; Gradual shifting from Maintenance By Administration (MBA) to
Maintenance By Contract (MBC) due to difficulty of renewal of equipment
Much emphasis to be given to routine maintenance activities at least for next 10 years due to limited maintenance budget.
Gradual shifting of man-power from Area Equipment Service Offices (AESO) to District Engineering Offices (DEO) in line with shifting to MBC.
Road maintenance level and priority of maintenance activities to maximize usage of limited maintenance budget
Above recommendations should be realized by DPWH-ARMM.
17.7 IMPLEMENTATION OF PRE-F/S ROAD PROJECTS
Pre-feasibility study of two (2) road projects was undertaken under this Study. DPWH-ARMM should exert all efforts to realize these projects. All possible funding sources should be tapped for the realization of the projects. DPWH-ARMM should also make them as good opportunities for the on-the-job training to learn about project implementation. Concerned LGUs’ endorsements for the project should be secured and a certificate of non-coverage (CNC) should be obtained from DENR. To obtain CNC, DPWH-ARMM needs to submit a Project Description of which format is presented in Annex 17-1.
17.8 FEASIBILITY STUDY OF PROJECTS PROPOSED FOR THE
SHORT-TERM PERIOD Feasibility studies of projects proposed for the short-term period (2011-2015) should be undertaken at the earliest possible time, since it is the first step to realize the Master Plan.
17.9 ENVIRONMENTAL IMPACT ASSESSMENT
Projects for eliminating missing links and new road construction are expected serious environmental impacts. EIA for those type of projects should be carried out and possible mitigation measures should be planned and implemented. Typical Terms of Reference (TOR) for EIA study is shown in Annex 17-2.
17.10 UPDATING OF ROAD/BRIDGE DATABASE
Road/bridge database covering road/bridge inventory and condition survey results should be up-dated annually.
