chapter 13 how do managers use financial and nonfinancial … · 2018-11-06 · competitors....
TRANSCRIPT

Chapter 13
How Do Managers Use Financial and Nonfinancial PerformanceMeasures?
Source: Photo courtesy of Jon Seidman, http://www.flickr.com/photos/jonseidman1988/4481833335/.
Sandy Masako is the CEO of a fast-food restaurant called Chicken Deluxe. Thecompany operates hundreds of restaurants throughout North America and ischoosing between two suppliers of soft drinks: Deep Fizz Company and ExtremeFizz, Inc. Consumer surveys indicate no significant preference between the two.Sandy is meeting with Dave Roberts, the CFO, and Karen Kraft, the purchasingmanager, to discuss the company’s options.
Sandy(CEO):
We have a big decision to make. Our soft drink contract is up at theend of this year, and we need to decide on a supplier for next year.
1030
Karen(PurchasingManager):
I’ve had preliminary discussions with both Deep Fizz and Extreme Fizz,and the costs of their products are about the same.
Dave (CFO):Based on extensive surveys with our customers, they are notparticularly concerned about which supplier we choose, as long as it’seither Deep Fizz or Extreme Fizz.
Karen:Both companies would like our business. This is a big contract foreither of them!
Sandy:OK, so we have two companies offering the same terms, and customerswho would be satisfied with either company’s products. Are there anyother criteria we should consider?
Dave:We must have a supplier that is on solid financial ground. If oursupplier were to have financial difficulties that jeopardized productquality or timing of deliveries, we would be in a bind.
Karen:I agree. We need to determine whether these companies are in goodfinancial shape.
Dave:I suggest we have our accounting staff evaluate their financialinformation by analyzing and comparing certain key financialmeasures.
Sandy: What do you have in mind?
Dave:
My staff can look at financial trends and calculate several differentratios to evaluate the strength of each company’s income statementand balance sheet. We can compare these ratios for both companiesand also compare them to industry standards. This analysis shouldgive us a better idea about the financial stability of each company.
Sandy:Excellent! We have a few months to make our decision. How much timedo you need?
Dave: We can have it ready within a few weeks.
Sandy: Great, let’s plan on reviewing your analysis next month.
Chicken Deluxe is facing a supplier decision common to many companies. Financialstability is an important factor in deciding on a supplier, along with the quality ofproduct and reliability of service. Chicken Deluxe must analyze financialinformation for Deep Fizz and Extreme Fizz to determine the financial condition ofeach company.
The analysis of a company’s financial information typically follows a three-prongedapproach. First, trends within a company’s own financial information are analyzed,such as sales and earnings from one year to the next, using two methods—trendanalysis and common-size analysis. Second, financial measures are compared between
Chapter 13 How Do Managers Use Financial and Nonfinancial Performance Measures?
1031

competitors. Finally, financial ratios are compared to industry averages. We discussthese three approaches next using Coca-Cola as an example. We will revisit thedecision facing Chicken Deluxe later in the chapter.
Chapter 13 How Do Managers Use Financial and Nonfinancial Performance Measures?
1032

13.1 Trend Analysis of Financial Statements
LEARNING OBJECTIVE
1. Perform trend analysis to evaluate financial statement information.
Question: How is trend analysis used to evaluate the financial health of an organization?
Answer: Trend analysis1 evaluates an organization’s financial information over aperiod of time. Periods may be measured in months, quarters, or years, dependingon the circumstances. The goal is to calculate and analyze the amount change andpercent change from one period to the next.
For example, in fiscal years 2010 and 2009, Coca-Cola had the operating incomeshown as follows. (Amounts are in millions. To convert to the actual amount, simplymultiply the amount given times one million. For example, $8,449 × 1,000,000 =$8,449,000,000. Thus Coca-Cola had operating income of $8,449,000,000 in 2010.)
Amount2010
Amount2009
AmountChange
PercentChange
Operatingincome
$8,449 $8,231 ? ?
Although readers of the financial information can see that operating incomeincreased from 2009 to 2010, the exact dollar amount of the change and the percentchange is more helpful in evaluating the company’s performance. The dollaramount of change is calculated as follows:
Key Equation
Amount of change = Current year amount – Base year amount
1. An analysis that evaluatesfinancial information for anorganization over a period oftime and is typically presentedas a dollar amount change anda percentage change.
Chapter 13 How Do Managers Use Financial and Nonfinancial Performance Measures?
1033
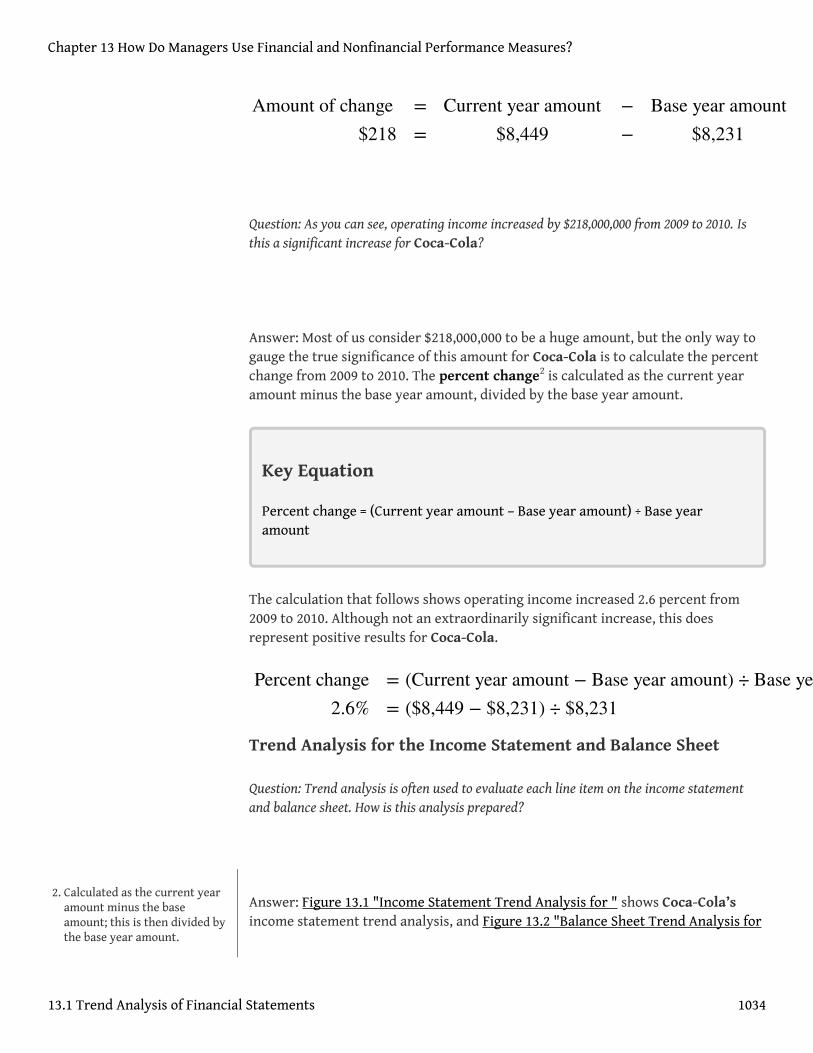
Question: As you can see, operating income increased by $218,000,000 from 2009 to 2010. Isthis a significant increase for Coca-Cola?
Answer: Most of us consider $218,000,000 to be a huge amount, but the only way togauge the true significance of this amount for Coca-Cola is to calculate the percentchange from 2009 to 2010. The percent change2 is calculated as the current yearamount minus the base year amount, divided by the base year amount.
Key Equation
Percent change = (Current year amount – Base year amount) ÷ Base yearamount
The calculation that follows shows operating income increased 2.6 percent from2009 to 2010. Although not an extraordinarily significant increase, this doesrepresent positive results for Coca-Cola.
Trend Analysis for the Income Statement and Balance Sheet
Question: Trend analysis is often used to evaluate each line item on the income statementand balance sheet. How is this analysis prepared?
Answer: Figure 13.1 "Income Statement Trend Analysis for " shows Coca-Cola’sincome statement trend analysis, and Figure 13.2 "Balance Sheet Trend Analysis for
Amount of change$218
==
Current year amount$8,449
−−
Base year amount$8,231
Percent change2.6%
= (Current year amount − Base year amount) ÷ Base year amount= ($8,449 − $8,231) ÷ $8,231
2. Calculated as the current yearamount minus the baseamount; this is then divided bythe base year amount.
Chapter 13 How Do Managers Use Financial and Nonfinancial Performance Measures?
13.1 Trend Analysis of Financial Statements 1034

" shows Coca-Cola’s balance sheet trend analysis. Carefully examine each of thesefigures, including the comments.
Figure 13.1 Income Statement Trend Analysis for Coca-Cola
Note: Percent change for each line item is found by dividing the increase (decrease) amount by the 2009 amount. Forexample, net sales 13.3 percent increase equals $4,129 ÷ $30,990.
Figure 13.1 "Income Statement Trend Analysis for " shows that net sales increasedby $4,129,000,000, or 13.3 percent. Cost of goods sold had a corresponding increaseof $1,605,000,000, or 14.5 percent. The increase in net sales and related increase incost of goods sold resulted in an increase in gross margin of $2,524,000,000, or 12.7percent. The increase in selling and administrative expenses of $1,800,000,000, or15.8 percent, outpaced the increase in net sales, resulting in a relatively smallincrease in operating income of $218,000,000, or 2.6 percent. The significantincrease in other income (expenses), net of 555.6 percent relates to a one-time gainof $4,978,000,000 resulting from Coca-Cola’s acquisition of Coca-Cola Enterprises,Inc., in 2010 (this information comes from the notes to the financial statements).This one-time gain caused an unusually large increase in net income for 2010. Thisis important as we continue our analysis of Coca-Cola Company throughout thechapter. Net income will appear to have an unusually large increase as we covervarious measures of performance, but keep in mind that the one-time gain in 2010of $4,978,000,000 caused most of the increase from 2009 to 2010.
Chapter 13 How Do Managers Use Financial and Nonfinancial Performance Measures?
13.1 Trend Analysis of Financial Statements 1035

Figure 13.2 Balance Sheet Trend Analysis for Coca-Cola
Note: Percent change for each line item is found by dividing the increase (decrease) amount by the 2009 amount. Forexample, cash and cash equivalents 22.4 percent increase equals $2,048 ÷ $9,151.
Current Assets and Current Liabilities
Question: What does the balance sheet trend analysis in Figure 13.2 "Balance Sheet TrendAnalysis for " tell us about current assets and current liabilities for Coca-Cola?
Answer: Figure 13.2 "Balance Sheet Trend Analysis for " shows that cash and cashequivalents increased by $2,048,000,000, or 22.4 percent. Coca-Cola’s statement ofcash flows would provide detailed information regarding this increase. (Chapter 12"How Is the Statement of Cash Flows Prepared and Used?" covers the statement ofcash flows.) Marketable securities increased 122.6 percent, accounts receivableincreased 17.9 percent, and merchandise inventory increased 12.6 percent. Othercurrent assets increased 42.0 percent.
Moving to current liabilities, accounts payable and accrued liabilities increased by33.1 percent, loans and notes payable increased 20.0 percent, and other current
Chapter 13 How Do Managers Use Financial and Nonfinancial Performance Measures?
13.1 Trend Analysis of Financial Statements 1036

liabilities decreased 391.7 percent (mostly attributable to a significant increase inthe current portion of long-term debt).
Noncurrent Assets and Noncurrent Liabilities
Question: What does the balance sheet trend analysis in Figure 13.2 "Balance Sheet TrendAnalysis for " tell us about noncurrent assets and noncurrent liabilities for Coca-Cola?
Answer: Figure 13.2 "Balance Sheet Trend Analysis for " shows that long-terminvestments increased 11.2 percent. Property, plant, and equipment increased 54.0percent, and intangible assets increased by a significant 109.8 percent. Both itemsappearing under noncurrent liabilities increased, with a 177.5 percent increase inlong-term debt and a 99.2 percent increase in other liabilities and deferred taxes.
Shareholders’ Equity
Question: What does the balance sheet trend analysis in Figure 13.2 "Balance Sheet TrendAnalysis for " tell us about shareholders’ equity for Coca-Cola?
Answer: Common stock increased 16.1 percent, and retained earnings increased17.8 percent. Accumulated other income (loss) went further into negative territoryby 91.5 percent, and treasury stock increased 9.3 percent.
Big Picture Balance Sheet Trend Analysis
Question: What are some of the key big picture items identified in the balance sheet trendanalysis shown in Figure 13.2 "Balance Sheet Trend Analysis for "?
Answer: Overall, total assets increased by $24,250,000,000, or 49.8 percent. Ofcourse, total liabilities and shareholders’ equity also increased by the same amount.The increases identified in almost every asset, liability, and shareholders’ equityline item are significant. From reading the notes to the financial statements, theauthors were able to identify the main source of these increases. In 2010, Coca-Colaacquired the remaining 67 percent of Coca-Cola Enterprises, Inc.’s (CCE) North
Chapter 13 How Do Managers Use Financial and Nonfinancial Performance Measures?
13.1 Trend Analysis of Financial Statements 1037

America business that Coca-Cola did not already own. This resulted in significantincreases in noncurrent assets and noncurrent liabilities, which were acquired aspart of this transaction. It also resulted in the reporting of a one-time gain on theincome statement of $4,978,000,000, which came from Coca-Cola remeasuring itsequity interest in CCE to fair value upon close of the transaction in 2010.
This analysis points to the reason we perform trend analysis—to identify theincreases and decreases in dollar amounts from one year to the next and to take aclose look at unusual trends.
Trend Analysis over Several Years
Question: The trend analysis just described works well when comparing financial data fortwo years. However, many prefer to review trends over more than two years. How might atrend analysis for several years be prepared?
Answer: A common approach is to establish the oldest year as the base year andcompute future years as a percentage of the base year. For example, Coca-Cola hadthe following net sales and operating income for each of the past five years (inmillions):
2010 2009 2008 2007 2006
Net sales $35,119 $30,990 $31,944 $28,857 $24,088
Operating income $ 8,449 $ 8,231 $ 8,446 $ 7,252 $ 6,308
Assuming 2006 is the base year, the trend percentage3 is calculated for each yearusing the following formula:
Key Equation
Trend percentage = Current year ÷ Base year
Figure 13.3 "Percentage Trend Analysis for " shows Coca-Cola’s trend percentagesfor net sales and operating income. Most analysts would expand this analysis toinclude most, if not all, of the income statement line items.
3. Calculated as the current yearamount divided by the baseyear amount.
Chapter 13 How Do Managers Use Financial and Nonfinancial Performance Measures?
13.1 Trend Analysis of Financial Statements 1038

Figure 13.3 Percentage Trend Analysis for Coca-Cola
Note: Trend percentages are calculated as the current year divided by the base year (2006). For example, the netsales 2010 trend percentage of 146 percent equals $35,119 (net sales for 2010) divided by $24,088 (net sales for thebase year 2006).
All percentages shown in Figure 13.3 "Percentage Trend Analysis for " are relativeto the base year, which is fiscal year 2006. Notice that the increase in operatingincome of 34 percent (= 134 percent – 100 percent) from 2006 to 2010 was less thanthe increase in net sales of 46 percent for the same period. This signals that theincrease in Coca-Cola’s operating expenses outpaced the increase in net salesduring this period. Figure 13.4 "Five-Year Percentage Trend in Operating Incomefor " shows the trend percentages in Coca-Cola’s operating income from 2006 to2010.
Figure 13.4 Five-Year Percentage Trend in Operating Income for Coca-Cola
Chapter 13 How Do Managers Use Financial and Nonfinancial Performance Measures?
13.1 Trend Analysis of Financial Statements 1039

KEY TAKEAWAY
• Trend analysis provides a means to analyze company data over a periodof time by focusing on the change in specific line items within theincome statement and balance sheet. Changes are typically measured indollars and percentages. Trends over several years can be evaluated bycalculating the trend percentage as the current year divided by the baseyear.
Business in Action 13.1
Trends Presented in Annual Reports
Most public companies present trend information in their annual reports. Forexample, Intel shows net revenues, gross margin, research and developmentcosts, operating income, and net income for the past five years. Nike andPepsiCo both show the percent change in selected income statement line itemsfor the past two years. Costco Wholesale Corporation presents selectedincome statement information for the past five years. The fact that thesefinancial data are provided in the annual report confirms the importance ofpresenting trend information to shareholders.
Sources: Intel, “Annual Report, 2010,” http://www.intel.com; Nike, “AnnualReport, 2010,” http://www.nike.com; PepsiCo, “Annual Report, 2010,”http://www.pepsico.com; Costco Wholesale Corporation, “Annual Report,2010,” http://www.costco.com.
Chapter 13 How Do Managers Use Financial and Nonfinancial Performance Measures?
13.1 Trend Analysis of Financial Statements 1040

REVIEW PROBLEM 13 .1
The following income statements and balance sheets are for PepsiCo, Inc.We use this information in review problems throughout the chapter.
1. Prepare a trend analysis for PepsiCo‘s income statement using theformat shown in Figure 13.1 "Income Statement Trend Analysis for ".
2. Prepare a trend analysis for PepsiCo’s balance sheet using the formatshown in Figure 13.2 "Balance Sheet Trend Analysis for ".
Chapter 13 How Do Managers Use Financial and Nonfinancial Performance Measures?
13.1 Trend Analysis of Financial Statements 1041

3. Compare PepsiCo’s increase in net income from 2009 to 2010 to Coca-Cola’s increase shown in Figure 13.1 "Income Statement Trend Analysisfor ". Which company has the highest percentage growth in net income?
4. Compare PepsiCo’s increase in total assets from 2009 to 2010 to Coca-Cola’s increase shown in Figure 13.2 "Balance Sheet Trend Analysis for". Which company has the highest percentage growth in total assets?
Solution to Review Problem 13.1
1.
Note: Percent change for each line item is found by dividing the increase (decrease)amount by the 2009 amount. For example, net sales 33.8 percent increase equals $14,606 ÷$43,232.
2.
Chapter 13 How Do Managers Use Financial and Nonfinancial Performance Measures?
13.1 Trend Analysis of Financial Statements 1042

Note: Percent change for each line item is found by dividing the increase (decrease)amount by the 2009 amount. For example, cash and cash equivalents 50.7 percent increaseequals $2,000 ÷ $3,943.
3. Net income at PepsiCo increased $374,000,000, or 6.3 percent, while netincome at Coca-Cola increased $4,985,000,000, or 73.1 percent (as shownin Figure 13.1 "Income Statement Trend Analysis for "). Thus Coca-Cola’s growth in net income far exceeded that of PepsiCo. As mentionedearlier, this huge increase in Coca-Cola’s net income is largelyattributable to a one-time gain in 2010 of $4,978,000,000.
4. Total assets at PepsiCo increased $28,305,000,000, or 71.0 percent, whiletotal assets at Coca-Cola increased $24,250,000,000, or 49.8 percent (asshown in Figure 13.2 "Balance Sheet Trend Analysis for "). ThusPepsiCo’s growth in total assets far exceeded that of Coca-Cola.
Chapter 13 How Do Managers Use Financial and Nonfinancial Performance Measures?
13.1 Trend Analysis of Financial Statements 1043

13.2 Common-Size Analysis of Financial Statements
LEARNING OBJECTIVE
1. Perform common-size analysis to evaluate financial statementinformation.
Question: How is common-size analysis used to evaluate the financial health of anorganization?
Answer: Common-size analysis4 (also called vertical analysis) converts each line offinancial statement data to an easily comparable, or common-size, amountmeasured as a percent. This is done by stating income statement items as a percentof net sales and balance sheet items as a percent of total assets (or total liabilitiesand shareholders’ equity). For example, Coca-Cola had net income of$11,809,000,000 and net sales of $35,119,000,000 for 2010. The common-size percentis simply net income divided by net sales, or 33.6 percent (= $11,809 ÷ $35,119).
There are two reasons to use common-size analysis: (1) to evaluate informationfrom one period to the next within a company and (2) to evaluate a companyrelative to its competitors. Common-size analysis answers such questions as “howdo our current assets as a percent of total assets compare with last year?” and “howdoes our net income as a percent of net sales compare with that of ourcompetitors?”
Using Common-Size Analysis to Evaluate Trends within aCompany
Question: How is a formal common-size analysis prepared, and what does it tell us for Coca-Cola?
Answer: Figure 13.5 "Common-Size Income Statement Analysis for " presents thecommon-size analysis for Coca-Cola’s income statement, and Figure 13.6
4. An analysis that converts eachline of financial statement datato an easily comparableamount measured in percentform. Income statement itemsare stated as a percent of netsales, and balance sheet itemsare stated as a percent of totalassets (or total liabilities andshareholders’ equity); alsocalled vertical analysis.
Chapter 13 How Do Managers Use Financial and Nonfinancial Performance Measures?
1044

"Common-Size Balance Sheet Analysis for " shows the common-size analysis forCoca-Cola’s balance sheet. As you look at these figures, notice that net sales areused as the base for the income statement, and total assets (or total liabilities andshareholders’ equity) are used as the base for the balance sheet. That is, for theincome statement, each item is measured as a percent of net sales, and for thebalance sheet, each item is measured as a percent of total assets (or total liabilitiesand shareholders’ equity).
Figure 13.5 Common-Size Income Statement Analysis for Coca-Cola
Note: All percentages use net sales as the base. For example, 2010 cost of goods sold percent of 36.1 percent equals$12,693 cost of goods sold ÷ $35,119 net sales. Note that rounding issues sometimes cause subtotals in the percentcolumn to be off by a small amount.
In general, managers prefer expenses as a percent of net sales to decrease over time,and profit figures as a percent of net sales to increase over time. As you can see inFigure 13.5 "Common-Size Income Statement Analysis for ", Coca-Cola’s grossmargin as a percent of net sales decreased from 2009 to 2010 (64.2 percent versus63.9 percent). Operating income declined as well (26.6 percent versus 24.1 percent).Income before taxes increased significantly from 28.6 percent in 2009 to 40.4percent in 2010, again mainly due to a one-time gain of $4,978,000,000 in 2010. Thiscaused net income to increase as well, from 22.0 percent in 2009 to 33.6 percent in2010. In the expense category, cost of goods sold as a percent of net sales increased,as did other operating expenses, interest expense, and income tax expense. Sellingand administrative expenses increased from 36.7 percent in 2009 to 37.5 percent in2010.
Chapter 13 How Do Managers Use Financial and Nonfinancial Performance Measures?
13.2 Common-Size Analysis of Financial Statements 1045
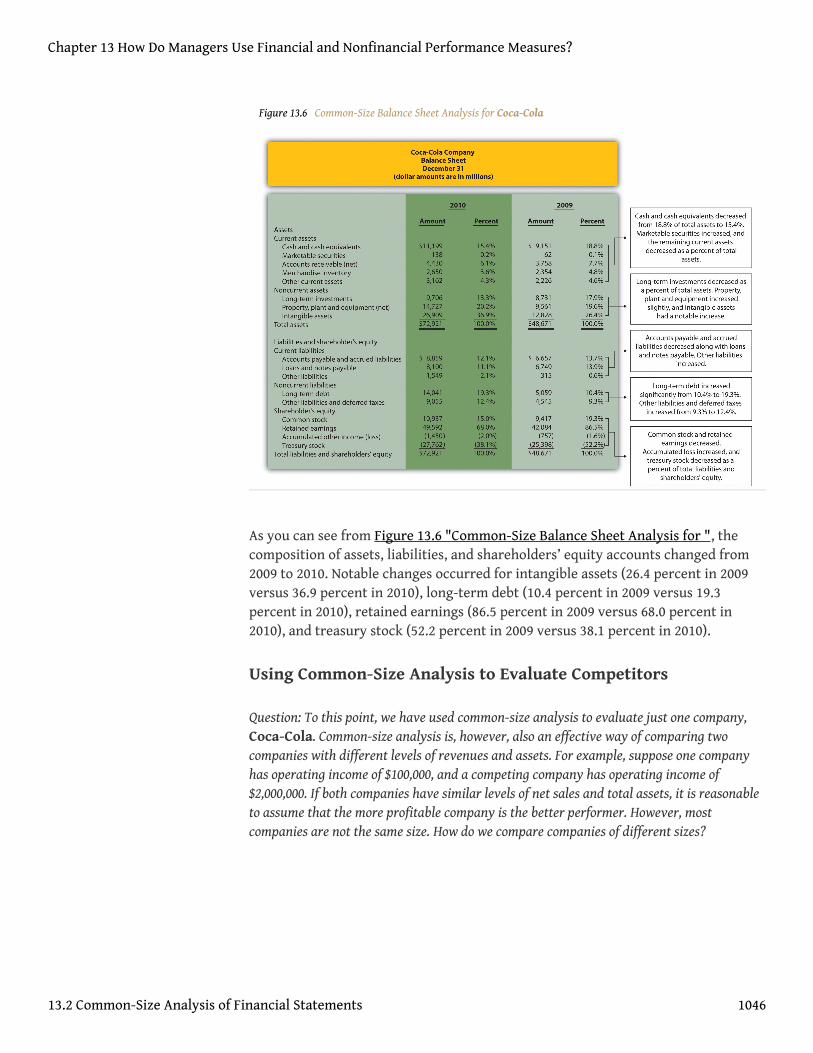
Figure 13.6 Common-Size Balance Sheet Analysis for Coca-Cola
As you can see from Figure 13.6 "Common-Size Balance Sheet Analysis for ", thecomposition of assets, liabilities, and shareholders’ equity accounts changed from2009 to 2010. Notable changes occurred for intangible assets (26.4 percent in 2009versus 36.9 percent in 2010), long-term debt (10.4 percent in 2009 versus 19.3percent in 2010), retained earnings (86.5 percent in 2009 versus 68.0 percent in2010), and treasury stock (52.2 percent in 2009 versus 38.1 percent in 2010).
Using Common-Size Analysis to Evaluate Competitors
Question: To this point, we have used common-size analysis to evaluate just one company,Coca-Cola. Common-size analysis is, however, also an effective way of comparing twocompanies with different levels of revenues and assets. For example, suppose one companyhas operating income of $100,000, and a competing company has operating income of$2,000,000. If both companies have similar levels of net sales and total assets, it is reasonableto assume that the more profitable company is the better performer. However, mostcompanies are not the same size. How do we compare companies of different sizes?
Chapter 13 How Do Managers Use Financial and Nonfinancial Performance Measures?
13.2 Common-Size Analysis of Financial Statements 1046
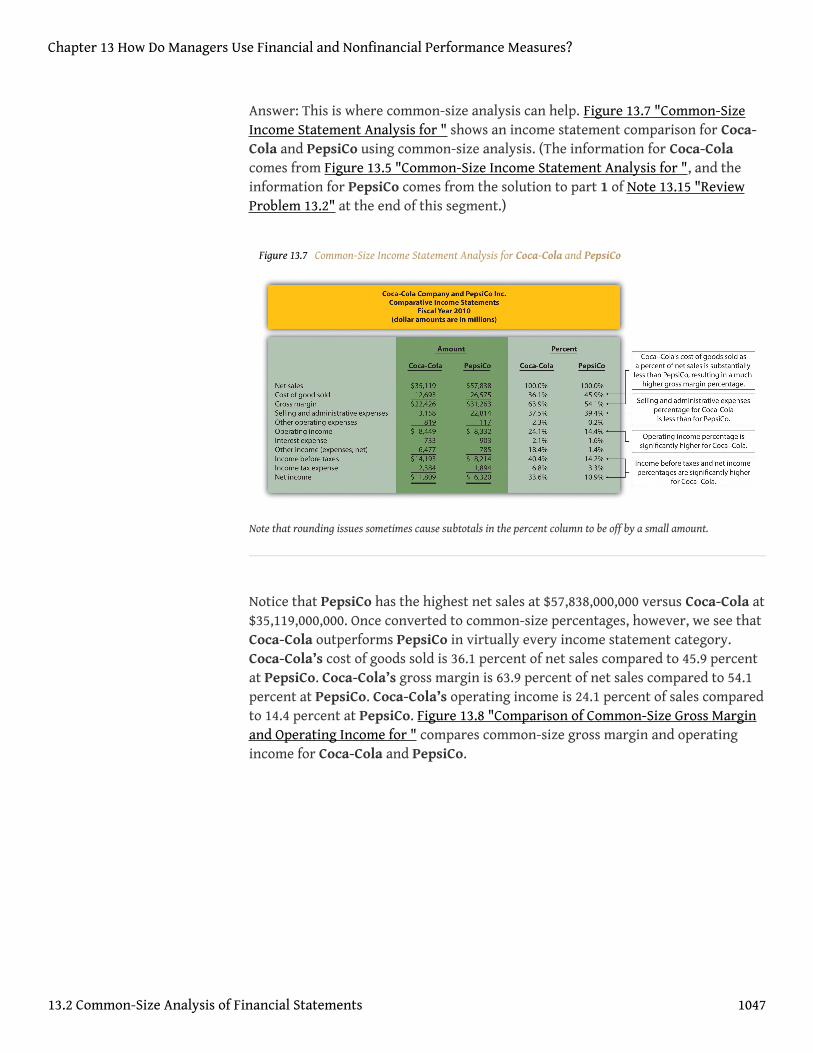
Answer: This is where common-size analysis can help. Figure 13.7 "Common-SizeIncome Statement Analysis for " shows an income statement comparison for Coca-Cola and PepsiCo using common-size analysis. (The information for Coca-Colacomes from Figure 13.5 "Common-Size Income Statement Analysis for ", and theinformation for PepsiCo comes from the solution to part 1 of Note 13.15 "ReviewProblem 13.2" at the end of this segment.)
Figure 13.7 Common-Size Income Statement Analysis for Coca-Cola and PepsiCo
Note that rounding issues sometimes cause subtotals in the percent column to be off by a small amount.
Notice that PepsiCo has the highest net sales at $57,838,000,000 versus Coca-Cola at$35,119,000,000. Once converted to common-size percentages, however, we see thatCoca-Cola outperforms PepsiCo in virtually every income statement category.Coca-Cola’s cost of goods sold is 36.1 percent of net sales compared to 45.9 percentat PepsiCo. Coca-Cola’s gross margin is 63.9 percent of net sales compared to 54.1percent at PepsiCo. Coca-Cola’s operating income is 24.1 percent of sales comparedto 14.4 percent at PepsiCo. Figure 13.8 "Comparison of Common-Size Gross Marginand Operating Income for " compares common-size gross margin and operatingincome for Coca-Cola and PepsiCo.
Chapter 13 How Do Managers Use Financial and Nonfinancial Performance Measures?
13.2 Common-Size Analysis of Financial Statements 1047

Figure 13.8 Comparison of Common-Size Gross Margin and Operating Income for Coca-Cola and PepsiCo
Common-size analysis enables us to compare companies on equal ground, and asthis analysis shows, Coca-Cola is outperforming PepsiCo in terms of incomestatement information. However, as you will learn in this chapter, there are manyother measures to consider before concluding that Coca-Cola is winning thefinancial performance battle.
Common-size analysis is obviously crucial to comparative analysis. In fact, somesources of industry data present the information exclusively in a common-sizeformat, and most of the accounting software available today has been engineered tofacilitate this type of analysis.
Business in Action 13.2
Common-Size Analysis Using Accounting Software
Most accounting computer programs, including QuickBooks, Peachtree, andMAS 90, provide common-size analysis reports. You simply select theappropriate report format and financial statement date, and the system printsthe report. Thus accountants using this type of software can focus more onanalyzing common-size information than on preparing it.
Chapter 13 How Do Managers Use Financial and Nonfinancial Performance Measures?
13.2 Common-Size Analysis of Financial Statements 1048

KEY TAKEAWAY
• Common-size analysis converts each line of financial statement data toan easily comparable amount measured as a percent. Income statementitems are stated as a percent of net sales and balance sheet items arestated as a percent of total assets (or total liabilities and shareholders’equity). Common-size analysis allows for the evaluation of informationfrom one period to the next within a company and between competingcompanies.
Chapter 13 How Do Managers Use Financial and Nonfinancial Performance Measures?
13.2 Common-Size Analysis of Financial Statements 1049
REVIEW PROBLEM 13 .2
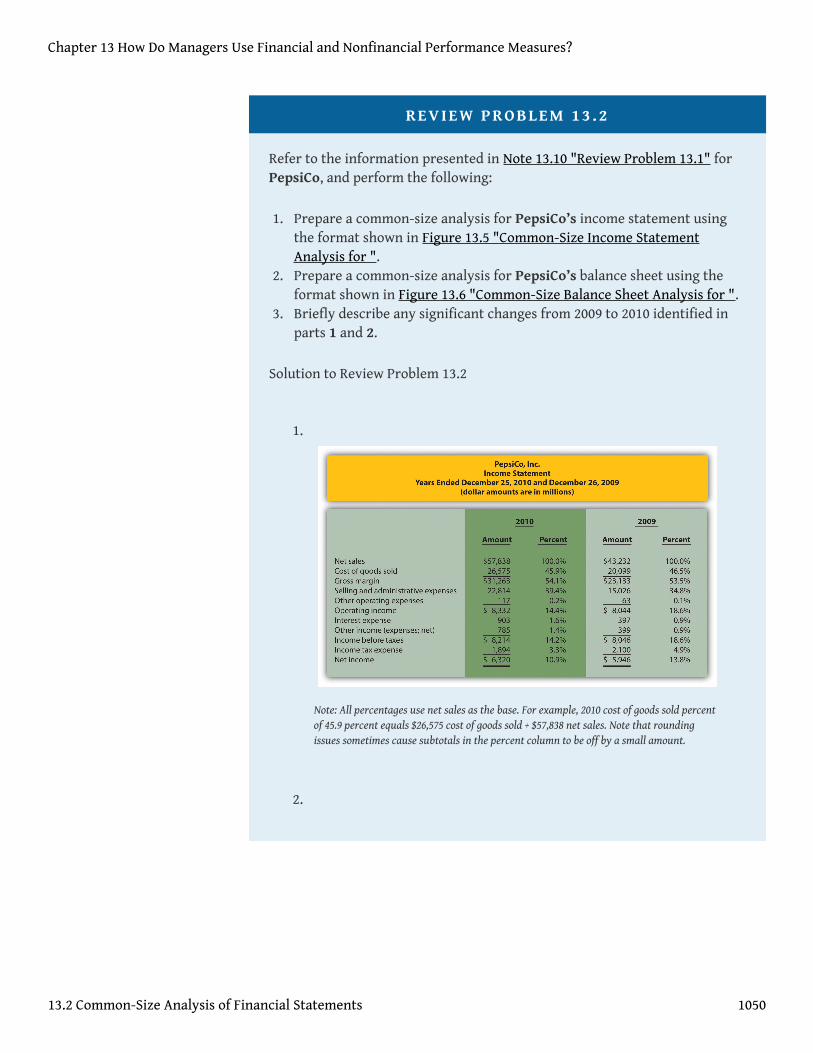
Refer to the information presented in Note 13.10 "Review Problem 13.1" forPepsiCo, and perform the following:
1. Prepare a common-size analysis for PepsiCo’s income statement usingthe format shown in Figure 13.5 "Common-Size Income StatementAnalysis for ".
2. Prepare a common-size analysis for PepsiCo’s balance sheet using theformat shown in Figure 13.6 "Common-Size Balance Sheet Analysis for ".
3. Briefly describe any significant changes from 2009 to 2010 identified inparts 1 and 2.
Solution to Review Problem 13.2
1.
Note: All percentages use net sales as the base. For example, 2010 cost of goods sold percentof 45.9 percent equals $26,575 cost of goods sold ÷ $57,838 net sales. Note that roundingissues sometimes cause subtotals in the percent column to be off by a small amount.
2.
Chapter 13 How Do Managers Use Financial and Nonfinancial Performance Measures?
13.2 Common-Size Analysis of Financial Statements 1050

Note: All percentages use total assets or total liabilities and shareholders’ equity as thebase. For example, 2010 cash and cash equivalents percent of 8.7 percent equals $5,943 ÷$68,153. Note that rounding issues sometimes cause subtotals in the percent column to beoff by a small amount.
3. The composition of PepsiCo’s income statement remainedrelatively consistent from 2009 to 2010. The most notable changeoccurred with selling and administrative expenses, whichincreased from 34.8 percent of sales in 2009 to 39.4 percent ofsales in 2010. This in turn drove down operating income from18.6 percent in 2009 to 14.4 percent in 2010. This also likelycaused the decrease in income before taxes, income tax expense,and net income.
The composition of PepsiCo’s balance sheet had some significantchanges from 2009 to 2010. The most notable changes occurredwith intangible assets (23.0 percent in 2009 versus 41.8 percent in2010), other assets (13.7 percent in 2009 versus 4.5 percent in2010), short-term obligations (1.2 percent in 2009 versus 7.2percent in 2010), long-term debt (18.6 percent in 2009 versus 29.3
Chapter 13 How Do Managers Use Financial and Nonfinancial Performance Measures?
13.2 Common-Size Analysis of Financial Statements 1051
percent in 2010), common stock (0.7 percent in 2009 versus 6.7percent in 2010), and retained earnings (86.4 percent in 2009versus 54.9 percent in 2010).
Chapter 13 How Do Managers Use Financial and Nonfinancial Performance Measures?
13.2 Common-Size Analysis of Financial Statements 1052

13.3 Ratio Analysis of Financial Information
LEARNING OBJECTIVE
1. Use ratio analysis to measure profitability, short-term liquidity, long-term solvency, and market valuation.
Question: Although reviewing trends and using common-size analysis provides an excellentstarting point for analyzing financial information, managers, investors, and otherstakeholders also use various ratios to assess the financial performance and financialcondition of organizations. What are the four categories of ratios used to evaluate thefinancial health of an organization?
Answer: The four categories of ratios presented in this chapter are as follows (inorder of presentation):
1. Ratios used to measure profitability (focus is on the income statement)2. Ratios used to measure short-term liquidity (focus is on short-term
liabilities)3. Ratios used to measure long-term solvency (focus is on long-term
liabilities)4. Ratios used to measure market valuation (focus is on market value of the
company)
For each ratio, we (1) explain the meaning, (2) provide the formula, (3) calculate theratio for Coca-Cola for two years, and (4) compare the ratio for Coca-Cola toPepsiCo’s ratio and industry averages. (Note: All industry averages throughout thischapter were obtained from http://moneycentral.msn.com. Some averages are notavailable or not applicable and will be noted as such.)
Table 13.1 "Financial Ratio Formulas" summarizes the formulas for all the ratiospresented in this section, and Table 13.2 "Summary of Financial Ratios for " showsthe ratio results for Coca-Cola, PepsiCo, and the industry averages that will becovered throughout this section.
Chapter 13 How Do Managers Use Financial and Nonfinancial Performance Measures?
1053

Table 13.1 Financial Ratio Formulas
Profitability Measures
1.
Indicates the gross margin generated for each dollar in net sales.
2.
Indicates the profit generated for each dollar in net sales.
3.
Indicates how much net income was generated from each dollar in average assets invested.
4.
Indicates how much net income was generated from each dollar of common shareholders’equity.
5.
Indicates how much net income was earned for each share of common stock outstanding.
Short-Term Liquidity Measures
Gross margin ratio =Gross margin
Net sales
Profit margin ratio =Net incomeNet sales
Return on assets =Net income
Average total assets
Return on common shareholders’ equity =Net income − Preferred dividends
Average common shareholders’ equity
Earnings per share =Net income − Preferred dividends
Weighted average common shares outstanding
Chapter 13 How Do Managers Use Financial and Nonfinancial Performance Measures?
13.3 Ratio Analysis of Financial Information 1054

6.
Indicates whether a company has sufficient current assets to cover current liabilities.
7.
Indicates whether a company has sufficient quick assets to cover current liabilities.
8.
Indicates how many times receivables are collected in a given period.
9.
Indicates how many days it takes on average to collect on credit sales.
10.
Indicates how many times inventory is sold and restocked in a given period.
11.
Current ratio =Current assets
Current liabilities
Quick ratio =Cash + Marketable securities + Short-term receivables
Current liabilities
Receivables turnover ratio =Credit sales
Average accounts receivable
Average collection period =365 days
Receivables turnover ratio
Inventory turnover ratio =Cost of goods soldAverage inventory
Average sale period =365 days
Inventory turnover ratio
Chapter 13 How Do Managers Use Financial and Nonfinancial Performance Measures?
13.3 Ratio Analysis of Financial Information 1055

Indicates how many days it takes on average to sell the company’s inventory.
Long-Term Solvency Measures
12.
Indicates the percentage of assets funded by creditors.
13.
Indicates the amount of debt incurred for each dollar that owners provide.
14.
Indicates the company’s ability to cover its interest expense related to long-term debt withcurrent period earnings.
Market Valuation Measures
15.
Indicates the value of a company at a point in time.
16.
Debt to assets =Total liabilities
Total assets
Debt to equity =Total liabilities
Total shareholders’ equity
Times interest earned =Net income + Income tax expense + Interest expense
Interest expense
Market capitalization = Market price per share × Number of shares outstanding
Chapter 13 How Do Managers Use Financial and Nonfinancial Performance Measures?
13.3 Ratio Analysis of Financial Information 1056

Indicates the premium investors are willing to pay for shares of stock relative to the company’searnings.
Table 13.2 Summary of Financial Ratios for Coca-Cola, PepsiCo, and the IndustryAverage
Coca-Cola 2010 PepsiCo 2010Industry
Average 2010
Profitability Measures
1. Gross margin ratio 63.9 percent 54.1 percent 56.1 percent
2. Profit margin ratio 33.6 percent 10.9 percent 19.2 percent
3. Return on assets 19.4 percent 11.7 percent 14.2 percent
4.Return on commonshareholders’ equity
41.7 percent 32.3 percent 34.7 percent
5. Earnings per share $5.12 $3.97 Not applicable
Short-Term Liquidity Measures
6. Current ratio 1.17 to 1 1.11 to 1 1.20 to 1
7. Quick ratio 0.85 to 1 0.80 to 1 1.10 to 1
8. Receivables turnover ratio 8.58 times 10.57 times 9.70 times
9. Average collection period 42.54 days 34.53 days 37.63 days
10. Inventory turnover ratio 5.07 times 8.87 times 7.50 times
11. Average sale period 71.99 days 41.15 days 48.67 days
Long-Term Solvency Measures
12. Debt to assets 0.57 to 1 0.68 to 1 0.48 to 1
13. Debt to equity 1.33 to 1 2.17 to 1 0.94 to 1
14. Times interest earned 20.36 times 10.10 times 10.70 times
Market Valuation Measures
Price-earnings ratio =Market price per share
Earnings per share
Chapter 13 How Do Managers Use Financial and Nonfinancial Performance Measures?
13.3 Ratio Analysis of Financial Information 1057

Coca-Cola 2010 PepsiCo 2010Industry
Average 2010
15. Market capitalization $146,500,000,000 $100,700,000,000 $87,500,000,000
16. Price-earnings ratio 12.48 times 16.04 times 14.60 times
Before we discuss the various ratios, it is important to note that different terms areoften used in financial statements to describe the same item. For example, somecompanies use the term net revenues instead of net sales, and the income statement isoften called the statement of earnings, or consolidated statement of earnings. Also besure to review the income statement and balance sheet information for Coca-Colashown in Figure 13.5 "Common-Size Income Statement Analysis for " and Figure13.6 "Common-Size Balance Sheet Analysis for ". We refer to these figuresthroughout this section. (All the dollar amounts given for Coca-Cola are in millionsunless stated otherwise.)
Profitability Ratios
Question: Analysts, shareholders, suppliers, and other stakeholders often want to evaluateprofit trends within a company and compare a company’s profits with competitors’ profits.What are the five common ratios used to evaluate company profitability?
Answer: The five ratios used to evaluate profitability are as follows:
1. Gross margin ratio2. Profit margin ratio3. Return on assets4. Return on common shareholders’ equity5. Earnings per share
Gross Margin Ratio
Question: How is the gross margin ratio calculated, and what does it tell us about Coca-Colarelative to PepsiCo and the industry average?
Chapter 13 How Do Managers Use Financial and Nonfinancial Performance Measures?
13.3 Ratio Analysis of Financial Information 1058

Answer: The gross margin ratio5 indicates the gross margin generated for eachdollar in net sales and is calculated as gross margin (which is net sales minus cost ofgoods sold) divided by net sales:
Key Equation
The gross margin ratio for Coca-Cola using 2010 information is calculated asfollows, with PepsiCo and industry average information following it:
Coca-Cola2010
Coca-Cola2009
PepsiCo2010
Industry Average2010
Gross marginratio
63.9percent
64.2percent
54.1percent
56.1 percent
The gross margin ratio indicates Coca-Cola generated 63.9 cents in gross margin forevery dollar in net sales. This ratio decreased slightly from 2009 to 2010 and issubstantially higher than PepsiCo’s 54.1 percent. Coca-Cola is also higher than theindustry average of 56.1 percent. (Alternative terms: Gross margin is often calledgross profit, net sales is often called net revenues, and cost of goods sold is often calledcost of sales.)
Profit Margin Ratio
Question: How is the profit margin ratio calculated, and what does it tell us about Coca-Cola relative to PepsiCo and the industry average?
Answer: The profit margin ratio6 shows the profit generated for each dollar in netsales. It is calculated as net income divided by net sales:
Gross margin ratio =Gross margin
Net sales
Gross margin ratio =$22,426$35,119
= 63. 9%
5. Indicates the gross margingenerated for each dollar innet sales. Calculated as grossmargin divided by net sales.
6. Indicates the profit generatedfrom each dollar in net sales.Calculated as net incomedivided by net sales.
Chapter 13 How Do Managers Use Financial and Nonfinancial Performance Measures?
13.3 Ratio Analysis of Financial Information 1059
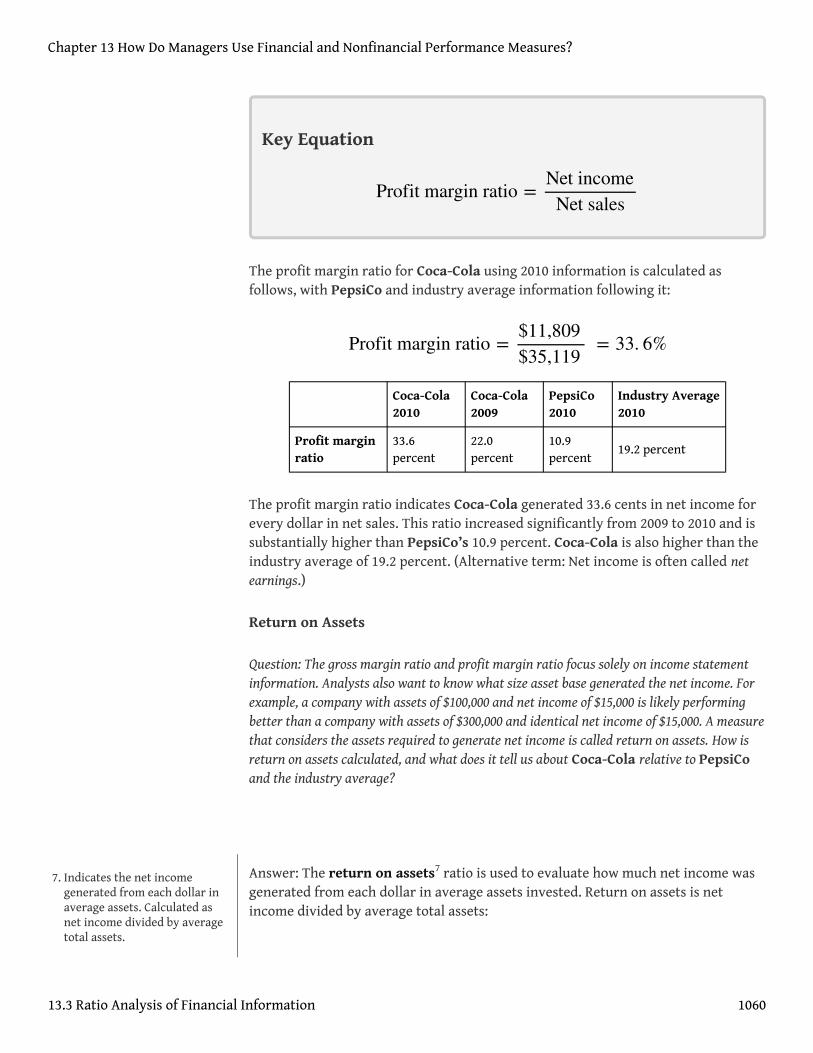
Key Equation
The profit margin ratio for Coca-Cola using 2010 information is calculated asfollows, with PepsiCo and industry average information following it:
Coca-Cola2010
Coca-Cola2009
PepsiCo2010
Industry Average2010
Profit marginratio
33.6percent
22.0percent
10.9percent
19.2 percent
The profit margin ratio indicates Coca-Cola generated 33.6 cents in net income forevery dollar in net sales. This ratio increased significantly from 2009 to 2010 and issubstantially higher than PepsiCo’s 10.9 percent. Coca-Cola is also higher than theindustry average of 19.2 percent. (Alternative term: Net income is often called netearnings.)
Return on Assets
Question: The gross margin ratio and profit margin ratio focus solely on income statementinformation. Analysts also want to know what size asset base generated the net income. Forexample, a company with assets of $100,000 and net income of $15,000 is likely performingbetter than a company with assets of $300,000 and identical net income of $15,000. A measurethat considers the assets required to generate net income is called return on assets. How isreturn on assets calculated, and what does it tell us about Coca-Cola relative to PepsiCoand the industry average?
Answer: The return on assets7 ratio is used to evaluate how much net income wasgenerated from each dollar in average assets invested. Return on assets is netincome divided by average total assets:
Profit margin ratio =Net income
Net sales
Profit margin ratio =$11,809$35,119
= 33. 6%
7. Indicates the net incomegenerated from each dollar inaverage assets. Calculated asnet income divided by averagetotal assets.
Chapter 13 How Do Managers Use Financial and Nonfinancial Performance Measures?
13.3 Ratio Analysis of Financial Information 1060

Key Equation
The average total assets amount is found by adding together total assets at the endof the current year and previous year (2010 and 2009 for this example) and dividingby two. The return on assets ratio for Coca-Cola for 2010 is calculated as follows,with PepsiCo and industry average information following it:
Coca-Cola2010
Coca-Cola2009
PepsiCo2010
Industry Average2010
Return onassets
19.4 percent 15.3 percent11.7percent
14.2 percent
The return on assets ratio indicates Coca-Cola generated 19.4 cents in net incomefor every dollar in average assets. This ratio increased from 2009 to 2010 and ishigher than PepsiCo’s 11.7 percent. Coca-Cola exceeded the industry average of14.2 percent.
(Note: There are several variations on the return on assets calculation. Some preferto use average operating assets in the denominator. Others adjust net income in thenumerator by adding back interest expense net of the interest expense tax benefit.We leave these variations to advanced cost and intermediate accounting textbooks.)
Return on Common Shareholders’ Equity
Question: How is the return on common shareholders’ equity ratio calculated, and what doesit tell us about Coca-Cola relative to PepsiCo and the industry average?
Answer: Common shareholders are interested in the return on commonshareholders’ equity8 ratio because this ratio tells them how much net income was
Return on assets =Net income
Average total assets
Return on assets =$11,809
($72,921 + $48,671) ÷ 2=
$11,809$60,796
= 19. 4%
8. Indicates the net incomegenerated from each dollar ofcommon shareholders’ equity.Calculated as net income minuspreferred dividends divided byaverage common shareholders’equity.
Chapter 13 How Do Managers Use Financial and Nonfinancial Performance Measures?
13.3 Ratio Analysis of Financial Information 1061

generated from each dollar of common shareholders’ equity. The return oncommon shareholders’ equity ratio is calculated as follows:
Key Equation
Note that preferred dividends are deducted from net income in the numerator. Ifthe company does not have any outstanding preferred stock, as is the case withCoca-Cola, the preferred dividends amount is zero.
Average common shareholders’ equity in the denominator is found by addingtogether all items in the shareholders’ equity section of the balance sheet at the endof the current year and previous year (2010 and 2009 for this example), exceptpreferred stock items, and dividing by two.
Because Coca-Cola does not have preferred stock, an average of all items in theshareholders’ equity section is in the denominator. The return on commonshareholders’ equity ratio for Coca-Cola for 2010 is calculated as follows, withPepsiCo and industry average information following it:
Coca-Cola2010
Coca-Cola2009
PepsiCo2010
IndustryAverage 2010
Return on commonshareholders’ equity
41.7percent
29.5percent
32.3percent
34.7 percent
The return on common shareholders’ equity ratio indicates Coca-Cola generated41.7 cents in net income for every dollar in average common shareholders’ equity.
Return on common shareholders’ equity =Net income − Preferred dividends
Average common shareholders’ equity
Return on commonshareholders’ equity
=$11,809 − $0
[($10,937 + $49,592 − $1,450 − $27,762) + ($9,417 + $42,084 − $757 − $25,398)] ÷ 2
=$11,809$28,332
= 41. 7%
Chapter 13 How Do Managers Use Financial and Nonfinancial Performance Measures?
13.3 Ratio Analysis of Financial Information 1062

This ratio increased significantly from 2009 to 2010 and is higher than PepsiCo’s32.3 percent. Coca-Cola exceeded the industry average of 34.7 percent.
Coca-Cola’s return on common shareholders’ equity of 41.7 percent is higher thanits return on assets of 19.4 percent, indicating that the company has positivefinancial leverage. Financial leverage9 describes a company’s ability to leveragecommon shareholders’ equity by taking on debt at an interest rate lower than thecompany’s return on assets. For example, assume a company has equity of $10,000earning 10 percent. The company can leverage this equity by borrowing $8,000 witha 6 percent interest rate. Assuming the company uses this $8,000 to purchase assetsthat earn 10 percent, the company has created positive financial leverage since thecost of borrowing is lower than the return on assets. This results in a return onequity that is higher than the return on assets. (Note: For a one-year period, thereturn on assets is $1,800 [= $18,000 × 10 percent] less the cost of debt of $480 [= 6percent × $8,000], or $1,320. This results in a return on assets of 7.3 percent [= $1,320÷ $18,000]. Positive financial leverage causes the return on equity to be much higherat 13.2 percent [= $1,320 ÷ $10,000 equity].)
Although some level of financial leverage is generally regarded as healthy,companies that are highly leveraged tend to be riskier than similar companies withless leverage. Analysts and shareholders should avoid drawing quick conclusionsthat increases in return on common shareholders’ equity are always better thandecreases without thoroughly reviewing the rest of the data.
Figure 13.9 "Return on Assets and Return on Equity for " shows the return on assetsand return on equity for Coca-Cola, PepsiCo, and the industry average.
Figure 13.9 Return on Assets and Return on Equity for Coca-Cola, PepsiCo, and the Industry Average
9. Indicates the ability of acompany to leverage commonshareholders’ equity by takingon debt at an interest ratelower than the company’sreturn on assets.
Chapter 13 How Do Managers Use Financial and Nonfinancial Performance Measures?
13.3 Ratio Analysis of Financial Information 1063

Earnings per Share
Question: How is earnings per share calculated, and what does it tell us about Coca-Colarelative to PepsiCo and the industry average?
Answer: Earnings per share10 indicates how much net income was earned for eachshare of common stock outstanding. The earnings per share ratio states net incomeon a per share basis and is calculated as the following:
Key Equation
Note that preferred dividends are deducted from net income in the numerator. Ifthe company does not have any outstanding preferred stock, as is the case withCoca-Cola, the preferred dividends amount is zero. The weighted average commonshares outstanding amount used in the denominator is typically provided in thefinancial statements, either on the income statement or in the notes to the financialstatements. (More advanced intermediate accounting textbooks discuss thiscalculation in detail. Throughout this chapter, we provide the number of weightedaverage common shares outstanding.)
Earnings per share for Coca-Cola using 2010 information is calculated as follows,with PepsiCo and industry average information following it (dollar amount andshares are in millions, except per share amount):
Coca-Cola2010
Coca-Cola2009
PepsiCo2010
Industry Average2010
Earnings pershare
$5.12 $2.95 $3.97 Not applicable
Earnings per share =Net income − Preferred dividends
Weighted average common shares outstanding
Earnings per share =$11,809 − $02,308 shares
= $5. 12 per share
10. Indicates how much netincome was earned for eachshare of common stockoutstanding. Calculated as netincome minus preferreddividends divided by weightedaverage common sharesoutstanding.
Chapter 13 How Do Managers Use Financial and Nonfinancial Performance Measures?
13.3 Ratio Analysis of Financial Information 1064

The earnings per share amount at Coca-Cola indicates the company earned $5.12for each share of common stock outstanding. This ratio increased from 2009 to2010. Although earnings per share is useful for looking at trends over time within acompany, it cannot be compared in any meaningful way from one company toanother because different companies have different numbers of shares outstanding.
For example, assume two identical companies earn $10,000 for the year. Onecompany has one share of common stock outstanding, and the other has two sharesoutstanding. Thus one company has earnings per share of $10,000 (= $10,000 ÷ 1share) and the other company has earnings per share of $5,000 (= $10,000 ÷ 2shares). The second company is not performing any worse; it simply has moreshares outstanding. This is why you should not compare earnings per share acrosscompanies. (Alternative terms: Earnings per share are often called EPS or income pershare.)
Chapter 13 How Do Managers Use Financial and Nonfinancial Performance Measures?
13.3 Ratio Analysis of Financial Information 1065
Business in Action 13.3
Source: Photo courtesy of DangApricot, http://commons.wikimedia.org/wiki/File:AnnTaylorLoftSign.JPG.
The Importance of Earnings per Share
The business press often uses earnings per share to announce a company’searnings. For example, the Associated Press addressed earnings at AnnTaylorStores Corporation, a retailer of women’s clothing, as follows: “Quarterlyincome fell to $7,100,000, or 10 cents per share, from $30,100,000, or 41 cents,the year before. Setting aside relocation costs, adjusted earnings were 18 centsper share, a penny higher than the average estimate from analysts polled byThomson Financial.”
This quote demonstrates not only that earnings per share data are importantwhen announcing a company’s earnings but also that analysts use these datawhen making predictions about a company’s performance. A quick perusal of
Chapter 13 How Do Managers Use Financial and Nonfinancial Performance Measures?
13.3 Ratio Analysis of Financial Information 1066

any business publication, such as The Wall Street Journal, or a review of onlinebusiness press releases at sites like http://finance.yahoo.com will confirm thatearnings per share data are commonly used to announce a company’s financialresults.
Source: Associated Press, “AnnTaylor’s 2Q Profit Plummets on Charge,” August19, 2005.
Chapter 13 How Do Managers Use Financial and Nonfinancial Performance Measures?
13.3 Ratio Analysis of Financial Information 1067

REVIEW PROBLEM 13 .3
Refer to the information presented in Note 13.10 "Review Problem 13.1" forPepsiCo, and perform the following for 2010:
1. Calculate the gross margin ratio, and briefly describe what it means forPepsiCo.
2. Calculate the profit margin ratio, and briefly describe what it means forPepsiCo.
3. Calculate return on assets, and briefly describe what it means forPepsiCo.
4. Calculate return on common shareholders’ equity, and briefly describewhat it means for PepsiCo. Assume PepsiCo recorded preferreddividends of $6,000,000 in 2010.
5. Calculate earnings per share, and briefly describe what it means forPepsiCo. Assume weighted average common shares outstanding totaled1,590,000,000 shares.
Solutions to Review Problem 13.3
1.
For every dollar in net sales, PepsiCo generated 54.1 cents ingross margin.
2.
Gross margin ratio =Gross margin
Net sales
=$31,263$57,838
= 54. 1%
Chapter 13 How Do Managers Use Financial and Nonfinancial Performance Measures?
13.3 Ratio Analysis of Financial Information 1068

For every dollar in net sales, PepsiCo generated 10.9 cents in netincome.
3.
For every dollar in average assets, PepsiCo generated 11.7 centsin net income.
4.
Profit margin ratio =Net income
Net sales
=$6,320
$57,838= 10.9%
Return on assets =Net income
Average total assets
=$6,320
($68,153 + $39,848) ÷ 2
=$6,320
$54,001= 11.7%
Return on commonshareholders’ equity
=Net income − Preferred dividends
Average common shareholders’ equity
=$6,320 − $6
[($4,558 + $37,402 − $3,630 − $16,745) + ($280 + $34,443 − $3,794 − $13,383)] ÷ 2
=$6,314
$19,566= 32. 3%
Chapter 13 How Do Managers Use Financial and Nonfinancial Performance Measures?
13.3 Ratio Analysis of Financial Information 1069

For every dollar in average common shareholders’ equity,PepsiCo generated 32.3 cents in net income (after deductingpreferred dividends).
5.
For each common share outstanding, PepsiCo generated $3.97 innet income (after deducting preferred dividends).
Short-Term Liquidity Ratios
Question: Suppliers and other short-term lenders often want to evaluate whether companiescan meet short-term obligations. What are the four common ratios used to evaluate short-term liquidity?
Answer: The four ratios used to evaluate short-term liquidity are as follows:
1. Current ratio2. Quick ratio3. Receivables turnover ratio (often converted to average collection period)4. Inventory turnover ratio (often converted to average sale period)
Current Ratio
Question: How is the current ratio calculated, and what does it tell us about Coca-Colarelative to PepsiCo and the industry average?
Earnings per share =Net income − Preferred dividends
Weighted average common shares outstanding
=$6,320 − $61,590 shares
= $3. 97 per share
Chapter 13 How Do Managers Use Financial and Nonfinancial Performance Measures?
13.3 Ratio Analysis of Financial Information 1070

Answer: The current ratio11 indicates whether a company has sufficient currentassets to cover current liabilities. It is found by dividing current assets by currentliabilities:
Key Equation
The current ratio for Coca-Cola for 2010 is calculated as follows, with PepsiCo andindustry average information following it:
Coca-Cola2010
Coca-Cola2009
PepsiCo2010
Industry Average2010
Currentratio
1.17 to 1 1.28 to 1 1.11 to 1 1.20 to 1
The current ratio indicates Coca-Cola had $1.17 in current assets for every dollar incurrent liabilities. This ratio decreased from 2009 to 2010 and is slightly higher thanPepsiCo’s 1.11 to 1 ratio. Coca-Cola is close to the industry average of 1.20 to 1. Ingeneral, a current ratio above 1 to 1 is preferable, which indicates the company hassufficient current assets to cover current liabilities. However, finding the idealminimum current ratio is dependent on many factors, such as the industry, theoverall financial condition of the company, and the composition of the company’scurrent assets and current liabilities. Because of variations in these factors fromone company to the next, a more stringent measure of short-term liquidity is oftenused. We present this measure, called the quick ratio, next.
Quick Ratio
Question: How is the quick ratio calculated, and what does it tell us about Coca-Colarelative to PepsiCo and the industry average?
Current ratio =Current assets
Current liabilities
Current ratio =$11,199 + $138 + $4,430 + $2,650 + $3,162
$8,859 + $8,100 + $1,549=
$21,579$18,508
= 1.17 to 1
11. Indicates whether a companyhas enough current assets tocover current liabilities.Calculated as current assetsdivided by current liabilities.
Chapter 13 How Do Managers Use Financial and Nonfinancial Performance Measures?
13.3 Ratio Analysis of Financial Information 1071

Answer: The quick ratio12 (also called acid-test ratio) indicates whether a companyhas sufficient quick, or highly liquid, assets to cover current liabilities. The quickratio is quick assets divided by current liabilities:
Key Equation
Notice the numerator excludes current assets that are not easily and quicklyconverted to cash. Although inventory is typically excluded from the numerator,further analysis is needed to evaluate whether inventory should be included. Forexample, grocery stores turn inventory over very quickly, typically within a coupleof weeks, and should consider including inventory in the quick ratio. Producers ofwine, on the other hand, turn inventory over very slowly, and should considerexcluding inventory in the numerator of the quick ratio. For the sake ofconsistency, you should exclude inventory from the numerator in this chapter,unless told otherwise. (Note: Many companies provide two quick ratio calculations,one that includes inventory in the numerator and one that excludes inventory inthe numerator. If two ratios are presented, it is important to label each ratio toindicate whether inventory has been included or excluded.)
It is helpful when reviewing a company’s balance sheet to remember that currentassets are presented in order of liquidity, with the most liquid current assetappearing first and the least liquid appearing last. This helps in determiningwhether a particular current asset should be included or excluded in the numeratorof the quick ratio. The quick ratio for Coca-Cola for 2010 is calculated as follows,with PepsiCo and industry average information following it:
Coca-Cola2010
Coca-Cola2009
PepsiCo2010
Industry Average2010
Quickratio
0.85 to 1 0.95 to 1 0.80 to 1 1.10 to 1
Quick ratio =Cash + Marketable securities + Short-term receivables
Current liabilities
Quick ratio =$11,199 + $138 + $4,430$8,859 + $8,100 + $1,549
=$15,767$18,508
= 0.85 to 1
12. Indicates whether a companyhas enough quick assets tocover current liabilities.Calculated as quick assetsdivided by current liabilities;also called acid-test ratio.
Chapter 13 How Do Managers Use Financial and Nonfinancial Performance Measures?
13.3 Ratio Analysis of Financial Information 1072

The quick ratio indicates Coca-Cola had $0.85 in quick assets for every dollar incurrent liabilities. This ratio decreased from 2009 to 2010 and is slightly higher thanPepsiCo’s 0.80 to 1 ratio. Coca-Cola is below the industry average of 1.10 to 1.
Receivables Turnover Ratio
Question: How is the receivables turnover ratio calculated, and what does it tell us aboutCoca-Cola relative to PepsiCo and the industry average?
Answer: The receivables turnover ratio13 indicates how many times receivablesare collected in a given period and is found by dividing credit sales by averageaccounts receivable:
Key Equation
Assume all net sales presented on the income statement are on account, andtherefore will be used in the numerator. The average accounts receivable amount inthe denominator is found by adding together accounts receivable at the end of thecurrent year and previous year (2010 and 2009 for this example) and dividing bytwo. The receivables turnover ratio for Coca-Cola for 2010 is calculated as follows,with PepsiCo and industry average information following it:
Coca-Cola2010
Coca-Cola2009
PepsiCo2010
IndustryAverage 2010
Receivablesturnover ratio
8.58 times 9.05 times10.57times
9.70 times
Receivables turnover ratio =Credit sales
Average accounts receivable
Receivables turnover ratio =$35,119
($4,430 + $3,758) ÷ 2=
$35,119$4,094
= 8. 58 times
13. Indicates how many timesreceivables are collected in agiven period. Calculated ascredit sales divided by averageaccounts receivable.
Chapter 13 How Do Managers Use Financial and Nonfinancial Performance Measures?
13.3 Ratio Analysis of Financial Information 1073

The receivables turnover ratio indicates Coca-Cola collected receivables 8.58 timesduring 2010. This ratio decreased from 2009 to 2010 and is lower than PepsiCo’s10.57 times. Coca-Cola is below the industry average of 9.70 times.
Question: How is the receivables turnover ratio converted to average collection period?
Answer: The receivables turnover ratio can be converted to the average collectionperiod14, which indicates how many days it takes on average to collect on creditsales, as follows:
Key Equation
This ratio is typically compared to the company’s credit terms to evaluate howeffectively receivables are being collected. The average collection period for Coca-Cola for 2010 is calculated as follows, with PepsiCo and industry averageinformation following it:
Coca-Cola2010
Coca-Cola2009
PepsiCo2010
IndustryAverage 2010
Averagecollection period
42.54 days 40.33 days34.53days
37.63 days
The average collection period indicates Coca-Cola collected credit sales in 42.54days, on average. The number of days increased slightly from 2009 to 2010 and ishigher than PepsiCo’s 34.53 days. Coca-Cola is also above the industry average of37.63 days and therefore is slower at collecting accounts receivable than theindustry as a whole.
Average collection period =365 days
Receivables turnover ratio
Average collection period =365 days
8. 58 times= 42. 54 days
14. Indicates how many days ittakes on average to collectcredit sales. Calculated as 365days divided by receivablesturnover ratio.
Chapter 13 How Do Managers Use Financial and Nonfinancial Performance Measures?
13.3 Ratio Analysis of Financial Information 1074
Inventory Turnover Ratio
Question: How is the inventory turnover ratio calculated, and what does it tell us aboutCoca-Cola relative to PepsiCo and the industry average?
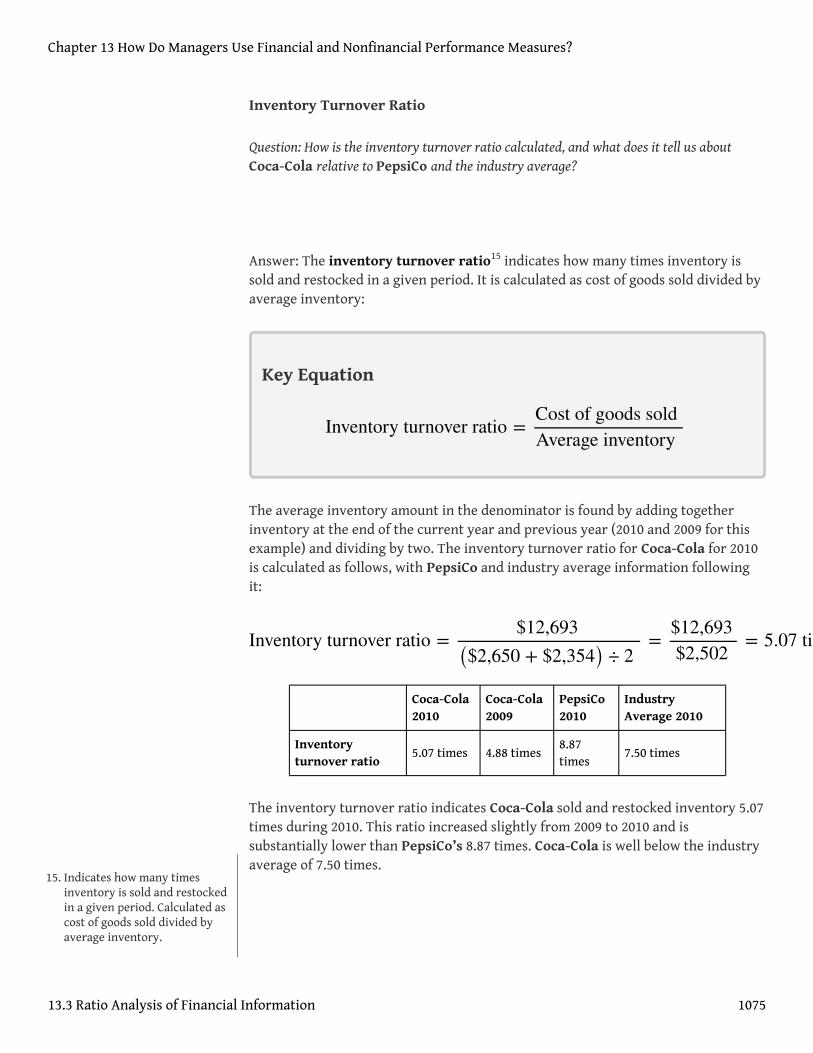
Answer: The inventory turnover ratio15 indicates how many times inventory issold and restocked in a given period. It is calculated as cost of goods sold divided byaverage inventory:
Key Equation
The average inventory amount in the denominator is found by adding togetherinventory at the end of the current year and previous year (2010 and 2009 for thisexample) and dividing by two. The inventory turnover ratio for Coca-Cola for 2010is calculated as follows, with PepsiCo and industry average information followingit:
Coca-Cola2010
Coca-Cola2009
PepsiCo2010
IndustryAverage 2010
Inventoryturnover ratio
5.07 times 4.88 times8.87times
7.50 times
The inventory turnover ratio indicates Coca-Cola sold and restocked inventory 5.07times during 2010. This ratio increased slightly from 2009 to 2010 and issubstantially lower than PepsiCo’s 8.87 times. Coca-Cola is well below the industryaverage of 7.50 times.
Inventory turnover ratio =Cost of goods soldAverage inventory
Inventory turnover ratio =$12,693
($2,650 + $2,354) ÷ 2=
$12,693$2,502
= 5.07 times
15. Indicates how many timesinventory is sold and restockedin a given period. Calculated ascost of goods sold divided byaverage inventory.
Chapter 13 How Do Managers Use Financial and Nonfinancial Performance Measures?
13.3 Ratio Analysis of Financial Information 1075
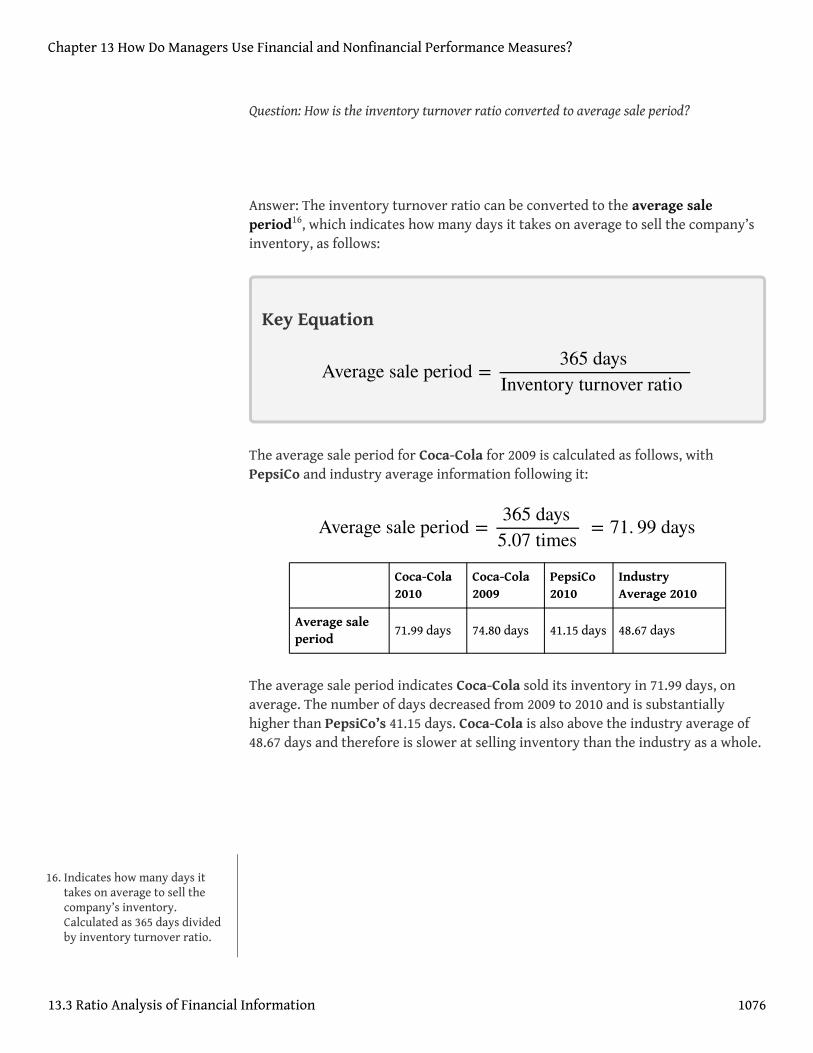
Question: How is the inventory turnover ratio converted to average sale period?
Answer: The inventory turnover ratio can be converted to the average saleperiod16, which indicates how many days it takes on average to sell the company’sinventory, as follows:
Key Equation
The average sale period for Coca-Cola for 2009 is calculated as follows, withPepsiCo and industry average information following it:
Coca-Cola2010
Coca-Cola2009
PepsiCo2010
IndustryAverage 2010
Average saleperiod
71.99 days 74.80 days 41.15 days 48.67 days
The average sale period indicates Coca-Cola sold its inventory in 71.99 days, onaverage. The number of days decreased from 2009 to 2010 and is substantiallyhigher than PepsiCo’s 41.15 days. Coca-Cola is also above the industry average of48.67 days and therefore is slower at selling inventory than the industry as a whole.
Average sale period =365 days
Inventory turnover ratio
Average sale period =365 days
5.07 times= 71. 99 days
16. Indicates how many days ittakes on average to sell thecompany’s inventory.Calculated as 365 days dividedby inventory turnover ratio.
Chapter 13 How Do Managers Use Financial and Nonfinancial Performance Measures?
13.3 Ratio Analysis of Financial Information 1076

Business in Action 13.4
© Thinkstock
Industry Variations in Inventory and Receivable Turnover
Retail grocery stores turn inventory over every 22 days, meaning that shelvesare emptied and restocked about every three weeks. In addition to extremelyfast inventory turnover, retail grocery stores collect credit sales in seven days.Thus it takes 29 days, on average, to convert freshly stocked inventory to cash.Very few industries are able to convert inventory to cash as quickly. Examplesof inventory and receivable turnover for several industries are shown in thefollowing.
ReceivablesTurnover
InventoryTurnover
Auto manufacturers 39 days 41 days
Chemical manufacturing 51 days 61 days
Forestry and woodproducts
46 days 53 days
Computer systems 78 days 18 days
Chapter 13 How Do Managers Use Financial and Nonfinancial Performance Measures?
13.3 Ratio Analysis of Financial Information 1077

Source: Industry averages found at MSN Money, Home Page,”http://moneycentral.msn.com.
Chapter 13 How Do Managers Use Financial and Nonfinancial Performance Measures?
13.3 Ratio Analysis of Financial Information 1078

REVIEW PROBLEM 13 .4
Refer to the information presented in Note 13.10 "Review Problem 13.1" forPepsiCo, and perform the following requirements for 2010:
1. Calculate the current ratio, and briefly describe what it means forPepsiCo.
2. Calculate the quick ratio, and briefly describe what it means forPepsiCo.
3. Calculate the receivables turnover ratio and average collection period,and briefly describe what these measures mean for PepsiCo. Assume allsales are on account.
4. Calculate the inventory turnover ratio and average sale period, andbriefly describe what these measures mean for PepsiCo.
Solution to Review Problem 13.4
1.
For every dollar in current liabilities, PepsiCo had $1.11 incurrent assets.
2.
Current ratio =Current assets
Current liabilities
=$5,943 + $426 + $6,323 + $3,372 + 1,505
$4,898 + $10,923 + $71
=$17,569$15,892
= 1.11 to 1
Chapter 13 How Do Managers Use Financial and Nonfinancial Performance Measures?
13.3 Ratio Analysis of Financial Information 1079
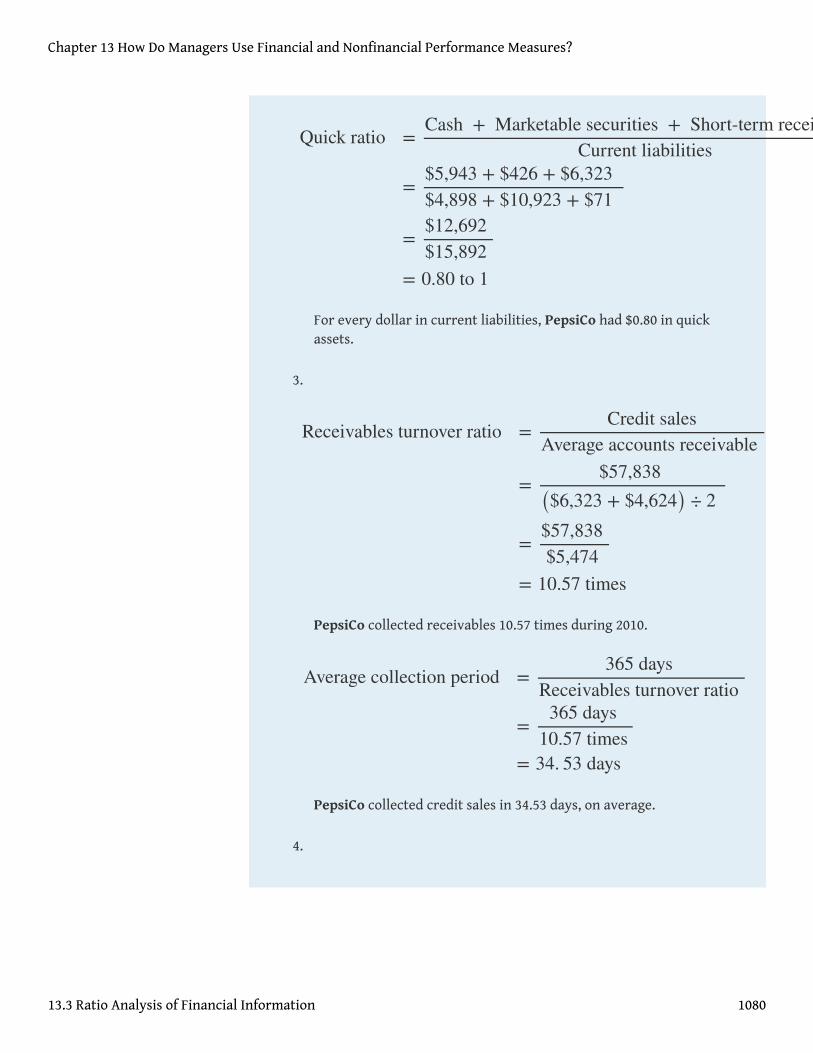
For every dollar in current liabilities, PepsiCo had $0.80 in quickassets.
3.
PepsiCo collected receivables 10.57 times during 2010.
PepsiCo collected credit sales in 34.53 days, on average.
4.
Quick ratio =Cash + Marketable securities + Short-term receivables
Current liabilities
=$5,943 + $426 + $6,323$4,898 + $10,923 + $71
=$12,692$15,892
= 0.80 to 1
Receivables turnover ratio =Credit sales
Average accounts receivable
=$57,838
($6,323 + $4,624) ÷ 2
=$57,838$5,474
= 10.57 times
Average collection period =365 days
Receivables turnover ratio
=365 days
10.57 times= 34. 53 days
Chapter 13 How Do Managers Use Financial and Nonfinancial Performance Measures?
13.3 Ratio Analysis of Financial Information 1080

PepsiCo sold and restocked inventory 8.87 times during 2010.
PepsiCo sold its inventory in 41.15 days, on average.
Long-Term Solvency Ratios
Question: Banks, bondholders, and other long-term lenders often want to evaluate whethercompanies can meet long-term obligations. What are the three common ratios used toevaluate long-term solvency?
Answer: The three ratios used to evaluate long-term solvency are as follows:
1. Debt to assets2. Debt to equity3. Times interest earned
Inventory turnover ratio =Cost of goods soldAverage inventory
=$26,575
($3,372 + $2,618) ÷ 2
=$26,575$2,995
= 8. 87 times
Average sale period =365 days
Inventory turnover ratio
=365 days
8. 87 times= 41. 15 days
Chapter 13 How Do Managers Use Financial and Nonfinancial Performance Measures?
13.3 Ratio Analysis of Financial Information 1081
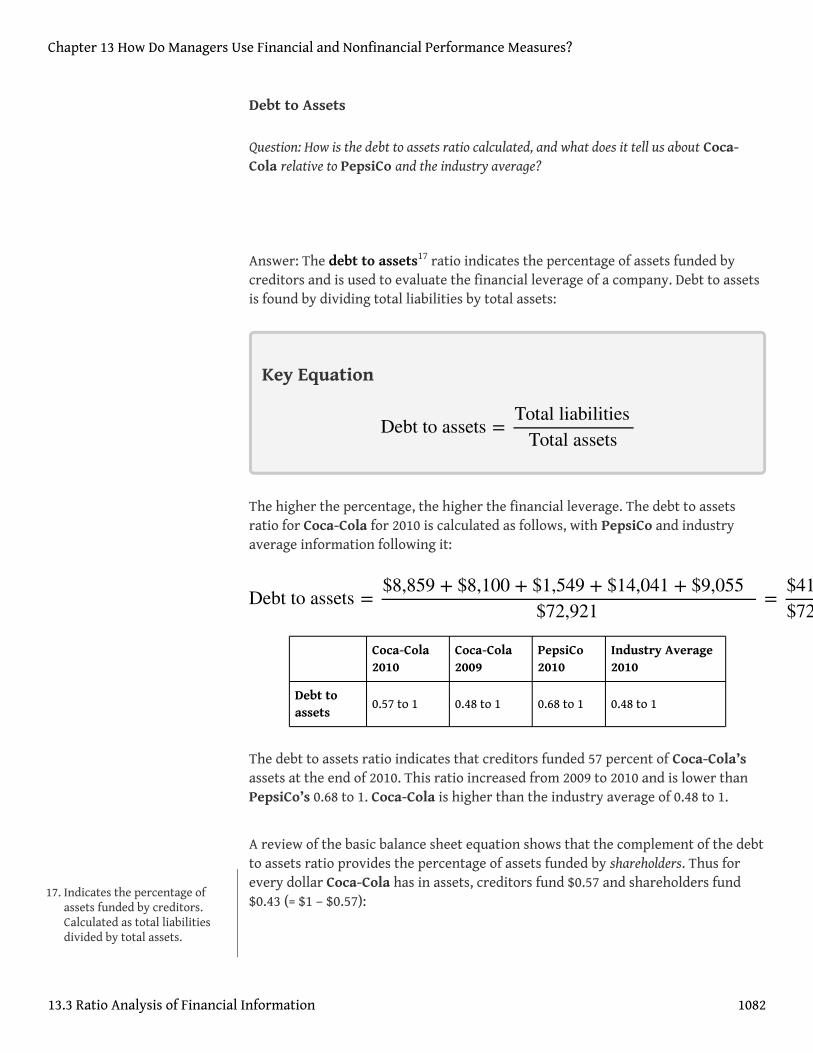
Debt to Assets
Question: How is the debt to assets ratio calculated, and what does it tell us about Coca-Cola relative to PepsiCo and the industry average?
Answer: The debt to assets17 ratio indicates the percentage of assets funded bycreditors and is used to evaluate the financial leverage of a company. Debt to assetsis found by dividing total liabilities by total assets:
Key Equation
The higher the percentage, the higher the financial leverage. The debt to assetsratio for Coca-Cola for 2010 is calculated as follows, with PepsiCo and industryaverage information following it:
Coca-Cola2010
Coca-Cola2009
PepsiCo2010
Industry Average2010
Debt toassets
0.57 to 1 0.48 to 1 0.68 to 1 0.48 to 1
The debt to assets ratio indicates that creditors funded 57 percent of Coca-Cola’sassets at the end of 2010. This ratio increased from 2009 to 2010 and is lower thanPepsiCo’s 0.68 to 1. Coca-Cola is higher than the industry average of 0.48 to 1.
A review of the basic balance sheet equation shows that the complement of the debtto assets ratio provides the percentage of assets funded by shareholders. Thus forevery dollar Coca-Cola has in assets, creditors fund $0.57 and shareholders fund$0.43 (= $1 – $0.57):
Debt to assets =Total liabilities
Total assets
Debt to assets =$8,859 + $8,100 + $1,549 + $14,041 + $9,055
$72,921=
$41,604$72,921
= 0.57 to 1
17. Indicates the percentage ofassets funded by creditors.Calculated as total liabilitiesdivided by total assets.
Chapter 13 How Do Managers Use Financial and Nonfinancial Performance Measures?
13.3 Ratio Analysis of Financial Information 1082
The debt to assets ratio reveals Coca-Cola (0.57 to 1) and PepsiCo (0.68 to 1) aremore highly leveraged than the industry average of 0.48 to 1.
Debt to Equity
Question: How is the debt to assets ratio calculated, and what does it tell us about Coca-Cola relative to PepsiCo and the industry average?
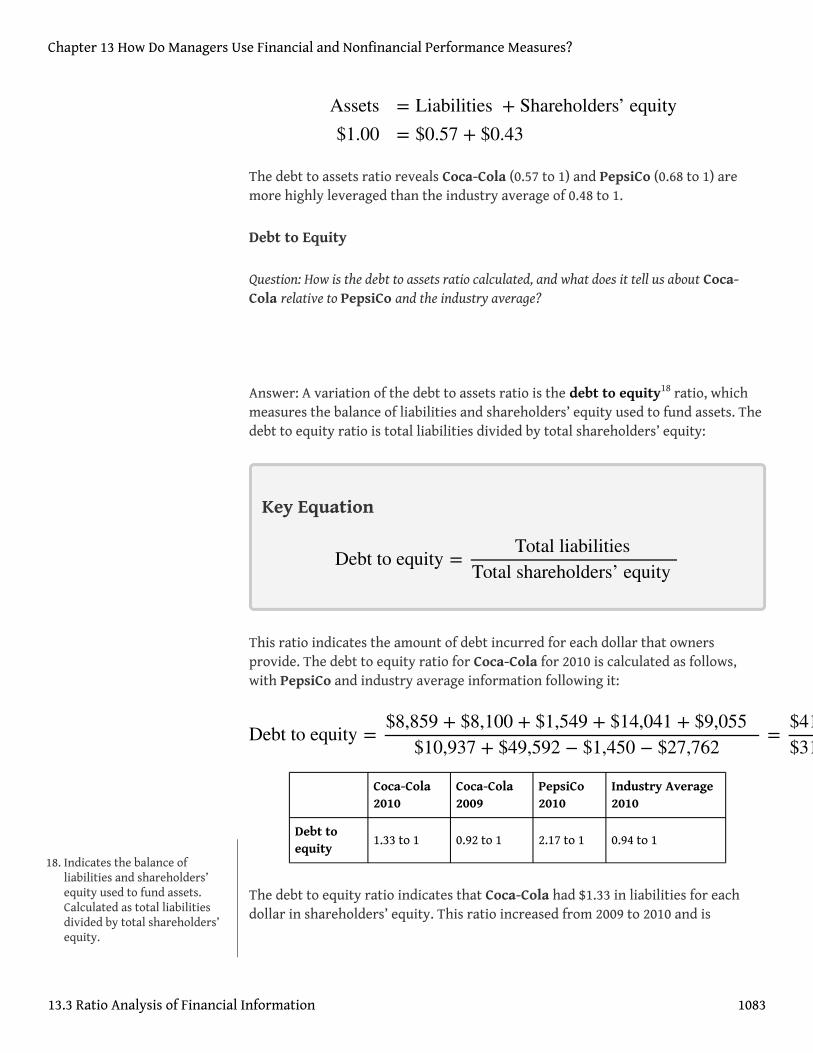
Answer: A variation of the debt to assets ratio is the debt to equity18 ratio, whichmeasures the balance of liabilities and shareholders’ equity used to fund assets. Thedebt to equity ratio is total liabilities divided by total shareholders’ equity:
Key Equation
This ratio indicates the amount of debt incurred for each dollar that ownersprovide. The debt to equity ratio for Coca-Cola for 2010 is calculated as follows,with PepsiCo and industry average information following it:
Coca-Cola2010
Coca-Cola2009
PepsiCo2010
Industry Average2010
Debt toequity
1.33 to 1 0.92 to 1 2.17 to 1 0.94 to 1
The debt to equity ratio indicates that Coca-Cola had $1.33 in liabilities for eachdollar in shareholders’ equity. This ratio increased from 2009 to 2010 and is
Assets$1.00
= Liabilities + Shareholders’ equity= $0.57 + $0.43
Debt to equity =Total liabilities
Total shareholders’ equity
Debt to equity =$8,859 + $8,100 + $1,549 + $14,041 + $9,055
$10,937 + $49,592 − $1,450 − $27,762=
$41,604$31,317
= 1.33 to 1
18. Indicates the balance ofliabilities and shareholders’equity used to fund assets.Calculated as total liabilitiesdivided by total shareholders’equity.
Chapter 13 How Do Managers Use Financial and Nonfinancial Performance Measures?
13.3 Ratio Analysis of Financial Information 1083

substantially lower than PepsiCo’s 2.17 to 1. However, Coca-Cola is higher than theindustry average of 0.94 to 1.
Chapter 13 How Do Managers Use Financial and Nonfinancial Performance Measures?
13.3 Ratio Analysis of Financial Information 1084

Business in Action 13.5
Source: Photo courtesy of spechtenhauser, http://www.flickr.com/photos/usinside/2931437356/.
Financial Leverage at General Motors and Toyota
Prior to the company’s bankruptcy filing in 2009, General Motors (GM) was thelargest manufacturer of automobiles and trucks in the world (ranked byrevenues). However, GM took on substantial amounts of debt over severalyears. With an average debt to equity ratio of 2.5 to 1, the automobile industryis relatively highly leveraged, but GM’s ratio was substantially higher at 11.3 to1. This means that GM had $11.30 in debt for every $1 in shareholders’ equity.
Toyota Motor Corporation, on the other hand, was not highly leveraged; ithad a debt to equity ratio of 1 to 1. Thus Toyota had $1 in debt for every $1 inshareholders’ equity. It is important to review other financial ratios beforeconcluding that Toyota was in better financial shape than GM, but the fact that
Chapter 13 How Do Managers Use Financial and Nonfinancial Performance Measures?
13.3 Ratio Analysis of Financial Information 1085

GM was much more highly leveraged than Toyota likely played a big role inGM’s downfall!
Source: Industry averages found at MSN Money, Home Page,”http://moneycentral.msn.com and Yahoo! Finance, “Home Page,”http://biz.yahoo.com.
Times Interest Earned
Question: How is times interest earned calculated, and what does it tell us about Coca-Colarelative to PepsiCo and the industry average?
Answer: The times interest earned19 ratio (also called interest coverage ratio)measures the company’s ability to cover its interest expense related to long-termdebt with current period earnings. The times interest earned ratio is net incomebefore income tax expense and interest expense divided by interest expense:
Key Equation
Notice that income tax expense and interest expense are added back in thenumerator to find net income available to cover interest expense. The timesinterest earned ratio for Coca-Cola for 2010 is calculated as follows, with PepsiCoand industry average information following it:
Coca-Cola2010
Coca-Cola2009
PepsiCo2010
IndustryAverage 2010
Times interest earned =Net income + Income tax expense + Interest expense
Interest expense
Times interest earned =$11,809 + $2,384 + $733
$733=
$14,926$733
= 20.36 times19. Indicates the ability of a
company to cover its interestexpense with current periodearnings. Calculated as incomebefore income tax expense andinterest expense divided byinterest expense; also calledinterest coverage ratio.
Chapter 13 How Do Managers Use Financial and Nonfinancial Performance Measures?
13.3 Ratio Analysis of Financial Information 1086
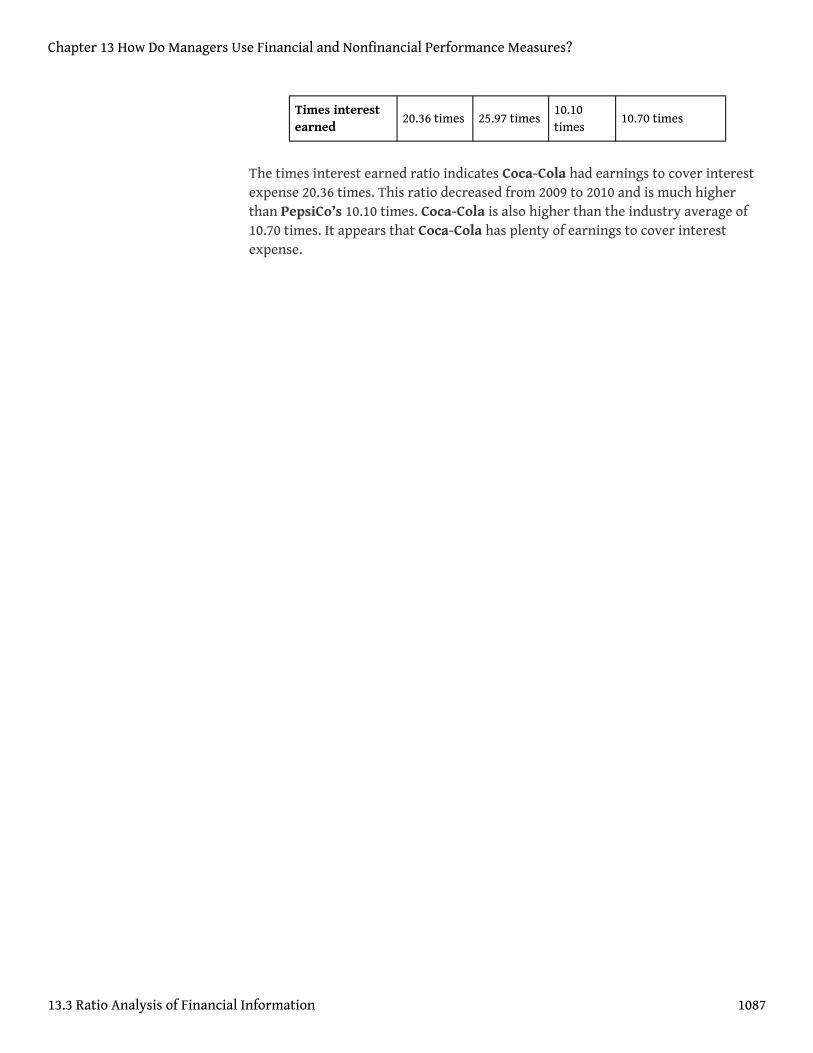
Times interestearned
20.36 times 25.97 times10.10times
10.70 times
The times interest earned ratio indicates Coca-Cola had earnings to cover interestexpense 20.36 times. This ratio decreased from 2009 to 2010 and is much higherthan PepsiCo’s 10.10 times. Coca-Cola is also higher than the industry average of10.70 times. It appears that Coca-Cola has plenty of earnings to cover interestexpense.
Chapter 13 How Do Managers Use Financial and Nonfinancial Performance Measures?
13.3 Ratio Analysis of Financial Information 1087

REVIEW PROBLEM 13 .5
Refer to the information presented in Note 13.10 "Review Problem 13.1" forPepsiCo, and perform the following requirements for 2010:
1. Calculate the debt to assets ratio, and briefly describe what it means forPepsiCo.
2. Calculate the debt to equity ratio, and briefly describe what it means forPepsiCo.
3. Calculate the times interest earned ratio, and briefly describe what itmeans for PepsiCo.
Solution to Review Problem 13.5
1.
Creditors funded 68 percent of PepsiCo’s assets. Owners fundedthe remaining 32 percent.
2.
Debt to assets =Total liabilities
Total assets
=$4,898 + $10,923 + $71 + $19,999 + $10,786
$68,153
=$46,677$68,153
= 0.68 to 1
Chapter 13 How Do Managers Use Financial and Nonfinancial Performance Measures?
13.3 Ratio Analysis of Financial Information 1088

For every dollar in shareholders’ equity, PepsiCo had $2.17 inliabilities.
3.
PepsiCo had earnings to cover interest expense 10.10 times.
Market Valuation Measures
Question: Existing and potential shareholders are often interested in a company’s marketvalue. What are the two common measures used to evaluate market value?
Answer: The two measures used to determine and evaluate the market value of acompany are as follows:
1. Market capitalization2. Price-earnings ratio
Debt to equity =Total liabilities
Total shareholders’ equity
=$4,898 + $10,923 + $71 + $19,999 + $10,786
($109) + $4,558 + $37,402 − $3,630 − $16,745
=$46,677$21,476
= 2.17 to 1
Times interest earned =Net income + Income tax expense + Interest expense
Interest expense
=$6,320 + $1,894 + $903
$903
=$9,117$903
= 10.10 times
Chapter 13 How Do Managers Use Financial and Nonfinancial Performance Measures?
13.3 Ratio Analysis of Financial Information 1089

Market Capitalization
Question: How is market capitalization calculated, and what does it tell us about Coca-Colarelative to PepsiCo and the industry average?
Answer: Market capitalization20 (also called market cap) measures the value of acompany at a point in time. It is determined by multiplying market price per sharetimes the number of shares outstanding:
Key Equation
Market capitalization = Market price per share × Number of shares outstanding
Coca-Cola’s market capitalization for 2010 is calculated as follows, with PepsiCoinformation following it. The number of shares outstanding at Coca-Cola’s fiscalyear ended December 31, 2010, totaled 2,292,000,000 (= 3,520,000,000 shares issued –1,228,000,000 treasury shares). The market price per share at that time was $63.92.
Market capitalization = $63.92 per share × 2,292,000,000 shares = $146,500,000,000
Coca-Cola 2010 Coca-Cola 2009 PepsiCo 2010IndustryAverage 2010
Marketcapitalization
$146,500,000,000 $123,200,000,000 $100,700,000,000 $87,500,000,000
Coca-Cola’s market capitalization indicates that the company’s shares outstandinghad a market value totaling $146,500,000,000 at the end of 2010. This amountincreased significantly from 2009 to 2010 and is higher than PepsiCo’s$100,700,000,000. Both Coca-Cola and PepsiCo are above the industry average of$87,500,000.
(Note that the number of shares outstanding is typically found in the shareholders’equity section of the balance sheet or in the notes to the financial statements. Weprovide the number of shares outstanding throughout this chapter, unless notedotherwise. This number is different than the weighted average shares outstandingused to calculate earnings per share earlier in the chapter. Also note that the price
20. Indicates the value of acompany at a point in time.Calculated as market price pershare times the number ofshares outstanding; also calledmarket cap.
Chapter 13 How Do Managers Use Financial and Nonfinancial Performance Measures?
13.3 Ratio Analysis of Financial Information 1090

per share amount is from Yahoo’s finance Web site at http://finance.yahoo.com. Weprovide this information throughout the chapter, unless noted otherwise.)
Looking at a company’s market capitalization is a quick way of gauging itsaggregate value. But what does a number like Coca-Cola’s $146,500,000,000 marketcapitalization really tell us about how a company compares to others? Note 13.54"Business in Action 13.6" has the answer.
Business in Action 13.6
Three Categories of Market Capitalization
Most investors refer to market capitalization as market cap. Companies aretypically classified into one of three market cap categories: small-cap, midcap,and large-cap. In general, small-cap companies have a market value of less than$1,000,000,000, midcap companies have a market value between $1,000,000,000and $12,000,000,000, and large-cap companies have a market value greater than$12,000,000,000.
Thus small-cap mutual funds are stock funds that invest in companies with amarket value of less than $1,000,000,000. Midcap mutual funds are stock fundsthat invest in companies with a market value between $1,000,000,000 and$12,000,000,000, and so on. These categories are important to investors becausethe stocks of small-cap companies tend to be more volatile than those of mid-or large-cap companies.
Source: Definitions are from the Web site of Vanguard, one of the world’slargest investment management firms (http://www.vanguard.com).
Price-Earnings Ratio
Question: How is the price-earnings ratio calculated, and what does it tell us about Coca-Cola relative to PepsiCo and the industry average?
Chapter 13 How Do Managers Use Financial and Nonfinancial Performance Measures?
13.3 Ratio Analysis of Financial Information 1091

Answer: The price-earnings ratio21 (also called P/E ratio) measures the premiuminvestors are willing to pay for shares of stock relative to the company’s earnings.The price-earnings ratio is found by dividing market price per share by earningsper share:
Key Equation
In general, a relatively high price-earnings ratio indicates investors expectfavorable future earnings, whereas a relatively low price-earnings ratio indicatesinvestors expect moderate future earnings. The price-earnings ratio for Coca-Colafor 2010 is calculated as follows, with PepsiCo and industry average informationfollowing it. The market price information was given in the market capitalizationexample, and we calculated earnings per share earlier in the chapter.
Coca-Cola2010
Coca-Cola2009
PepsiCo2010
IndustryAverage 2010
Price-earningsratio
12.48 times 18.21 times16.04times
14.60 times
The price-earnings ratio indicates investors were willing to pay 12.48 times theearnings for Coca-Cola’s stock. This ratio decreased from 2009 to 2010 and is lowerthan PepsiCo’s 16.04 times. Coca-Cola is also lower than the industry average of14.60 times.
Price-earnings ratio =Market price per share
Earnings per share
Price-earnings ratio =$63. 92$5. 12
= 12. 48 times
21. Indicates the premiuminvestors are willing to pay forshares of stock relative to thecompany’s earnings. Calculatedas market price per sharedivided by earnings per share;also called P/E ratio.
Chapter 13 How Do Managers Use Financial and Nonfinancial Performance Measures?
13.3 Ratio Analysis of Financial Information 1092

KEY TAKEAWAY
• Shareholders, creditors, and analysts often evaluate a company’sprofitability. Five ratios used to evaluate profitability are the grossmargin ratio, the profit margin ratio, return on assets, return oncommon shareholders’ equity, and earnings per share. Suppliers andother short-term creditors often evaluate whether a company can meetshort-term obligations. Four ratios used to evaluate short-term liquidityare the current ratio, the quick ratio, the receivables turnover ratio(often converted to average collection period), and the inventoryturnover ratio (often converted to average sale period). Banks,bondholders, and other long-term lenders often evaluate whethercompanies can meet long-term obligations. Three ratios used to evaluatelong-term solvency are debt to assets, debt to equity, and times interestearned. Shareholders are particularly interested in a company’s marketvalue. Two measures used to determine and evaluate the market value ofa company are market capitalization and the price-earnings ratio.
Chapter 13 How Do Managers Use Financial and Nonfinancial Performance Measures?
13.3 Ratio Analysis of Financial Information 1093
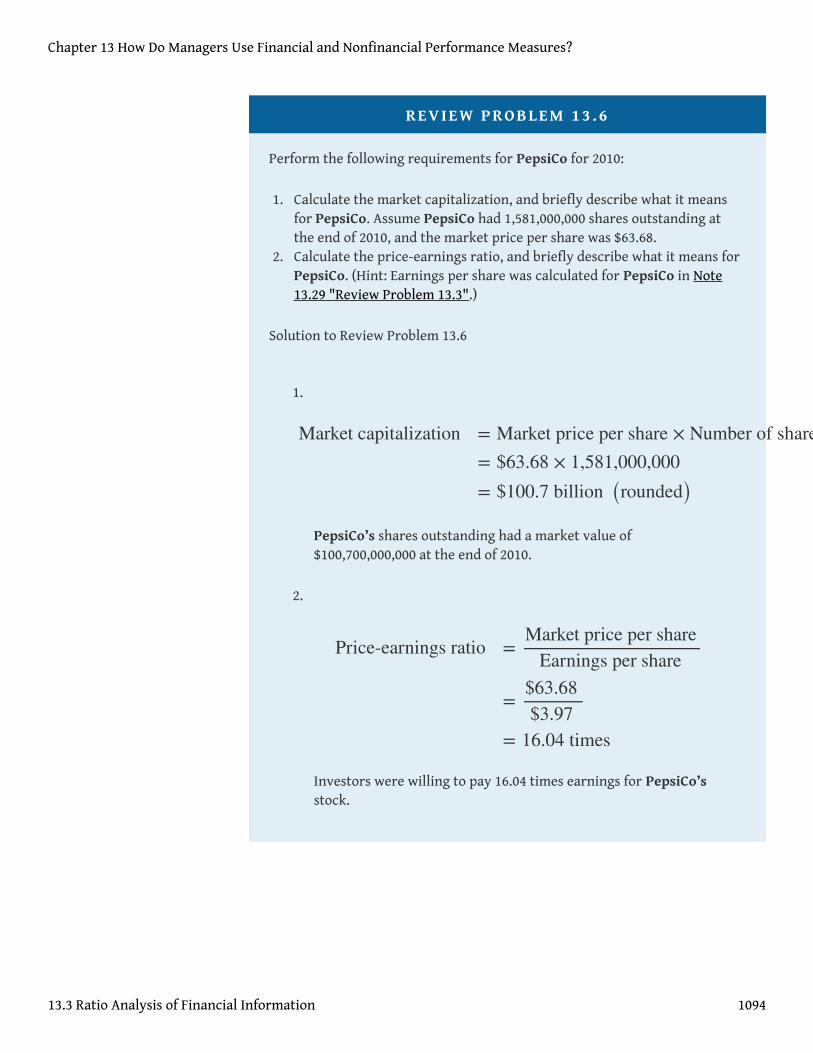
REVIEW PROBLEM 13 .6
Perform the following requirements for PepsiCo for 2010:
1. Calculate the market capitalization, and briefly describe what it meansfor PepsiCo. Assume PepsiCo had 1,581,000,000 shares outstanding atthe end of 2010, and the market price per share was $63.68.
2. Calculate the price-earnings ratio, and briefly describe what it means forPepsiCo. (Hint: Earnings per share was calculated for PepsiCo in Note13.29 "Review Problem 13.3".)
Solution to Review Problem 13.6
1.
PepsiCo’s shares outstanding had a market value of$100,700,000,000 at the end of 2010.
2.
Investors were willing to pay 16.04 times earnings for PepsiCo’sstock.
Market capitalization = Market price per share × Number of shares outstanding= $63.68 × 1,581,000,000= $100.7 billion (rounded)
Price-earnings ratio =Market price per share
Earnings per share
=$63.68$3.97
= 16.04 times
Chapter 13 How Do Managers Use Financial and Nonfinancial Performance Measures?
13.3 Ratio Analysis of Financial Information 1094

13.4 Wrap-Up of Chapter Example
Recall the dialogue at Chicken Deluxe between Sandy Masako, the CEO; DaveRoberts, the CFO; and Karen Kraft, the purchasing manager. Chicken Deluxe mustchoose between Deep Fizz Company and Extreme Fizz, Inc., as the supplier of thecompany’s beverages. Dave was asked to evaluate the financial condition of eachcompany and report back to the group. The group reconvenes the following month,where Dave presents the financial measures for each company. As you read thedialogue, refer to Table 13.3 "Summary of Financial Ratios for Deep Fizz Company;Extreme Fizz, Inc.; and the Industry Average"; it is the summary of financialmeasures that Dave provides to the group.
Table 13.3 Summary of Financial Ratios for Deep Fizz Company; Extreme Fizz, Inc.;and the Industry Average
Deep Fizz Extreme FizzIndustryAverage
Profitability Measures
1. Gross margin ratio 63.1 percent 54.1 percent 53.1 percent
2. Profit margin ratio 22.1 percent 23.2 percent 19.2 percent
3. Return on assets 15.1 percent 17.3 percent 14.2 percent
4.Return on commonshareholders’ equity
36.5 percent 34.9 percent 34.7 percent
5. Earnings per share $2.01 $3.76 Not applicable
Short-Term Liquidity Measures
6. Current ratio 0.85 to 1 1.25 to 1 1.20 to 1
7. Quick ratio 0.62 to 1 0.87 to 1 1.10 to 1
8.Receivables turnoverratio
9.10 times 10.18 times 9.70 times
9. Average collection period 40.11 days 35.85 days 37.63 days
10. Inventory turnover ratio 5.12 times 7.86 times 7.50 times
11. Average sale period 72.29 days 46.44 days 48.67 days
Long-Term Solvency Measures
12. Debt to assets 0.34 to 1 0.38 to 1 0.48 to 1
Chapter 13 How Do Managers Use Financial and Nonfinancial Performance Measures?
1095
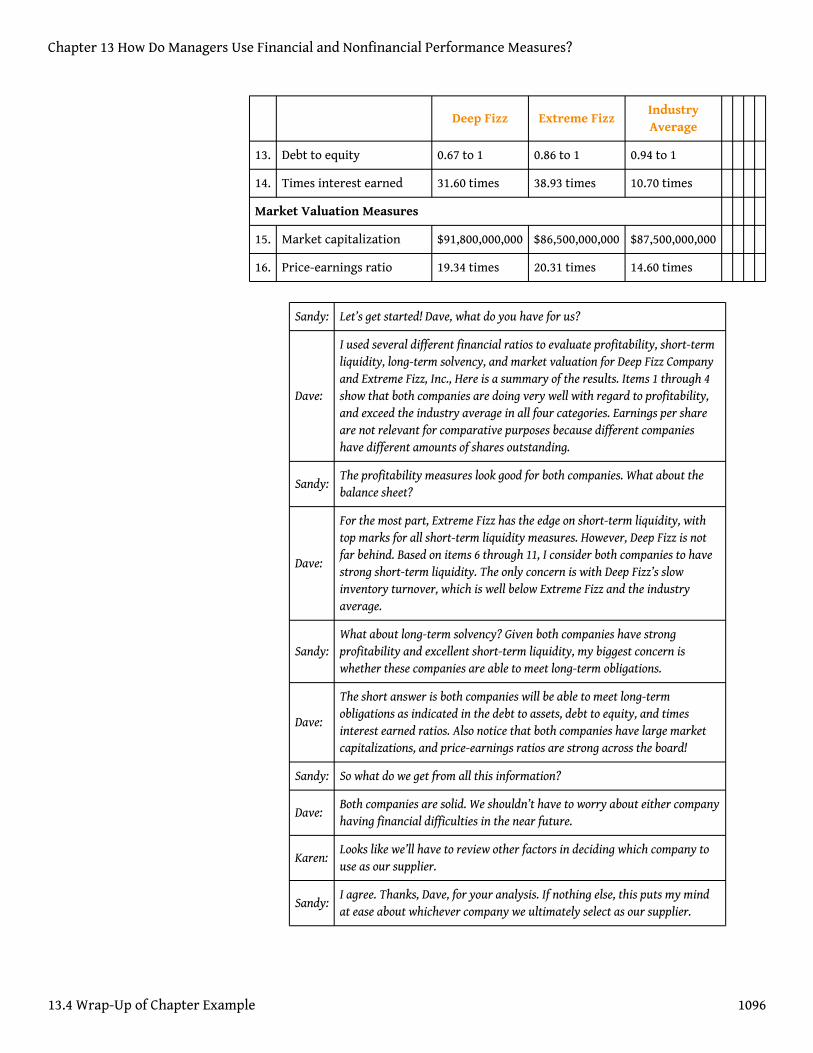
Deep Fizz Extreme FizzIndustryAverage
13. Debt to equity 0.67 to 1 0.86 to 1 0.94 to 1
14. Times interest earned 31.60 times 38.93 times 10.70 times
Market Valuation Measures
15. Market capitalization $91,800,000,000 $86,500,000,000 $87,500,000,000
16. Price-earnings ratio 19.34 times 20.31 times 14.60 times
Sandy: Let’s get started! Dave, what do you have for us?
Dave:
I used several different financial ratios to evaluate profitability, short-termliquidity, long-term solvency, and market valuation for Deep Fizz Companyand Extreme Fizz, Inc., Here is a summary of the results. Items 1 through 4show that both companies are doing very well with regard to profitability,and exceed the industry average in all four categories. Earnings per shareare not relevant for comparative purposes because different companieshave different amounts of shares outstanding.
Sandy:The profitability measures look good for both companies. What about thebalance sheet?
Dave:
For the most part, Extreme Fizz has the edge on short-term liquidity, withtop marks for all short-term liquidity measures. However, Deep Fizz is notfar behind. Based on items 6 through 11, I consider both companies to havestrong short-term liquidity. The only concern is with Deep Fizz’s slowinventory turnover, which is well below Extreme Fizz and the industryaverage.
Sandy:What about long-term solvency? Given both companies have strongprofitability and excellent short-term liquidity, my biggest concern iswhether these companies are able to meet long-term obligations.
Dave:
The short answer is both companies will be able to meet long-termobligations as indicated in the debt to assets, debt to equity, and timesinterest earned ratios. Also notice that both companies have large marketcapitalizations, and price-earnings ratios are strong across the board!
Sandy: So what do we get from all this information?
Dave:Both companies are solid. We shouldn’t have to worry about either companyhaving financial difficulties in the near future.
Karen:Looks like we’ll have to review other factors in deciding which company touse as our supplier.
Sandy:I agree. Thanks, Dave, for your analysis. If nothing else, this puts my mindat ease about whichever company we ultimately select as our supplier.
Chapter 13 How Do Managers Use Financial and Nonfinancial Performance Measures?
13.4 Wrap-Up of Chapter Example 1096

As you can see from the Chicken Deluxe example, analysts use many differentfinancial measures to evaluate financial performance. In the case of Deep Fizz andExtreme Fizz, both companies appear to be strong performers. Armed with thisinformation, management can confidently choose either company knowing thewinner will be on solid financial ground for years to come.
Chapter 13 How Do Managers Use Financial and Nonfinancial Performance Measures?
13.4 Wrap-Up of Chapter Example 1097

13.5 Nonfinancial Performance Measures: The Balanced Scorecard
LEARNING OBJECTIVE
1. Develop and analyze nonfinancial performance measures using abalanced scorecard.
Question: Although financial measures are important for evaluation purposes, manyorganizations use a mix of financial and nonfinancial measures to evaluate performance. Forexample, airlines track on-time arrival percentages carefully, and delivery companies likeFederal Express (FedEx) and United Parcel Service (UPS) monitor percentages of on-timedeliveries. The balanced scorecard uses several alternative measures to evaluateperformance. What is a balanced scorecard and how does it help companies to evaluateperformance?
Answer: The balanced scorecard22 is a balanced set of measures that organizationsuse to motivate employees and evaluate performance. These measures are typicallyseparated into four perspectives outlined in the following. (Dr. Robert S. Kaplan andDr. David P. Norton created the balanced scorecard, and it is actively promotedthrough their company, Balanced Scorecard Collaborative. More information can befound at the company’s Web site at http://www.bscol.com.)
1. Financial. Measures that shareholders, creditors, and otherstakeholders use to evaluate financial performance.
2. Internal business process. Measures that management uses toevaluate efficiency of existing business processes.
3. Learning and growth. Measures that management uses to evaluateeffectiveness of employee training.
4. Customer. Measures that management uses to evaluate whether theorganization is meeting customer expectations.
The goal is to link these four perspectives to the company’s strategies and goals. Forexample, a high percentage of on-time arrivals is likely an important goal from theperspective of the customer of an airline. A high percentage of defect-free computerchips is likely an important goal from the internal business process perspective of acomputer chip maker. A high number of continuing education hours is likely an
22. A balanced set of financial andnonfinancial measures used byorganizations to motivateemployees and evaluateperformance.
Chapter 13 How Do Managers Use Financial and Nonfinancial Performance Measures?
1098
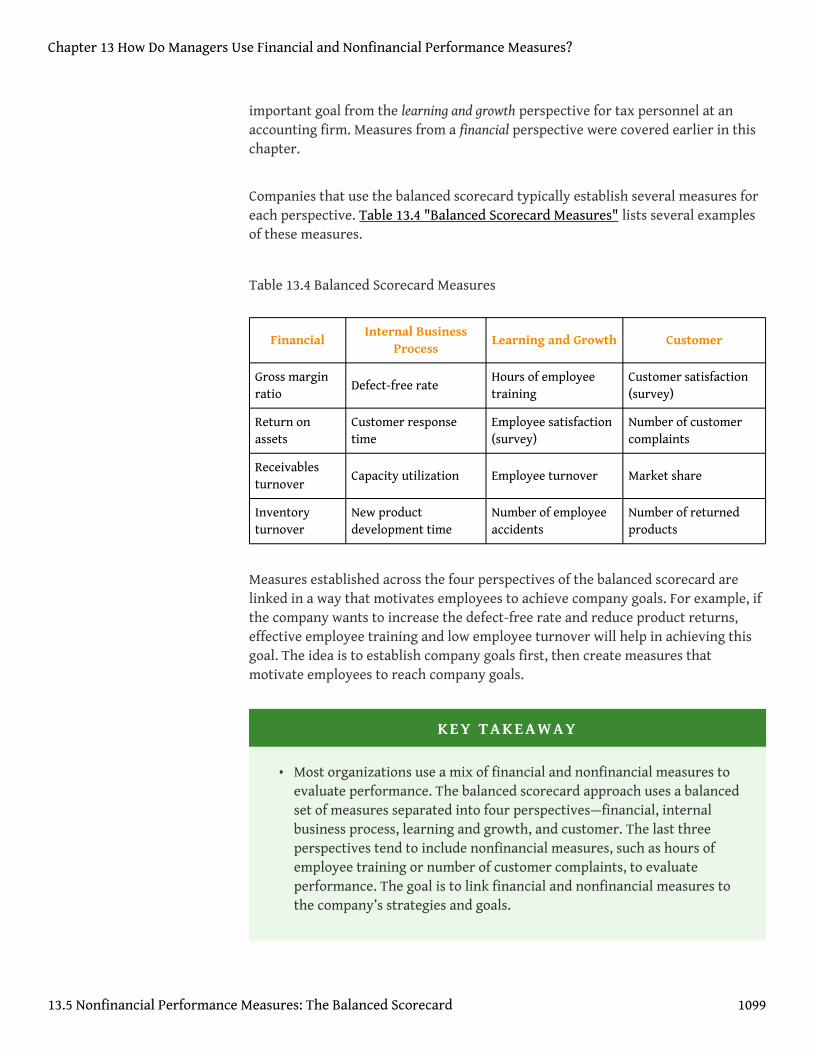
important goal from the learning and growth perspective for tax personnel at anaccounting firm. Measures from a financial perspective were covered earlier in thischapter.
Companies that use the balanced scorecard typically establish several measures foreach perspective. Table 13.4 "Balanced Scorecard Measures" lists several examplesof these measures.
Table 13.4 Balanced Scorecard Measures
FinancialInternal Business
ProcessLearning and Growth Customer
Gross marginratio
Defect-free rateHours of employeetraining
Customer satisfaction(survey)
Return onassets
Customer responsetime
Employee satisfaction(survey)
Number of customercomplaints
Receivablesturnover
Capacity utilization Employee turnover Market share
Inventoryturnover
New productdevelopment time
Number of employeeaccidents
Number of returnedproducts
Measures established across the four perspectives of the balanced scorecard arelinked in a way that motivates employees to achieve company goals. For example, ifthe company wants to increase the defect-free rate and reduce product returns,effective employee training and low employee turnover will help in achieving thisgoal. The idea is to establish company goals first, then create measures thatmotivate employees to reach company goals.
KEY TAKEAWAY
• Most organizations use a mix of financial and nonfinancial measures toevaluate performance. The balanced scorecard approach uses a balancedset of measures separated into four perspectives—financial, internalbusiness process, learning and growth, and customer. The last threeperspectives tend to include nonfinancial measures, such as hours ofemployee training or number of customer complaints, to evaluateperformance. The goal is to link financial and nonfinancial measures tothe company’s strategies and goals.
Chapter 13 How Do Managers Use Financial and Nonfinancial Performance Measures?
13.5 Nonfinancial Performance Measures: The Balanced Scorecard 1099

REVIEW PROBLEM 13 .7
Assume Chicken Deluxe, the fast-food restaurant franchise featured in thischapter, uses a balanced scorecard. Provide at least two examples ofmeasures that Chicken Deluxe might use for each of the followingperspectives of the balanced scorecard:
1. Financial2. Internal business process3. Learning and growth4. Customer
Solution to Review Problem 13.7
1. Answers will vary. Several examples of financial measures are asfollows:
1. Gross margin ratio2. Profit margin ratio3. Return on assets4. Receivables turnover5. Inventory turnover
2. Answers will vary. Several examples of internal business processmeasures are as follows:
1. Capacity utilization2. Amount of food spoilage3. Order response time
3. Answers will vary. Several examples of learning and growthmeasures are as follows:
1. Hours of employee training2. Employee satisfaction3. Employee turnover4. Number of employee accidents
4. Answers will vary. Several examples of customer perspectivemeasures are as follows:
Chapter 13 How Do Managers Use Financial and Nonfinancial Performance Measures?
13.5 Nonfinancial Performance Measures: The Balanced Scorecard 1100

1. Customer satisfaction2. Number of customer complaints3. Market share4. Amount of food returned
Chapter 13 How Do Managers Use Financial and Nonfinancial Performance Measures?
13.5 Nonfinancial Performance Measures: The Balanced Scorecard 1101

END-OF-CHAPTER EXERCISES
Questions
1. What is trend analysis? Explain how the percent change from one periodto the next is calculated.
2. What is common-size analysis? How is common-size analysisinformation used?
3. Explain the difference between trend analysis and common-sizeanalysis.
4. Name the ratios used to evaluate profitability. Explain what thestatement “evaluate profitability” means.
5. Coca-Cola’s return on assets was 19.4 percent, and return on commonshareholders’ equity was 41.7 percent. Briefly explain why these twopercentages are different.
6. Coca-Cola had earnings per share of $5.12, and PepsiCo had earningsper share of $3.97. Is it accurate to conclude PepsiCo was moreprofitable? Explain your reasoning.
7. Name the ratios used to evaluate short-term liquidity. Explain what thestatement “evaluate short-term liquidity” means.
8. Explain the difference between the current ratio and the quick ratio.9. Coca-Cola had an inventory turnover ratio of 5.07 times (every 71.99
days), and PepsiCo had an inventory turnover ratio of 8.87 times (every41.15 days). Which company had the best inventory turnover? Explainyour reasoning.
10. Name the ratios used to evaluate long-term solvency. Explain what theterm “long-term solvency” means.
11. Name the measures used to determine and evaluate the market value ofa company. Briefly describe the meaning of each measure.
12. What is the balanced scorecard? Briefly describe the four perspectives ofthe balanced scorecard.
Brief Exercises
13. Evaluating Suppliers at Chicken Deluxe. Refer to the dialogueat Chicken Deluxe presented at the beginning of the chapter andthe follow-up dialogue immediately following Note 13.58 "ReviewProblem 13.6".
Required:
Chapter 13 How Do Managers Use Financial and Nonfinancial Performance Measures?
13.5 Nonfinancial Performance Measures: The Balanced Scorecard 1102

a. What is the big decision that Chicken Deluxe is facing?b. Briefly describe the results of Dave’s analysis of the two
suppliers.
14. Trend Analysis. The following condensed income statement isfor Apple, Inc.
Required:
Prepare a trend analysis of the income statements from 2010 to2011. Use the format shown in Figure 13.1 "Income StatementTrend Analysis for " as a guide. (Round percent computations toone decimal place.)
15. Common-Size Analysis. Refer to the condensed incomestatement for Apple, Inc., in Brief Exercise 14.
Required:
Prepare a common-size analysis of the income statements for2010 and 2011. Use the format shown in Figure 13.5 "Common-Size Income Statement Analysis for " as a guide. (Round percentcomputations to one decimal place.)
16. Gross Margin and Profit Margin Ratios. Refer to thecondensed income statement for Apple, Inc., in Brief Exercise14.
Required:
Chapter 13 How Do Managers Use Financial and Nonfinancial Performance Measures?
13.5 Nonfinancial Performance Measures: The Balanced Scorecard 1103

Compute the following profitability ratios for 2011, and provide abrief explanation after each ratio (round computations to onedecimal place):
1. Gross margin ratio2. Profit margin ratio
17. Current and Quick Ratios. A condensed balance sheet forApple, Inc., appears in the following.
Required:
Compute the following short-term liquidity ratios for 2011, andprovide a brief explanation after each ratio (round computationsto two decimal places):
1. Current ratio2. Quick ratio
18. Long-Term Solvency Ratios. Refer to the condensed balancesheet for Apple, Inc., in Brief Exercise 17.
Required:
Chapter 13 How Do Managers Use Financial and Nonfinancial Performance Measures?
13.5 Nonfinancial Performance Measures: The Balanced Scorecard 1104

Compute the following long-term solvency ratios for 2011, andprovide a brief explanation after each ratio (round computationsto two decimal places):
1. Debt to assets2. Debt to equity
19. Market Capitalization. On September 24, 2011, Apple, Inc., had929,277,000 shares of common stock issued and outstanding, andthe market price per share on that date was $403.33.
Required:
Compute Apple’s market capitalization at September 24, 2011,and provide a brief explanation of what this measures represents(state the answer in billions).
20. Balanced Scorecard. Provide two nonfinancial measures likely used bydelivery companies like FedEx and UPS.
Exercises: Set A
21. Trend Analysis. The following condensed income statement isfor CarMax, Inc., a large retailer of used vehicles.
Required:
a. Prepare a trend analysis of the income statements from 2010to 2011. Use the format shown in Figure 13.1 "Income
Chapter 13 How Do Managers Use Financial and Nonfinancial Performance Measures?
13.5 Nonfinancial Performance Measures: The Balanced Scorecard 1105

Statement Trend Analysis for " as a guide. (Roundcomputations to one decimal place.)
b. What does the trend analysis prepared in requirement a tellyou about the company?
22. Common-Size Analysis. Refer to the condensed incomestatement for CarMax, Inc., in Exercise 21.
Required:
a. Prepare a common-size analysis of the income statements for2011 and 2010. Use the format shown in Figure 13.5"Common-Size Income Statement Analysis for " as a guide.(Round computations to one decimal place.)
b. What does the common-size analysis in requirement a tellyou about the company?
23. Profitability Ratios. Refer to the condensed income statementfor CarMax, Inc., in Exercise 21 and to the company’s balancesheet shown as follows.
Required:
Chapter 13 How Do Managers Use Financial and Nonfinancial Performance Measures?
13.5 Nonfinancial Performance Measures: The Balanced Scorecard 1106

Compute the following profitability ratios for 2011, and provide abrief explanation after each ratio (round percentagecomputations to one decimal place and earnings per share to twodecimal places):
1. Gross margin ratio2. Profit margin ratio3. Return on assets4. Return on common shareholders’ equity5. Earnings per share (assume weighted average shares
outstanding totaled 223,449,000 shares)
24. Short-Term Liquidity Ratios. Refer to the condensed incomestatement for CarMax, Inc., in Exercise 21 and to the company’sbalance sheet in Exercise 23.
Required:
Compute the following short-term liquidity ratios for 2011, andprovide a brief explanation after each ratio (round computationsto two decimal places):
1. Current ratio2. Quick ratio3. Receivables turnover ratio and average collection period
(assume all sales are on account)4. Inventory turnover ratio and average sale period
25. Long-Term Solvency Ratios. Refer to the condensed incomestatement for CarMax, Inc., in Exercise 21 and to the company’sbalance sheet in Exercise 23.
Required:
Compute the following long-term solvency ratios for 2011, andprovide a brief explanation after each ratio (round computationsto two decimal places):
1. Debt to assets2. Debt to equity3. Times interest earned
Chapter 13 How Do Managers Use Financial and Nonfinancial Performance Measures?
13.5 Nonfinancial Performance Measures: The Balanced Scorecard 1107

26. Market Valuation Measures. The following requirements arefor CarMax, Inc., as of February 28, 2011.
Required:
a. Compute the following market valuation measures for2011, and provide a brief explanation after eachmeasure (state market capitalization in billions, andround price-earnings ratio to two decimal places):
1. Market capitalization (assume 225,885,693 shareswere issued and outstanding at February 28, 2011,and the market price was $35.37 per share)
2. Price-earnings ratio (assume earnings per sharewas $1.71)
b. Refer to Note 13.54 "Business in Action 13.6" In whichcategory does CarMax belong? Explain.
27. Balanced Scorecard Customer Measures. Tech University hasmore than 10,000 students enrolling in courses each term. Themanagement would like to develop a balanced scorecard toassess performance.
Required:
Provide at least three customer measures Tech University canuse on its balanced scorecard. Assume students are thecustomers.
Exercises: Set B
28. Trend Analysis. The following condensed income statement isfor Colgate-Palmolive Company, a large retailer of personal andhome care products.
Chapter 13 How Do Managers Use Financial and Nonfinancial Performance Measures?
13.5 Nonfinancial Performance Measures: The Balanced Scorecard 1108
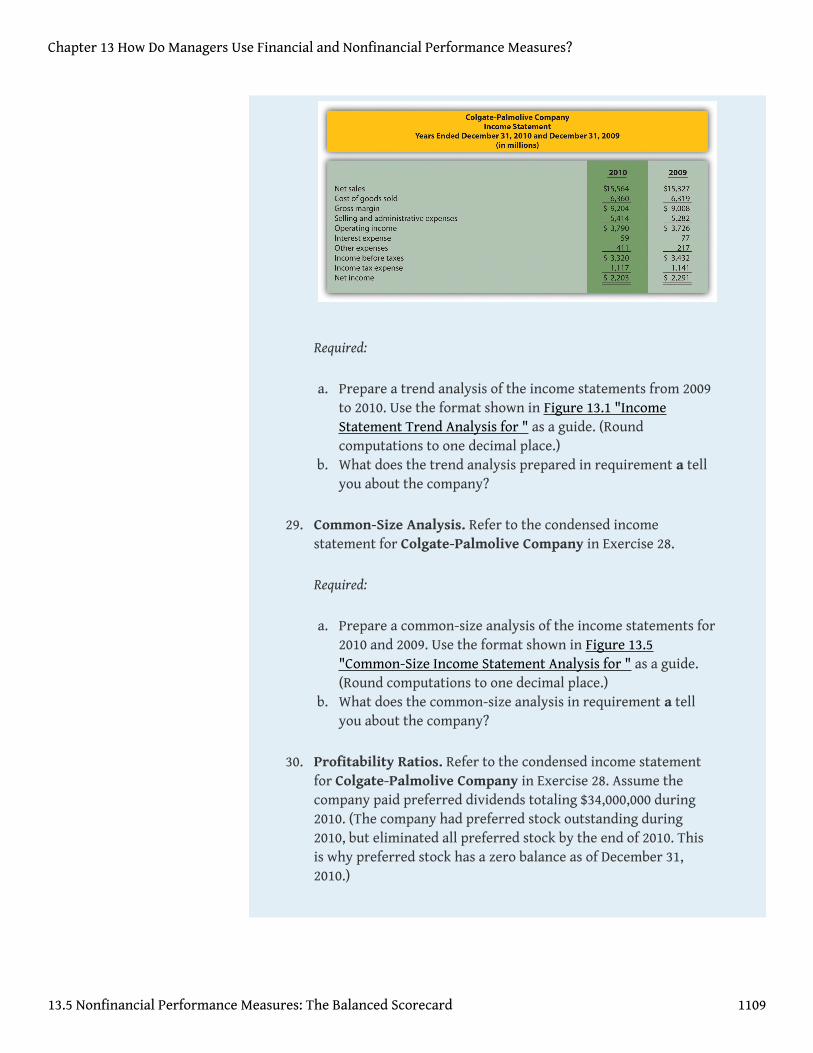
Required:
a. Prepare a trend analysis of the income statements from 2009to 2010. Use the format shown in Figure 13.1 "IncomeStatement Trend Analysis for " as a guide. (Roundcomputations to one decimal place.)
b. What does the trend analysis prepared in requirement a tellyou about the company?
29. Common-Size Analysis. Refer to the condensed incomestatement for Colgate-Palmolive Company in Exercise 28.
Required:
a. Prepare a common-size analysis of the income statements for2010 and 2009. Use the format shown in Figure 13.5"Common-Size Income Statement Analysis for " as a guide.(Round computations to one decimal place.)
b. What does the common-size analysis in requirement a tellyou about the company?
30. Profitability Ratios. Refer to the condensed income statementfor Colgate-Palmolive Company in Exercise 28. Assume thecompany paid preferred dividends totaling $34,000,000 during2010. (The company had preferred stock outstanding during2010, but eliminated all preferred stock by the end of 2010. Thisis why preferred stock has a zero balance as of December 31,2010.)
Chapter 13 How Do Managers Use Financial and Nonfinancial Performance Measures?
13.5 Nonfinancial Performance Measures: The Balanced Scorecard 1109

Required:
Compute the following profitability ratios for 2010, and provide abrief explanation after each ratio (round percentagecomputations to one decimal place and earnings per share to twodecimal places):
1. Gross margin ratio2. Profit margin ratio3. Return on assets4. Return on common shareholders’ equity5. Earnings per share (assume weighted average shares
outstanding totaled 487,800,000 shares)
31. Short-Term Liquidity Ratios. Refer to the condensed incomestatement for Colgate-Palmolive Company in Exercise 28 and tothe company’s balance sheet in Exercise 30.
Required:
Chapter 13 How Do Managers Use Financial and Nonfinancial Performance Measures?
13.5 Nonfinancial Performance Measures: The Balanced Scorecard 1110

Compute the following short-term liquidity ratios for 2010, andprovide a brief explanation after each ratio (round computationsto two decimal places):
1. Current ratio2. Quick ratio3. Receivables turnover ratio and average collection period
(assume all sales are on account)4. Inventory turnover ratio and average sale period
32. Long-Term Solvency Ratios. Refer to the condensed incomestatement for Colgate-Palmolive Company in Exercise 28 and tothe company’s balance sheet in Exercise 30.
Required:
Compute the following long-term solvency ratios for 2010, andprovide a brief explanation after each ratio (round computationsto two decimal places):
1. Debt to assets2. Debt to equity3. Times interest earned
33. Market Valuation Measures. The following requirements arefor Colgate-Palmolive Company as of December 31, 2010.
Required:
a. Compute the following market valuation measures for2010, and provide a brief explanation after eachmeasure (state market capitalization in billions, andround price-earnings ratio to two decimal places):
1. Market capitalization (assume 494,850,467 shareswere issued and outstanding at December 31,2010, and the market price was $77.74 per share)
2. Price-earnings ratio (assume earnings per sharewas $4.45)
Chapter 13 How Do Managers Use Financial and Nonfinancial Performance Measures?
13.5 Nonfinancial Performance Measures: The Balanced Scorecard 1111

b. Refer to Note 13.54 "Business in Action 13.6" In whichcategory does Colgate-Palmolive belong? Explain.
34. Balanced Scorecard Internal Business Process Measures.Tony’s Pizzeria serves pizzas at its restaurants and providesdelivery services to customers. The management would like todevelop a balanced scorecard to assess performance.
Required:
Provide at least three internal business process measures Tony’sPizzeria can use on its balanced scorecard.
Problems
35. Trend Analysis and Common-Size Analysis. The followingcondensed income statement and balance sheet are forNordstrom, Inc., a large retailer of apparel. (Note thatNordstrom’s 2010 fiscal year ends on January 29, 2011. This iscalled the 2010 fiscal year because only one month is in 2011, theother 11 months of the fiscal year are in 2010, and the companyhas chosen to refer to this as the 2010 fiscal year. This sameconcept applies to fiscal year 2009.)
Chapter 13 How Do Managers Use Financial and Nonfinancial Performance Measures?
13.5 Nonfinancial Performance Measures: The Balanced Scorecard 1112

Required:
a. Prepare a trend analysis of the income statements from 2009to 2010. Use the format shown in Figure 13.1 "IncomeStatement Trend Analysis for " as a guide. (Roundcomputations to one decimal place.)
b. Prepare a trend analysis of the balance sheets from 2009 to2010. Use the format shown in Figure 13.2 "Balance SheetTrend Analysis for " as a guide. (Round computations to onedecimal place.)
c. Identify all items that changed by more than 20 percent inthe trend analyses prepared in requirements a and b, andbriefly comment on the results.
d. Prepare a common-size analysis of the income statements for2010 and 2009. Use the format shown in Figure 13.5"Common-Size Income Statement Analysis for " as a guide.(Round computations to one decimal place.)
e. Prepare a common-size analysis of the balance sheets for2010 and 2009. Use the format shown in Figure 13.6"Common-Size Balance Sheet Analysis for " as a guide.(Round computations to one decimal place.)
f. What does the common-size analysis prepared inrequirements d and e tell you about the company?
Chapter 13 How Do Managers Use Financial and Nonfinancial Performance Measures?
13.5 Nonfinancial Performance Measures: The Balanced Scorecard 1113

36. Profitability and Short-Term Liquidity Ratios. Refer to theinformation presented in Problem 35 for Nordstrom.
Required:
a. Compute the following profitability ratios for 2010,and provide a brief explanation after each ratio(round percentage computations to one decimal placeand earnings per share to two decimal places):
1. Gross margin ratio2. Profit margin ratio3. Return on assets4. Return on common shareholders’ equity5. Earnings per share (weighted average shares
outstanding totaled 218,800,000 shares)
b. Compute the following short-term liquidity ratios for2010, and provide a brief explanation after each ratio(round computations to two decimal places):
1. Current ratio2. Quick ratio3. Receivables turnover ratio and average collection
period (assume all sales are on account)4. Inventory turnover ratio and average sale period
37. Long-Term Solvency Ratios and Market Valuation Measures.Refer to the information presented in Problem 35 forNordstrom.
Required:
a. Compute the following long-term solvency ratios for2010, and provide a brief explanation after each ratio(round computations to two decimal places):
1. Debt to assets
Chapter 13 How Do Managers Use Financial and Nonfinancial Performance Measures?
13.5 Nonfinancial Performance Measures: The Balanced Scorecard 1114

2. Debt to equity3. Times interest earned
b. Compute the following market valuation measures for2010, and provide a brief explanation after eachmeasure (state market capitalization in billions, andround price-earnings ratio to two decimal places):
1. Market capitalization (assume 218,000,000 shareswere issued and outstanding at January 29, 2011,and the market price was $40.08 per share)
2. Price-earnings ratio (assume the earnings pershare amount was $2.80)
38. Income Statement Trend, Common-Size, and ProfitabilityAnalysis. The following condensed income statement andbalance sheet are for Starbucks Corporation, a large retailer ofspecialty coffee with stores throughout the world.
Chapter 13 How Do Managers Use Financial and Nonfinancial Performance Measures?
13.5 Nonfinancial Performance Measures: The Balanced Scorecard 1115

Required:
a. Prepare a trend analysis of the income statements from 2010to 2011. Use the format shown in Figure 13.1 "IncomeStatement Trend Analysis for " as a guide. (Roundcomputations to one decimal place.)
b. Identify all items that changed by more than 20 percent inthe trend analysis prepared in requirement a, and brieflycomment on the results.
c. Prepare a common-size analysis of the income statements for2011 and 2010. Use the format shown in Figure 13.5"Common-Size Income Statement Analysis for " as a guide.(Round computations to one decimal place.)
d. What does the common-size analysis prepared inrequirement c tell you about the company?
e. Compute the following profitability ratios for 2011,and provide a brief explanation after each ratio(round percentage computations to one decimal placeand earnings per share to two decimal places):
1. Gross margin ratio
Chapter 13 How Do Managers Use Financial and Nonfinancial Performance Measures?
13.5 Nonfinancial Performance Measures: The Balanced Scorecard 1116

2. Profit margin ratio3. Return on assets4. Return on common shareholders’ equity5. Earnings per share (assume weighted average
shares outstanding totaled 748,300,000 shares)
39. Short-Term Liquidity, Long-Term Solvency, and MarketValuation. Refer to the information presented in Problem 38 forStarbucks.
Required:
a. Compute the following short-term liquidity ratios for2011, and provide a brief explanation after each ratio(round computations to two decimal places):
1. Current ratio2. Quick ratio3. Receivables turnover ratio and average collection
period (assume all sales are on account)4. Inventory turnover ratio and average sale period
b. Compute the following long-term solvency ratios for2011, and provide a brief explanation after each ratio(round computations to two decimal places):
1. Debt to assets2. Debt to equity3. Times interest earned
c. Compute the following market valuation measures for2011, and provide a brief explanation after eachmeasure (state market capitalization in billions, andround price-earnings ratio to two decimal places):
1. Market capitalization (assume 744,800,000 shareswere issued and outstanding at October 2, 2011,and the market price was $37.14 per share)
Chapter 13 How Do Managers Use Financial and Nonfinancial Performance Measures?
13.5 Nonfinancial Performance Measures: The Balanced Scorecard 1117

2. Price-earnings ratio (assume the earnings pershare amount was $1.66)
40. Balance Sheet Trend and Common-Size Analysis. Thefollowing condensed income statement and balance sheet are forWal-Mart Stores, Inc. (note that Wal-Mart’s 2010 fiscal yearends on January 31, 2011. This is called the 2010 fiscal yearbecause only one month is in 2011, the other 11 months of thefiscal year are in 2010, and the company has chosen to refer tothis as the 2010 fiscal year. This same concept applies to fiscalyear 2009.)
Chapter 13 How Do Managers Use Financial and Nonfinancial Performance Measures?
13.5 Nonfinancial Performance Measures: The Balanced Scorecard 1118

Required:
a. Prepare a trend analysis of the balance sheets from 2009 to2010. Use the format shown in Figure 13.2 "Balance SheetTrend Analysis for " as a guide. (Round computations to onedecimal place.)
b. Prepare a common-size analysis of the balance sheets for2010 and 2009. Use the format shown in Figure 13.6"Common-Size Balance Sheet Analysis for " as a guide.(Round computations to one decimal place.)
c. What does the balance sheet common-size analysis preparedin requirement b tell you about the company?
41. Income Statement Trend and Common-Size Analysis;Profitability Ratios. Refer to the information presented inProblem 40 for Wal-Mart.
Required:
a. Prepare a trend analysis of the income statements from 2009to 2010. Use the format shown in Figure 13.1 "IncomeStatement Trend Analysis for " as a guide. (Roundcomputations to one decimal place.)
Chapter 13 How Do Managers Use Financial and Nonfinancial Performance Measures?
13.5 Nonfinancial Performance Measures: The Balanced Scorecard 1119

b. Based on the income statement trend analysis prepared inrequirement a, describe what caused the increase inoperating income from 2009 to 2010.
c. Prepare a common-size analysis of the income statements for2010 and 2009. Use the format shown in Figure 13.5"Common-Size Income Statement Analysis for " as a guide.(Round computations to one decimal place.)
d. What does the income statement common-size analysisprepared in requirement c tell you about the company?
e. Compute the following profitability ratios for 2010,and provide a brief explanation after each ratio(round percentage computations to one decimal placeand earnings per share to two decimal places):
1. Gross margin ratio2. Profit margin ratio3. Return on assets4. Return on common shareholders’ equity5. Earnings per share (assume weighted average
shares outstanding totaled 3,656,000,000 shares)
42. Short-Term Liquidity, Long-Term Solvency, MarketValuation, and Balanced Scorecard. Refer to the informationpresented in Problem 40 for Wal-Mart.
Required:
a. Compute the following short-term liquidity ratios for2010, and provide a brief explanation after each ratio(round computations to two decimal places):
1. Current ratio2. Quick ratio3. Receivables turnover ratio and average collection
period (assume all sales are on account)4. Inventory turnover ratio and average sale period
Chapter 13 How Do Managers Use Financial and Nonfinancial Performance Measures?
13.5 Nonfinancial Performance Measures: The Balanced Scorecard 1120

b. Compute the following long-term solvency ratios for2010, and provide a brief explanation after each ratio(round computations to two decimal places):
1. Debt to assets2. Debt to equity3. Times interest earned
c. Compute the following market valuation measures for2010, and provide a brief explanation after eachmeasure (state market capitalization in billions, andround price-earnings ratio to two decimal places):
1. Market capitalization (assume 3,516,000,000shares were issued and outstanding at January 31,2011, and the market price was $54.58 per share)
2. Price-earnings ratio (assume the earnings pershare amount was $4.48)
d. Assume Wal-Mart uses a balanced scorecard to assessperformance. Provide at least two learning and growthmeasures the company can use on its balanced scorecard.
One Step Further: Skill-Building Cases
43. Trend Information in Annual Reports. Refer to Note 13.9 "Business inAction 13.1" Why is trend information important to shareholders?
44. Earnings per Share. Refer to Note 13.28 "Business in Action 13.3" WasAnnTaylor Stores’ earnings per share higher or lower than analystsexpected? Explain whether you would expect the company’s stock priceto increase or decrease as a result of the press release.
45. Inventory Turnover in the Computer Industry. Refer to Note 13.42"Business in Action 13.4" Why do you think inventory turnover for thecomputer hardware industry is so quick?
46. Financial Leverage in the Auto Industry. Refer to Note 13.48 "Businessin Action 13.5" Why do most investors consider GM to be highlyleveraged?
47. Market Capitalization Categories. Refer to Note 13.54 "Business inAction 13.6" Define what is meant by small-cap, midcap, and large-cap.In which category does Coca-Cola belong? Explain.
Chapter 13 How Do Managers Use Financial and Nonfinancial Performance Measures?
13.5 Nonfinancial Performance Measures: The Balanced Scorecard 1121

48. Internet Project: Financial Statement Analysis. Using theInternet, find the most recent annual report (or form 10K) for amanufacturing or retail company of your choice. Most companieshave links to the information at their Web sites under titles, suchas investor relations or financial reports. Print the income statementand balance sheet for the company selected and include thesedocuments with your response to the following requirements.
Required:
a. Compute the following profitability ratios for themost current year, and provide a brief explanationafter each ratio (round percentage computations toone decimal place):
1. Gross margin ratio2. Profit margin ratio3. Return on assets4. Return on common shareholders’ equity
b. Compute the following short-term liquidity ratios forthe most current year, and provide a briefexplanation after each ratio (round computations totwo decimal places):
1. Current ratio2. Quick ratio3. Receivables turnover ratio and average collection
period (assume all sales are on account)4. Inventory turnover ratio and average sale period
c. Compute the following long-term solvency ratios forthe most current year, and provide a briefexplanation after each ratio (round computations totwo decimal places):
1. Debt to assets2. Debt to equity
Chapter 13 How Do Managers Use Financial and Nonfinancial Performance Measures?
13.5 Nonfinancial Performance Measures: The Balanced Scorecard 1122

d. Provide a one-page written report summarizing your resultsin requirements a, b, and c. Identify any areas of concern aswell as areas of strength for the company.
49. Group Activity: Analyzing Lowe’s Companies, Inc. Thecondensed income statement and balance sheet informationprovided as follows is for Lowe’s Companies, Inc., a large retailcompany that sells building materials and supplies. Lowe’s had1,354,000,000 shares issued and outstanding at January 28, 2011,and the market price per share on that date was $24.83. (Notethat Lowe’s 2010 fiscal year ends on January 28, 2011. This iscalled the 2010 fiscal year because only one month is in 2011, theother 11 months of the fiscal year are in 2010, and the companyhas chosen to refer to this as the 2010 fiscal year. This sameconcept applies to fiscal year 2009.)
Chapter 13 How Do Managers Use Financial and Nonfinancial Performance Measures?
13.5 Nonfinancial Performance Measures: The Balanced Scorecard 1123

Form groups of two to four students. Each group is to be assignedone of the following three categories of financial measures:
1. Profitability measures
1. Gross margin ratio2. Profit margin ratio3. Return on assets4. Return on common shareholders’ equity
2. Short-term liquidity measures
1. Current ratio2. Quick ratio3. Inventory turnover ratio and average sales period
3. Long-term solvency and market valuation measures
1. Debt to assets2. Debt to equity3. Market capitalization
Chapter 13 How Do Managers Use Financial and Nonfinancial Performance Measures?
13.5 Nonfinancial Performance Measures: The Balanced Scorecard 1124
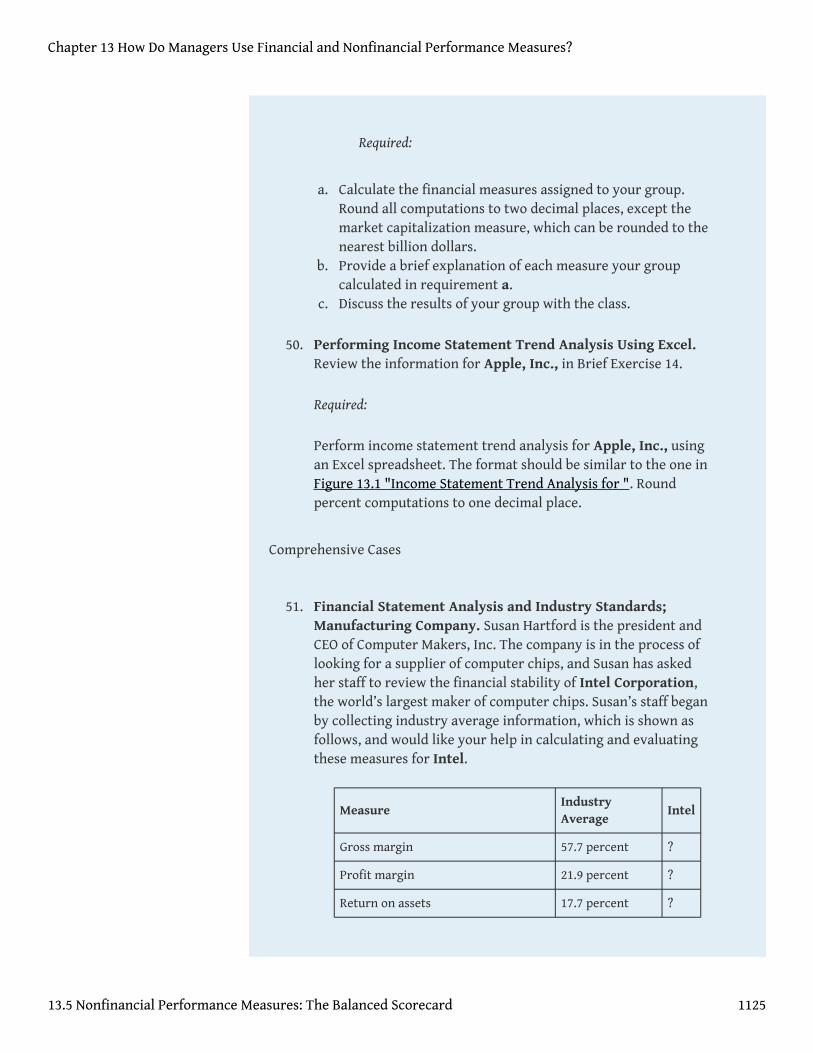
Required:
a. Calculate the financial measures assigned to your group.Round all computations to two decimal places, except themarket capitalization measure, which can be rounded to thenearest billion dollars.
b. Provide a brief explanation of each measure your groupcalculated in requirement a.
c. Discuss the results of your group with the class.
50. Performing Income Statement Trend Analysis Using Excel.Review the information for Apple, Inc., in Brief Exercise 14.
Required:
Perform income statement trend analysis for Apple, Inc., usingan Excel spreadsheet. The format should be similar to the one inFigure 13.1 "Income Statement Trend Analysis for ". Roundpercent computations to one decimal place.
Comprehensive Cases
51. Financial Statement Analysis and Industry Standards;Manufacturing Company. Susan Hartford is the president andCEO of Computer Makers, Inc. The company is in the process oflooking for a supplier of computer chips, and Susan has askedher staff to review the financial stability of Intel Corporation,the world’s largest maker of computer chips. Susan’s staff beganby collecting industry average information, which is shown asfollows, and would like your help in calculating and evaluatingthese measures for Intel.
MeasureIndustryAverage
Intel
Gross margin 57.7 percent ?
Profit margin 21.9 percent ?
Return on assets 17.7 percent ?
Chapter 13 How Do Managers Use Financial and Nonfinancial Performance Measures?
13.5 Nonfinancial Performance Measures: The Balanced Scorecard 1125

Return on common shareholders’equity
21.5 percent ?
Current ratio 2.3 to 1 ?
Quick ratio 1.9 to 1 ?
Receivables turnover 12.8 times ?
Inventory turnover 4.8 times ?
Debt to assets 0.21 to 1 ?
Debt to equity 0.26 to 1 ?
Market capitalization $80,000,000,000 ?
Intel’s income statement and balance sheet are provided asfollows. The price for 1 share of common stock at December 25,2010, the end of Intel’s fiscal year, was $20.13. The number ofshares issued and outstanding at December 25, 2010, totaled5,581,000,000. Assume all sales were on account.
Chapter 13 How Do Managers Use Financial and Nonfinancial Performance Measures?
13.5 Nonfinancial Performance Measures: The Balanced Scorecard 1126

Required:
a. Using the industry average measures provided, compute thesame measures for Intel for its fiscal year ended December25, 2010. (State your results in the same format used forindustry averages.)
b. Summarize your results in requirement a bycompleting a table using the following headings:
Measure Industry Average Intel Corporation
Immediately following each measure, indicatewhether Intel’s financial condition is better or worsethan the industry average.
c. Using your answers to requirements a and b to support yourposition, determine whether Intel is financially stable.
52. Ethics: Manipulating Data to Meet Loan Requirements.Custom Tech, Inc., designs and produces computers for a variety
Chapter 13 How Do Managers Use Financial and Nonfinancial Performance Measures?
13.5 Nonfinancial Performance Measures: The Balanced Scorecard 1127

of customers. The company has encountered a cash shortageresulting from collection problems with several customers. IfCustom Tech is unable to collect a significant portion of itsreceivables relatively soon, the company will not be able to paysuppliers and employees next quarter. As a result, Custom Tech’spresident, Don Lardner, began discussions with a local bankabout obtaining a short-term loan. Don did not mention thecause of the cash flow shortage other than to say, “This happensthe same time every year due to the cyclical nature of ourbusiness.”
In a meeting with the bank’s loan officer, Jan Johnson, Don wastold the loan should not be a problem as long as Custom Techmaintains a profit margin ratio above 10 percent, quick ratioabove 1.0 to 1, and debt to equity ratio below 1.4 to 1. Donindicated this was in line with his company’s performance andagreed to provide financial statements for the most recent yearat their next meeting.
The financial statements shown as follows are for Custom Tech’smost recent year ended December 31. This information has notyet been provided to the bank.
Chapter 13 How Do Managers Use Financial and Nonfinancial Performance Measures?
13.5 Nonfinancial Performance Measures: The Balanced Scorecard 1128

Required:
a. Calculate the ratios required by the bank and determinewhether Custom Tech will qualify for the loan.
b. Assume you are the CFO for Custom Tech. Don Lardner asksyou to reclassify $30,000 in current liabilities to commonstock. Don states, “We owe it to our shareholders andemployees to do whatever it takes to get this loan! Withoutit, we may have to file for bankruptcy and let our employeesgo. Once we get this loan and collect our outstandingreceivables we’ll be in good shape.” Prepare a revisedbalance sheet after making the $30,000 reclassification,recalculate the ratios required by the bank, and determinewhether Custom Tech will qualify for the loan with therevised numbers.
c. Are the president’s actions ethical? If you were the CFO, howwould you handle the president’s request? (To answer thesequestions, you may want to review the presentation of ethicsin Chapter 1 "What Is Managerial Accounting?".)
Chapter 13 How Do Managers Use Financial and Nonfinancial Performance Measures?
13.5 Nonfinancial Performance Measures: The Balanced Scorecard 1129