using nonfinancial measures to assess fraud riskjfbrazel/myteaching/advanced... · using...
TRANSCRIPT

Using Nonfinancial Measures to Assess Fraud Risk
Joseph F. Brazel North Carolina State University
Department of Accounting College of Management
Campus Box 8113 Nelson Hall
Raleigh, NC 27695 919-513-1772
Keith Jones George Mason University Department of Accounting Enterprise Hall, MSN 5F4 Fairfax, VA 22030-4444
703-993-4819 [email protected]
Mark F. Zimbelman
Brigham Young University School of Accountancy
540 Tanner Building Provo, UT 84602
801-422-1227 [email protected]
June 2007

Using Nonfinancial Measures to Assess Fraud Risk
ABSTRACT
For several decades, the audit profession has attempted to find efficient and effective methods of
improving auditors’ fraud risk assessments so as to enhance audit quality and reduce auditor
liability. This study examines whether auditors can effectively use nonfinancial measures to
assess the reasonableness of financial performance and, thereby, help detect financial statement
fraud (hereafter, fraud). If auditors or other interested parties (e.g., directors, lenders, investors or
regulators) can identify nonfinancial measures (e.g., facilities growth) that are correlated with
financial measures (e.g., revenue growth), inconsistent patterns between the nonfinancial and
financial measures can be used to detect firms with high fraud risk. We find that the difference
between nonfinancial measures and financial performance is significantly greater for fraud firms
than for their non-fraud competitors. We also find that this difference is a significant fraud
indicator when included in a model containing variables that have previously been linked to the
likelihood of fraud. Overall, our results provide empirical evidence suggesting that nonfinancial
measures can be effectively used to assess the likelihood of fraud.
Keywords: analytical procedures; earnings management; fraud; nonfinancial measures
Data Availability: Data are available from public sources.

1
I. INTRODUCTION During former HealthSouth CEO Richard Scrushy’s trial, federal prosecutors argued that
Scrushy must have known something was amiss with HealthSouth’s financial statements since
there was a discrepancy between the company’s financial and non-financial performance. The
prosecutor noted that twice during the seven-year fraud, revenues and assets increased even
though the number of HealthSouth facilities decreased. “And that’s not a red flag to you?” asked
prosecutor Colleen Conry during the trial (WSJ 2005). Conry’s question implied the following:
Because HealthSouth’s financial statement data was inconsistent with its nonfinancial measures
the risk of financial statement fraud (hereafter, fraud) at HealthSouth was obviously high. The
defense witness responded that the inconsistency was not apparent at the time and—
importantly—HealthSouth’s external auditors also failed to take note of the inconsistency
between the firm’s financial and nonfinancial measures.
This paper investigates whether publicly available nonfinancial measures (NFMs) can be
used to assess the likelihood of fraud. Many individuals, including external and internal auditors,
boards of directors, investors, creditors and regulators, have incentives for detecting fraud. While
we focus our discussion largely on external auditors—who are charged with the responsibility to
detect material fraud in SAS No. 99 (AICPA 2002)—our discussion could easily be adapted to
these other parties as well.
Audit standards (e.g., AICPA 1988 and 2002) require that external auditors perform
analytical procedures (such as ratio analysis) and consider the results when assessing fraud risk.
Although audit guidance recognizes that NFMs may be valuable for assessing fraud risk (see
Bell et al. 2005, 29; Messier et al. 2006, 188; AICPA 2002) auditors are not required to consider
NFMs. The Public Company Accounting Oversight Board (PCAOB) is considering whether
2
auditors should be required to use NFMs to help detect fraud (PCAOB 2004; Hogan et al. 2006).
They concluded that analytical procedures using only financial data are unlikely to be effective
in detecting fraud because management can easily make fictitious entries to financial data to
create an expected pattern (PCAOB 2004). Our study provides empirical evidence regarding the
potential effectiveness of requiring auditors to use NFMs when assessing fraud risk.
Academic research suggests that auditors find it difficult to detect fraud with analytical
procedures for at least three reasons. First, auditors may not recognize unusual trends and ratios
within the financial statements because they lack a sufficient understanding of their client’s
business (Erickson et al. 2000). Second, auditors tend to rely on management explanations
without adequately testing the validity of their explanations (Anderson and Koonce 1995; Hirst
and Koonce 1996; Bierstaker et al. 1999). Third, archival research has found that traditional
analytical procedures using financial statement data lead to high rates of misclassification and,
therefore, yield limited success in identifying fraud (Beneish 1999; Kaminski and Wetzel 2004;
Hogan et al. 2006). If NFMs can be used to detect fraud, requiring auditors to use NFMs could
help address these challenges. For example, NFMs could be used to help auditors understand a
client’s business by pointing them to the drivers of economic performance (Ittner and Larcker
1998). Similarly, assuming NFMs exist that are easily verified and less likely to be manipulated
by management (Bell et al. 2005), using them may provide an avenue for auditors to both
generate reliable expectations for their analytical procedures and to test the validity of
management’s explanations to their inquiries.
This study provides two major contributions to extant accounting research. The first
involves building on existing archival auditing research on detecting fraud. Although there is a
vast amount of such research that looks at numerous variables (see Nieschweitz et al. 2000), no

3
prior study has examined the potential for NFMs to help distinguish fraud firms from non-fraud
firms. Prior archival research on detecting fraud has provided evidence of a link between fraud
and financial statement variables (Dechow et al. 1996; Beneish 1997; Summers and Sweeney
1998; Lee et al. 1999), corporate governance variables (Beasley 1996; Dechow et al. 1996;
Abbott et al. 2000; Beasley et al. 2000; Farber 2005), suspicious accounting (Marquardt and
Wiedman 2004; McVay 2006) and other fraud indicators such as weak internal controls (Bell
and Carcello 2000). Importantly, we add to this literature by exploring whether a new dimension
of variables—namely, NFMs—can add discriminatory power to the state-of-the-art fraud
prediction models developed from this prior research. Thus, this study is the first to explore the
ability of NFMs to help detect fraud.
The second contribution of this paper is that it builds on prior research that explores the
relevance of NFMs for measuring firm performance (e.g., Amir and Lev 1996; Kaplan and
Norton 1996; Ittner and Larcker 1998). This study extends this literature by empirically testing
whether NFMs can be used to detect a discrepancy between fraud firms’ reported financial
performance and their actual economic performance. If NFMs are correlated with the underlying
economic performance of a firm (as is argued in the NFM literature) then fraud firms will exhibit
inconsistencies between their NFMs and their reported financial results that will not exist for
non-fraud firms. Assuming that some NFMs are correlated with financial results (e.g., growth in
retail outlets and growth in revenue) and fraud firms fail to manipulate their NFMs, fraud firms
should be more likely than non-fraud firms to report financial results that are inconsistent with
their NFMs (Bell et al. 2005). Importantly, our approach is to examine the use of NFMs as a
verification of current financial results whereas the body of research exploring the use of NFMs
often looks at the ability of NFMs to predict future firm performance. We believe both uses of

4
NFMs are potentially valuable—one as a confirmation of the current financial reporting and the
other as valuable information for forecasting future performance. Thus, this paper expands the
literature on the use of NFMs for supplementing financial reporting by exploring the ability of
NFMs to validate reported financial results.
Our results provide evidence that the relationship between reported financial performance
and NFMs can discriminate fraud from non-fraud firms. Using a matched-pair sample of fraud
firms and non-fraud competitors, we show that fraud firms are more likely than non-fraud firms
to report inconsistent revenue growth relative to their growth in NFMs. We show this result
holds under different analyses that compare revenue growth with different measures of NFMs
which should be positively correlated with revenue. We analyze this result from the year prior to
the initial fraud year to the first year of the fraud for each matched-pair. When including the
difference between a firm’s financial measures and its NFMs in a model including factors that
have been found to be indicative of fraud, we find the difference to be a significant discriminator
between fraud and non-fraud firms. Thus, we provide evidence showing that comparisons
between financial measures and NFMs can be effectively used to assess fraud risk.
This paper is organized as follows. Section II develops our hypotheses. Section III
explains our sample selection and research method. Section IV provides the results. Section V
concludes the paper.
II. DEVELOPMENT OF HYPOTHESES
Prior Research The use of NFMs in evaluating firm performance has garnered much attention since
Kaplan and Norton (1996) published the “The Balanced Scorecard.” Proponents of using NFMs
claim they are not subject to the limitations of traditional financial measures (i.e., short-term
5
focus, emphasis on narrow groups of stakeholders, and limited guidance for future actions; see
Langfield-Smith 2003). In auditing, SAS No. 56 (AICPA 1988) suggests that auditors may want
to consider NFMs when determining the reasonableness of their clients’ financial statements.
The effectiveness of using NFMs to help assess fraud risk is dependent on whether NFMs
are correlated with current financial performance. Thus, if NFMs are correlated with current
financial performance and auditors can detect fluctuations in NFMs that appear unusual given
reported financial performance, NFMs may help auditors and others assess fraud risk. While
several prior studies investigate the use of NFMs in compensation plans (e.g., Banker et al. 2000;
Said et al. 2003), little published research has investigated the relationship between financial
measures and NFMs (Ittner and Larcker 1998). Amir and Lev (1996) and Riley et al. (2003)
studied the cell-phone and airline industries, respectively, and conclude that the value-relevance
of nonfinancial information overwhelms that of traditional, financial statement variables for
investors. The former study also stresses the importance of significantly expanding the use of
nonfinancial information in both practice and research. Ittner and Larcker (1998) find one form
of NFM, customer satisfaction, is significantly related to future accounting performance and
partially reflected in current accounting book values. Two studies investigate the relationship
between NFMs and financial statement data in the airline industry. Liedtka (2002) employs
factor analyses that suggest that the growing reliance on NFMs is justified. Specifically, this
study shows that the nineteen NFMs disclosed by the airline industry represent seven constructs
not measured by eighteen common financial measures. Behn and Riley (1999) find that NFMs
are useful in predicting quarterly revenue, expense, and net income numbers. Lastly, in the retail
industry, Lundholm and McVay (2006) find that growth in retail outlets and same store sales
data can be modeled to provide sales forecasts that are as accurate as IBES analysts’ forecasts.
6
Consistent with this research, audit guidance suggests that NFMs such as production capacity
should be correlated with revenue reported on the income statement (AICPA 2002).
In addition to the research noted above, anecdotal evidence suggests that considering
NFMs in conjunction with financial results should help auditors identify fraudulent financial
statements. For example, Delphi Corporation appears to have boosted net income through sham
sales of assets during a period when Delphi and its competitors were laying off workers and
experiencing production cuts (Lundegaard 2005). Similar to the HealthSouth prosecutor’s
comments noted previously, it appears that Delphi’s auditors might have detected this fraud if
they had noted the inconsistency between the firm’s reported performance and its NFMs. In
addition, both short-sellers and fraud examiners appear to consider NFMs when evaluating the
reasonableness of sales growth that exceeds expectations (Eisinger 2005).
Interestingly, internal and external stakeholders are pressuring businesses to report more
NFMs (Ballou et al. 2006; Holder-Webb et al. 2007). As businesses respond to the pressure to
report more NFMs, it will likely become more difficult to conceal inconsistencies between
financial performance and NFMs. We explore whether fraud firms’ financial results are
inconsistent with publicly available NFMs such that the financial results suggest significantly
stronger performance than the NFMs. For example, a retail store operation that is shrinking in
the number of outlets is not likely to achieve above average revenue growth. Thus, such an
inconsistency suggests a higher likelihood of fraud.
The PCAOB has recognized the potential for NFMs to be a powerful, independent
benchmark for evaluating the validity of financial statement data and have recently endorsed
their usage to improve fraud detection (PCAOB 2007). One reason that NFMs may be a good
benchmark for testing the validity of financial reports is that misstated NFMs may be difficult to

7
conceal. Several characteristics of NFMs make them either less vulnerable to manipulation
and/or are more easily verified than financial data (Bell et al. 2005, 28). First, while financial
controls can be overridden by management and financial statements are produced internally,
NFMs are often produced and reported by independent sources (e.g., customer satisfaction
ratings produced by J.D. Power and Associates). Second, when management reports an NFM it is
often easily verified by an auditor (e.g., number of acquisitions, production facilities or
employees) whereas many financial results can be difficult to verify (e.g., the estimation of the
allowance for doubtful accounts). Third, if management attempts to manipulate their NFMs to
conceal a fraud they will need to expand the perpetrator pool in order to conceal the misstated
NFM. Thus, a fraud involving both misstated financial data and NFMs will require a greater
degree of collusion to conceal from interested parties such as the auditor. For example, if a firm
wants to overstate sales and feels the need to report an increase in the number of employees to
support the overstatement, they will need to involve human resources and payroll personnel to
ensure that the misstated NFM is concealed. Further, concealing this fraud may also require
paying wages and related taxes for employees that do not exist.
In sum, we expect NFMs to be more difficult for management to manipulate than
financial statement data because NFMs are often reported by independent parties, are often easily
verified, and concealing misstated NFMs will require greater amounts of collusion than
concealing a financial misstatement. In any case, if fraud firms do not manipulate their NFMs in
a manner that is consistent with their financial performance and if NFMs can be identified that
are normally positively correlated with financial performance, then unexpected differences
between NFMs and financial performance should help discriminate fraud from non-fraud firms.1
1 The possibility that NFMs are manipulated by management would bias against us finding significant results. Thus, we indirectly test the assertion that it is difficult for management to conceal misstated NFMs. Also, it should be

8
It is important to note that the purpose of our study is not to provide auditors or other
interested parties with a specific model or variable that can be used to detect fraud. Instead, our
purpose is to empirically test whether a relationship exists between NFMs and fraud such that
auditors could design such models to assess fraud risk. Such evidence would support claims by
auditing regulators (AICPA 2002) and educators (see Messier et al. 2006, 188) that NFMs
provide valuable incremental information for assessing fraud risk. We assume that because
auditors have access to a larger pool of firm-specific data than what is publicly available,
empirical tests using publicly available NFM data will be no more (and probably less) likely to
detect fraud than the pool of NFM data available to auditors and many other interested parties
(e.g., directors). Thus, tests using publicly available data that suggest NFMs can detect fraud will
provide strong evidence that auditors could effectively use NFMs to detect fraud. Potential
reasons why auditors may not currently search for and use NFMs include budgetary pressures,
over-reliance on prior year workpapers that do not include analyses of NFMs, and a hesitancy
among auditors to adjust the nature of their fraud testing (cf., Wright 1988; Zimbelman 1997;
Houston 1999; Glover et al. 2003; Brazel et al. 2004). Thus, our tests may be used by
policymakers to determine whether benefits to the profession would accrue if auditors were
required to use NFM data when assessing fraud risk. Several anecdotal examples suggest such
benefits would accrue.
Examples
We provide two examples of fraud firms where their NFMs suggested fraud was
occurring. Del Global Technologies makes electronic components, assemblies, and systems for
medical, industrial, and defense uses. The Securities and Exchange Commission alleges that in
noted that management may provide false explanations for changes in NFMs that would explain an inconsistency such as an increased use of outsourcing which led to fewer employees while sales increased. Auditors are required to corroborate such explanations with additional evidence when performing analytical procedures (AICPA 1988).

9
fiscal years 1997-2000 Del Global Technologies Corp. (Del) engaged in improper revenue
recognition when it held open quarters, prematurely shipped products to third-party warehouses,
and recorded sales on products that Del had not yet manufactured (SEC 2004a). Del overstated
pretax income in 1997 by at least $3.7 million or 110%. Del’s revenue increased 25 percent from
$43.7 million in 1996 to $54.7 million in 1997. However, Del reported a decrease in the total
number of employees over the same period. Employees decreased from 440 in 1996 to 412 in
1997. We believe that while a company could increase profits by cutting payroll, it is improbable
that the company would double in profitability while laying-off employees and even less
probable that employee layoffs would correspond with a significant increase in revenue. In
addition, Del’s total number of distributors also decreased from 400 to 250 from 1996 to 1997. A
decrease in distributors would also seem unlikely to correspond with a significant increase in
revenue. This case illustrates how an unusual relationship between NFMs (i.e., total number of
employees and of distribution dealers) and financial data (i.e., revenue) could help an auditor
assess fraud risk. In contrast, one of Del Global’s competitors, Fischer Imaging Corp., realized a
27 percent decrease in revenue over the same period accompanied by a 20 percent decrease in
employees and a seven percent decrease in distributors.
Anicom, Inc. represents another case of unusual trends among NFMs and financial data.
Prior to filing for bankruptcy in 2001, the company was a leading distributor of industrial and
multimedia wire, cable, and fiber-optic products. The SEC alleges that from January 1, 1998
through March 30, 2000, Anicom’s management perpetrated a massive fraud in which it falsely
reported millions of dollars of non-existent sales and used other fraudulent techniques to inflate
net income by more than $20 million (SEC 2004b). During the first year of the fraud, 1998,
Anicom reported a substantial increase in employees (46 percent) and in the number of facilities

10
(55 percent). However, the company’s revenue growth was 93 percent over the same period.
Anicom’s revenue increased from $244 million in 1997 to $470 million in 1998. Anicom’s
growth in NFMs (i.e., employees and facilities), while robust, did not keep pace with its
enormous revenue growth. In contrast, one of Anicom’s closest competitors, Graybar Electric
Company, Inc., reported more modest sales growth (11 percent) from 1997 to 1998. Graybar’s
growth in NFMs was consistent with its revenue growth: total employees increased 10 percent
and total number of facilities increased three percent.2 While we recognize that factors other than
fraud could cause unusual relationships between NFMs and financial data, we argue that firms
that are committing fraud are more likely to exhibit these relationships.
Hypotheses
One general challenge in studying fraud is a shortage of data; this study is no exception.
Levitt and Dubner (2005) posit that one reason academics know very little about the
practicalities of fraud is the paucity of good data. Ideally, a study of NFMs would focus on
common nonfinancial measures, which are industry specific. Compiling a reasonable database of
fraud firms in one industry is problematic because publicized fraud cases are rare. To overcome
this limitation, we construct a measure that is consistent across firms in different industries with
different NFMs. We do so by using NFMs with an expected positive correlation with revenue
and determining whether inconsistencies between revenue growth and NFM growth discriminate
between fraud and non-fraud firms.3 For example, we selected the number of retail outlet stores
as an NFM for a firm in the retail industry. Then, we examine the difference between an 2 Both examples (Del Global and Fischer Imaging; and Anicom and Graybar Electric) came from data in our sample. 3 With respect to our sample, we focus on revenue frauds, revenue as a financial performance measure, and NFMs that should be correlated with revenues. We concentrate our analyses on revenues due to the concentration of frauds and restatements related to improper revenue recognition. SAS No. 99 explicitly advises auditors that revenue recognition should be considered a high fraud risk area and, consequently, auditors should compare recorded revenue amounts with relevant NFMs. In addition, any future PCAOB guidance on fraud is likely to contain required procedures related to revenue recognition (e.g., Beasley et al. 1999; AICPA 2002; PCAOB 2004; Gullapalli 2005).

11
identified fraud firm’s percentage change in revenue and percentage change in retail outlets from
the year prior to the fraud to the year of the fraud. We then compare this difference with that of
an industry competitor with the expectation that the difference between revenue growth and the
growth in the NFM will be larger for fraud firms than for their non-fraud competitors. Thus, we
test the following hypothesis:
H1: Fraud firms will have greater differences between their percent change in revenue growth and percent change in NFMs than their non-fraud competitors.
We also explore whether the difference between a financial measure and a related NFM
will be significant in a fraud risk assessment model which includes other indicators of fraud.
Assuming that nonfinancial data is less easily manipulated and is not derived from financial data
contained within the financial statements, we expect that NFMs contain significant amounts of
additional information that is not provided by financial statement variables shown previously to
be associated with fraud. When performing analytical procedures, auditors commonly rely on
prior years’ trends and ratios in financial data to develop expectations for the current year
financial performance (Anderson and Koonce 1995; Hirst and Koonce 1996; Bierstaker et al.
1999; POB 2000). As mentioned previously, audit guidance suggests that auditors should
incorporate the results of analytical procedures into their fraud risk assessments. SAS No. 99
(AICPA 2002, ¶28) specifically states,
In performing analytical procedures … the auditor develops expectations about plausible relationships that are reasonably expected to exist, based on the auditor’s understanding of the entity and its environment. When comparison of those expectations with recorded amounts yields unusual or unexpected relationships, the auditor should consider those results in identifying the risk of material misstatement due to fraud. We argue, and the PCAOB contends (PCAOB 2004), that comparing financial data to
NFMs is more likely to help auditors detect fraud than performing analytical procedures based
solely on financial data which has also been subject to manipulation or fraud. To test this
12
expectation, we explore whether the consistency between financial measures and NFMs
indicative of operations (e.g., number of employees, number of retail outlets) provides additional
statistical power over other financial variables (e.g., leverage) known to discriminate fraud from
non-fraud firms. We also investigate whether the comparison of financial data to NFMs of
operations enhances the explanatory power of a model also containing nonoperational /
nonfinancial data (e.g., corporate governance variables, auditor type, age of the firm, etc.) that
have been found to be associated with fraud. In a fraudulent financial reporting model, the
explanatory power of these nonoperational / nonfinancial factors should be complemented by
including NFMs which serve as a reliable benchmark for financial reporting accuracy.
Prior research and audit guidance has identified three factors—collectively known as the
fraud triangle—that lead to fraud: incentive, opportunity and attitude (Loebbecke at al. 1989;
Albrecht et al. 1995, AICPA 2002). Incentive factors include inducement from capital markets or
compensation schemes that result in a perceived benefit from committing fraud. Opportunity
factors include weak corporate governance and other working conditions that result in
circumstances that allow management to commit fraud. Attitude factors are items that reveal
management’s propensity to rationalize fraudulent behavior. Archival research has shown that
factors related to both incentive and opportunity are related to fraud. However, we are not aware
of prior archival research that has measured and controlled for management’s attitude using
publicly available data. Indeed, in their review of the fraud literature, Hogan et al. (2006)
conclude that research related to attitudes is limited. Because publicly available data measuring
management’s attitude is not available, attitude is not controlled in our models.4
4 As noted earlier, several parties are calling on businesses to report more NFM information. Some NFMs that are being called for include measures that may be useful for measuring managements’ attitude toward fraud. For example, NFMs that measure a firm’s social and environmental performance may be correlated with managements’ attitude. We believe that future research exploring this relationship may be fruitful.

13
Prior archival studies and educators have identified variables related to suspicious
accounting (e.g., special items) which have been useful in detecting fraud or earnings
management (Albrecht et al. 2006; Marquardt and Wiedman 2004; McVay 2006). Thus, three
categories of factors found in prior archival research to be associated with fraud are: incentive,
opportunity, and suspicious accounting. Therefore, to determine if inconsistencies between
financial measures and NFMs discriminate fraud firms from non-fraud firms, we incorporate
such a variable into a model containing proxies for incentive, opportunity, and suspicious
accounting and measure its effects. Our expectation is formalized as follows:
H2: Including an independent variable that compares change in revenue growth and change in NFMs adds to the power of a fraud risk assessment model comprised of variables that have previously been associated with fraudulent financial reporting.
The evidence provided in this study should not only assist auditors in their risk assessments but
also others who are interested in assessing fraud risk (e.g., investors, lenders, regulators, etc.)
III. SAMPLE SELECTION AND RESEARCH METHOD
Sample
Our fraud sample includes firms charged by the SEC with having fraudulently reported
revenue on at least one 10-K filing. We do not include frauds that involve quarterly data for
several reasons: prior studies restrict their samples to annual data, quarterly disclosures provide
little nonfinancial data, quarterly financial statements are not audited, and discrepancies between
financial and nonfinancial data would be less likely in a shorter time frame. We also limit our
sample to firms for which we were able to access the original 10-K filing and subsequent filings
of restated data (i.e., 10-K/As, 8-Ks, etc.). We do this for two reasons. First, 10-K filings are
valuable sources of information to help identify NFMs. Second, Compustat is our primary
financial data source. We found that Compustat does not consistently report restated data. It

14
appears that if the restated data is available when Compustat personnel enter the data in their
database, the restated data is entered and the fraudulent numbers are discarded. It does not appear
that Compustat changes data upon restatements several years after the original data is entered in
the database. We therefore compare Compustat data with the original 10-K filing to verify the
data reported in Compustat is the fraudulently reported numbers and not restated data. We find
that Compustat reported restated data for 14 of the 69 firms in our fraud sample so we hand-
collect the fraudulent data from the original 10-K filing for those 14 firms. SEC filings are
available on EDGAR from 1994 onward and for selected companies on Lexis/Nexis for years
prior to 1994. The majority of the frauds in our sample occurred after 1994.
We identified our fraud sample from three sources. First, the Committee of Sponsoring
Organizations of the Treadway Commission (COSO) published a report “Fraudulent Financial
Reporting: 1987-1997 - An Analysis of U.S. Public Companies” (Beasley et al. 1999). The
COSO study investigated frauds that were identified in SEC Accounting and Auditing
Enforcement Releases (AAERs) issued during the period of 1987-1997.5 Second, we performed
our own AAER search for AAERs issued during the years 1998-2005. We used “fraud” as a
search term. Our third source came from searching the popular press (e.g., Wall Street Journal).
We excluded firms from our sample for one or more of the following reasons: firms with missing
or incomplete data (largely due to missing Compustat data required to measure many of our
control variables); firms that did not misreport at least one 10-K (e.g., fraudulent reported
quarterly data); firms in the financial services or insurance industries;6 firms that perpetrated
frauds that did not involve fraudulent financial reporting (e.g., omitted disclosures, insider
5 Prior studies (Pincus et al. 1988; Feroz et al. 1991; Dechow et al. 1996) provide more detail on AAERS and the SEC’s process in investigating firms. It should be noted that the initial year of fraudulent activity often occurs years before the SEC AAER. 6 We exclude firms in these industries because they generally lack the control variables (e.g., Financing) used in our models and to be consistent with prior fraud research (e.g., Lee et al. 1999; Erickson et al. 2006)

15
trading); firms that did not manipulate revenues (e.g., inventory/expense frauds); firms that
committed fraud prior to 1993 (i.e., no 10-K or proxy statement available on Edgar to verify
fraudulent revenue data); or firms where we could not find similar nonfinancial information
about the firm and a competitor (non-fraud firm). Our final fraud sample consists of 69 fraud
firms that, according to the SEC, intentionally manipulated revenues. This sample size is
comparable to or greater than the sample sizes of previous fraud studies (e.g., Beasley 1996;
Erickson et al. 2006). Panel A of Table 1 reports our sample selection method.
Insert Table 1 here
Several of the firms misreported revenues for more than one year. Our sample includes
only the first year of manipulation because we want to compare a year that was accurately
reported (i.e., year prior to the fraud) to a year that was manipulated (i.e., first year of the fraud).
Panels B and C of Table 1 present the number of frauds by industry and year, respectively. The
69 firms accused of fraud reside in 22 different two-digit SIC codes. The 7300-7399 Business
Services classification code has the largest percentage (30%) of fraud firms. The frauds in our
sample occurred during a ten-year period between 1993 and 2002. Sixty-four percent of the
alleged frauds in the sample began in the years 1997-2000.
Table 2 presents the types of alleged accounting fraud in our sample firms as obtained
from the AAERs. We were also able to hand-collect information on the size of the restatement
for 54 of the 69 firms in our sample. For each fraud firm, we searched the AAER and subsequent
10-K’s, 10-K/As, and 8-Ks to find the restated earnings number. The average earnings
restatement for all firms equaled 12 percent of total revenue.
Insert Table 2 here

16
Methodology for Collecting NFM Data
Compustat (data item #29) reports total number of employees. We therefore included
total number of employees as an NFM in our analyses. To gather additional NFM data, students
enrolled in undergraduate auditing courses at two large state universities performed the duties of
selecting the non-fraud competitors and collecting NFM data for our sample of fraud firms.
Emulating audit practice, we asked the students to assume the role of staff assistant with each
student assigned to a different auditee (i.e., fraud firm) and informed them that their audit task
would involve NFM collection for the client and a competitor of their choice. The students were
also told the current fiscal year-end under audit (initial fraud year) and the prior fiscal year-end
(pre-fraud year). Students were not aware of the study’s hypotheses nor were they evaluated on
whether the data was consistent with the hypotheses. Students were evaluated solely on their
ability to conduct research.
We also provided the students with three of the client’s closest competitors (non-fraud
firms) as identified by Hoover’s Online database. We did not perform a simple match based on
SIC code and size because we required identical NFMs for both the fraud firm and its
competitor. We concluded that simply matching by SIC code and size would be less likely to
yield corresponding NFM data for both the fraud firm and the matched pair and that we were
more likely to find corresponding NFM data by matching fraud firms with their true competitors.
More importantly, discussions with practicing auditors revealed that our matching procedure was
more likely to be performed by independent auditors rather than a simple SIC code match.7
7 Prior fraud research has traditionally matched on SIC code, year, and size (e.g., Beasley 1996; Summers and Sweeney 1998; Erickson et al. 2006). Our matching process is not the same but yields similar results. Only 17 of our 69 fraud firms were matched with competitors in a different two-digit SIC code. However, we found it is not uncommon for natural competitors to be in entirely different SIC codes. For example, Genesco allegedly committed fraud in fiscal year ended 2001 (SEC 2003). Compustat lists Genesco’s SIC code as 5661 (Apparel and Accessory Stores: Shoe Stores). Hoover’s Online lists Stride Rite as one of Genesco’s closest competitors; Compustat lists Stride Rite’s SIC code as 3140 (Leather and Leather Products: Footwear). Incidentally, Hoover’s Online lists Stride

17
Students were then instructed to collect up to four quantitative NFMs (along with the
source references) which were identical for both the client and one competitor of their choosing
for the initial fraud year and the prior fiscal year-end. We instructed the students to target NFMs
that have positive contemporaneous correlations with revenue. The students were asked to
perform an exhaustive search of 10-Ks, Hoover’s Online, Proquest, ABI-Inform, LexisNexis,
Standard and Poor’s Market Insight, and Google for NFMs for each fraud firm and one
competitor of their own choosing. The students were informed that they should be creative in
finding new sources of NFM information and to share information about possible new data
sources with other students. Students reported that collecting the NFM data took between two
and five hours for each firm - competitor combination.
We included in our sample all NFMs which were quantitative, non-financial and
appeared to have a contemporaneous correlation with revenue. Some NFMs collected by the
students did not fit these requirements and, therefore, were not included in our sample. Some
common examples of data that we excluded are bond ratings because they were non-quantitative,
percent spending on research and development because it was financial in nature, and number of
litigation cases because we failed to see a contemporaneous correlation between litigation cases
and revenue. We erred on the side of including NFMs in our analysis even if we could only make
a weak argument for their correlation with revenue. We reasoned that allowing some noise in the
association between NFMs and revenue would reduce the subjectivity of the data collection
process and would bias against finding results. In addition, our objective is not to find the best Rite’s SIC code as 5139 (Wholesale Trade non-durable-goods: Footwear). For Enron, Compustat lists Enron’s SIC code as (5172: Wholesale Trade non-durable-goods: Petroleum). Hoover’s Online lists Williams Companies as one of Enron’s closest competitors. However, Compustat lists Williams Companies’ SIC code as 4922 (Electric, Gas, and Sanitary Services: Natural Gas Transmission). Therefore, matching on SIC code through Compustat is dependent upon Compustat’s SIC classification and does not necessarily include the firm’s closest competitor(s) as listed by Hoover’s Online. Coincidentally, if we had performed a simple two-digit SIC code match using Hoover’s Online SIC classification, we could have theoretically matched Enron (5172) with Stride Rite (5139) and not Williams Companies (4922).
18
methodology for collecting NFM data. Rather, our goal is to test whether NFMs have the
potential to be effectively utilized in auditors’ fraud risk assessments. Because we believe
auditors have access to client NFM data that is not publicly available but more predictive of
financial data, we view our test as lacking strong power to reject the null. Therefore finding
statistical support for our hypotheses using this methodology suggests that NFMs have
significant potential to aid fraud risk assessment.
From the NFMs submitted by students and the employee data collected from Compustat,
we identified a total of 144 common NFMs for 69 fraud firms and their competitors. We had an
average of slightly more than two NFMs per pair. The Del Global Technologies and Anicom
examples discussed previously illustrate a few of the specific NFMs (i.e., employees, facilities,
distribution dealers) included in our sample. Table 3 provides a list of the NFMs in our sample.
Insert Table 3 here
Statistical Models
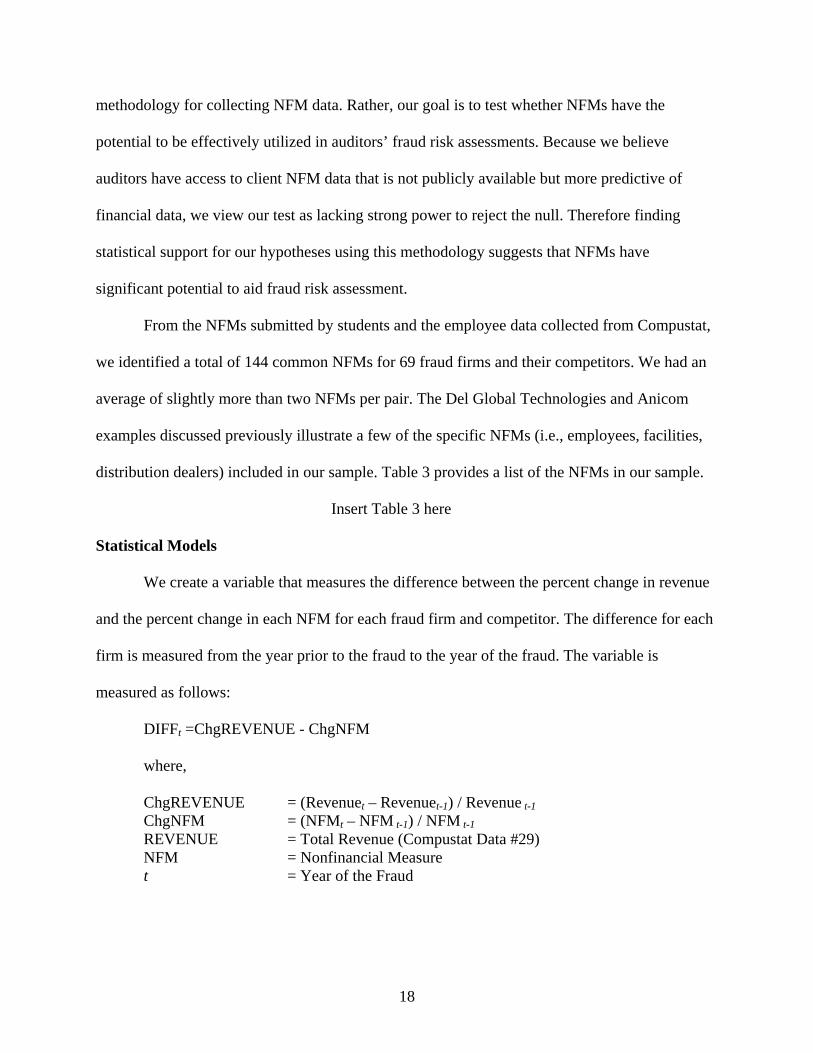
We create a variable that measures the difference between the percent change in revenue
and the percent change in each NFM for each fraud firm and competitor. The difference for each
firm is measured from the year prior to the fraud to the year of the fraud. The variable is
measured as follows:
DIFFt =ChgREVENUE - ChgNFM where,
ChgREVENUE = (Revenuet – Revenuet-1) / Revenue t-1 ChgNFM = (NFMt – NFM t-1) / NFM t-1 REVENUE = Total Revenue (Compustat Data #29) NFM = Nonfinancial Measure t = Year of the Fraud

19
H1 posits that fraud firms will have, on average, a greater value for DIFF than non-fraud firms
(i.e., competitors).8 When we were able collect multiple NFMs for a matched pair, we used the
average change in NFM to calculate DIFF. For example, as noted previously, Anicom reported a
substantial increase in employees (46 percent) and in the number of facilities (55 percent) during
the year of the fraud. In Anicom’s case, the average change in NFM would be 50.5%. Anicom’s
sales grew 93% for a DIFF of 42.5%.
As an alternative test of H1 and H2, we examine whether our hypotheses are supported
using one NFM—total number of employees (Compustat data #29)—for a majority of firms.
Before examining whether this NFM is useful for discriminating fraud from non-fraud firms (vs.
using the average of multiple NFMs as indicated above), we test whether total number of
employees is correlated with revenue. We perform the following regression on all the firms in
Compustat during our sample period (1993-2002):
REVENUEt = β0 + β1EMPLOYEESt
Where, REVENUE is defined as total revenue in year t (Compustat Data #12). EMPLOYEES is
defined as total employees in year t (Compustat Data #29). The results are presented in Table 4.
The coefficient on EMPLOYEES (197.81) is highly significant (p < .01) and the R2 is high
(.712), suggesting a strong correlation between total number of employees and sales revenue 8 We winzorized DIFF at 1 and -1, which means the difference between revenue growth and NFM growth could not be greater than 100 percent or less than negative 100 percent. We did this because the majority of our sample had DIFFs between 1 and -1. However, 13 firms had extreme DIFFs, which are primarily driven by years of extreme revenue growth. For example, M&A West allegedly committed fraud in 2000 (SEC 2001). M&A’s revenues increased from $602 thousand in 1999 to $7.496 million in 2000 for an increase of 1,145 percent. M&A’s NFM growth was still substantial (491 percent); however, M&A’s DIFF value is 654 percent. Financial ratios often “blow up” at the tails and the problems with using accounting-based financial ratios are well documented (Kane and Meade 1998). DIFF is especially sensitive to these problems because it is the difference of two ratios. In the case of M&A West, it is unlikely that an auditor attempting to assess fraud risk would attach six and one half times more weight to M&A’s difference in revenue growth and nonfinancial measure growth than a firm that has a 100 percent difference. The differences for both are simply very high and abnormal. Therefore, we capped the value of DIFF at 100 percent and -100 percent for the results tabulated. Capping DIFF at as high as 150 percent and -150 percent provides qualitatively similar results. In addition, deleting firms (and their corresponding matched pair) with DIFFs in excess of 100 percent and -100 percent or ranking the DIFFs and using the ranking as our dependent variable (Cheng et al. 1992; Ireland and Lennox 2002) generate qualitatively similar results.

20
reported by a company. Because we have one consistent NFM for almost the entire fraud sample
that should be correlated with revenue, we perform alternative tests of H1 and H2 using only
employee data and name that variable EMPLOYEE DIFF. In sum, we were able to calculate
DIFF for 69 matched pairs (138 observations) and EMPLOYEE DIFF for 68 matched pairs (136
observations).9
Insert Table 4 here
To test H2, we examine DIFF and EMPLOYEE DIFF in a multivariate regression with
control variables for incentive, opportunity, and suspicious accounting and an indicator for fraud
as the dependent variable. The effects of our variables of interest will then be examined to
determine whether they provide additional explanatory power when discriminating between the
fraud and non-fraud firms in our sample. Our selection and measurement of control variables is
reflective of variables that have been examined in prior studies of fraud, earnings management,
and accounting restatements (e.g., Erickson et al. 2006; McVay 2006; Richardson et al. 2007).
Our model appears as follows:
P(FRAUDt) = β0 + β1Difft + βiControl Variables
P(FRAUDt) = A dummy variable coded 1 for fraud firms and 0 for non-fraud firms t = year of the fraud
The control variables are defined as follows:
Incentive Factors FINANCING = An indicator variable coded 1 if FREECASHt
is less than -0.5 and 0 otherwise. FREECASHt = (Cash Flow from Operationst - Average Capital Expenditurest-3 to t-1) / Current Assetst-1
LEVERAGE = (Short-Term Debtt + Long-Term Debtt) / Total Assetst
ALTMAN’S Z SCORE = 1.2X1 + 1.4X2 + 3.3X3 + .6X4 + 1.0X5
9 One firm did not have employee data on Compustat but we collected other NFM data for the firm.

21
X1 = (Current Assetst – Current Liabilitiest) / Total Assetst
X2 = Retained Earningst / Total Assetst X3 = Earnings before interest and taxest /
Total Assetst X4 = Market Value of Equityt / Book Value of Total Liabilitiest X5 = Revenuet / Total Assetst
MARKET VALUE OF EQUITY = End-of-Year Share Pricet x Total Common Shares Outstandingt / Total Assetst
BOOK TO MARKET = (Total Assetst – Total Liabilitiest) / Market Value of Equityt
EARNINGS TO PRICE = Net Income before extraordinary itemst / End-of- Year Share Pricet
RETURN ON ASSETS = Net Income before extraordinary itemst / Total Assetst-1
AGE OF FIRM = The length of time in years the firm has been publicly traded (from the Center for Research in Security Prices [CRSP]).
M&A IN YEAR OF FRAUD = An indicator variable set equal to 1 if the firm had an acquisition that contributed to sales in the prior year (acquisition in the first year of fraud for fraud firms). (Variable set equal to one if
Compustat data #249 > 0, otherwise variable is set to 0.)
Opportunity Factors BIG FOUR = An indicator variable set equal to 1 if the firm
had a Big Four Auditor at t and 0 otherwise. INSIDERS ON THE BOARD = The percentage of insiders (company employees)
on the Board of Directors. CEO=COB = An indicator variable coded 1 if the firm’s
CEO was also Chairman of the Board and 0 otherwise.
Suspicious Accounting Factors TOTAL ACCRUALS = (Net Income before extraordinary itemst +
Depreciationt – Cash Flow from Operationst) / Total Assetst
SPECIAL ITEMS = An indicator variable set equal to 1 if the firm reported a special item (Compustat #17) and 0 otherwise.
REVENUE GROWTH = (Revenuet – Revenuet-1) / Revenue t-1
Other Controls TOTAL ASSETS = Total Assetst

22
NEGATIVE CHANGE IN NFM = An indicator variable set equal to 1 if the firm
had a negative change in NFM, otherwise variable is sent to 0.
FINANCING captures the extent to which the firm may need external financing.
Consistent with Dechow et al. (1996) we create an indicator variable set equal to one if the firm
will likely need external financing in the next two years. Firms closer to exhausting their internal
funds may have incentives to manipulate revenues in anticipation of accessing the capital
markets. Following Erickson et al. (2006) if FREECASH is less than or equal to -0.5 then
FINANCING is set equal to 1 and 0 otherwise. This cutoff assumes that if a firm will need
external financing in the coming years it will need to start raising the desired funds now
(Erickson et al. 2006).
LEVERAGE and ALTMAN’s Z SCORE control for financial distress. Financially
distressed firms may have a greater incentive to commit fraud than those that are not distressed
(Begley et al. 1996). We also include several variables that measure market and financial
performance. Above average financial or stock performance may indicate that the firm is
achieving abnormally high performance through fraudulent reporting or may have incentives to
commit fraud in order to sustain their performance. We use MARKET VALUE OF EQUITY,
BOOK TO MARKET, EARNINGS TO PRICE, and RETURN ON ASSETS to control for stock
and financial performance and to be consistent with prior fraud studies (e.g., Dechow et al. 1996;
Beneish 1997; Summers and Sweeney 1998; Lee et al. 1999; Erickson et al. 2006). AGE OF
THE FIRM controls for the fact that fraud firms tend to be younger (Beneish 1997), which may
be due to a greater incentive to commit fraud as a result of an initial public offering or other
newly issued stock. M&A IN YEAR OF FRAUD is an indicator variable that measures 1 if a
23
portion of firm revenues are from an acquisition. Firms have incentives to manage earnings prior
to an acquisition in order to raise their stock price (Erickson and Wang 1999; Louis 2004).10
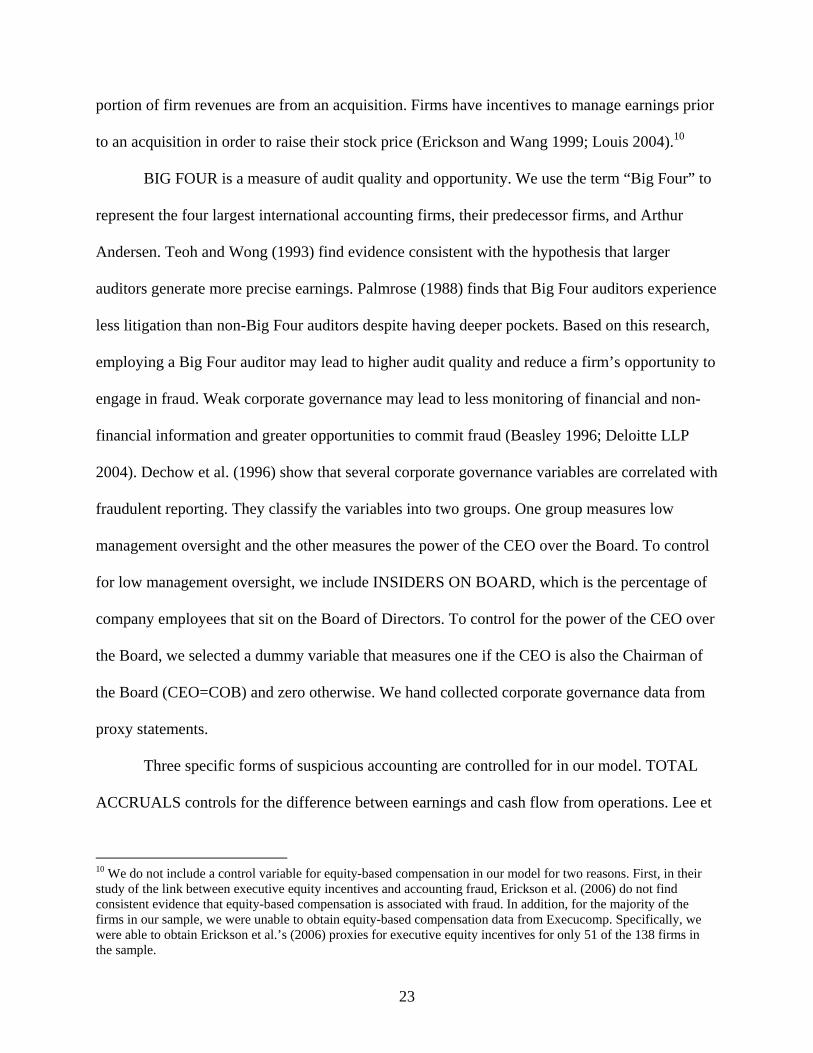
BIG FOUR is a measure of audit quality and opportunity. We use the term “Big Four” to
represent the four largest international accounting firms, their predecessor firms, and Arthur
Andersen. Teoh and Wong (1993) find evidence consistent with the hypothesis that larger
auditors generate more precise earnings. Palmrose (1988) finds that Big Four auditors experience
less litigation than non-Big Four auditors despite having deeper pockets. Based on this research,
employing a Big Four auditor may lead to higher audit quality and reduce a firm’s opportunity to
engage in fraud. Weak corporate governance may lead to less monitoring of financial and non-
financial information and greater opportunities to commit fraud (Beasley 1996; Deloitte LLP
2004). Dechow et al. (1996) show that several corporate governance variables are correlated with
fraudulent reporting. They classify the variables into two groups. One group measures low
management oversight and the other measures the power of the CEO over the Board. To control
for low management oversight, we include INSIDERS ON BOARD, which is the percentage of
company employees that sit on the Board of Directors. To control for the power of the CEO over
the Board, we selected a dummy variable that measures one if the CEO is also the Chairman of
the Board (CEO=COB) and zero otherwise. We hand collected corporate governance data from
proxy statements.
Three specific forms of suspicious accounting are controlled for in our model. TOTAL
ACCRUALS controls for the difference between earnings and cash flow from operations. Lee et
10 We do not include a control variable for equity-based compensation in our model for two reasons. First, in their study of the link between executive equity incentives and accounting fraud, Erickson et al. (2006) do not find consistent evidence that equity-based compensation is associated with fraud. In addition, for the majority of the firms in our sample, we were unable to obtain equity-based compensation data from Execucomp. Specifically, we were able to obtain Erickson et al.’s (2006) proxies for executive equity incentives for only 51 of the 138 firms in the sample.

24
al. (1999) find this difference to be an indicator of fraudulent financial reporting. If earnings are
fraudulent then there will be no corresponding cash inflow. We include the existence of
SPECIAL ITEMS as a control variable because prior research suggests that special items have
been used as an earnings management tool (Marquardt and Wiedman 2004; McVay 2006).
REVENUE GROWTH controls for the possibility that high growth firms may have high DIFFs
and that fraud firms are simply high growth firms needing to sustain their growth (Erickson et al.
2006), rather than firms for which there are inconsistencies between their financial data and
NFMs. We expect growth to be positively associated with fraud in our sample because we only
include firms that manipulated revenues.
TOTAL ASSETS proxies for size. Including this variable controls for the possibility that
size is driving our results. Similarly, NEGATIVE CHANGE IN NFM controls for the possibility
that our results are driven by firms in crisis. Firms with a negative change in their NFMs may be
downsizing or in turmoil causing a large DIFF. We include this variable to control for this
possibility.
Methodology Related to Missing Data
In order to maximize the size of our sample (in terms of total sample size and total
control variables) in a multivariate analysis (H2 testing), we employed Rubin’s (1987) multiple
imputation procedure to control for missing data. Our primary data constraint with respect to
control variables was hand-collecting the corporate governance variables from proxy statements.
We were only able to collect INSIDERS ON BOARD and CEO=COB for 45 matched pairs.11
The multiple imputation procedure replaces the missing values with a set of plausible values that
represent the uncertainty about the correct value to impute. The imputed data sets are analyzed
11 When we perform our tests of H2 without imputing missing controls, the multivariate results are qualitatively similar for DIFF and EMPLOYEE DIFF (p’s = .01).

25
using standard procedures (e.g., standard logistic regression) and the results are combined (Yuan
2007).12
IV. RESULTS
Descriptive Statistics
Table 5 provides descriptive statistics for our study’s variable of interest (DIFF), the
alternative variable of interest (EMPLOYEE DIFF), control variables, and size of the fraud. For
the fraud sample, we include a variable that measures fraud size (i.e., the size of the earning
restatement as a percentage of revenue) to provide an estimate of the extent of the earnings
manipulation.
Insert Table 5 here
On average, the fraud firms were smaller and had a larger return on assets than the
matched pairs; however, the differences in means for TOTAL ASSETS and ROA were not
significant. Several control variables were significantly different between groups including
control variables from the three fraud factors; incentive (FINANCING, LEVERAGE, BOOK TO
MARKET, AGE OF FIRM, M&A IN YEAR OF FRAUD), opportunity (INSIDERS ON THE
BOARD) and suspicious accounting (TOTAL ACCRUALS). The average earnings manipulation
for the fraud firms equaled 12 percent of total revenue.
Tests of Hypotheses
H1 predicts a greater difference between revenue growth and NFM growth (DIFF) for the
fraud sample than for the control sample (i.e., non-fraud competitors). The results in Table 5
12 Three methods are traditionally used for imputing missing data. We made the assumption that the missing data follow an arbitrary pattern and used the Markov Chain Monte Carlo (MCMC) method developed by Schafer (1997). Two other methods, the parametric regression method and the propensity scores method, are available when the missing data follow a monotone pattern. A data set is monotone when a variable Yj is missing for the individual i and it implies that all subsequent variables Yk, k>j, are all missing for the individual i (Yuan 2007). While we have no evidence to assume our missing data followed a monotone pattern, we performed our analyses using these two other methods and the results are qualitatively the same.

26
support H1 as DIFF is significantly (p < .01) greater for the fraud sample relative to the sample
of non-fraud competitor firms.13 Thus, for fraud firms, there appears to be a larger inconsistency
between the performance portrayed by their financial statements and that portrayed by their
NFMs. For their competitors we observe a mean DIFF of .08. For non-fraud firms, revenues
appear to grow faster than their NFMs, but the percentage difference appears reasonable given
the expected noise between financial statement data and NFMs. However, for the fraud firms, we
observe a much larger mean DIFF of .29. Thus, H1 is supported in that fraud firms appear to
have greater differences between their percent change in revenue growth and percent change in
NFMs than their non-fraud competitors. A greater DIFF may be indicative of greater fraud risk.
For auditors, investors, regulators, or other parties that are examining DIFF in future
applications, our descriptive results provide a benchmark for a reasonable DIFF (.08) and what
might be considered an unreasonable DIFF (.29) requiring an explanation from management.
The results are equally strong for EMPLOYEE DIFF, which provides similar means as
DIFF but slightly less variance as evidenced by smaller standard deviations. While DIFF
represents the change in revenue less the average change of multiple, industry-specific NFMs,
EMPLOYEE DIFF represents the change in revenue less the change in one consistent NFM.
Thus, a smaller degree of variance is not surprising. H1 is also supported with EMPLOYEE
DIFF.
Table 6 presents the results of a multivariate logistic regression for DIFF and our control
variables on P(FRAUD). H2 is supported by a positive and significant coefficient (p = .02) for
DIFF. Interestingly DIFF is significant despite the fact that M&A IN YEAR OF FRAUD,
TOTAL ACCRUALS, and SALES GROWTH were also significant. All three of these control
13 Due to the directional nature of our expectations, our hypotheses tests are one-tailed. All other tests are two-tailed.

27
variables can be considered indicators of firm growth, which we would expect to be significant
in a sample of firms that committed revenue fraud. Thus, the significant positive coefficient for
DIFF suggests that the large DIFF for fraud firms presented in Table 5 is not simply a function of
frauds firms being high-growth firms. Our results indicate that comparing revenue growth to
NFM growth provides additional information about the likelihood of fraudulent reporting not
contained in variables identified in prior research. H2 is supported.
Insert Table 6 here
Table 7 presents the results of a multivariate logistic regression for EMPLOYEE DIFF
and our control variables on P(FRAUD). H2 is further supported by a positive and significant
coefficient (p = .01) for EMPLOYEE DIFF. These results are consistent and slightly better than
those presented in Table 5. Using one NFM may provide greater statistical power because of a
lower variance than when multiple NFMs are used. In addition, some of the student-collected
NFM data may not have been ideally suited for a comparison with revenue. In practice, auditors,
corporate governors, analysts, lenders and investors would be much more familiar with specific
industries and the NFMs that drive revenue. Thus, it is still an empirical question as to whether
those concerned with assessing fraud risk should use multiple NFMs or concentrate their efforts
on one single NFM. In summary, our results provide empirical evidence that NFMs have the
power to aid in fraud detection. This finding is consistent with Erickson et al.’s (2000, 168)
statement that one of the major failures of the Lincoln Saving and Loan audit was “the auditor’s
failure to obtain and use knowledge of Lincoln Saving and Loan’s business, the industry in
which it operated, and the economic forces that influenced this industry/business.”
Insert Table 7 here

28
V. CONCLUDING COMMENTS
The current regulatory environment is placing increased scrutiny on auditors’ ability to
detect fraud. Additionally, SAS No. 99 (AICPA 2002) requires auditors to document a separate
fraud risk assessment for each engagement. The purpose of this paper is to investigate whether
the comparing financial data to nonfinancial measures (NFMs) can aid auditors and others in
assessing fraud risk. We believe that firms that fraudulently misstate their financial statements
will be unlikely or unable to concurrently misstate NFMs that are indicative of their true
financial condition. We therefore predict that fraud firms will have greater differences in percent
change in revenue growth and percent change in NFMs than their non-fraud competitors and that
these differences will add to the power of fraud-risk-assessment models comprised of variables
that have previously been associated with fraud. We compare a sample of firms that committed
fraud to a control sample of competitor firms to test these predictions. Our analyses incorporate
NFMs that we believe should correspond with revenue growth and indicate that a variable that
measures the difference between the percent change in revenue growth and NFMs can
discriminate between fraud and non-fraud competitor firms.
These findings have implications for future audit practice, other parties interested in
assessing fraud risk, and research. First, the prior literature suggests that fraud goes undetected
when auditors fail to understand the environments in which their clients operate (Erickson et al.
2000). We provide evidence suggesting that fraud risk assessment models that incorporate NFMs
can help prevent these failures. Thus, understanding the various NFMs for the industries in
which an audit client operates and comparing the NFMs to reported financial results has the
potential to be a powerful fraud detection tool. Substantial differences between financial
statement data and NFMs should serve as a red flag to auditors and lead them to ask pointed

29
questions of client management, corroborate and test management’s responses, and, if necessary,
serve as a tipping point at which forensic specialists are assigned to the engagement. Second, our
study provides empirical evidence to support policy-makers who currently are considering the
required use of NFMs in future fraud standards (e.g., PCAOB 2004). Third, our descriptive
results in Table 5 provide auditors and other parties (e.g., investors, directors, regulators) with
benchmarks as to what might be unreasonable inconsistencies between financial performance
and NFMs. Advances in technology (e.g., XBRL) should allow interested parties to easily extract
both financial measures and NFMs from SEC filings and perform analyses similar to those
described in this study.
Future research could study whether our results, found with annual data, can be replicated
with quarterly data. Such research would show whether auditors could use the analysis contained
herein to possibly detect fraudulent activity prior to performing fiscal year-end audit procedures.
Alternatively, evaluating whether the discriminatory power of the analysis could be improved by
using more than one competitor or determining whether “Diff” for non-fraud firms and their
competitors is consistently low represent fruitful areas of research. Future studies could
investigate if and how auditors and investors use NFMs in practice. For example, researchers
could examine the degree to which auditors choose to use NFMs in practice and what
mechanisms might promote their usage (e.g., higher fraud risk assessments, more explicit
guidance, and greater industry expertise). Such research could also determine the extent to which
NFM usage improves auditors’ performance. Also, future studies could examine the extent to
which investors decisions are impacted by “Diff.” Researchers could examine if investors (e.g.,
short-sellers) identify inconsistencies between financial measures and NFMs and benefit from
this knowledge. Finally, exploring the ability of specific NFMs, such as those attempting to

30
measure social or environmental performance, to measure the fraud risk construct of attitude
could also be fruitful.
We recognize that it is difficult to determine if the change in our NFMs should lead, lag
or mirror changes in revenue. For example, does an increase in employees lead to an increase in
revenue in the same year or in future years? Furthermore, does an increase in revenue lead to the
hiring of more employees as the firm expands operations to meet demand? Importantly, if
changes and revenue and changes in an NFM are not completely contemporaneous, this would
bias against our finding results. We hope that future research in this area will provide more
insight into the time frame auditors and others should employ when using NFMs to assess fraud
risk. Lastly, our findings are limited in that we only examined revenue frauds. Future studies can
examine other fraud schemes and determine specific NFMs which might be useful in their
detection.

31
REFERENCES
Abbott, L., Y. Park, and S. Parker. 2000. The effects of audit committee activity and independence on corporate fraud. Managerial Finance 26: 55-67.
Albrecht, W., G. Wernz and T. Williams. 1995. Fraud: Bringing Light to the Dark Side of
Business. New York, NY: McGraw-Hill.
Albrecht, W. S., C.C. Albrecht and C.O. Albrecht. 2006. Fraud Examination. Thompson-Southwestern. Mason, Ohio.
American Institute of Certified Public Accountants (AICPA). 1988. Statement on Auditing
Standards No. 56: Analytical Procedures. New York, NY: AICPA. AICPA. 2002. Statement on Auditing Standards No. 99: Consideration of Fraud in a Financial
Statement Audit. New York, NY: AICPA. Amir, E. and B. Lev. 1996. Value-Relevance of nonfinancial information: The wireless
communications industry. Journal of Accounting and Economics 22 (Supplement): 3-30. Anderson, U. and L. Koonce. 1995. Explanation as a method for evaluating client-suggested
causes in analytical procedures. Auditing, A Journal of Practice and Theory 14 (Fall): 124-132.
Ballou, B, D. Heitger, and C. Landes. 2006. The future of corporate sustainability reporting. Journal of Accountancy 202 (December): 65-74.
Banker, R., G. Potter and D. Srinivasan. 2000. An empirical investigation of an incentive plan
that includes nonfinancial measures. The Accounting Review 75 (January): 65-92.
Beasley, M. 1996. An empirical analysis of the relation between board of director composition and financial statement fraud. The Accounting Review 71 (October): 443-465.
Beasley, M., J. Carcello, and D. Hermanson. 1999. Fraudulent Financial Reporting: 1987-1997
An Analysis of U.S. Public Companies. Committee of Sponsoring Organizations of the Treadway Commission.
Beasley, M., J. Carcello, D. Hermanson, and P. Lapides. 2000. Fraudulent financial reporting:
Consideration of industry traits and corporate governance mechanisms. Accounting Horizons 14 (December): 441-454.
Behn, B. and R. Riley. 1999. Using nonfinancial information to predict financial performance:
The case of the U.S. airline industry. Journal of Accounting, Auditing & Finance 14 (Winter): 29-56.

32
Begley, J., J. Ming, and S. Watts. 1996. Bankruptcy Classification Errors in the 1980s: An Empirical Analysis of Altman’s and Ohlson’s Models. Review of Accounting Studies 1 (1996): 267-284.
Bell, T. B. and J. V. Carcello. 2000. A decision aid for assessing the likelihood of fraudulent
financial reporting. Auditing: A Journal of Practice & Theory 19 (Spring): 169-184. _____ , Peecher, M., Solomon, I. 2005. The 21st century public-company audit: Conceptual
elements of KPMG's global audit methodology. Montvale, New Jersey: KPMG. Beneish, M. 1997. Detecting GAAP violations: Implications for assessing earnings
management among firms with extreme financial performance. Journal of Accounting and Public Policy 16 (Fall): 271-309.
Beneish, M. 1999. The Detection of Earnings Manipulation. Financial Analysts’ Journal 55(5):24-36.
Bierstaker, J., J. Bedard, and S. Biggs. 1999. The role of problem representation shifts in auditor decision processes in analytical procedures. Auditing: A Journal of Practice & Theory 18 (Spring): 19-36.
Brazel, J. F., C. P. Agoglia, and R. C. Hatfield. 2004. Electronic versus face-to-face review: The
effects of alternative forms of review on auditors’ performance. The Accounting Review 79 (October): 949-966.
Cheng, C., W. Hopwood, and J. McKeown. Non-linearity and specification problems in
unexpected earnings response regression model. The Accounting Review 67 (July): 579-598.
Dechow, P.M., R.G. Sloan, and A.P. Sweeney. 1996. Causes and consequences of earnings
manipulation: An analysis of firms subject to enforcement actions by the SEC. Contemporary Accounting Research 13 (Spring): 1-36.
Deloitte LLP. 2004. In the dark: What boards and executives don't know about the health of their
businesses. New York, NY: Deloitte LLP. Eisinger, J. Cerner’s growth has been healthy, but its accounting could be ailing. The Wall Street
Journal (December 14, 2005): C1. Erickson, M., B. Mayhew, and W. Felix. 2000. Why do audits fail? Evidence from Lincoln
Savings and Loan. Journal of Accounting Research 38 (Spring): 165-194. Erickson, M., and S. Wang 1999. Earnings management by acquiring firms in stock for stock
mergers. Journal of Accounting and Economics 27: 149-176.

33
Erickson, M., M. Hanlon, and E.L. Maydew. 2006. Is there a link between executive equity incentives and accounting fraud? Journal of Accounting Research 44 (Spring): 113-143.
Farber, D. 2005. Restoring trust after fraud: Does corporate governance matter? The Accounting
Review 80. (April): 539-561. Feroz, E. H., K. Park and V.S. Pastena. 1991. The financial and market effects of the
SEC’s Accounting and Enforcement Releases. Journal of Accounting Research 29 (Supplement): 107-142.
Glover, S.M., D.F. Prawitt, J.J. Schultz, Jr., and M.F. Zimbelman. 2003. A test of changes in auditors’ fraud-related planning judgments since the issuance of SAS No. 82. Auditing: A Journal of Practice and Theory 22 (September): 237–252.
Gullapalli, D. To err is human, to restate financials, divine: Companies redo reports in record
numbers, partly due to Sarbanes-Oxley. The Wall Street Journal (January 20, 2005): C3. Hogan, C.E., Z. Rezaee, R.A. Riley, and U. Velury. 2006. Financial statement fraud: Insights
from the academic literature. Working Paper, Michigan State Univeristy. Holder-Webb, L., J. Cohen, L. Nath, and D. Wood. 2007. Corporate reporting of social and
environmental information: A sampling of current disclosure practices. Working Paper, University of Wisconsin.
Hirst, D.E. and L. Koonce. 1996. Audit analytical procedures: A field investigation.
Contemporary Accounting Research 13 (Fall): 457-486. Houston, R. W. 1999. The effects of fee pressure and client risk on audit seniors’ time budget
decisions. Auditing: A Journal of Practice and Theory 18: 70-86. Ireland, J. and C. Lennox. 2002. The large audit fee premium: A case of selectivity bias. Journal
of Accounting, Auditing and Finance. 73-91. Ittner, C. and D. Larcker, 1998. Are nonfinancial measures leading indicators of financial
performance? An analysis of customer satisfaction. Journal of Accounting Research 36 (Supplement): 1-35.
Kaminski, K.A. and T.S. Wetzel. 2004. Financial Ratios and Fraud: An Exploratory Study Using
Chaos Theory. Journal of Forensic Accounting V: 147–172. Kane, G. and N. Meade. 1998. Ratio Analysis Using Rank Transformation. Review of
Quantitative Finance and Accounting 10: 59-74. Kaplan, R. and D. Norton. 1996. The balanced scorecard. Boston, MA: Harvard Business
School Press.
34
Langfield-Smith, K., 2003, Management accounting, 3rd edition, McGraw-Hill. Lee, T.A., R.W. Ingram, and T.P. Howard. 1999. The difference between earnings and
operating cash flow as an indicator of financial reporting fraud. Contemporary Accounting Research 16 (Winter): 749-786.
Levitt, S. D. and S. J. Dubner. 2005. Freakonomics: A rogue economist explores the hidden side
of everything. New York, NY: HarperCollins. Liedtka, S. 2002. The information content of nonfinancial measures in the airline
industry. Journal of Business Finance & Accounting 29 (September/October): 1105- 1121.
Loebbecke, J.K., M.M. Eining, and J.J. Willingham. 1989. Auditors’ experience with
material irregularities: Frequency, nature, and detectability. Auditing: A Journal of Practice and Theory 9 (Fall): 1-28.
Louis, H. 2004. Earnings management and the market performance of acquiring firms. Journal
of Financial Economics 74: 121-148. Lundegaard, K. 2005. Delphi discloses accounting problems. Wall Street Journal (March 7,
2005): A3. Lundholm, R. and S. McVay. 2006. Forecasting sales: A model and some evidence from the
retail industry. Working Paper, University of Michigan. Marquardt, C. and C. Wiedman, 2004. How are earnings managed? An examination of specific
accruals. Contemporary Accounting Research 21 (Summer): 461-489. McVay, S. 2006. Earnings management using classification shifting: An examination of core and
special items. The Accounting Review 81 (May): 501-531. Messier, W., S. Glover, and D. Prawitt. 2006. Auditing and assurance services: A systematic
approach, 4th edition. New York, NY: McGraw-Hill Irwin. Nieschweitz, R., J. J. Schultz, Jr. and M. Zimbelman, 2000. Empirical Research on External
Auditors’ Detection of Financial Statement Fraud, Journal of Accounting Literature: 190-246.
Palmrose, Z. 1988. An Analysis of Auditor Litigation and Audit Service Quality. The
Accounting Review 63 (January): 55-73. Pincus, K., W. Holder, and T. Mock. 1998. Reducing the incidence of fraudulent financial
reporting: The role of the Securities and Exchange Commission. Los Angeles, CA: SEC Financial Reporting Institute of the University of California.
35
Public Company Accounting Oversight Board (PCAOB). 2004. PCAOB Standing Advisory Group Meeting: Meeting Agenda (September 8-9). Available at: http://pcaobus.org/News_and_Events/Events/2004/09-08-09.aspx.
PCAOB. 2007. Observations on auditors’ implementation of PCAOB standards relating to
auditors’ responsibilities with respect to fraud. Available at: http://pcaob.org/inspections/other/01-22_release_2007-001.pdf.
Public Oversight Board (POB) 2000. The Panel on Audit Effectiveness: Report and
Recommendations. Stamford, CT: POB. Richardson, S., I. Tuna, and M. Wu. 2002. Predicting earnings management: The case of
earnings restatements. Working Paper, University of Pennsylvania. Riley, R. A., T. Preason, and G. Trompeter. 2003. The value relevance of non-financial
performance variables: The case of the airline industry. Journal of Accounting and Public Policy 22 (May/June): 231-254.
Rubin, D. 1987. Multiple Imputation for Nonresponse in Surveys. New York, NY: John Wiley &
Sons, inc. Said, A., R. HassabElnaby, B. Wier. 2003. An empirical investigation of the performance
consequences of nonfinancial measures. Journal of Management Accounting Research. 15: 193-223.
Schafer, J. 1997. Analysis of Incomplete Multivariate Data. New York, NY: Chapman and Hall. Security and Exchange Commission (SEC) 2001. Accounting and Auditing Enforcement Release
No. 1440. SEC 2003. Accounting and Auditing Enforcement Release No. 1930. SEC 2004a. Accounting and Auditing Enforcement Release No. 2027. SEC 2004b. Accounting and Auditing Enforcement Release No. 1741. Summers, S.L. and J.T. Sweeney. 1998. Fraudulent misstated financial statements and insider
trading: An empirical analysis. The Accounting Review 73 (January): 131-146. Teoh, S.H. and T.J. Wong. 1993. Perceived auditor quality and the earnings response
Coefficient. The Accounting Review 68 (April): 346-366. Wall Street Journal (WSJ), 2005. Defense expert: HealthSouth fraud too complex for detection.
May 6.

36
Wright, A. M. 1988. The impact of prior year workpapers on auditor evidential planning judgments. Accounting, Organizations, and Society 13: 595-606.
Xie, H. 2001. The mispricing of accruals. The Accounting Review 76: 357-373. Yuan. 2007. Multiple Imputation for Missing Data: Concepts and New Development. SAS
Institute. Rockville, MD. Zimbelman, M. F. 1997. The effects of SAS No. 82 on auditors’ attention to fraud risk factors
and audit planning decisions. Journal of Accounting Research, 1997, Supplement: 75-97.

37
TABLE 1
Sample Selection Method
Panel A Frauds from COSO’s Report on Fraudulent Financial Reporting 204 from 1987-1997 (Beasely et al. 1999). Total Accounting and Auditing Enforcement Releases (AAERs) 240 attributable to alleged or actual accounting fraud from 1998-June
2005 (non-duplicates of the COSO report). Additional frauds identified through other sources (e.g. popular press
search and AAA monograph on litigation involving Big Four auditors) 6
Firms with missing or incomplete data on Compustat, Edgar or Lexis/Nexis. (144)
Frauds related to quarterly (10-Qs) but not annual data (10-Ks) (72) Frauds dropped for other reasons (i.e., financial services or insurance firm or nonfinancial in nature (e.g., omitted disclosure, insider trading)) (60) Frauds unrelated to revenue (e.g., inventory and expense frauds) (49) Frauds prior to 1993 (no proxy or 10-K available on Edgar) (44)
Frauds where we could not find similar NFM data for the fraud firm and competitor for the year before fraud and the first year of fraud. (12) _____
Total sample 69
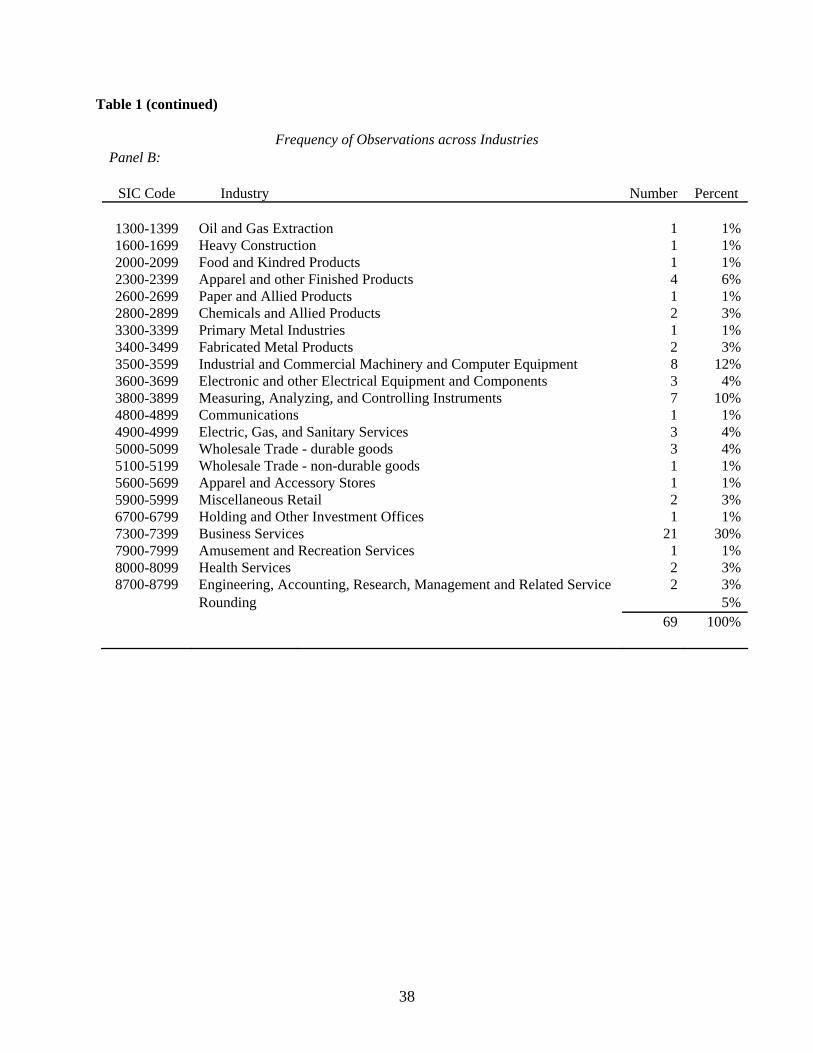
38
Table 1 (continued)
Frequency of Observations across Industries Panel B:
SIC Code Industry Number Percent
1300-1399 Oil and Gas Extraction 1 1%1600-1699 Heavy Construction 1 1%2000-2099 Food and Kindred Products 1 1%2300-2399 Apparel and other Finished Products 4 6%2600-2699 Paper and Allied Products 1 1%2800-2899 Chemicals and Allied Products 2 3%3300-3399 Primary Metal Industries 1 1%3400-3499 Fabricated Metal Products 2 3%3500-3599 Industrial and Commercial Machinery and Computer Equipment 8 12%3600-3699 Electronic and other Electrical Equipment and Components 3 4%3800-3899 Measuring, Analyzing, and Controlling Instruments 7 10%4800-4899 Communications 1 1%4900-4999 Electric, Gas, and Sanitary Services 3 4%5000-5099 Wholesale Trade - durable goods 3 4%5100-5199 Wholesale Trade - non-durable goods 1 1%5600-5699 Apparel and Accessory Stores 1 1%5900-5999 Miscellaneous Retail 2 3%6700-6799 Holding and Other Investment Offices 1 1%7300-7399 Business Services 21 30%7900-7999 Amusement and Recreation Services 1 1%8000-8099 Health Services 2 3%8700-8799 Engineering, Accounting, Research, Management and Related Service 2 3%
Rounding 5% 69 100%
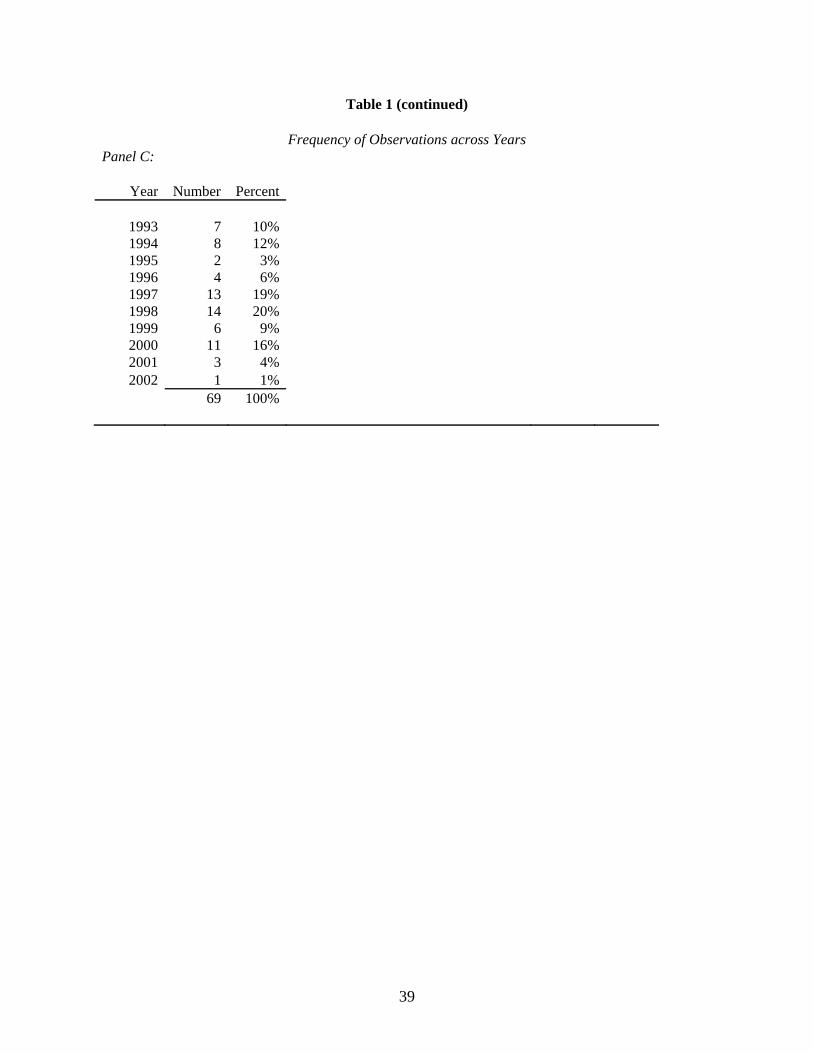
39
Table 1 (continued)
Frequency of Observations across Years Panel C:
Year Number Percent 1993 7 10% 1994 8 12% 1995 2 3% 1996 4 6% 1997 13 19% 1998 14 20% 1999 6 9% 2000 11 16% 2001 3 4% 2002 1 1%
69 100%

40
Table 2
Type of Alleged Accounting Fraud
Number % of FraudAccounts and Other Factors Involved in Fraud of Firms Sample Revenues 69 100%Accounts Receivable 50 72%Expenses 23 33%Other Assets 17 25%Inventory 11 16%Cost of Sales 8 12%Accounts Payable and Other Accrued Expenses 6 9%Debt 5 7%Other Gaines/Losses 2 3%Related Parties 3 4%Acquisitions and Mergers 4 6%Total 198 *
* Does not sum to the number of firms in the sample because of the dual-entry nature of accounting (i.e., early revenue recognition generates a fraudulent credit to revenue and debit to accounts receivable) and several firms are accused of engaging in multiple types of fraudulent behavior (e.g., manipulation of revenue and expenses).

41
Table 3
Types of Nonfinancial Measures Nonfinancial Measures Observations Employees 68 Capacity 28 Products 21 Mergers, Acquisitions and Subsidiaries 13 Customers 8 Miscellaneous 6 Total 144
We categorized the nonfinancial measures for information purposes. The employees category includes the number of employees listed on Compustat. Capacity includes measures such as capacity in tons, square footage of office or floor space, energy producing capacity, number of facilities or plants, and similar measures. Products generally includes number of products, cubic feet of gas sold or transported, lines of clothing, market capitalization, new products introduced during the year, export or purchase volume, patient visits or days, and patents. Mergers, acquisitions and subsidiaries includes the number of acquisitions, mergers or subsidiaries during the year. Customers includes the number of customers, largest customer as a percentage of revenue, number of retail outlets, and sales representatives. Miscellaneous includes items that did not fit into one of these categories such as web influence.
Table 4
Results of Regressing Employees on Revenue for all Firms on Compustat between 1993 and 2002.
OLS Parameter Variables Estimate t-value INTERCEPT 93.62 13.64 ***EMPLOYEES 197.81 462.91 *** R2 0.716 Sample Size 85,058
Significance Levels: ***<.01, **<.05 Model: REVENUEt = β0 + β1EMPLOYEESt; REVENUE is defined as total revenue in year t (Compustat Data #12). EMPLOYEES is defined as total employees in year t (Compustat Data #29). Variables are winzorized at the 99th and 1st percentile.
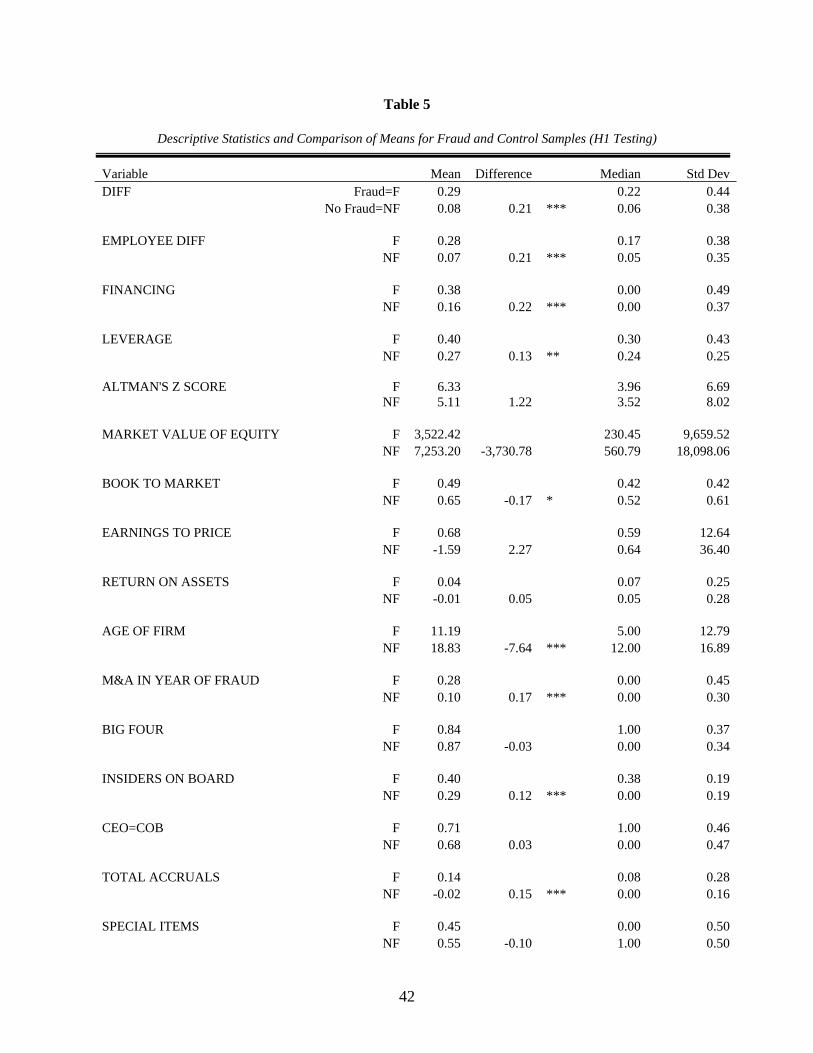
42
Table 5
Descriptive Statistics and Comparison of Means for Fraud and Control Samples (H1 Testing) Variable Mean Difference Median Std Dev DIFF Fraud=F 0.29 0.22 0.44 No Fraud=NF 0.08 0.21 *** 0.06 0.38 EMPLOYEE DIFF F 0.28 0.17 0.38 NF 0.07 0.21 *** 0.05 0.35 FINANCING F 0.38 0.00 0.49 NF 0.16 0.22 *** 0.00 0.37 LEVERAGE F 0.40 0.30 0.43 NF 0.27 0.13 ** 0.24 0.25 ALTMAN'S Z SCORE F 6.33 3.96 6.69 NF 5.11 1.22 3.52 8.02 MARKET VALUE OF EQUITY F 3,522.42 230.45 9,659.52 NF 7,253.20 -3,730.78 560.79 18,098.06 BOOK TO MARKET F 0.49 0.42 0.42 NF 0.65 -0.17 * 0.52 0.61 EARNINGS TO PRICE F 0.68 0.59 12.64 NF -1.59 2.27 0.64 36.40 RETURN ON ASSETS F 0.04 0.07 0.25 NF -0.01 0.05 0.05 0.28 AGE OF FIRM F 11.19 5.00 12.79 NF 18.83 -7.64 *** 12.00 16.89 M&A IN YEAR OF FRAUD F 0.28 0.00 0.45 NF 0.10 0.17 *** 0.00 0.30 BIG FOUR F 0.84 1.00 0.37 NF 0.87 -0.03 0.00 0.34 INSIDERS ON BOARD F 0.40 0.38 0.19 NF 0.29 0.12 *** 0.00 0.19 CEO=COB F 0.71 1.00 0.46 NF 0.68 0.03 0.00 0.47 TOTAL ACCRUALS F 0.14 0.08 0.28 NF -0.02 0.15 *** 0.00 0.16 SPECIAL ITEMS F 0.45 0.00 0.50 NF 0.55 -0.10 1.00 0.50

43
REVENUE GROWTH F 0.76 0.38 1.25 NF 0.42 0.33 0.15 1.17 TOTAL ASSETS F 3,109.54 127.37 10,235.76 NF 4,743.56 -1,634.02 453.00 9,782.71 NEGATIVE CHANGE IN NFM F 0.19 0.00 0.39 NF 0.23 -0.04 0.00 0.43 FRAUD SIZE / REVENUE F 0.12 0.05 0.20
Significance Levels: ***<.01, **<.05, *<.1 All variables are defined as follows: t = year of the fraud. DIFFt = ChgREVENUE – ChgNFM. ChgREVENUE= ((Revenuet – Revenuet-1) / Revenue t-1) and ChgNFM = ((NFMt – NFM t-1) / NFM t-1). NFM is Nonfinancial Measure. If a firm has more than one NFM, then we use the average ChgNFM to calculate DIFF. EMPLOYEE DIFF = ChgREVENUE – ChgEMPLOYEES. ChgEMPLOYEES = (Employeest – Employeest-1) / Employeest-1. FINANCING = An indicator variable coded 1 if the firms FREECASH is less than -0.5 and 0 otherwise. FREECASHt = (Cash Flow from Operationst - Average Capital Expenditurest-3 to t-1) / Current Assetst-1. LEVERAGE = (Short-Term Debtt + Long-Term Debtt) / Total Assetst. ALTMAN’S Z SCORE = 1.2X1 + 1.4X2 + 3.3X3 + .6X4 + 1.0X5. X1 = (Current Assetst – Current Liabilitiest) / Total Assetst. X2 = Retained Earningst / Total Assetst. X3 = Earnings before interest and taxest / Total Assetst. X4 = Market Value of Equityt / Book Value of Total Liabilitiest. X5 = Revenuet / Total Assetst. MARKET VALUE OF EQUITY = End-of-Year Share Pricet x Total Common Shares Outstandingt / Total Assetst. BOOK TO MARKET = (Total Assetst – Total Liabilitiest) / Market Value of Equityt. EARNINGS TO PRICE = Net Income before extraordinary itemst / End-of-Year Share Pricet. RETURN ON ASSETS = Net Income before extraordinary itemst / Total Assetst-1. AGE OF FIRM = The length of time in years the firm has been publicly traded (from the Center for Research in Security Prices [CRSP]). M&A IN YEAR OF FRAUD = An indicator variable set equal to 1 if the firm had an acquisition that contributed to sales in the prior year (acquisition in the first year of fraud for fraud firms). (Variable set equal to 1 if Compustat data #249 > 0, otherwise variable is set to 0.) BIG FOUR= An indicator variable set equal to 1 if the firm had a Big Four Auditor during the year of the fraud and 0 otherwise. INSIDERS ON BOARD = The percentage of insiders (company employees) on the Board of Directors. CEO=COB = An indicator variable coded 1 if the firm’s CEO was also Chairman of the Board and 0 otherwise. TOTAL ASSETS = Total Assetst. ACCRUALS = (Net Income before extraordinary itemst + Depreciationt – Cash Flow from Operationst ) / Total Assetst. SPECIAL ITEMS = An indicator variable set equal to 1 if the firm reported a special item (Compustat #17) and 0 otherwise. REVENUE GROWTH = (Salest – Salest-1) / Salest-1. NEGATIVE CHANGE IN NFM= An indicator variable set equal to 1 if the firm had a negative change in NFM, otherwise variable is set to 0. FRAUD SIZE / REVENUE = the size of the earnings restatement as a percentage of revenue after the fraud was discovered. All control variables are winzorized at the 99th and 1st percentile.
7

44
TABLE 6
Logistic Regression Comparing 69 Fraud Firms with 69 Matched Competitors (H2 Testing for DIFF)
Predicted Parameter Variables Sign Estimate p-value INTERCEPT -0.90 0.44 DIFF + 1.58 0.02 FINANCING + 1.24 0.14 LEVERAGE + 0.85 0.29 ALTMAN'S Z SCORE + -0.02 0.68 MARKET VALUE OF EQUITY ? 0.00 0.41 BOOK TO MARKET ? -0.39 0.55 EARNINGS TO PRICE ? 0.00 0.97 RETURN ON ASSETS ? 1.51 0.35 AGE OF FIRM - -0.03 0.13 M&A IN YEAR OF FRAUD + 1.51 0.02 BIG FOUR - 0.13 0.85 INSIDERS ON BOARD + 1.36 0.40 CEO=COB + 0.40 0.46 TOTAL ACCRUALS + 3.46 0.08 SPECIAL ITEMS + -0.18 0.70 SALES GROWTH + -0.51 0.05 TOTAL ASSETS ? 0.00 0.49 NEGATIVE CHANGE IN NFM + -0.05 0.94 Sample Size 138
This table presents the results of a logistic regression where the dependent variable is an indicator variable set equal to 1 for fraud firms accused of financial statement fraud and 0 otherwise. All Variables defined in Table 5. Predicted signs are adopted from the prior literature on fraud (e.g., Erickson et al. 2006) or posited in the text (e.g., DIFF).

45
TABLE 7
Logistic Regression Comparing 68 Fraud Firms with 68 Matched Competitors (H2 Testing for EMPLOYEE DIFF)
Predicted Parameter Variables Sign Estimate p-value INTERCEPT -0.97 0.43 EMPLOYEE DIFF + 2.07 0.01 FINANCING + 0.70 0.39 LEVERAGE + 0.76 0.34 ALTMAN'S Z SCORE + -0.01 0.91 MARKET VALUE OF EQUITY ? 0.00 0.40 BOOK TO MARKET ? -0.56 0.38 EARNINGS TO PRICE ? -0.01 0.67 RETURN ON ASSETS ? 0.77 0.64 AGE OF FIRM - -0.04 0.04 M&A IN YEAR OF FRAUD + 2.01 0.00 BIG FOUR - 0.40 0.58 INSIDERS ON BOARD + 0.60 0.75 CEO=COB + 0.70 0.23 TOTAL ACCRUALS + 4.88 0.03 SPECIAL ITEMS + -0.04 0.94 SALES GROWTH + -0.58 0.05 TOTAL ASSETS ? 0.00 0.40 NEGATIVE CHANGE IN NFM + 0.02 0.98 Sample Size 136
This table presents the results of a logistic regression where the dependent variable is an indicator variable set equal to 1 for fraud firms accused of financial statement fraud and 0 otherwise. All Variables defined in Table 5. Predicted signs are adopted from the prior literature on fraud (e.g., Erickson et al. 2006) or posited in the text (e.g., EMPLOYEE DIFF).