chapter 11 the quality of the questionnaire can affect response rate in a survey ... when serving as...
TRANSCRIPT
Chapter 11
DESIGNING QUESTIONNAIRES
413
Throughout this book, we have discussed methodological issues in the context of error andways to manage such error. At this point, we turn to the questions asked of respondents andconsider the sources of error due to the nature of the questions themselves, such as questionselection, structure, wording, order of presentation, and so on.
We begin by considering the dimensions of the questionnaire design process, focusing onexplaining the steps involved in designing a quality data collection instrument. Very simply,a quality instrument does two things: It accurately portrays to the respondent what is desiredby the researcher, and it accurately reports to the researcher information about the respondent.Many years ago, a practitioner stated that a questionnaire should be viewed as “spoken ques-tions that are put down on paper. A questionnaire is not a document—it’s a conversation.”This task, though simple in concept, is sometimes monumental in application. Properprocedures for developing a questionnaire are required, and these are based on several keyquestions and concerns:
1. What information do we need?
2. What type of data is required?
3. What questionnaire type is used to collect this data?
4. Develop question content, format, and phrasing.
5. Develop response format.
6. Sequence and layout the questionnaire.
7. Pretest the questionnaire.
8. Revise the questionnaire (Repeat 1–7).
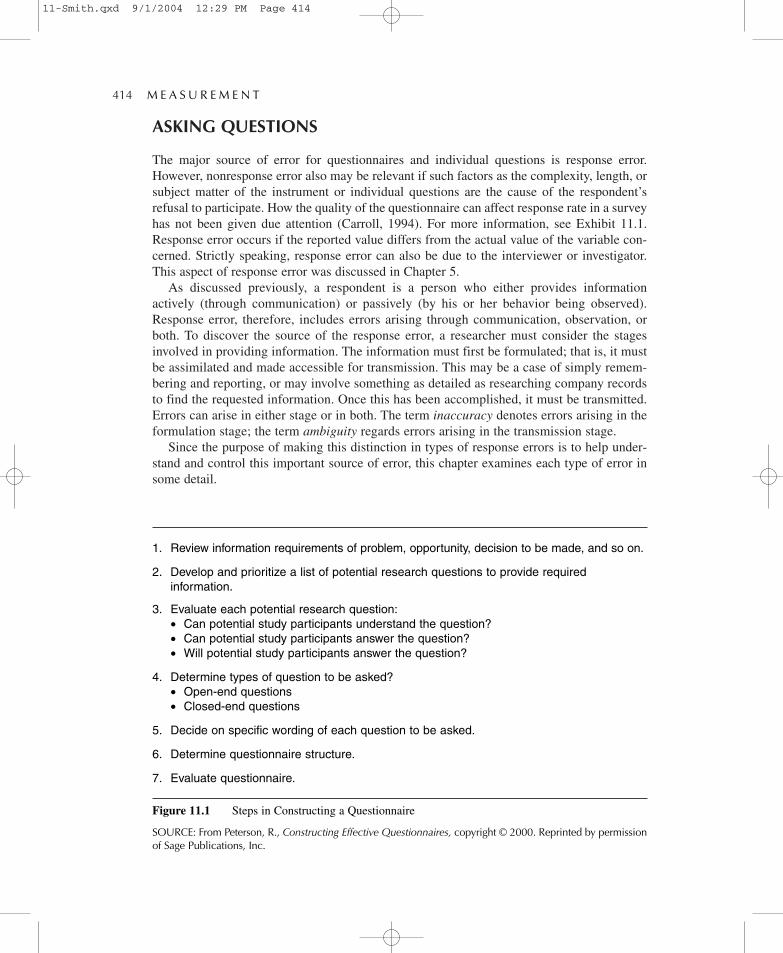
Peterson (2000, p. 14) summarizes the steps in questionnaire construction as shown inFigure 11.1.
11-Smith.qxd 9/1/2004 12:29 PM Page 413
ASKING QUESTIONS
The major source of error for questionnaires and individual questions is response error.However, nonresponse error also may be relevant if such factors as the complexity, length, orsubject matter of the instrument or individual questions are the cause of the respondent’srefusal to participate. How the quality of the questionnaire can affect response rate in a surveyhas not been given due attention (Carroll, 1994). For more information, see Exhibit 11.1.Response error occurs if the reported value differs from the actual value of the variable con-cerned. Strictly speaking, response error can also be due to the interviewer or investigator.This aspect of response error was discussed in Chapter 5.
As discussed previously, a respondent is a person who either provides informationactively (through communication) or passively (by his or her behavior being observed).Response error, therefore, includes errors arising through communication, observation, orboth. To discover the source of the response error, a researcher must consider the stagesinvolved in providing information. The information must first be formulated; that is, it mustbe assimilated and made accessible for transmission. This may be a case of simply remem-bering and reporting, or may involve something as detailed as researching company recordsto find the requested information. Once this has been accomplished, it must be transmitted.Errors can arise in either stage or in both. The term inaccuracy denotes errors arising in theformulation stage; the term ambiguity regards errors arising in the transmission stage.
Since the purpose of making this distinction in types of response errors is to help under-stand and control this important source of error, this chapter examines each type of error insome detail.
414— M E A S U R E M E N T
1. Review information requirements of problem, opportunity, decision to be made, and so on.
2. Develop and prioritize a list of potential research questions to provide requiredinformation.
3. Evaluate each potential research question:• Can potential study participants understand the question?• Can potential study participants answer the question?• Will potential study participants answer the question?
4. Determine types of question to be asked?• Open-end questions• Closed-end questions
5. Decide on specific wording of each question to be asked.
6. Determine questionnaire structure.
7. Evaluate questionnaire.
Figure 11.1 Steps in Constructing a Questionnaire
SOURCE: From Peterson, R., Constructing Effective Questionnaires, copyright © 2000. Reprinted by permissionof Sage Publications, Inc.
11-Smith.qxd 9/1/2004 12:29 PM Page 414

EXHIBIT 11.1 How to Affect Survey Response Rate Through Questionnaire Design
There are a few relatively simple things that can be done to a questionnaire to help stimulateresponse rates beyond the normal industry average.
First, at times, use nontraditional ways to structure questions on the questionnaire. Keep thequestions simple in appearance, but sophisticated. For example, if a researcher is interested in theimportance a respondent attaches to six factors that may have influenced a decision, instead ofusing a traditional rating scale for each factor, a constant sum scale can be used and the respon-dent asked to allocate, say, 100 points among the six factors to reflect importance.
Second, mix up response formats on the items you are asking respondents to complete. A ques-tionnaire that repeats the same response format over and over again can appear boring to arespondent. As we indicated in an earlier chapter, interest in a study can have a huge positiveimpact on response rates.
Third, never assume that respondents know what you want them to do with any question.Specific directions should be given for each group or section of items included in the questionnaire.
Fourth, pay particular attention to visual aspects of the questionnaire. Such issues as layout,typeface, shadings, using boxes where appropriate, and color of paper can affect whether a par-ticular respondent participates. Visual dimensions may vary by mode of data collection. Visualeffects are a form of nonverbal communication. Not only may response rates be affected, but thequality of collected data may also be affected (Sanchez, 1992).
Fifth, all items should be numbered. This can be done within each section, or, if the question-naire is relatively short, within the entire questionnaire itself. Doing this assists the respondent inself-report questionnaires and helps the interviewer in non–self-report questionnaires.
INACCURACY
Inaccuracy refers to errors made in the formulation of information. There are two types of inac-curacies: predictive and concurrent inaccuracies. Predictive inaccuracy, as a source of responseerror, is a special case caused by inaccurate intentions. Concurrent inaccuracy occurs when therespondent intentionally does not provide accurate information. Concurrent inaccuracies are amajor concern for many kinds of information obtained from respondents (information on pastbehavior, socioeconomic characteristics, level of knowledge, and opinion-attitude).
To explain predictive inaccuracy, suppose that a male respondent is asked, “Do you intendto buy a new automobile within the next six months?” His answers are limited to “Yes,” “No,”or “Uncertain.” A brief examination of possible answers and subsequent actions indicates thatthere are two different kinds of inaccuracies. If the respondent answers “Yes,” but really has nointention of buying a car within this period or, conversely, answers “No,” but does intend tobuy a car, then we may say that there is concurrent inaccuracy in his statement. Suppose, how-ever, that his present intention is to buy a new car; he so indicates in his answer, and then hedoes not, in fact, buy one within six months. Or, alternatively, he does not now intend to buy,he answers “No” to the question, and then buys a car within the six-month period. There isno concurrent inaccuracy in either case; the response has reflected the actual intention of theperson. The intention, however, was not followed. This situation is a predictive inaccuracy.
Designing Questionnaires— 415
11-Smith.qxd 9/1/2004 12:29 PM Page 415

A similar type of predictive inaccuracy can occur when marketing researchers try topredict actual market response to a price by asking consumers, “How much are you willingto pay for Product X?” Differences between predicted and actual purchases may occurbecause the true range of prices acceptable to the consumer may change between the time ofdata collection and the point of purchase for a number of reasons, such as budget constraintsor windfalls, the price of substitutes at point of purchase, search costs, and purchase urgency.
Now, let’s focus on concurrent inaccuracies and their sources. Both our everyday experi-ences and empirical evidence suggest that there are two basic sources from which inaccurateinformation may result:
• The inability of the respondent to provide the desired information• The unwillingness of the respondent to provide the desired information
In those instances where observation is used, this statement may also be applied to theobserver; the observer may be unable or unwilling to provide the desired information.
Inability to Respond
Even such a simple and straightforward question as “What is the model year of your familycar?” may result in an information-formulation problem, particularly if the car is several yearsold. If the additional question were asked, “What brand or brands of tires do you now haveon your car?” most respondents would have even more difficulty in providing an accurateanswer without looking at the tires. Finally, if respondents were asked, “What reasons did youhave for buying Brand A tires instead of some other brand?” most respondents would haveeven more difficulty in providing an accurate answer.
In addition to the two basic sources of inaccuracies, Semon (2000a, 2000b) reports thatthere are three major types of inaccuracies:
• Memory error: A respondent gives the wrong factual information because he or shesimply does not remember an event asked about. It may be due to underestimating or overes-timating the time that had elapsed since an event occurred. Better questionnaire and surveydesign can help reduce this error, but many proven techniques are not used because they addto the length of the survey. For instance, in a personal or telephone interview survey a follow-up call can be made to confirm the answers given.
• Ignorance error: This is due to research design in terms of question content and sam-pling. A question (or even an entire questionnaire) may be unrealistic, deficient, or directedto the wrong persons. If a potential respondent perceives the questionnaire, or individualquestions, to be irrelevant, it probably is.
• Misunderstanding: This can be a matter of careless question design. Poorly definedterms and words with different meanings can lead to inaccurate, or even deliberately falsifiedresponses. Proper question design would avoid words with multiple meanings and definitions,or would clearly define the context in which the word is being used in the questionnaire.
Respondents must be able to determine what is expected of them. Also, problems can arisewhen respondents are unfamiliar with the expected patterns of interaction involved in anyinterview situations. This can be especially important in international and multiculturalresearch. Exhibit 11.2 gives additional information.
416— M E A S U R E M E N T
11-Smith.qxd 9/1/2004 12:29 PM Page 416

EXHIBIT 11.2 Response Error and Questionnaire Design
One of the keys to minimizing concurrent errors is for researchers to better translate the clients’information needs into a set of practical questions that respondents can and will answer to thebest of their ability. When serving as senior vice-president of marketing at PepsiCo RestaurantsInternational, Dwight Riskey suggested that any marketing research question can be charted in atwo-by-two matrix by plotting the urgency and importance of the question (Murphy, 1997). Thismatrix breaks down into four categories:
• Important/urgent• Unimportant/urgent• Important/nonurgent• Unimportant/nonurgent
Questions falling in the first and last categories are easy to identify. It is the other two cate-gories that can cause most of the problems. Often, the urgent/unimportant questions are bestanswered by a judgment-call than by extensive research. In contrast, the important/nonurgentquestions are the ones that often need to be addressed. In the short run, a company will carry onwithout answers to these questions. But these answers may be essential to the long-term futuredirection of the company.
Unwillingness to Respond
When we move to the problem of unwillingness of respondents to provide accurate infor-mation, the topic is more complex. Here we are dealing with the motivations of people: whythey are not willing to accurately provide the information desired. No fully accepted generaltheory of motivation has yet emerged from the behavioral sciences to explain this behavior,other than general theoretical concepts that attempt to explain survey response behavior. Asdiscussed in Chapter 5, any or none of these might be applicable in any given situation. Thereis no conclusive evidence favoring one theory to the exclusion of the others. However, byagain applying everyday experiences to this problem, and adding some research findings andthe accumulated experiences of practitioners, several reasons are suggested why people maynot be willing to make accurate information accessible.
Except in those instances where the respondent provides information by being observed ina natural situation, there are always costs (negative utilities) attached to his or her formulat-ing information. The time required is one such cost that is always present. Others includeperceived losses of prestige and some degree of invasion of privacy.
When possible to do so, a respondent will tend to act in a manner that will reduce thesecosts. Such behavior will sometimes result in inaccurate information being provided.
Time Costs
Perhaps the most common reason for respondent unwillingness to provide accurateinformation, or any information for that matter, is the result of the time required to make the
Designing Questionnaires— 417
11-Smith.qxd 9/1/2004 12:29 PM Page 417
information available. A person may simply be busy and wish to complete the interview asquickly as possible. In this circumstance it is not unusual for the respondent to decide thatabrupt answers are the easiest and quickest way of terminating the interview. Rather thanreflecting on or verifying the information provided, the respondent gives hasty, ill-consideredanswers and resists probing if attempted, leading to inaccurate information. In addition, timepressures may lead respondents to not answer all questions, thus providing incomplete data.
Another aspect of the time dimension is that this potential respondent may not be in a“comfortable” position to provide the information at the time requested (he or she may havejust come home, sat down to a meal, have a child doing something, etc.). This arises for datacollection in telephone and personal interviews. Rather than asking “May I ask you somequestions?” as an introductory comment, it would seem preferable to ask, “Do you have timenow to answer questions, or would you rather set a time when I could contact you again?”Experience has shown this latter technique only slightly lowers response rates.
Perceived Losses of Prestige
When information involving the prestige of the respondent is sought, there is always atendency toward inaccurate formulation in the direction of the higher-prestige responses.Although all experienced researchers recognize this tendency, two problems remain:
1. Recognizing the items of information that the respondent will interpret as having pres-tige content
2. Measuring the resulting amount of inaccuracy
Information that affects prestige is often sensitive information.Some information items have prestige content associated with them by virtually all respon-
dents. Among these are such socioeconomic characteristics as age, income, educational level,and occupation. Other informational items, such as place of birth or residence, are more dif-ficult to identify as having prestige content. People who live in rural areas or in suburbs areprone to give the nearest city in answer to questions concerning where they live. In part, thisno doubt reflects a belief that the investigator would not otherwise recognize the locationgiven; it may also reflect a higher level of prestige associated with being born or living in alarge and well-known city.
An example of a still more subtle prestige association that resulted in a sizable error ininformation obtained is the experience of a marketing research firm that conducted a study onnationally known brands of beer. One of the questions asked was, “Do you prefer light or reg-ular beer?” The response was overwhelmingly in favor of light beer. Since sales data indicateda strong preference for regular beer, it was evident that the information was inaccurate.Subsequent investigation revealed that the respondents viewed people who drank light beer asbeing more discriminating in taste. They had, therefore, given answers that, in their view,were associated with a higher level of prestige.
Measuring the amount of inaccuracy is a difficult task. In the ideal case, it requires thatinformation be available on the item from sources external to the sample, and further, thatthese external data be more accurate than those obtained from the respondents. Clearly, inmost cases such data are not available; if there were, the information would not have beencollected from the respondents.
418— M E A S U R E M E N T
11-Smith.qxd 9/1/2004 12:29 PM Page 418

One solution to this problem is to ask for the information in two different ways. When oneis obtaining information on respondents’ ages, for example, it is a common practice to askearly in the interview, “What is your present age?” and later “In what year were you born?”or “In what year did you enter high school?” or “In what year did you graduate from highschool?” In one study, when respondents were asked, “Are you afraid to fly?” very few peopleindicated any fear of flying. In a follow-up study, when they were asked, “Do you think yourneighbor is afraid to fly?” (a technique known as the third-person technique), most of theneighbors turned out to have severe anxieties about flying.
A method used to obtain information about sensitive matters is the randomized-responsetechnique (Campbell & Joiner, 1973; Fox & Tracy, 1986; Reinmuth & Geurts, 1975). Whenusing this technique the investigator presents two questions, either of which can be answeredby a “Yes” or a “No,” one innocuous (“Were you born in May?”) and the other sensitive (“Didyou shoplift any items from the Downtown Mall during the month of December?”). Therespondent is asked to flip a coin or use a randomizing device (provided with the survey) toselect the question to answer. The respondent is instructed not to in any way communicate tothe interviewer which question was answered. Only the answer “Yes” or “No” is given.
The proportion of respondents who answered “Yes” to the sensitive question can beestimated from the formula
In the example, if the proportion of respondents who answered “Yes” is .06, the propor-tion born in May (determined from the Census of Population) is .08, and the probability ofanswering each question is .5, the estimated proportion who answered “Yes” to the shoplift-ing question would be
This is a point estimate of the (hypothetical) proportion of the population from which thesample was drawn who shoplifted at the place during the period specified.
This example of the randomized technique is simplified. There are approaches that can usea single question, but the mathematical and statistical properties tend to be more complex. Formost marketing applications, the two-question structure will work nicely. All that is neededis a suitable randomizing device (for which the investigator knows the relevant distributions)and knowledge of the distribution of responses to the innocuous question. Although this tech-nique is perhaps most easily administered in person, there have been approaches suitable fortelephone and mail administration, as shown in Exhibit 11.3 (Stem & Steinhorst, 1984).Umesh and Peterson (1991) provide an evaluation of this technique.
Invasion of Privacy
Clearly, some topics on which information is sought are considered to be private matters.When such is the case, both nonresponse and inaccuracy in the responses obtained can beanticipated. Matters about which respondents resent questions include money matters or
Designing Questionnaires— 419
11-Smith.qxd 9/1/2004 12:29 PM Page 419

finance, family, life, personal hygiene, political beliefs, religious beliefs, and even job oroccupation. Either indirect questions or the randomized-response technique can sometimes beused to avoid intrusion. If direct questions are used concerning such matters, they should beplaced as near the end of the questionnaire as other considerations permit.
It should be recognized, however, that invasion of privacy is an individual matter. Thus,what one person considers to be sensitive information may not be viewed that way by others.In fact, it has been suggested that researchers often view topics as sensitive that a majorityof respondents would not view as sensitive. Because the response to the way in which ques-tions are asked and the order in which they are asked will be affected by the “sensitivity” ofthe requested information, the investigator should attempt to determine sensitivity if it issuspected to be a problem. One way of handling this is adding questions in the pretest stagethat ask about the extent of sensitivity to topics and specific questions. A comprehensivetreatment of sensitive information and how to ask questions about it is given by Bradburnand Sudman (1979).
EXHIBIT 11.3 Randomized Response
One approach to administrating the randomized response approach to obtain sensitive infor-mation by mail and/or telephone involves the use of a spinner (the randomizing device) andquestionnaire. A cover (I) fits over a base (II) with instructions on the bottom (III) to form thedevice. This device may then be used with a questionnaire (IV).
I II
SOURCE: We are deeply indebted to Donald E. Stem, Washington State University, for allowing us to useillustrations of his spinner randomizing device. Reprinted with permission of Donald E. Stern, Jr.
420— M E A S U R E M E N T
2
2
1
4 4
10
3
2 0
YE
S
NO3
4
14
23
12
3
0
0
NONO
0
33
33
2
1213 NO
YES
2
2
1
32
0
4
4
1
NONO
1
3
1
33
0
3
07
YE
S
NO 8
3
5
34
0
3
015
NONO
3
4 1
25
9
3 00
NO
YES
0
2
6
32
1
4
411
NONO
A
B
C
11-Smith.qxd 9/1/2004 12:29 PM Page 420

Designing Questionnaires— 421
IIIINSTRUCTIONS
1. Place the spinner in front of you on a flat surface such as a table.
2. With one hand holding down the spinner, flip the disk with the other hand hard enoughso that it spins rapidly.
3. Each question on the questionnaire will indicate which window to use for that particularquestion. When the disk stops, look in the window assigned for that question. • If the arrow lands on a shaded area, enter your actual answer to the question on the
questionnaire. • If the arrow lands on a lettered or numbered area, enter the randomly assigned answer.
(YES, NO, 1, 2, 3, etc.) • If the answer lands on a line, answer according to the numbered, lettered, or shaded area
to the left of the line.
4. When you repeat the process for the next question, always start from the last stoppingpoint. (Do not spin from the same starting point each time.)
IVFor Questions 1 through 20 use Window C on the spinner
1. Do you currently maintain a ‘prospect locator’ or ‘bird dog’? That is, someone you willpay a fee to if that person sends you a customer that results in a sale?
WINDOW C Yes No
2. Do you regularly use direct mail as a reminder to past customers that you would like theirbusiness again?
WINDOW C Yes No
For Questions 21 through 29 use Window A on the spinner
21. How many times within the past year have you knowingly misrepresented a vehicle’swarranty in order to close a sale?
WINDOW A Times
22. How many times in the last year have you ‘low balled’ a customer?WINDOW A Times
For Questions 30 through 34, use Window B on the spinner. If the arrow lands on 1, markthe answer labeled one (1); If it lands on 2, mark the answer labeled two (2); and so on.If the arrow lands on the shaded area, please answer the question truthfully by checkingthe best space provided.
30. Do you agree that the average automobile salesperson is trusted by the buying public?Window Strongly Agree Neither Disagree Strongly
B Agree Agree nor DisagreeDisagree
(1) (2) (3) (4) (5)
(Continued)
11-Smith.qxd 9/1/2004 12:29 PM Page 421

AMBIGUITY
Ambiguity may be defined as the errors made in interpreting spoken or written words or behav-ior. Ambiguity, therefore, occurs in the transmission of information, through either communi-cation or observation.
Ambiguity in Communication
Ambiguity is present in all languages. Unambiguous communication in research requiresthat the question asked and the answers given each mean the same thing to the questioner andthe respondent. A two-step process is therefore involved:
1. Question as understood by respondent is same as question as understood by questioner
2. Answer as understood by questioner is same as answer as understood by respondent
The first step in this process is the controlling one. If the question is not clearly understoodby the respondent, frequently the answer will not be clearly understood by the questioner. Toillustrate this point, in an actual research project on tomato juice, the question
422— M E A S U R E M E N T
Another approach to randomized response by mail is to have the randomizing device built-in thequestionnaire itself. The following questionnaire illustrates this approval:
Do you have a telephone in your family unit? Yes No
1. Your telephone number is of the form 7 _ _ - W X Y Z. If the digit in the W position is0, 1, or 2, check Agree; if it’s 3, 4, 5, 6, 7 or 8, respond to the statement; if it’s 9, check Disagree.
Manufacturers should be doing more to encourage the recycling of containers andmaterials that would otherwise be tossed onto the trash pile, even if this means an increasein the price of their products.
Agree Disagree No response
2. Your telephone number is of the form 7 _ _ - W X Y Z. If the digit in the X-position is0 or 1, check True; if it’s 2, 3, 4, 5, 6, 7 or 8, respond to the statement; if it’s 9, check False.
I deposit recyclable materials such as newspapers, aluminum containers, glass containers,etc. on a regular basis at an appropriate recycling center.
True False No response
3. Your telephone number is of the form 7 _ _ - W X Y Z. If the digit in the Y position is0 or 1, check True; if it’s 2, 3, 4, 5, 6, 7 or 8, respond to the statement; if it’s 9, check False.
I make a conscious effort at conserving fuel by a cutback in my home thermostat settingand/or a reduction in my use of automobile gasoline.
True False No response
4. Your telephone number is of the form 7 _ _ - W X Y Z. If the digit in the Z position is0 or 1, check Agree; if it’s 2, 3, 4, 5, 6, 7 or 8, respond to the statement; if it’s 9, check Disagree.
The current welfare program plays an important as well as beneficial role in our society.Agree Disagree No response
11-Smith.qxd 9/1/2004 12:29 PM Page 422

Do you like tomato juice?
Yes No Neither like nor dislike
was changed, after pretesting, to
Do you like the taste of tomato juice?
Yes No Neither like nor dislike
Even a careful reading of these two questions may not disclose any real difference intheir meaning. The analyst who drew up the question assumed that “like” refers to taste. Inpretesting, however, it was discovered that some housewives answered “Yes” with otherreferent in mind. They “like” the amount of Vitamin C their children get when they drinktomato juice, they “liked” the tenderizing effect that tomato juice has when used in cook-ing of meat dishes, and so on. If the wording of the question had not been changed, therewould have been a complete misunderstanding in some cases of the simple, one-wordanswer “Yes.”
A related issue is one where implicatures are added to questions by respondents (Barnes, Jr.& Dotson, 1989). A receiver of a message in any communication is expected to take what issaid, along with what is inferred, and derive what is implicated. One source of implicaturesis the use of elliptical sentence structure. An elliptical sentence is a shortened form of othersentences. When such a sentence is used, something that is sought is left out. Examples are,“How come?,” “What?,” and “How?” The respondent of a questionnaire, after reading anelliptical sentence, first considers the context of the sentence and then adds the missing parts.When the mental process of transformational rule is the same in both researcher and respon-dent, communication occurs unambiguously. If the process differs, communication is lost andinterpretation of a person’s response is faulty and ambiguity exists.
The understanding of questions is an issue that goes beyond ambiguity. All too often arespondent may not understand a question, but may have no opportunity to request clarification.In mail and online surveys, the extreme response is to not respond at all. In telephone or per-sonal interview settings, the more captive individual might participate even though specificquestions or topics are not fully understood. The quality of such data, of course, would be highlyquestionable. However, the mode of interviewing might be used to mitigate this potential prob-lem. Most personal and telephone interviewing uses standardized interviewing, in which theinterpretation of questions is left up to the respondent. The interviewer is not permitted toanswer any query raised. In contrast, in conversational interviewing the interviewer shouldanswer the respondent’s query with whatever words it takes to help the respondent understandthe question from the survey designer’s perspective, without unduly influencing the response.One interesting approach taken in online surveys by www.surveypro.com, www.surveyz.com,and www.perfectsurveys.com is to use context-sensitive help. The respondent can click on it toreceive further clarification or instruction for a given question. In a recent study of householdsusing telephone interviewing, Conrad and Schober (2000) found that compared to strictly stan-dardized interviewing, conversational interviewing improved respondents’ comprehension ofquestions, but at a cost; the time to complete an interview was lengthened. Depending upon theparticular questionnaire, this may be a small price to pay for better understanding.
How serious a problem ambiguity represents is subjective. A study conducted morethan 20 years ago using telephone interviews reported a 74.9 percent incidence of question
Designing Questionnaires— 423
11-Smith.qxd 9/1/2004 12:29 PM Page 423

understanding, and this understanding varied systematically with the socioeconomiccharacteristics of respondents (Peterson, Kerin, & Sabertehrani, 1982). The danger, of course,lies in having a “significant” incidence of question misunderstanding but not knowing it. Thus,examining question understanding should be a part of every survey whenever possible. Used inthis manner it can help interpret and gain further insights into the data (Exhibit 11.4).
The question both initiates and gives direction to the communication process in research. Inaddition, the form and wording of the question, unlike that of the answer, can be completelycontrolled by the researcher. It is not surprising, therefore, that a large number of investigationshave been carried out on both the form and wording of questions. It is appropriate that weconsider both question form and question wording and their relationships to ambiguity.
EXHIBIT 11.4 Using “Question Understanding” for Explanation
From these data, several percentages can be calculated. For example, while 65.1 percent of thetotal sample agreed with the statement, 61.8 percent of the males and 68.4 percent of the femalesagreed. But the data reveals more specific interpretations:
• Of the males whose question understanding was “good,” 59.2 percent agreed.• Of the males whose question understanding was “fair/poor,” 74.4 percent agreed.• Of the females whose question understanding was “good,” 66.1 percent agreed.• Of the females whose question understanding was “fair/poor,” 72.9 percent agreed.
Generally, of the survey participants whose question understanding was “good,” 62.3 percentagreed with the statement. Hence, in certain instances question understanding can be used toenhance the interpretation of, and even, to a limited extent, “explain” item responses.
(Peterson, Kerin, & Sabertehrani, 1982)
424— M E A S U R E M E N T
QuestionResponse
Understanding Agree Uncertain Disagree Total
MALE RESPONDENTS:
Good 447 10 332 839
Fair/poor 128 11 33 172
FEMALE RESPONDENTS:
Good 453 17 215 685
Fair/poor 248 20 72 340
TOTAL 1326 58 652 2036
Consider the data below, which are raw responses to the question “Government regulation isnecessary to protect and improve the quality of life.”
11-Smith.qxd 9/1/2004 12:29 PM Page 424

Forms of Questions and Answers
Underlying every question is a basic reason for asking it. If the reason for it is clear whenconstructing a question, there is a higher probability that the desired response will beobtained. Table 11.1 shows nine different types of questions (based on the nature of content),the broad reason underlying asking each type of question, and some examples of each type.Based on this structure, and the information in Table 11.2, which deals with standard answerformats, we are able to distinguish four basic question/answer types:
1. Free-answer (open-ended text)
2. Dichotomous and multiple choice answers (select k of n)
3. Rank order answers
4. Constant sum answers
Free Answer or Open-Ended Text Answers
The free answer (or open-ended text question) is, as the name implies, a question that has nofixed alternatives to which the answer must conform. The respondent answers in his or her ownwords and at the length he or she chooses, subject of course to any limitations imposed by thequestionnaire itself. Interviewers are usually instructed to make a verbatim record of the answer.
An example of a free-answer question in the tomato-juice study already referred to is
What suggestions could you make for improving tomato juice?
The suggestions made included packaging it in glass containers, finding some way to keepit from separating, and improving the flavor by adding lemon juice, salt, or hot spices.
Free-answer questions are usually shorter than multiple-choice and dichotomous questions.A corollary characteristic is that free-answer questions are also invariably less complex in sen-tence structure than multiple-choice questions on the same issue, and are usually less complexthan dichotomous questions.
Common sense suggests, and reading tests have confirmed, that short and simply struc-tured sentences are more easily understood than long and complex ones. The tendency towardambiguity of the long and complex sentence is accentuated, if anything, by listening to itrather than reading it. Further, there would seem to be no reason to believe that the findingswould be any different for question than for declarative statements. Based on these premises,we should be on reasonably sound grounds for drawing inferences about the relative proba-bility of ambiguity in questions and answers based on length and complexity of structure.
Free-answer questions place greater demands on the ability of the respondents to expressthemselves. As such, this form of question provides the opportunity for greater ambiguity ininterpreting answers. To illustrate, consider the following verbatim transcript of one femalerespondent’s reply to the question
What suggestions could you make for improving tomato juice?
“I really don’t know. I never thought much about it. I suppose that it would be nice ifyou could buy it in bottles because the can turns black where you pour the juice out afterit has been opened a day or two. Bottles break, though.”
Designing Questionnaires— 425
11-Smith.qxd 9/1/2004 12:29 PM Page 425

Should the conclusion be drawn that she had “no suggestion,” “suggested packaging in aglass container,” or “suggested that some way be found to prevent the can from turning blackaround the opening?” Note that she seems to have made the implicit assumption that thebottle would not turn black around the opening.
One way to overcome some of these problems, at least in personal and telephone surveys,is to have interviewers probe respondents. When this is done, primary concern should be forprobing for clarity rather than additional information. One practitioner has gone so far as tosuggest that questionnaires should clearly instruct interviewers to probe only once for addi-tional information, and to continue to probe for clarity until the interviewer understands arespondent’s reply.
From the criteria previously stated, we may tentatively conclude that the free-answer questionprovides the lowest probability of the questions being ambiguous, but the highest probability ofthe answers being ambiguous, compared with the other two question forms (see Exhibit 11.5).
426— M E A S U R E M E N T
Table 11.1 Basic Question Types
Type of Question Goal of Question Positioning of Question
Factual or behavioral To get information. Questions beginning withwhat, where, when, why, whoand how.
Explanatory To get additional information or How would that help? How wouldto broaden discussion. you go about doing that? What
other things shouldbe considered?
Attitudinal To get perceptions, motivations, What do you believe to be the feelings, etc., about an object or topic. best? How strongly do you feel
about XYZ?
Justifying To get proof to challenge old ideas How do you know? What makesand to get new ones. you say that?
Leading To introduce a thought of your own. Would this be a possible solution?What do you think of this plan?
Hypothetical To use assumptions or suppositions. What would happen if we didit this way? If it came in bluewould you buy it today?
Alternative To get a decision or agreement. Which of these plans do you thinkis best? Is one or two o’clockbest for you?
Coordinative To develop common agreement. Do we all agree that this is ourTo take action. next step?
Comparative To compare alternatives or to get a Is baseball more or less excitingjudgment anchored by another item. to watch on TV than soccer?
11-Smith.qxd 9/1/2004 12:29 PM Page 426
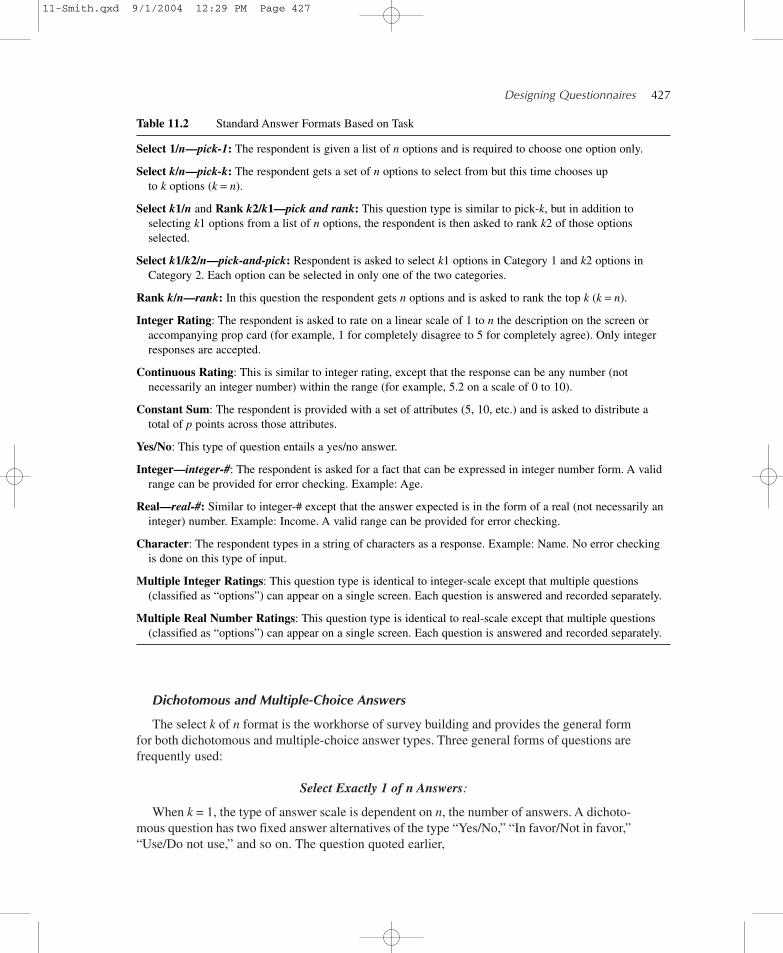
Dichotomous and Multiple-Choice Answers
The select k of n format is the workhorse of survey building and provides the general formfor both dichotomous and multiple-choice answer types. Three general forms of questions arefrequently used:
Select Exactly 1 of n Answers:
When k = 1, the type of answer scale is dependent on n, the number of answers. A dichoto-mous question has two fixed answer alternatives of the type “Yes/No,” “In favor/Not in favor,”“Use/Do not use,” and so on. The question quoted earlier,
Designing Questionnaires— 427
Table 11.2 Standard Answer Formats Based on Task
Select 1/n—pick-1: The respondent is given a list of n options and is required to choose one option only.
Select k/n—pick-k: The respondent gets a set of n options to select from but this time chooses upto k options (k = n).
Select k1/n and Rank k2/k1—pick and rank: This question type is similar to pick-k, but in addition toselecting k1 options from a list of n options, the respondent is then asked to rank k2 of those optionsselected.
Select k1/k2/n—pick-and-pick: Respondent is asked to select k1 options in Category 1 and k2 options inCategory 2. Each option can be selected in only one of the two categories.
Rank k/n—rank: In this question the respondent gets n options and is asked to rank the top k (k = n).
Integer Rating: The respondent is asked to rate on a linear scale of 1 to n the description on the screen oraccompanying prop card (for example, 1 for completely disagree to 5 for completely agree). Only integerresponses are accepted.
Continuous Rating: This is similar to integer rating, except that the response can be any number (notnecessarily an integer number) within the range (for example, 5.2 on a scale of 0 to 10).
Constant Sum: The respondent is provided with a set of attributes (5, 10, etc.) and is asked to distribute atotal of p points across those attributes.
Yes/No: This type of question entails a yes/no answer.
Integer—integer-#: The respondent is asked for a fact that can be expressed in integer number form. A validrange can be provided for error checking. Example: Age.
Real—real-#: Similar to integer-# except that the answer expected is in the form of a real (not necessarily aninteger) number. Example: Income. A valid range can be provided for error checking.
Character: The respondent types in a string of characters as a response. Example: Name. No error checkingis done on this type of input.
Multiple Integer Ratings: This question type is identical to integer-scale except that multiple questions(classified as “options”) can appear on a single screen. Each question is answered and recorded separately.
Multiple Real Number Ratings: This question type is identical to real-scale except that multiple questions(classified as “options”) can appear on a single screen. Each question is answered and recorded separately.
11-Smith.qxd 9/1/2004 12:29 PM Page 427

Do you like the taste of tomato juice?
is an example of a dichotomous question. Multiple-choice questions are simply an exten-sion of the dichotomous question that have more answer points and often take the form of anordered or interval measurement scale.
EXHIBIT 11.5 Open-Ended Questions and Answers
The advantages of the open-ended format are considerable, but so are its disadvantages (Sudmanand Bradburn, 1982). In the hands of a good interviewer, the open format allows and encouragesrespondents to give their opinions fully and with as much nuance as they are capable of. It alsoallows respondents to make distinctions that are not usually possible with the fixed alternativeformats, and to express themselves in language that is comfortable for them and congenial totheir views. In many instances it produces vignettes of considerable richness and quotable mate-rial that will enliven research reports.
The richness of the material can also be a disadvantage if there is need to summarize thedata in concise form. One example is the need to reduce the complexity of the data to fewer orsimpler categories and in order to place the data into categories that can be counted. Coding offree-response material is not only time consuming and costly, but also introduces some amountof coding error. This is known as content analysis.
Open-ended questions also take somewhat more time to answer than closed questions. Theyalso require greater interviewer skill to recognize ambiguities of response and to probe and drawrespondents out, particularly those who are reticent and not highly verbal, to make sure that theygive answers that can be coded. Open-ended response formats may work better with telephoneinterviews, where a close supervision of interview quality can be maintained, although there is atendency for shorter answers to be given on the telephone. No matter how well controlled the inter-viewers may be, however, factors such as carelessness and verbal facility will generate greater indi-vidual variance among respondents than would be the case with fixed alternative response formats.
In general, the free-response format requires more psychological work on the part of respon-dents; that is, respondents must think harder about the question and pay more attention to what isbeing asked and marshal their thoughts in order to respond to the interviewers’ questions. If thequestion comes more or less out of the blue, the respondent’s thoughts will not be organized andmay emerge somewhat haphazardly and in a confused fashion. What is reported first, however,may be important to the investigator as an indicator of the saliency of issues or the importance ofthings to the respondents.
SOURCE: From Sudman, S. & Bradburn, N., Asking Questions: A Practical Guide to Questionnaire Design,copyright © 1982. This material is used by permission of John Wiley & Sons, Inc.
Traditional multiple–choice questions also are of the select k of n answer form, but havemore than two possible answers. For example, an agreement scale could have three, five, orseven possible answers.
Three answers: Agree/Neutral/Disagree
Five answers: Strongly Agree/Agree/Neither/Disagree/Strongly Disagree
Seven answers: Very Strongly Agree/SA/A/N/D/SD/Very Strongly Disagree
428— M E A S U R E M E N T
11-Smith.qxd 9/1/2004 12:29 PM Page 428

As with all select k of n answers, the specific text associated with the answer optionsis variable and could measure many different constructs such as affect (liking), satisfaction,loyalty, purchase likelihood, and so forth.
Select Exactly k of n Answers
When questions are developed that accept or require multiple responses within a set ofanswers, the form “exactly k of n” or “as many as k of n” can be used. This general form asksthe respondent to indicate that several answers meet the requirements of the question. In the“exactly” case, questions can be formatted to require “exactly” k answers, (where k is greaterthan 1), as when the respondent is asked to “select the best three of the 10 possible answers”(in other words, select exactly three of 10). This type of question might be
Please identify the three (3) of the following service activities that are most likely to beoutsourced in the next 12 months.
� Retirement benefits � Recruitment
� Medical benefits � Security services
� Health services/medical � Training, education
� Management/Executive selection � Travel services
� Organization development � Work/Life programs
Select as Many as k of n Answers
A variable number of answers may also be appropriate, particularly where long lists ofattributes or features are given. In these cases, the respondent is asked to select as many ask of the n possible answers, where k can be any number from 2 to n. For example, in theprevious question, the respondent could select as many as three (one, two, or three) of 10possible answers. The question might be reworded to read something like
Please identify which service activities are most likely to be outsourced in the next12 months (check all that apply).
Rank-Order Questions/Answers
As discussed in Chapter 9, rank-order questions increase the power of the measurementscale by including the characteristic of order to the data. Whereas the categorical data asso-ciated with many dichotomous or multiple-choice items does not permit us to say that oneitem is greater than another, rank-order data allows for the analysis of differences. Rank-orderquestions use an answer format that requires the respondent to assign a rank position for thefirst, second, and so forth up to the nth item to be ordered. This format of assigning positionnumbers can be very versatile, resulting in different types of questions that can be asked.Respondents may be asked to rank a specified subset from the list (such as their first, second,and third choices from a list), or to rank all items in the list. Typical questions might includeidentifying preference rankings, attribute association strength, first to last, most recent to leastrecent or relative position (most, next most, and so forth, until either a set number of items isordered or all items may be ordered).
Designing Questionnaires— 429
11-Smith.qxd 9/1/2004 12:29 PM Page 429
When this type of question is administered online or using a CATI system, additionaloptions for administration may exist, including randomization and acceptance/validation ofties in the ranking. Randomization of the answer order helps to control for presentation orderbias. It is well established that in elections, being the first on the list increases chances ofreceiving the voter’s election. Similar bias occurs in questions where the same answer appearsat the top of the list for each respondent, and is controlled by presenting the choice options ina different random order for each respondent.
Tied rankings are another issue to be considered when a rank-order question is con-structed. When ties are permitted, several items may be evaluated as having the same rank. Ingeneral, this is not a good idea because it weakens the data. However, if ties truly exist, thenthe ranking should reflect this. Rank-order questions are generally a difficult type of questionfor respondents to answer, especially if the number of items to be ranked goes beyond fiveor seven.
Constant Sum Questions/Answers
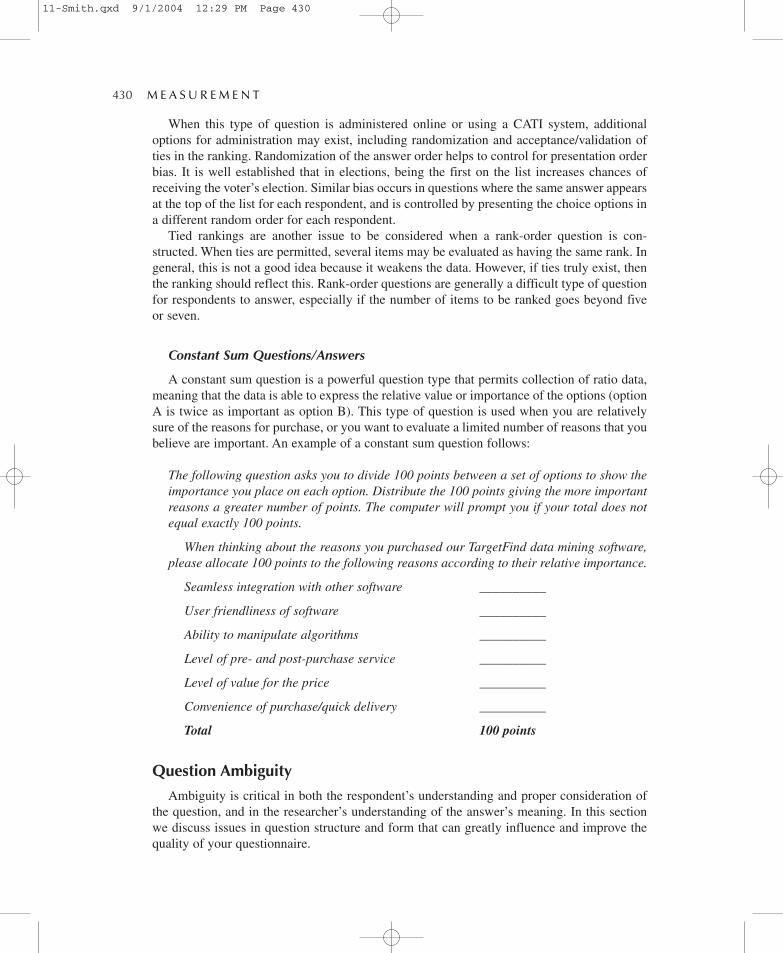
A constant sum question is a powerful question type that permits collection of ratio data,meaning that the data is able to express the relative value or importance of the options (optionA is twice as important as option B). This type of question is used when you are relativelysure of the reasons for purchase, or you want to evaluate a limited number of reasons that youbelieve are important. An example of a constant sum question follows:
The following question asks you to divide 100 points between a set of options to show theimportance you place on each option. Distribute the 100 points giving the more importantreasons a greater number of points. The computer will prompt you if your total does notequal exactly 100 points.
When thinking about the reasons you purchased our TargetFind data mining software,please allocate 100 points to the following reasons according to their relative importance.
Seamless integration with other software __________
User friendliness of software __________
Ability to manipulate algorithms __________
Level of pre- and post-purchase service __________
Level of value for the price __________
Convenience of purchase/quick delivery __________
Total 100 points
Question Ambiguity
Ambiguity is critical in both the respondent’s understanding and proper consideration ofthe question, and in the researcher’s understanding of the answer’s meaning. In this sectionwe discuss issues in question structure and form that can greatly influence and improve thequality of your questionnaire.
430— M E A S U R E M E N T
11-Smith.qxd 9/1/2004 12:29 PM Page 430

Neutrality and Don’t Know or No Opinion
When a third alternative “Neither like nor dislike” is added to the example dichotomousquestion discussed previously, it becomes multiple choice and allows for those people whodo not have a definite liking or disliking for tomato juice.
Do you like the taste of tomato juice?
� Yes � No � Neither
It is usually desirable to provide a category of this type to avoid forcing the respondentto make a definite stand when he or she may really be neutral. Similarly, it may be desirableto add other types of categories such as “don’t know,” “no opinion,” or “not applicable,” asthe nature of the question and question format dictates. For example, “don’t know” wouldapply to a question dealing with fact, whereas “no opinion” would apply to an attitude.Unfortunately there is a tendency to treat neutral, no opinion and don’t know responses asindicating the same thing, something they obviously do not.
One potential problem with offering a “don’t know” or “no opinion” option is that a falsenegative error may arise. This type of error occurs when a respondent reports not having anattitude when he or she really does have one. Quite often people who appear on first glanceto have no attitude turn out to take a position if they are asked other questions on the sametopic (Gilljam & Granberg, 1993). Attitudes that turn up only on the follow-up questions maybe used to predict behavior to a significant degree. It is possible, however, that people whoappear to have attitudes because of what they say on the follow-up questions may be guiltyof creating a false positive error—this is created by the researcher’s persistence. A false pos-itive error occurs when a person appears to have an attitude when he or she really does not.So, offering a “don’t know” option can lead to a reduced incidence of false positives. In addi-tion, use of filter questions and easy-out alternatives also can lower the number of false pos-itives. Filter questions are used to sort out respondents for whom detailed follow-up questionsmay not apply and therefore should not be asked (Knauper, 1998). A risk with using a filterquestion is that there will be an underreporting of events in which the researcher is interested;for example, more respondents are filtered out than intended as a more extreme questionmeaning has been conveyed. It is clear that protecting against false positives and false nega-tives seem to be counter to each other. There is no evidence that one of these errors is gener-ally more serious than the other.
There is some evidence that offering a “no-opinion” response in attitudinal studies doesnot improve the quality of the data obtained (Krosnick et al., 2002). The over-time consis-tency of attitudes does not increase, nor does the statistical predictability of obtainedresponses. The idea that “no opinion” options discourage respondents from providing mean-ingless answers to survey questions is highly questionable. Many, and perhaps most, respon-dents who choose an explicitly offered “no opinion” response option may have meaningfulattitudes, but the possibility that some people do so because they truly do not have attitudescannot be dismissed (Krosnick et al.). Where does this leave us? It appears that offering a “noopinion” (or “don’t know” where applicable) option does not improve things, but it also doesnot appear to make things worse. One impact is that the probably effective sample size willbe decreased, leading to reduced statistical power. But for researchers who prefer to offer a“no opinion” option, two things can be done to compensate for this. First, the original sample
Designing Questionnaires— 431
11-Smith.qxd 9/1/2004 12:29 PM Page 431

size can be increased. Second, respondents who say they have no opinion can then be askedif they lean toward one of the substantive response options (Krosnick et al.). Use of the “noopinion” and “don’t know” options appears to be a matter of researcher preference.
Dichotomous Questions
In terms of length and complexity of structure, the dichotomous question falls between thefree-answer questions (shortest and least complex) and the multiple-choice questions (longestand most complex). The dichotomous question places the least demands on the respondentin terms of formulating and expressing an answer. With respect to ambiguity in dichotomousquestions, therefore, we may tentatively conclude that this form of question provides roughlyan average probability of the question’s being ambiguous, but the lowest probability of theanswer’s being ambiguous, compared with the other two forms.
Multiple-Choice Questions
The multiple-choice question provides several set alternatives for the answer to it. In thisrespect it is in the middle ground between the free-answer and the dichotomous question.
Below is an example of the multiple-choice type of question from the tomato juice study:
Why do you use the brand you do?
� It is reasonably priced
� I like the taste
� The brand I’m used to and rely on
� Other reason
It should be noted that this question could have been asked as a free-answer question, and asa series of dichotomous questions. The choice between the free-answer and the multiple-choiceforms of asking a question must always be made if the same question is not asked in both forms.
The multiple-choice question must be longer and more complex than either the free-answer or dichotomous questions in order to state the several alternatives. The statement ofthe alternatives is provided to assist the respondent in recalling and in formulating his or heranswer. In giving this assistance, however, added opportunities to misunderstand the questionare also provided.
A common source of ambiguity in the multiple-choice question is the difficulty of makingthe alternatives mutually exclusive. In the above example this requirement was met reason-ably well. (It might be argued, however, that one would have to be “used to” and be able to“rely on” the taste’s being consistently the same in order to give the “taste” alternative as theanswer.) Another common source of ambiguity in multiple-choice questions is the impliedrestriction on alternatives. The example strongly implies that the respondent should have asingle, most important reason for using the brand. This may very well not be the case.
In attempting to reduce the burden of respondents, self-report questionnaires often use thetechnique of asking respondents to examine a list of items and mark, circle, or check all thatapply. This is useful in asking about alternative behaviors, attitudes, influencing factors, andso forth. For example, in a study done by Money magazine in the mid-1990s, one questionasked used the technique described above:
432— M E A S U R E M E N T
11-Smith.qxd 9/1/2004 12:29 PM Page 432
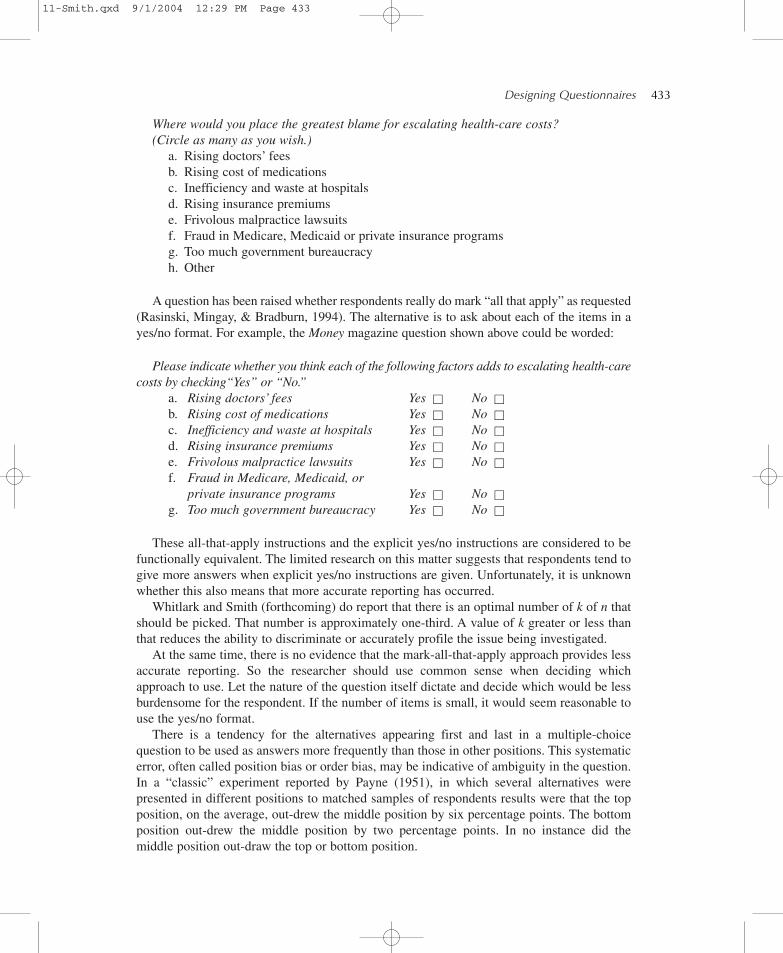
Where would you place the greatest blame for escalating health-care costs?(Circle as many as you wish.)
a. Rising doctors’ feesb. Rising cost of medicationsc. Inefficiency and waste at hospitalsd. Rising insurance premiumse. Frivolous malpractice lawsuitsf. Fraud in Medicare, Medicaid or private insurance programsg. Too much government bureaucracyh. Other
A question has been raised whether respondents really do mark “all that apply” as requested(Rasinski, Mingay, & Bradburn, 1994). The alternative is to ask about each of the items in ayes/no format. For example, the Money magazine question shown above could be worded:
Please indicate whether you think each of the following factors adds to escalating health-carecosts by checking“Yes” or “No.”
a. Rising doctors’ fees Yes No b. Rising cost of medications Yes No c. Inefficiency and waste at hospitals Yes No d. Rising insurance premiums Yes No e. Frivolous malpractice lawsuits Yes No f. Fraud in Medicare, Medicaid, or
private insurance programs Yes No g. Too much government bureaucracy Yes No
These all-that-apply instructions and the explicit yes/no instructions are considered to befunctionally equivalent. The limited research on this matter suggests that respondents tend togive more answers when explicit yes/no instructions are given. Unfortunately, it is unknownwhether this also means that more accurate reporting has occurred.
Whitlark and Smith (forthcoming) do report that there is an optimal number of k of n thatshould be picked. That number is approximately one-third. A value of k greater or less thanthat reduces the ability to discriminate or accurately profile the issue being investigated.
At the same time, there is no evidence that the mark-all-that-apply approach provides lessaccurate reporting. So the researcher should use common sense when deciding whichapproach to use. Let the nature of the question itself dictate and decide which would be lessburdensome for the respondent. If the number of items is small, it would seem reasonable touse the yes/no format.
There is a tendency for the alternatives appearing first and last in a multiple-choicequestion to be used as answers more frequently than those in other positions. This systematicerror, often called position bias or order bias, may be indicative of ambiguity in the question.In a “classic” experiment reported by Payne (1951), in which several alternatives werepresented in different positions to matched samples of respondents results were that the topposition, on the average, out-drew the middle position by six percentage points. The bottomposition out-drew the middle position by two percentage points. In no instance did themiddle position out-draw the top or bottom position.
Designing Questionnaires— 433
11-Smith.qxd 9/1/2004 12:29 PM Page 433
This problem can be solved satisfactorily in most cases by rotating the order of thealternatives. This may be done by printing cards for each of the desired different orders of alter-natives and instructing the interviewers to use the cards in a prescribed sequence. For mail orother self-report instruments, rotation means that different questionnaires must be prepared.Practical and economic considerations will limit the extent to which this can be done. Responseorder effects are discussed in more depth by Sudman, Bradburn, and Schwarz (1996).
With respect to ambiguity in multiple-choice questions, we may tentatively conclude thatthis form of question provides the highest probability of the question’s being ambiguous, andan average probability of the answer’s being ambiguous, compared with the other two forms.
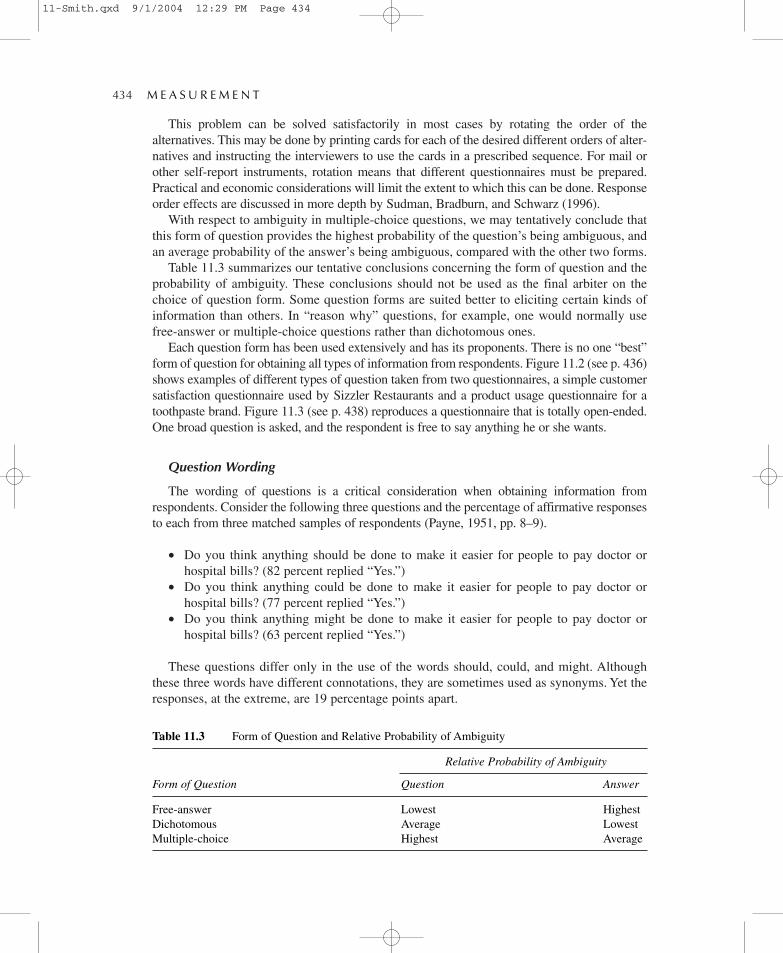
Table 11.3 summarizes our tentative conclusions concerning the form of question and theprobability of ambiguity. These conclusions should not be used as the final arbiter on thechoice of question form. Some question forms are suited better to eliciting certain kinds ofinformation than others. In “reason why” questions, for example, one would normally usefree-answer or multiple-choice questions rather than dichotomous ones.
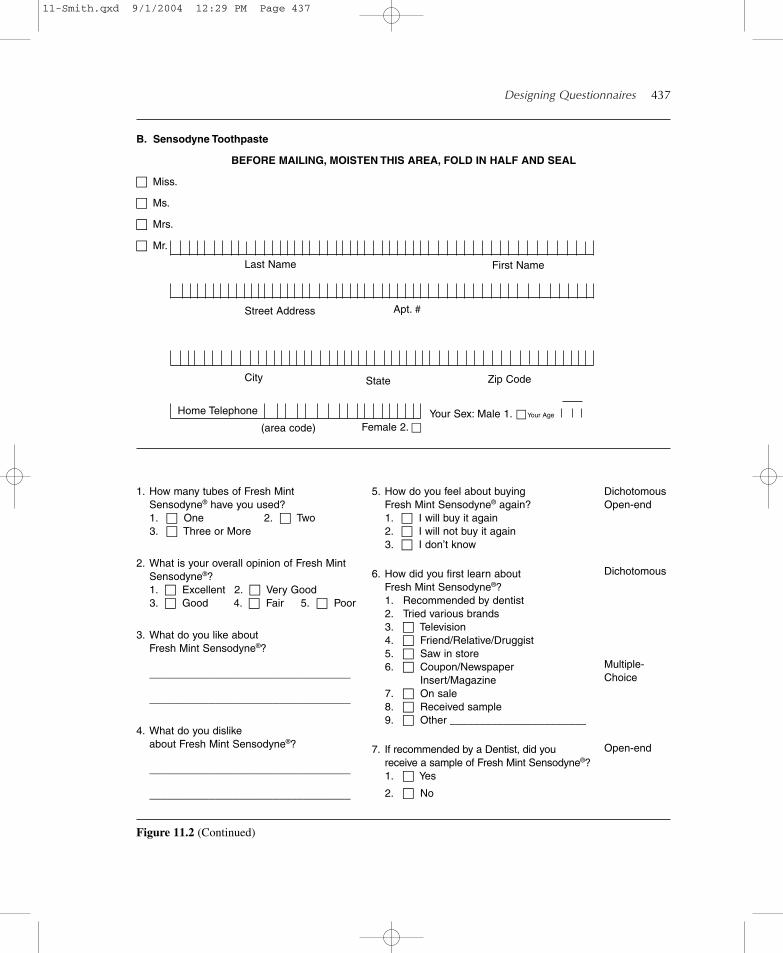
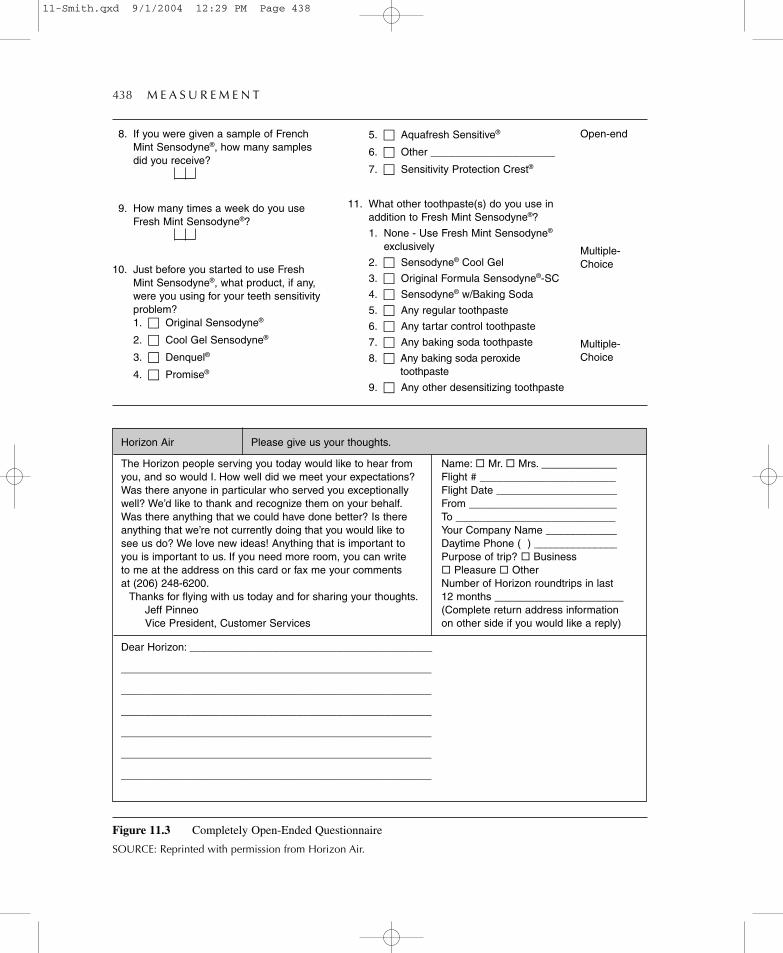
Each question form has been used extensively and has its proponents. There is no one “best”form of question for obtaining all types of information from respondents. Figure 11.2 (see p. 436)shows examples of different types of question taken from two questionnaires, a simple customersatisfaction questionnaire used by Sizzler Restaurants and a product usage questionnaire for atoothpaste brand. Figure 11.3 (see p. 438) reproduces a questionnaire that is totally open-ended.One broad question is asked, and the respondent is free to say anything he or she wants.
Question Wording
The wording of questions is a critical consideration when obtaining information fromrespondents. Consider the following three questions and the percentage of affirmative responsesto each from three matched samples of respondents (Payne, 1951, pp. 8–9).
• Do you think anything should be done to make it easier for people to pay doctor orhospital bills? (82 percent replied “Yes.”)
• Do you think anything could be done to make it easier for people to pay doctor orhospital bills? (77 percent replied “Yes.”)
• Do you think anything might be done to make it easier for people to pay doctor orhospital bills? (63 percent replied “Yes.”)
These questions differ only in the use of the words should, could, and might. Althoughthese three words have different connotations, they are sometimes used as synonyms. Yet theresponses, at the extreme, are 19 percentage points apart.
434— M E A S U R E M E N T
Table 11.3 Form of Question and Relative Probability of Ambiguity
Relative Probability of Ambiguity
Form of Question Question Answer
Free-answer Lowest HighestDichotomous Average LowestMultiple-choice Highest Average
11-Smith.qxd 9/1/2004 12:29 PM Page 434

As another example consider the following questions, posed by Rasinski (1989), for whichlabels for the issues of concern were changed:
• Are we spending too much, too little, or about the right amount on welfare (23.1 per-cent replied “too little”); assistance to the poor (62.8 percent replied “too little”)
• Are we spending too much, too little, or about the right amount on halting the rising crimerate (66.8 percent replied “too little”); law enforcement (52.9 percent replied “too little”)
In these questions, a more descriptive and more positive explanation is used and there isas much as 39.3 percent difference in evalution.
Framing Questions
This last example is related to what is known as framing in communication. Informationframing effects reflect the difference in response to objectively equivalent informationdepending upon the manner in which the information is labeled or framed. Levin, Schneider,and Gaeth (1998) and Levin et al. (2001) identify three distinct types of framing effects:
• Attribute framing effects. Occur when evaluations of an object or product are morefavorable when a key attribute is framed in positive rather than negative terms.
• Goal framing effects. Occur when a persuasive message has different appeal dependingon whether it stresses the positive consequences of performing an act to achieve aparticular goal or the negative consequences of not performing the act.
• Risky choice framing effects. Occur when willingness to take a risk depends uponwhether potential outcomes are positively framed (in terms of success rate) or nega-tively framed (in terms of failure rate).
Which type of potential framing effect should be of concern to the research designer dependsupon the nature of the information being sought in a questionnaire. At the simplest level, ifintended purchase behavior of ground beef was being sought, the question could be framed as “80percent lean” or “20 percent fat.” This is an example of attribute framing. It should be obvious thatthis is potentially a pervasive effect in question design, and is something that needs to be addressedwhenever it arises. More detailed discussion of these effects are given by Hogarth (1982).
The ability to construct clear, unambiguous questions is an art rather than a science. It hasremained so despite the extensive investigations and accumulated experience of practitionersover the past four decades. Although principles of question wording have evolved, they aremore indicative than imperative.
According to Oppenheim (1992, pp. 128–130), these principles can be summarized byasserting that ambiguity in question wording arises from one or more of the following sources:
1. Question length
2. Respondent unfamiliarity with one or more words
3. Ambiguity of one or more words in context
4. Two questions combined in one
5. Lack of specificity
A brief discussion on each of these sources of ambiguity in question wording is in order.
Designing Questionnaires— 435
(Text continues on page 439)
11-Smith.qxd 9/1/2004 12:29 PM Page 435

436— M E A S U R E M E N T
A. Sizzler
We would like you to rate some specific characteristics about your visit to Sizzler today.
A. Taste of the food C. Value for the money E. Efficiency of service(1.) Excellent (1.) Excellent (1.) Excellent(2.) Above Average (2.) Above Average (2.) Above Average(3.) Average (3.) Average (3.) Average(4.) Below Average (4.) Below Average (4.) Below Average(5.) Poor (5.) Poor (5.) Poor
B. Size of the portion D. Employee attitude F. Cleanliness(1.) Excellent (1.) Excellent (1.) Excellent(2.) Above Average (2.) Above Average (2.) Above Average(3.) Average (3.) Average (3.) Average(4.) Below Average (4.) Below Average (4.) Below Average(5.) Poor (5.) Poor (5.) Poor
Was the food cooked as ordered?Yes No
Was the food served at the proper temperature?Yes No
Menu item ordered____________________________________________________________
___________________________________________________________________________
Please rate some specific characteristics about the Buffet Court (if ordered).A. Quality B. Cleanliness C. Variety
(1.) Excellent (1.) Excellent (1.) Excellent(2.) Above Average (2.) Above Average (2.) Above Average(3.) Average (3.) Average (3.) Average(4.) Below Average (4.) Below Average (4.) Below Average(5.) Poor (5.) Poor (5.) Poor
What additional items would you like for the Buffet Court? _____________________________
___________________________________________________________________________
What did you like best about your visit today? ______________________________________
___________________________________________________________________________
___________________________________________________________________________
What did you like least about your visit today? ______________________________________
___________________________________________________________________________
___________________________________________________________________________
Overall, how would you rate your eating experience at Sizzler today? Was it:(1.) Excellent (2.) Above Average (3.) Average (4.) Below Average (5.) Poor
Name ______________________________________________________________________
Address ____________________________________________________________________
City ________________________________________________________________________
Date __________________________________ Time _______________________________
Multiple-Choice
Dichotomous
Open-end
Multiple-Choice
Open-end
Multiple-Choice
Figure 11.2 Illustration of Question Types
11-Smith.qxd 9/1/2004 12:29 PM Page 436
Designing Questionnaires— 437
B. Sensodyne Toothpaste
BEFORE MAILING, MOISTEN THIS AREA, FOLD IN HALF AND SEAL
Miss.
Ms.
Mrs.
Mr.
DichotomousOpen-end
Dichotomous
Multiple-Choice
Open-end
Last Name
Home Telephone
(area code) Female 2.
Street Address
City State Zip Code
Your Sex: Male 1. Your Age
Apt. #
First Name
Figure 11.2 (Continued)
1. How many tubes of Fresh MintSensodyne® have you used?1. One 2. Two3. Three or More
2. What is your overall opinion of Fresh MintSensodyne®?1. Excellent 2. Very Good3. Good 4. Fair 5. Poor
3. What do you like aboutFresh Mint Sensodyne®?
__________________________________
__________________________________
4. What do you dislikeabout Fresh Mint Sensodyne®?
__________________________________
__________________________________
5. How do you feel about buyingFresh Mint Sensodyne® again? 1. I will buy it again2. I will not buy it again3. I don’t know
6. How did you first learn aboutFresh Mint Sensodyne®?1. Recommended by dentist 2. Tried various brands3. Television4. Friend/Relative/Druggist 5. Saw in store6. Coupon/Newspaper
Insert/Magazine 7. On sale8. Received sample9. Other _______________________
7. If recommended by a Dentist, did youreceive a sample of Fresh Mint Sensodyne®?1. Yes
2. No
11-Smith.qxd 9/1/2004 12:29 PM Page 437
438— M E A S U R E M E N T
Open-end
Multiple-Choice
Multiple-Choice
Horizon Air Please give us your thoughts.
The Horizon people serving you today would like to hear from Name: � Mr. � Mrs. _____________you, and so would I. How well did we meet your expectations? Flight # _______________________Was there anyone in particular who served you exceptionally Flight Date _____________________well? We’d like to thank and recognize them on your behalf. From _________________________Was there anything that we could have done better? Is there To ___________________________anything that we’re not currently doing that you would like to Your Company Name ____________see us do? We love new ideas! Anything that is important to Daytime Phone ( ) _______________you is important to us. If you need more room, you can write Purpose of trip? � Business to me at the address on this card or fax me your comments � Pleasure � Otherat (206) 248-6200. Number of Horizon roundtrips in last
Thanks for flying with us today and for sharing your thoughts. 12 months ______________________Jeff Pinneo (Complete return address informationVice President, Customer Services on other side if you would like a reply)
Dear Horizon: _________________________________________
_____________________________________________________
_____________________________________________________
_____________________________________________________
_____________________________________________________
_____________________________________________________
_____________________________________________________
Figure 11.3 Completely Open-Ended Questionnaire
SOURCE: Reprinted with permission from Horizon Air.
8. If you were given a sample of FrenchMint Sensodyne®, how many samplesdid you receive?
9. How many times a week do you useFresh Mint Sensodyne®?
10. Just before you started to use FreshMint Sensodyne®, what product, if any,were you using for your teeth sensitivityproblem?1. Original Sensodyne®
2. Cool Gel Sensodyne®
3. Denquel®
4. Promise®
5. Aquafresh Sensitive®
6. Other _____________________
7. Sensitivity Protection Crest®
11. What other toothpaste(s) do you use inaddition to Fresh Mint Sensodyne®?
1. None - Use Fresh Mint Sensodyne®
exclusively
2. Sensodyne® Cool Gel
3. Original Formula Sensodyne®-SC
4. Sensodyne® w/Baking Soda
5. Any regular toothpaste
6. Any tartar control toothpaste
7. Any baking soda toothpaste
8. Any baking soda peroxidetoothpaste
9. Any other desensitizing toothpaste
11-Smith.qxd 9/1/2004 12:29 PM Page 438

Designing Questionnaires— 439
1. Questions that are too long. There is a class of questions known as “flabbergasters”that are long, complex, and verge on being incomprehensible. A classic example is a reported13-line question asking farm managers whether they used mostly inductive or deductive logic.Each word in a question is a potential source of ambiguity. The greater the number of words,the more complex the structure of the question must become. For both these reasons, brevityin question construction is a virtue. As a general rule-of-thumb, questions should be held to nomore than 20 words if at all possible.
The following question has been paraphrased from one actually used on a survey in adifferent field:
Do you think of new-car dealers as being independent business people like appliancedealers and furniture merchants who own their own stores, or as being employees of theautomobile companies?
Suppose, if you will, that this question is being read to you rather than your reading it.It refers to three different types of businesses, as well as to owning one’s business versusbeing employed by a manufacturer. The researcher who constructed this question went tothe trouble of using at least 10 extra words, which add opportunities for having the questionmisunderstood. Do you think that you would be more likely to understand the question aboveor this revised and shortened version?
Do you think of new-car dealers as owning their business, or as being employees of theautomobile companies?
2. Questions that use one or more words that are unfamiliar to the respondent. Thevocabulary used in questions should match that normally used by the respondents as closelyas possible. For example, the wording of the question
Do you think that the processing of dehydrated soups reduces the caloric content?
might well be appropriate if it is to be asked of a group of food chemists. It would requirea heroically optimistic researcher, however, to seriously consider asking this question ofa sample of consumers. There are at least four words that individually, and in some casescollectively, would be unfamiliar to some consumers.
The principle of matching question vocabulary and respondent vocabulary is notalways easy to follow. In the case of a group of food chemists, there is a similarity oftraining and a common usage of terms. It is probable that their individual vocabularylevels are uniformly high. For this group, question vocabulary and respondent vocabularycan be matched reasonably well. In the case of consumers, however, vocabulary levelsvary widely.
When the sample of respondents is large and nonhomogeneous in background, it is desir-able to word the question at the lowest vocabulary level represented in the sample. Theresearcher must guard against the use of more difficult synonyms for their simpler equivalentssuch as “observe” instead of “see,” “obtain” instead of “get,” and “purchase” instead of “buy.”
The question should be worded to be understood by the respondent—not to impress himor her with the researcher’s vocabulary.
11-Smith.qxd 9/1/2004 12:29 PM Page 439

440— M E A S U R E M E N T
3. Questions that use one or more words that are ambiguous in context. A commonsource of ambiguity of words in context is the way in which the question is constructed. Someillustrations of ambiguities arising from poor sentence structure are given below.
If Security Bank were to install an automatic teller machine and discontinue Saturdayteller assisted hours, would you change your banking practice? (Would you use themachine, change banking hours, or change banks?)
A more serious and less easily corrected source of ambiguity of words in context is wordsthat have two or more meanings. Most words have several meanings out of context, and werely on the topic being discussed to indicate the intended meaning. In these questions themeaning intended should be clear. In many cases, however, the intended meaning of a wordis not clear from the context in which it is used. Consider the following question:
Have you been satisfied with the service provided by the Sight and Sound Company?
In this question, both the words “you” and “service” are subject to misinterpretation. Does“you” mean the person being addressed only, or does it include this person’s family? Does“service” refer to the assistance and consideration given the customer in making purchases,or does it refer to the repair of equipment done by the company?
Contextual effects are especially troublesome in research involving foreign markets, or anymulticultural market. Some countries are what are known as linguistic high-context countries(Asian countries, for example), whereas others (like the United States and Canada) are low-context countries. In a high-context country, words by themselves carry little meaning. Howthe words are used, or their context, provides the meaning. Consequently, ambiguity in con-text may be quite significant in international marketing research.
4. Combined Questions. Careless question wording sometimes results in two questionsbeing asked as one. A question asked of commuters is illustrative of such questions:
Which would you say is the more convenient and economical way to commute, by car orby train?
It is obvious that the respondent who believed that one method was more convenient andthe other more economical could not logically answer the question as it was asked. Combinedquestions should be avoided. The above question should have been broken into two separatequestions, one dealing with “convenience” and the other with “economy.”
5. Questions that lack specificity. Ambiguity often arises because of the vagueness ofquestions. A question such as
Do you listen to FM radio stations regularly?
will involve ambiguity because it is by no means clear whether “regularly” means threetimes a day, twice a week, once a month, or some other frequency of listening. If the questionis to be understood correctly, the desired information must be clearly specified.
11-Smith.qxd 9/1/2004 12:29 PM Page 440

Designing Questionnaires— 441
Procedures for Recognizing and Reducing Ambiguity in Communication
Every research design that uses communication to obtain information should have as manysafeguards against ambiguity as possible. Procedures should be employed to recognize whereambiguity may be present and to reduce it to the lowest practicable level.
Three procedural steps are useful for these purposes and should be considered in every project:
1. Alternative question wording
2. Pretesting
3. Verification by observation
1. Alternative question wording. We have already seen that the present state-of-the-artquestion formulation cannot guarantee unambiguous questions. In questions where there isreason to suspect that ambiguity may exist, it is advisable to consider alternative wordingsand forms of questions to be asked of sub-samples of respondents.
The simplest application of this procedure applies to dichotomous questions. If it is believedthat the order in which the alternatives are stated may influence the responses, the question canbe asked of half the sample of respondents with the alternatives in one order, and of the otherhalf with the order reversed. For example, the question
Which make of car would you say is more powerful, Ford or Chevrolet?
can be asked of half the respondents, and the question
Which make of car would you say is more powerful, Chevrolet or Ford?
of the other half. If the order of the alternatives does, in fact, affect the responses, this willbecome apparent and can be allowed for when interpreting the results.
The use of this simple experimental technique costs little more than having an extra set ofquestionnaires printed. In personal and telephone interviewing situations, the interviewers canbe instructed to change the order for one-half the interviews, and the cost will be nil. For elec-tronic modes of data collection, again two sets of questionnaires are constructed at little or nocost. It may reveal no significant differences in response. If so, it will usually be worth the costinvolved simply to know that this is the case. Where significant differences in response are dis-covered, it will be even more worthwhile as a warning in interpreting the information.
2. Pretesting. Pretesting of questionnaires is a virtual necessity (Converse & Presser, 1986,pp. 51–75). The only way to gain real assurance that questions are unambiguous is to try them.Pretesting is usually done initially by asking proposed questions of associates. To be trulyeffective, however, pretesting of questions should be conducted by asking them ofa group of respondents who are similar to those to be interviewed in the final sample.
A typical way to assess problems with individual questions included in the questionnaire isto ask those participating whether they had any trouble with each of the questions. For a self-report survey (nonelectronic or electronic), a simple way is to add a sheet that asks about eachquestion and requests a response on some type of scale—understanding, difficulty in respond-ing, and so forth. This may indicate if there are “problems” but may not indicate the exactnature of the problem.
11-Smith.qxd 9/1/2004 12:29 PM Page 441

442— M E A S U R E M E N T
If the pretest is done by an interviewer, each respondent can be asked about each questionand probing can get more depth in the response. Another method, one which requires thatpretest be done by personal interview, has been suggested by Bolton and Bronkhorst (1995)and Bolton (1993). This method was developed for GTE’s use to pretest its customer satis-faction questionnaires, and involves the use of concurrent verbal protocols and an automaticcoding scheme, designed to measure respondents’ cognitive difficulties answering questionsabout low-involvement, low-frequency events. As respondents go through and respond to aquestionnaire during a pretest interview, they concurrently verbalize aloud their thoughts.While this occurs, there is automatic coding of the verbal reports, which would then be con-tent analyzed. Obviously, this procedure requires much more time and effort than is usuallydevoted to design and evaluation of pretests, and may not be appropriate for many studies.
It is the rule, rather than the exception, that questions will be revised as a result of pretest-ing. Several versions of a question may need to be considered as a result of pretesting beforethe final version is decided upon.
3. Verification by observation. Whenever cost, time, and the type of information desiredpermit, information obtained through communication should be verified by observation. Thehousewife may state that the only brand of toothpaste she buys for her children is Crest.Where possible, it is desirable to verify this statement partially by observing whether this isthe only brand of toothpaste she now has on hand.
Clearly, verification by observation is not always possible or practical. In the above example,the housewife may object to a pantry audit. Even greater difficulties would be involved inattempting to verify via observation her statement that her children brush before going to bed.
Ambiguity in Observation
Although it has been suggested that, where practical to do so, information obtained bycommunication should be verified by observation, the implication should not be drawn thatobservation is free of ambiguity. If we conduct an in-home audit and find that Crest is the onlybrand on hand, this in itself does not disclose whether it was purchased or received as a gift,whether it is used or not, or, if used, for what purpose.
In making observations, we each select, organize, and interpret visual stimuli into apicture that is as meaningful and as coherent to us as we can make it. Which stimuli areselected and how they are organized and interpreted are highly dependent on both thebackgrounds and frames of reference of the observer. If a customer, a floorwalker, and thedepartment manager are each standing side by side on the mezzanine overlooking the jewelrydepartment, what each “sees” will very likely differ markedly from the others.
The trained observer will invariably “see” more that relates to his or her specialty in anambiguous situation than the untrained observer. As an illustration, many years ago a cerealmanufacturer ran a promotional campaign involving a drawing contest for children. Eachchild who entered was required to submit (along with a box top) a picture he or she had drawnthat depicted Brand X cereal being eaten. The contest was run, the prizes awarded on the basisof artistic merit, and the brand manager turned his attention to other matters. A short time latera psychologist who worked for the company happened to see the pictures. He asked to be per-mitted to study them. He found that a sizable proportion of them showed a child eating cerealalone, often with no other dishes on the table. This suggested to him that cereal is often eatenby children as a between-meal snack. Later studies by the company’s marketing research
11-Smith.qxd 9/1/2004 12:29 PM Page 442

Designing Questionnaires— 443
department showed that cereals are eaten between meals by children in greater amounts thanare eaten for breakfast. The advertising program of the company was subsequently changedto stress the benefits of its cereals as between-meal snacks.
SOME CONCLUDING COMMENTS
We have not discussed broader issues of overall questionnaire design, question sequencing, andso forth (see Table 11.4). This is not to say that these are not important issues. To the contrary,they are. For example, research has shown that questions appearing early in a questionnaire andearly within their respective groups (when the questionnaire is so organized) are more likely tobe answered and may influence responses to later questions than are questions placed elsewhere.This is the question-order effect issue. Question-order effects can occur along two differentdimensions (Moore, 2002): (a) the relative judgments that respondents make about each ofthe items being evaluated (the item dimension); and (b) the judgments made about the largerframework within which the evaluations are being made (the framework dimension). As in thecase of response order, rotation of questions may help reduce any such effects. But the researcherhas to be careful not to destroy any logical sequencing of questions within a topic area.
Similarly, a well-known principle is that questionnaire design should follow a funnelapproach with respect to where variable kinds of questions should be placed (e.g., sensitive,important, hard to answer, demographic). There are two ways to look at the funnel technique.First, it is a sequencing of questions where one proceeds from the general to the specific (orfrom easier questions to answer to those more difficult), keeping in mind that there must betopic consistency. A second view is that a set of funnel questions exists in a form of a “con-tingency tree” in that each succeeding question is contingent on a respondent’s answer to thepreceding question, as shown in Figure 11.4 (Peterson, 2000, page 110). One advantage ofthis approach is that it minimizes the chance that respondents are asked irrelevant questionsor questions to which they do not know the answers. These issues are covered rather thor-oughly in books that are more narrowly focused (Peterson, 2000; Dillman, 2000; Bourque &Fiddler, 2003a, 2003b; Labaw, 1988; Converse & Presser, 1986; Payne, 1951).
What is clear, however, is that there is no such thing as a “pure” optimum length of ques-tionnaire, as usually understood by marketing researchers. There may be an operational opti-mum length. Such an optimum would be determined by interest value of the topic(s) covered,their importance, the motivation of the respondent, the quality of the interviewer where oneis used, and a myriad of other considerations.
One issue is that of comparability across different populations when doing cross-cultural/national research. An area of great concern to marketing researchers is the differences that haveexisted among countries in demographic variation and categorizations. The European Societyfor Opinion and Research (ESOMAR) worked on the development of a common questionnairethat can be used for Pan-European and multicountry surveys. Figure 11.5 shows one Englishlanguage version (ESOMAR, 1990, p. 4).
Another issue that arises in cross-cultural/national research is the question of whetheror not to translate a questionnaire. A typical cross-national study has the questionnairedeveloped by someone in one country, and it is then to be administered in another country.In a few rare cases and for certain “populations,” the questionnaire can be administered in thelanguage of the country in which it was developed, even if the languages differ. For example,an English language questionnaire may be able to be used in Denmark and The Netherlands
(Text continues on p. 447)
11-Smith.qxd 9/1/2004 12:29 PM Page 443

Table 11.4 Major Aspects of Questionnaire Design
Audit Questions
What is the purpose of thestudy?
What am I trying to describe,segment, or predict?
How do I identify or classifyresults by market segment?
Can I picture the tables andgraphs to be presented whenthe final data is analyzed?
Are we conducting exploratoryresearch or can StructuredDirect methods be used?
Are respondents willing toprovide the requested info?
Possibilities
Descriptive:Awareness, attitudes, importance,
acceptabilities, preference, pastbehavior, trial, use, market position
Segment the market:Attitude, benefit, demographic,
psychographic, usage
Estimate/predict:Market share, elasticity
How is the data to be collected?
Focus groups, mail questionnaire,phone interview, personal interview,combination, Internet/e-mail
(Continued)
Researcher Question
What information is to besought?
What information is to bepresented at the end ofthe research project?
What type of data isrequired?
What type of questionnaireis appropriate to collectthis data?
444— M E A S U R E M E N T
Question 1.Have you heard or seen anyadvertisements for automobiles recently?
NoGo to Question
6.
NoGo to Question 6.
NoGo to Question
6.
YesQuestion 3. Were any of theseadvertisements on television?
YesQuestion 2. Were any of theseadvertisements for foreign automobiles?
YesQuestion 4. Were any of these advertisements for a Volvo?
YesQuestion 5. What did the advertisement say?
NoGo to Question
6.
Figure 11.4 Funnel Questions
SOURCE: From Peterson, R., Constructing Effective Questionnaires, copyright © 2000. Reprinted by permission ofSage Publications, Inc.
11-Smith.qxd 9/1/2004 12:29 PM Page 444

Designing Questionnaires— 445
Table 11.4 (Continued)
Researcher Question
How is thequestionnaire to beadministered?
Question content,question format,question phrasing
Response format of theindividual questions.
Sequencing and layoutof the questionnaire
Re-examine, rethink and revise
Pretest and revise
Audit Questions
Do we need specialconsiderations? Disguiseneeded? In-depth interviews?Projective methods?
Does the question answer thestudy objective(s)?
Do respondents have the abilityto answer the question?
Does the statement communicate?
Does the question purposematch the question?
Can the result be interpreted?
Is there a better way to measurethis response?
Does the question purposematch the response format?
How is the data analyzed?
Can the result be interpreted?
How many questions shouldbe added or deleted?
Do questions flow buildingon previous questions?
Are similar response formatsgrouped together?
Review questionnairere-examine steps 1–4
Formal pretest of survey
Possibilities
Consider:Able to answer, time required, prestige,privacy, etc.
Question types:Open-ended, dichotomous,multiple-choice, measurement scale, etc.
Question wording:Biased wording, length, unfamiliarwords, ambiguous content, combinedquest., specificity, etc.
Some question typesDemographics, attribute strength, attributeimportance, satisfaction, preference, futurebehavior, trade-offs, psychographics, etc.
Measurement level:Nominal, ordinal, interval, ratio?
Scaling objective:Scale stimuli, scale respondents
Scale type:Paired comparison, ranking methods,rating methods, etc.
Funnel approach:General—Warm-upSpecific—In-depthGeneral—Wind-down
Funnel Approach
GeneralWarm-Up
SpecificIn-Depth
GeneralWind-Down
11-Smith.qxd 9/1/2004 12:29 PM Page 445

446— M E A S U R E M E N T
II
(10) At present, are you . . .?self-employed � q.11A�
• in a paidemployment � q.11B�
• temporarily notworking � B
• retired � B• not working/responsible
for ordinary shopping andlooking after the home(E13) � q.13
• And formerly, have youbeen . . .?
(11) What kind of work do youdo? (What position doyou hold?)
A – Self-Employed
• PROFESSIONAL(Doctor, Lawyer,Accountant,Architect)(E2) � q.12(in actual profession)
• GENERALMANAGEMENT �(Exec./Manag.Dir., Officer, Mgr)
• MIDDLE MANAGEMENT� (Dmt/Branch Head,Junior Mgr)- How many employeesare you responsible(or heading)?GM MM
0–5: (E4) (E6) � q.126 or +:(E1) (E5) � q.12
• OTHER EMPLOYEMENT� Do you workmainly in an office?YES (E8) � q.12 NO �
– In your job, do youspend much of yourtime writing orworking with figures?
YES (E11) � NO (E14) �
▲
▲
▲▲
▲
▲▲
▲
▲▲
III
(12) How many hours per week doyou normally work? � �
(13) Do you, or anyone else inyour household, own . . .?• a color TV set Y � N �• a video recorder Y � N �• a radio-clock Y � N �• a video camera/
camcorder Y � N �• a PC/home computer
Y � N �• an electric deep fryer
Y � N �• an electric drill Y � N �• a still camera Y � N �• at least 2 cars Y � N �• a second home or a
vacation house/flatY� N�
(14) Your main home:do you . . .?• rent it �• own it �
(15) Which foreign languages doyou understand well enoughto read a newspaper or listento radio news?
Danish � Greek �
Dutch � Italian �
English � Portuguese �
French � Spanish �
German � Swedish �
Other �
FULL ADDRESS
(16) • REGION(17) • SIZE OF TOWNUSING THE LOCAL, USUALCATEGORIES(As documented in availablestatistics on universe)
I
(1) Sex: M � F �
(2) What is your age? � �
(3) How many people live in yourhousehold, includingyourself? � �
(4) How many children under 15are there? � �
(5) Are you, in yourhousehold . . .• The person who
contributes most to thehousehold income?YES � NO �
• The person mainlyresponsible for ordinaryshopping and looking afterthe home?YES � NO �
(6) Are you . . .?• Married/living
together �• Single �• Separated/divorced/
widowed �
(7) At what age did you finishfull-time education? � �
Still studying (E10) q.13
(8) Any time after that, didyou . . .• Resume general education
at a later stage in your life?YES � q.9 NO �
• Take any apprenticeship/professional trainingfor your job?YES � q.9 NO � q.10
(9) How many months didyour . . . (furthereducation/prof. training)last in total? � �
▲▲
▲▲
▲
Figure 11.5 A Sample Questionnaire for Demographics
SOURCE: Copyright © 1990 by ESOMAR® - The World Association of Research Professionals. Originally publishedby ESOMAR.
11-Smith.qxd 9/1/2004 12:29 PM Page 446

as the incidence of English-speaking is very high in these two countries. The issue often isone of cultural comfort versus loss in meaning. Any time a questionnaire is translated, therewill be some loss in meaning. A normal procedure for translation is to follow a translation/back-translation process. The extent to which a questionnaire can be successfully translateddepends upon (a) the lack of semantic equivalence across languages; (b) the lack of concep-tual equivalence across cultures; and (c) the lack of normative equivalence across societies.This is a specialized topic and is covered in depth by Behling and Law (2000).
SUMMARY
This chapter looked at issues involved in asking questions of respondents. The exposition wasin the context of response error and what might be done to control and, it is hoped, eliminate asmuch of this error as possible. Some general principles of question formation were presented.
It is often difficult to separate the questionnaire and questions asked in a marketingresearch study from the mode of data collection used. This is especially so for surveys orwhen a survey method (communication) is used in an experiment. The interview (telephoneor personal) can be a key element in errors of inaccuracy and ambiguity arising. Thisis especially so for surveys designed to produce quantitative data about some population—acommon type of marketing research project—and for cross-cultural/national studies as well.
�
ASSIGNMENT MATERIAL
1. The manufacturer of a certain brand of nationally advertised and distributed frozen fruitjuices has retained you as a consultant to advise on a questionnaire that is being pre-pared. The purpose of the survey is to determine consumer opinion and attitudes aboutfrozen versus fresh fruit juices. Personal interviews are to be conducted on a randomlyselected sample of families.a. The questions listed below are being considered for the questionnaire. Comment on
each, indicating whether you would leave the question as it is or change it. If youthink if should be changed, rewrite it as you believe it should be asked.
(1) Do you or any of your family drink fruit juices?Yes _____ No _____If yes:
(2) Is the juice drunk at a meal or between meals or bothAt meal _____ Between meals _____ Both _____
(3) Do you prefer frozen or fresh juices?Frozen _____ Fresh _____
(4) What advantages, if any, do you believe using fresh juice has over using frozenjuice?
(5) What advantages, if any, do you believe using frozen juice has over using freshjuice?
Designing Questionnaires— 447
11-Smith.qxd 9/1/2004 12:29 PM Page 447

(6) What brand or brands of juice do you regularly buy?Don’t know
(7) On this card is a list of fruit juices. Tell me which are your family’s first, second,and third choices.
grape ____tomato ____lime ____lemonade ____orange ____V-8 ___other ____
(8) What is the last brand of juice bought by your family? ____________Don’t know
b. Classify each of the above questions by type (free-answer, multiple-choice, ordichotomous).
2. The No-Fault Insurance Company, a relatively small company specializing in insuringautomobiles, was interested in learning in what proportion of automobile accidents, inwhich the police were not called, an insuree was involved who had been driving underthe influence of alcohol or some form of drugs. A member of the company’s market-ing research department took a simple random sample of 100 accidents by theirinsurees over the past 12 months in which there was no police investigation. Theinsuree was interviewed personally and, after a suitable introduction, handed a cardwith the following instructions printed on it:
PLEASE READ THIS CARD ALL THE WAY THROUGH BEFORE DOING ANY OF THE THINGS REQUESTED
1. The interviewer will hand you a penny after you have finished reading the card andhave asked any questions you may have.
Please flip the penny and determine whether it came up HEADS or TAILS without let-ting the interviewer know which it was.
2. The side of the coin that came up will determine which of the two questions given belowyou will answer. Please answer the question with “YES” or “NO” only and do not sayanything else as we do not want the interviewer to know which question you answer.
3. If the penny came up HEADS, answer “YES” or “NO” (only) to the question:
“Was your mother born in August?”
4. If the penny came up TAILS, answer “YES” or “NO” (only) to the question:
“Before your last automobile accident had you been drinking alcohol or takenany drugs (including tranquilizers) that might have caused you to be unable to driveas well as you usually do?”
5. If you have any questions about any of these instructions, please ask the interviewerfor an explanation before you flip the penny. If the instructions are followed properly,ONLY YOU SHOULD KNOW WHICH QUESTION YOU ANSWERED.
448— M E A S U R E M E N T
11-Smith.qxd 9/1/2004 12:29 PM Page 448

Responses were obtained from 91 persons (four had died or otherwise could not becontacted and five refused to answer). Twenty-four (24) of the respondents answered “Yes.”
a. What is the estimated proportion of respondents who answered “Yes” to the questionconcerning driving after drinking alcohol or taking drugs?
b. What are the nonsampling errors that are actually or potentially present in thisestimate?
c. Should these nonsampling errors be reflected in the estimate? If so, how?
3. A U.S. senator sent the questionnaire reproduced below to a mailing list of hisconstituents. Comment on the questionnaire indicatinga. Your evaluation of each questionb. Your appraisal of the questionnaire as a device for informing the senator of his
constituents’ opinions
QUESTIONNAIRE
1. Under present law, families who run small businesses and farms are often forcedto sell their holdings rather than pass them on to the next generation owing to theburden of estate taxes. Would you favor legislation to ease this burden?
Yes _____ No _____
2. Of the following areas of federal spending, choose one in which you would prefer tomake a budget cut:a. Public welfare payments __________b. Public works projects __________c. Defense spending __________d. Foreign assistance programs __________e. Food stamps __________f. Education __________g. Other __________
3. Do you believe that charitable organization, such as churches and nonprofit hospitalsshould remain tax-exempt?
Yes _____ No _____
4. Which one of the following would you choose as the most important in solving theenergy shortage over the next 20 years?a. Solar/geothermal power development __________b. Nuclear power development __________c. Conservation of present sources __________
of energyd. Expansion of domestic oil reserves __________e. Increased use of coal __________
5. Which one of the following would you say is the most important effort Congresscould make to prevent crime?a. Enact harsher penalties to deter crimes __________
Designing Questionnaires— 449
11-Smith.qxd 9/1/2004 12:29 PM Page 449

b. Reenact the death penalty for certain crimes __________c. Enact restrictions on violence on television __________d. Increase funding for the courts __________e. Increase funding for law enforcement agencies __________f. Reform the country’s prison system __________
6. Most of the economic indicators for the nation show positive signs of a recovery.Unemployment is down to 7.6 percent, personal incomes are up, and the prime lendingrate is down.a. Do you feel that we are in a recovery? Yes _____ No _____b. Do you feel that the economy has stabilized? Yes _____ No _____c. Do you expect inflation to increase? Yes _____ No _____d. Do you believe that unemployment will stabilize Yes _____ No _____
Should Congress finance more jobs producing programs with tax revenues?
Yes _____ No _____
7. In each of the following areas do you feel that Congress’ efforts should be increased?a. Energy research and development Yes _____ No _____b. Health care and insurance Yes _____ No _____c. Crime control Yes _____ No _____d. Tax reform Yes _____ No _____e. Preservation of the environment Yes _____ No _____f. Other Yes _____ No _____
�
450— M E A S U R E M E N T
REFERENCES
Barnes, J. H., Jr., & Dotson, M. J. (1989, November).The effect of mixed grammar chains in responseto survey questions. Journal of MarketingResearch, 26(4), 468–472.
Behling, O., & Law, K. S. (2000). Translating ques-tionnaires and other research instruments: Prob-lems and solutions. Thousand Oaks, CA: Sage.
Bolton, R. N. (1993). Pretesting questionnaires:Content analysis of respondents’ concurrentverbal protocols. Management Science, 12(3),280–303.
Bolton, R. N., & Bronkhorst, T. M. (1995).Questionnaire pretesting: Computer assistedcoding of concurrent protocols. In N. Schwarzand S. Sudman (Eds.), Answering questions:Methodology for determining cognitive andcommunciative processes in survey research.San Francisco: Jossey-Bass.
Bourque, L. B., & Fielder, E. P. (2003a). How toconduct self-administered and mail surveys(2nd ed.). Thousand Oaks, CA: Sage.
Bourque, L. B., & Fielder, E. P. (2003b). How toconduct telephone surveys (2nd ed.). ThousandOaks, CA: Sage.
Bradburn, N., & Sudman, S. (1979). Improving inter-view method and questionnaire design. SanFrancisco: Jossey-Bass.
Campbell, C., & Joiner, B. L (1973, December). Howto get the answer without being sure you’veasked the question. American Statistician, 27,229–231.
Carroll, S. (1994, January 3). Questionnaire designaffects response rate. Marketing News, 28, 14ff.
Conrad, F. G., & Schober, M. F. (2000). Clarifyingquestion meaning in a household survey. PublicOpinion Quarterly, 64, 1–28.
11-Smith.qxd 9/1/2004 12:29 PM Page 450
Converse, J. M., & Presser, S. (1986). Surveyquestions: Handcrafting the standardized ques-tionnaire. Beverly Hills, CA: Sage.
Dillman, D. A. (2000). Mail and internet surveys: Thetailored design method (2nd ed.). New York:Wiley.
ESOMAR Working Party on Harmonization ofDemographics. (1990). Getting ready forsingle European sample surveys. Amsterdam:ESOMAR.
Fox, J. A., & Tracy, P. E. (1986). Randomized response:A method for sensitive surveys. Beverly Hills,CA: Sage.
Gilljam, M., & Granberg, D. (1993). Should we take‘don’t know’ for an answer? Public OpinionQuarterly, 57, 348–357.
Hausknecht, D. R. (1990). Measurement scales inconsumer satisfaction/dissatisfaction. Journalof Consumer Satisfaction, Dissatisfaction andComplaining Behavior, 3, 1–11.
Hogarth, R. M. (Ed.) (1982). Question framing andresponse consistency. San Francisco: Jossey-Bass.
Knauper, B. (1998). Filter questions and questioninterpretation: Presuppositions at work. PublicOpinion Quarterly, 62, 70–78.
Krosnick, J. A., Holbrook, A. L., Berent, M. K.,Carson, R. T., Hanemann, W. M., Kopp, R. J.,et al. (2002). The impact of ‘no opinion’response options on data quality: Non-attitudereduction or an invitation to satisfice? PublicOpinion Quarterly, 66, 371–403.
Labaw, P. (1980). Advanced questionnaire design.Cambridge, MA: Abt Books.
Levin, I. P., Gaeth, G. J, Evangelista, F., Albaum, G., &Schreiber, J. (2001). How positive and negativeframes influence the decisions of persons in theUnited States and Australia. Asia Pacific Journalof Marketing and Logistics, 13(2), 64–71.
Levin, I. P., Schneider, S. L., & Gaeth, G. J. (1998,November). All frames are not created equal:A typology of framing effects. OrganizationalBehavior and Human Decision Processes,76(2), 149–188.
Moore, D. W. (2002). Measuring new types of ques-tion-order effects. Public Opinion Quarterly, 66,80–91.
Murphy, I. P. (1997, January 6). Keynote speakeremphasizes urgency of strategic research.Marketing News, 31, 6.
Oppenheim, A. N. (1992). Questionnaire design,interviewing and attitude measurement. London:Pinter Publishers.
Payne, S. L. (1951). The art of asking questions.Princeton, NJ: Princeton University Press.
Peterson, R. A. (2000). Constructing effective ques-tionnaires. Thousand Oaks, CA: Sage.
Peterson, R. A., Kerin, R. A., & Sabertehrani, M.(1982). Question understanding in self-reportdata. In B. J. Walker, et al. (Eds.), An assessmentof marketing thought and practice (pp.426–429). Chicago: American MarketingAssociation.
Rasinski, K. A. (1989). The effect of question word-ing on public support for government spending.Public Opinion Quarterly, 53, 388–394.
Rasinski, K. A., Mingay, D., & Bradburn, N. (1994).Do respondents really “mark all that apply” onquestionnaires? Public Opinion Quarterly, 58,400–408.
Reinmuth, J. E., & Geurts, M. D. (1975, November).The collection of sensitive information usinga two-stage randomized response model.Journal of Marketing Research, XII, 402–407.
Sanchez, M. E. (1992). Effects of questionnairedesign on the quality of survey data. PublicOpinion Quarterly, 56, 206–217.
Semon, T. T. (2000a, August 14). Better questionsmeans more honesty. Marketing News, 34, 10.
Semon, T. T. (2000b, January 17). If you think a ques-tion is stupid—it is. Marketing News, 34, 7.
Stem, D.F., Jr., & Steinhorst, R. K. (1984). Telephoneand mail questionnaire applications of therandomized response model. Journal of theAmerican Statistical Association, 79, 555–564.
Sudman, S., & Bradburn, N. (1982). Asking ques-tions. San Francisco: Jossey-Bass.
Sudman, S., Bradburn, N., & Schwarz, N. (1996).Thinking about answers: The application ofcognitive processes to survey methodology. SanFrancisco: Jossey-Bass.
Umesh, U. N., & Peterson, R. A. (1991). A critical eval-uation of the randomized response method:Applications, validation, and research agenda.Sociological Methods and Research, 20, 104–138.
Whitlark, D., & Smith, S. (forthcoming). Using pickdata to measure brand performance: Advantagesand issues for outline questionnaires. MarketingResearch.
Designing Questionnaires— 451
11-Smith.qxd 9/1/2004 12:29 PM Page 451