chap006 lecture
TRANSCRIPT
1
Perfectly Competitive Supply
Chapter 6
Copyright © 2013 by The McGraw-Hill Companies, Inc. All rights reserved.McGraw-Hill/Irwin
6-2
Learning Objectives1.Explain how opportunity cost is related to the
supply curve
2.Discuss the relationship between the supply curve for an individual firm and the market supply curve for an industry
3.Determine a perfectly competitive firm’s profit-maximizing output level and profit in the short run
4.Connect the determinants of supply with the factors that affect individual firms’ costs and apply the theory of supply
5.Define and calculate producer surplus
2
6-3
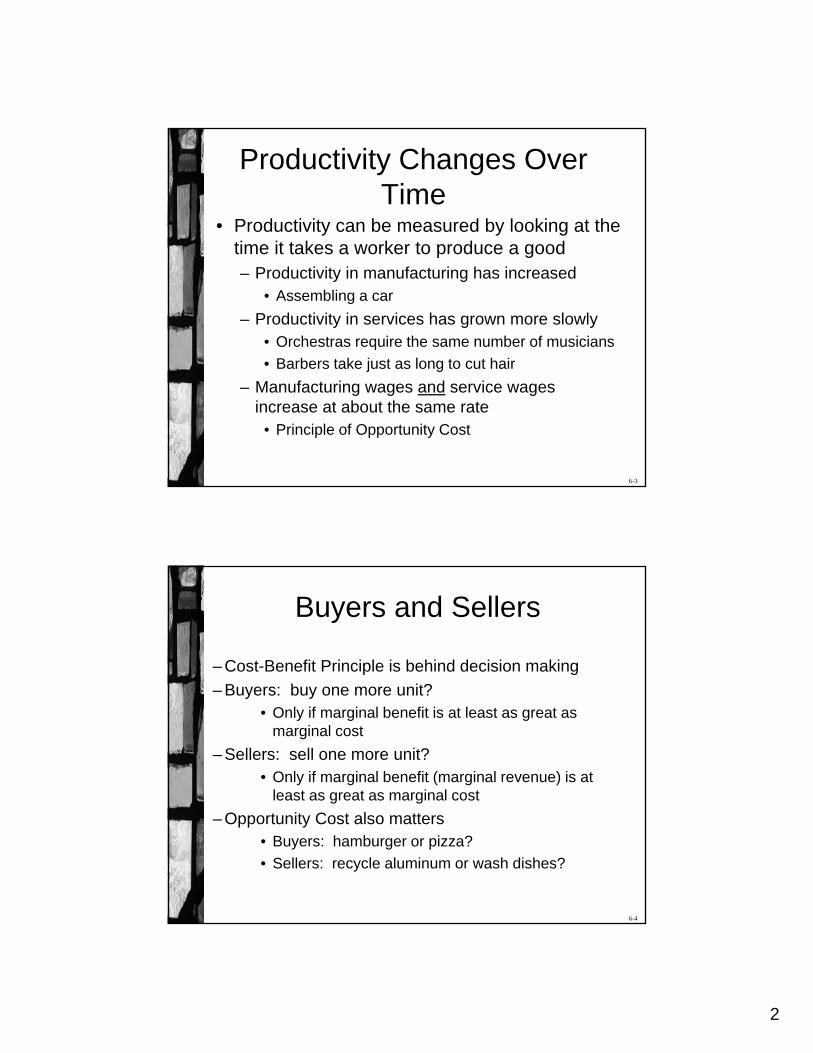
Productivity Changes Over Time
• Productivity can be measured by looking at the time it takes a worker to produce a good– Productivity in manufacturing has increased
• Assembling a car
– Productivity in services has grown more slowly• Orchestras require the same number of musicians
• Barbers take just as long to cut hair
– Manufacturing wages and service wages increase at about the same rate
• Principle of Opportunity Cost
6-4
Buyers and Sellers
– Cost-Benefit Principle is behind decision making
– Buyers: buy one more unit?• Only if marginal benefit is at least as great as
marginal cost
– Sellers: sell one more unit?• Only if marginal benefit (marginal revenue) is at
least as great as marginal cost
– Opportunity Cost also matters• Buyers: hamburger or pizza?
• Sellers: recycle aluminum or wash dishes?
3
6-5
The Importance of Opportunity Cost
• Harry can divide his time between two activities: – Wash dishes for $6 per hour
– Recycle aluminum cans and earn 2¢ per can
• Harry only cares about the income
• How much labor should Harry supply to each activity?– Harry should devote an additional hour to
recycling as long as he is earning at least $6 per hour
6-6
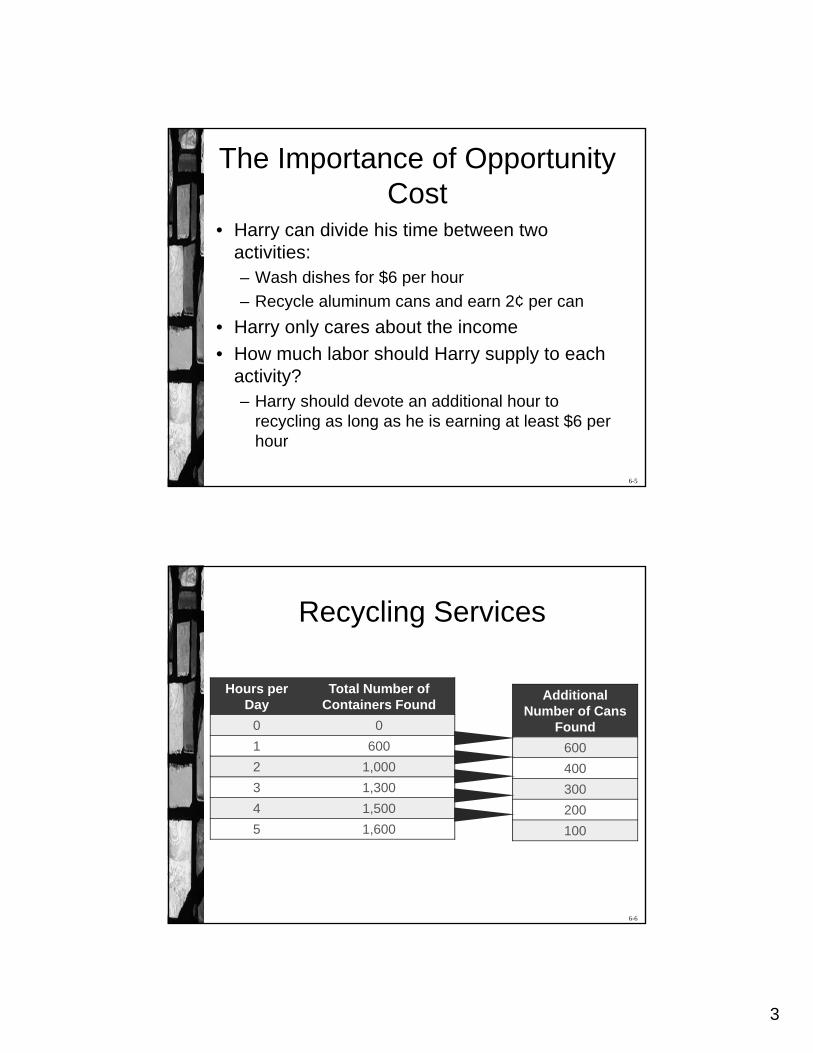
Recycling Services
Hours per Day
Total Number of Containers Found
0 0
1 600
2 1,000
3 1,300
4 1,500
5 1,600
Additional Number of Cans
Found
600
400
300
200
100

4
6-7
Recycling Services
• Harry earns more than $6 for each of the first two hours– Third hour is a tie with washing dishes
• Harry's rule is to collect cans if the return is at least as great as washing dishes
– Harry spends 3 hours recycling
Hours per DayAdditional Number
of Cans FoundRevenue from
Additional Cans
1 600 $12.00
2 400 $8.00
3 300 $6.00
4 200 $4.00
5 100 $2.00
6-8
Recycling Services• Suppose the deposit goes
up to 4¢ per can• Harry will spend 4
hours per day recycling
• Suppose Harry's dishwashing wage increases to $7
• Deposit stays at 2 ¢ each
• Harry collects cans for 2 hours a day
– Harry recycles more if:– Can deposit
increases
– Dish-washing wage decreases
Hours per Day
Additional Number of Cans
Found
1 600
2 400
3 300
4 200
5 100

5
6-9
Reservation Price Per Can
• What is the lowest deposit per can that would get Harry to recycle for an hour?
• What price makes his wage at recycling equal to his opportunity cost?
1st hour price is 1¢
2nd hour is 1.5¢
3rd hour is 2¢
4th hour is 3¢
5th hour is 6¢
Hours per Day
Additional Number of Cans
Found
1 600
2 400
3 300
4 200
5 100
6-10
Harry's Supply Curve
Reservation Price (¢)
Number of Cans (000s)
1 61.5 102 133 156 16
Recycled cans(100s of cans/day)
Dep
osit
(cen
ts/c
an)
6 10 13 16
6
3
2
1
6
6-11
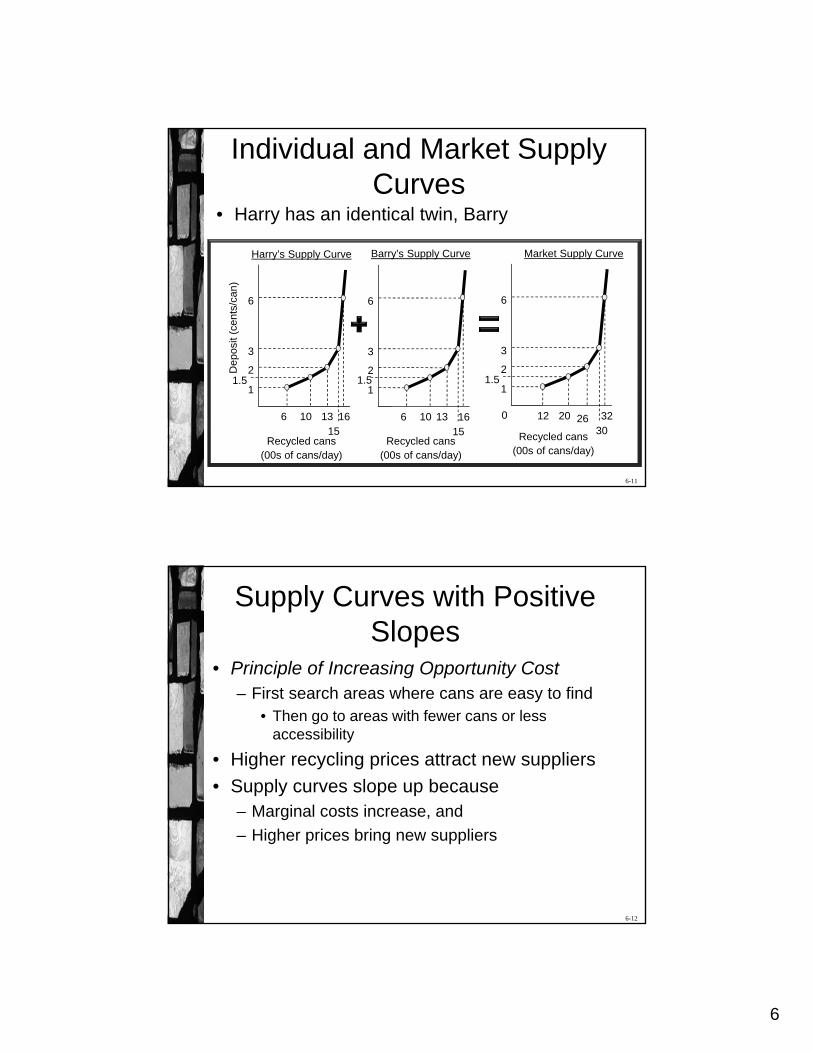
Individual and Market Supply Curves
• Harry has an identical twin, Barry
Recycled cans (00s of cans/day)
Dep
osit
(cen
ts/c
an)
Harry’s Supply Curve
Recycled cans (00s of cans/day)
Barry’s Supply Curve
Recycled cans (00s of cans/day)
016
6
16
6
32
6
6
1
6
1
12
1
10
1.5 1.5
10 20
1.5
13
3
2
1513
3
2
1526
3
2
30
Market Supply Curve
6-12
Supply Curves with Positive Slopes
• Principle of Increasing Opportunity Cost– First search areas where cans are easy to find
• Then go to areas with fewer cans or less accessibility
• Higher recycling prices attract new suppliers
• Supply curves slope up because– Marginal costs increase, and
– Higher prices bring new suppliers
7
6-13
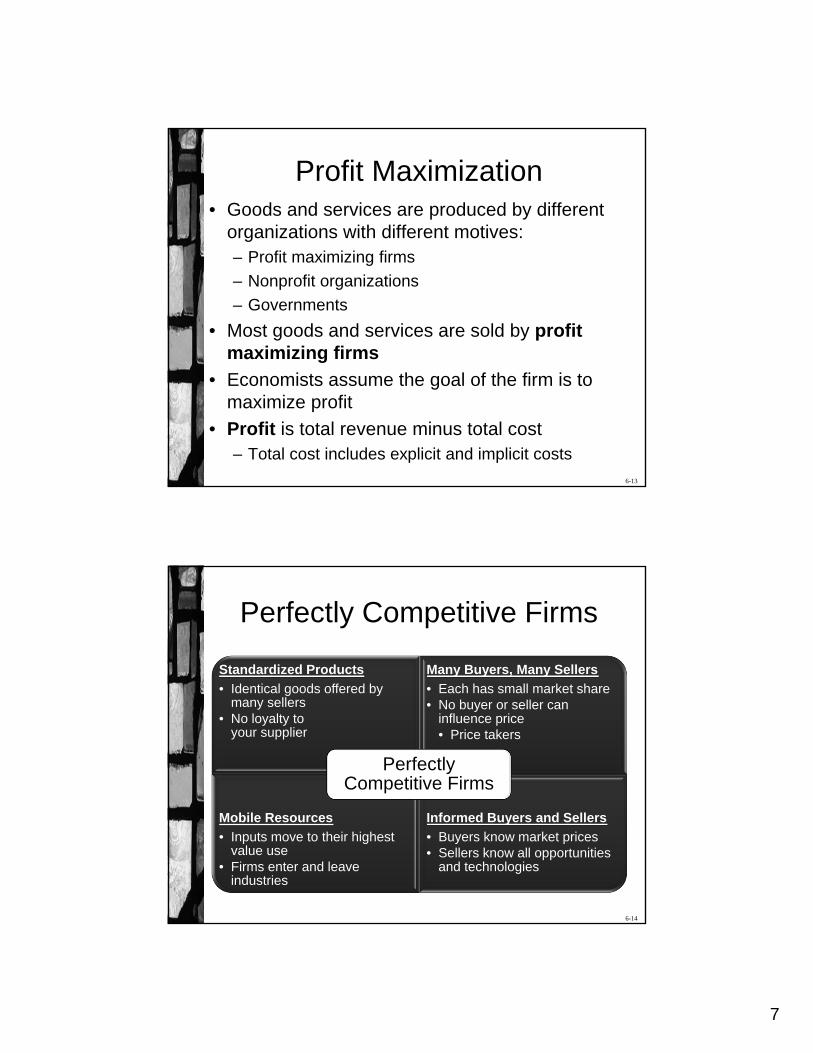
Profit Maximization• Goods and services are produced by different
organizations with different motives:– Profit maximizing firms
– Nonprofit organizations
– Governments
• Most goods and services are sold by profit maximizing firms
• Economists assume the goal of the firm is to maximize profit
• Profit is total revenue minus total cost– Total cost includes explicit and implicit costs
6-14
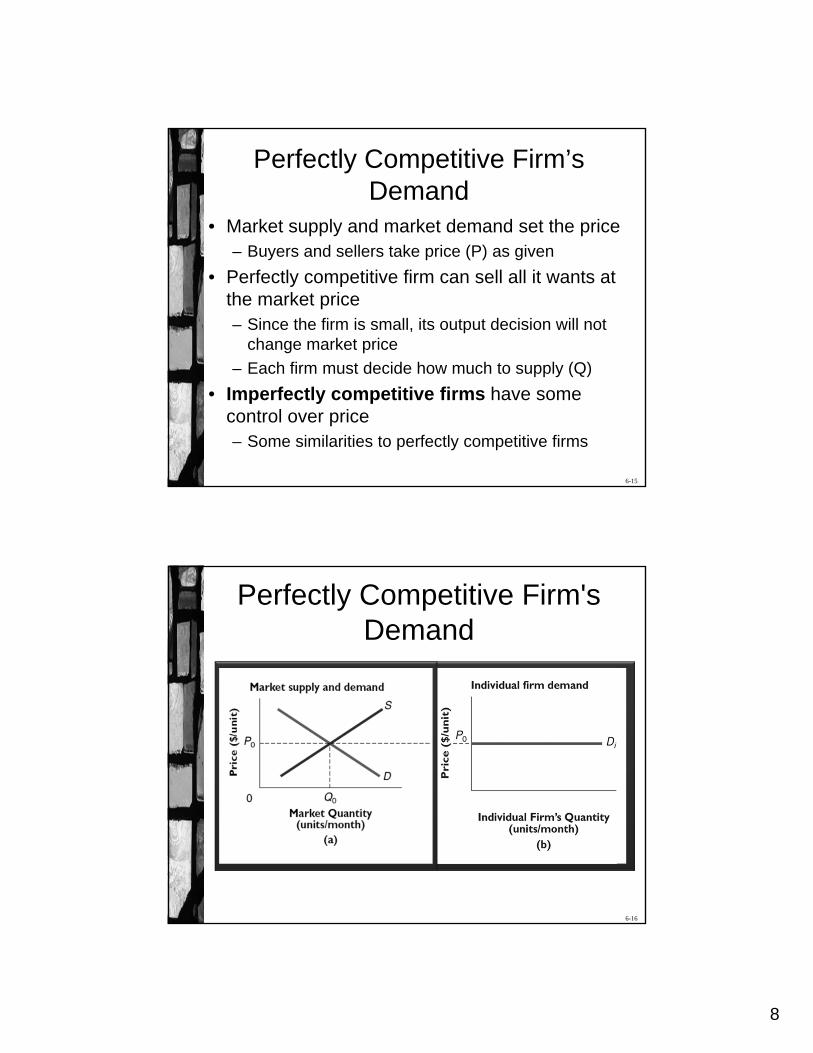
Perfectly Competitive Firms
Standardized Products
• Identical goods offered by many sellers
• No loyalty to your supplier
Many Buyers, Many Sellers
• Each has small market share• No buyer or seller can
influence price• Price takers
Mobile Resources
• Inputs move to their highest value use
• Firms enter and leave industries
Informed Buyers and Sellers
• Buyers know market prices• Sellers know all opportunities
and technologies
Perfectly Competitive Firms
8
6-15
Perfectly Competitive Firm’s Demand
• Market supply and market demand set the price– Buyers and sellers take price (P) as given
• Perfectly competitive firm can sell all it wants at the market price– Since the firm is small, its output decision will not
change market price
– Each firm must decide how much to supply (Q)
• Imperfectly competitive firms have some control over price– Some similarities to perfectly competitive firms
6-16
Perfectly Competitive Firm's Demand
9
6-17
Production Ideas• Production converts inputs into outputs
– Many different ways to produce the same product
– Technology is a recipe for production
• A factor of production is an input used in the production of a good or a service– Examples are land, labor, capital, and
entrepreneurship
• The short run is the period of time when at least one of the firm's factors of production is fixed
• The long run is the period of time in which all inputs are variable
6-18
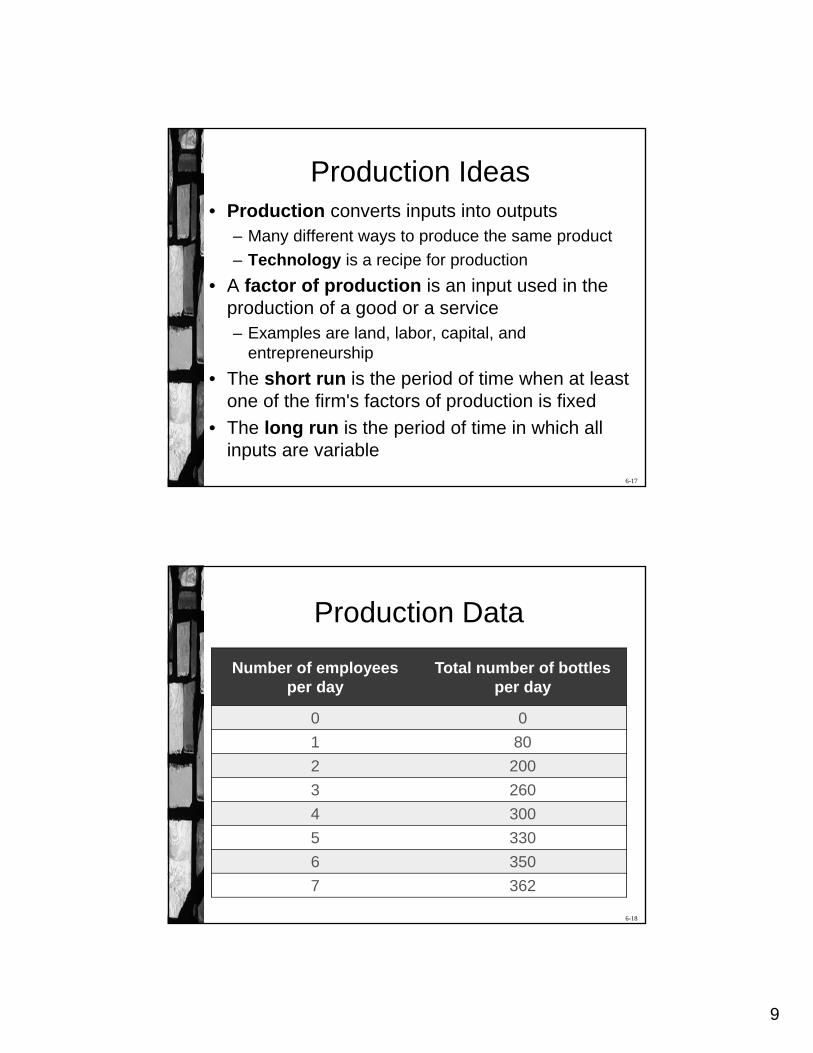
Production Data
Number of employees per day
Total number of bottles per day
0 0
1 80
2 200
3 260
4 300
5 330
6 350
7 362
10
6-19
Production in the Short Run
• A perfectly competitive firm has to decide how much to produce– Start by evaluating the short run
• The firm produces a single product (glass bottles) using two inputs (workers and a bottle-making machine)– Labor is a variable factor – it can be changed in
the short run
– Bottle-making machine (capital) is a fixed factor –it cannot be changed in the short run
• Determine the profit maximizing level of output
6-20
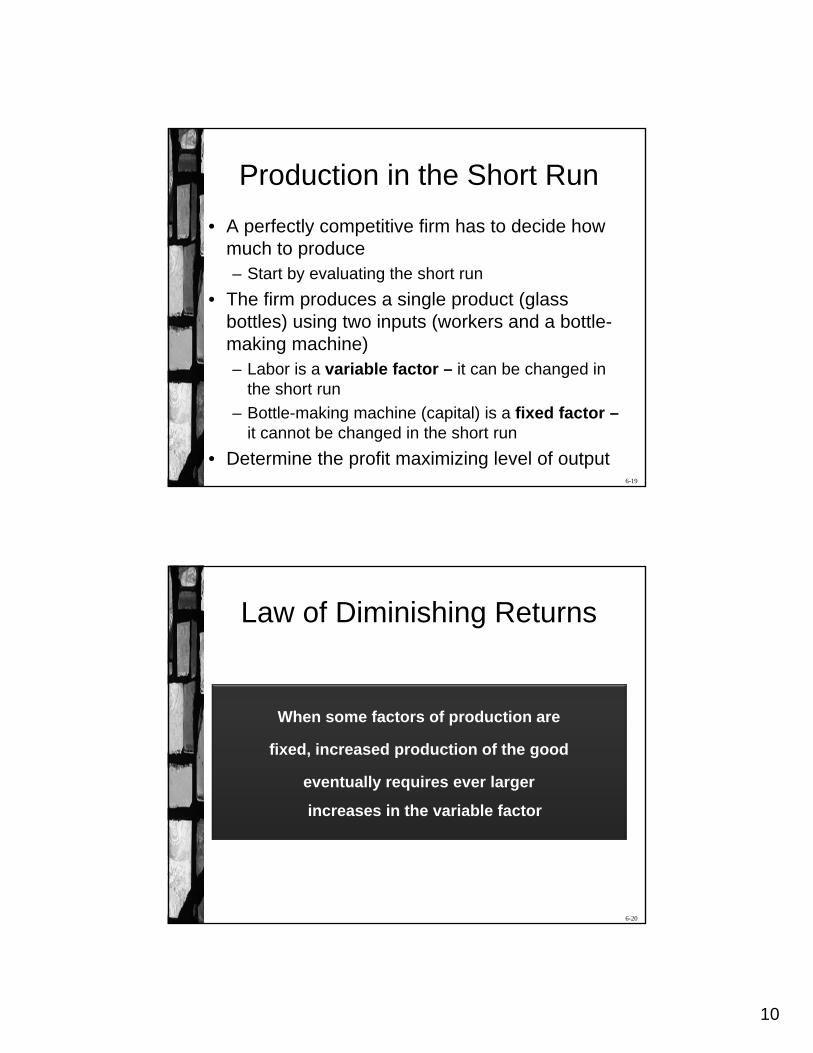
Law of Diminishing Returns
When some factors of production are
fixed, increased production of the good
eventually requires ever larger
increases in the variable factor
11
6-21
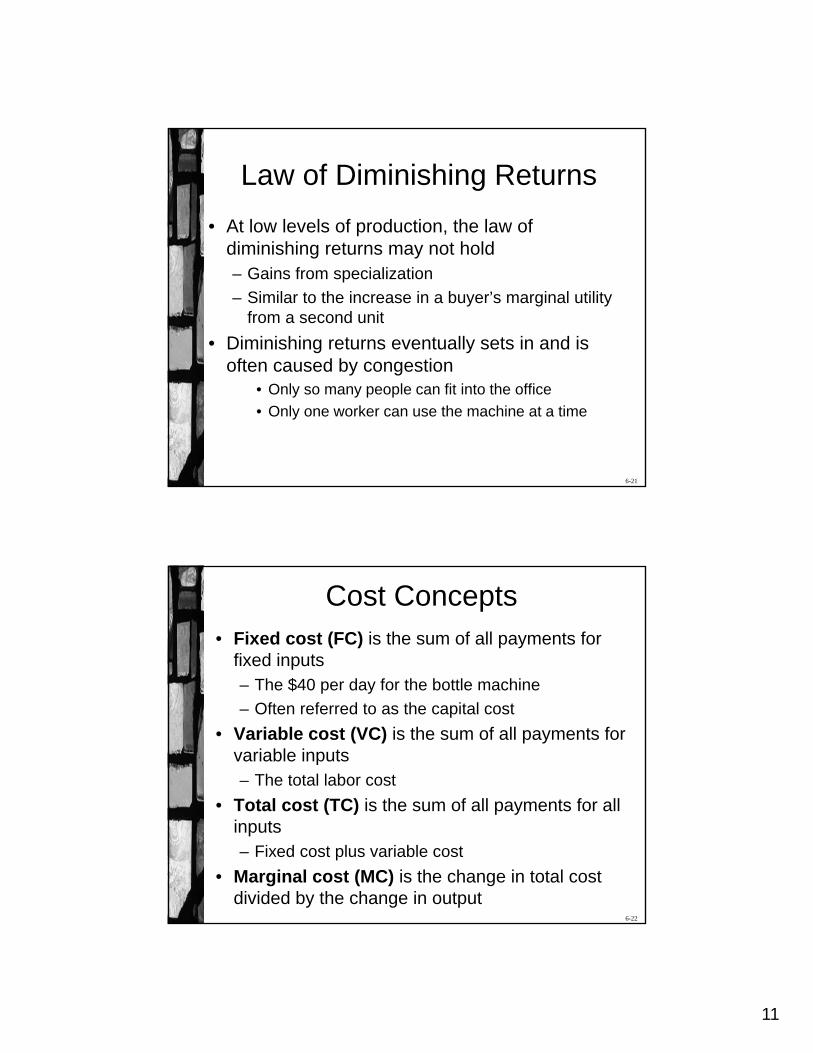
Law of Diminishing Returns
• At low levels of production, the law of diminishing returns may not hold– Gains from specialization
– Similar to the increase in a buyer’s marginal utility from a second unit
• Diminishing returns eventually sets in and is often caused by congestion
• Only so many people can fit into the office
• Only one worker can use the machine at a time
6-22
Cost Concepts• Fixed cost (FC) is the sum of all payments for
fixed inputs– The $40 per day for the bottle machine
– Often referred to as the capital cost
• Variable cost (VC) is the sum of all payments for variable inputs– The total labor cost
• Total cost (TC) is the sum of all payments for all inputs– Fixed cost plus variable cost
• Marginal cost (MC) is the change in total cost divided by the change in output
12
6-23
Find the Output Level that Maximizes Profit
Profit = total revenue – total cost
• Total revenue comes from selling the bottles
• Total cost = labor (fixed) cost + capital (variable) cost
• The firm must know about both revenues and costs in order to maximize profits– Increase output if marginal benefit is at least as great
as the marginal cost
– Decrease output if marginal benefit is greater than marginal cost
6-24
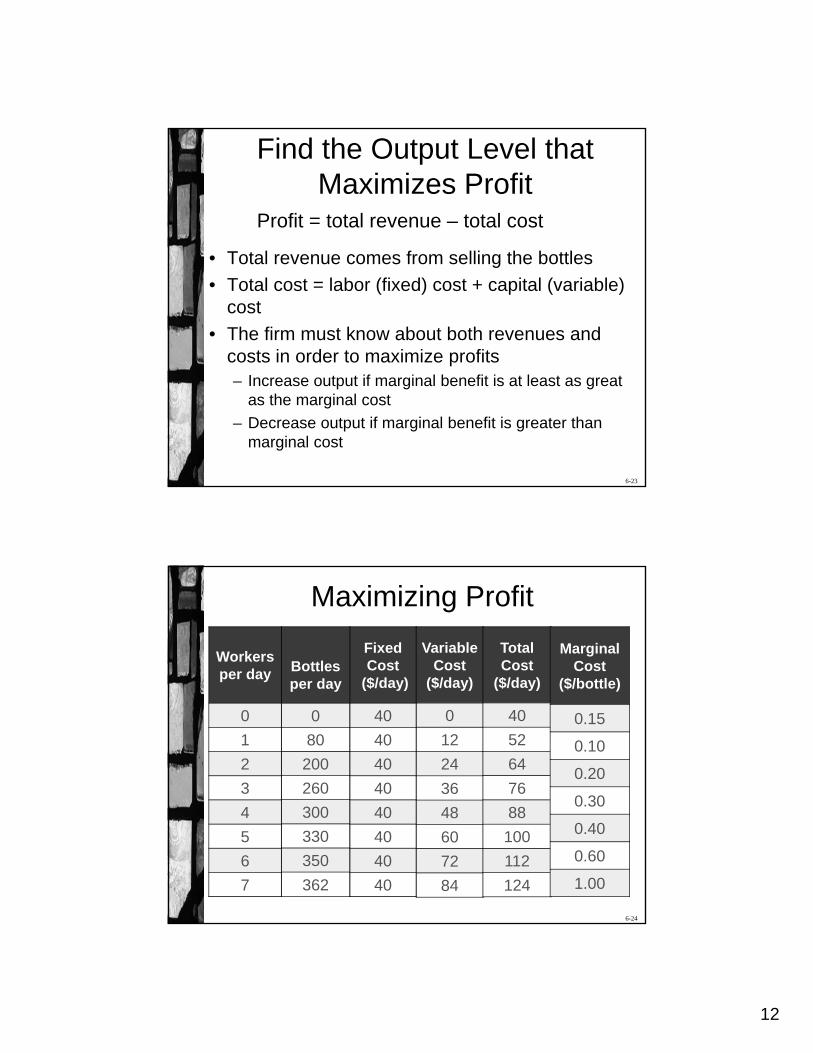
Maximizing Profit
Variable Cost
($/day)
0
12
24
36
48
60
72
84
Bottles per day
0
80
200
260
300
330
350
362
Fixed Cost
($/day)
40
40
40
40
40
40
40
40
Workersper day
0
1
2
3
4
5
6
7
Total Cost
($/day)
40
52
64
76
88
100
112
124
MarginalCost
($/bottle)
0.15
0.10
0.20
0.30
0.40
0.60
1.00
13
6-25
Fixed Cost and Profit Maximization
• The profit maximizing quantity does not depend on fixed cost
• A firm should increase output only if the extra benefit exceeds the extra cost (cost-benefit principle)
• The extra benefit is the price
• The extra cost is the marginal cost – the amount by which total cost increases when production rises
• The competitive firm produces where price equals marginal cost
• When diminishing returns apply, marginal cost rises as production increases
6-26
Shut-Down Decision
• Firms can make losses in the short run– Some firms continue to operate
– Some firms shut down
• The Cost – Benefit Principle applies even to losses
– Continue to operate if your losses are less than if you shut down
– Shut down if your losses are less than if you continued operating
14
6-27
Shut-Down Condition
• If the firm shuts down in the short run, it loses all of its fixed costs– So, fixed costs are the most a firm can lose
• The firm should shut down if revenue is less than variable cost: P x Q < VC for all levels of Q– The firm is losing money on every unit it makes
• If the firm's revenue is at least as big as variable cost, the firm should continue to produce– Each unit pays its variable costs and contributes to
fixed costs• Losses will be less than fixed costs
6-28
AVC and ATC
• Average values are the total divided by quantity– Average variable cost (AVC) is
AVC = VC / Q
– Average total cost (ATC) isATC = TC / Q
• Shut-down if
P x Q < VC
P < VC / Q
P < AVC
• Shut down if price is less than average variable cost

15
6-29
Profitable Firms
• A firm is profitable if its total revenue is greater than its total cost
TR > TC OR
P x Q > ATC x Q since ATC = TC / Q
– Another way to state this is to divide both sides of the inequality by Q to get
P > ATC
• As long as the firm's price is greater than its average total costs, the firm is profitable
6-30
Cost CurvesWorkers per day
Bottles per day
Variable Cost ($/day)
AVC ($ per
unit)
Total Cost
ATC ($ per
unit)
0 0 0 40
1 80 12 0.15 52 0.65
2 200 24 0.12 64 0.32
3 260 36 0.135 76 0.292
Marginal Cost
($/unit)
0.15
0.10
0.20
16
6-31
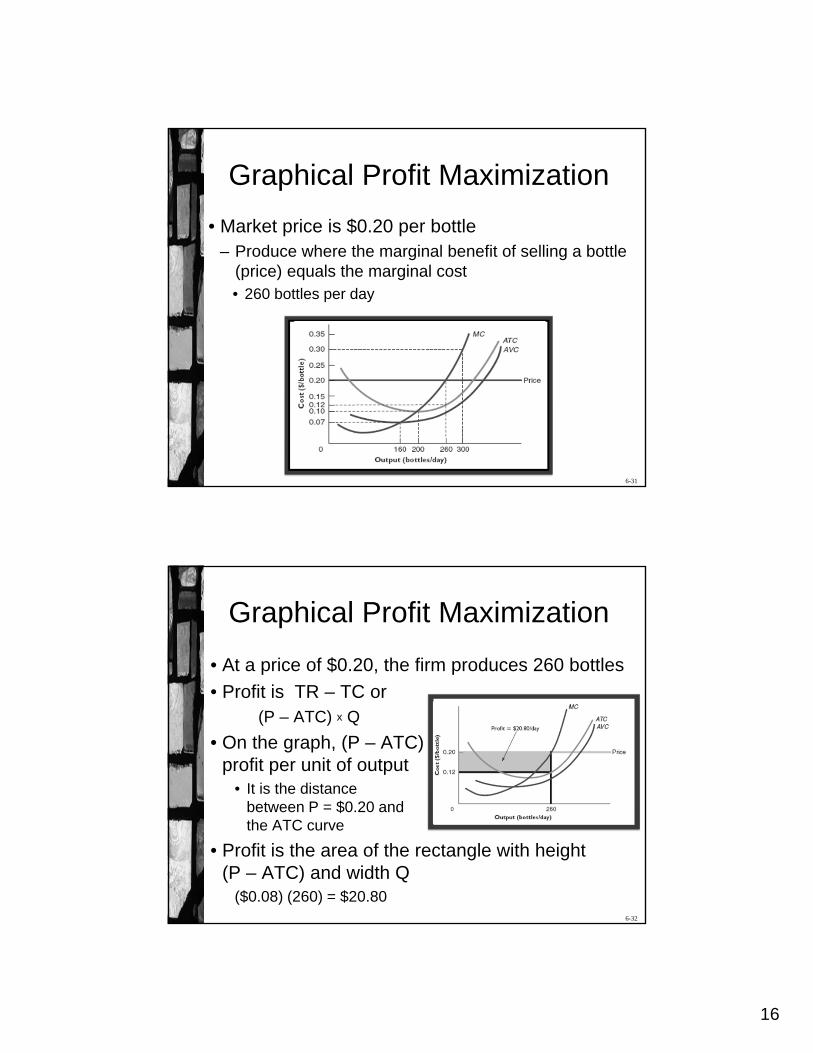
Graphical Profit Maximization
• Market price is $0.20 per bottle– Produce where the marginal benefit of selling a bottle
(price) equals the marginal cost • 260 bottles per day
6-32
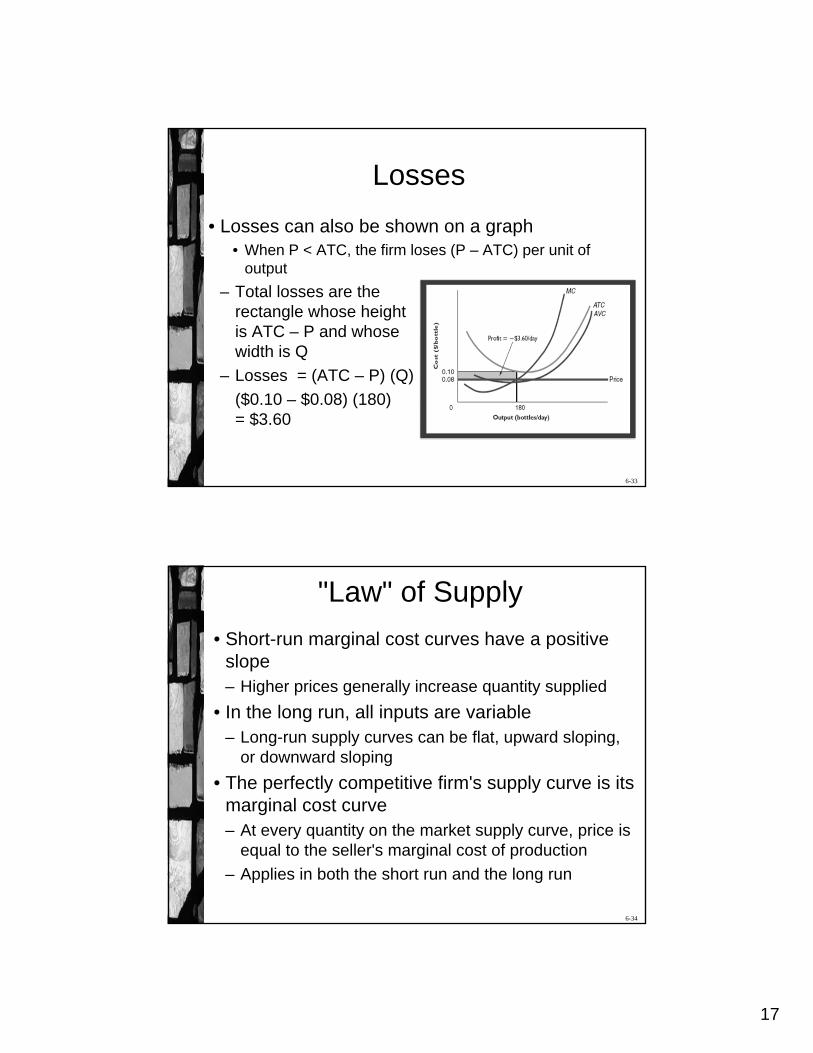
Graphical Profit Maximization
• At a price of $0.20, the firm produces 260 bottles
• Profit is TR – TC or (P – ATC) x Q
• On the graph, (P – ATC) is profit per unit of output
• It is the distance between P = $0.20 and the ATC curve
• Profit is the area of the rectangle with height (P – ATC) and width Q
($0.08) (260) = $20.80
17
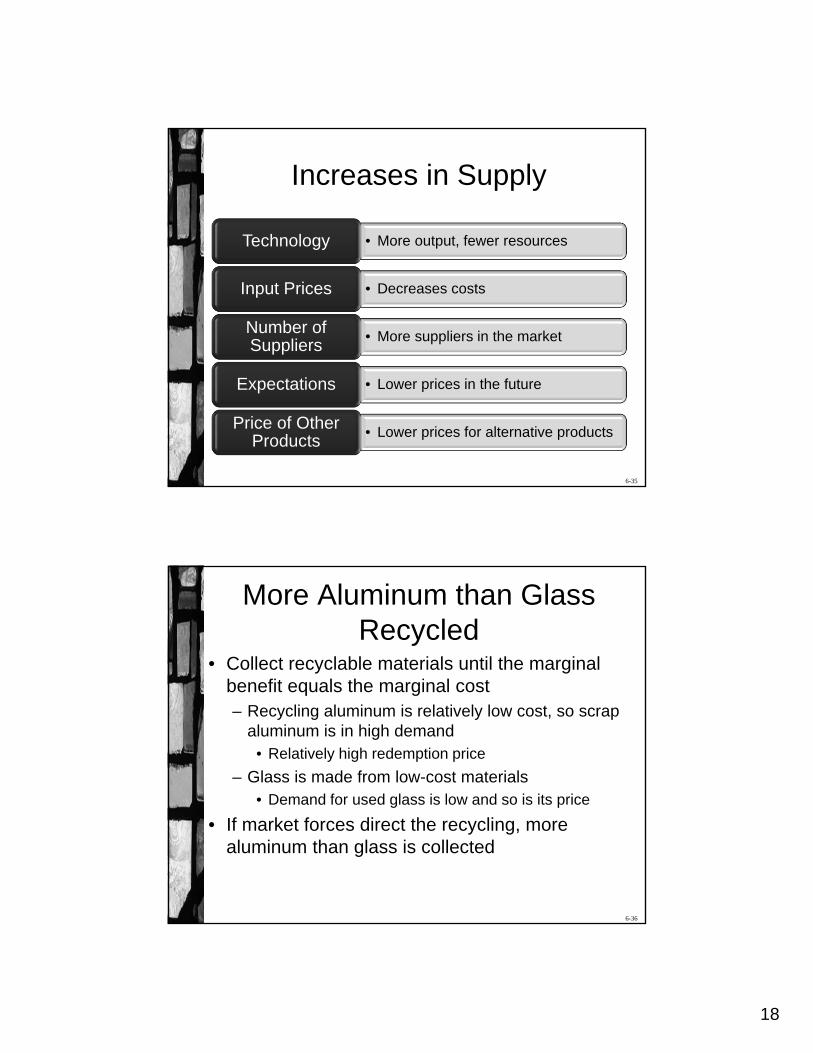
6-33
Losses
• Losses can also be shown on a graph• When P < ATC, the firm loses (P – ATC) per unit of
output
– Total losses are the rectangle whose height is ATC – P and whose width is Q
– Losses = (ATC – P) (Q)
($0.10 – $0.08) (180) = $3.60
6-34
"Law" of Supply
• Short-run marginal cost curves have a positive slope– Higher prices generally increase quantity supplied
• In the long run, all inputs are variable– Long-run supply curves can be flat, upward sloping,
or downward sloping
• The perfectly competitive firm's supply curve is its marginal cost curve– At every quantity on the market supply curve, price is
equal to the seller's marginal cost of production
– Applies in both the short run and the long run
18
6-35
Increases in Supply
• More output, fewer resourcesTechnology
• Decreases costs Input Prices
• More suppliers in the market Number of Suppliers
• Lower prices in the futureExpectations
• Lower prices for alternative productsPrice of Other
Products
6-36
More Aluminum than Glass Recycled
• Collect recyclable materials until the marginal benefit equals the marginal cost– Recycling aluminum is relatively low cost, so scrap
aluminum is in high demand• Relatively high redemption price
– Glass is made from low-cost materials • Demand for used glass is low and so is its price
• If market forces direct the recycling, more aluminum than glass is collected
19
6-37
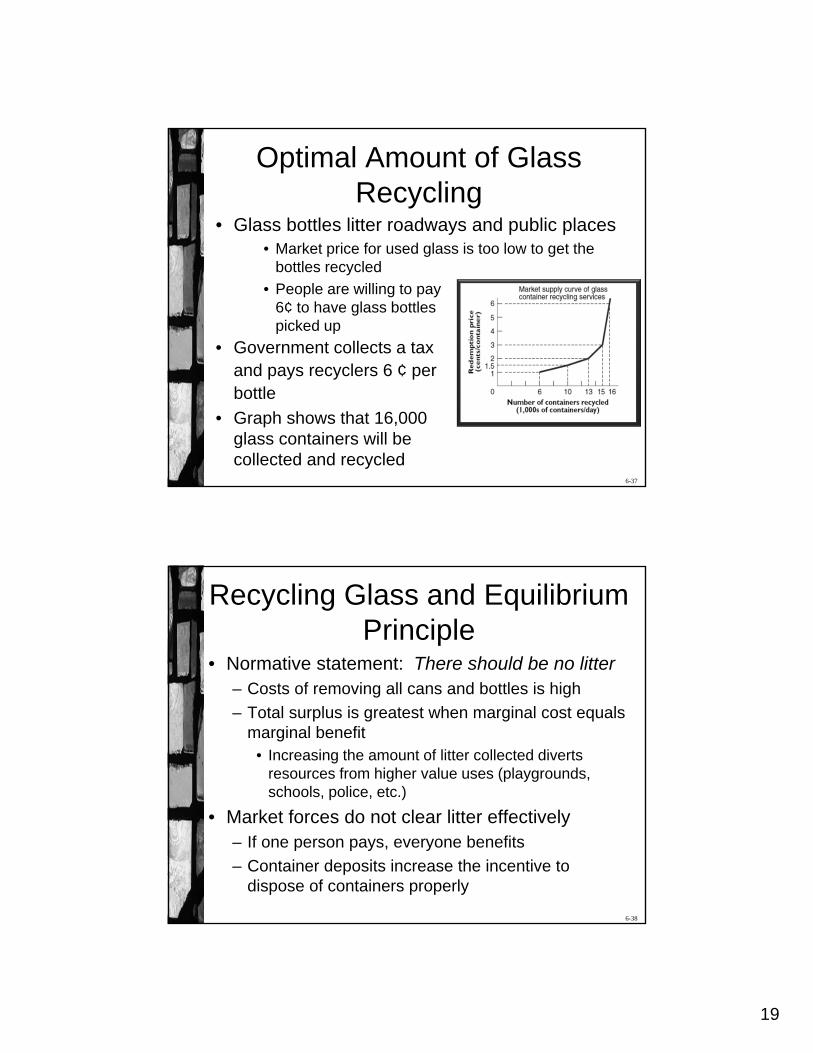
Optimal Amount of Glass Recycling
• Glass bottles litter roadways and public places• Market price for used glass is too low to get the
bottles recycled
• People are willing to pay 6¢ to have glass bottles picked up
• Government collects a tax and pays recyclers 6 ¢ per bottle
• Graph shows that 16,000 glass containers will be collected and recycled
6-38
Recycling Glass and Equilibrium Principle
• Normative statement: There should be no litter– Costs of removing all cans and bottles is high
– Total surplus is greatest when marginal cost equals marginal benefit
• Increasing the amount of litter collected diverts resources from higher value uses (playgrounds, schools, police, etc.)
• Market forces do not clear litter effectively– If one person pays, everyone benefits
– Container deposits increase the incentive to dispose of containers properly
20
6-39
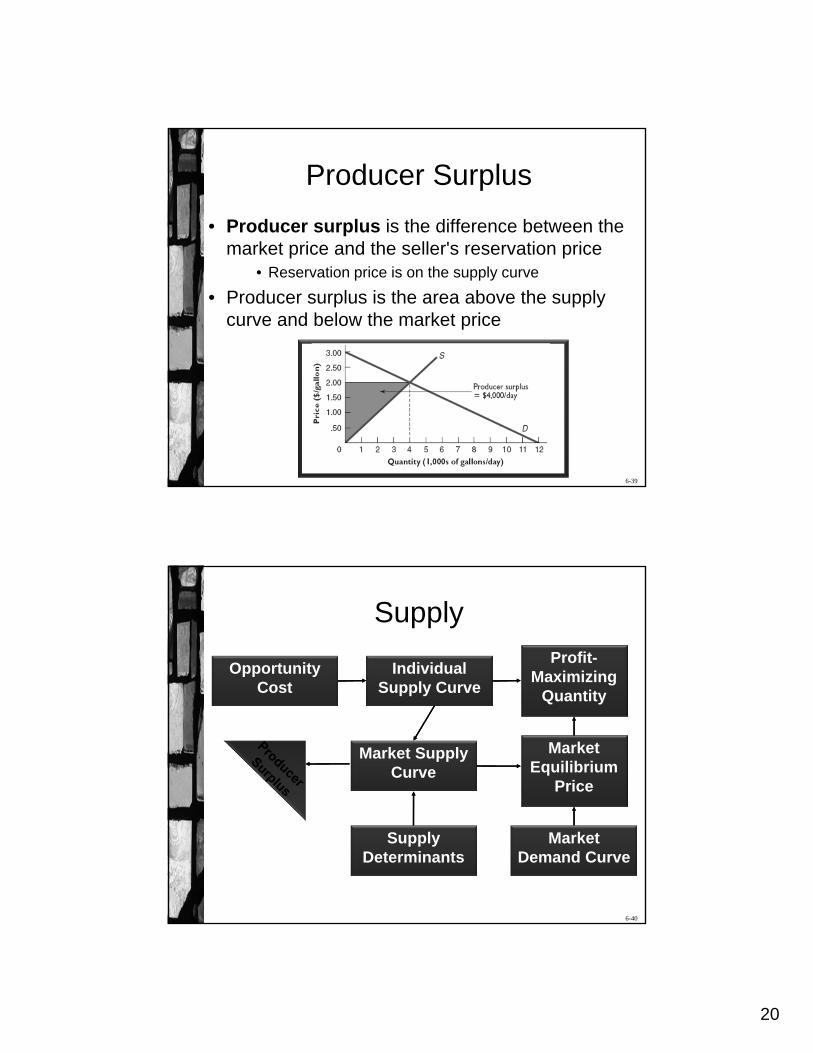
Producer Surplus
• Producer surplus is the difference between the market price and the seller's reservation price
• Reservation price is on the supply curve
• Producer surplus is the area above the supply curve and below the market price
6-40
Supply
Individual Supply Curve
Market Supply Curve
Opportunity Cost
Market Equilibrium
Price
Market Demand Curve
Profit-Maximizing
Quantity
Supply Determinants