changing the world of logistics - wisetech globalir.wisetechglobal.com/formbuilder/_resource/... ·...
TRANSCRIPT

CHANGING THE WORLD OF LOGISTICSONE INNOVATION AT A TIME
2017 ANNUAL REPORT

CONTENTSFinancial highlights 2Delivered on our strategy 4Chairman’s letter 6CEO’s message 8Our business 10Our innovation pipeline 12
Our expansion pipeline 14Environment, social and governance 16Board of Directors 20Operating and financial review 22Remuneration Report 29Directors’ Report 40
Lead auditor’s independence declaration 43Risk management 44Financial Report 47Independent auditor’s report 88Shareholder information 94Glossary 95Corporate directory 96
ANNUAL TRANSACTIONS
44+billion
COUNTRIES
125+
CUSTOMERS
7,000+
LANGUAGES
30
DEVELOPMENT HOURS
3+million
LINES OF CODE
18+million
FY13-FY17 INVESTMENT IN
INNOVATION
$167million
This annual report is a summary of WiseTech’s and its subsidiary companies’ operations, activities and financial position as at 30 June 2017. In this report, references to “WiseTech”, “the Company”, “the Group”, “we”, “us” and “our” refer to WiseTech Global Limited (ABN 41 065 894 724) unless otherwise stated.
Where stated, financial measures for the periods FY13 to FY16 have been prepared on a pro forma (“PF”) basis. For details see page 93. Pro forma information in this report is unaudited.
This document is dated 22 September 2017.
About this document
We are changing the world of logistics and transforming global trade one innovation at a time.
Our CargoWise One platform is the leading deeply‑integrated global logistics execution platform of its kind, and our solutions are used by over 7,000 customers across 125 countries.
Our industry expertise, insights and innovation capability position us at the forefront of technology managing international logistics, cross‑border compliance challenges, changes in trade patterns and evolving logistics regulation.
1WiseTech Global | annual report 2017

1 Acquisitions are those executed in FY17: Softship AG (“Softship”), znet group GmbH (“znet”) and ACO Informatica S.r.l. (“ACO”). 2 Annual attrition rate is a customer attrition measurement relating to the CargoWise One application suite (excluding any customers on acquired
legacy platforms). A customer’s users are included in the customer attrition calculation upon leaving, i.e. having not used the product for at least four months. Based on attrition rate <1% for each year of the last five financial years FY13–FY17.
31% CAGR
$153.8m
over 5 yearsFY13PF–FY17
u50%revenuevs FY16
annual customer attrition rate 2 across CargoWise One global platform
<1%every yearfor last 5 years
92%on-demandusage-based licensing ex acquisitions 1
up 9pp since FY16PF
99%recurring revenueex acquisitions 1
ACCELERATED REVENUE GROWTH
HIGH RECURRING, HIGH QUALITY REVENUE
LOW CUSTOMER ATTRITION
FINANCIAL HIGHLIGHTS
51.9
43.0
FY13 FY14 FY15 FY16 FY17
153.8
103.3
56.7 66
.0 70.0 79
.6
102.8
53.9
31.5
21.9
18.6
8.9
35%
30%28%28%
17%
FY13 FY14 FY15 FY16 FY17
Statutory EBITDA marginPro forma EBITDA
REVENUE ($million) EBITDA ($million)
$153.8m $53.9m
growth in revenue (statutory) to
growth in EBITDA (pro forma) to
u50% u71%
Pro forma2
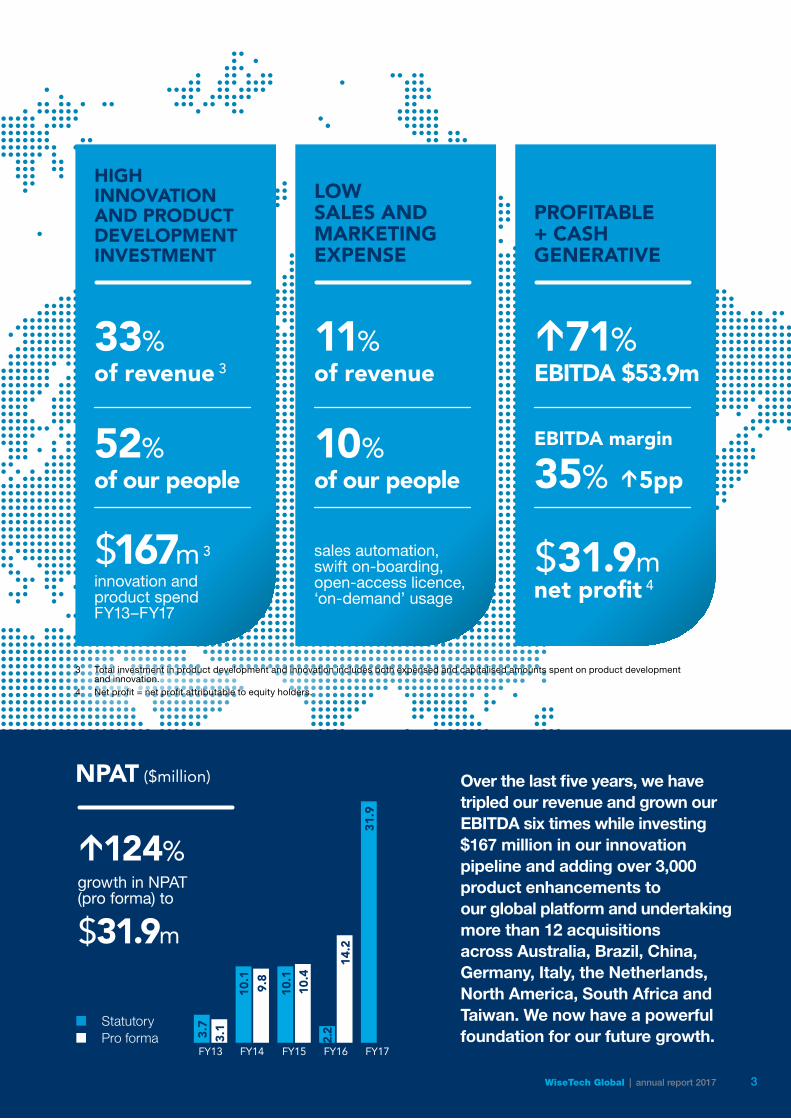
3 Total investment in product development and innovation includes both expensed and capitalised amounts spent on product development and innovation.
4 Net profit = net profit attributable to equity holders.
33%
52%
$167m 3
of revenue 3
of our people
innovation and product spend FY13–FY17
11%
10%
of revenue
of our people
sales automation, swift on-boarding, open-access licence, ‘on-demand’ usage
HIGH INNOVATION AND PRODUCT DEVELOPMENT INVESTMENT
LOW SALES AND MARKETING EXPENSE
3.13.7
FY13 FY14 FY15 FY16 FY17
31.9
14.2
10.1
9.8
10.1
10.4
2.2StatutoryPro forma
EBITDA ($million) NPAT ($million)
$31.9m
growth in NPAT (pro forma) to
u124%
Over the last five years, we have tripled our revenue and grown our EBITDA six times while investing $167 million in our innovation pipeline and adding over 3,000 product enhancements to our global platform and undertaking more than 12 acquisitions across Australia, Brazil, China, Germany, Italy, the Netherlands, North America, South Africa and Taiwan. We now have a powerful foundation for our future growth.
$31.9m
EBITDA $53.9m
net profit 4
35% u5pp
EBITDA margin
u71%
PROFITABLE + CASH GENERATIVE
3WiseTech Global | annual report 2017
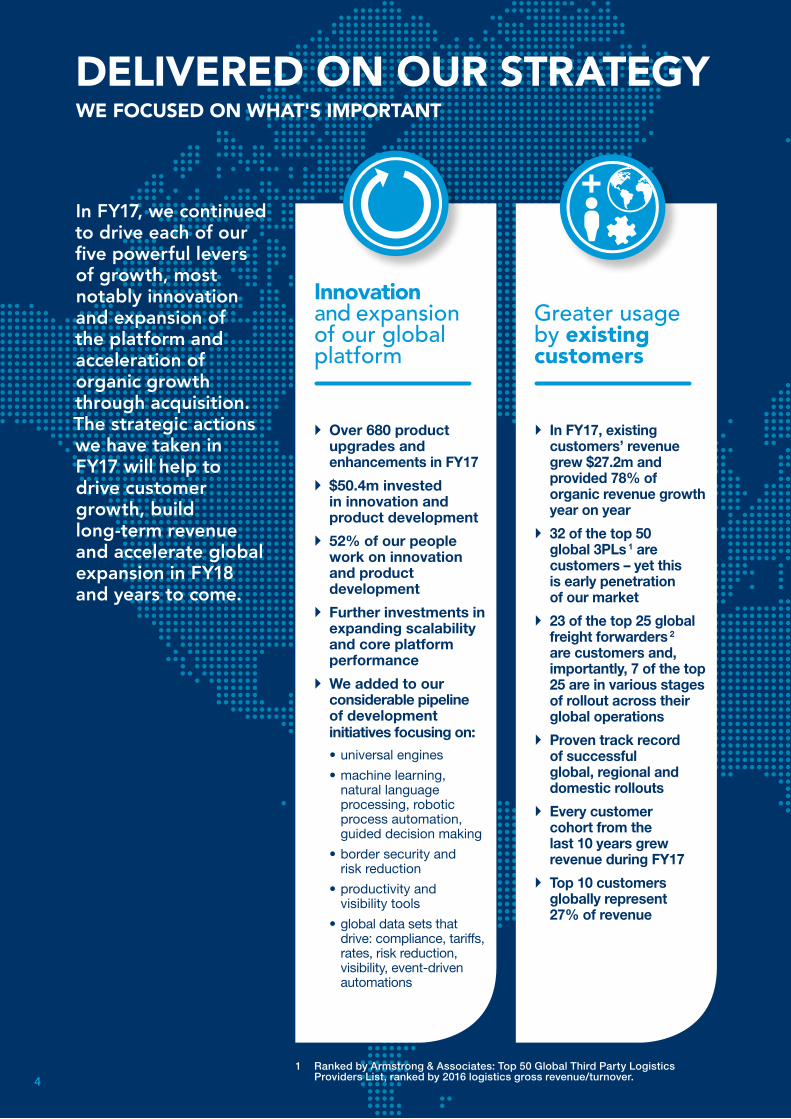
Innovation and expansion of our global platform
` Over 680 product upgrades and enhancements in FY17
` $50.4m invested in innovation and product development
` 52% of our people work on innovation and product development
` Further investments in expanding scalability and core platform performance
` We added to our considerable pipeline of development initiatives focusing on:
• universal engines
• machine learning, natural language processing, robotic process automation, guided decision making
• border security and risk reduction
• productivity and visibility tools
• global data sets that drive: compliance, tariffs, rates, risk reduction, visibility, event-driven automations
` In FY17, existing customers’ revenue grew $27.2m and provided 78% of organic revenue growth year on year
` 32 of the top 50 global 3PLs 1 are customers – yet this is early penetration of our market
` 23 of the top 25 global freight forwarders 2 are customers and, importantly, 7 of the top 25 are in various stages of rollout across their global operations
` Proven track record of successful global, regional and domestic rollouts
` Every customer cohort from the last 10 years grew revenue during FY17
` Top 10 customers globally represent 27% of revenue
Greater usage by existing customers
DELIVERED ON OUR STRATEGYWE FOCUSED ON WHAT'S IMPORTANT
1 Ranked by Armstrong & Associates: Top 50 Global Third Party Logistics Providers List, ranked by 2016 logistics gross revenue/turnover.
In FY17, we continued to drive each of our five powerful levers of growth, most notably innovation and expansion of the platform and acceleration of organic growth through acquisition. The strategic actions we have taken in FY17 will help to drive customer growth, build long-term revenue and accelerate global expansion in FY18 and years to come.
4
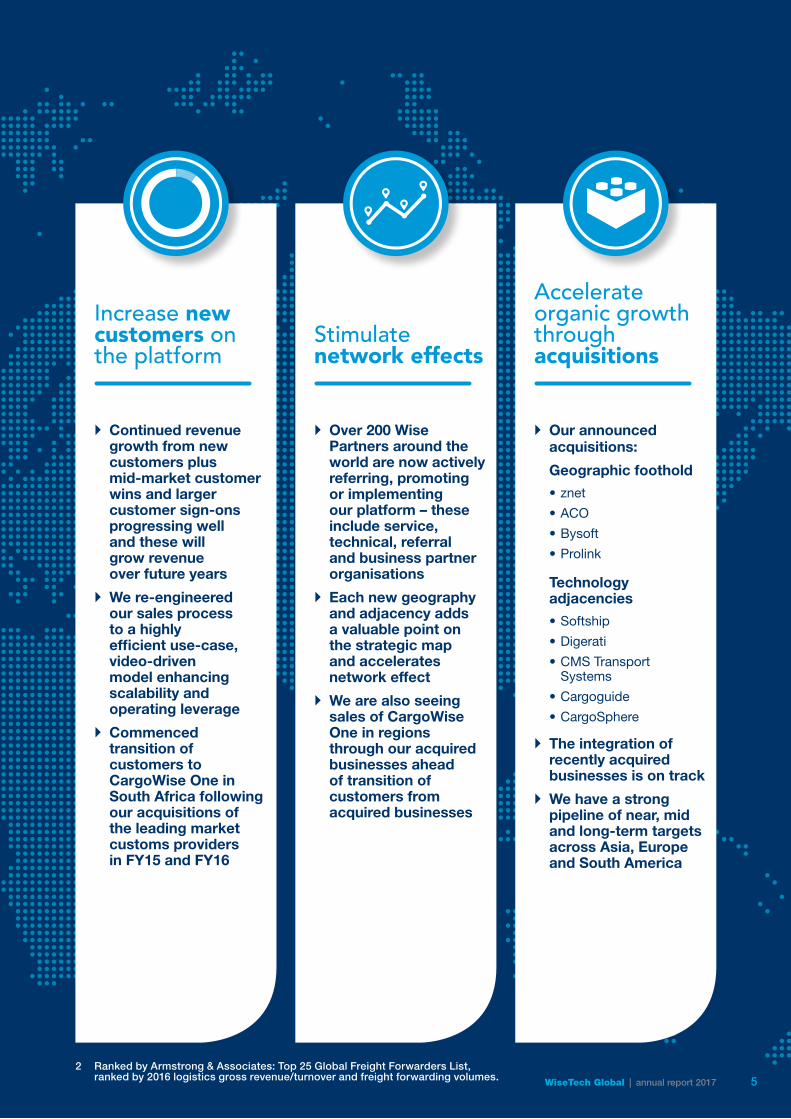
` Continued revenue growth from new customers plus mid‑market customer wins and larger customer sign‑ons progressing well and these will grow revenue over future years
` We re‑engineered our sales process to a highly efficient use‑case, video‑driven model enhancing scalability and operating leverage
` Commenced transition of customers to CargoWise One in South Africa following our acquisitions of the leading market customs providers in FY15 and FY16
` Over 200 Wise Partners around the world are now actively referring, promoting or implementing our platform – these include service, technical, referral and business partner organisations
` Each new geography and adjacency adds a valuable point on the strategic map and accelerates network effect
` We are also seeing sales of CargoWise One in regions through our acquired businesses ahead of transition of customers from acquired businesses
` Our announced acquisitions:
Geographic foothold
• znet
• ACO
• Bysoft
• Prolink
Technology adjacencies
• Softship
• Digerati
• CMS Transport Systems
• Cargoguide
• CargoSphere
` The integration of recently acquired businesses is on track
` We have a strong pipeline of near, mid and long‑term targets across Asia, Europe and South America
Increase new customers on the platform
Stimulate network effects
Accelerate organic growth through acquisitions
2 Ranked by Armstrong & Associates: Top 25 Global Freight Forwarders List, ranked by 2016 logistics gross revenue/turnover and freight forwarding volumes. 5WiseTech Global | annual report 2017
Our business continued to experience strong growth during FY17, with revenues up 50% to $153.8m, and net profit attributable to equity holders increasing to $31.9m compared to $2.2m for FY16. These pleasing results were fuelled by significant growth in revenue from our existing customers across transactions, modules and geographies as well as new sales worldwide and further acceleration of organic growth through targeted acquisitions. All compelling evidence of the strength of our technology and powerful ‘five levers of growth’ strategy.
Importantly, our revenues are high quality. Our recurring revenue is 99% of total revenue (excluding recent acquisitions) and our customer attrition rate (by CargoWise One customers) was less than 1% for the fifth year in succession.
In FY17, we invested $50.4m, or 33% of our revenue, and over 50% of our people in product development and innovation, delivering over 680 product upgrades and enhancements added seamlessly to our platform and made available to our customers across 125 countries. This brings our total investment in product development and innovation over the last five years to $167m. Our relentless investment in expanding and enhancing our CargoWise One platform ensures that we can maintain a highly efficient sales and marketing model – with sales and marketing expenses in FY17 accounting for only 11% of revenue.
During FY17, and in the months since, we have announced nine acquisitions across the globe. Over time, as we integrate these businesses and their staff and customers, they will extend the depth, breadth and value of our industry‑leading technology and provide a strong base for further accelerating our organic growth.
With our compelling momentum in FY17, plus expansion of our powerful CargoWise One platform, and continued growth across our global operations, in FY18 we expect to deliver revenue growth of 30%‑37% and EBITDA growth of 32%‑39%. This translates to FY18 revenue of $200m‑$210m and EBITDA of $71m‑$75m.
DividendsWe have declared a fully franked final dividend of 1.2 cents per share for FY17, payable 4 October 2017. This is in addition to the 1 cent interim
CHAIRMAN'S LETTER
“In FY17 our people and operations delivered strong, high quality growth in revenues and profit while expanding our global platform and geographic footprint to further build our leadership position.”
6
dividend paid to shareholders in April 2017. We have also introduced a dividend reinvestment plan to enable eligible shareholders to reinvest their dividends to acquire additional WiseTech shares.
Our balance sheet remains robust, supported by $54.9m of net cash flows from operating activities. At 30 June 2017, we held cash and cash equivalents of $101.6m, compared to $109.5m a year ago, as we continued to invest for future growth, including our strategic acquisitions in Germany and Italy during FY17.
Our ongoing dividend policy is to target a dividend payout ratio of up to 20% of our annual statutory net profit after tax.
Board activitiesOur Company has built and rightly takes pride in its strong and unique culture. This culture is central to the Company’s growth, technological leadership and global market presence. It is important that as the Board grows and refreshes that it too embraces and reflects these qualities.
To this end we intend to add a further independent director to the Board with a focus on technology and innovation in the 2018 financial year.
The Board and Remuneration Committee have also taken the opportunity to reflect upon and reassess our remuneration approaches for both executives and the broader staff community and to establish a new remuneration framework. We know the actions our people take in FY18 will impact shareholder value for many years to come. Therefore, for WiseTech, we believe effective performance incentives are best focused on key strategic priorities, financial targets and operational KPI lead measures and delivered in the form of multi‑year deferred equity to ensure alignment with our shareholders’ interests. This framework has been adopted for FY18.
For further details, please refer to the Remuneration Report and the letter from Mike Gregg, Chair of the Remuneration Committee.
Our peopleOur long‑term employment practices have strongly favoured merit, talent and ability and as a result we benefit from having a diverse mix of extraordinary people drawn from over 40 countries, ranging in age from 18 to 70+, with eclectic backgrounds and remarkable skills. Including our recently announced acquisitions, we now have a team of over 900 people. Importantly, since 2014 we have expanded our WiseTech Global family threefold while retaining and further embedding our prized culture of freedom and responsibility with productivity at the centre of everything. We highly engineer our processes, automating where we can thus freeing our people to develop further, accelerate growth and focus on innovation for the future.
On behalf of the Board, I would like to thank our CEO, Richard White, for his continual inspiration and vision, and also the broader WiseTech Global team whose dedication and commitment delivered these results and our growth for the future.
Finally, we collectively thank our shareholders both old and new for your support and acknowledge the trust you have placed in us.
We will do our very best.
Charles Gibbon CHAIRMAN
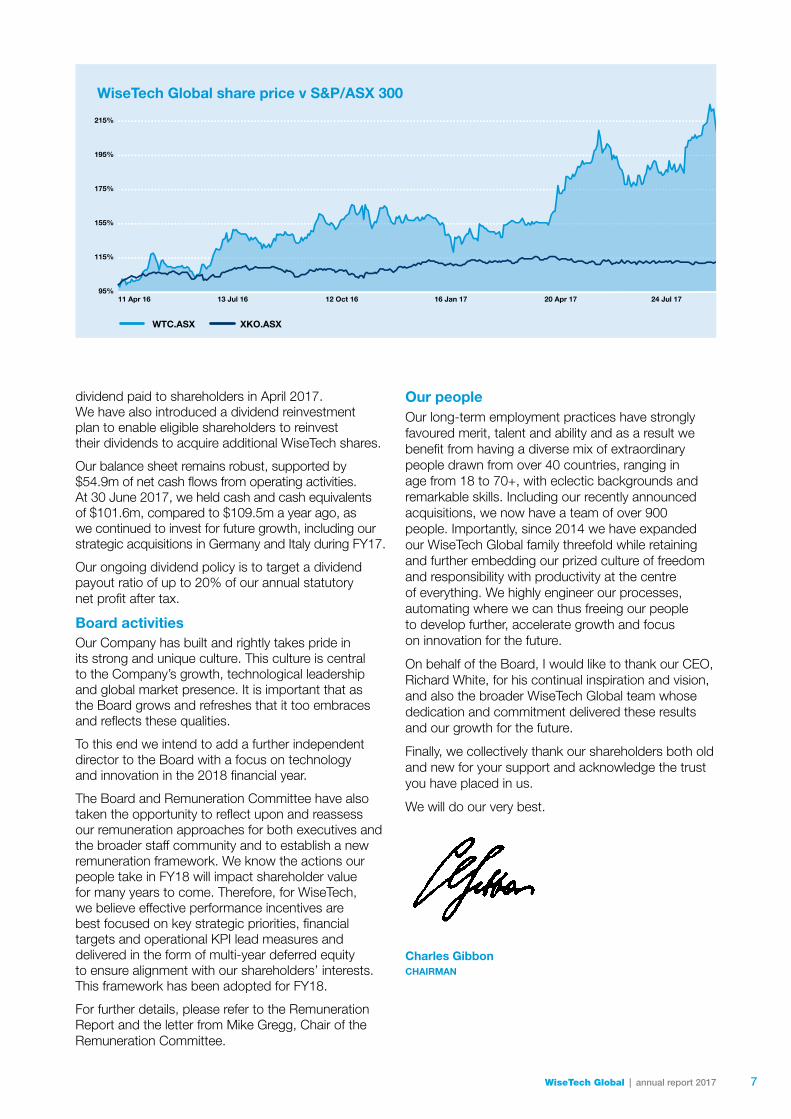
11 Apr 16 24 Jul 1720 Apr 1716 Jan 1712 Oct 1613 Jul 1695%
115%
155%
175%
195%
215%
WiseTech Global share price v S&P/ASX 300
WTC.ASX XKO.ASX
7WiseTech Global | annual report 2017
This year, we have started to see our long‑term strategy gain traction. Our solid progress on the execution of strategy in prior periods is responsible for the acceleration in revenue growth – FY17 is up 50% on FY16 which in turn was up 47% on FY15, and our annual growth rate over the past five years is 38%, all of which is a strong reflection of the power of our global platform, loyal customer base and our growth strategy.
At the same time, we have more than tripled our revenue, grown EBITDA six times, invested $167 million in our innovation pipeline, added more than 3,000 product enhancements to our platform and undertaken acquisitions across Australia, China, South Africa, Italy, Germany, Taiwan and Brazil.
And yet, it is important to understand that we see this as just the start, a necessary foundation for future growth, not the end result. The additional strategic actions we have taken in FY17 will help to drive customer growth, build long‑term revenue and accelerate global expansion in FY18 and years to come.
Sustainable, high growth and progress to our goal is a long gameFor us, building on growth is a long game, played with care and precision. Because of our very low customer attrition rate, our high recurring revenue and our on‑demand licence model, our day‑to‑day business is stable and predictable. There are no short‑cuts, quick fixes or single events that change our growth dramatically, instead it is the continued diligent and focused execution of every growth lever and every improvement available to us.
All five levers of growth contributed to the strong operating result in FY17 and will continue to support and extend growth into the future. We focus on innovation and product leadership. With, our CargoWise One technology, the only single‑source code, deeply integrated, global, supply chain execution platform of its kind, we are in a leading position which we advance to the tune of over 600 product enhancements annually. We further add to our considerable technology pipeline by investing research and development resources into machine learning, natural language processing, robotic process automation and guided decision making driven by vast volumes of transactional and border agency data sets to enable enhanced compliance, due diligence, risk assessment and risk mitigation for the logistics industry.
CEO'S MESSAGE“At WiseTech, we have created the global platform, scale and development capacity to revolutionise logistics execution across trade routes, borders and transport modes and we will not rest until we have delivered on our vision to become the ‘operating system for global logistics’. We do the difficult, complex things that others can’t, and we take the time to do it right. We believe in ‘slower today, faster forever’, in order to build a future that is bigger, better and brighter. We deliver, and we intend to keep delivering, on our commitments to our customers, partners, staff and shareholders and the communities we serve.”
8
Growth from existing customers and growth from new customers add more revenue as more customers transact on our platform and they continue to add more users, transactions, sites, modules and geographies over time. We further accelerate our organic growth with targeted ‘foothold and adjacent’ acquisitions, with more than 12 completed since 2013, and we will continue to do so for many years to come.
We are also focused on powerful and measurable network effects from our technology and our referral, certification and partner programs with over 200 external WisePartner organisations across the world which add to the powerful industry trends accelerating our business.
We are true innovators – improving everything that makes a meaningful differenceGood technology businesses innovate products. Great technology businesses, like WiseTech, innovate relentlessly in product development, while simultaneously innovating across business process, commercial, technical, sales and marketing and customer service models.
As we grow, we continue to confront and eliminate the internal and external factors that constrain most company’s growth and scalability and reduce their efficiency. This is not window dressing, but a continuum of iterative changes and improvements that have brought us consistent, rapid growth.
Over the last decade, we have very carefully and deliberately, constructed, tested and iterated our commercial approach, learned how to industrialise our business processes, designed effective ways of growing teams of motivated, smart people and built efficient innovation and development architectures to deliver and grow the leading global integrated execution platform.
We innovate anywhere there is a significant, valuable, sustainable advantage to be gained and this must necessarily include management structure, agility, culture and openness.
I particularly love the fact that WiseTech Global sets out to be different in the important areas that matter and that allow us a significant competitive edge. We will continue to think very differently. We believe that ‘being different does not guarantee being great, but being great does require being different’.
Technology will drive global logistics and will create winners (and losers)Our customers are logistics service providers who are key to the way the world trades and are a fundamental part
of the global economy. Our market is global, vast and incredibly complex while our customers are highly specialised into different vertical capabilities. Due to historically limited technology options and legacy systems, fragmentation has been a long‑term feature of that industry.
We see WiseTech as a powerful change leader, proven, safe, efficient, and capable of helping logistics providers across the world address the compound challenges of razor‑thin margins, legacy systems, exponential transaction volume growth from the explosion in eCommerce and constant regulatory changes.
We see a world full of opportunity for our thousands of existing customers. They have already made the switch to our solutions, which are being accelerated by advances in technology and they will see more and more improvement from innovations in machine learning, natural language processing, robotic process automation and what we call “guided decision making”.
We intend to bring meaningful, continual improvement to global logistics – replacing ageing, legacy, proprietary and domestic systems and old‑world processes with globally applicable, efficient, highly automated, deeply integrated capabilities. We have the global platform, scale and development capacity to revolutionise industry across trade routes and borders and we will not rest until we have delivered fully on our vision to create the ‘operating system for global logistics’. Whilst we have made clear inroads towards this audacious goal, there is still so much to do. Together with our customers, partners, staff and shareholders and the communities we inhabit, we intend to make significant and continuous progress towards this vision.
Commitment to our futureAt WiseTech, we work hard with deep focus and the endless drive and vigilance required to continue to grow the business. I can tell you with 100% conviction, I really love my job and working with our fantastic team of talented motivated people around the world. Together we are all committed to continuing to grow our business rapidly and for the very long term.
I thank each of our shareholders for their investment in WiseTech Global, and for giving us the opportunity to build an even more powerful and valuable organisation.
Richard White FOUNDER CEO
9WiseTech Global | annual report 2017

CUSTOMERS AND CARGOWISE ONE
We are a leading provider of software solutions to the logistics industry globally, to more than 7,000 customers worldwide, across 125 countries supported through offices in Australia, New Zealand, China, Singapore, South Africa, the United Kingdom, the United States, Germany, Italy and Brazil.
Our industry‑leading flagship technology, CargoWise One, is a deeply integrated global software solution for logistics service providers that enables our customers to execute highly complex logistics transactions and manage their operations on one database across multiple users, functions, offices, countries and languages. We operate our own data centres and deliver our CargoWise One software principally through the cloud. We provide our software as a service, which customers access as needed, without limitation, and pay for usage of modules or transactions as they execute on the platform.
CustomersOur customers range from large multinational companies to small and mid‑sized regional and domestic enterprises. We provide them with open access to our entire technology platform so that, regardless of which software capabilities a customer initially chooses to use and the geographies they use them in, our customers are given full and immediate access to our entire global software platform from day one. We also enable our customers to configure the platform so that it is customised to their specific needs. Customers are able to add more users, modules and locations as they wish, without additional sales contracts or customisation, site visits or coding changes. This strategy assists us to streamline sales, provide swift on‑boarding, reduce dependence on direct sales, lower our customer acquisition costs and drive faster customer adoption of our product.
Our customers stay and grow transactions and users due to the power, depth and productivity of our global platform. Our software is designed to assist our customers to better address the complexities of the logistics industry while dramatically increasing productivity, reducing costs and mitigating risks in a global integrated software platform.
VisionOur vision is of a comprehensive global logistics execution solution for our customers capable of managing from the first‑mile road movement, connecting to long‑haul air, sea, rail and road, crossing complex borders, while navigating deep regulatory burdens and improved safety and productivity through data and device integration, global visibility and system manageability.
CUSTOMERS
Our 7,000 existing customers = significant runway for increased usage in transactions, geographic expansion and entering new verticals across the supply chain
Growth opportunities from: ` 32 of top 50 global 3PLs ` 23 of top 25 global
freight forwarders
Global rollouts progressing for largest freight forwarders
Top 10 customers represent 27% of FY17 revenue
CARGOWISE ONE REVENUE($million FY14–FY17) by application suite customer cohort
FY17FY16
FY15
FY14
FY13
FY12
FY11FY10FY09FY08
FY07
FY06& prior
FY14
120
100
80
60
40
20
0FY15 FY16 FY17
Each annual cohort of customers from the last 10 years grew revenue in FY17
OUR BUSINESS
10
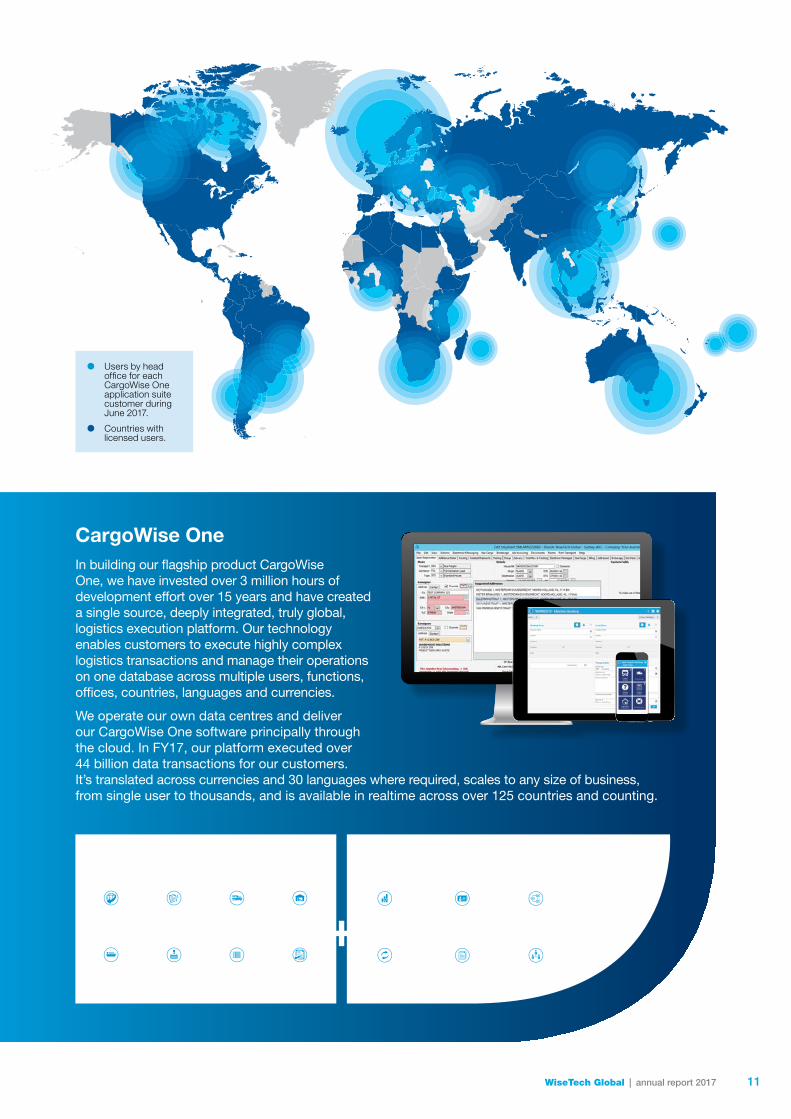
Users by head office for each CargoWise One application suite customer during June 2017.
Countries with licensed users.
CargoWise One In building our flagship product CargoWise One, we have invested over 3 million hours of development effort over 15 years and have created a single source, deeply integrated, truly global, logistics execution platform. Our technology enables customers to execute highly complex logistics transactions and manage their operations on one database across multiple users, functions, offices, countries, languages and currencies.
We operate our own data centres and deliver our CargoWise One software principally through the cloud. In FY17, our platform executed over 44 billion data transactions for our customers. It’s translated across currencies and 30 languages where required, scales to any size of business, from single user to thousands, and is available in realtime across over 125 countries and counting.
Integrated modules for enterprise‑wide administration, accounting and management
Integrated modules covering key logistics transactions
Freight forwarding
Accounting & reporting
Liner & agency
Integrated messaging
Customs clearance
Customer relationship
management
Container freight station
Document management
Land transport
Workflow
Track, trace & manage
Human capital management
Geo compliance
Warehousing
11WiseTech Global | annual report 2017

OUR INNOVATION PIPELINE
640,000unit tests executed every 45 mins
52%of employees focus on innovation and product development
33%of revenue invested in FY17
680+product upgrades and enhancements in FY17
$167minvested FY13PF–FY17
Innovation and productivity are at the core of what we do. Our relentless focus on product development positions us at the forefront of technology in managing international and cross-border logistics, changes in trade patterns and evolving logistics regulation.
In FY17, we delivered over 680 product upgrades and enhancements to the CargoWise One global platform. In addition, we added to our considerable innovation pipeline of development initiatives by investing research and development resources into machine learning, natural language processing, robotic process automation and guided decision making, driven by vast volumes of transactional and border agency data sets.
Each year, we continue to invest in:
` developing new modules to enable additional logistics activities or market segments
` developing new product components to expand productivity of existing modules
` developing hardware components to complement software modules
` extending access to new geographies
` upgrading capabilities to cover compliance with additional, existing and new regulatory requirements
` incorporating new technology and delivery mechanisms
` adding quality improvements – simplifying, automating and eliminating errors
` building next‑generation productivity tools to accelerate our customers’ productivity, resource efficiency and business growth
` investing in disciplined development processes, our data centres and scalable technology for growth in volumes, data storage and usage.
INTEGRATION
CO
MM
ER
CIA
LISE
12

GLOW
Global Tracking
IOT & VOLCAM
Universal Customs EnginePAVE
WiseRates
GEOCODE
` ‘Build once’ architecture and ‘coding without coders’
` Global Air/Ocean Schedules, Container and Air Waybill Tracking
` Computer Vision Scan‑Weigh‑Measure
` Telematics, SOLAS
` Accelerating complex customs localisations
` Productivity Acceleration Visualisation Engine
` Global data sets
` Real time access
` Immediate booking
` Global Address Cleansing, Geocoding and Master Data Deduplication
MachineLearning
` Robotic process automation
` Guided decision making
Work faster, harder, smarter
Reduce cost, time, error, risk
Supply chain behavioural change
BorderCompliance
` Risk reduction
` Due diligence
` Cost efficiency
13WiseTech Global | annual report 2017

OUR EXPANSION PIPELINEOrganic growth accelerated by acquisitions. Small, valuable acquisitions further our growth across geographies and adjacencies. We buy into market positions that would take years to build, integrate swiftly to drive value across our platform. Universal Customs Engine delivers efficient development. Select adjacencies accelerate our global product pipeline.
2
16
7
3
ACQUISITION INTEGRATION PROCESS
` Platform migration
` Business processes
` Development system
` Commercial standards
` Management control of operations
` Integrate acquired product with CargoWise One swiftly
` Product development utilising Universal Customs Engine where applicable
` Localisation
` E‑learning platform
` Innovation and expansion
` Move to full “embedded” product
` Global customers access new capability integrated in CargoWise One Immediate revenue once capability embedded in global platform, transaction-based licence
` Conversions of acquired customer base On-board transition over 3+ years, full platform access
` Over time, acquired customers expand usage
` Acquired customers can access multi‑region rollout
Integrate target‘Acculturation’
Develop product‘Build out’
Grow revenue‘Rollout’
3–12 months Foothold 12–24 months 0–36 months
14

4
5
WHY WE ACQUIRE
WHAT WE TARGET
` Acquire customers in new geographies to migrate to CargoWise One global platform
` Acquire compliance capabilities to avoid high risk, costly market entry
` Acquire skilled employees with local market experience and logistics industry capability and processes
` Acquire to efficiently enter new geographic regions with lower cost and lower risks than organic growth may deliver
` New geographies
` Strongly entrenched leading providers
` In markets with complex compliance requirements (particularly customs)
` Major markets with larger 3PL customers to allow us to drive network effect
` New, complex, adjacent competencies to allow us to acquire specialist market knowledge to support our product development
CUSTOMS
ITALY
FY17
CUSTOMS
BRAZIL
1H18
AIR FREIGHT
NETHERLANDS
1H18
CUSTOMS
TAIWAN & CHINA
1H18
OCEAN FREIGHT
UNITED STATES
1H18
GLOBAL OCEAN CARRIER
GERMANY
FY17
CUSTOMS
GERMANY
FY17
TARIFFS
AUSTRALIA
1H18
TRANSPORT
AUSTRALIA
1H18
1
1
2
5
7
3
6
4 4
15WiseTech Global | annual report 2017

ENVIRONMENT, SOCIAL AND GOVERNANCE
EnvironmentOur CargoWise One global platform licensed for use across 125 countries is beneficial to the environment through digitisation of millions of data transfers, which reduces paper, hardware and resources, and through improvement in safety, accuracy and productivity across the supply chain which reduces futile trips, inefficient shipments and unnecessary resource wastage.
WiseTech is a service‑based organisation, not directly involved in the manufacture or transport of goods. As such, our environmental footprint is relatively small and primarily comprises the energy used by our offices and data centres and the typical consumables of an office‑based business. Accordingly, our environmental risks are not significant.
We operate waste recycling programmes and our main office in Sydney features purpose‑designed energy‑efficient lighting. In Australia, hardware that has reached the end of its useful life is sent to an e‑waste recycling centre that is approved under the National Television and Computer Recycling Scheme.
WiseTech in the communityWiseTech has an active programme of scholarships and sponsorships with university and school groups. This programme fosters student engagement, promotes our brand awareness and is designed to encourage and build the next generation of innovation leaders.
Key features of the program include:
• Sponsoring information technology‑related scholarships at the University of Technology, Sydney and The University of New South Wales
• Platinum sponsor of the National Computer Science School (“NCSS”). Events include the NCSS Summer School, a 10‑day summer camp held at The University of Sydney for school students in years 10 to 12 and the NCSS Challenge, a six‑week programming challenge for anyone from primary school onwards
• Platinum sponsor of ACCESS for Women (Australian Computing Coding and Engineering Summer School), a five‑day summer school for female students going into years 11 and 12, encouraging young women to pursue computer science as a career path
• Gold sponsor of the Australian Computer Society Foundation events: The BiG Day In and Junior BiG Day In. The BiG Day In is an IT careers conference designed by students for students. It is targeted at both high school (years 9 to 12) and university students interested in a career in technology. We tour with this event annually around Australia, visiting all major cities and some regional locations, engaging with over 7,500 students last year.
At WiseTech, we focus long term and the important work we do to drive innovation, global expansion and business efficiencies ultimately impacts logistics execution and supply chains worldwide. The long-term sustainability of our business is essential and we monitor environment, social and governance risks.
16

Political donationsIt is our policy not to make donations to political parties.
Corporate governanceWiseTech’s approach to corporate governance and our compliance with the Recommendations of the ASX Corporate Governance Council are described in our Corporate Governance Statement, which is available from our website http://ir.wisetechglobal.com/investors/?page=corporate‑governance
Ethics and integrityWe promote ethical and responsible decision making by our employees and Directors and these behaviours are outlined in our Code of Conduct and Whistleblower Protection Principles. All our people are required to complete training and testing on WiseTech policies, including our Code of Conduct, Equal Employment Opportunity Policy, Securities Trading Policy and Whistleblower Protection Principles.
Employees, diversity and cultureAt WiseTech, we have built a culture of innovation and productivity where we solve complex industry problems and challenges with a ‘test first, fail quickly and improve rapidly’ approach. We seek to recruit and develop individuals with a diverse range of professional backgrounds and experience and we provide extensive upfront and ongoing technical and strategic training.
We seek to create a work environment for our ‘tech creatives’ that supports bold ideas and innovation, and a focus on ‘freedom and responsibility’. We operate a flat, low hierarchy management with small diverse teams in open plan hubs to stimulate creativity and workflow.
Our people
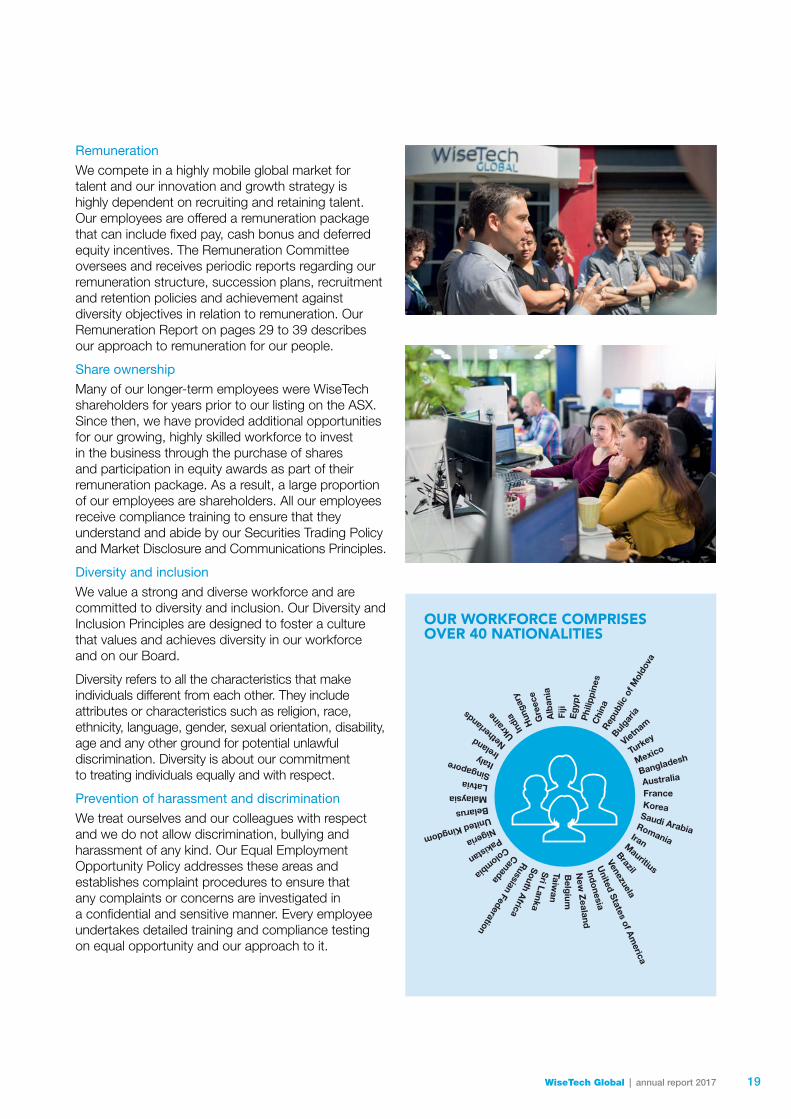
As a global organisation, we benefit from having a diverse mix of extraordinary people drawn from over 40 countries, ranging in age from 18 to 70+, with eclectic backgrounds and remarkable skills. Our future growth and innovation come from the talent, motivation and enthusiasm of our people across the world.
The BiG Day In, 2017.
OUR VALUES
` We continuously improve our culture so that it empowers and drives us
` We work hard to improve ourselves, our colleagues, our teams, our products and our business
` We have a clear purpose and a shared vision
` We manage ourselves and focus on results
` We lead when we see the need and inspire and support each other always
` We fight for excellence
` We focus on the deeper needs of customers in our chosen markets
` We invent things our customers did not know they needed and cannot live without
17

Employee wellbeing
Each member of our WiseTech family worldwide is encouraged to take personal responsibility for their wellbeing, health and relationships. We enable this through our policies, support services and wellbeing initiatives such as in‑house fitness classes, nutritional advice, free breakfasts and healthy snacks, lunchtime sport, our family‑friendly working week, health campaigns, and company funded social activities.
We celebrate with each other, observing decades long traditions of monthly ‘Cake Day’ to welcome every new employee and celebrate birthdays, and, on Fridays, our employees worldwide, meet to celebrate our hard work and efforts with pizza and refreshments.
We have support systems in place to promote the safety and wellbeing of our employees. Our global Employee Assistance Programme offers short‑term, solution‑focused counselling to employees who may be experiencing issues or concerns, whether at home or at work and additional professional guidance counselling. This service is delivered by external, qualified, experienced professionals at no cost to the employee.
Overall, our Workplace Health and Safety Policy is designed to ensure that we provide a safe and healthy workplace for our people and visitors. Employees are encouraged to observe and practice safe working methods to support a healthy and safe work culture and environment.
Developing our people
To assist our talented people develop further, we provide our education and training professional certification programme, employee education assistance for doctorate, masters and bachelor degrees and encourage continuing industry education.
We also assist development with mentoring programmes worldwide, facilitated rotations though multiple development teams and ‘theory of constraints’ training, and we operate an active programme of international placements/global mobility to build skills and understanding of technological and cultural diversity.
EMPLOYEES BY FUNCTION(%, as at 30 June 2017)
EMPLOYEES BY REGION(%, as at 30 June 2017)
Product design and development 52%
Customer support and other 19%
General and administration 19%
Sales and marketing 10%
Australia and New Zealand 48%
Europe 18%Asia 16%South Africa 12%North America 6%
Under 30 23%30–44 50%45 and over 27%
Cake Day September 2017.
EMPLOYEES BY AGE DIVERSITY(%, as at 30 June 2017)
18
Remuneration
We compete in a highly mobile global market for talent and our innovation and growth strategy is highly dependent on recruiting and retaining talent. Our employees are offered a remuneration package that can include fixed pay, cash bonus and deferred equity incentives. The Remuneration Committee oversees and receives periodic reports regarding our remuneration structure, succession plans, recruitment and retention policies and achievement against diversity objectives in relation to remuneration. Our Remuneration Report on pages 29 to 39 describes our approach to remuneration for our people.
Share ownership
Many of our longer‑term employees were WiseTech shareholders for years prior to our listing on the ASX. Since then, we have provided additional opportunities for our growing, highly skilled workforce to invest in the business through the purchase of shares and participation in equity awards as part of their remuneration package. As a result, a large proportion of our employees are shareholders. All our employees receive compliance training to ensure that they understand and abide by our Securities Trading Policy and Market Disclosure and Communications Principles.
Diversity and inclusion
We value a strong and diverse workforce and are committed to diversity and inclusion. Our Diversity and Inclusion Principles are designed to foster a culture that values and achieves diversity in our workforce and on our Board.
Diversity refers to all the characteristics that make individuals different from each other. They include attributes or characteristics such as religion, race, ethnicity, language, gender, sexual orientation, disability, age and any other ground for potential unlawful discrimination. Diversity is about our commitment to treating individuals equally and with respect.
Prevention of harassment and discrimination
We treat ourselves and our colleagues with respect and we do not allow discrimination, bullying and harassment of any kind. Our Equal Employment Opportunity Policy addresses these areas and establishes complaint procedures to ensure that any complaints or concerns are investigated in a confidential and sensitive manner. Every employee undertakes detailed training and compliance testing on equal opportunity and our approach to it.
OUR WORKFORCE COMPRISES OVER 40 NATIONALITIES
19WiseTech Global | annual report 2017
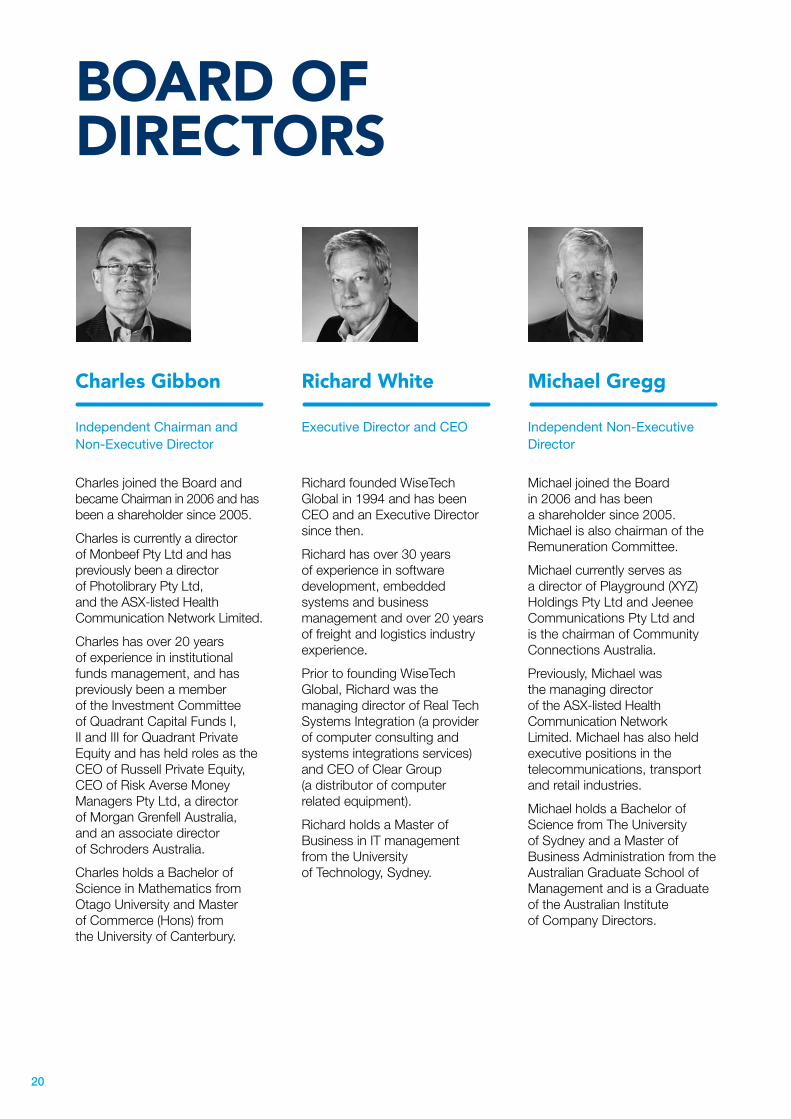
Charles Gibbon
Independent Chairman and Non-Executive Director
Charles joined the Board and became Chairman in 2006 and has been a shareholder since 2005.
Charles is currently a director of Monbeef Pty Ltd and has previously been a director of Photolibrary Pty Ltd, and the ASX‑listed Health Communication Network Limited.
Charles has over 20 years of experience in institutional funds management, and has previously been a member of the Investment Committee of Quadrant Capital Funds I, II and III for Quadrant Private Equity and has held roles as the CEO of Russell Private Equity, CEO of Risk Averse Money Managers Pty Ltd, a director of Morgan Grenfell Australia, and an associate director of Schroders Australia.
Charles holds a Bachelor of Science in Mathematics from Otago University and Master of Commerce (Hons) from the University of Canterbury.
Richard White
Executive Director and CEO
Richard founded WiseTech Global in 1994 and has been CEO and an Executive Director since then.
Richard has over 30 years of experience in software development, embedded systems and business management and over 20 years of freight and logistics industry experience.
Prior to founding WiseTech Global, Richard was the managing director of Real Tech Systems Integration (a provider of computer consulting and systems integrations services) and CEO of Clear Group (a distributor of computer related equipment).
Richard holds a Master of Business in IT management from the University of Technology, Sydney.
Michael Gregg
Independent Non-Executive Director
Michael joined the Board in 2006 and has been a shareholder since 2005. Michael is also chairman of the Remuneration Committee.
Michael currently serves as a director of Playground (XYZ) Holdings Pty Ltd and Jeenee Communications Pty Ltd and is the chairman of Community Connections Australia.
Previously, Michael was the managing director of the ASX‑listed Health Communication Network Limited. Michael has also held executive positions in the telecommunications, transport and retail industries.
Michael holds a Bachelor of Science from The University of Sydney and a Master of Business Administration from the Australian Graduate School of Management and is a Graduate of the Australian Institute of Company Directors.
BOARD OF DIRECTORS
20

Andrew Harrison
Independent Non-Executive Director
Andrew joined the Board in 2015. He is also chairman of the Audit and Risk Management Committee.
Andrew is an experienced company director and corporate adviser. He is currently a non‑executive director of ASX‑listed companies Bapcor Limited, Estia Health Limited, Xenith IP Limited and IVE Group Limited.
Andrew has previously held executive and non‑executive directorships with public and private companies, including as CFO of Seven Group Holdings, group finance director of Landis+Gyr, and CFO and a director of Alesco Limited.
Andrew was previously a senior manager at Ernst & Young (Sydney and London) and Gresham Partners Limited, and an associate at Chase Manhattan Bank (New York).
Andrew holds a Bachelor of Economics from The University of Sydney and a Master of Business Administration from the Wharton School at the University of Pennsylvania and is a Chartered Accountant.
Maree Isaacs
Executive Director and Head of Invoicing & Licensing
Maree co‑founded WiseTech with Richard White in 1994 and has been an Executive Director since then.
Maree is focused on invoicing and licensing, group operations, quality control and administration. Maree is also a Company Secretary of WiseTech Global.
Prior to co‑founding WiseTech Global, Maree worked with Richard at Real Tech Systems Integration and Clear Group.
Director attendance at meetingsDirector attendance at meetings for FY17:
Board
Audit and Risk Management Committee
RemunerationCommittee
Held Attended Held Attended Held Attended
Charles Gibbon 13 13 4 4 9 9Richard White 13 13 – – – –Michael Gregg 13 13 4 4 9 9Andrew Harrison 13 13 4 4 9 7Maree Isaacs 13 13 – – – –
21WiseTech Global | annual report 2017

Operating and financial review
Financial performance
During the period, we delivered significant revenue growth of 50% compared to the prior year through strong organic growth across our business, further accelerated by strategic acquisitions.
Operating profit increased 795% to $41.5m compared to $4.6m in the prior year (FY16 included IPO and related costs of $16.7m).
Net profit after tax rose 1386% to $32.2m from $2.2m in the prior year. Net profit attributable to equity holders of the parent increased 1371% to $31.9m (FY16: $2.2m).
Summary financial results 1
FY17 $m
FY16 $m
Change $m
Change %
Recurring monthly and annual software usage revenue 142.4 101.2 41.2 41One Time Licences and support services 11.4 1.6 9.8 613Total revenue 153.8 102.8 51.0 50Cost of revenues (26.1) (15.4) (10.7) 69Gross profit 127.7 87.4 40.3 46Product design and development 2 (35.6) (30.4) (5.2) 17Sales and marketing (16.7) (22.8) 6.1 (27)General and administration (33.9) (29.5) (4.4) 15Total operating expenses (86.2) (82.8) (3.4) 4Operating profit 41.5 4.6 36.9 795Net finance income/(costs) 2.7 (1.2) 3.9 (325)Share of loss of equity accounted investees (0.1) n/a (0.1) n/aProfit before income tax 44.2 3.5 40.7 1180Tax expense (12.0) (1.3) (10.7) 823Net profit after tax 32.2 2.2 30.0 1386
Net profit after tax attributable to:
Equity holders of the parent 31.9 2.2 29.7 1371Non-controlling interests 0.3 – 0.3 n/aNet profit after tax 32.2 2.2 30.0 1386
1 Differences in tables are due to rounding.
2 Product design and development expense includes $7.2m ($7.0m in the prior year) depreciation and amortisation but excludes capitalised development amounts.
22

Operating and financial review
Key financial metrics FY17 FY16 Change
Recurring revenue % 93% 98% (5)pp
Gross profit margin % 83% 85% (2)pp
Product design and development as % total revenue 2 23% 30% (7)pp
Sales and marketing as % total revenue 11% 22% (11)pp
General and administration as % total revenue 22% 29% (7)pp
Capitalised development cost ($m) 3 22.0 17.7 4.3
R&D as a % of total revenue 4 33% 40% (7)pp
1 Differences in tables are due to rounding.
2 Product design and development expense includes $7.2m ($7.0m in the prior year) depreciation and amortisation but excludes capitalised development amounts.
3 Includes patents and purchased external software licences.
4 R&D is total investment in Product design and development expense, excluding depreciation and amortisation, and including Capitalised development cost each year.
Revenue
Total revenue grew 50% to $153.8m (FY16: $102.8m). Our revenue growth came from:
• revenue growth from our existing customer base
• revenue growth from new customers won in the year, the full year impact of customers won in FY16 and growth from customers won in FY15
• revenue from acquisitions in the year.
Revenue from existing customers increased by $27.2m (26%), net of $2.4m of adverse foreign exchange movements. Growth was driven by increased usage of the CargoWise One technology platform, the impact of the commencement of the DHL Global Forwarding contract and the transition of certain large customers previously on temporary pricing arrangements to standard transaction licence models.
Revenue growth for CargoWise One was achieved across all existing customer cohorts.
New customer revenue increased by $7.5m (FY16: $7.8m), being $8.2m of new customer growth partially offset by $0.7m adverse foreign exchange movements (FY16: $1.5m benefit). New customer revenue increased 30% year on year once adjusted for the impact of currency.
Revenue from customers on acquired platforms arises from customers not yet transitioned onto CargoWise One and increased by $16.3m (FY16: $9.9m) including acquisitions completed in FY17 and growth from prior acquisitions in South Africa, China and Australia. Year on year growth for these acquisitions is typically lower than the growth experienced for customers on our CargoWise One platform. In the current year, revenues from previously acquired customers increased by $0.8m. Revenue contributions from the businesses acquired during FY17 were:
• $14.1m – Softship AG, gained control on 1 July 2016
• $1.4m – znet group GmbH, acquired 31 January 2017 and ACO Informatica S.r.l., acquired 9 February 2017.
The increase in OTL and Support Services revenue reflects the revenue generated by the acquired businesses.
Foreign exchange: Our revenue is invoiced in a range of currencies, reflecting the global nature of our customer base, and as a result may be positively or negatively impacted by movements in foreign exchange rates.
Recurring revenue: Excluding the impact of acquisitions, we increased our recurring revenue to 99% of total revenue (FY16: 98%).
23WiseTech Global | annual report 2017
Operating and financial review
Licensing and transition: All new CargoWise One customers use our transaction-based Seat plus Transaction Licence (“STL”) revenue model. Over time, we have transitioned our CargoWise One customer base from historical One-Time Licence (“OTL”) agreements to On-Demand licence models (licensing based on either module use or on STL) and this transition is substantially complete, reflected in 92% of revenue from On-Demand licence excluding FY17 acquisitions (FY16: 83%).
Overall, our percentage of On-Demand licence model revenue is 83% of total revenue, reflecting acquisitions which have higher levels of OTL and consulting/service revenue compared to our CargoWise One platform. The transition of customers from our acquired businesses to On-Demand models will take time, will vary from business to business, and is a key component of our acquisition integration process.
Customer attrition: Attrition rates for the CargoWise One technology platform continued to be very low at under 1% as it had been for the previous four years.
Gross profit and gross profit margin
Gross profit increased by $40.3m, up 46%, to $127.7m (FY16: $87.4m). Gross profit growth was mainly driven by revenue growth including revenue from acquisitions. The rate of increase in cost of revenues, excluding acquisitions, was lower than our revenue growth, reflecting better leverage within cost of revenues, particularly employee costs. However, overall gross profit margin including acquisitions was 83% (FY16: 85%), as acquired businesses all had lower gross profit margins than those of CargoWise One.
Operating expenses
Product design and development: We continued to invest significantly in innovation with product design and development expenses of $35.6m (FY16: $30.4m). The increase reflects our continued investment in development resources, including the full year impact of the additional development staff of the businesses acquired in FY16.
Total research and development: Total investment in R&D for the year was 33% of revenue (FY16: 40%), the change reflecting the underlying operating leverage resulting from the high rate of revenue growth. The level of capitalised development investment increased to $22.0m (FY16: $17.7m) reflecting the growth in the pipeline of innovation, addition of further skilled industry experts and developers to our teams, along with improvements in our internal development management and time capturing processes utilising our self-developed productivity tool PAVE.
Sales and marketing: During FY17, expenses reduced to $16.7m (FY16: $22.8m), 11% of revenue compared to 22% in the prior year. The change reflected cost leverage and some impact from changes in the composition of the salesforce and the structure of commission schemes. The prior year also included $6.4m of one-off costs (sales commission and employee incentive close-out costs in conjunction with our IPO). Sales and marketing expenses without the one-offs were broadly even across both years, indicating limited further sales and marketing expenditure was required to generate increased FY17 revenue.
General and administration: These expenses rose to $33.9m (FY16: $29.5m) as we invested in supporting growth of our business globally. Headcount increases included Finance (including global tax compliance and internal control functions), People and Culture (recruitment) and office support roles. We also acquired businesses with their own G&A costs and further invested in M&A and legal services costs for both our in-process transactions and those completed during the year. Even with this investment, overall general and administration expenses as a percentage of revenue were 22% (FY16: 29%), the reduction reflecting $7.5m of one-off IPO-related expenses incurred last year.
Finance income
Finance income includes a non-taxable, non-cash gain of $2.0m, which arose due to an increase in the fair value recognised in relation to the acquisition of Softship (see note 20).
24

Operating and financial review
Cash flow
We continued to generate positive cash flows, with $54.9m of net cash flow from operating activities.
Investing activities included:
• $22.9m in new acquisitions, as well as contingent payments for acquisitions made in prior years (FY16: $20.0m)
• $22.0m in intangible assets as we further developed and expanded our global platform resulting in capitalised development investments for both commercialised and those products yet to be launched (FY16: $17.7m)
• $6.9m was invested in fixed assets related to our data centres to enhance the scalability and reliability of our platform, increase capacity for future growth and add to our new South African office and data centre (FY16: $2.4m).
Financing activities included $7.5m (FY16: $nil) invested in treasury shares for the on-market purchase of shares to satisfy employee incentive commitments and $3.7m (FY16: $3.4m) of repayment of finance leases.
Dividends of $2.7m (FY16: $3.8m) were paid, with shareholders choosing to reinvest an additional $0.2m of dividends via the dividend reinvestment plan.
Delivery on our growth strategy
The key strategic developments in the year were:
Expansion of our global platform
We invested $50.4m and over 50% of our people in product development, further expanding our pipeline of commercialisable innovations and delivering over 680 product upgrades seamlessly across the CargoWise One global platform.
• These hundreds of upgrades include initiatives such as:
– global container tracking to target the 650m TEU 1 that move worldwide each year
– automations in supply chain security for air cargo screening to reduce risks at the border and in the air
– WiseRates rating and pricing automation engine
– integrations in shipping port and cartage
– carrier connectivity electronic booking
– global address validation and master file or data deduplication to prevent futile trips, risks and fines.
• Larger pipeline components include:
– architecture engine, GLOW, which we utilise internally to deliver more rapid development capability for our teams and which is accelerating our new product pipeline commercialisation.
– Universal Customs Engine which is designed to deliver complex, multi-year customs localisation projects in a fraction of the time and which is accelerating the pace of integration of the customs solutions businesses we are acquiring in key regions.
• PAVE, our Productivity Acceleration and Visualisation Engine, is nearing completion and is in the process of commercialising, having delivered significant productivity improvements in development partner tests. We expect this to be made available across the global platform later in FY18.
Additionally, within our innovation pipeline we are investing research and development resources into machine learning, natural language processing, robotic process automation and guided decision support, all of which must be driven by large volume transaction data and deep learning around vast border agency data sets, compliance, due diligence and risk assessment and mitigation.
With our deeply integrated global platform, relentless innovation and rapid development capability, we are uniquely placed to address future logistics execution and cross-border compliance needs. Given the advent of global border initiatives such as Trade Single Window, Trusted Trader, Known Shipper, C-TPAT, AEO and Supply Chain Security plus an ever-increasing critical need to secure borders and ensure that international trade is both safe and efficient, we see the innovation investment we make and the work we do as vital to the next generation of cross-border compliance.
1. Twenty-foot equivalent unit, a measure of cargo capacity.
25WiseTech Global | annual report 2017
Operating and financial review
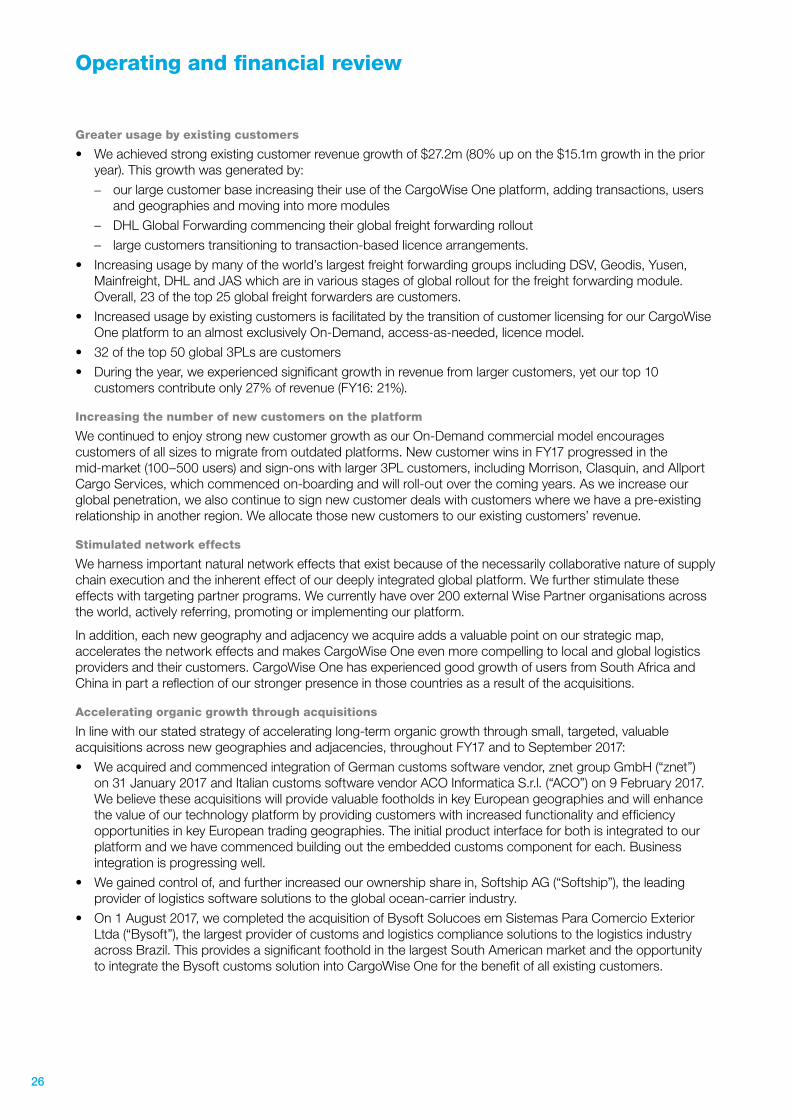
Greater usage by existing customers
• We achieved strong existing customer revenue growth of $27.2m (80% up on the $15.1m growth in the prior year). This growth was generated by:
– our large customer base increasing their use of the CargoWise One platform, adding transactions, users and geographies and moving into more modules
– DHL Global Forwarding commencing their global freight forwarding rollout
– large customers transitioning to transaction-based licence arrangements.
• Increasing usage by many of the world’s largest freight forwarding groups including DSV, Geodis, Yusen, Mainfreight, DHL and JAS which are in various stages of global rollout for the freight forwarding module. Overall, 23 of the top 25 global freight forwarders are customers.
• Increased usage by existing customers is facilitated by the transition of customer licensing for our CargoWise One platform to an almost exclusively On-Demand, access-as-needed, licence model.
• 32 of the top 50 global 3PLs are customers
• During the year, we experienced significant growth in revenue from larger customers, yet our top 10 customers contribute only 27% of revenue (FY16: 21%).
Increasing the number of new customers on the platform
We continued to enjoy strong new customer growth as our On-Demand commercial model encourages customers of all sizes to migrate from outdated platforms. New customer wins in FY17 progressed in the mid-market (100–500 users) and sign-ons with larger 3PL customers, including Morrison, Clasquin, and Allport Cargo Services, which commenced on-boarding and will roll-out over the coming years. As we increase our global penetration, we also continue to sign new customer deals with customers where we have a pre-existing relationship in another region. We allocate those new customers to our existing customers’ revenue.
Stimulated network effects
We harness important natural network effects that exist because of the necessarily collaborative nature of supply chain execution and the inherent effect of our deeply integrated global platform. We further stimulate these effects with targeting partner programs. We currently have over 200 external Wise Partner organisations across the world, actively referring, promoting or implementing our platform.
In addition, each new geography and adjacency we acquire adds a valuable point on our strategic map, accelerates the network effects and makes CargoWise One even more compelling to local and global logistics providers and their customers. CargoWise One has experienced good growth of users from South Africa and China in part a reflection of our stronger presence in those countries as a result of the acquisitions.
Accelerating organic growth through acquisitions
In line with our stated strategy of accelerating long-term organic growth through small, targeted, valuable acquisitions across new geographies and adjacencies, throughout FY17 and to September 2017:
• We acquired and commenced integration of German customs software vendor, znet group GmbH (“znet”) on 31 January 2017 and Italian customs software vendor ACO Informatica S.r.l. (“ACO”) on 9 February 2017. We believe these acquisitions will provide valuable footholds in key European geographies and will enhance the value of our technology platform by providing customers with increased functionality and efficiency opportunities in key European trading geographies. The initial product interface for both is integrated to our platform and we have commenced building out the embedded customs component for each. Business integration is progressing well.
• We gained control of, and further increased our ownership share in, Softship AG (“Softship”), the leading provider of logistics software solutions to the global ocean-carrier industry.
• On 1 August 2017, we completed the acquisition of Bysoft Solucoes em Sistemas Para Comercio Exterior Ltda (“Bysoft”), the largest provider of customs and logistics compliance solutions to the logistics industry across Brazil. This provides a significant foothold in the largest South American market and the opportunity to integrate the Bysoft customs solution into CargoWise One for the benefit of all existing customers.
26

Operating and financial review
• On 9 August 2017, we acquired the Digerati business, a leading provider of tariff research and compliance tools utilised by the Australasian customs broking community which we will utilise to enhance our pipeline on cross-border compliance.
• On 11 August 2017, we announced the acquisition of the Prolink business, a leading provider of customs and forwarding solutions across Taiwan and China which gives us additional regional strength to accelerate our growth throughout Asia.
• On 14 August 2017, we announced the acquisition of CMS Transport Systems Pty Ltd, a leading Australasian provider of road transport and logistics management systems. This timely acquisition will allow us to further accelerate our local developments in land transport and integrated telematics.
• On 12 September 2017, we announced the acquisitions of two global rate management solutions providers: Netherlands-based Cargoguide, a leading provider of global air freight rate management solutions and US-based CargoSphere, a leading provider of global ocean freight rate management solutions.
We have also invested in developing our potential acquisition pipeline of near-, mid- and long-term opportunities and in building out our internal M&A capabilities and integration processes to execute and embed acquisitions.
Post balance date events
As summarised above, we have announced a number of strategic acquisitions since 30 June 2017. Further details can be found in note 30. In addition, on 18 August, we announced an offer to acquire any and all outstanding shares of Softship, of which we are the majority shareholder.
Since the period end, the Directors have declared a fully-franked final dividend of 1.2 cents per share, payable on 4 October 2017. The dividend will be recognised in subsequent financial statements.
Outlook for year ending 30 June 2018
The strong momentum of the Group’s performance during FY17 combined with 99% recurring revenue (excluding acquisitions), annual customer attrition rate of less than 1% and continued expansion across our global business give us confidence to expect for FY18 revenue of $200m – $210m, revenue growth of 30% – 37%, EBITDA of $71m – $75m and EBITDA growth of 32% – 39%.
27WiseTech Global | annual report 2017

Operating and financial review
Five year financial summary 1
FY13$m
FY14$m
FY15$m
FY16$m
FY17$m
Recurring monthly and recurring annual software usage revenue 37.3 53.8 67.3 101.2 142.4OTL and support services 5.7 2.9 2.7 1.6 11.4Total revenue 43.0 56.7 70.0 102.8 153.8Cost of revenues (7.7) (8.5) (11.4) (15.4) (26.1)Gross profit 35.2 48.2 58.6 87.4 127.7Operating expenses
Product design and development (15.9) (17.1) (19.6) (30.4) (35.6)Sales and marketing (8.2) (9.0) (11.7) (22.8) (16.7)General and administration (6.0) (8.1) (12.9) (29.5) (33.9)Total operating expenses (30.1) (34.2) (44.2) (82.8) (86.2)Operating profit 5.2 13.8 14.4 4.6 41.5Finance income 0.3 0.4 1.0 1.3 4.6Finance cost (0.7) (0.6) (0.9) (2.4) (1.9)Share of profit/(loss) of equity-accounted investees – – 0.0 – (0.1)Profit before income tax 4.8 13.8 14.5 3.5 44.2Tax expense (1.1) (3.7) (4.4) (1.3) (12.0)NPAT continuing operations 3.7 10.1 10.1 2.2 32.2
Net profit after tax attributable to:
Equity holders of the parent 3.7 10.1 10.1 2.2 31.9Non-controlling interests – – – – 0.3Net profit after tax 3.7 10.1 10.1 2.2 32.2
Key financial metrics
Recurring revenue % 87% 95% 96% 98% 93%Gross profit margin 82% 85% 84% 85% 83%Product design and development as % of total revenue 2 37% 30% 28% 30% 23%Sales and marketing as % of total revenue 19% 16% 17% 22% 11%General and administration as % of total revenue 14% 14% 18% 29% 22%Capitalised development cost ($m) 3 7.0 9.5 13.5 17.7 22.0Total R&D as a % of total revenue 4 45% 41% 40% 40% 33%
1 Differences in tables are due to rounding.
2 Product design and development expense includes $7.2m (FY16: $7.0m. FY15: $5.3m. FY14: $3.9m. FY13: $3.6m) depreciation and amortisation but excludes capitalised development amounts.
3 Includes patents and purchased external software licences.
4 R&D is total investment in product design and development expense, excluding depreciation and amortisation, and including capitalised development cost each year.
28
Remuneration Report
Remuneration Committee Chairman’s letter
I am pleased to present our Remuneration Report for the year ended 30 June 2017.
FY17 was our first full year as a listed company and the Committee took the opportunity to reflect upon, and reassess, our remuneration approaches for executives and for the broader population of WiseTech. We have considered deeply the right remuneration approach that will match our specialised operations and growth aspirations.
In any given year, our economic outcomes and financial results are the result of laser-like focus in previous years on strategic goals, meaningful lead indicators and execution on critical short-term project deliverables aligned to our strategic plan. To assist us achieve our outcomes, we utilise our comprehensive productivity tools and our Productivity Acceleration and Visualisation Engine (“PAVE”) to engineer and effectively manage workflows throughout our business functions to ensure accurate and disciplined delivery of strategic imperatives.
We know the actions we take in FY18 will impact shareholder value for many years to come. Therefore, we have developed a new remuneration framework to replace that which was proposed in our 2016 annual report. At WiseTech, we believe effective performance incentives are best focused on key strategic priorities, financial targets and operational KPI lead measures and delivered in the form of multi-year deferred equity to ensure alignment with shareholders’ interests. Going forward, our remuneration approach will include equity-based performance incentives with deferred vesting over three years – see page 33 for more detail.
Our Executive Directors, Richard White and Maree Isaacs, as co-founders of WiseTech, each have significant equity interests and therefore their motivations and interests are firmly aligned with those of our other shareholders – “they share the joy and feel the pain”. For both Richard and Maree, FY17 remuneration comprised only fixed remuneration with no deferred equity components. For our non-director key management personnel (“KMP”) in FY17, remuneration outcomes comprised fixed remuneration plus a performance-based deferred equity incentive. Further details, including performance measures, are set out on page 31.
In the interests of clear communication, we have included some additional, simplified tables showing the total remuneration awarded for FY17 and the actual remuneration received in FY17 for our Executive KMP. These additional disclosures are intended to supplement the statutory disclosures contained later in the report.
For FY18, CEO Richard White will continue to receive fixed remuneration of $1m, while Maree Isaacs’ fixed remuneration as Head of Invoicing & Licensing will increase to $350,000 to reflect her operational responsibilities. Maree will also have a performance incentive aligned to delivery on licence transition. Neither Richard nor Maree receives remuneration in relation to their Board responsibilities and Director roles. Non-director KMP incentives will focus on delivery of operational lead targets annually and incentives will be delivered as multi-year deferred equity. From FY18, we will also require KMP to hold a minimum of 100% of fixed remuneration in WiseTech equity, within five years of their appointment, to further reinforce alignment.
WiseTech’s future growth and innovation come from the talent, motivation and enthusiasm of our people across the world. We are a high-performance company and we aim to reward our high-performance staff accordingly. We believe that the ownership of WiseTech equity is important to align our people around the world with the interests of shareholders. Therefore, we will implement an “Invest As You Earn” equity investment plan to enable employees to acquire WiseTech shares, along with a “1 for 5” matching offer. Further details on our overall approach are contained in the report.
We hope that you find this report useful and thank you for your continued support.
Mike Gregg Chairman, Remuneration Committee
22 September 2017
WiseTech Global | annual report 2017 29
Remuneration Report
Introduction
This Remuneration Report sets out the Board’s approach to the remuneration of our KMP. The report covers company performance and remuneration outcomes for the period from 1 July 2016 to 30 June 2017.
The information provided in this report has been audited as required by section 308(3C) of the Corporations Act 2001.
Remuneration governance
Remuneration Committee
The Remuneration Committee is responsible for ensuring WiseTech’s remuneration strategy and frameworks support the Group’s performance while ensuring Executives and Non-Executive Directors are rewarded fairly and responsibly with regard to legal compliance and corporate governance requirements.
Further information on the Committee’s responsibilities is set out in the Remuneration Committee Charter available at: http://ir.wisetechglobal.com/investors/?page=corporate-governance
The Remuneration Committee comprises three Non-Executive Directors, including the Committee Chairman.
Independent remuneration consultants
The Committee has protocols in place to ensure that any advice is provided in an appropriate manner and is free from undue influence of management.
During FY17, the Committee sought advice from independent remuneration consultants who provided advice on market practice incentive arrangements, executive remuneration benchmarking and reporting, including current market practices. The advice received did not constitute remuneration recommendations for the purposes of the Corporations Act 2001.
Details of Directors and Executives
KMP includes all Directors and those executives who have specific responsibility for planning, directing and controlling material activities of the Group. In this report, the term “Executive KMP” refers to the KMP excluding Non-Executive Directors.
The KMP for the period from 1 July 2016 to 30 June 2017 were:
Charles Gibbon Chairman and Non-Executive Director
Michael Gregg Non-Executive Director
Andrew Harrison Non-Executive Director
Richard White Executive Director and Chief Executive Officer (“CEO”)
Maree Isaacs Executive Director and Head of Invoicing & Licensing
Andrew Cartledge Chief Financial Officer (“CFO”)
James Powell Chief Productivity Officer (“CPO”).
30

Remuneration Report
Remuneration awarded for FY17
At WiseTech, we believe effective performance incentives are best focused on key strategic priorities, financial targets and operational KPI lead measures and delivered in the form of multi-year deferred equity to ensure alignment with shareholders’ interests. We know the actions we take each year will impact shareholder value for many years to come. Therefore, we have developed a new remuneration framework for FY18 to replace that which was proposed in our 2016 annual report. Taking this into account, we implemented a transitional incentive arrangement for Executive KMP for FY17.
The remuneration awarded to the Executive KMP in relation to performance during FY17 is set out in the table below. The incentive awarded reflects performance assessed against key strategic priorities, financial targets and operational lead measures over FY17. The table also shows the performance outcome for each Executive as a percentage of target incentive.
To ensure alignment with shareholder returns over time, incentives for Executive KMP for FY17 will be delivered as multi-year deferred equity, with a grant date in September 2017 and vesting in three instalments in September 2017, July 2018 and July 2019. The grant of equity was determined using the market value based on the WiseTech share price following the announcement of our FY17 results on 23 August 2017. These transitional FY17 arrangements differ from those that apply from FY18, which feature longer duration vesting and a relative Total Shareholder Return (“TSR”) check at each vesting point – see page 33.
The equity values in the table reflect face value at the date the grant was determined. The actual value at vesting will depend on the WiseTech share price at date of vesting. In the event of the executive ceasing employment, it is expected that any unvested share rights will lapse; however, for exceptional circumstances, the Board retains discretion.
Remuneration awarded for FY17
Short-term Deferred – at risk
Total potential
remuneration
% of target equity
incentive awarded
Fixed 1Equity
incentive Equity incentive Other equity 3
Jul 18 Jul 19 Jul 17
Richard White $1,000,000 – – – – $1,000,000 n/a
Maree Isaacs $262,340 – – – – $262,340 n/a
Andrew Cartledge $550,000 $275,000 $137,500 $137,500 $500 $1,100,500 100%
James Powell 2 $360,000 $60,000 $60,000 $60,000 $500 $540,500 100%
1 Fixed includes superannuation but excludes any allowances or non-monetary benefits. In particular, the amounts do not include the value related to annual and long service leave entitlements.
2 A portion of James Powell’s fixed remuneration is paid in NZ$. The amounts above reflect the A$ equivalent.
3 Other equity refers to a company-wide Christmas Equity Bonus consisting of $500 worth of share rights which vested on 3 July 2017. The bonus was available to all employees, subject to continued employment at vesting. In certain countries, where a local deferred equity right could not be offered, the bonus was paid in cash.
Actual remuneration received in FY17
In the table below, executive remuneration received in FY17 is separated into remuneration received for employment in FY17 and deferred equity incentives from previous years that vested in FY17.
Current year remuneration represents FY17 fixed remuneration plus the first equity tranche of equity incentives awarded for FY17 performance granted in September 2017.
Prior years’ remuneration represents any deferred equity awards from prior periods that vested during FY17. The value of the vested deferred equity is shown in two components: the face value at date of original award and the contribution from growth in the WiseTech share price over the period from award to vesting date. For James Powell, this represented the vesting of the first tranche of share rights awarded at the IPO in relation to the close out of short-term incentive arrangements for FY15 and FY16.
WiseTech Global | annual report 2017 31

Remuneration Report
Actual remuneration received in FY17
Current year remunerationPrior years’
remuneration
TotalEquity
growthTotal including equity growthFixed 1 Equity incentive 2 Deferred equity
Richard White $1,000,000 – – $1,000,000 – $1,000,000
Maree Isaacs $262,340 – – $262,340 – $262,340
Andrew Cartledge $550,000 $275,000 – $825,000 – $825,000
James Powell3 $360,000 $60,000 $179,999 $599,999 $119,283 $719,282
1 Fixed includes superannuation but excludes any allowances or non-monetary benefits. In particular, the amounts do not include the value related to annual and long service leave entitlements.
2 Equity incentive refers to the portion of the award for the year ended 30 June 2017 delivered as equity in September 2017.
3 A portion of James Powell’s fixed remuneration is paid in NZ$. The amounts above reflect the A$ equivalent.
Please note the actual remuneration in the table differs from the required statutory disclosures on page 39 which are prepared in accordance with the relevant accounting standards and represent a blend of actual amounts and accounting accruals.
Executive KMP equity incentive outcomes for FY17 and the link to WiseTech performance
The tables below summarise the performance of WiseTech shares for the period since our ASX-listing in April 2016 and for the year ended 30 June 2017, and our financial performance for the five years FY13 to FY17. The information has been considered in conjunction with an assessment of individual performance by the Remuneration Committee when determining Executive KMP remuneration.
Period Period start
Share price at start of
periodShare price
30 June 2017Change in
share price Change in
ASX 300
WTC outper-
formance v ASX 300
Dividends paid per
share WTC TSR
Since listing 11 April 2016 $3.35 1 $6.92 +106.6% +15.8% +90.8% $0.01 106.9%
FY17 1 July 2016 $4.43 $6.92 +56.2% +9.1% +47.1% $0.01 56.4%
1 IPO offer price.
FY13 FY14 FY15 FY16 FY17
Revenue ($m) 43.0 56.7 70.0 102.8 153.8
Revenue growth n/a 32% 23% 47% 50%
NPAT 1 ($m) 3.7 10.1 10.1 2.2 31.9
Earnings per share (cents) 1.8 4.9 4.2 0.8 10.9
Dividend per share (cents) 0.83 0.84 0.91 0.60 2.20
1 NPAT attributable to equity holders of the parent (affects FY17 only). NPAT for FY13 is for continuing operations.
In FY17, our co-founders, Richard White and Maree Isaacs, were remunerated solely with fixed pay as we believe that their significant equity holdings provide adequate motivation and alignment with other shareholders.
32

Remuneration Report
The equity incentive outcomes for other Executive KMP were determined on an individual basis aligned to the strategic goals and economic outcomes for WiseTech.
• Andrew Cartledge’s equity incentive opportunity for on target performance was 100% of fixed remuneration (with a potential maximum opportunity for significant outperformance of 150% of fixed remuneration). The CEO reviewed Andrew’s performance based on financial results including EBITDA, TSR and operational outcomes including building out the finance function to support business growth and strategic initiatives. Andrew’s performance was assessed “at target”.
• James Powell’s equity incentive opportunity for on target performance was 50% of fixed remuneration. The CEO reviewed James’ performance on criteria including the readiness of PAVE to move into the commercialising environment, execution on productivity initiatives and establishment of delivery management team and structure. James’ performance was assessed “at target”.
KMP remuneration framework for FY18
Since our ASX listing last year, we have deeply considered the right remuneration approach for our organisation, and we have felt compelled to put in place an incentive program that will drive our specialised operations and growth aspirations while aligning our interests with those of shareholders.
We know the actions we take in FY18 will impact shareholder value for many years to come. At WiseTech, we believe effective performance incentives are best focused on key strategic priorities, financial targets and operational KPI lead measures and delivered in the form of multi-year deferred equity to ensure alignment with shareholders’ interests.
Our current year financial and strategic outcomes are the result of a laser-like focus in previous years on strategic goals, lead indicators and execution on critical short-term and medium-term project deliverables. To assist us in achieving our outcomes, we utilise strategic and tactical plans which feed our comprehensive productivity tools and PAVE to create engineered and predictable outcomes throughout our business functions. Agreed actions, such as project deliverables, feed direct measurable effects and we use lead measures to predict longer-term lag outcomes such as growth in revenue and EBITDA.
Quantifiabletargets
Agreed actions
Continuous progressassessed through year
Key performance pointDelivery assessed,
reward granted
Deferment createsalignment
LAG economicoutcomes
+ TSR
Strategic andOperational
LEAD measures
Measurableeffects
It is evident from the diagram above, that we focus on clear measures which result in predicable long-term results from actions, measurable effects and lead indicators. Our view is that this approach, combined with three-year vesting on equity incentive, obviates the need for a separate long-term incentive to align interests with shareholders.
WiseTech Global | annual report 2017 33
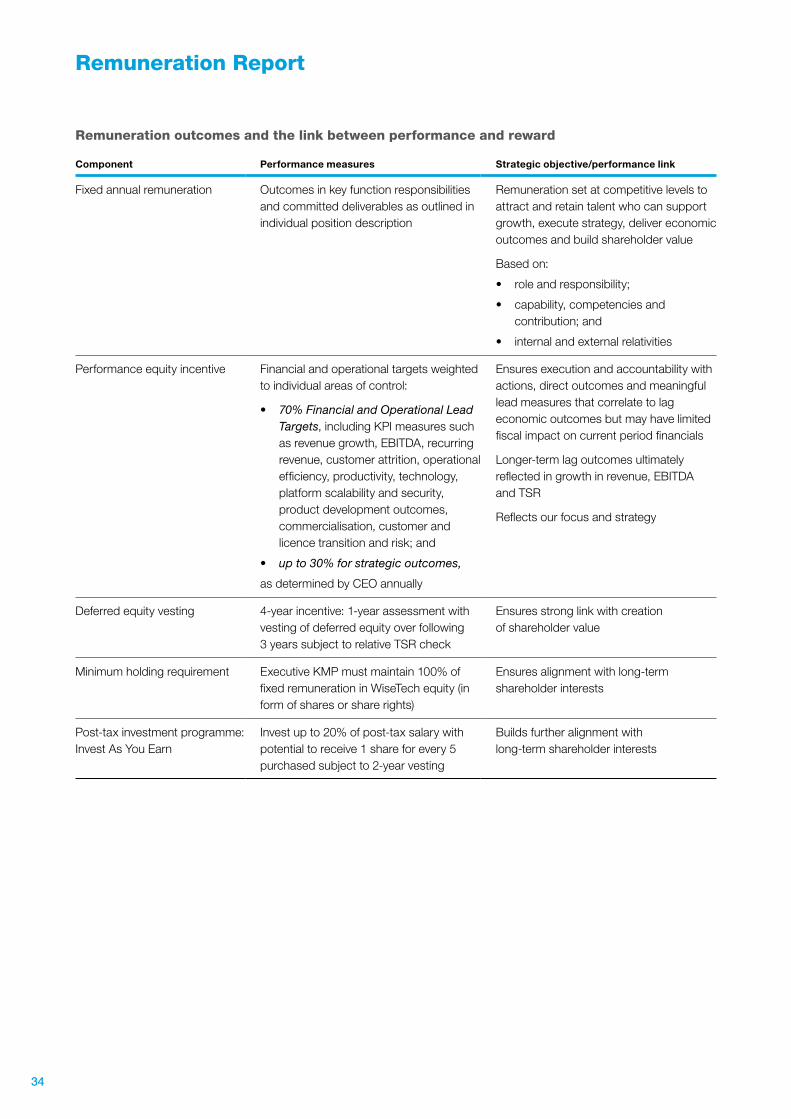
Remuneration Report
Remuneration outcomes and the link between performance and reward
Component Performance measures Strategic objective/performance link
Fixed annual remuneration Outcomes in key function responsibilities and committed deliverables as outlined in individual position description
Remuneration set at competitive levels to attract and retain talent who can support growth, execute strategy, deliver economic outcomes and build shareholder value
Based on:
• role and responsibility;
• capability, competencies and contribution; and
• internal and external relativities
Performance equity incentive Financial and operational targets weighted to individual areas of control:
• 70% Financial and Operational Lead Targets, including KPI measures such as revenue growth, EBITDA, recurring revenue, customer attrition, operational efficiency, productivity, technology, platform scalability and security, product development outcomes, commercialisation, customer and licence transition and risk; and
• up to 30% for strategic outcomes,
as determined by CEO annually
Ensures execution and accountability with actions, direct outcomes and meaningful lead measures that correlate to lag economic outcomes but may have limited fiscal impact on current period financials
Longer-term lag outcomes ultimately reflected in growth in revenue, EBITDA and TSR
Reflects our focus and strategy
Deferred equity vesting 4-year incentive: 1-year assessment with vesting of deferred equity over following 3 years subject to relative TSR check
Ensures strong link with creation of shareholder value
Minimum holding requirement Executive KMP must maintain 100% of fixed remuneration in WiseTech equity (in form of shares or share rights)
Ensures alignment with long-term shareholder interests
Post-tax investment programme: Invest As You Earn
Invest up to 20% of post-tax salary with potential to receive 1 share for every 5 purchased subject to 2-year vesting
Builds further alignment with long-term shareholder interests
34
Remuneration Report
Executive Directors
Our Executive Directors, Richard and Maree, as co-founders of WiseTech Global, each have significant equity interests and, as such, their motivations and interests are firmly aligned with those of our other shareholders. Therefore, their FY18 remuneration will contain no deferred equity components.
CEO and founder, Richard White, will continue to receive fixed remuneration of $1 million per annum in FY18. Head of Invoicing & Licensing, Maree Isaacs, will receive fixed remuneration of $350,000 per annum, an increase from $262,340 in FY17, following a salary and performance review which considered her operational role and remuneration parity. Maree’s fixed remuneration was last increased in 2015. Maree will also have a target performance incentive of up to 43% of fixed remuneration annually, based on achievement of multi-year strategic goals related to operational delivery on key growth goals in contract management, legacy conversion, licensing transition and pricing. In view of Maree’s significant existing ownership of WiseTech equity, the Board determined this performance incentive will be cash-based.
Non-director KMP
To align our non-director KMP with our shareholders’ interests, Executive KMP are required to maintain a minimum WiseTech equity holding of 100% of fixed remuneration within five years of appointment and their annual performance incentive will be delivered in the form of deferred equity over three years.
Our non-director KMP remuneration structure features:
• fixed remuneration consisting of base salary and superannuation; and
• a target Performance Equity Incentive opportunity of up to 100% of fixed remuneration for target high performance. In select circumstances, the CEO and Board may use their discretion to grant an additional reward for substantial outperformance, usually capped at an additional 50% of target. Performance Equity Incentive will be in the form of deferred equity over three years, normally delivered as share rights with vesting after the end of the performance period in three equal tranches in July 2019, 2020 and 2021. Prior to any vesting in a given year, the Board will consider relative TSR for the year compared to the ASX 200 index and has the discretion to cancel the vesting of that tranche. The grant of equity will be determined using the market value based on the WiseTech share price following the announcement of our full year results in August.
While our preference is for 100% equity, we are cognisant of liquidity requirements and the potential need for allocated shares to be sold to meet taxation commitments. Therefore, a non-director KMP can apply to receive up to 30% of their award in cash, at Board discretion, with the remainder issued as deferred equity vesting over three years. Unvested deferred equity will not receive dividends.
In the event of an executive leaving service, unvested share rights will lapse. However, the full Board has discretion in exceptional circumstances to determine that some or all of the unvested share rights will not lapse.
WiseTech Global | annual report 2017 35
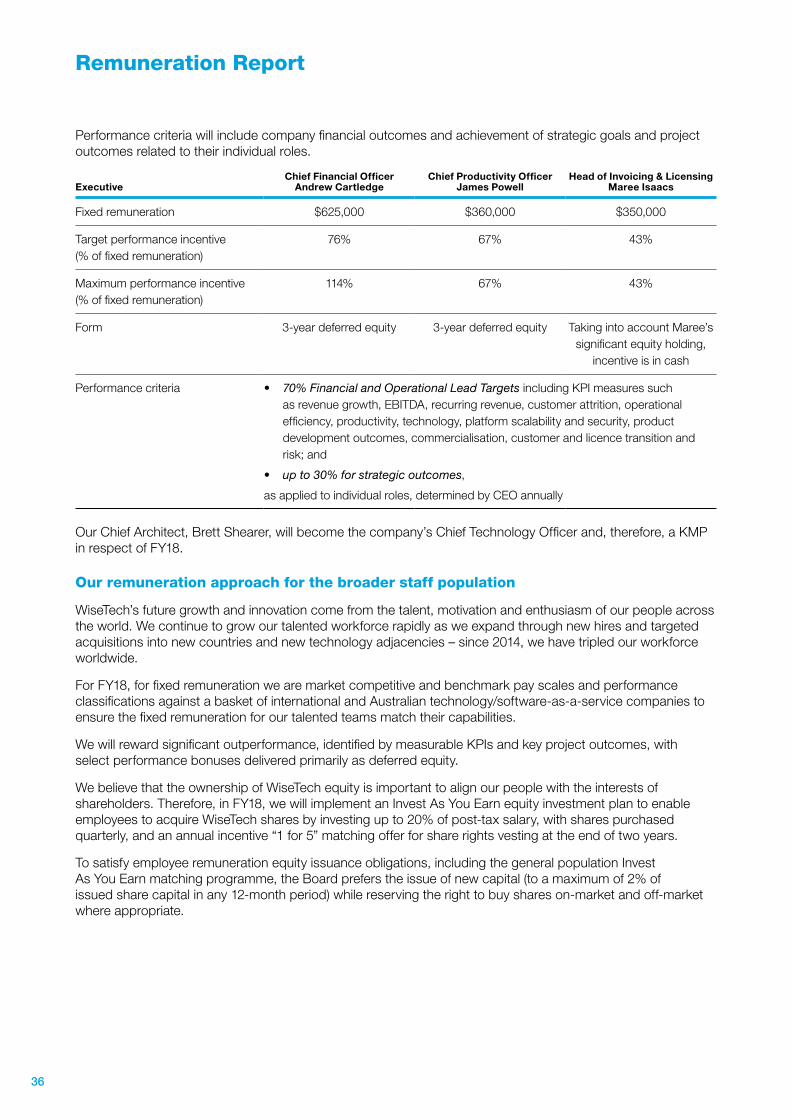
Remuneration Report
Performance criteria will include company financial outcomes and achievement of strategic goals and project outcomes related to their individual roles.
ExecutiveChief Financial Officer
Andrew CartledgeChief Productivity Officer
James PowellHead of Invoicing & Licensing
Maree Isaacs
Fixed remuneration $625,000 $360,000 $350,000
Target performance incentive (% of fixed remuneration)
76% 67% 43%
Maximum performance incentive (% of fixed remuneration)
114% 67% 43%
Form 3-year deferred equity 3-year deferred equity Taking into account Maree’s significant equity holding,
incentive is in cash
Performance criteria • 70% Financial and Operational Lead Targets including KPI measures such as revenue growth, EBITDA, recurring revenue, customer attrition, operational efficiency, productivity, technology, platform scalability and security, product development outcomes, commercialisation, customer and licence transition and risk; and
• up to 30% for strategic outcomes,
as applied to individual roles, determined by CEO annually
Our Chief Architect, Brett Shearer, will become the company’s Chief Technology Officer and, therefore, a KMP in respect of FY18.
Our remuneration approach for the broader staff population
WiseTech’s future growth and innovation come from the talent, motivation and enthusiasm of our people across the world. We continue to grow our talented workforce rapidly as we expand through new hires and targeted acquisitions into new countries and new technology adjacencies – since 2014, we have tripled our workforce worldwide.
For FY18, for fixed remuneration we are market competitive and benchmark pay scales and performance classifications against a basket of international and Australian technology/software-as-a-service companies to ensure the fixed remuneration for our talented teams match their capabilities.
We will reward significant outperformance, identified by measurable KPIs and key project outcomes, with select performance bonuses delivered primarily as deferred equity.
We believe that the ownership of WiseTech equity is important to align our people with the interests of shareholders. Therefore, in FY18, we will implement an Invest As You Earn equity investment plan to enable employees to acquire WiseTech shares by investing up to 20% of post-tax salary, with shares purchased quarterly, and an annual incentive “1 for 5” matching offer for share rights vesting at the end of two years.
To satisfy employee remuneration equity issuance obligations, including the general population Invest As You Earn matching programme, the Board prefers the issue of new capital (to a maximum of 2% of issued share capital in any 12-month period) while reserving the right to buy shares on-market and off-market where appropriate.
36

Remuneration Report
Overview of Non-Executive Director remuneration
The Board sets Non-Executive Director remuneration at a level that enables the Group to attract and retain Directors with an appropriate mix of skills and experience. The remuneration of the Non-Executive Directors is determined by the Board on recommendation from the Remuneration Committee within a maximum fee pool.
Non-Executive Directors receive a base fee and statutory superannuation contributions. Non-Executive Directors do not receive any performance-based remuneration.
Non-Executive Director fee pool and structure
The maximum amount of fees that can be paid to Non-Executive Directors is capped by a pool approved by shareholders. The current fee pool is $900,000 per annum.
In determining the appropriate level of fees, the Board has regard for market practice and survey data. The following table outlines the main Board and Committee fees effective annually from 1 July 2016. All fees are exclusive of superannuation.
Chair fee Member fee
Board $140,000 $85,000
Audit and Risk Management Committee $15,000 –
Remuneration Committee $10,000 –
The Board has indicated that it is in the process of recruiting at least one additional independent Non-Executive Director to the Board in FY18.
Non-Executive Director remuneration and equity holdings
The following tables detail Non-Executive Directors’ remuneration in respect of FY17 and the prior period, together with details of WiseTech Global Limited ordinary shares held directly, indirectly or beneficially by each Non-Executive Director and their related parties:
Board and Committee fees Superannuation Total
Charles Gibbon FY17 $140,000 $13,300 $153,300
FY16 $140,000 $13,300 $153,300
Michael Gregg FY17 $95,000 $9,025 $104,025
FY16 $95,000 $9,025 $104,025
Andrew Harrison FY17 $100,000 $9,500 $109,500
FY16 $92,052 $8,745 $100,797
Total FY17 $335,000 $31,825 $366,825
FY16 $327,052 $31,070 $358,122
Shares held on1 July 2016 Shares acquired Shares disposed
Shares held on 30 June 2017
Charles Gibbon 20,698,297 – – 20,698,297
Michael Gregg 16,123,188 29,103 – 16,152,291
Andrew Harrison 29,850 10,000 – 39,850
WiseTech Global | annual report 2017 37
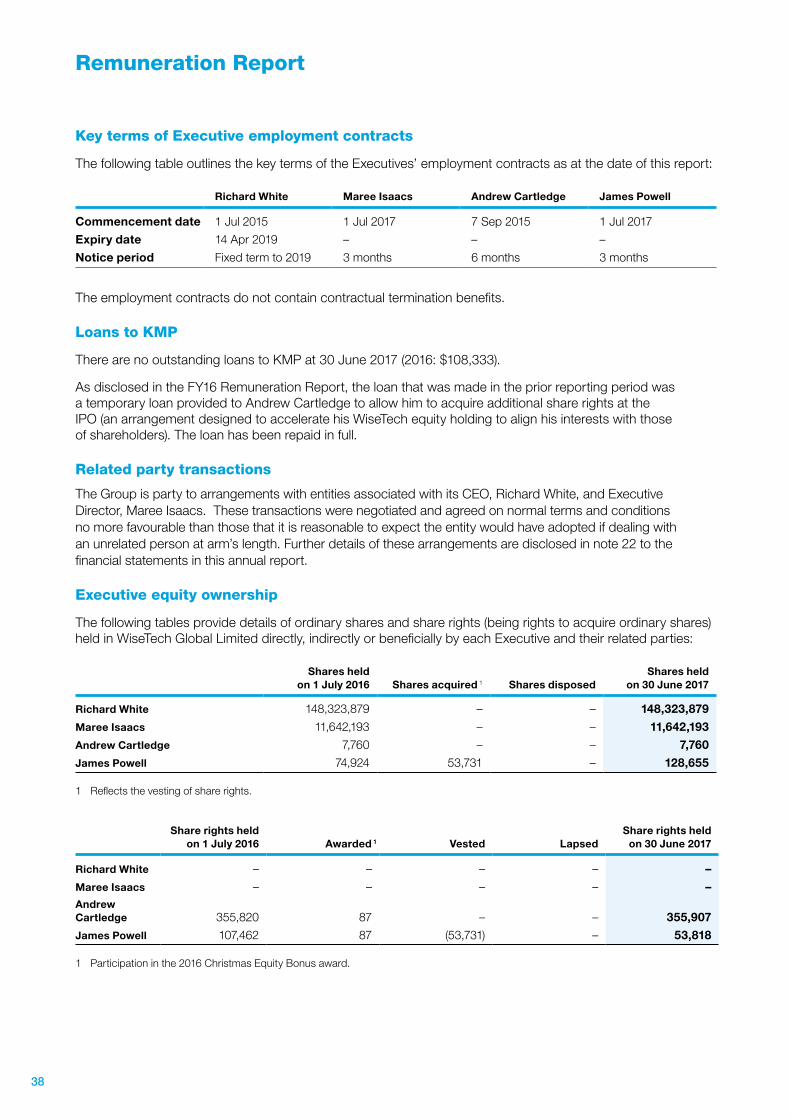
Remuneration Report
Key terms of Executive employment contracts
The following table outlines the key terms of the Executives’ employment contracts as at the date of this report:
Richard White Maree Isaacs Andrew Cartledge James Powell
Commencement date 1 Jul 2015 1 Jul 2017 7 Sep 2015 1 Jul 2017
Expiry date 14 Apr 2019 – – –
Notice period Fixed term to 2019 3 months 6 months 3 months
The employment contracts do not contain contractual termination benefits.
Loans to KMP
There are no outstanding loans to KMP at 30 June 2017 (2016: $108,333).
As disclosed in the FY16 Remuneration Report, the loan that was made in the prior reporting period was a temporary loan provided to Andrew Cartledge to allow him to acquire additional share rights at the IPO (an arrangement designed to accelerate his WiseTech equity holding to align his interests with those of shareholders). The loan has been repaid in full.
Related party transactions
The Group is party to arrangements with entities associated with its CEO, Richard White, and Executive Director, Maree Isaacs. These transactions were negotiated and agreed on normal terms and conditions no more favourable than those that it is reasonable to expect the entity would have adopted if dealing with an unrelated person at arm’s length. Further details of these arrangements are disclosed in note 22 to the financial statements in this annual report.
Executive equity ownership
The following tables provide details of ordinary shares and share rights (being rights to acquire ordinary shares) held in WiseTech Global Limited directly, indirectly or beneficially by each Executive and their related parties:
Shares held on 1 July 2016 Shares acquired 1 Shares disposed
Shares held on 30 June 2017
Richard White 148,323,879 – – 148,323,879
Maree Isaacs 11,642,193 – – 11,642,193
Andrew Cartledge 7,760 – – 7,760
James Powell 74,924 53,731 – 128,655
1 Reflects the vesting of share rights.
Share rights held on 1 July 2016 Awarded 1 Vested Lapsed
Share rights held on 30 June 2017
Richard White – – – – –
Maree Isaacs – – – – –Andrew Cartledge 355,820 87 – – 355,907
James Powell 107,462 87 (53,731) – 53,818
1 Participation in the 2016 Christmas Equity Bonus award.
38

Remuneration Report
Schedule of KMP share rights and conditions
Share rights granted to Andrew Cartledge and James Powell in FY17 Share rights vesting in FY17 – James Powell
Award 2016 Christmas Equity Bonus, equivalent to $500
Share rights granted at IPO in respect of incentive entitlements related to bonuses for FY15 and FY16
Instrument Share rights (rights to acquire ordinary shares)
Share rights (rights to acquire ordinary shares)
Allocation price $5.70 per share, being the closing price on 16 December 2016
$3.35 per share, being the IPO offer price
Allocation 87 share rights, determined as $500 divided by $5.70 (rounded down)
53,731 share rights
Grant date 1 June 2017 14 April 2016
Grant date fair value $7.22 $3.35
Release conditions Share rights automatically convert to ordinary shares subject to being an employee at the release date. There are no performance conditions.
Share rights automatically converted to ordinary shares on the release date. There were no further performance or service conditions.
Release date 3 July 2017 22 February 2017 – the release of WiseTech’s financial results for the period ended 31 December 2016
Dividends No dividends or dividend equivalents are paid on share rights.
Clawback provisions Our plan rules provide the Board with broad clawback powers. If in the opinion of the Board, a participant acts fraudulently or dishonestly or is in material breach of his or her obligations to any Group company, the Board may deem any award of share rights held by the participant to be forfeited.
Other statutory disclosures - Executive remuneration
The following table of Executive KMP remuneration has been prepared in accordance with accounting standards and the Corporations Act 2001 requirements, for the period from 1 July 2016 to 30 June 2017 and the prior period:
Short-term benefits
Post employment
Share-based payments
Long-term benefits Total
Base salary and benefits
Super-annuation
Shares and share rights Other2 Total
Performance related
Richard White FY17 $965,000 $35,000 – $126,932 $1,126,932 –
FY16 $965,000 $35,000 – $65,721 $1,065,721 –
Maree Isaacs FY17 $233,173 $29,167 – $23,312 $285,652 –
FY16 $241,477 $20,863 – $18,629 $280,969 –
Andrew Cartledge 1 FY17 $535,651 $16,000 $389,584 $55,133 $996,368 39%
FY16 $433,713 $19,519 $672,000 $33,141 $1,158,373 58%
James Powell FY17 $424,006 $23,076 $110,630 $11,603 $569,315 19%
FY16 $424,614 $17,678 $180,000 $27,046 $649,338 28%
1 Andrew Cartledge was appointed CFO on 7 September 2015.
2 Other long-term benefits relate to annual and long service leave.
WiseTech Global | annual report 2017 39

Directors’ Report
The Directors present their report together with the consolidated financial statements of the Group comprising WiseTech Global Limited, and its controlled entities for the financial year ended 30 June 2017 and the auditor’s report thereon.
Directors
The names and details of the Company’s Directors in office during the financial year and until the date of this report are set out below. Directors were in office for this entire period unless otherwise stated.
• Charles Llewlyn Gibbon (Chairman);
• Richard John White (CEO);
• Michael John Gregg;
• Andrew Charles Harrison; and
• Maree McDonald Isaacs.
The qualifications and experience of the Directors, including current and recent directorships, are detailed on pages 20 and 21 of this annual report.
Directors’ meetings and their attendance at those meetings for FY17 (including meetings of committees of Directors) are disclosed on page 21 of this annual report.
Company Secretary
Natasha Davidson, Group General Counsel and Company Secretary
BA (Hons) LLB (Macquarie), LLM (Sydney)
Ms Davidson is Group General Counsel and Company Secretary. As Company Secretary, she is responsible for company secretarial and corporate governance support across the Group. Ms Davidson has held senior roles at Clayton Utz, Royal Bank of Scotland and ABN AMRO. Ms Davidson was president of the Australian Financial Markets Association Capital Raising Committee from 2009 to 2014.
Maree IsaacsDetails of Ms Isaacs’ qualifications and experience are disclosed on page 21 of this annual report.
Review of operations
Information on the operations and financial position of the Group and its business strategies and prospects is set out in the operating and financial review on pages 22 to 28 of this annual report.
Dividends
Details of dividends paid during FY17 and the prior period are disclosed in note 7 to the financial statements included in this annual report.
Significant changes in the state of affairs
There have been no significant changes in the state of affairs of the Group during the year.
Events subsequent to balance date
On 1 August 2017, WiseTech Global Limited completed the acquisition of a 100% interest in Bysoft Solucoes em Sistemas Para Comercio Exterior Ltda (“Bysoft”), the largest provider of customs and logistics compliance solutions to the logistics industry across Brazil. The Company paid $13.1m (BRL 30m) on completion, with a potential earn-out payment for future revenue growth. The total purchase cost will be 3.8x 2018 Bysoft revenue. Bysoft has current annual revenue of approximately $3.4m (BRL 8.7m) and approximately break even net profit after tax.
During August 2017, the Group announced and completed the acquisitions of Digerati, Prolink and CMS Transport Systems. The combined annual revenues and EBITDA for these acquisitions are approximately $7.6m and $1.0m. Total upfront consideration paid was $14.4m. There is no contingent consideration for Digerati
40

Directors’ Report
and the contingent consideration for CMS is up to $4m and for Prolink is estimated at 2.5x–3x 2021 recurring revenue.
During September 2017, the Group announced the acquisitions of two leading global rate management solution providers, Cargoguide and CargoSphere. The combined annual revenues and EBITDA for these acquisitions are approximately $6.0m and $0m. Total upfront consideration is expected to be $18.4m with earn-out potential for both, based on revenue growth to 2020. There is no other contingent consideration.
Initial accounting surrounding these acquisitions have not yet been completed.
On 18 August 2017, the Group announced to the German market its intended voluntary public acquisition offer to the remaining shareholders of Softship to purchase any and all outstanding shares. The offer made is EUR 10.00 per share with 409,611 shares outstanding at the offer date. Concurrently, the Management Board of Softship announced their intention to apply to de-list Softship shares from the Frankfurt Stock Exchange.
Since the period end, the Directors have declared a fully franked final dividend of 1.2 cents per share, payable 4 October 2017. The dividend will be recognised in subsequent financial statements.
Other than the matters discussed above, there has not arisen in the interval between the end of the financial year and the date of this report any item, transaction or event of a material and unusual nature, likely, in the opinion of the Directors of the Company, to affect significantly the operations of the Group, the results of those operations or the state of affairs of the Group in future financial years.
Likely developments and expected results
For further information about likely developments in the operations of the Group, refer to the strategy and outlook sections in the operating and financial review on pages 22 to 28 of this annual report.
Environmental regulation and performance
The operations of the Group are not subject to any particular or significant environmental regulations under a Commonwealth, State or Territory law of Australia.
Indemnification and insurance of Directors and officersInsurance
The Group’s officers consist of the Directors of the Company, the Company Secretaries and other officers of the Company, including certain executive officers whose functions include the management of operations, financial management, strategic development, risk management and human resources management of the Company and its related parties.
During FY17, the Company paid a premium under a contract insuring each of certain officers of the Group against liability incurred in that capacity. Disclosure of the nature of the liability and the amount of the premium is prohibited by the confidentiality clause of the contract of insurance.
Indemnification
WiseTech’s constitution provides that every person who is or has been a director or company secretary of the Company or a subsidiary of the Company is indemnified by the Company to the maximum extent permitted by law. The indemnity covers liabilities and legal costs incurred by the person as a director or company secretary.
Share rights
At the date of this report, WiseTech had 1,554,809 share rights outstanding across 244 holders. The share rights relate to grants of deferred equity to employees under the Long Term Incentive Plan or Equity Incentives Plan and have a range of vesting dates through to August 2019. The share rights are not subject to further performance conditions, but may be subject to employment conditions. On vesting, the holder is entitled to receive one ordinary share at no cost to the holder.
155,075 share rights were converted to shares during the financial year.
41WiseTech Global | annual report 2017
Directors’ Report
Proceedings on behalf of the Group
Under section 237 of the Corporations Act 2001, no application has been made in respect of the Group and no proceedings have been brought or intervened in or on behalf of the Group under that section.
Remuneration Report
Information on WiseTech’s remuneration framework and the outcomes for FY17 for the Key Management Personnel and changes for FY18, is included in the Remuneration Report on pages 29 to 39 of this annual report.
Corporate governance
Our Corporate Governance Statement for FY17 is available from our website, www.wisetechglobal.com.
Non-audit services
During the year, KPMG, the Company’s auditor, performed certain other services in addition to the audit and review of the financial statements. Details of the amounts paid to the auditor of the Group, KPMG, and its network firms for audit and non-audit services provided in note 23 to the financial statements included in this annual report.
The Board has considered the non-audit services provided during FY17 by the auditor and in accordance with written advice provided by resolution of the Audit and Risk Management Committee, is satisfied that the provision of those non-audit services during FY17 by the auditor is compatible with, and did not compromise, the auditor independence requirements of the Corporation Act 2001 for the following reasons:
• all non-audit services were subject to the corporate governance procedures adopted by the Group and have been reviewed by the Audit and Risk Management Committee to ensure they do not impact the integrity and objectivity of the auditor; and
• the non-audit services provided did not undermine the general principles relating to auditor independence as set out in APES 110 Code of Ethics for Professional Accountants, as they did not involve reviewing or auditing the auditor’s own work, acting in a management or decision making capacity for the Company, acting as an advocate for the Group or jointly sharing risks and rewards.
Lead auditor’s independence declaration
The lead auditor’s independence declaration is set out on page 43 of this annual report and forms part of the Directors’ Report for the financial year ended 30 June 2017.
Signed in accordance with a resolution of the Directors.
Charles Gibbon Chairman
Richard White Executive Director and CEO
22 September 2017 22 September 2017
42
Lead auditor’s independence declarationunder section 307C of the Corporations Act 2001
KPMG, an Australian partnership and a member firm of the KPMG network of independent member firms affiliated with KPMG International Cooperative (“KPMG International”), a Swiss entity.
Liability limited by a scheme approved under Professional Standards Legislation.
Lead Auditor’s Independence Declaration under
Section 307C of the Corporations Act 2001
To the Directors of WiseTech Global Limited
I declare that, to the best of my knowledge and belief, in relation to the audit of WiseTech Global Limited for the financial year ended 30 June 2017 there have been:
i. no contraventions of the auditor independence requirements as set out in the Corporations Act 2001 in relation to the audit; and
ii. no contraventions of any applicable code of professional conduct in relation to the audit.
KPMG Chris Hollis Partner Sydney
22 September 2017 PAR_SIG_01 PAR_NAM_01 PAR_POS_01 PAR_DAT_01 PAR_CIT_01
43WiseTech Global | annual report 2017
Risk management
The Group’s operations and financial results are subject to a number of risks. Some of these risks are not directly within WiseTech’s control. The main risks affecting WiseTech, and the steps we take to manage or mitigate these risks are described below.
Reliance on our flagship product CargoWise One and failure to adequately maintain and develop it
Our business model depends on our ability to continue to ensure that our customers are satisfied with CargoWise One. There is a risk that we fail to maintain CargoWise One adequately, or that updates introduce errors and performance issues, which may cause customer satisfaction in CargoWise One to fall. Customer satisfaction may also fall as a result of real or perceived reductions in functionality, product quality, reliability, cost effectiveness, and customer support for CargoWise One, or a failure to accommodate and reflect changes and developments in technology and in the commercial, compliance and regulatory environment. Any of these factors may result in reduced sales and usage, loss of customers, reputational damage, an impaired ability to attract new customers and potentially claims for compensation.
Our future revenue and growth also depend on our ability to develop enhancements and new features and modules for CargoWise One so that it continues to meet customer needs, attract new customers and generate additional revenue from increased usage. There is a risk that the development and introduction of new features and modules does not result in a successful outcome for us due to various reasons, such as insufficient investment, unforeseen costs, poor performance and reliability, low customer acceptance, existing competition or economic and market conditions.
To mitigate this risk, we continue to invest significantly in product development and innovation, investing $167m in the period FY13–FY17. In FY17, we reinvested 33% of our revenues in product development and innovation and delivered over 680 product upgrades and enhancements to the platform.
Ability to attract and retain key personnel
Our success is dependent on retaining key personnel, in particular, our founder and CEO, Richard White and members of the senior management and product teams. In addition, we need to attract and retain highly skilled software development engineers. Competition for such personnel is intense. There is a risk that we may not be able to attract and retain key personnel or be able to find effective replacements in a timely manner. The loss of such personnel, or any delay in their replacement, could materially adversely impact our ability to operate our business and achieve our growth strategies and prospects, including through the development and commercialisation of new features, products or modules.
The loss of key personnel could also have an adverse impact on our operations, the potential loss of key customer relations, and potential loss of business process knowledge.
To mitigate this risk, we have invested and continue to invest in our workforce by recruiting key individuals and also in processes and systems to ensure knowledge and skills are maintained within the Group to enable its continued and stable growth. Our remuneration framework also delivers flexible components designed to support the recruitment, motivation and retention of our staff.
Execution of new acquisitions and integration of acquired businesses
In recent years, we have completed a number strategic acquisitions and part of our growth strategy is to undertake targeted acquisitions in the future. It is our intention to integrate strategic acquisitions, which includes transitioning customers of the acquired businesses to our CargoWise One platform. We may also choose to utilise aspects of the acquired business or their products to enhance our existing product. There is a risk that customers of acquired businesses do not transition across to CargoWise One. There is also a risk that the transitioning of customers requires significantly more financial and management resources, or time to complete, than originally planned. In addition, there is a risk that the acquisitions may fail to: meet our strategic and financial objectives, generate the synergies and benefits that we expected, or provide an adequate return on the purchase price and resources invested in them.
44
Risk management
There is a risk that future expansion by acquisition may be affected by factors beyond our control (including without limitations, commercial or regulatory changes), which may result in there being limited or unsuitable opportunities at the relevant time.
Our acquisition strategy has resulted, and is likely to continue to result, in us expanding our presence in new international jurisdictions which may increase our exposure to the risks associated with doing business in such regions. These regions may have greater risk of political, legal and economic instability or different legal and regulatory systems and frameworks compared to the regions in which we currently operate.
To mitigate the risk of loss of customers or slow-down in growth, we tailor the acquisition and integration approach to each acquisition and the region in which the acquisition business is based. Broadly, the process is characterised by a three phased approach to:
• integrate the target: operations and workforce;
• develop the product capability into our CargoWise One platform; and
• grow revenue from new capabilities and conversion of acquired customer base.
When considering a target for potential acquisition, we also assess the capabilities of the business to support the integration and product development phases mentioned above.
WiseTech operation in a competitive industry
We compete against other commercial logistics service software providers as well as our potential customers’ in-house IT departments that develop in-house logistics software. Some of our existing and potential competitors have significantly more resources than we do. We face the risk that:
• existing competitors could increase their competitive position through aggressive marketing campaigns, product innovation, price discounting or acquisitions;
• our software products may not be well received by our customers and we may be unable to implement necessary changes to these products to our customers’ satisfaction or we may fail to meet our customers’ expectations;
• we may fail to anticipate and respond to technology changes as quickly as our competitors;
• our competitors may increase their product offering to compete with us on a larger scale. For example, software vendors that focus on enterprise-wide applications may expand their product offering to include industry-specific applications;
• logistic service providers operate in-house developed systems in preference to commercial logistics software; and
• new competitors could emerge and develop products (including cloud-based software) which compete with our products.
Potential new customers may elect to maintain their own in-house systems rather than elect to change to our software solution due to the perceived risk of change which may adversely impact our growth opportunities.
We believe that our deeply integrated, open-access platform, which provides an efficient platform for global rollouts and an efficient consolidation tool for large 3PLs and our commitment to relentlessly invest in product development are the most effective mitigants to this risk.
Failure to retain existing customers and attract new customers
Our business success depends on our ability to retain and grow usage by our existing customers and our ability to attract further business from new customers.
There is a risk that our customers reduce the use of our software, for example, in terms of the number of users, number of modules and volume of transactions, or that they cease to use our software altogether. We generally do not require customers to enter long, fixed-term contracts requiring minimum levels of usage or minimum time commitments, and our customer contracts can typically be terminated by either party on short notice. Therefore, there is a risk that if customers terminate their contracts with us, or reduce their usage of our software, our revenue, including revenue that we characterise as recurring revenue, could decrease. There is also a risk that existing customers fail to expand their use of our software or that new customers fail to select our software for their businesses.
45WiseTech Global | annual report 2017

Risk management
We mitigate this risk by:
• providing our customers with open access to our platform to new sites/geographies;
• continuing to innovate and add more modules and functionality which drives productivity benefits for our customers and responds to industry and regulatory changes faced by customers; and
• providing a platform which enables rapid on-boarding of users without additional contract negotiations.
Our success in managing this risk is characterised by our high (99%) level of recurring revenue (excluding recent acquisitions) and our low (<1%) level of annual customer attrition (by CargoWise One customers).
Decline in trade volumes and economic conditions
A decline in regional and global trade volumes and recessionary economic conditions, including in the logistics services market, may adversely affect our financial performance. Our customers are logistics service providers whose business operations depend on regional and global logistics activities which are closely linked to regional and global trade volumes. A decline in regional and global trade volumes and recessionary economic conditions, including in the logistics services market, may adversely affect our financial performance.
Our software provides a “mission critical”, integrated solution which increases productivity and drives efficiency in a complex, highly regulated and competitive industry. We believe that risks associated with a reduction in trade volumes and economic conditions would be offset by the opportunities which present themselves from increased competition amongst our customers.
Impacted of foreign currency on financial results
A significant portion of our revenue (FY17: 75%) is invoiced in currencies other than Australian dollars. As a result, our Australian dollar financial results are influenced by movements in the foreign exchange rates of currencies including the US dollar, South African rand, Euro and pound sterling.
This risk is partially offset by natural hedges where we also incur operational costs in the same foreign currency.
Where appropriate, we also seek to denominate new customer contracts in Australian dollars.
Disruption or failure of technology systems
Together with our customers, we are dependent on the performance, reliability and availability of our technology platforms, data centres and global communications systems (including servers, the internet, hosting services and the cloud environment in which we provide our products). There is a risk that these systems may be adversely affected by disruption, failure, service outages or data corruption that could occur as a result of computer viruses, “bugs” or “worms”, malware, internal or external misuse by websites, cyber attacks or other disruptions including natural disasters, power outages or other similar events.
These events may be caused by circumstances outside of our control, and may lead to prolonged disruption to our IT platform, or operational or business delays and damage to our reputation. This could potentially lead to a loss of customers, legal claims by customers, and an inability to attract new customers.
We mitigate this risk by operating separate data centres in three distinct regions around the world to reduce reliance on any individual data centre, a global network of support centres providing 24/7 365 support internally and to our customers, automated replication of data as well as disaster recovery planning and testing.
Security breach and data privacy
Our products involve the storage and transmission of our customers’ confidential and proprietary information, including intellectual property, confidential business information, information regarding their employees or suppliers, and other confidential information. Our business could be materially impacted by security breaches of our customers’ data and information, by unauthorised access, theft, destruction, loss of information or misappropriation or release of confidential customer data.
To mitigate this risk, we have adopted a layered approach to protecting customer data that includes physical security, system security, policy, governance, logging and auditing. Since the start of 2016, we have completed an independent Service Organisation Control audit of our key WiseCloud systems in Australia, the United States and the United Kingdom.
46
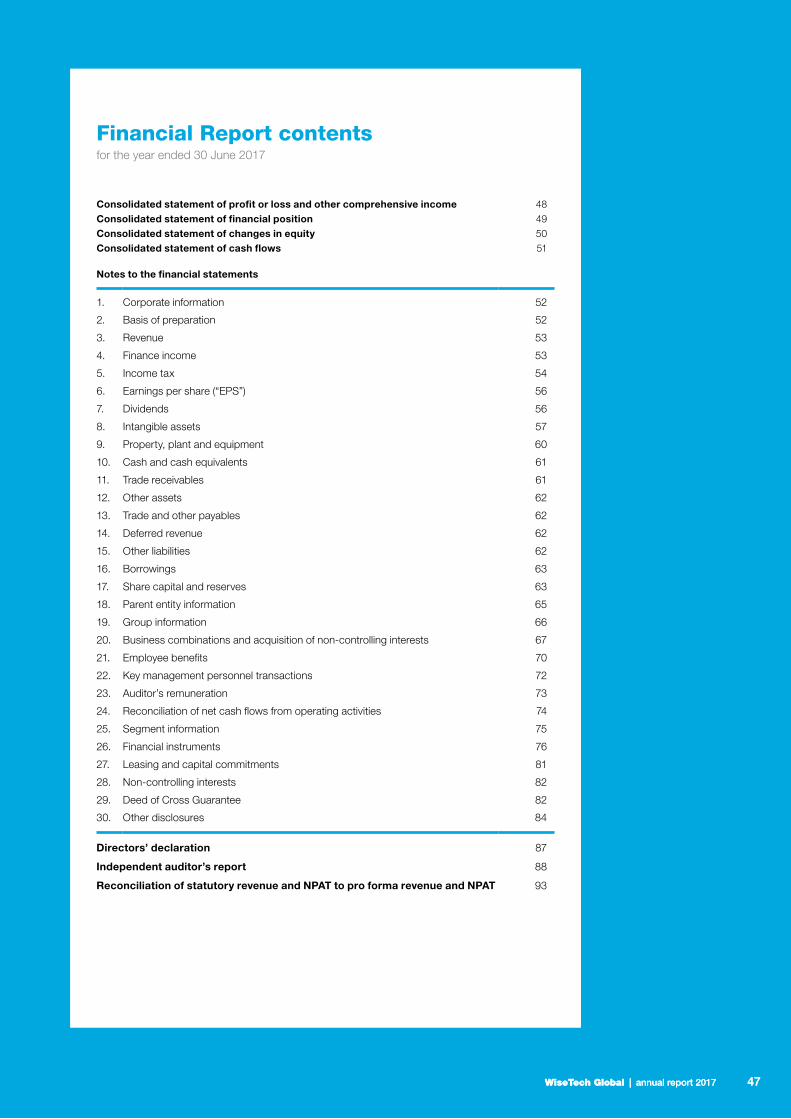
47WiseTech Global | annual report 2017
Financial Report contents for the year ended 30 June 2017
Consolidated statement of profit or loss and other comprehensive income 48Consolidated statement of financial position 49Consolidated statement of changes in equity 50Consolidated statement of cash flows 51
Notes to the financial statements
1. Corporate information 52
2. Basis of preparation 52
3. Revenue 53
4. Finance income 53
5. Income tax 54
6. Earnings per share (“EPS”) 56
7. Dividends 56
8. Intangible assets 57
9. Property, plant and equipment 60
10. Cash and cash equivalents 61
11. Trade receivables 61
12. Other assets 62
13. Trade and other payables 62
14. Deferred revenue 62
15. Other liabilities 62
16. Borrowings 63
17. Share capital and reserves 63
18. Parent entity information 65
19. Group information 66
20. Business combinations and acquisition of non-controlling interests 67
21. Employee benefits 70
22. Key management personnel transactions 72
23. Auditor’s remuneration 73
24. Reconciliation of net cash flows from operating activities 74
25. Segment information 75
26. Financial instruments 76
27. Leasing and capital commitments 81
28. Non-controlling interests 82
29. Deed of Cross Guarantee 82
30. Other disclosures 84
Directors’ declaration 87
Independent auditor’s report 88
Reconciliation of statutory revenue and NPAT to pro forma revenue and NPAT 93
47WiseTech Global | annual report 2017

Consolidated statement of profit or loss and other comprehensive incomefor the year ended 30 June 2017
Notes2017$000
2016$000
Revenue 3 153,759 102,809Cost of revenues (26,055) (15,416)Gross profit 127,704 87,393
Product design and development (35,609) (30,429)Sales and marketing (16,729) (22,815)General and administration (33,869) (29,510)Total operating expenses (86,207) (82,754)
Operating profit 41,497 4,639
Finance income 4 4,627 1,255Finance costs 26 (1,896) (2,442)Net finance income/(costs) 2,731 (1,187)
Share of (loss)/profit of equity accounted investees, net of tax (64) –
Profit before income tax 44,164 3,452
Income tax expense 5 (11,972) (1,285)Net profit for the year 32,192 2,167
Net profit for the year attributable to:Equity holders of the parent 31,860 2,167Non-controlling interests 332 –
32,192 2,167
Other comprehensive income/(loss)Items that may be reclassified to profit or lossExchange differences on translation of foreign operations 3,580 (4,208)Fair value of available-for-sale financial assets reclassified to profit or loss (2,046) –Net gain on available-for-sale financial assets 194 2,020Other comprehensive income/(loss) for the year, net of tax 1,728 (2,188)Total comprehensive income/(loss) for the year 33,920 (21)
Total comprehensive income/(loss) for the year attributable to:Equity holders of the parent 33,593 (21)Non-controlling interests 327 –
33,920 (21)
Cents Cents
Earnings per shareBasic earnings per share 6 10.9 0.8Diluted earnings per share 6 10.9 0.8
These financial statements should be read in conjunction with accompanying notes.
48
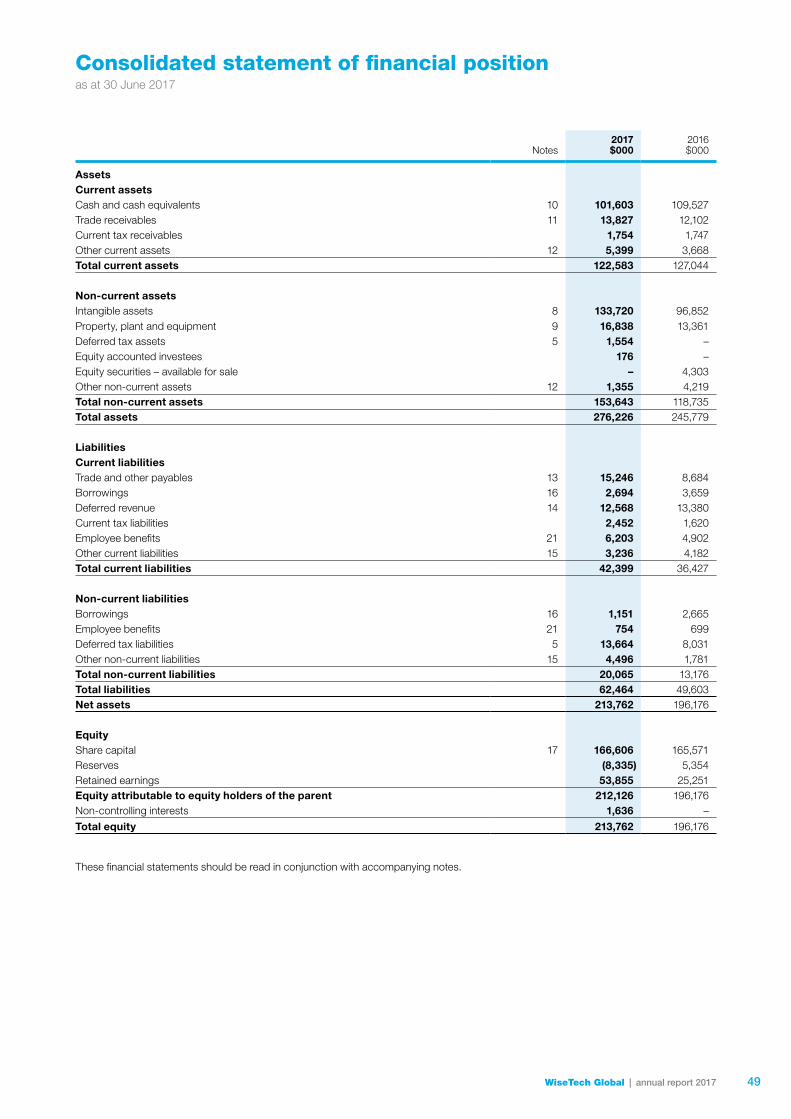
Consolidated statement of financial positionas at 30 June 2017
Notes2017$000
2016$000
AssetsCurrent assetsCash and cash equivalents 10 101,603 109,527Trade receivables 11 13,827 12,102Current tax receivables 1,754 1,747Other current assets 12 5,399 3,668Total current assets 122,583 127,044
Non-current assetsIntangible assets 8 133,720 96,852Property, plant and equipment 9 16,838 13,361Deferred tax assets 5 1,554 –Equity accounted investees 176 –Equity securities – available for sale – 4,303Other non-current assets 12 1,355 4,219Total non-current assets 153,643 118,735Total assets 276,226 245,779
LiabilitiesCurrent liabilitiesTrade and other payables 13 15,246 8,684Borrowings 16 2,694 3,659Deferred revenue 14 12,568 13,380Current tax liabilities 2,452 1,620Employee benefits 21 6,203 4,902Other current liabilities 15 3,236 4,182Total current liabilities 42,399 36,427
Non-current liabilitiesBorrowings 16 1,151 2,665Employee benefits 21 754 699Deferred tax liabilities 5 13,664 8,031Other non-current liabilities 15 4,496 1,781Total non-current liabilities 20,065 13,176Total liabilities 62,464 49,603Net assets 213,762 196,176
EquityShare capital 17 166,606 165,571Reserves (8,335) 5,354Retained earnings 53,855 25,251Equity attributable to equity holders of the parent 212,126 196,176Non-controlling interests 1,636 –
Total equity 213,762 196,176
These financial statements should be read in conjunction with accompanying notes.
49WiseTech Global | annual report 2017

Consolidated statement of changes in equityfor the year ended 30 June 2017
Notes
Share capital
$000
Treasury share
reserve$000
Acqui-sition
reserve$000
Fair value
reserve$000
Share- based
payment reserve
$000
Foreign currency
translation reserve
$000
Retained earnings
$000Total $000
Non- controlling
interests$000
Total equity$000
Balance as at 1 July 2015 44,869 – – (168) 1,692 (283) 26,897 73,007 – 73,007Net profit for the year – – – – – – 2,167 2,167 – 2,167Other comprehensive income/(loss) – – – 2,020 – (4,208) – (2,188) – (2,188)Total comprehensive income/(loss) – – – 2,020 – (4,208) 2,167 (21) – (21)Transactions with ownersIssue of share capital (net of issue costs) 17 119,989 – – – – – – 119,989 – 119,989Vesting of share rights 17 713 – – – (713) – – – – –Equity settled share-based payment expense – – – – 7,014 – – 7,014 – 7,014Dividends declared 7 – – – – – – (3,813) (3,813) – (3,813)Balance as at 30 June 2016 165,571 – – 1,852 7,993 (4,491) 25,251 196,176 – 196,176
Notes
Share capital
$000
Treasury share
reserve$000
Acqui-sition
reserve$000
Fair value
reserve$000
Share- based
payment reserve
$000
Foreign currency
trans-lation
reserve$000
Retained earnings
$000Total $000
Non-control-
ling interests
$000
Total equity
$000
Balance as at 1 July 2016 165,571 – – 1,852 7,993 (4,491) 25,251 196,176 – 196,176Net profit/(loss) for the year – – – – – – 31,860 31,860 332 32,192Other comprehensive income/(loss) – – – (1,852) – 3,585 – 1,733 (5) 1,728Total comprehensive income/(loss) – – – (1,852) – 3,585 31,860 33,593 327 33,920Transactions with ownersIssue of share capital (net of issue costs) 17 864 (864) – – – – – – – –Dividends declared 7 – – – – – – (2,913) (2,913) – (2,913)Shares issued under dividend reinvestment plan 17 241 – – – – – – 241 – 241Vesting of share rights 17 – 864 – – (521) – (343) – – –
Vesting shares withheld – (133) – – – – – (133) – (133)Transaction costs 17 (70) – – – – – – (70) – (70)Treasury shares – (6,634) – – – – – (6,634) – (6,634)Equity settled share-based payment expense – – – – 3,218 – – 3,218 – 3,218Dividend from subsidiary to non-controlling interest – – – – – – – (265) (265)Total contributions and distributions 1,035 (6,767) – – 2,697 – (3,256) (6,291) (265) (6,556)Changes in ownership interestAcquisition of subsidiary with non-controlling interest – – – – – – – – 3,952 3,952Acquisition of non-controlling interest without a change in control 20 – – (11,352) – – – – (11,352) (2,378) (13,730)Total changes in ownership interests – – (11,352) – – – – (11,352) 1,574 (9,778)Balance as at 30 June 2017 166,606 (6,767) (11,352) – 10,690 (906) 53,855 212,126 1,636 213,762
These financial statements should be read in conjunction with the accompanying notes.
50

Consolidated statement of cash flowsfor the year ended 30 June 2017
Notes2017$000
2016$000
Operating activitiesReceipts from customers 156,189 105,390Payments to suppliers and employees (91,953) (73,277)Initial Public Offer fees paid (755) (6,414)Income tax paid (8,552) (3,073)Option premium paid – (1,544)Net cash flows from operating activities 24 54,929 21,082
Investing activitiesPayment for intangible assets (22,007) (17,738)Purchase of property, plant and equipment (6,890) (2,396)Interest received 2,326 836Acquisition of subsidiaries, net of cash acquired 20 (22,907) (20,038)Other investing income 298 –Net cash flows used in investing activities (49,180) (39,336)
Financing activitiesInterest paid (273) (1,366)Repayment of finance lease liabilities (3,677) (3,363)Repayment of borrowings (236) (24,000)Dividends paid 7 (2,672) (3,813)Dividends paid by subsidiary to non-controlling interests (265) –Proceeds from issue of shares 864 125,000Initial Public Offering costs pre-tax – (7,607)Financing transaction costs – (221)Treasury shares acquired (7,498) –Net cash flows (used in)/from financing activities (13,757) 84,630
Net (decrease)/increase in cash and cash equivalents (8,008) 66,376Cash and cash equivalents at 1 July 10 109,527 43,155Effect of exchange differences on cash balances 84 (4)Net cash and cash equivalents at 30 June 10 101,603 109,527
These financial statements should be read in conjunction with accompanying notes.
51WiseTech Global | annual report 2017
Notes to the financial statementsfor the year ended 30 June 2017
1. Corporate informationWiseTech Global Limited (“Company”) is a company domiciled in Australia. The consolidated financial statements comprise the Company and its controlled entities (collectively “Group” or “WiseTech”). The Company’s registered office is at Unit 3a, 72 O’Riordan Street, Alexandria, NSW 2015, Australia.
The Group is a for-profit entity and its principal business is providing software to the logistics services industry globally.
2. Basis of preparation
Statement of complianceThe financial report is a general purpose financial report, which has been prepared in accordance with the requirements of the Corporations Act 2001, Australian Accounting Standards and other authoritative pronouncements of the Australian Accounting Standards Board. The financial report also complies with International Financial Reporting Standards (“IFRS”) as issued by the International Accounting Standards Board.
Material accounting policies adopted in the preparation of these financial statements are presented alongside the relevant notes and have been consistently applied unless stated otherwise. Other significant accounting policies which are relevant to understand the basis of preparation of these financial statements are included in note 30.
The financial statements have been prepared on an accruals basis and are based on historical costs except for:• derivative financial assets and liabilities which are measured at fair value in accordance with AASB 139 Financial Instruments:
Recognition and Measurement; and• cash flow information which are measured at fair value in accordance with AASB 13 Fair Value Measurement.
The financial statements have been prepared on a going concern basis, which contemplates continuity of normal business activities and the realisation of assets and the settlement of liabilities in the ordinary course of business.
The financial statements were authorised by the Board of Directors on 22 September 2017.
Functional and presentational currencyThe financial report is presented in Australian dollars.
Rounding of amountsThe Company is of a kind referred to in Australian Securities and Investments Commission (“ASIC”) Corporations (Rounding in Financial/Directors’ Reports) Instrument 2016/191 issued by ASIC, relating to the “rounding off” of amounts in the financial statements. Amounts in the financial statements have been rounded off in accordance with this instrument to the nearest thousand dollars, or in certain cases, the nearest dollar.
Presentation of resultsThe Group has presented the expense categories within the Consolidated statement of profit or loss and other comprehensive income on a functional basis. The categories used are cost of revenues, product design and development, sales and marketing and general and administration. This presentation style provides insight into the Company’s business model and enables users to consider the results of the Group compared to other major Software as a Service (“SaaS”) companies. The methodology and the nature of costs within each category are further described below.
Cost of revenuesCost of revenues consists of expenses directly associated with securely hosting WiseTech’s services and providing support to customers. Costs include data centre costs, personnel and related costs (including salaries and share-based payments) directly associated with cloud infrastructure and customer support, contracted third party costs, related depreciation and amortisation and allocated overheads.
Product design and development expensesProduct design and development expenses consist primarily of personnel and related costs (including salaries, benefits, bonuses and share-based payments) directly associated with the Company’s product design and development employees, as well as allocated overheads. Under IFRS, the proportion of product design and development expenses that creates a benefit in future periods is capitalisable as an intangible asset and then amortised to profit or loss over the estimated life of the asset created. The amortisation of those costs capitalised is included as a product design and development expense. In FY16, expenses also included costs associated with the close out of the legacy employee incentive scheme related to development employees in conjunction with the Initial Public Offering (“IPO”).
Sales and marketing expensesSales and marketing expenses consist of personnel and related costs (including salaries, benefits, bonuses, commissions and share-based payments) directly associated with the sales and marketing team’s activities to acquire new customers and grow revenue from existing customers. Other costs included are external advertising costs, marketing costs and promotional event costs as well as allocated overheads. In FY16, sales and marketing expenses also included the accelerated expense associated with the close out of an uncapped legacy sales commission arrangement in conjunction with the IPO.
52
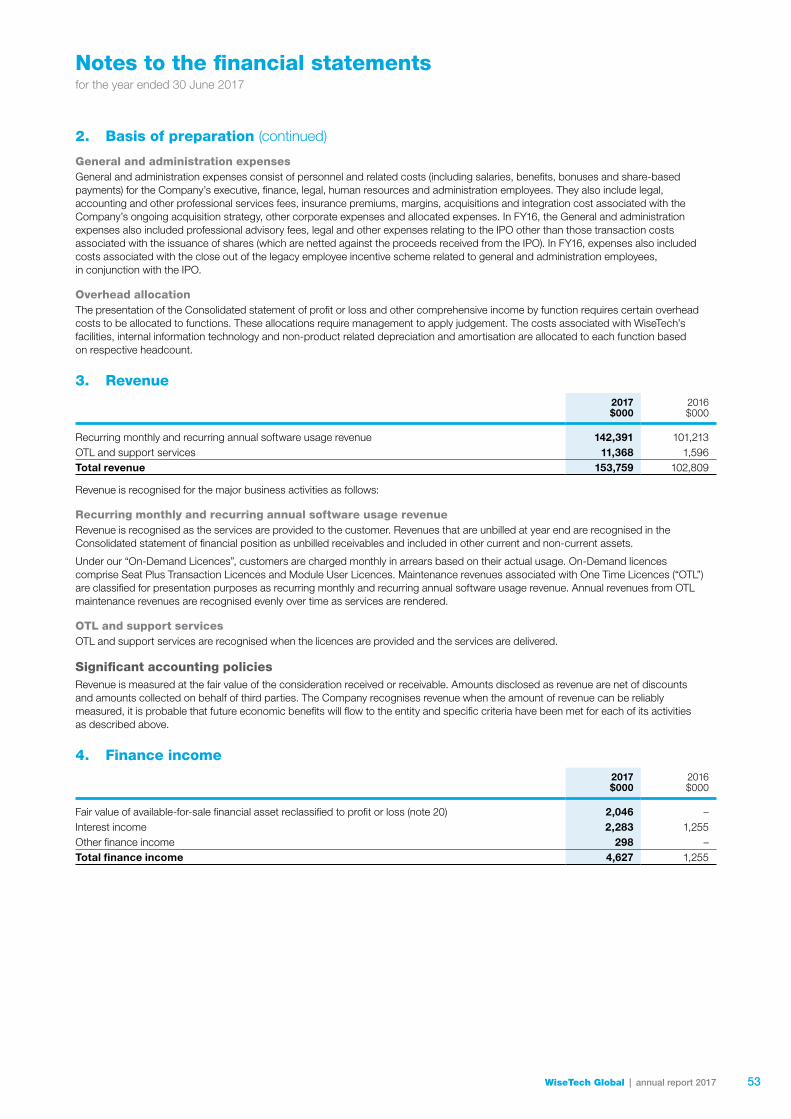
Notes to the financial statementsfor the year ended 30 June 2017
General and administration expensesGeneral and administration expenses consist of personnel and related costs (including salaries, benefits, bonuses and share-based payments) for the Company’s executive, finance, legal, human resources and administration employees. They also include legal, accounting and other professional services fees, insurance premiums, margins, acquisitions and integration cost associated with the Company’s ongoing acquisition strategy, other corporate expenses and allocated expenses. In FY16, the General and administration expenses also included professional advisory fees, legal and other expenses relating to the IPO other than those transaction costs associated with the issuance of shares (which are netted against the proceeds received from the IPO). In FY16, expenses also included costs associated with the close out of the legacy employee incentive scheme related to general and administration employees, in conjunction with the IPO.
Overhead allocationThe presentation of the Consolidated statement of profit or loss and other comprehensive income by function requires certain overhead costs to be allocated to functions. These allocations require management to apply judgement. The costs associated with WiseTech’s facilities, internal information technology and non-product related depreciation and amortisation are allocated to each function based on respective headcount.
3. Revenue
2017 $000
2016 $000
Recurring monthly and recurring annual software usage revenue 142,391 101,213OTL and support services 11,368 1,596Total revenue 153,759 102,809
Revenue is recognised for the major business activities as follows:
Recurring monthly and recurring annual software usage revenueRevenue is recognised as the services are provided to the customer. Revenues that are unbilled at year end are recognised in the Consolidated statement of financial position as unbilled receivables and included in other current and non-current assets.
Under our “On-Demand Licences”, customers are charged monthly in arrears based on their actual usage. On-Demand licences comprise Seat Plus Transaction Licences and Module User Licences. Maintenance revenues associated with One Time Licences (“OTL”) are classified for presentation purposes as recurring monthly and recurring annual software usage revenue. Annual revenues from OTL maintenance revenues are recognised evenly over time as services are rendered.
OTL and support servicesOTL and support services are recognised when the licences are provided and the services are delivered.
Significant accounting policiesRevenue is measured at the fair value of the consideration received or receivable. Amounts disclosed as revenue are net of discounts and amounts collected on behalf of third parties. The Company recognises revenue when the amount of revenue can be reliably measured, it is probable that future economic benefits will flow to the entity and specific criteria have been met for each of its activities as described above.
4. Finance income
2017 $000
2016 $000
Fair value of available-for-sale financial asset reclassified to profit or loss (note 20) 2,046 –Interest income 2,283 1,255Other finance income 298 –Total finance income 4,627 1,255
2. Basis of preparation (continued)
WiseTech Global | annual report 2017 53
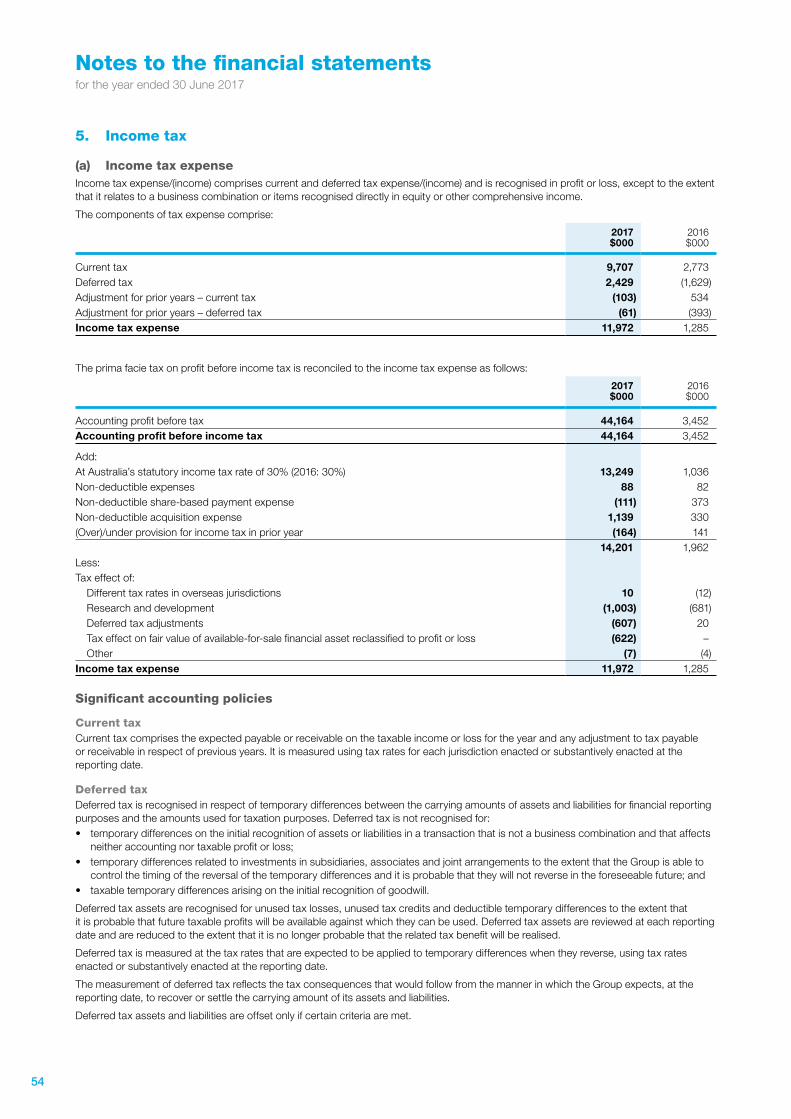
Notes to the financial statementsfor the year ended 30 June 2017
5. Income tax
(a) Income tax expenseIncome tax expense/(income) comprises current and deferred tax expense/(income) and is recognised in profit or loss, except to the extent that it relates to a business combination or items recognised directly in equity or other comprehensive income.
The components of tax expense comprise:
2017 $000
2016 $000
Current tax 9,707 2,773Deferred tax 2,429 (1,629)Adjustment for prior years – current tax (103) 534Adjustment for prior years – deferred tax (61) (393)Income tax expense 11,972 1,285
The prima facie tax on profit before income tax is reconciled to the income tax expense as follows:
2017 $000
2016 $000
Accounting profit before tax 44,164 3,452Accounting profit before income tax 44,164 3,452
Add:At Australia’s statutory income tax rate of 30% (2016: 30%) 13,249 1,036Non-deductible expenses 88 82Non-deductible share-based payment expense (111) 373Non-deductible acquisition expense 1,139 330(Over)/under provision for income tax in prior year (164) 141
14,201 1,962Less:Tax effect of:
Different tax rates in overseas jurisdictions 10 (12)Research and development (1,003) (681)Deferred tax adjustments (607) 20Tax effect on fair value of available-for-sale financial asset reclassified to profit or loss (622) –Other (7) (4)
Income tax expense 11,972 1,285
Significant accounting policies
Current taxCurrent tax comprises the expected payable or receivable on the taxable income or loss for the year and any adjustment to tax payable or receivable in respect of previous years. It is measured using tax rates for each jurisdiction enacted or substantively enacted at the reporting date.
Deferred taxDeferred tax is recognised in respect of temporary differences between the carrying amounts of assets and liabilities for financial reporting purposes and the amounts used for taxation purposes. Deferred tax is not recognised for:• temporary differences on the initial recognition of assets or liabilities in a transaction that is not a business combination and that affects
neither accounting nor taxable profit or loss;• temporary differences related to investments in subsidiaries, associates and joint arrangements to the extent that the Group is able to
control the timing of the reversal of the temporary differences and it is probable that they will not reverse in the foreseeable future; and• taxable temporary differences arising on the initial recognition of goodwill.
Deferred tax assets are recognised for unused tax losses, unused tax credits and deductible temporary differences to the extent that it is probable that future taxable profits will be available against which they can be used. Deferred tax assets are reviewed at each reporting date and are reduced to the extent that it is no longer probable that the related tax benefit will be realised.
Deferred tax is measured at the tax rates that are expected to be applied to temporary differences when they reverse, using tax rates enacted or substantively enacted at the reporting date.
The measurement of deferred tax reflects the tax consequences that would follow from the manner in which the Group expects, at the reporting date, to recover or settle the carrying amount of its assets and liabilities.
Deferred tax assets and liabilities are offset only if certain criteria are met.
54
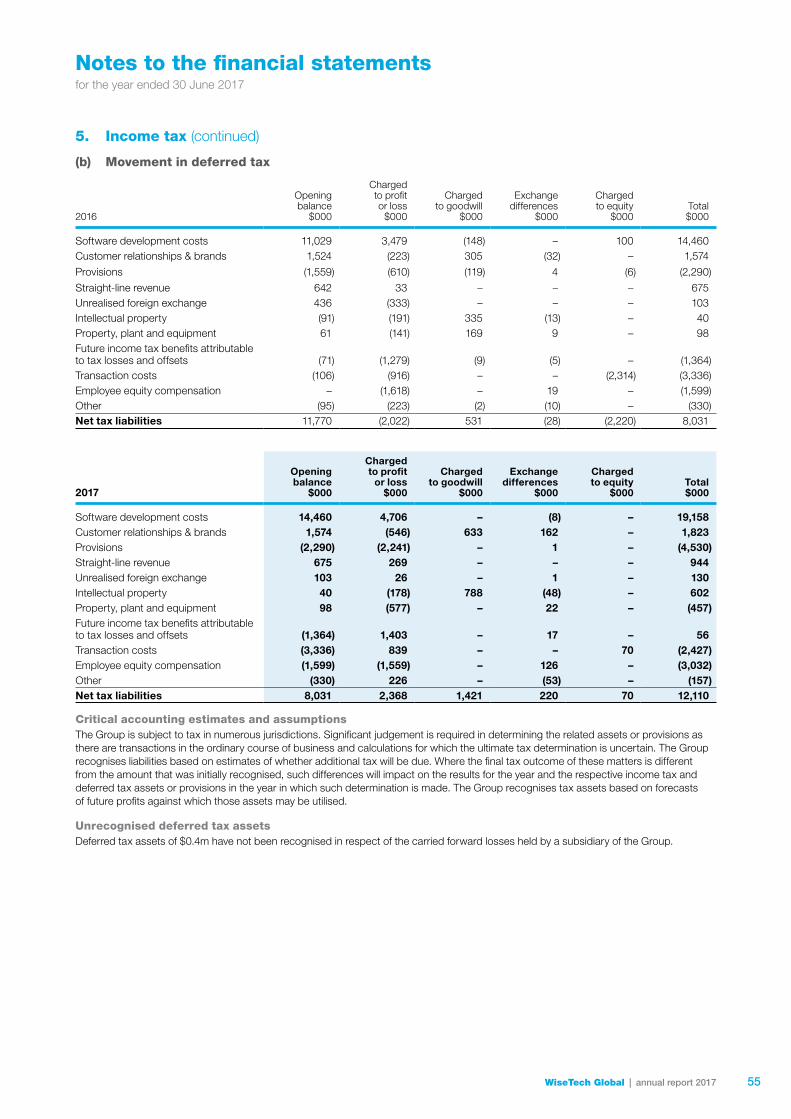
Notes to the financial statementsfor the year ended 30 June 2017
(b) Movement in deferred tax
2016
Opening balance
$000
Charged to profit or loss
$000
Charged to goodwill
$000
Exchange differences
$000
Charged to equity
$000Total$000
Software development costs 11,029 3,479 (148) – 100 14,460Customer relationships & brands 1,524 (223) 305 (32) – 1,574
Provisions (1,559) (610) (119) 4 (6) (2,290)
Straight-line revenue 642 33 – – – 675Unrealised foreign exchange 436 (333) – – – 103Intellectual property (91) (191) 335 (13) – 40Property, plant and equipment 61 (141) 169 9 – 98Future income tax benefits attributable to tax losses and offsets (71) (1,279) (9) (5) – (1,364)Transaction costs (106) (916) – – (2,314) (3,336)Employee equity compensation – (1,618) – 19 – (1,599)Other (95) (223) (2) (10) – (330)Net tax liabilities 11,770 (2,022) 531 (28) (2,220) 8,031
2017
Opening balance
$000
Charged to profit
or loss$000
Charged to goodwill
$000
Exchange differences
$000
Charged to equity
$000Total$000
Software development costs 14,460 4,706 – (8) – 19,158Customer relationships & brands 1,574 (546) 633 162 – 1,823Provisions (2,290) (2,241) – 1 – (4,530)Straight-line revenue 675 269 – – – 944Unrealised foreign exchange 103 26 – 1 – 130Intellectual property 40 (178) 788 (48) – 602Property, plant and equipment 98 (577) – 22 – (457)Future income tax benefits attributable to tax losses and offsets (1,364) 1,403 – 17 – 56Transaction costs (3,336) 839 – – 70 (2,427)Employee equity compensation (1,599) (1,559) – 126 – (3,032)Other (330) 226 – (53) – (157)Net tax liabilities 8,031 2,368 1,421 220 70 12,110
Critical accounting estimates and assumptionsThe Group is subject to tax in numerous jurisdictions. Significant judgement is required in determining the related assets or provisions as there are transactions in the ordinary course of business and calculations for which the ultimate tax determination is uncertain. The Group recognises liabilities based on estimates of whether additional tax will be due. Where the final tax outcome of these matters is different from the amount that was initially recognised, such differences will impact on the results for the year and the respective income tax and deferred tax assets or provisions in the year in which such determination is made. The Group recognises tax assets based on forecasts of future profits against which those assets may be utilised.
Unrecognised deferred tax assetsDeferred tax assets of $0.4m have not been recognised in respect of the carried forward losses held by a subsidiary of the Group.
5. Income tax (continued)
WiseTech Global | annual report 2017 55
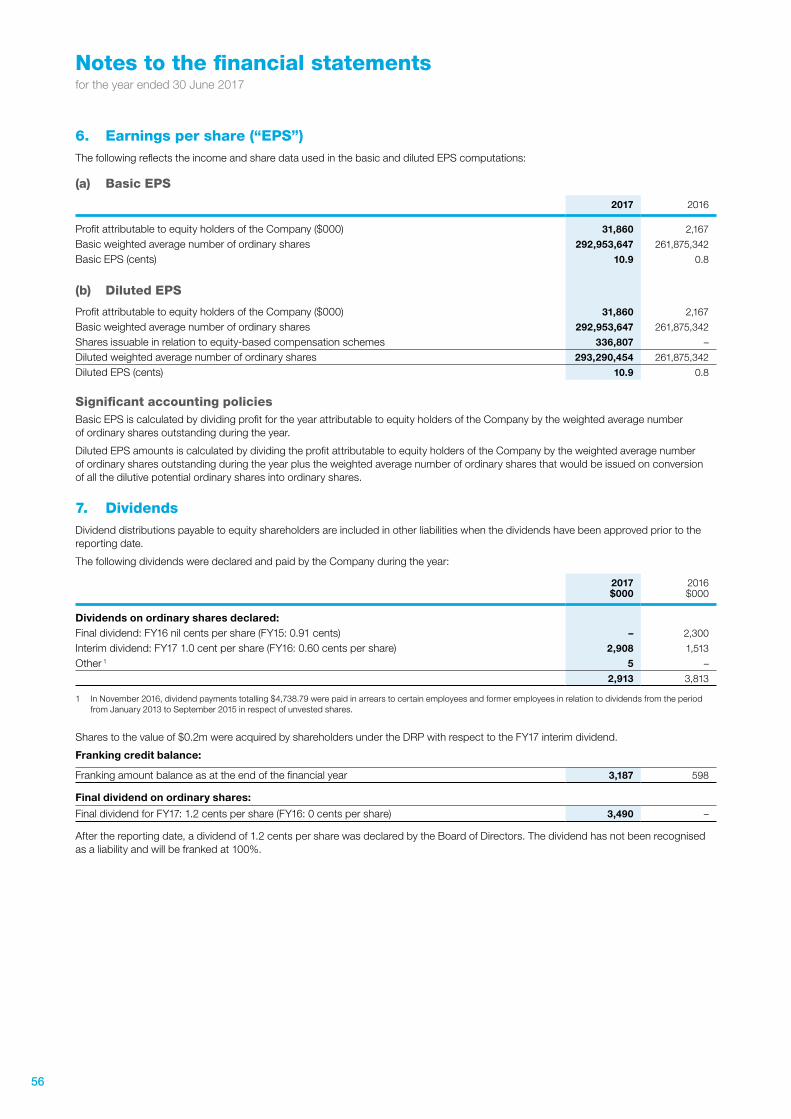
Notes to the financial statementsfor the year ended 30 June 2017
6. Earnings per share (“EPS”)The following reflects the income and share data used in the basic and diluted EPS computations:
(a) Basic EPS
2017 2016
Profit attributable to equity holders of the Company ($000) 31,860 2,167
Basic weighted average number of ordinary shares 292,953,647 261,875,342
Basic EPS (cents) 10.9 0.8
(b) Diluted EPS
Profit attributable to equity holders of the Company ($000) 31,860 2,167
Basic weighted average number of ordinary shares 292,953,647 261,875,342
Shares issuable in relation to equity-based compensation schemes 336,807 –
Diluted weighted average number of ordinary shares 293,290,454 261,875,342
Diluted EPS (cents) 10.9 0.8
Significant accounting policiesBasic EPS is calculated by dividing profit for the year attributable to equity holders of the Company by the weighted average number of ordinary shares outstanding during the year.
Diluted EPS amounts is calculated by dividing the profit attributable to equity holders of the Company by the weighted average number of ordinary shares outstanding during the year plus the weighted average number of ordinary shares that would be issued on conversion of all the dilutive potential ordinary shares into ordinary shares.
7. DividendsDividend distributions payable to equity shareholders are included in other liabilities when the dividends have been approved prior to the reporting date.
The following dividends were declared and paid by the Company during the year:
2017 $000
2016 $000
Dividends on ordinary shares declared:Final dividend: FY16 nil cents per share (FY15: 0.91 cents) – 2,300
Interim dividend: FY17 1.0 cent per share (FY16: 0.60 cents per share) 2,908 1,513
Other 1 5 –
2,913 3,813
1 In November 2016, dividend payments totalling $4,738.79 were paid in arrears to certain employees and former employees in relation to dividends from the period from January 2013 to September 2015 in respect of unvested shares.
Shares to the value of $0.2m were acquired by shareholders under the DRP with respect to the FY17 interim dividend.
Franking credit balance:
Franking amount balance as at the end of the financial year 3,187 598
Final dividend on ordinary shares:
Final dividend for FY17: 1.2 cents per share (FY16: 0 cents per share) 3,490 –
After the reporting date, a dividend of 1.2 cents per share was declared by the Board of Directors. The dividend has not been recognised as a liability and will be franked at 100%.
56

Notes to the financial statementsfor the year ended 30 June 2017
8. Intangible assets
Computersoftware
$000
Develop-mentcosts (WIP)$000
External softwarelicences
$000Goodwill
$000
Intellec-tual
property$000
Customerrelation-
ships$000
Tradenames
$000Patents
$000Total$000
At 30 June 2015Cost 30,051 15,058 1,583 20,302 8,848 6,707 – – 82,549Accumulated amortisation and impairment (8,345) – (119) (63) (6,497) (1,523) – – (16,547)Net book value 21,706 15,058 1,464 20,239 2,351 5,184 – – 66,002
At 1 July 2015 21,706 15,058 1,464 20,239 2,351 5,184 – – 66,002Additions – 15,960 1,674 – – – – 104 17,738Transfers 8,796 (8,796) – – – – – – –Amortisation (4,405) – (383) – (916) (899) (63) – (6,666)Acquisition via business combination – – – 20,983 1,025 1,337 647 – 23,992Exchange differences – – – (3,541) (315) (261) (97) – (4,214)Net book value at 30 June 2016 26,097 22,222 2,755 37,681 2,145 5,361 487 104 96,852
At 30 June 2016Cost 38,847 22,222 3,257 37,744 9,558 7,783 550 104 120,065Accumulated amortisation and impairment (12,750) – (502) (63) (7,413) (2,422) (63) – (23,213)Net book value 26,097 22,222 2,755 37,681 2,145 5,361 487 104 96,852At 1 July 2016 26,097 22,222 2,755 37,681 2,145 5,361 487 104 96,852Additions – 21,266 658 – – – – 83 22,007Transfers 11,869 (11,869) 120 – (120) – – – –Reclassification – – (595) – – – – – (595)Amortisation (4,893) – (774) – (1,153) (914) (116) – (7,850)Acquisition via business combination – – 612 14,614 2,638 1,292 839 – 19,995Exchange differences – 137 (162) 3,002 51 236 47 – 3,311Net book value at 30 June 2017 33,073 31,756 2,614 55,297 3,561 5,975 1,257 187 133,720
At 30 June 2017Cost 50,752 31,756 4,038 55,360 12,204 9,235 1,429 187 164,961Accumulated amortisation and impairment (17,679) – (1,424) (63) (8,643) (3,260) (172) – (31,241)Net book value 33,073 31,756 2,614 55,297 3,561 5,975 1,257 187 133,720
WiseTech Global | annual report 2017 57
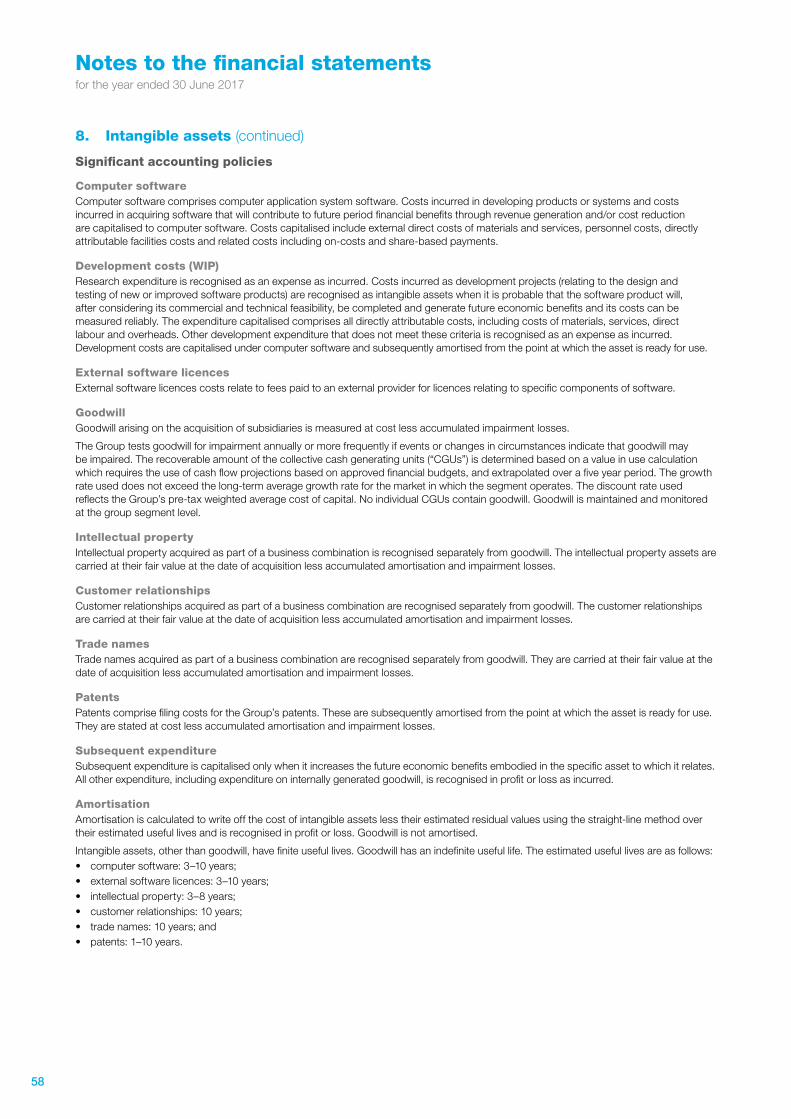
Notes to the financial statementsfor the year ended 30 June 2017
Significant accounting policies
Computer softwareComputer software comprises computer application system software. Costs incurred in developing products or systems and costs incurred in acquiring software that will contribute to future period financial benefits through revenue generation and/or cost reduction are capitalised to computer software. Costs capitalised include external direct costs of materials and services, personnel costs, directly attributable facilities costs and related costs including on-costs and share-based payments.
Development costs (WIP)Research expenditure is recognised as an expense as incurred. Costs incurred as development projects (relating to the design and testing of new or improved software products) are recognised as intangible assets when it is probable that the software product will, after considering its commercial and technical feasibility, be completed and generate future economic benefits and its costs can be measured reliably. The expenditure capitalised comprises all directly attributable costs, including costs of materials, services, direct labour and overheads. Other development expenditure that does not meet these criteria is recognised as an expense as incurred. Development costs are capitalised under computer software and subsequently amortised from the point at which the asset is ready for use.
External software licencesExternal software licences costs relate to fees paid to an external provider for licences relating to specific components of software.
GoodwillGoodwill arising on the acquisition of subsidiaries is measured at cost less accumulated impairment losses.
The Group tests goodwill for impairment annually or more frequently if events or changes in circumstances indicate that goodwill may be impaired. The recoverable amount of the collective cash generating units (“CGUs”) is determined based on a value in use calculation which requires the use of cash flow projections based on approved financial budgets, and extrapolated over a five year period. The growth rate used does not exceed the long-term average growth rate for the market in which the segment operates. The discount rate used reflects the Group’s pre-tax weighted average cost of capital. No individual CGUs contain goodwill. Goodwill is maintained and monitored at the group segment level.
Intellectual propertyIntellectual property acquired as part of a business combination is recognised separately from goodwill. The intellectual property assets are carried at their fair value at the date of acquisition less accumulated amortisation and impairment losses.
Customer relationshipsCustomer relationships acquired as part of a business combination are recognised separately from goodwill. The customer relationships are carried at their fair value at the date of acquisition less accumulated amortisation and impairment losses.
Trade namesTrade names acquired as part of a business combination are recognised separately from goodwill. They are carried at their fair value at the date of acquisition less accumulated amortisation and impairment losses.
PatentsPatents comprise filing costs for the Group’s patents. These are subsequently amortised from the point at which the asset is ready for use. They are stated at cost less accumulated amortisation and impairment losses.
Subsequent expenditureSubsequent expenditure is capitalised only when it increases the future economic benefits embodied in the specific asset to which it relates. All other expenditure, including expenditure on internally generated goodwill, is recognised in profit or loss as incurred.
AmortisationAmortisation is calculated to write off the cost of intangible assets less their estimated residual values using the straight-line method over their estimated useful lives and is recognised in profit or loss. Goodwill is not amortised.
Intangible assets, other than goodwill, have finite useful lives. Goodwill has an indefinite useful life. The estimated useful lives are as follows:• computer software: 3–10 years;• external software licences: 3–10 years;• intellectual property: 3–8 years;• customer relationships: 10 years;• trade names: 10 years; and• patents: 1–10 years.
8. Intangible assets (continued)
58
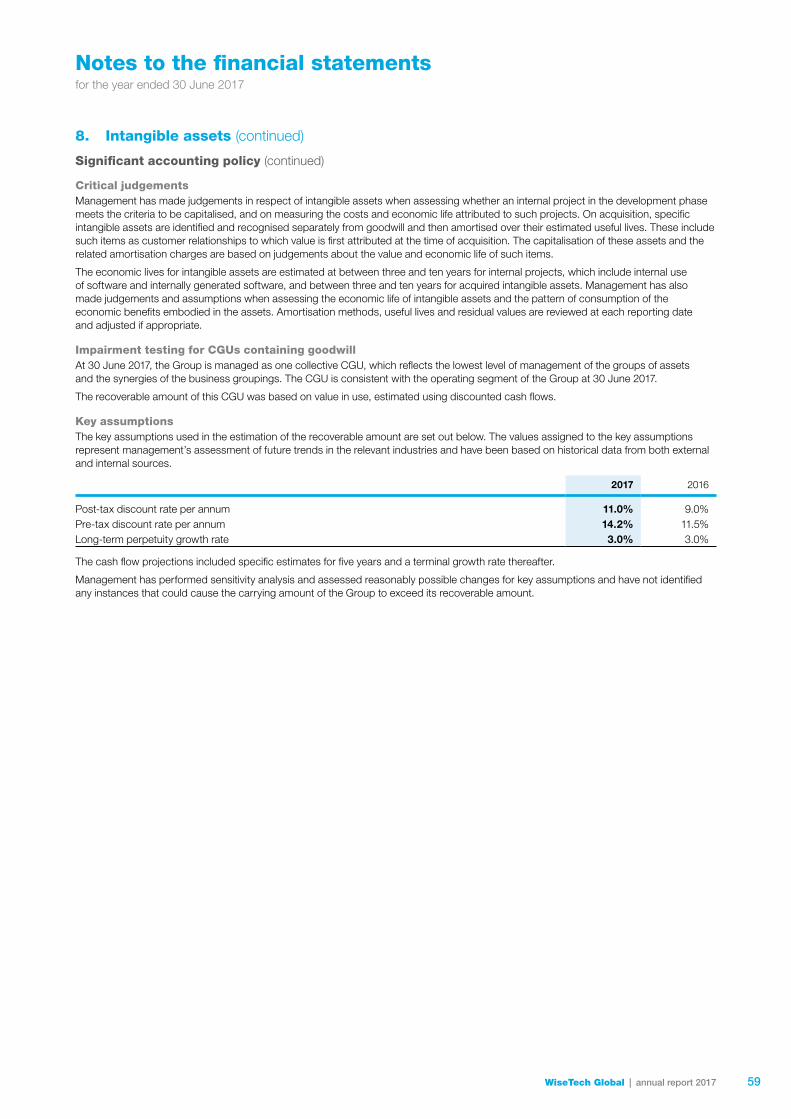
Notes to the financial statementsfor the year ended 30 June 2017
Critical judgementsManagement has made judgements in respect of intangible assets when assessing whether an internal project in the development phase meets the criteria to be capitalised, and on measuring the costs and economic life attributed to such projects. On acquisition, specific intangible assets are identified and recognised separately from goodwill and then amortised over their estimated useful lives. These include such items as customer relationships to which value is first attributed at the time of acquisition. The capitalisation of these assets and the related amortisation charges are based on judgements about the value and economic life of such items.
The economic lives for intangible assets are estimated at between three and ten years for internal projects, which include internal use of software and internally generated software, and between three and ten years for acquired intangible assets. Management has also made judgements and assumptions when assessing the economic life of intangible assets and the pattern of consumption of the economic benefits embodied in the assets. Amortisation methods, useful lives and residual values are reviewed at each reporting date and adjusted if appropriate.
Impairment testing for CGUs containing goodwillAt 30 June 2017, the Group is managed as one collective CGU, which reflects the lowest level of management of the groups of assets and the synergies of the business groupings. The CGU is consistent with the operating segment of the Group at 30 June 2017.
The recoverable amount of this CGU was based on value in use, estimated using discounted cash flows.
Key assumptionsThe key assumptions used in the estimation of the recoverable amount are set out below. The values assigned to the key assumptions represent management’s assessment of future trends in the relevant industries and have been based on historical data from both external and internal sources.
2017 2016
Post-tax discount rate per annum 11.0% 9.0%Pre-tax discount rate per annum 14.2% 11.5%Long-term perpetuity growth rate 3.0% 3.0%
The cash flow projections included specific estimates for five years and a terminal growth rate thereafter.
Management has performed sensitivity analysis and assessed reasonably possible changes for key assumptions and have not identified any instances that could cause the carrying amount of the Group to exceed its recoverable amount.
8. Intangible assets (continued)
Significant accounting policy (continued)
WiseTech Global | annual report 2017 59
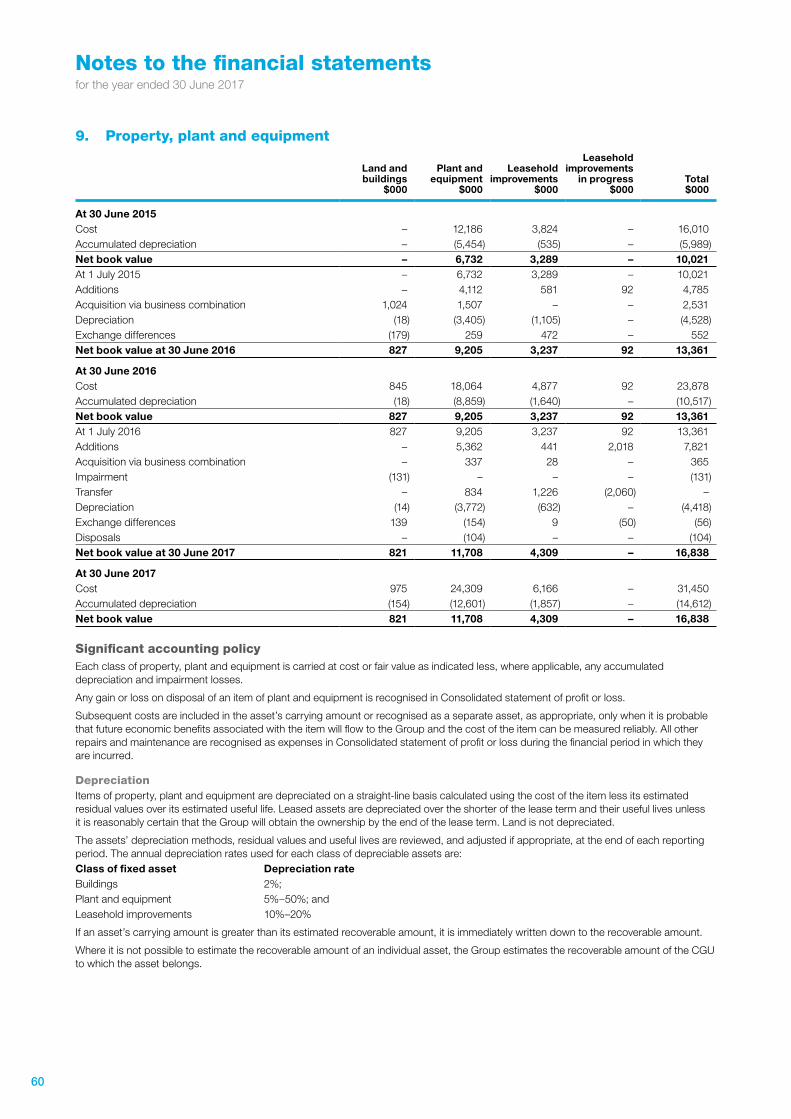
Notes to the financial statementsfor the year ended 30 June 2017
9. Property, plant and equipment
Land and buildings
$000
Plant and equipment
$000
Leasehold improvements
$000
Leasehold improvements
in progress $000
Total $000
At 30 June 2015Cost – 12,186 3,824 – 16,010Accumulated depreciation – (5,454) (535) – (5,989)Net book value – 6,732 3,289 – 10,021At 1 July 2015 – 6,732 3,289 – 10,021Additions – 4,112 581 92 4,785Acquisition via business combination 1,024 1,507 – – 2,531Depreciation (18) (3,405) (1,105) – (4,528)Exchange differences (179) 259 472 – 552Net book value at 30 June 2016 827 9,205 3,237 92 13,361
At 30 June 2016Cost 845 18,064 4,877 92 23,878Accumulated depreciation (18) (8,859) (1,640) – (10,517)Net book value 827 9,205 3,237 92 13,361At 1 July 2016 827 9,205 3,237 92 13,361Additions – 5,362 441 2,018 7,821Acquisition via business combination – 337 28 – 365Impairment (131) – – – (131)Transfer – 834 1,226 (2,060) –Depreciation (14) (3,772) (632) – (4,418)Exchange differences 139 (154) 9 (50) (56)Disposals – (104) – – (104)Net book value at 30 June 2017 821 11,708 4,309 – 16,838
At 30 June 2017Cost 975 24,309 6,166 – 31,450Accumulated depreciation (154) (12,601) (1,857) – (14,612)Net book value 821 11,708 4,309 – 16,838
Significant accounting policyEach class of property, plant and equipment is carried at cost or fair value as indicated less, where applicable, any accumulated depreciation and impairment losses.
Any gain or loss on disposal of an item of plant and equipment is recognised in Consolidated statement of profit or loss.
Subsequent costs are included in the asset’s carrying amount or recognised as a separate asset, as appropriate, only when it is probable that future economic benefits associated with the item will flow to the Group and the cost of the item can be measured reliably. All other repairs and maintenance are recognised as expenses in Consolidated statement of profit or loss during the financial period in which they are incurred.
DepreciationItems of property, plant and equipment are depreciated on a straight-line basis calculated using the cost of the item less its estimated residual values over its estimated useful life. Leased assets are depreciated over the shorter of the lease term and their useful lives unless it is reasonably certain that the Group will obtain the ownership by the end of the lease term. Land is not depreciated.
The assets’ depreciation methods, residual values and useful lives are reviewed, and adjusted if appropriate, at the end of each reporting period. The annual depreciation rates used for each class of depreciable assets are:Class of fixed asset Depreciation rateBuildings 2%;Plant and equipment 5%–50%; and Leasehold improvements 10%–20%
If an asset’s carrying amount is greater than its estimated recoverable amount, it is immediately written down to the recoverable amount.
Where it is not possible to estimate the recoverable amount of an individual asset, the Group estimates the recoverable amount of the CGU to which the asset belongs.
60

Notes to the financial statementsfor the year ended 30 June 2017
10. Cash and cash equivalents2017 $000
2016 $000
Cash at bank and on hand 16,603 19,483Short-term deposits 85,000 90,044Cash and cash equivalents 101,603 109,527
The effective interest rate on cash and cash equivalents was 2.24% per annum (2016: 1.36% per annum).
Significant accounting policiesCash comprises cash on hand and demand deposits. Cash equivalents are short-term, highly liquid investments that are readily convertible to known amounts of cash and which are subject to an insignificant risk of changes in value.
11. Trade receivables2017 $000
2016 $000
Trade receivables 14,282 12,576Provision for impairment of receivables (455) (474)
13,827 12,102
The carrying value of trade receivables is considered a reasonable approximation of fair value due to the short-term nature of the balances.
The movement in the provision for impairment of trade receivables during the year was as follows:
2017 $000
2016 $000
Opening balance 474 391Acquired from subsidiary 185 –Impairment loss recognised 252 342Amount written off (456) (259)
455 474
Trade receivables that were considered recoverable as at 30 June 2017 were as follows:
2017 $000
2016 $000
Not past due 12,672 9,402Past due 0–30 days 357 1,719Past due 31–60 days 534 464Past due more than 60 days 264 517
13,827 12,102
Significant accounting policiesTrade receivables include amounts due from customers for services performed in the ordinary course of business. Trade receivables expected to be collected within 12 months of the end of the reporting period are classified as current assets. Other trade receivables are classified as non-current assets.
Trade receivables are initially recognised at fair value less any provision for impairment. The Group does not hold any collateral as security over any trade receivable balances.
A provision for impairment of trade receivables is established when there is objective evidence that the Group will not be able to collect all amounts due according to the original terms of the receivables.
WiseTech Global | annual report 2017 61
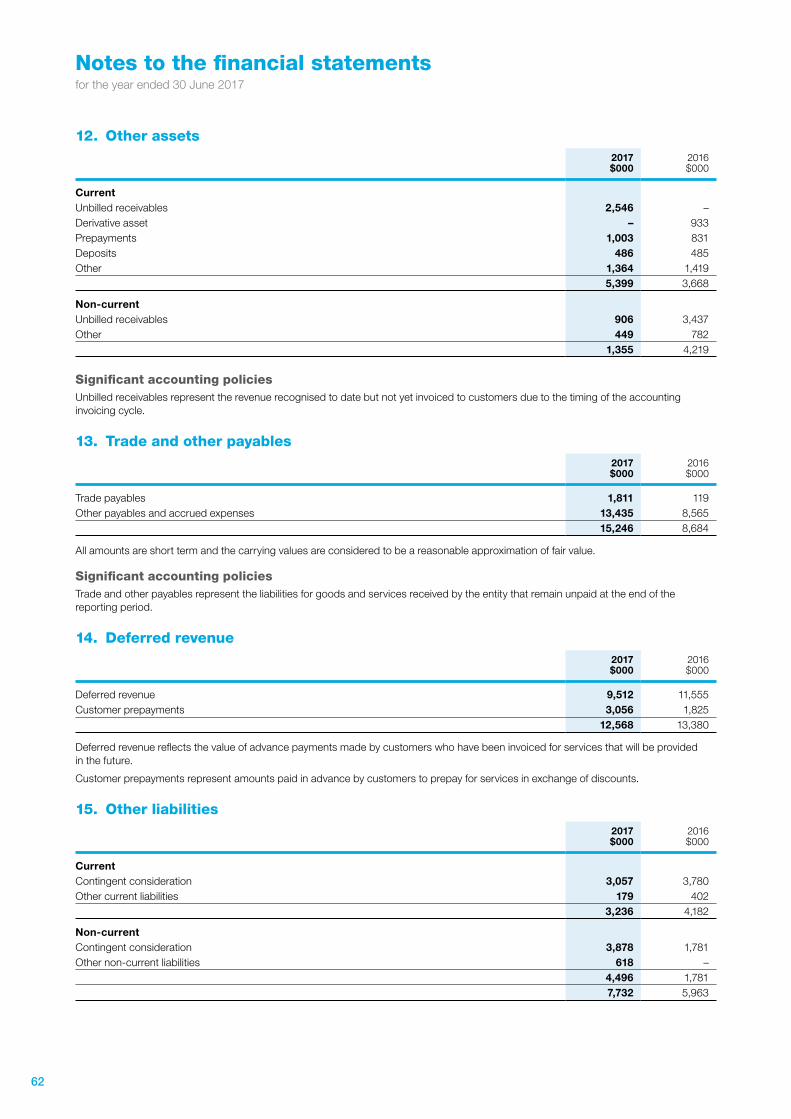
Notes to the financial statementsfor the year ended 30 June 2017
12. Other assets2017 $000
2016 $000
CurrentUnbilled receivables 2,546 –Derivative asset – 933Prepayments 1,003 831Deposits 486 485Other 1,364 1,419
5,399 3,668
Non-currentUnbilled receivables 906 3,437Other 449 782
1,355 4,219
Significant accounting policiesUnbilled receivables represent the revenue recognised to date but not yet invoiced to customers due to the timing of the accounting invoicing cycle.
13. Trade and other payables2017 $000
2016 $000
Trade payables 1,811 119Other payables and accrued expenses 13,435 8,565
15,246 8,684
All amounts are short term and the carrying values are considered to be a reasonable approximation of fair value.
Significant accounting policiesTrade and other payables represent the liabilities for goods and services received by the entity that remain unpaid at the end of the reporting period.
14. Deferred revenue2017 $000
2016 $000
Deferred revenue 9,512 11,555Customer prepayments 3,056 1,825
12,568 13,380
Deferred revenue reflects the value of advance payments made by customers who have been invoiced for services that will be provided in the future.
Customer prepayments represent amounts paid in advance by customers to prepay for services in exchange of discounts.
15. Other liabilities2017 $000
2016 $000
CurrentContingent consideration 3,057 3,780Other current liabilities 179 402
3,236 4,182
Non-currentContingent consideration 3,878 1,781Other non-current liabilities 618 –
4,496 1,7817,732 5,963
62
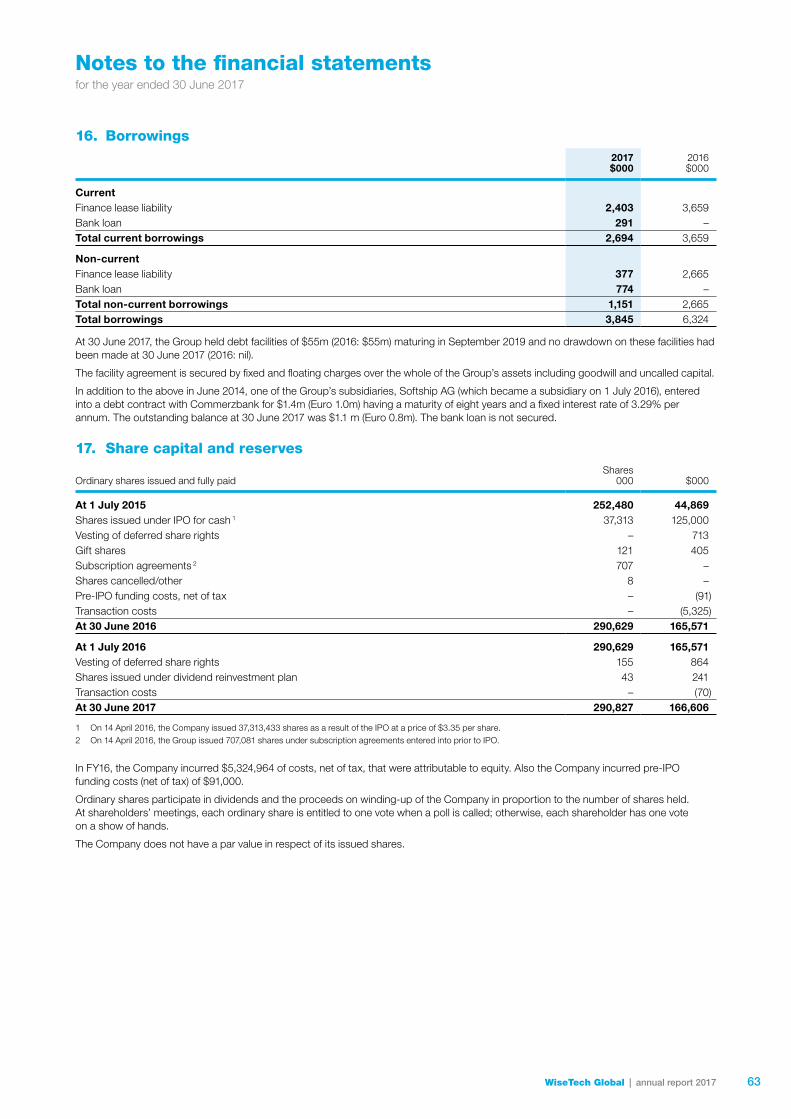
Notes to the financial statementsfor the year ended 30 June 2017
16. Borrowings2017 $000
2016 $000
CurrentFinance lease liability 2,403 3,659Bank loan 291 –Total current borrowings 2,694 3,659
Non-currentFinance lease liability 377 2,665Bank loan 774 –Total non-current borrowings 1,151 2,665Total borrowings 3,845 6,324
At 30 June 2017, the Group held debt facilities of $55m (2016: $55m) maturing in September 2019 and no drawdown on these facilities had been made at 30 June 2017 (2016: nil).
The facility agreement is secured by fixed and floating charges over the whole of the Group’s assets including goodwill and uncalled capital.
In addition to the above in June 2014, one of the Group’s subsidiaries, Softship AG (which became a subsidiary on 1 July 2016), entered into a debt contract with Commerzbank for $1.4m (Euro 1.0m) having a maturity of eight years and a fixed interest rate of 3.29% per annum. The outstanding balance at 30 June 2017 was $1.1 m (Euro 0.8m). The bank loan is not secured.
17. Share capital and reserves
Ordinary shares issued and fully paidShares
000 $000
At 1 July 2015 252,480 44,869Shares issued under IPO for cash 1 37,313 125,000Vesting of deferred share rights – 713Gift shares 121 405Subscription agreements 2 707 –Shares cancelled/other 8 –Pre-IPO funding costs, net of tax – (91)Transaction costs – (5,325)At 30 June 2016 290,629 165,571
At 1 July 2016 290,629 165,571Vesting of deferred share rights 155 864Shares issued under dividend reinvestment plan 43 241Transaction costs – (70)At 30 June 2017 290,827 166,606
1 On 14 April 2016, the Company issued 37,313,433 shares as a result of the IPO at a price of $3.35 per share.2 On 14 April 2016, the Group issued 707,081 shares under subscription agreements entered into prior to IPO.
In FY16, the Company incurred $5,324,964 of costs, net of tax, that were attributable to equity. Also the Company incurred pre-IPO funding costs (net of tax) of $91,000.
Ordinary shares participate in dividends and the proceeds on winding-up of the Company in proportion to the number of shares held. At shareholders’ meetings, each ordinary share is entitled to one vote when a poll is called; otherwise, each shareholder has one vote on a show of hands.
The Company does not have a par value in respect of its issued shares.
WiseTech Global | annual report 2017 63

Notes to the financial statementsfor the year ended 30 June 2017
Nature and purpose of reserves
(i) Treasury share reserveThe reserve for the Company’s treasury shares comprises the cost of the Company’s shares held by the WiseTech Global Limited Employee Share Trust. At 30 June 2017, the Group held 940,466 of the Company’s shares.
(ii) Acquisition reserveThe acquisition reserve arises on the acquisition of additional shares in a subsidiary. The difference between the consideration paid and fair value of the identifiable net assets of the non-controlling interests has been accounted for in the acquisition reserve.
(iii) Fair value reserveThe fair value reserve comprises the cumulative net change of fair value of available-for-sale financial assets until the assets are derecognised or impaired.
(iv) Share-based payment reserveThe share-based payment reserve represents the value of unvested shares and unissued shares as part of the share-based payment scheme. As the shares vest to employees, they are transferred to share capital.
(v) Foreign currency translation reserveThe foreign currency translation reserve comprises all foreign currency differences arising from the translation of the financial statements of foreign operations.
Capital managementManagement controls the capital of the Group in order to maintain a sustainable debt to equity ratio, generate long-term shareholder value and ensure that the Group can fund its operations and continue as a going concern. The Group’s capital and debt include ordinary share capital and financial liabilities, supported by financial assets.
Management effectively manages the Group’s capital by assessing the Group’s financial risks and adjusting its capital structure in response to changes in these risks and in the market. These responses include the management of debt levels, distributions to shareholders and share issues.
At 30 June 2017, the Group has a undrawn facility of $55m to apply towards future strategic initiatives. The total equity of the Group for FY17 is $213.8m (2016: $196.1m) and total cash and cash equivalents for FY17 are $101.6m (2016: $109.5m). The total borrowings for FY17 are $3.8m (2016: $6.3m).
The Group is not subject to any externally imposed capital requirements.
17. Share capital and reserves (continued)
64
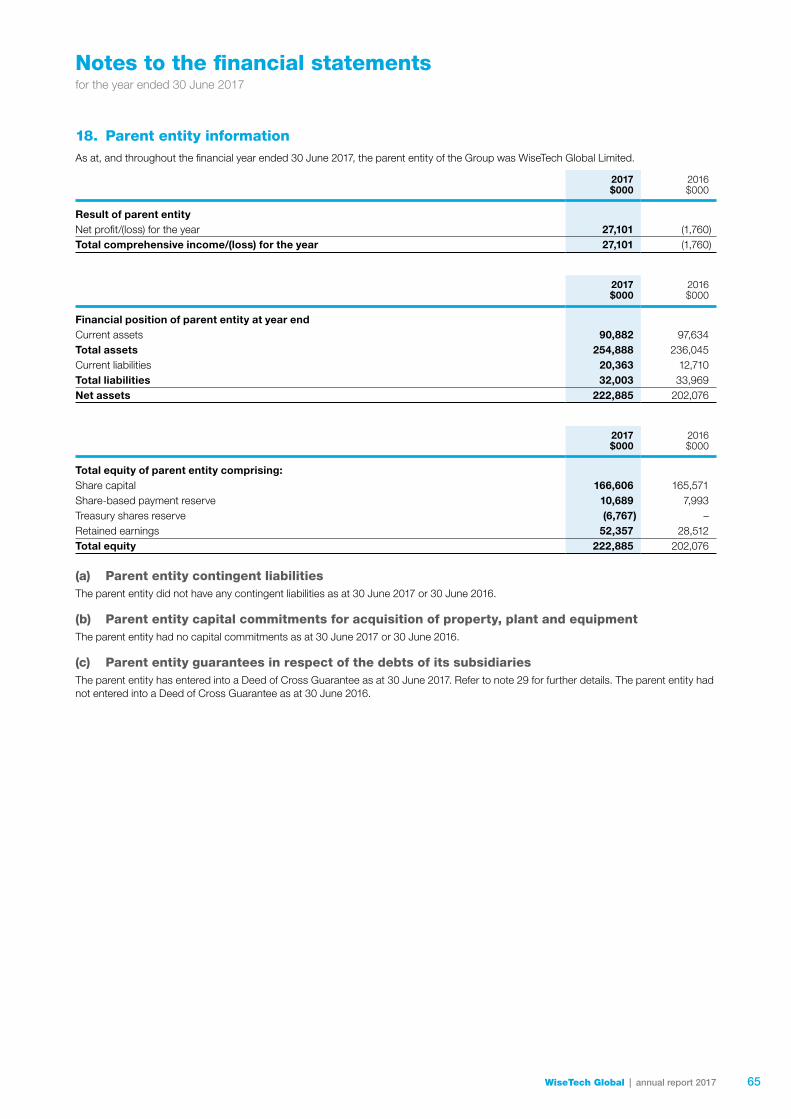
Notes to the financial statementsfor the year ended 30 June 2017
18. Parent entity informationAs at, and throughout the financial year ended 30 June 2017, the parent entity of the Group was WiseTech Global Limited.
2017 $000
2016 $000
Result of parent entityNet profit/(loss) for the year 27,101 (1,760)Total comprehensive income/(loss) for the year 27,101 (1,760)
2017 $000
2016 $000
Financial position of parent entity at year endCurrent assets 90,882 97,634Total assets 254,888 236,045Current liabilities 20,363 12,710Total liabilities 32,003 33,969Net assets 222,885 202,076
2017 $000
2016 $000
Total equity of parent entity comprising:Share capital 166,606 165,571Share-based payment reserve 10,689 7,993Treasury shares reserve (6,767) –Retained earnings 52,357 28,512Total equity 222,885 202,076
(a) Parent entity contingent liabilitiesThe parent entity did not have any contingent liabilities as at 30 June 2017 or 30 June 2016.
(b) Parent entity capital commitments for acquisition of property, plant and equipmentThe parent entity had no capital commitments as at 30 June 2017 or 30 June 2016.
(c) Parent entity guarantees in respect of the debts of its subsidiariesThe parent entity has entered into a Deed of Cross Guarantee as at 30 June 2017. Refer to note 29 for further details. The parent entity had not entered into a Deed of Cross Guarantee as at 30 June 2016.
WiseTech Global | annual report 2017 65
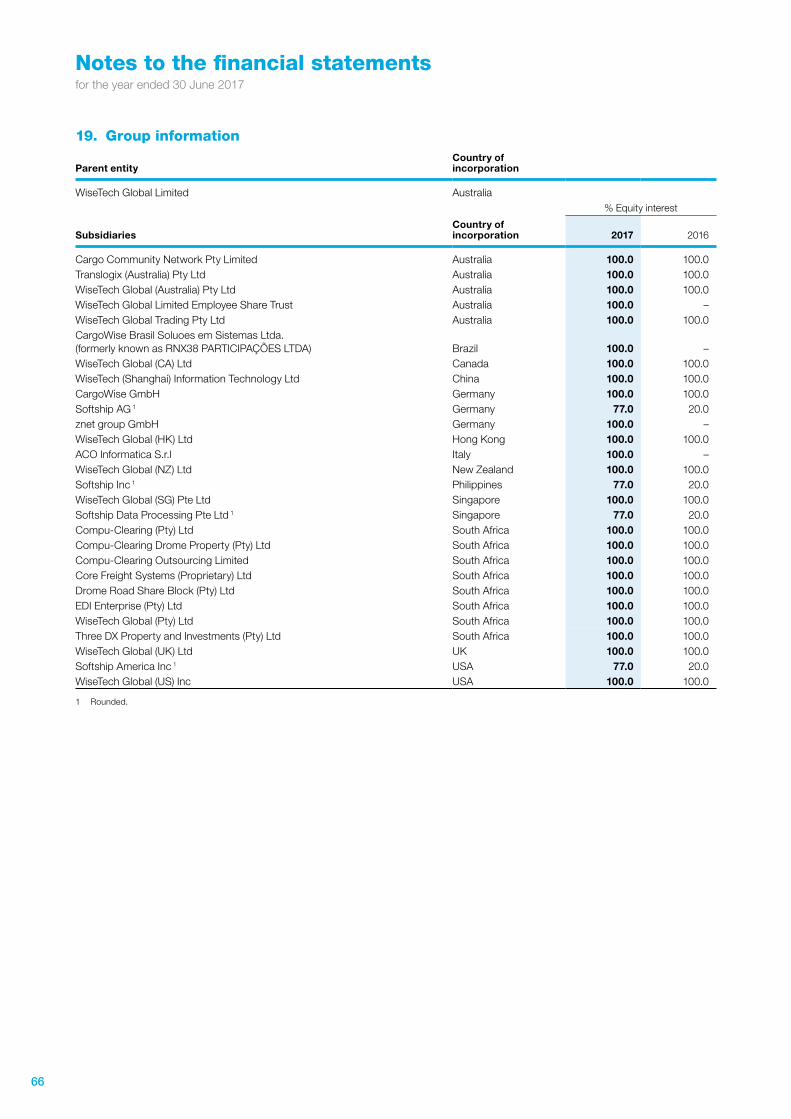
Notes to the financial statementsfor the year ended 30 June 2017
19. Group information
Parent entityCountry of incorporation
WiseTech Global Limited Australia% Equity interest
SubsidiariesCountry of incorporation 2017 2016
Cargo Community Network Pty Limited Australia 100.0 100.0Translogix (Australia) Pty Ltd Australia 100.0 100.0WiseTech Global (Australia) Pty Ltd Australia 100.0 100.0WiseTech Global Limited Employee Share Trust Australia 100.0 –WiseTech Global Trading Pty Ltd Australia 100.0 100.0CargoWise Brasil Soluoes em Sistemas Ltda. (formerly known as RNX38 PARTICIPAÇÕES LTDA) Brazil 100.0 –WiseTech Global (CA) Ltd Canada 100.0 100.0WiseTech (Shanghai) Information Technology Ltd China 100.0 100.0CargoWise GmbH Germany 100.0 100.0Softship AG 1 Germany 77.0 20.0znet group GmbH Germany 100.0 –WiseTech Global (HK) Ltd Hong Kong 100.0 100.0ACO Informatica S.r.l Italy 100.0 –WiseTech Global (NZ) Ltd New Zealand 100.0 100.0Softship Inc 1 Philippines 77.0 20.0WiseTech Global (SG) Pte Ltd Singapore 100.0 100.0Softship Data Processing Pte Ltd 1 Singapore 77.0 20.0Compu-Clearing (Pty) Ltd South Africa 100.0 100.0Compu-Clearing Drome Property (Pty) Ltd South Africa 100.0 100.0Compu-Clearing Outsourcing Limited South Africa 100.0 100.0Core Freight Systems (Proprietary) Ltd South Africa 100.0 100.0Drome Road Share Block (Pty) Ltd South Africa 100.0 100.0EDI Enterprise (Pty) Ltd South Africa 100.0 100.0WiseTech Global (Pty) Ltd South Africa 100.0 100.0Three DX Property and Investments (Pty) Ltd South Africa 100.0 100.0WiseTech Global (UK) Ltd UK 100.0 100.0Softship America Inc 1 USA 77.0 20.0WiseTech Global (US) Inc USA 100.0 100.0
1 Rounded.
66

Notes to the financial statementsfor the year ended 30 June 2017
20. Business combinations and acquisition of non-controlling interests
Acquisitions in 2017During the year, the Group acquired Softship AG (“Softship”), znet group GmbH (“znet”) and ACO Informatica S.r.l (“ACO”). Key information on the acquisitions is summarised in table below:
Softship $000
Other acquisitions 1
$000
Cash and cash equivalents 3,864 210
Trade receivables 2,246 668
Current tax receivables 9 35
Other current assets 552 568
Property, plant and equipment 268 97
Intangible assets 3,897 1,484
Equity-accounted investees 250 –
Deferred tax assets – 30
Other non-current assets 306 –
Trade and other payables (1,315) (454)
Borrowings (1,300) (107)
Deferred revenue (122) (1,106)
Current tax liabilities (1) (11)
Employee benefits (18) (160)
Other current liabilities (306) (95)
Deferred tax liabilities (1,110) (337)
Other non-current liabilities (306) (12)
Fair value of net assets acquired (100%) 6,914 810
Acquisition related costs 567 948
1 Provisional details of the fair value of the net identifiable assets acquired and liabilities assumed at the date of acquisition.
Softship AGSoftship is a leading provider of logistics software solutions to the global ocean-carrier industry.
On 1 July 2016, the Group acquired a controlling interest in Softship by increasing its ownership from 19.99% to 42.84% of shares on issue. From 1 July 2016, as a result of acquiring a controlling interest, the accounting for the available-for-sale investment at fair value through other comprehensive income no longer applies and Softship forms part of the consolidated financial statements of the Group.
The fair value of Group’s purchase consideration for 42.84% share in Softship was $7.9m which was paid in the form of cash, of which $2.6m was paid in FY16.
In the 12 months ended 30 June 2017, Softship contributed revenue of $14.1m and net profit after tax of $0.4m (after share of profit of non-controlling interest).
A valuation was undertaken by Ernst & Young, Germany, in relation to the acquired intangibles with respect to customer relationships ($0.7m), trade name ($0.8m) and intellectual property ($2.0m).
The methodology used to derive the value of customer relationships was the multi-period excess earnings method (“MEEM”). The MEEM considers the present value of net cash flows expected to be generated by the customer relationships, by excluding any cash flows related to contributory assets.
The royalty relief method was used to value the trade name and intellectual property whereby it considers the discounted estimated royalty payments that are expected to be avoided as a result of the patents or trademarks being owned.
The trade receivables balance represents the gross contractual amounts due of $2.3m, of which $0.1m was expected to be uncollectable at the date of acquisition. The Group also acquired receivables relating to deferred purchase price on a sale of investment that occurred prior to acquisition. The fair value is nil on acquisition and the gross contractual amount receivable is $0.6m. $0.3m of the deferred purchase price was received in April 2017 and the remaining $0.3m is receivable in April 2018, however it is contingent upon no claims against warranties given.
WiseTech Global | annual report 2017 67

Notes to the financial statementsfor the year ended 30 June 2017
Non-controlling interest (“NCI”) and goodwillThe Group has adopted the proportionate method of accounting for NCI and therefore, on the date of initial control (1 July 2016) NCI is valued at 57.16% of the net identifiable assets acquired.
NCI and goodwill arising from the acquisition have been recognised as follows:
Softship $000
Total consideration paid 7,876
Fair value adjustment of pre-existing interest in Softship 2,046
NCI, based on proportionate interest in the net identifiable assets acquired 3,952
Less: Fair value of net identifiable assets acquired (6,914)
Goodwill 6,960
The fair value adjustment to the pre-existing interest in Softship of $2.0m was reclassified from reserves to finance income in the Consolidated statement of profit or loss on the date of acquisition.
The goodwill is attributable mainly to the key management, specialised know-how of the workforce, employee relationships, competitive position and service offerings that do not meet the recognition criteria as an intangible asset at the date of acquisition. The goodwill is not deductible for tax purposes.
Increase in ownership after obtaining controlAfter obtaining control of Softship on 1 July 2016, the Group increased its ownership percentage throughout FY17 to 76.97%. $13.8m was paid in cash, resulting in a reduction of non-controlling interest by $2.4m. The $11.4m paid in excess of the fair value has been recorded in the acquisition reserve.
Other acquisitionsOn 31 January 2017, the Group acquired 100% of the shareholding in znet group GmbH, a provider of customs solutions to the logistics industry across Germany. On 9 February 2017, the Group acquired 100% of the shareholding in ACO Informatica S.r.l, a provider of customs compliance solutions to the logistics industry across Italy.
Other acquisitions
$000
Total consideration paid 8,464Less: Fair value of net identifiable assets acquired (810)Goodwill 7,654
GoodwillThe total goodwill arising on acquisition is $7.7m which relates predominantly to the key management, specialised know-how of the workforce, employee relationships, competitive position and service offerings that do not meet the recognition criteria as an intangible asset at the date of acquisition. The goodwill is not deductible for tax purposes.
Consideration paidTotal cash consideration is $4.8m with further contingent consideration payable of $3.7m. Contingent consideration is based on a number of milestones including the integration of the acquired businesses with the Group such as the development of local customs capability into the Group’s existing product. These arrangements are in place up to a period of five years and the undiscounted value of these arrangements is $4.0m.
Contribution of other acquisitions to revenue and profitsIn total, the contribution of other acquisitions to revenue is $1.4m and a reduction to net profit of $0.2m from their respective dates of acquisition to 30 June 2017. If the acquisitions had been acquired from 1 July 2016, the Group revenue and reduction in net profit for the year ended 30 June 2017 would have been $3.5m and $0.5m respectively.
20. Business combinations and acquisition of non-controlling interests (continued)
Acquisitions in 2017 (continued)
68
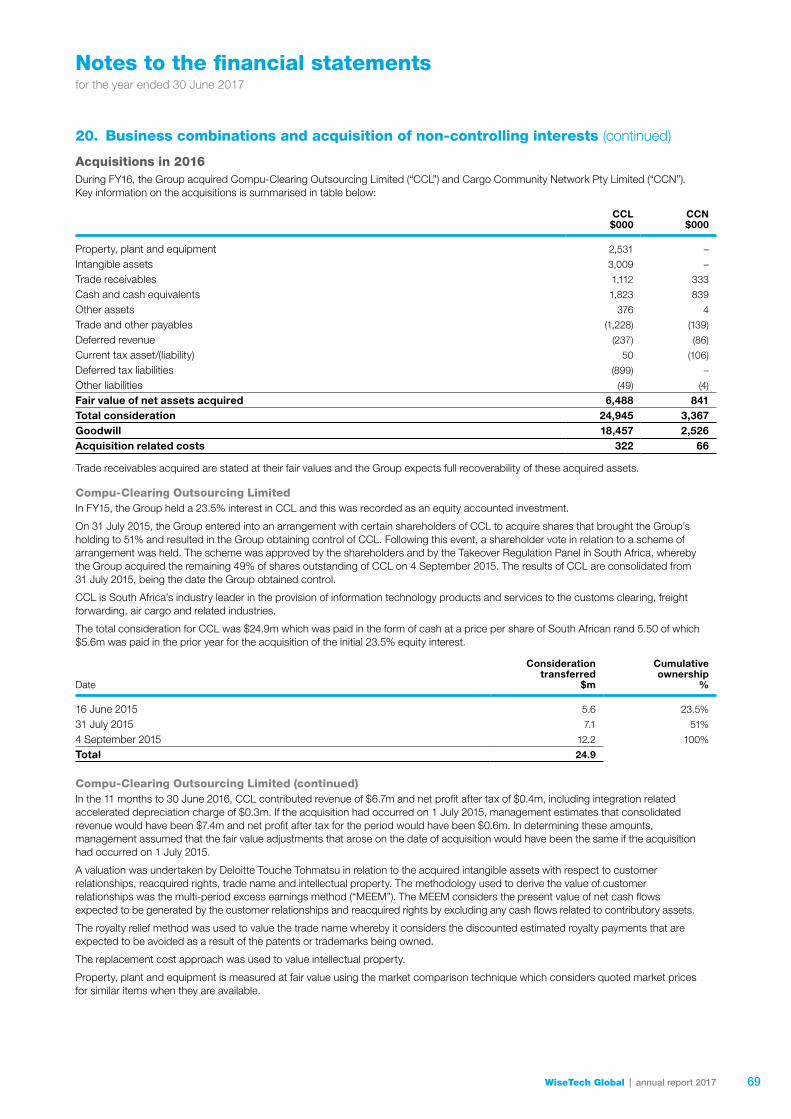
Notes to the financial statementsfor the year ended 30 June 2017
Acquisitions in 2016During FY16, the Group acquired Compu-Clearing Outsourcing Limited (“CCL”) and Cargo Community Network Pty Limited (“CCN”). Key information on the acquisitions is summarised in table below:
CCL $000
CCN $000
Property, plant and equipment 2,531 –
Intangible assets 3,009 –
Trade receivables 1,112 333
Cash and cash equivalents 1,823 839
Other assets 376 4
Trade and other payables (1,228) (139)
Deferred revenue (237) (86)
Current tax asset/(liability) 50 (106)
Deferred tax liabilities (899) –
Other liabilities (49) (4)
Fair value of net assets acquired 6,488 841Total consideration 24,945 3,367Goodwill 18,457 2,526Acquisition related costs 322 66
Trade receivables acquired are stated at their fair values and the Group expects full recoverability of these acquired assets.
Compu-Clearing Outsourcing LimitedIn FY15, the Group held a 23.5% interest in CCL and this was recorded as an equity accounted investment.
On 31 July 2015, the Group entered into an arrangement with certain shareholders of CCL to acquire shares that brought the Group’s holding to 51% and resulted in the Group obtaining control of CCL. Following this event, a shareholder vote in relation to a scheme of arrangement was held. The scheme was approved by the shareholders and by the Takeover Regulation Panel in South Africa, whereby the Group acquired the remaining 49% of shares outstanding of CCL on 4 September 2015. The results of CCL are consolidated from 31 July 2015, being the date the Group obtained control.
CCL is South Africa’s industry leader in the provision of information technology products and services to the customs clearing, freight forwarding, air cargo and related industries.
The total consideration for CCL was $24.9m which was paid in the form of cash at a price per share of South African rand 5.50 of which $5.6m was paid in the prior year for the acquisition of the initial 23.5% equity interest.
Date
Consideration transferred
$m
Cumulative ownership
%
16 June 2015 5.6 23.5%
31 July 2015 7.1 51%
4 September 2015 12.2 100%
Total 24.9
Compu-Clearing Outsourcing Limited (continued)In the 11 months to 30 June 2016, CCL contributed revenue of $6.7m and net profit after tax of $0.4m, including integration related accelerated depreciation charge of $0.3m. If the acquisition had occurred on 1 July 2015, management estimates that consolidated revenue would have been $7.4m and net profit after tax for the period would have been $0.6m. In determining these amounts, management assumed that the fair value adjustments that arose on the date of acquisition would have been the same if the acquisition had occurred on 1 July 2015.
A valuation was undertaken by Deloitte Touche Tohmatsu in relation to the acquired intangible assets with respect to customer relationships, reacquired rights, trade name and intellectual property. The methodology used to derive the value of customer relationships was the multi-period excess earnings method (“MEEM”). The MEEM considers the present value of net cash flows expected to be generated by the customer relationships and reacquired rights by excluding any cash flows related to contributory assets.
The royalty relief method was used to value the trade name whereby it considers the discounted estimated royalty payments that are expected to be avoided as a result of the patents or trademarks being owned.
The replacement cost approach was used to value intellectual property.
Property, plant and equipment is measured at fair value using the market comparison technique which considers quoted market prices for similar items when they are available.
20. Business combinations and acquisition of non-controlling interests (continued)
WiseTech Global | annual report 2017 69

Notes to the financial statementsfor the year ended 30 June 2017
GoodwillThe goodwill is attributable mainly to the skills and technical talent of CCL’s work force and the synergies expected to be achieved from integrating the company into the Group’s existing business. The goodwill is not deductible for tax purposes.
Cargo Community Network Pty LimitedOn 30 April 2016, the Group acquired CCN, the exclusive distributor in Australia and New Zealand of Cargo Community Network Pte Ltd’s global messaging and applications for the air cargo industry.
CCN is the leading supplier of mission critical airline messaging solutions and data integration to support activities of the Australian and New Zealand cargo operations of some of the world’s leading airlines, ground handling agents and freight forwarders.
Total consideration of $3.4m includes contingent consideration of $1.5m.
In the two months to 30 June 2016, CCN contributed revenue of $0.2m and net profit after tax of $0.04m. If the acquisition had occurred on 1 July 2015, management estimates that consolidated revenue would have been $1.4m and net profit after tax for the period would have been $0.2m. In determining these amounts, management has assumed that the fair value adjustments that arose on the date of acquisition would have been the same if the acquisition had occurred on 1 July 2015.
A valuation was undertaken by management in relation to the acquired intangibles where it was determined that it consists only of goodwill.
GoodwillThe goodwill is attributable mainly to the synergies expected to be achieved from integrating the company into the Group’s existing business. The goodwill is not deductible for tax purposes.
Significant accounting policyBusiness combinations occur where an acquirer obtains control over one or more businesses.
A business combination is accounted for by applying the acquisition method, unless it is a combination involving entities or businesses under common control. Under the acquisition method, the business combination will be accounted for from the date that control is attained whereby the fair value of the identifiable assets acquired and liabilities (including contingent liabilities) assumed is recognised (subject to certain limited exemptions).
The consideration transferred in the acquisition including any contingent consideration is generally measured at fair value as are the identifiable net assets acquired. Any goodwill that arises is tested annually for impairment. Any gain on a bargain purchase is recognised in profit or loss immediately. Transaction costs are expensed as incurred except if related to the issue of debt or equity securities.
The consideration transferred does not include amounts related to the settlement of pre-existing relationships. Such amounts are generally recognised in Consolidated statement of profit or loss.
If the contingent consideration is classified as equity, then it is not remeasured and settlement is accounted for within equity. Otherwise, subsequent changes in the fair value of the contingent consideration are recognised in Consolidated statement of profit or loss.
21. Employee benefits2017 $000
2016 $000
Wages and salaries 72,681 60,488Share-based payment expense 3,218 7,014Defined contribution superannuation expense 4,983 3,395Total employee benefit expense 80,882 70,897
Annual leave and long service leave
2017 $000
2016 $000
CurrentAnnual leave 4,670 3,739Long service leave 1,533 1,163
6,203 4,902
Non-currentLong service leave 754 699
754 699Total annual and long service leave 6,957 5,601
20. Business combinations and acquisition of non-controlling interests (continued)
Acquisitions in 2016 (continued)
70
Notes to the financial statementsfor the year ended 30 June 2017
Significant accounting policy
Short-term employee benefitsShort-term employee benefits are benefits (other than termination benefits) that are expected to be settled wholly within 12 months after the end of the annual reporting period in which the employees render the related service, including wages, salaries and sick leave. Short-term employee benefits are measured at the (undiscounted) amounts expected to be paid when the obligation is settled.
The Group’s obligations for short-term employee benefits such as wages, salaries and sick leave are recognised as a part of current trade and other payables in the Consolidated statement of financial position. The Group’s obligations for employees’ annual leave and long service leave entitlements are recognised as employee benefits in the Consolidated statement of financial position.
Long-term employee benefitsProvision is made for employees’ long service leave and not expected to be settled wholly within 12 months after the end of the annual reporting period in which the employees render the related service. Long-term employee benefits are measured at the present value of the expected future payments to be made to employees.
Expected future payments incorporate anticipated future wage and salary levels, duration of service and employee departures and are discounted at rates determined by reference to market yields at the end of the reporting period on corporate bonds that have maturity dates that approximate the terms of the obligations. Any remeasurements for changes in assumptions of obligations for long-term employee benefits are recognised in profit or loss in the periods in which the changes occur.
The Group’s obligations for long-term employee benefits are presented as non-current employee benefits in its Consolidated statement of financial position, except where the Group does not have an unconditional right to defer settlement for at least 12 months after the end of the reporting period, in which case the obligations are presented as current employee benefits.
Defined contribution superannuation benefitsAll obligations for contributions in respect of employees’ defined contribution superannuation benefits are recognised as an expense as the related service is provided.
Share-based payment transactionsThe Company had a number of share-based payment arrangements that were granted to employees during FY17. These related to share rights granted as part of employee remuneration for FY17, one-off Christmas bonuses and matching equity related to salary sacrifice arrangements. The awards were granted in June 2017 based on a specified monetary value to each employee. The fair value of these arrangements were deemed to be the function of the number of share rights and the grant date price. The FY17 remuneration share rights and matching equity share rights vest in three equal annual tranches commencing July 2017, the Christmas bonus vested in July 2017. Any unvested portions are forfeited upon cessation of employment.
Incentive awards for employees for performance during FY17 include bonuses delivered as equity in the form of share rights expected to be granted in September 2017. These share rights vest in three tranches, in September 2017, July 2018 and July 2019. Any unvested share rights are forfeited upon cessation of employment.
The total value of share-based payments recognised in the Consolidated statement of profit or loss with a corresponding entry to share-based payment reserve is $3.2m.
In the prior year, as part of the IPO, the Group determined to close out and settle equity incentives in existence at the prospectus date (and considered appropriate by the Company before it was listed). The incentive plan was modified to bring forward the vesting date to the date of IPO; accordingly, the remaining value of the schemes was accelerated and expensed to profit or loss. This was completed through issuing of share rights and cash payments (with the ability for employees to reinvest in shares on IPO). In the prior year, the cost of this accelerated close-out amounted to $4.4m which was in addition to $2.4m that was expensed to profit or loss prior to the modification.
In the prior year, the Company modified the legacy “uncapped” sales commission plan from a cash settled plan to an equity settled arrangement. The share rights were issued at the time of the IPO and were not subject to performance or employment hurdles or conditions and will not lapse if the holders employment with the Group terminates. In FY16, an expense of $4.8m relating to the value of the equity issued and associated taxes of $1.4m were recognised in the Consolidated statement of profit or loss.
21. Employee benefits (continued)
WiseTech Global | annual report 2017 71

Notes to the financial statementsfor the year ended 30 June 2017
22. Key management personnel transactions
Key management personnel (“KMP”) compensationThe total remuneration of the KMP of the Company included within employee benefit expense are as follows:
2017 $000
2016 $000
Short-term employee benefits 2,493 2,837Post-employment benefits 135 181Other long-term benefits 217 147Share-based payments 598 1,382Total KMP compensation 3,443 4,547
Short-term employee benefitsThese amounts include fees and benefits paid to executive Directors and other KMP as well as salary, fringe benefits and cash bonuses awarded to the non-executive Chairperson and the other non-executive Directors.
Post-employment benefitsThese amounts are the cost of superannuation contributions made during the year.
Other long-term benefitsThese amounts represent long service leave and long-term annual leave benefits accruing during the year.
Share-based paymentsThese amounts represent the expense related to the participation of KMP in equity-settled benefit schemes as measured by the fair value of the shares granted on grant date.
Loans to KMPThere are no loans outstanding to KMP at 30 June 2017 (2016:$0.1m).
KMP transactionsDirectors of the Company controlled 67.69% (2016: 67.72%) of the voting shares of the Company as at 30 June 2017. A number of KMP, or their related parties, hold positions in other companies that result in them having control or significant influence over these companies. A number of these companies transacted with the Group during the year. The terms and conditions of these transactions were no more favourable than those available, or which might reasonably be expected to be available, in similar transactions with non-KMP related companies on an arm’s length basis.
The aggregate value of transactions and outstanding balances related to KMP and entities over which they have control or significant influence were as follows:
Transaction values for the year ended 30 June
Balance outstandingas at 30 June
Directors Transactions2017 $000
2016 $000
2017 $000
2016 $000
R White & M Isaacs Company apartments rent ¹ 66 136 – –
R White Company apartments rent ¹ 95 – – –
R White & M Isaacs US office costs ² 900 620 – –
R White & M Isaacs US data centre costs ² 1,302 533 (406) 533
R White & M Isaacs Office services agreements 11 18 – –
R White Office services agreements 11 – – –
1 The Group entered into various apartment leases with RealWise Holdings Pty Ltd, a company controlled by R White and M Isaacs until 30 November 2016. From 1 December 2016, these agreements were transferred to Marwood White Administrators Pty Ltd, a company controlled by R White.
2 The US office and US data centre is in a building owned by RealWise Investments LLC, a company controlled by R White & M Isaacs.
All these arrangements were agreed on normal market rates.
72
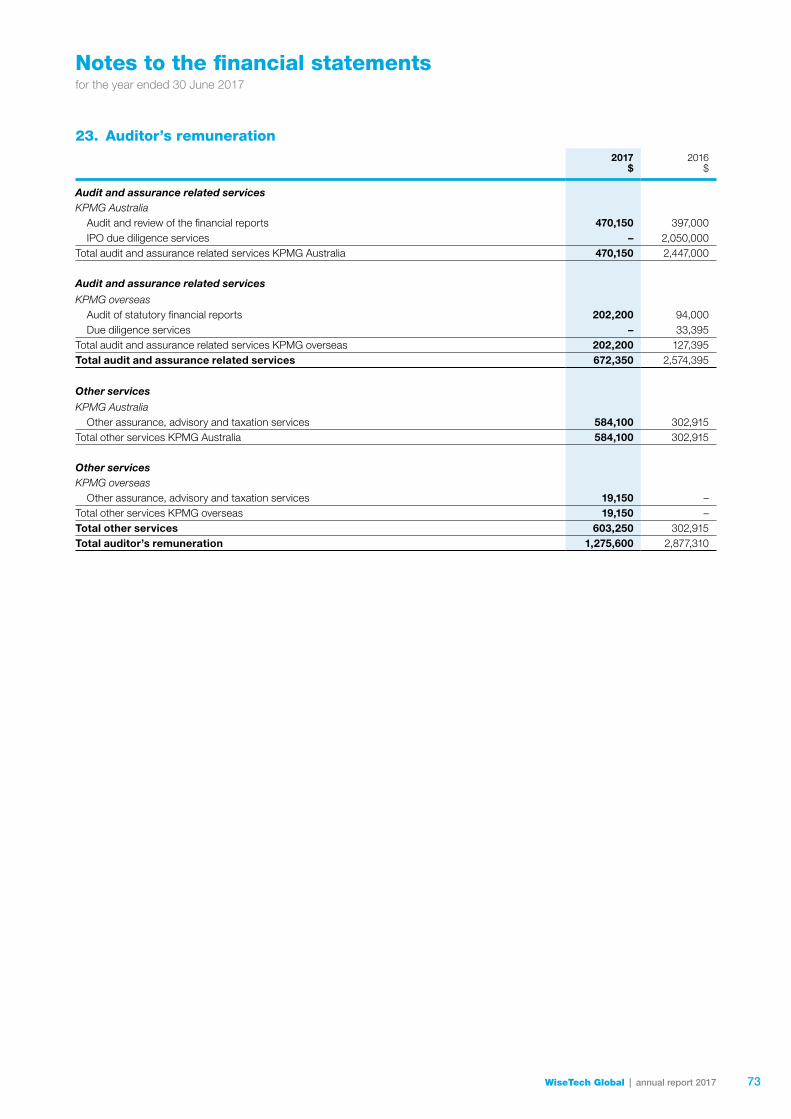
Notes to the financial statementsfor the year ended 30 June 2017
23. Auditor’s remuneration2017
$2016
$
Audit and assurance related servicesKPMG Australia
Audit and review of the financial reports 470,150 397,000IPO due diligence services – 2,050,000
Total audit and assurance related services KPMG Australia 470,150 2,447,000
Audit and assurance related services
KPMG overseasAudit of statutory financial reports 202,200 94,000Due diligence services – 33,395
Total audit and assurance related services KPMG overseas 202,200 127,395Total audit and assurance related services 672,350 2,574,395
Other services
KPMG AustraliaOther assurance, advisory and taxation services 584,100 302,915
Total other services KPMG Australia 584,100 302,915
Other servicesKPMG overseas
Other assurance, advisory and taxation services 19,150 –Total other services KPMG overseas 19,150 –Total other services 603,250 302,915Total auditor’s remuneration 1,275,600 2,877,310
WiseTech Global | annual report 2017 73

Notes to the financial statementsfor the year ended 30 June 2017
24. Reconciliation of net cash flows from operating activities2017 $000
2016 $000
Cash flow reconciliationReconciliation of net profit after tax to net cash flows from operations:Profit after tax from continuing operations 31,860 2,167Share of profit of non-controlling interests 332 –Net Profit after tax 32,192 2,167Adjustments to reconcile profit before tax to net cash flows:
Depreciation and impairment 4,549 4,528Amortisation 7,850 6,666Doubtful debt expense 367 83Net finance costs/(income) (2,731) 1,187Income from cash flow hedge instrument (267) –Unrealised foreign exchange 223 44Share-based payment expense 3,218 7,014Gift shares – 405Unwinding of contingent consideration 357 514Option premium – (1,544)Share of loss of associate 64 –Dividend income from associate (18) –Exchange differences on cash balances (84) 4Reclassification adjustment of intangible expensed to P/L 595 –
Change in assets and liabilities:Decrease/(increase) in trade receivables 1,387 (2,824)Decrease/(increase) in other current and non-current assets 1,053 (2,038)Increase in trade and other payables 4,432 1,757Increase/(decrease) in current tax liabilities 857 611Increase/(decrease) in deferred tax payable 2,612 (2,400)(Decrease)/increase in other liabilities (352) 1,240(Decrease)/increase in deferred revenue (2,397) 2,489Increase in provisions 1,022 1,179
Net cash flows from operating activities 54,929 21,082
74
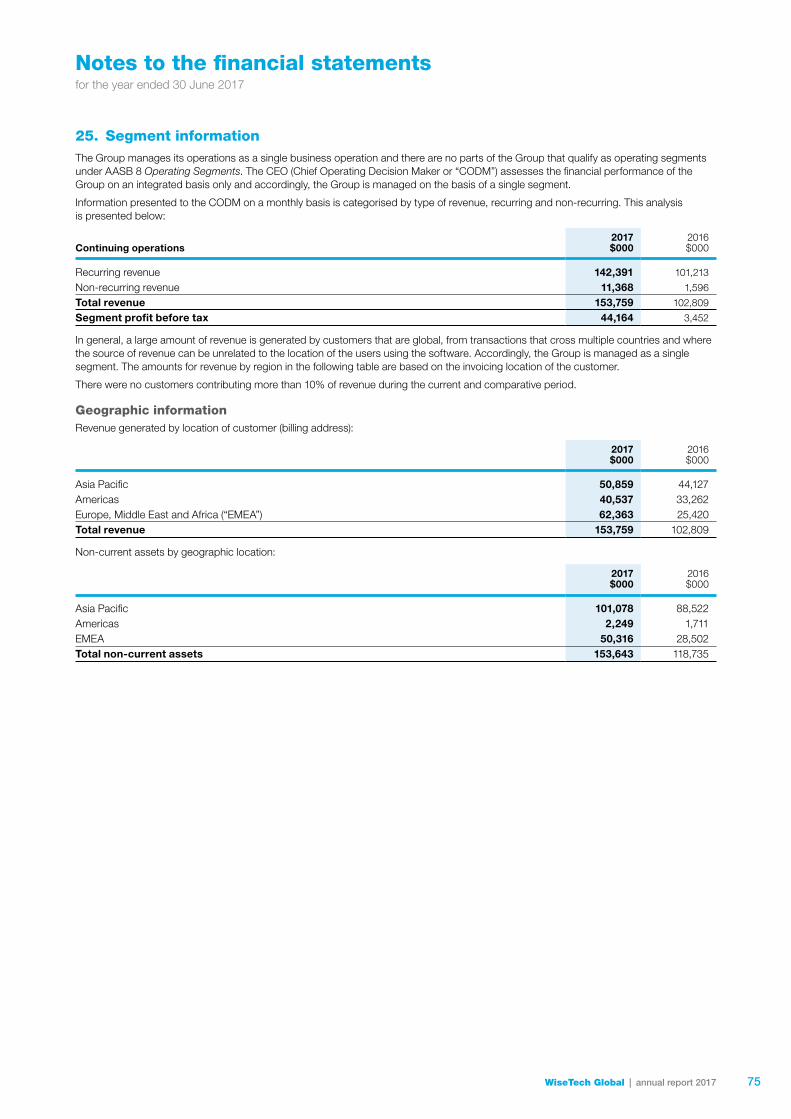
Notes to the financial statementsfor the year ended 30 June 2017
25. Segment informationThe Group manages its operations as a single business operation and there are no parts of the Group that qualify as operating segments under AASB 8 Operating Segments. The CEO (Chief Operating Decision Maker or “CODM”) assesses the financial performance of the Group on an integrated basis only and accordingly, the Group is managed on the basis of a single segment.
Information presented to the CODM on a monthly basis is categorised by type of revenue, recurring and non-recurring. This analysis is presented below:
Continuing operations2017 $000
2016 $000
Recurring revenue 142,391 101,213
Non-recurring revenue 11,368 1,596
Total revenue 153,759 102,809
Segment profit before tax 44,164 3,452
In general, a large amount of revenue is generated by customers that are global, from transactions that cross multiple countries and where the source of revenue can be unrelated to the location of the users using the software. Accordingly, the Group is managed as a single segment. The amounts for revenue by region in the following table are based on the invoicing location of the customer.
There were no customers contributing more than 10% of revenue during the current and comparative period.
Geographic informationRevenue generated by location of customer (billing address):
2017 $000
2016 $000
Asia Pacific 50,859 44,127Americas 40,537 33,262Europe, Middle East and Africa (“EMEA”) 62,363 25,420Total revenue 153,759 102,809
Non-current assets by geographic location:
2017 $000
2016 $000
Asia Pacific 101,078 88,522Americas 2,249 1,711EMEA 50,316 28,502Total non-current assets 153,643 118,735
WiseTech Global | annual report 2017 75
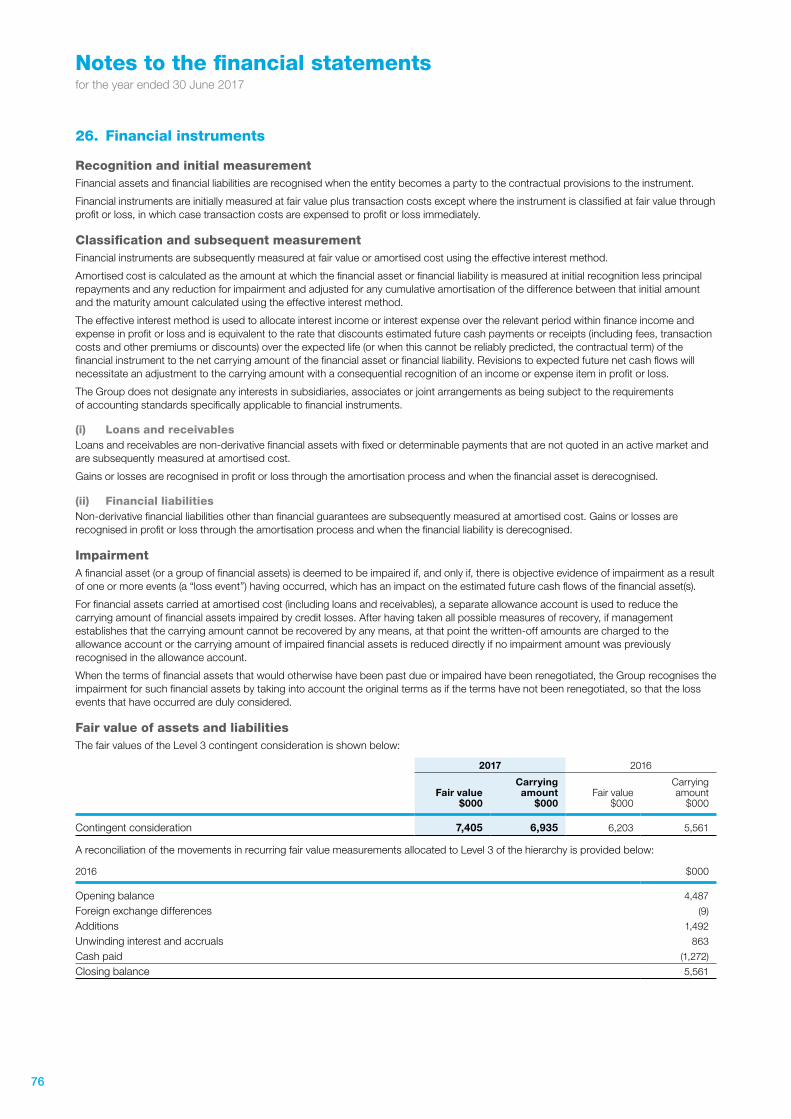
Notes to the financial statementsfor the year ended 30 June 2017
26. Financial instruments
Recognition and initial measurementFinancial assets and financial liabilities are recognised when the entity becomes a party to the contractual provisions to the instrument.
Financial instruments are initially measured at fair value plus transaction costs except where the instrument is classified at fair value through profit or loss, in which case transaction costs are expensed to profit or loss immediately.
Classification and subsequent measurementFinancial instruments are subsequently measured at fair value or amortised cost using the effective interest method.
Amortised cost is calculated as the amount at which the financial asset or financial liability is measured at initial recognition less principal repayments and any reduction for impairment and adjusted for any cumulative amortisation of the difference between that initial amount and the maturity amount calculated using the effective interest method.
The effective interest method is used to allocate interest income or interest expense over the relevant period within finance income and expense in profit or loss and is equivalent to the rate that discounts estimated future cash payments or receipts (including fees, transaction costs and other premiums or discounts) over the expected life (or when this cannot be reliably predicted, the contractual term) of the financial instrument to the net carrying amount of the financial asset or financial liability. Revisions to expected future net cash flows will necessitate an adjustment to the carrying amount with a consequential recognition of an income or expense item in profit or loss.
The Group does not designate any interests in subsidiaries, associates or joint arrangements as being subject to the requirements of accounting standards specifically applicable to financial instruments.
(i) Loans and receivablesLoans and receivables are non-derivative financial assets with fixed or determinable payments that are not quoted in an active market and are subsequently measured at amortised cost.
Gains or losses are recognised in profit or loss through the amortisation process and when the financial asset is derecognised.
(ii) Financial liabilitiesNon-derivative financial liabilities other than financial guarantees are subsequently measured at amortised cost. Gains or losses are recognised in profit or loss through the amortisation process and when the financial liability is derecognised.
ImpairmentA financial asset (or a group of financial assets) is deemed to be impaired if, and only if, there is objective evidence of impairment as a result of one or more events (a “loss event”) having occurred, which has an impact on the estimated future cash flows of the financial asset(s).
For financial assets carried at amortised cost (including loans and receivables), a separate allowance account is used to reduce the carrying amount of financial assets impaired by credit losses. After having taken all possible measures of recovery, if management establishes that the carrying amount cannot be recovered by any means, at that point the written-off amounts are charged to the allowance account or the carrying amount of impaired financial assets is reduced directly if no impairment amount was previously recognised in the allowance account.
When the terms of financial assets that would otherwise have been past due or impaired have been renegotiated, the Group recognises the impairment for such financial assets by taking into account the original terms as if the terms have not been renegotiated, so that the loss events that have occurred are duly considered.
Fair value of assets and liabilitiesThe fair values of the Level 3 contingent consideration is shown below:
2017 2016
Fair value$000
Carrying amount
$000Fair value
$000
Carrying amount
$000
Contingent consideration 7,405 6,935 6,203 5,561
A reconciliation of the movements in recurring fair value measurements allocated to Level 3 of the hierarchy is provided below:
2016 $000
Opening balance 4,487
Foreign exchange differences (9)
Additions 1,492
Unwinding interest and accruals 863
Cash paid (1,272)
Closing balance 5,561
76
Notes to the financial statementsfor the year ended 30 June 2017
2017 $000
Opening balance 5,561Foreign exchange differences 202Additions 3,658Unwinding interest and accruals 668Cash paid (3,154)Closing balance 6,935
The Group has contingent consideration measured at fair value at 30 June 2017 in relation to contingent consideration arising out of the acquisition of znet, ACO and Zsoft. The contingent consideration is deemed to be a Level 3 measurement of fair value which will be paid over various periods from the acquisition date up to 30 June 2022 in relation to znet and ACO and 30 June 2018 in relation to Zsoft and has been discounted accordingly based on a number of milestones including the successful integration of customers into CargoWise One. The contingent consideration in relation to Core Freight Systems (Proprietary) Ltd (“CFS”) and CCN was settled during the year.
The effect on the Consolidated statement of profit or loss is due to unwinding of interest on deferred consideration/accruals and foreign exchange as indicated in the above reconciliation.
In the prior year, the fair value of the Softship equity securities was a Level 2 measurement, based on quoted prices of the security which is listed on Frankfurt Stock Exchange. During FY17, the Group obtained control of Softship and does not hold these investments as available-for-sale assets as it is now consolidated into the Group’s results.
Financial risk management objectives and policiesThe Group has exposure to the following risks arising from financial instruments:• credit risk;• liquidity risk; and• market risk.
(a) Risk management frameworkThe Board of Directors has overall responsibility for the establishment and oversight of the Group’s risk management framework. The Board of Directors has established an Audit and Risk Management Committee, which is responsible for developing and monitoring the Group’s risk management policies. The committee reports regularly to the Board of Directors on its activities.
The Group’s risk management policies are established to identify and analyse the risks faced by the Group, to set appropriate risk limits and controls and to monitor risks and adherence to limits. Risk management policies and systems are reviewed regularly to reflect changes in market conditions and the Group’s activities. The Group, through its training and management standards and procedures, aims to maintain a disciplined and constructive control environment in which all employees understand their roles and obligations.
The Audit and Risk Management Committee oversees how management monitors compliance with the Group’s risk management policies and procedures, and reviews the adequacy of the risk management framework in relation to the risks faced by the Group.
(b) Credit riskCredit risk is the risk of financial loss to the Group if a customer fails to meet its contractual obligations, and arises principally from the Group’s receivables from customers.
The Group’s standard payment and delivery terms and conditions are that payment is generally due within 30 days on receipt of any invoice and the preferred payment options are by direct debit from a bank account or credit card. No limits are used and the Group’s receivables are carefully managed by the credit management team.
Trade receivablesThe Group’s exposure to credit risk is influenced mainly by the individual characteristics of each customer. However, management also considers the factors that may influence the credit risk of its customer base including the default risk of the industry and country in which customers operate.
The maximum exposure to credit risk at balance date to recognised financial assets, is the carrying amount, net of any provision for impairment of those assets, as disclosed in the Consolidated statement of financial position. These predominantly relate to trade receivables. Refer note 11 for further details.
Cash and cash equivalentsThe Group held cash and cash equivalents of $101.6m at 30 June 2017 (2016: $109.5m). The cash and cash equivalents are held with credit-worthy bank and financial institution counterparties.
26. Financial instruments (continued)
Fair value of assets and liabilities (continued)
WiseTech Global | annual report 2017 77
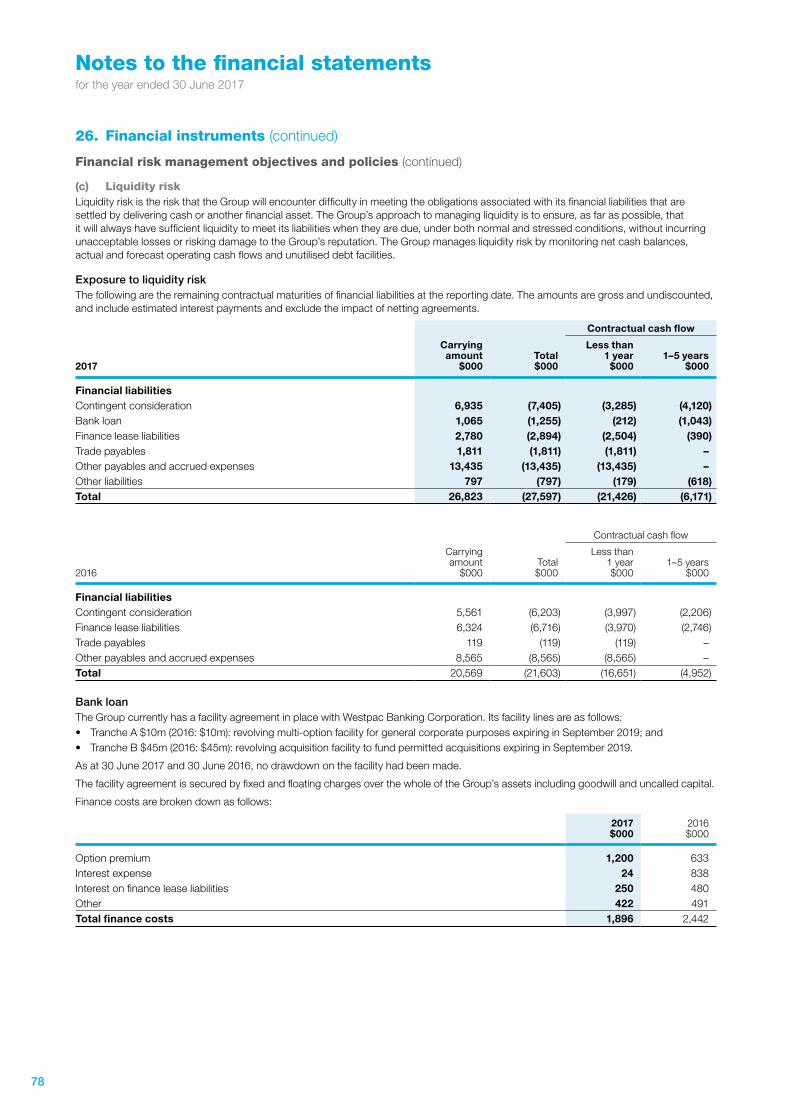
Notes to the financial statementsfor the year ended 30 June 2017
(c) Liquidity riskLiquidity risk is the risk that the Group will encounter difficulty in meeting the obligations associated with its financial liabilities that are settled by delivering cash or another financial asset. The Group’s approach to managing liquidity is to ensure, as far as possible, that it will always have sufficient liquidity to meet its liabilities when they are due, under both normal and stressed conditions, without incurring unacceptable losses or risking damage to the Group’s reputation. The Group manages liquidity risk by monitoring net cash balances, actual and forecast operating cash flows and unutilised debt facilities.
Exposure to liquidity riskThe following are the remaining contractual maturities of financial liabilities at the reporting date. The amounts are gross and undiscounted, and include estimated interest payments and exclude the impact of netting agreements.
Contractual cash flow
2017
Carrying amount
$000Total $000
Less than 1 year
$0001–5 years
$000
Financial liabilitiesContingent consideration 6,935 (7,405) (3,285) (4,120)Bank loan 1,065 (1,255) (212) (1,043)Finance lease liabilities 2,780 (2,894) (2,504) (390)Trade payables 1,811 (1,811) (1,811) –Other payables and accrued expenses 13,435 (13,435) (13,435) – Other liabilities 797 (797) (179) (618)Total 26,823 (27,597) (21,426) (6,171)
Contractual cash flow
2016
Carrying amount
$000Total $000
Less than 1 year $000
1–5 years $000
Financial liabilitiesContingent consideration 5,561 (6,203) (3,997) (2,206)Finance lease liabilities 6,324 (6,716) (3,970) (2,746)Trade payables 119 (119) (119) – Other payables and accrued expenses 8,565 (8,565) (8,565) – Total 20,569 (21,603) (16,651) (4,952)
Bank loanThe Group currently has a facility agreement in place with Westpac Banking Corporation. Its facility lines are as follows:• Tranche A $10m (2016: $10m): revolving multi-option facility for general corporate purposes expiring in September 2019; and• Tranche B $45m (2016: $45m): revolving acquisition facility to fund permitted acquisitions expiring in September 2019.
As at 30 June 2017 and 30 June 2016, no drawdown on the facility had been made.
The facility agreement is secured by fixed and floating charges over the whole of the Group’s assets including goodwill and uncalled capital.
Finance costs are broken down as follows:
2017 $000
2016 $000
Option premium 1,200 633Interest expense 24 838Interest on finance lease liabilities 250 480Other 422 491Total finance costs 1,896 2,442
26. Financial instruments (continued)
Financial risk management objectives and policies (continued)
78

Notes to the financial statementsfor the year ended 30 June 2017
(d) Market riskMarket risk is the risk that changes in market prices such as foreign exchange rates, interest rates and equity prices will adversely affect the Group’s income or the value of its holdings of financial instruments. The objective of market risk management is to manage and control market risk exposures within acceptable parameters, while optimising the return.
Currency riskCurrency risk is the risk that the fair value of future cash flows of a financial instrument will fluctuate because of changes in foreign exchange rates. The source and nature of this risk arise from operations and translation risks.
The Company’s reporting currency is Australian dollars. However, the international operations give rise to an exposure to changes in foreign exchange rates as the majority of its revenue from outside of Australia is denominated in currencies other than Australian dollars, most significantly US dollars (“USD”), pounds sterling (“GBP”), South African rand (“ZAR”), and Euro (“EUR”).
The Group has exposures surrounding foreign currencies due to non-functional transactions within operations in different overseas jurisdictions.
A reasonably possible strengthening (weakening) of the USD, GBP, ZAR and EUR against all other currencies at 30 June 2017 would have affected the measurement of financial instruments denominated in a foreign currency and affected profit or loss and equity by the amounts shown below. This analysis assumes that all other variables, in particular interest rates, remain constant and ignores any impact of forecast sales and purchases.
Profit or loss Equity
30 June 2017 $000
Change (+10%)
$000
Change (–10%)
$000
Change (+10%)
$000
Change (–10%)
$000
USDNet trade receivables/(payables) exposure 2,715 (247) 302 – –GBPNet trade receivables/(payables) exposure 118 (11) 13 – –ZARNet trade receivables/(payables) exposure 23 (2) 3 – –EURNet trade receivables/(payables) exposure 176 (16) 20 – –
Profit or loss Equity
30 June 2016 $000
Change (+10%)
$000
Change (-10%) $000
Change (+10%)
$000
Change (-10%) $000
USDDerivatives – – – 1,162 –Net trade receivables/(payables) exposure 2,745 (112) 305 – –GBPNet trade receivables/(payables) exposure 214 (19) 24 – –ZARNet trade receivables/(payables) exposure 369 (34) 41 – –EURNet trade receivables/(payables) exposure 763 (69) 85 – –
When the Company enters into derivative financial instruments to hedge its foreign currency risk exposures, the derivatives are recognised initially at fair value. Subsequent to initial recognition, derivatives are measured at fair value. Ineffective changes in the fair value of any derivative are recognised immediately in profit or loss.
Ineffectiveness during the year was nil (2016: nil) and is deemed to be a Level 2 measurement of fair value.
In the prior year, the Group entered into USD options to protect the Company’s USD currency exposure in FY16 and FY17. The foreign currency option contracts protect approximately 60% of forecast revenue exposure which equates to approximately 90% of the net exposure to fluctuations in the USD exchange rate in FY16 and FY17.
26. Financial instruments (continued)
Financial risk management objectives and policies (continued)
WiseTech Global | annual report 2017 79
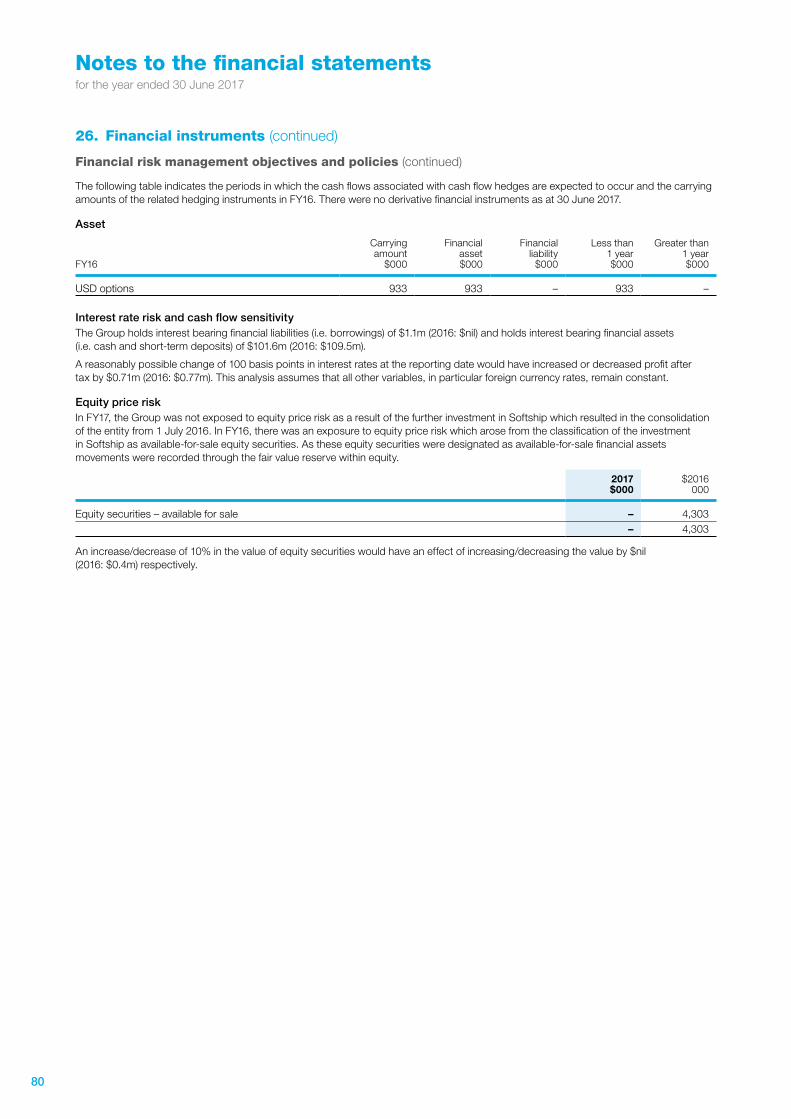
Notes to the financial statementsfor the year ended 30 June 2017
The following table indicates the periods in which the cash flows associated with cash flow hedges are expected to occur and the carrying amounts of the related hedging instruments in FY16. There were no derivative financial instruments as at 30 June 2017.
Asset
FY16
Carrying amount
$000
Financial asset $000
Financial liability
$000
Less than 1 year $000
Greater than 1 year $000
USD options 933 933 – 933 –
Interest rate risk and cash flow sensitivityThe Group holds interest bearing financial liabilities (i.e. borrowings) of $1.1m (2016: $nil) and holds interest bearing financial assets (i.e. cash and short-term deposits) of $101.6m (2016: $109.5m).
A reasonably possible change of 100 basis points in interest rates at the reporting date would have increased or decreased profit after tax by $0.71m (2016: $0.77m). This analysis assumes that all other variables, in particular foreign currency rates, remain constant.
Equity price riskIn FY17, the Group was not exposed to equity price risk as a result of the further investment in Softship which resulted in the consolidation of the entity from 1 July 2016. In FY16, there was an exposure to equity price risk which arose from the classification of the investment in Softship as available-for-sale equity securities. As these equity securities were designated as available-for-sale financial assets movements were recorded through the fair value reserve within equity.
2017 $000
$2016 000
Equity securities – available for sale – 4,303– 4,303
An increase/decrease of 10% in the value of equity securities would have an effect of increasing/decreasing the value by $nil (2016: $0.4m) respectively.
26. Financial instruments (continued)
Financial risk management objectives and policies (continued)
80
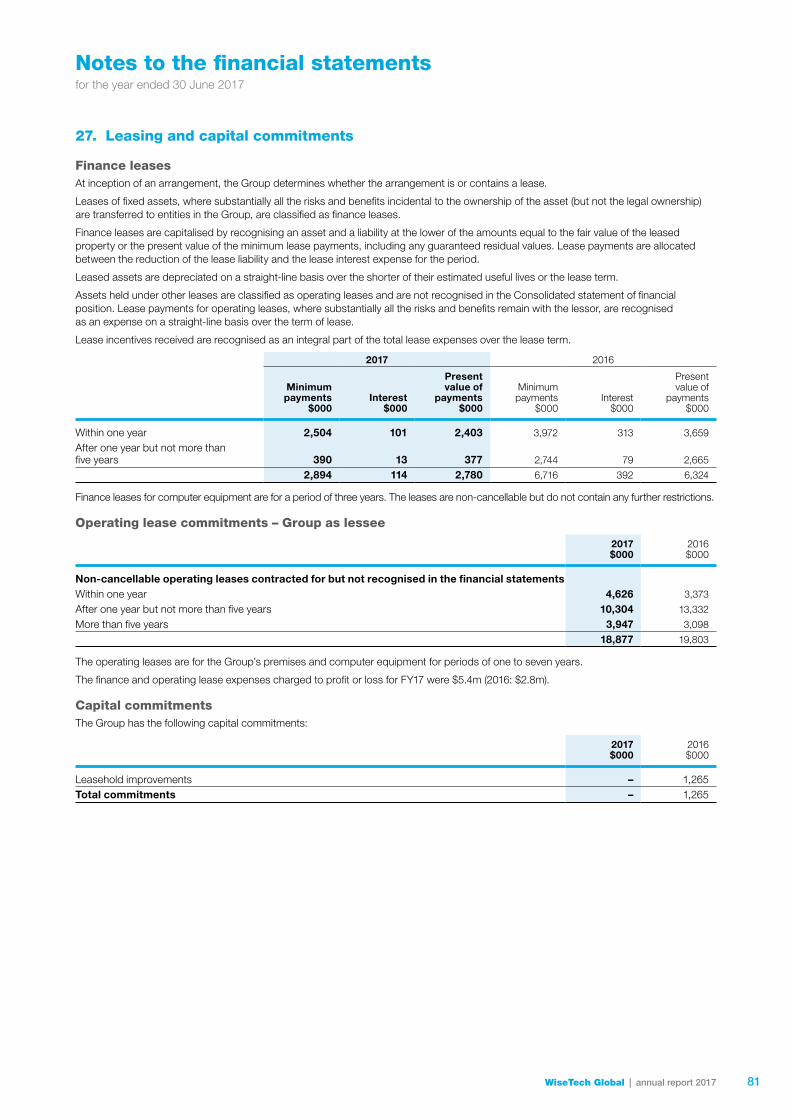
Notes to the financial statementsfor the year ended 30 June 2017
27. Leasing and capital commitments
Finance leasesAt inception of an arrangement, the Group determines whether the arrangement is or contains a lease.
Leases of fixed assets, where substantially all the risks and benefits incidental to the ownership of the asset (but not the legal ownership) are transferred to entities in the Group, are classified as finance leases.
Finance leases are capitalised by recognising an asset and a liability at the lower of the amounts equal to the fair value of the leased property or the present value of the minimum lease payments, including any guaranteed residual values. Lease payments are allocated between the reduction of the lease liability and the lease interest expense for the period.
Leased assets are depreciated on a straight-line basis over the shorter of their estimated useful lives or the lease term.
Assets held under other leases are classified as operating leases and are not recognised in the Consolidated statement of financial position. Lease payments for operating leases, where substantially all the risks and benefits remain with the lessor, are recognised as an expense on a straight-line basis over the term of lease.
Lease incentives received are recognised as an integral part of the total lease expenses over the lease term.
2017 2016
Minimumpayments
$000Interest
$000
Presentvalue of
payments$000
Minimumpayments
$000Interest
$000
Presentvalue of
payments$000
Within one year 2,504 101 2,403 3,972 313 3,659
After one year but not more than five years 390 13 377 2,744 79 2,665
2,894 114 2,780 6,716 392 6,324
Finance leases for computer equipment are for a period of three years. The leases are non-cancellable but do not contain any further restrictions.
Operating lease commitments – Group as lessee
2017 $000
2016 $000
Non-cancellable operating leases contracted for but not recognised in the financial statementsWithin one year 4,626 3,373
After one year but not more than five years 10,304 13,332
More than five years 3,947 3,098
18,877 19,803
The operating leases are for the Group’s premises and computer equipment for periods of one to seven years.
The finance and operating lease expenses charged to profit or loss for FY17 were $5.4m (2016: $2.8m).
Capital commitmentsThe Group has the following capital commitments:
2017$000
2016 $000
Leasehold improvements – 1,265Total commitments – 1,265
WiseTech Global | annual report 2017 81
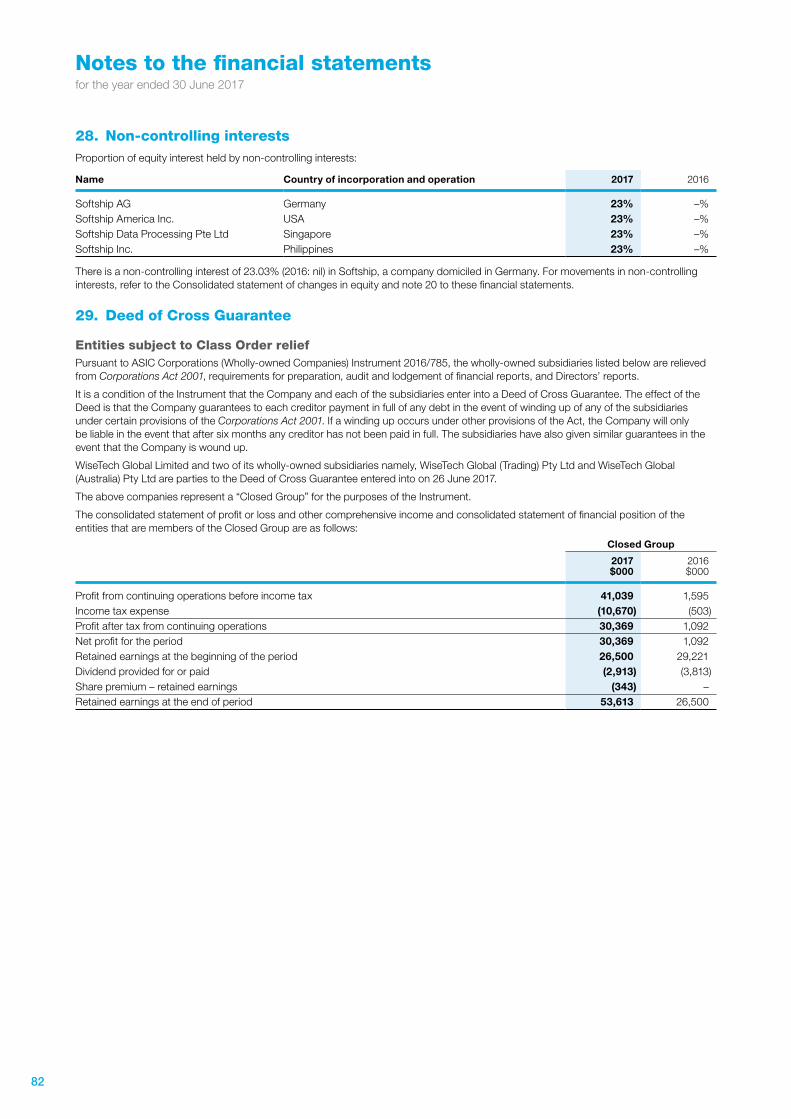
Notes to the financial statementsfor the year ended 30 June 2017
28. Non-controlling interestsProportion of equity interest held by non-controlling interests:
Name Country of incorporation and operation 2017 2016
Softship AG Germany 23% –%Softship America Inc. USA 23% –%Softship Data Processing Pte Ltd Singapore 23% –%Softship Inc. Philippines 23% –%
There is a non-controlling interest of 23.03% (2016: nil) in Softship, a company domiciled in Germany. For movements in non-controlling interests, refer to the Consolidated statement of changes in equity and note 20 to these financial statements.
29. Deed of Cross Guarantee
Entities subject to Class Order reliefPursuant to ASIC Corporations (Wholly-owned Companies) Instrument 2016/785, the wholly-owned subsidiaries listed below are relieved from Corporations Act 2001, requirements for preparation, audit and lodgement of financial reports, and Directors’ reports.
It is a condition of the Instrument that the Company and each of the subsidiaries enter into a Deed of Cross Guarantee. The effect of the Deed is that the Company guarantees to each creditor payment in full of any debt in the event of winding up of any of the subsidiaries under certain provisions of the Corporations Act 2001. If a winding up occurs under other provisions of the Act, the Company will only be liable in the event that after six months any creditor has not been paid in full. The subsidiaries have also given similar guarantees in the event that the Company is wound up.
WiseTech Global Limited and two of its wholly-owned subsidiaries namely, WiseTech Global (Trading) Pty Ltd and WiseTech Global (Australia) Pty Ltd are parties to the Deed of Cross Guarantee entered into on 26 June 2017.
The above companies represent a “Closed Group” for the purposes of the Instrument.
The consolidated statement of profit or loss and other comprehensive income and consolidated statement of financial position of the entities that are members of the Closed Group are as follows:
Closed Group
2017 $000
2016 $000
Profit from continuing operations before income tax 41,039 1,595Income tax expense (10,670) (503)Profit after tax from continuing operations 30,369 1,092Net profit for the period 30,369 1,092Retained earnings at the beginning of the period 26,500 29,221Dividend provided for or paid (2,913) (3,813)Share premium – retained earnings (343) –Retained earnings at the end of period 53,613 26,500
82

Notes to the financial statementsfor the year ended 30 June 2017
Closed Group
2017 $000
2016 $000
AssetsCurrent assetsCash and cash equivalents 92,566 95,213Trade and other receivables 9,000 10,575Current tax receivables 1,747 1,747Other current assets 4,404 1,641Total current assets 107,717 109,176
Non-current assetsIntangible assets 82,319 67,343Property, plant and equipment 9,992 9,380Deferred tax assets – 7,623Investments in subsidiaries 75,860 58,230Other non-current assets 1,322 3,621Total non-current assets 169,493 146,197Total assets 277,210 255,373
LiabilitiesCurrent liabilitiesTrade and other payables 8,739 4,353Borrowings 2,094 3,376Deferred revenue 11,125 12,375Current tax liabilities 3,336 –Employee benefits 4,901 4,016Other current liabilities 3,319 3,321Intercompany payables 6,491 6,606Total current liabilities 40,005 34,047
Non-current liabilitiesBorrowings 258 2,074Employee benefits 754 699Deferred tax liabilities 11,419 16,816Other liabilities 633 1,674Total non-current liabilities 13,064 21,263Total liabilities 53,069 55,310Net assets 224,141 200,063
EquityShare capital 166,606 165,571Reserves 3,922 7,992Retained earnings 53,613 26,500Total equity 224,141 200,063
29. Deed of Cross Guarantee (continued)
Entities subject to Class Order relief (continued)
WiseTech Global | annual report 2017 83
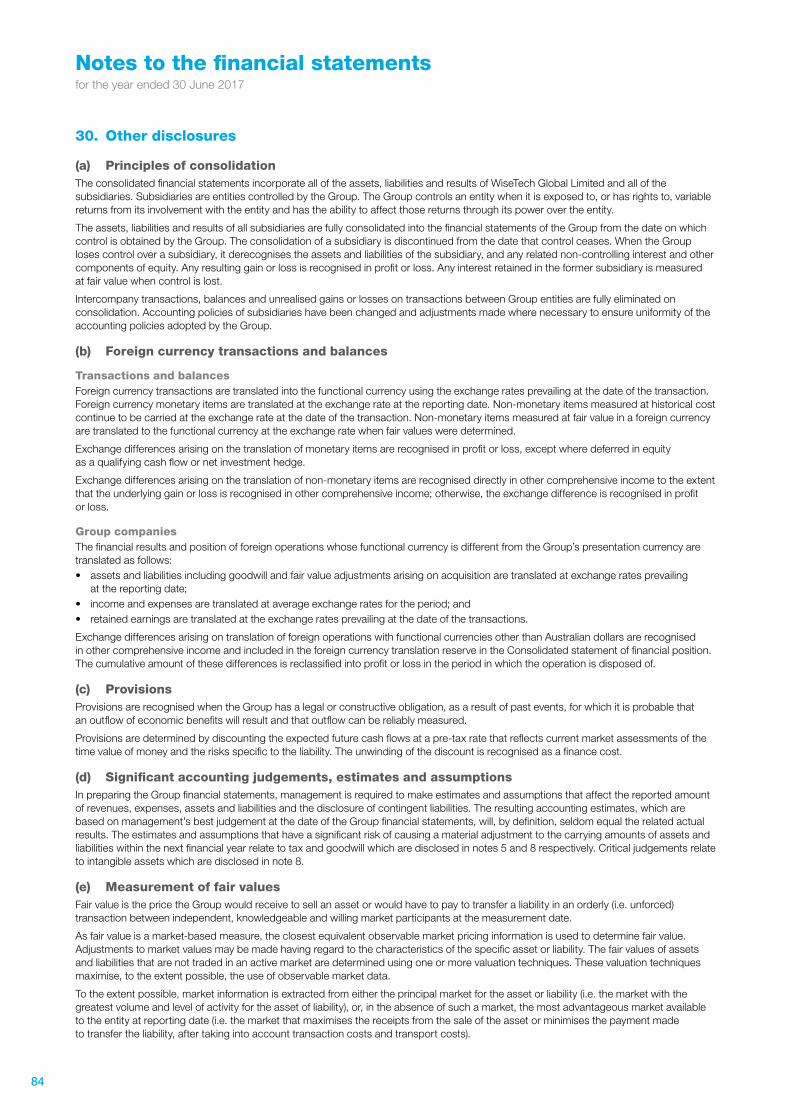
Notes to the financial statementsfor the year ended 30 June 2017
30. Other disclosures
(a) Principles of consolidationThe consolidated financial statements incorporate all of the assets, liabilities and results of WiseTech Global Limited and all of the subsidiaries. Subsidiaries are entities controlled by the Group. The Group controls an entity when it is exposed to, or has rights to, variable returns from its involvement with the entity and has the ability to affect those returns through its power over the entity.
The assets, liabilities and results of all subsidiaries are fully consolidated into the financial statements of the Group from the date on which control is obtained by the Group. The consolidation of a subsidiary is discontinued from the date that control ceases. When the Group loses control over a subsidiary, it derecognises the assets and liabilities of the subsidiary, and any related non-controlling interest and other components of equity. Any resulting gain or loss is recognised in profit or loss. Any interest retained in the former subsidiary is measured at fair value when control is lost.
Intercompany transactions, balances and unrealised gains or losses on transactions between Group entities are fully eliminated on consolidation. Accounting policies of subsidiaries have been changed and adjustments made where necessary to ensure uniformity of the accounting policies adopted by the Group.
(b) Foreign currency transactions and balances
Transactions and balancesForeign currency transactions are translated into the functional currency using the exchange rates prevailing at the date of the transaction. Foreign currency monetary items are translated at the exchange rate at the reporting date. Non-monetary items measured at historical cost continue to be carried at the exchange rate at the date of the transaction. Non-monetary items measured at fair value in a foreign currency are translated to the functional currency at the exchange rate when fair values were determined.
Exchange differences arising on the translation of monetary items are recognised in profit or loss, except where deferred in equity as a qualifying cash flow or net investment hedge.
Exchange differences arising on the translation of non-monetary items are recognised directly in other comprehensive income to the extent that the underlying gain or loss is recognised in other comprehensive income; otherwise, the exchange difference is recognised in profit or loss.
Group companiesThe financial results and position of foreign operations whose functional currency is different from the Group’s presentation currency are translated as follows:• assets and liabilities including goodwill and fair value adjustments arising on acquisition are translated at exchange rates prevailing
at the reporting date;• income and expenses are translated at average exchange rates for the period; and• retained earnings are translated at the exchange rates prevailing at the date of the transactions.
Exchange differences arising on translation of foreign operations with functional currencies other than Australian dollars are recognised in other comprehensive income and included in the foreign currency translation reserve in the Consolidated statement of financial position. The cumulative amount of these differences is reclassified into profit or loss in the period in which the operation is disposed of.
(c) ProvisionsProvisions are recognised when the Group has a legal or constructive obligation, as a result of past events, for which it is probable that an outflow of economic benefits will result and that outflow can be reliably measured.
Provisions are determined by discounting the expected future cash flows at a pre-tax rate that reflects current market assessments of the time value of money and the risks specific to the liability. The unwinding of the discount is recognised as a finance cost.
(d) Significant accounting judgements, estimates and assumptionsIn preparing the Group financial statements, management is required to make estimates and assumptions that affect the reported amount of revenues, expenses, assets and liabilities and the disclosure of contingent liabilities. The resulting accounting estimates, which are based on management’s best judgement at the date of the Group financial statements, will, by definition, seldom equal the related actual results. The estimates and assumptions that have a significant risk of causing a material adjustment to the carrying amounts of assets and liabilities within the next financial year relate to tax and goodwill which are disclosed in notes 5 and 8 respectively. Critical judgements relate to intangible assets which are disclosed in note 8.
(e) Measurement of fair valuesFair value is the price the Group would receive to sell an asset or would have to pay to transfer a liability in an orderly (i.e. unforced) transaction between independent, knowledgeable and willing market participants at the measurement date.
As fair value is a market-based measure, the closest equivalent observable market pricing information is used to determine fair value. Adjustments to market values may be made having regard to the characteristics of the specific asset or liability. The fair values of assets and liabilities that are not traded in an active market are determined using one or more valuation techniques. These valuation techniques maximise, to the extent possible, the use of observable market data.
To the extent possible, market information is extracted from either the principal market for the asset or liability (i.e. the market with the greatest volume and level of activity for the asset of liability), or, in the absence of such a market, the most advantageous market available to the entity at reporting date (i.e. the market that maximises the receipts from the sale of the asset or minimises the payment made to transfer the liability, after taking into account transaction costs and transport costs).
84

Notes to the financial statementsfor the year ended 30 June 2017
For non-financial assets, the fair value measurement also takes into account a market participant’s ability to use the asset in its highest and best use or to sell it to another market participant that would use the asset in its highest and best use.
The fair value of liabilities and the entity’s own equity instruments (excluding those related to share-based payment arrangements) may be valued, where there is no observable market price in relation to the transfer of such financial instrument, by reference to observable market information where such instruments are held as assets. Where this information is not available, other valuation techniques are adopted and where significant, are detailed in the respective note to the financial statements.
Fair value hierarchySignificant valuation issues are reported to the Audit and Risk Management Committee.
When measuring the fair value of an asset or a liability, the Group uses market observable data as far as possible. Fair values are categorised into different levels in a fair value hierarchy based on the inputs used in the valuation techniques as follows:Level 1: quoted prices (unadjusted) in active markets for identical assets or liabilities;Level 2: inputs other than quoted prices included in Level 1 that are observable for the asset or liability, either directly (i.e. as prices)
or indirectly (i.e. derived from prices); andLevel 3: inputs for the asset or liability that are not based on observable market data (unobservable inputs).
If the inputs used to measure the fair value of an asset or a liability might be categorised in different levels of the fair value hierarchy, then the fair value measurement is categorised in its entirety in the same level of the fair value hierarchy as the lowest level input that is significant to the entire measurement.
The Group recognises transfers between levels of the fair value hierarchy at the end of the reporting period during which the change has occurred.
(f) Standards issued but not yet effectiveA number of new standards, amendments to standards and interpretations are effective for annual periods beginning after 1 July 2017 and have not been applied in preparing these consolidated financial statements. Those which may be relevant to the Group are set out below:
(i) AASB 9 Financial Instruments (“AASB 9”)The revised standard addresses the classification, measurement and derecognition of financial assets and financial liabilities. AASB 9 also introduces the expected credit losses model which is based on the concept of providing for expected impairment losses at inception of a contract. The Group will be required to evaluate trade receivables for expected lifetime losses and new rules for hedge accounting. The application date of AASB 9 is 1 July 2018.
The Group has undertaken an initial assessment of AASB 9 and identified the following:• There is no material impact on the classification and measurement requirements surrounding financial assets and liabilities• No material impact surrounding the recognition of expected credit losses on contract inception• There will be an impact surrounding hedge accounting where currently the Group recognises the cost of the option portfolio within
finance costs. Under AASB 9, the cost of hedging is recognised against the hedge item which will be revenue. At 30 June 2017, the Group does not hold any option contracts and therefore there will be no impact on the Consolidated financial statements upon transition. However, if the Group undertakes an identical hedging strategy to the current and prior year, there will be a change in the recording of the option cost as stated above.
(ii) AASB 15 Revenue from Contracts with Customers (“AASB 15”)AASB 15 will require the Group to identify deliverables in contracts with customers that qualify as “performance obligations”. The transaction price receivable from customers must be allocated between the Group’s performance obligations under the contracts on a relative standalone sell in price basis. The standard will also require additional disclosures for disaggregation of revenue, information about performance obligations, remaining performance obligations and other qualitative disclosures.
The Group has formed a project team to undertake this review where a project plan has been defined with a scope to review the impact of AASB 15 on the Group. This plan incorporates a review of contracts for both existing WiseTech customers and from acquisitions.
To date, the Group has focused its review on revenue generated from WiseTech Global’s existing operations as these comprise the material revenue streams of the Group’s results. A further review will be undertaken in relation to revenue recognition from its newly acquired businesses to determine if there is any impact under AASB 15.
It is expected that the Group will adopt AASB 15 on 1 July 2018.
(iii) AASB 16 Leases (“AASB 16”)AASB 16 removes the classification of leases as either operating or finance lease – for the lessee – effectively treating all leases as finance leases. Short-term leases (less than 12 months) and leases of low-value assets (such as personal computers) are exempt from the lease accounting requirements. There are also changes in accounting over the life of a lease. In particular, companies will now recognise a front-loaded pattern of expense for most leases, even when they pay constant annual rentals. The standard will be effective from 1 July 2019.
In FY18, the Group will undertake a review of the impact on this standard. Information of the undiscounted amount of the Group’s operating lease commitments under AASB 117 Leases, the current leasing standard, is disclosed in note 27. The composition of this balance largely relates to the Group’s rental premises.
30. Other disclosures (continued)
(e) Measurement of fair values (continued)
WiseTech Global | annual report 2017 85

Notes to the financial statementsfor the year ended 30 June 2017
30. Other disclosures (continued)
(g) Events after reporting periodOn 1 August 2017, WiseTech Global Limited completed the acquisition of a 100% interest in Bysoft Solucoes em Sistemas Para Comercio Exterior Ltda (“Bysoft”), the largest provider of customs and logistics compliance solutions to the logistics industry across Brazil. The Company paid $13.1m (BRL 30m) on completion, with a potential earnout payment for future revenue growth. The total purchase cost will be 3.8x 2018 Bysoft revenue. With current annual revenue of approximately $3.4m (BRL 8.7m) and approximately break even net profit after tax, this transaction is not material to the Group. The acquisition is expected to bring to the Group, key management, specialised know-how of the workforce, employee relationships, competitive position and service offerings.
During August 2017, the Group announced and completed the acquisitions of Digerati, Prolink and CMS Transport Systems. The combined annual revenues and EBITDA for these acquisitions are approximately $7.6m and $1.0m respectively. Total upfront consideration paid was $14.4m. There is no contingent consideration for Digerati and the contingent consideration for CMS is up to $4m and for Prolink is estimated at 2.5x–3x 2021 recurring revenue.
During September 2017, the Group announced the acquisitions of two leading global rate management solution providers, Cargoguide and CargoSphere. The combined annual revenues and EBITDA for these acquisitions are approximately $6.0m and $0m. Total upfront consideration is expected to be $18.4m with earn-out potential for both, based on revenue growth to 2020. There is no other contingent consideration.
Initial accounting surrounding these acquisitions have not yet been completed.
On 18 August 2017, the Group announced to the German market its intended voluntary public acquisition offer to the remaining shareholders of Softship to purchase any and all outstanding shares. The offer made is EUR10.00 per share with 409,611 shares outstanding at the date of the offer. Concurrently, the Management Board of Softship announced their intention to apply to de-list Softship shares from the Frankfurt Stock Exchange.
Since the period end, the Directors have declared a fully franked final dividend of 1.2 cents per share, payable 4 October 2017. The dividend will be recognised in subsequent financial statements.
(h) Contingent assets and contingent liabilitiesThere were no contingent assets or liabilities that have been recognised by the Group in relation to FY17 or FY16.
86

Directors’ declarationfor the year ended 30 June 2017
1. In the opinion of the Directors WiseTech Global Limited:(a) the consolidated financial statements and notes that are set out on pages 48 to 86 and the Remuneration Report set out on pages
29 to 39 are in accordance with the Corporations Act 2001, including:
(i) giving a true and fair view of the consolidated entity’s financial position as at 30 June 2017 and of its performance for the year ended on that date; and
(ii) complying with Accounting Standards and the Corporations Regulations 2001; and
(b) there are reasonable grounds to believe that the Company will be able to pay its debts as and when they become due and payable.
2. There are reasonable grounds to believe that the Company and the group entities identified in Note 29 will be able to meet any obligations or liabilities to which they are or may become subject to by virtue of the Deed of Cross Guarantee between the Company and those group entities pursuant to ASIC Corporations (Wholly owned Companies) Instrument 2016/785.
3. The Directors have been given the declarations required by section 295A of the Corporations Act 2001 from the Chief Executive Officer and Chief Financial Officer for the financial year ended 30 June 2017.
4. The directors draw attention to Note 2 to the consolidated financial statements, which includes a statement of compliance with International Financial Reporting Standards.
Signed in accordance with a resolution of the Directors:
Charles Gibbon Chairman
Richard White Executive Director and CEO
22 September 2017 22 September 2017
87WiseTech Global | annual report 2017
Independent auditor’s reportfor the year ended 30 June 2017
KPMG, an Australian partnership and a member firm of the KPMG network of independent member firms affiliated with KPMG International Cooperative (“KPMG International”), a Swiss entity.
Liability limited by a scheme approved under Profession Standards Legislation.
Independent Auditor’s Report
To the shareholders of WiseTech Global Limited
Report on the audit of the Financial Report
Opinion
We have audited the Financial Report of WiseTech Global Limited (the Company).
In our opinion, the accompanying Financial Report of the Company is in accordance with the Corporations Act 2001, including:
• giving a true and fair view of the Group's financial position as at 30 June 2017 and of its financial performance for the year ended on that date; and
• complying with Australian Accounting Standards and the Corporations Regulations 2001.
The Financial Report comprises:
• Consolidated statement of financial position as at 30 June 2017
• Consolidated statement of profit or loss and other comprehensive income, Consolidated statement of changes in equity, and Consolidated statement of cash flows for the year then ended
• Notes including a summary of significant accounting policies
• Directors' Declaration.
The Group consists of the Company and the entities it controlled at the year end or from time to time during the financial year.
Basis for opinion
We conducted our audit in accordance with Australian Auditing Standards. We believe that the audit evidence we have obtained is sufficient and appropriate to provide a basis for our opinion.
Our responsibilities under those standards are further described in the Auditor’s responsibilities for the audit of the Financial Report section of our report.
We are independent of the Group in accordance with the Corporations Act 2001 and the ethical requirements of the Accounting Professional and Ethical Standards Board’s APES 110 Code of Ethics for Professional Accountants (the Code) that are relevant to our audit of the Financial Report in Australia. We have fulfilled our other ethical responsibilities in accordance with the Code.
88

Independent auditor’s reportfor the year ended 30 June 2017
Key Audit Matters
Key Audit Matters are those matters that, in our professional judgment, were of most significance in our audit of the Financial Report of the current period.
These matters were addressed in the context of our audit of the Financial Report as a whole, and in forming our opinion thereon, and we do not provide a separate opinion on these matters.
The Key Audit Matters we identified are:
• Capitalisation of software development costs; and
• Acquisition accounting for Softship AG.
Capitalisation of software development costs
Refer to Note 8: Computer software ($33.1m) and Development costs (WIP) ($31.8m).
The key audit matter How the matter was addressed in our audit
Capitalisation of software development costs is a key audit matter due to the greater audit effort arising from:
• the high volume of software developer hours to be considered across multiple projects;
• there are a number of different sources key inputs are obtained from and manually collated;
• Defined processes and controls are in place and operating, however are largely undocumented;
• the high level of judgement required by us in assessing the Group’s determination of allowable software development costs against the subjective criteria in the accounting standards. We focused on the following key judgements:
– project by project assessment of when the ‘research’ phase has been completed and ‘development’ commences, allowing costs to be capitalised;
– whether a project can be completed and produce a viable software product;
– whether tasks/time are eligible for
Our procedures included:
• testing a statistical sample of developer time capitalised, to check the task being performed was related to a project in development or an enhancement to an existing software product, as opposed to research or maintenance;
• performing data analytic routines on developer time capitalised, analysing a number of qualitative and quantitative factors to identify unusual trends or anomalies. Where exceptions were identified, we performed additional testing to challenge the capitalisation of time to projects including:
- evaluating task descriptions logged against the criteria in the accounting standards;
- inspecting role identification in employee contracts for development related positions and developer allocation listings;
- corroborating task nature with project managers.
• assessing the rate per hour calculations applied to time eligible for capitalisation. This included testing a sample of key inputs, such as salary rates, leave entitlements and share based payments to signed employee contracts. We also assessed the Group’s allocation of directly attributable overhead
89WiseTech Global | annual report 2017
Independent auditor’s reportfor the year ended 30 June 2017
capitalisation;
– the assessment of an appropriate rate per hour for developers’ time eligible for capitalisation. This included inputs such as salaries, on-costs and an allocation of directly attributable overhead costs;
– assessing when a project is ‘available for its intended use’ and, accordingly, commence amortisation of costs capitalised.
costs against the criteria within the accounting standards;
• inspecting the Group’s documentation on the status of projects (research, development or available for its intended use) and the evaluation of the future economic return of the software under development. We challenged the Group’s positions using our knowledge of the business and projects from discussions with various stakeholders, including: project managers, chief IT architects, head of sales, the chief executive officer and the chief financial officer. We also inspected price lists, development partner contracts and Board of Director’s papers to corroborate these assertions.
Acquisition accounting for Softship AG
Refer to Note 20: Goodwill ($7.0m) and Non-controlling interest ($4.0m).
The key audit matter How the matter was addressed in our audit
The acquisition accounting for Softship AG is a key audit matter due to the size of the acquisition and the level of judgement required by us in respect to assessing the Group’s:
• determination that control was obtained on 1 July 2016;
• estimate of the fair value of the group’s pre-existing19.99% ownership interest on the date of acquisition;
• identification of acquired intangible assets, such as customer contracts, software and brand name;
• key assumptions and estimates used when performing the intangible asset valuations, including estimated future cash flows, growth rates, discount rates and useful economic lives applied. The Group engaged an independent valuation specialist to assist with this intangible asset valuation.
• fair value adjustments to net tangible
Our procedures included:
• inspecting and evaluating documentation underlying the Group’s assessment of control of Softship AG against the criteria in the accounting standards;
• assessing the Group’s estimate of the fair value of the pre-existing 19.99% ownership interest on the date of acquisition by comparing it to the available market price;
• assessing the scope, objectivity and competency of the Group’s external intangible asset valuations specialist;
• working with our valuation specialists, we challenged the Group’s valuation of identifiable intangible assets by:
• evaluating the Group’s assessment of identified intangible assets, using due diligence information and information from similar business combinations;
• evaluating the Group’s earnings and growth forecasts by comparing the forecasted data to the Board approved budget, the past performance of the
90
Independent auditor’s reportfor the year ended 30 June 2017
assets acquired. acquired business, due diligence information and our knowledge of the industry trends.
• evaluating the Group’s fair value accounting adjustments to the net tangible assets acquired by checking these to due diligence information, local management, board papers, and subsequent transactions.
Other Information
Other Information is financial and non-financial information in WiseTech Global Limited’s annual reporting which is provided in addition to the Financial Report and the Auditor’s Report. The Directors are responsible for the Other Information.
Our opinion on the Financial Report does not cover the Other Information and, accordingly, we do not express an audit opinion or any form of assurance conclusion thereon, with the exception of the Remuneration Report and our related assurance opinions.
In connection with our audit of the Financial Report, our responsibility is to read the Other Information. In doing so, we consider whether the Other Information is materially inconsistent with the Financial Report or our knowledge obtained in the audit, or otherwise appears to be materially misstated.
We are required to report if we conclude that there is a material misstatement of this Other Information, and based on the work we have performed on the Other Information that we obtained prior to the date of this Auditor’s Report we have nothing to report.
Responsibilities of Directors for the Financial Report
The Directors are responsible for:
• preparing the Financial Report that gives a true and fair view in accordance with Australian Accounting Standards and the Corporations Act 2001;
• implementing necessary internal control to enable the preparation of a Financial Report that gives a true and fair view and is free from material misstatement, whether due to fraud or error; and
• assessing the Group’s ability to continue as a going concern. This includes disclosing, as applicable, matters related to going concern and using the going concern basis of accounting unless they either intend to liquidate the Group or to cease operations, or have no realistic alternative but to do so.
91WiseTech Global | annual report 2017
Independent auditor’s reportfor the year ended 30 June 2017
Auditor’s responsibilities for the audit of the Financial Report
Our objective is:
• to obtain reasonable assurance about whether the Financial Report as a whole is free from material misstatement, whether due to fraud or error; and
• to issue an Auditor’s Report that includes our opinion.
Reasonable assurance is a high level of assurance, but is not a guarantee that an audit conducted in accordance with Australian Auditing Standards will always detect a material misstatement when it exists.
Misstatements can arise from fraud or error. They are considered material if, individually or in the aggregate, they could reasonably be expected to influence the economic decisions of users taken on the basis of this Financial Report.
A further description of our responsibilities for the Audit of the Financial Report is located at the Auditing and Assurance Standards Board website at: http://www.auasb.gov.au/auditors_files/ar2.pdf. This description forms part of our Auditor’s Report.
Report on the Remuneration Report
Opinion
In our opinion, the Remuneration Report of WiseTech Global Limited for the year ended 30 June 2017, complies with Section 300A of the Corporations Act 2001.
Director’s responsibilities
The Directors of the Company are responsible for the preparation and presentation of the Remuneration Report in accordance with Section 300A of the Corporations Act 2001.
Our responsibilities
We have audited the Remuneration Report included in pages 29 to 39 of the Financial Report for the year ended 30 June 2017.
Our responsibility is to express an opinion on the Remuneration Report, based on our Audit conducted in accordance with Australian Auditing Standards.
KPMG
Chris Hollis Partner Sydney 22 September 2017
92

Reconciliation of statutory revenue and NPAT to pro forma revenue and NPAT
Certain financial measures for FY13 to FY16 are provided on a pro forma basis in this annual report. The following table reconciles the statutory reported revenue and NPAT to pro forma revenue and NPAT using pro forma adjustments consistent with those presented in the Prospectus for the IPO.
$m Note FY13 FY14 FY15 FY16
Statutory revenue 43.0 56.7 70.0 102.8Net impact of acquisitions 1 8.9 9.3 9.6 0.5Pro forma revenue 51.9 66.0 79.6 103.3
Statutory NPAT 3.7 10.1 10.1 2.2Net impact of acquisitions 1 1.3 1.7 1.5 0.5Acquisition transaction costs 2 – – 0.5 0.5Incremental public company costs 3 (2.6) (2.6) (2.6) (1.8)Offer costs 4 – – 0.3 6.7Net finance costs 5 0.4 0.3 0.4 0.8Employee incentive scheme close out 6 – – – 4.4Commission scheme close out 7 – – – 6.2Tax impact of pro forma adjustments 8 0.3 0.3 0.2 (5.3)Pro forma NPAT 3.1 9.8 10.4 14.2
1. Represents the pro forma impact of acquisitions as presented in the Prospectus and adjustments for FY16 to remove the impact of CCN for May and June 2016
2. Represents costs associated with acquisitions completed in the respective period
3. Includes a full year of estimated costs of being a public company
4. Adds back the costs associated with the IPO, including the foreign currency option cost of $0.6m
5. Removes historical finance costs on bank debt, borrowings having been repaid as part of the IPO
6. Adds back the costs associated with the close out of legacy employee incentive arrangements as part of the IPO
7. Adds back the costs associated with the close out of legacy sales commission scheme as part of the IPO
8. Adjusts the tax impact of the pro forma adjustments
93WiseTech Global | annual report 2017
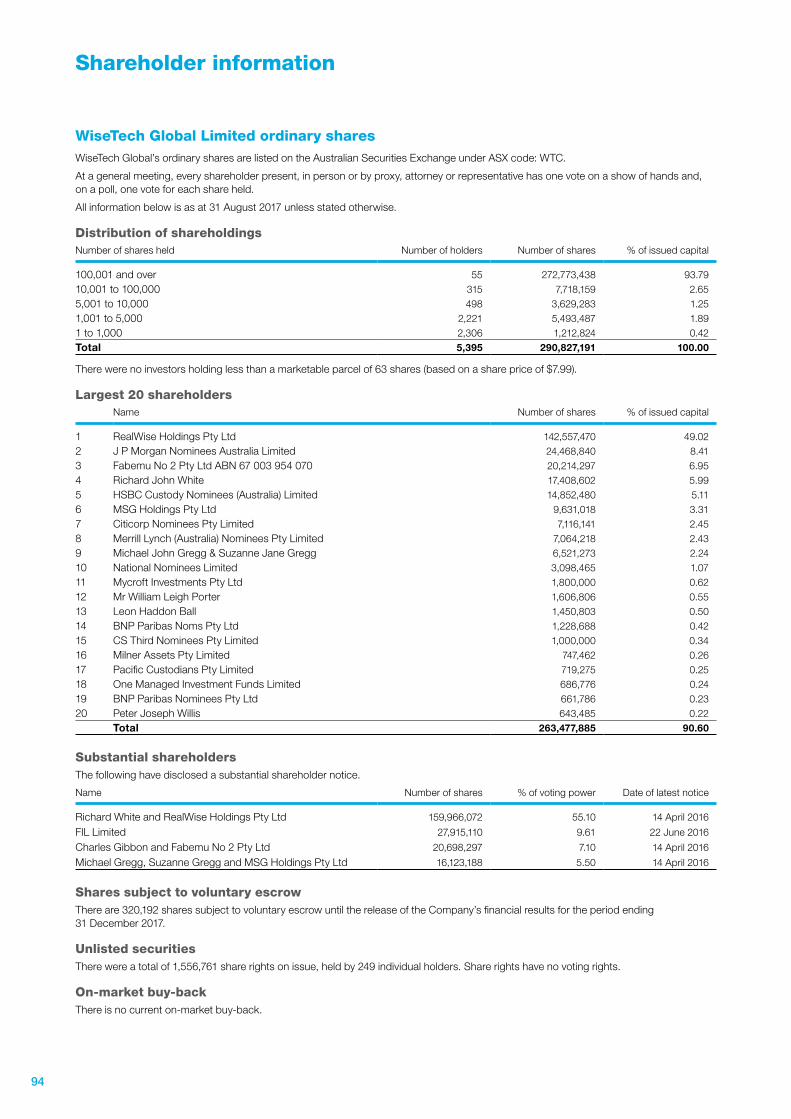
Shareholder information
WiseTech Global Limited ordinary sharesWiseTech Global’s ordinary shares are listed on the Australian Securities Exchange under ASX code: WTC.
At a general meeting, every shareholder present, in person or by proxy, attorney or representative has one vote on a show of hands and, on a poll, one vote for each share held.
All information below is as at 31 August 2017 unless stated otherwise.
Distribution of shareholdingsNumber of shares held Number of holders Number of shares % of issued capital
100,001 and over 55 272,773,438 93.7910,001 to 100,000 315 7,718,159 2.655,001 to 10,000 498 3,629,283 1.251,001 to 5,000 2,221 5,493,487 1.891 to 1,000 2,306 1,212,824 0.42Total 5,395 290,827,191 100.00
There were no investors holding less than a marketable parcel of 63 shares (based on a share price of $7.99).
Largest 20 shareholdersName Number of shares % of issued capital
1 RealWise Holdings Pty Ltd 142,557,470 49.022 J P Morgan Nominees Australia Limited 24,468,840 8.413 Fabemu No 2 Pty Ltd ABN 67 003 954 070 20,214,297 6.954 Richard John White 17,408,602 5.995 HSBC Custody Nominees (Australia) Limited 14,852,480 5.116 MSG Holdings Pty Ltd 9,631,018 3.317 Citicorp Nominees Pty Limited 7,116,141 2.458 Merrill Lynch (Australia) Nominees Pty Limited 7,064,218 2.439 Michael John Gregg & Suzanne Jane Gregg 6,521,273 2.2410 National Nominees Limited 3,098,465 1.0711 Mycroft Investments Pty Ltd 1,800,000 0.6212 Mr William Leigh Porter 1,606,806 0.5513 Leon Haddon Ball 1,450,803 0.5014 BNP Paribas Noms Pty Ltd 1,228,688 0.4215 CS Third Nominees Pty Limited 1,000,000 0.3416 Milner Assets Pty Limited 747,462 0.2617 Pacific Custodians Pty Limited 719,275 0.2518 One Managed Investment Funds Limited 686,776 0.2419 BNP Paribas Nominees Pty Ltd 661,786 0.2320 Peter Joseph Willis 643,485 0.22
Total 263,477,885 90.60
Substantial shareholdersThe following have disclosed a substantial shareholder notice.
Name Number of shares % of voting power Date of latest notice
Richard White and RealWise Holdings Pty Ltd 159,966,072 55.10 14 April 2016
FIL Limited 27,915,110 9.61 22 June 2016
Charles Gibbon and Fabemu No 2 Pty Ltd 20,698,297 7.10 14 April 2016
Michael Gregg, Suzanne Gregg and MSG Holdings Pty Ltd 16,123,188 5.50 14 April 2016
Shares subject to voluntary escrowThere are 320,192 shares subject to voluntary escrow until the release of the Company’s financial results for the period ending 31 December 2017.
Unlisted securitiesThere were a total of 1,556,761 share rights on issue, held by 249 individual holders. Share rights have no voting rights.
On-market buy-backThere is no current on-market buy-back.
94

Glossary
Term Meaning
ACO ACO Informatica S.r.l., an Italian provider of customs compliance solutions
ASX Australian Securities Exchange
Attrition rate Annual attrition rate is a customer attrition measurement relating to the CargoWise One application suite (excluding any customers on acquired legacy platforms). A customer’s users are included in the customer attrition calculation upon leaving, i.e. having not used the product for at least four months
Bysoft Bysoft Solucoes em Sistemas Para Comercio Exterior Ltda, a Brazilian provider of customs and logistics compliance solutions
CAGR Compound annual growth rate
Cargoguide Cargoguide International B.V., a leading global air freight rate management provider
CargoSphere Planet Traders Inc. (trading as CargoSphere), a leading global ocean freight rate management provider
CargoWise One Our flagship logistics execution software application suite which comprises our current generation software product known as CargoWise One, and our software it was developed from, ediEnterprise, which is still in use by some customers
CMS CMS Transport Systems Pty Ltd, a leading provider of road transport and logistics management systems
Company WiseTech Global Limited
Digerati A leading provider of tariff research and compliance tools utilised by the Australasian customs broking community
EBITDA Earnings before interest, tax depreciation and amortisation
FYXX Financial year ended/ending 30 June 20XX
GLOW GLOW is a set of software extensions to CargoWise One that will allow product managers, business analysts and customers to build on and extend the functionality of our platform without knowledge of software programming
IPO Initial Public Offering of shares in the Company completed on 14 April 2016
MUL Module user licence
NPAT Net profit after tax
On-Demand On-demand licensing includes MUL and STL
OTL One Time Licence
PAVE “Productivity, Acceleration and Visualisation Engine” is an innovative workflow management tool
Prolink A leading provider of customs and forwarding solutions across Taiwan and China
Recurring revenue Recurring revenue is the sum of revenue categorised as On-Demand and OTL maintenance revenue which is categorised in our statutory financial statements as recurring monthly and recurring annual software usage revenue
Softship Softship AG, a German provider of logistics software solutions to the global ocean-carrier industry
STL Seat plus Transaction Licence
Total R&D The total amount spent on development of our software platform. This amount is the sum of product design and development expenses, less depreciation and amortisation included in this expense category, plus capitalised development expenditure and software licences
Universal Customs Engine Our self-developed software, designed to more efficiently deliver complex, multi-year customs localisation projects
znet znet group GmbH, a German provider of customs solutions
95WiseTech Global | annual report 2017
Corporate directory
Shareholder enquiries
Enquiries about shareholdings in WiseTechPlease direct all correspondence to WiseTech’s share registry:
Link Market ServicesLevel 12, 680 George Street Sydney NSW 2000
Telephone: 1300 554 474
Email: [email protected]
Website: www.linkmarketservices.com.au
Further information about WiseTech
Websitewww.wisetechglobal.com/investors
Investor relationsEmail: [email protected]
Telephone: +61 (0)2 8001 2200
Registered officeUnit 3a, 72 O’Riordan Street Alexandria NSW 2015
Telephone: +61 (0)2 8001 2200
Company SecretaryEmail: [email protected]
Telephone: +61 (0)2 8001 2200
Auditor
KPMGLevel 38, Tower Three International Towers Sydney 300 Barangaroo Avenue Sydney NSW 2000
Telephone: +61 (0)2 9335 7000
96


www.wisetechglobal.com/investors