changing global scenario & new opportunities for the trade
TRANSCRIPT

Changing global scenario & new
opportunities for the trade fair
industry
AEFI Conference,
Nov. 2013
By Sonia Thomas,
UFI Director of
Operations
ⓒ UFI 2013

UFI is the Global Association of the Exhibition
Industry, uniting the industry’s organizers, venues,
associations and partners of the industry
What is UFI?
2 ⓒ UFI 2013

UFI Impact
• 4,500 Exhibitions organised or hosted by UFI
members
• Presence of UFI members in 85 countries
including the 40 largest countries in terms of
GDP
3 UFI Offices
Headquarters in Paris,
Regional Office Asia/Pacific in Hong Kong
Regional Office in Middle East/Africa in Sharjah
3 ⓒ UFI 2013

UFI membership
today
637 members
in 85 countries
206 members with
“venue” activity
(32,3%)
458 members with
“organizer” activity (71,9%)
50 “Associations”
(7.9%)
48 “Partners of
the Industry” (7.5%)
81 “Venues
only” (12.7%)
125 “Venue
& Organizer”
(19,6%)
333 “Organizer
only” (52,3%)
936 approved events

How the industry is
changing in size
Changing global scenario
ⓒ UFI 2013

Venues and Indoor
Exhibition Space in 2011
496 venues
15.6 million sqm
(48%)
184 venues
6.6 million sqm
(20%)
389 venues
7.9 million sqm
(24%)
70 venues
1.3 million sqm
(4%) 33 venues
0.8 million sqm
(2%) 25 venues
0.5 million sqm
(2%)
5 million sqm
Scale
7 ⓒ UFI 2013

TOTAL (in sqm) WORLD %
USA 6 712 342 21%
China 4 755 102 15%
Germany 3 377 821 10%
Italy 2 227 304 7%
France 2 094 554 6%
Spain 1 548 057 5%
The Netherlands 960 530 3%
Brazil 701 882 2%
United Kingdom 701 857 2%
Canada 684 175 2%
Russia 566 777 2%
Switzerland 500 570 2%
Belgium 448 265 1%
Turkey 433 904 1%
Mexico 431 761 1%
15 countries
account for 80%
of the global indoor
exhibition space
National indoor exhibition space available in 2011 (Venues with a minimum of 5,000 sqm indoor exhibition space)
UFI World Map of
Exhibition Venues
ⓒ UFI 2013
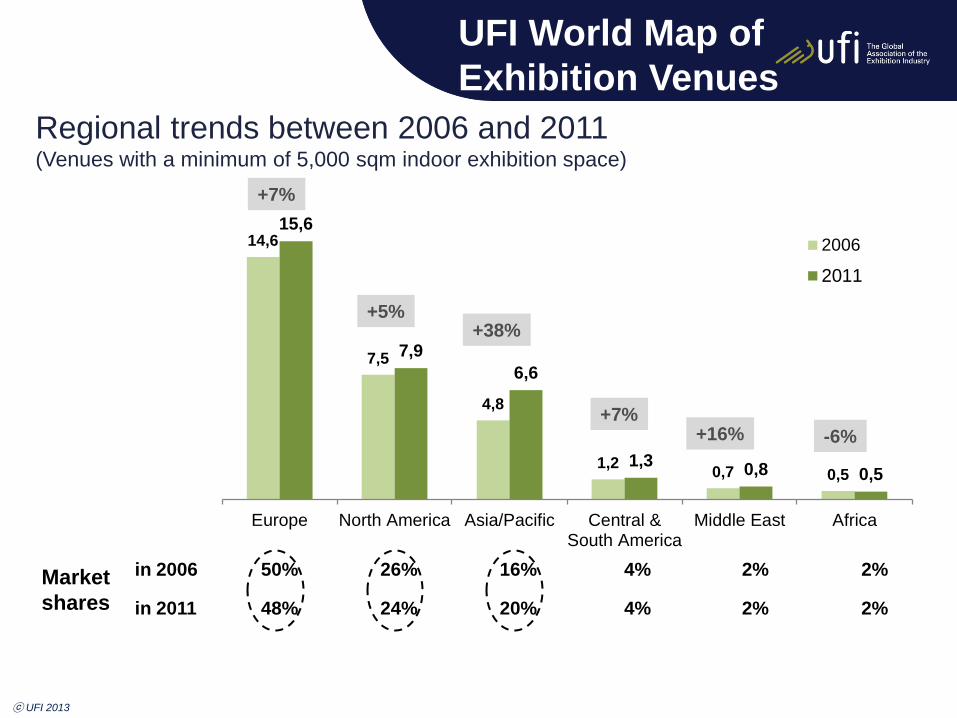
14,6
7,5
4,8
1,20,7 0,5
15,6
7,9
6,6
1,30,8 0,5
Europe North America Asia/Pacific Central &South America
Middle East Africa
2006
2011
Regional trends between 2006 and 2011 (Venues with a minimum of 5,000 sqm indoor exhibition space)
+7%
+5% +38%
+7% +16% -6%
in 2006 50% 26% 16% 4% 2% 2%
in 2011 48% 24% 20% 4% 2% 2%
Market
shares
ⓒ UFI 2013
UFI World Map of
Exhibition Venues

Change in net space
rented between 2008
and 2011 (in million net sqm) Trend since 2008
1. USA 23,3 (*) - 7%
2. China 13,0 + 13%
3. Germany 8,8 - 5%
4. Italy 6,2 - 5%
5. France 5,4 - 8%
6. Spain 3,5 - 24%
7. Japan 3,2 - 3%
8. UK 2,8 - 6%
9. Russia 2,6 - 13%
10.Brazil 2,6 + 4%
The Global Top 10
ⓒ UFI 2013
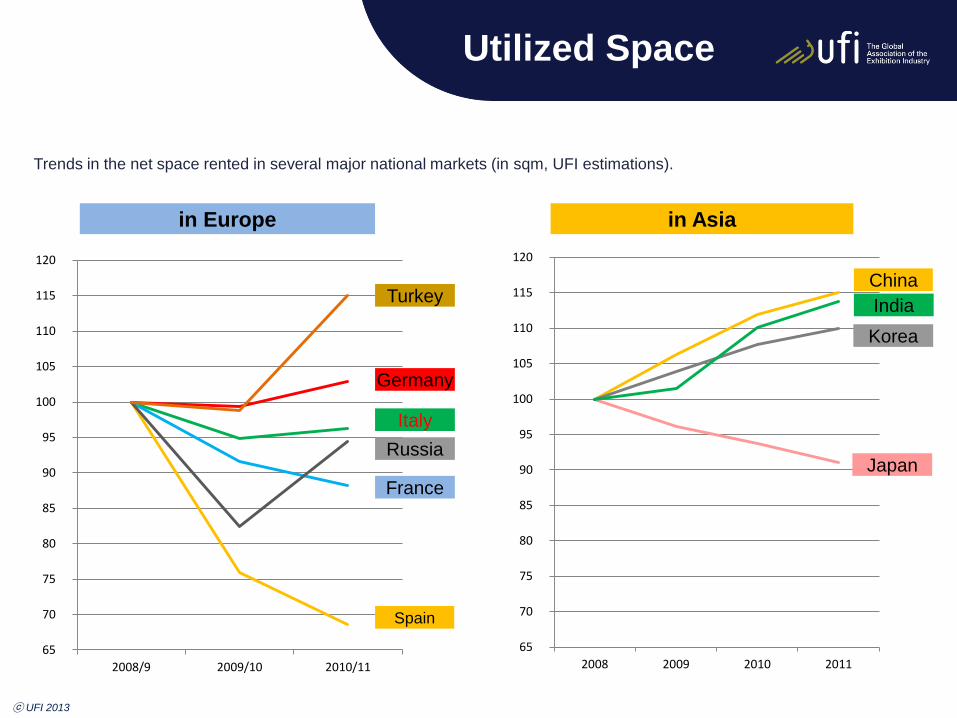
65
70
75
80
85
90
95
100
105
110
115
120
2008 2009 2010 2011 65
70
75
80
85
90
95
100
105
110
115
120
2008/9 2009/10 2010/11
in Europe in Asia
China
India
Japan
Germany
Spain
Italy
France
Turkey
Russia
Korea
Trends in the net space rented in several major national markets (in sqm, UFI estimations).
Utilized Space
ⓒ UFI 2013

What about Asia?
What about Asia?
11 ⓒ UFI 2013

Growth in Asia continues
13.000.000
13.500.000
14.000.000
14.500.000
15.000.000
15.500.000
16.000.000
16.500.000
2008 2009 2010 2011 2012
Es
tim
ate
d a
nn
ua
l s
ize
in
m2
12 ⓒ UFI 2013
What about Asia?
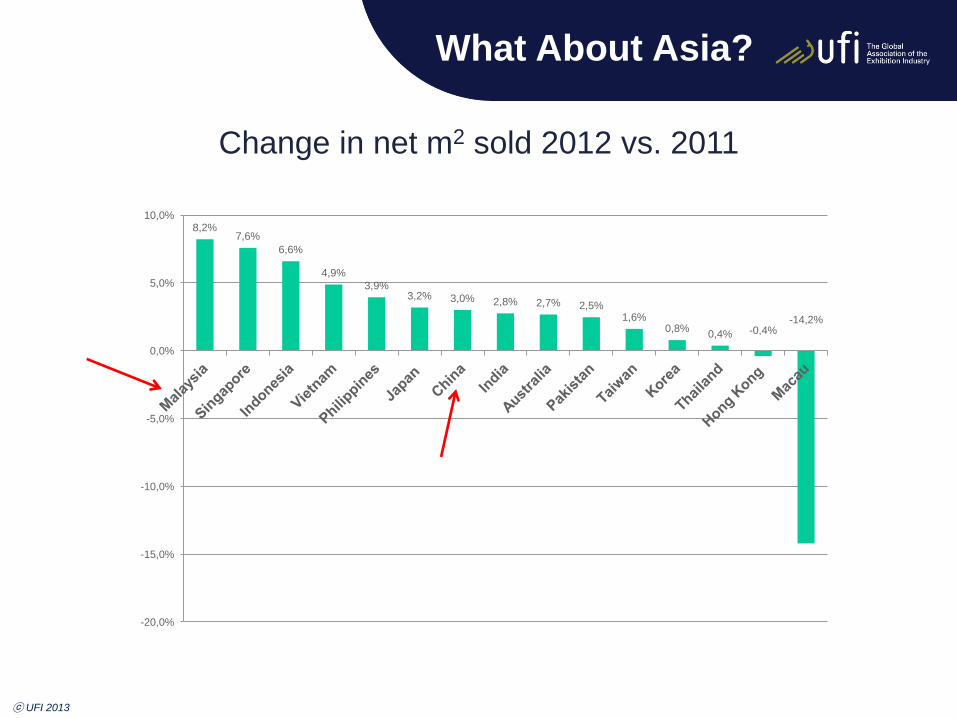
8,2% 7,6%
6,6%
4,9%
3,9% 3,2% 3,0% 2,8% 2,7% 2,5%
1,6% 0,8%
0,4% -0,4% -14,2%
-20,0%
-15,0%
-10,0%
-5,0%
0,0%
5,0%
10,0%
Change in net m2 sold 2012 vs. 2011
ⓒ UFI 2013
What About Asia?

Share of revenues, 2012
ⓒ UFI 2013
What about Asia?
China, 35%
Japan, 22% Hong Kong, 9%
Australia, 6%
Korea, 6%
India, 4%
Taiwan, 4%
Singapore, 4%
Thailand, 4%
Malaysia, 3%
Indonesia, 1% Vietnam, 1%
Philippines, 1%
Pakistan, 0%
Macau, 0%

Effects of the economic crisis
Highlights from the UFI
Global barometer
Effects of the
economic crisis
ⓒ UFI 2013

0%
20%
40%
60%
80%
100%
2009 2010 2011 2012 2013
Operating profits compared to the previous year
Americas Europe Asia & Pacific Middle East & Africa
% of companies declaring stable
profits (between -10% and +10%)
or increases of more than 10%
% of companies declaring profit
increases of more than 10%
ⓒ UFI 2013
Effects of the
economic crisis

0%
25%
50%
75%
100%
June2010
Dec.2010
June2011
Dec.2011
June2012
Dec.2012
June2013
% of companies declaring – over the last 7 Barometer
surveys – that the impact of the “economic crisis”
on their exhibition business is now over
Americas
Europe
Asia & Pacific
Middle East & Africa
ⓒ UFI 2013
Effects of the
economic crisis

14%
63%
15%
9%
0%
10%
44%
30%
15%
2%10%
37%42%
12%
2011 2012 2013 2014 2015 after 2015
June 2011
June 2012
June 2013
Anticipated end of the “economic crisis” as declared
in the last 3 years by those who consider that it is not yet over
ⓒ UFI 2013
Effects of the
economic crisis
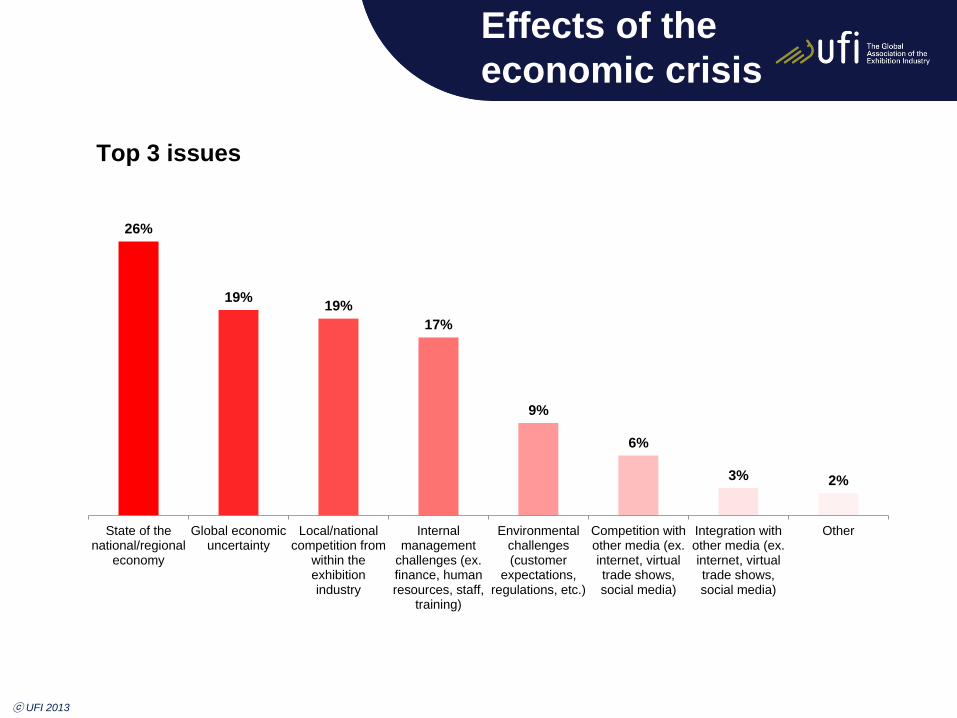
Top 3 issues
26%
19%19%
17%
9%
6%
3% 2%
State of thenational/regional
economy
Global economicuncertainty
Local/nationalcompetition from
within theexhibitionindustry
Internalmanagement
challenges (ex.finance, humanresources, staff,
training)
Environmentalchallenges(customer
expectations,regulations, etc.)
Competition withother media (ex.internet, virtualtrade shows,social media)
Integration withother media (ex.internet, virtualtrade shows,social media)
Other
ⓒ UFI 2013
Effects of the
economic crisis

13%
38%
20%
28%
25%
34%
39%
33%
38%
22%
23%
17%
25%
6%
17%
22%
25% 36% 23% 16%
Current strategic priorities related to activities
Stay within current
scope of activities (as
a venue, an organizer or
a service provider)
Develop new activities within
the classical range of the
exhibition industry (venue /
organizer / services)
Develop new activities in
terms of live events or
virtual events
ASIA &
PACIFIC
MIDDLE EAST
& AFRICA
EUROPE
AMERICAS
WORLD
Both these developments
ⓒ UFI 2013
Effects of the
economic crisis

43%
59%
42%
33%
57%
41%
58%
67%
Operate in new countries
Current strategic priorities related to geographic exposure…..
ASIA &
PACIFIC
MIDDLE EAST
& AFRICA
EUROPE
AMERICAS
WORLD 46% 54%
Stay in the same countries as
those where I currently operate
ⓒ UFI 2013
Effects of the
economic crisis

Trends in the
exhibition industry
• “Geo-cloning”: fairs that work well in certain
countries are being exported to other
destinations, usually with local partners.
• Easier as the brands etc. already exist.
• In general terms, new shows have an estimated
8 – 10% survival rate.
• This rises significantly in geo-cloned exhibitions
• Also contributes to the increase in themed
exhibitions
• Risks must be shared among the different entities
ⓒ UFI 2013

What about
sustainable development?
What about
Sustainable
Development?
ⓒ UFI 2013

Is sustainability implemented within your
company operations?
4
27
8
37
39
0% 5% 10% 15% 20% 25% 30% 35% 40% 45% 50%
Not implemented
Considered, but not in the coming year
Planned for the coming year
In limited areas
Across the organization
UFI’s SD survey
results

When did you start
implementing
sustainability?
Starting year indicated by the 65 companies who have declared either
partial or across implementation of sustainability (and provided a date / 11 additional ones did not)
1 1 2 2 2 3 3 3 4 5 7 9 12 13
17 21
25 29
33 35 36
1 1 1 2
2
2 5
7
14
18
23
26
28 29
1993 1994 1995 1996 1997 1998 1999 2000 2001 2002 2003 2004 2005 2006 2007 2008 2009 2010 2011 2012 2013
Implemented in limited areas
Implemented across the organization
UFI’s SD survey
results

What are your
recommendations
for possible actions
by UFI in the
future?
77%
58%
40%
37%
23%
14%
17%
26%
37%
42%
35%
35%
2%
5%
19%
17%
29%
34%
3%
3%
13%
16%
Promote best practices
Develop education
Organize local workshops
Support at local level (national
associations for instance)
Develop standard certification
Develop some kind of label
Very important
Possibly
Not sure
No
Covered
Ongoing
Done when
appropriate
Not
considered
UFI’s SD survey results

WHAT DOES THE FUTURE
HOLD?
WHAT DOES THE FUTURE
HOLD?

Exhibitions
remain powerful
tools
•SMEs still find exhibitions the most effective way to promote their products and services, find new clients and open up new markets
• have a strong need for new business.
• have a strong need to identify and commercialize innovations.
•Blockbuster major events continue to thrive
• Companies want to ‘wave the flag’ even in tough times.
• They become more conservative with marketing budgets.
• Safe choices are the top shows.
SMEs are the backbone of the Italian economy (account for 80%
of the GDP) but have suffered in recent years. Many economists
believe that the way out of the crisis is through SMEs…
Source: European Investment Bank/FT

Economic impact
Exhibitions business
Supporting industries (e.g. hotels,
restaurants, travel, etc.)
The industries we serve
Jobs 1 € spent (invested) to participate in
an exhibition= 5.5 to 7.2 € (minimum)
of local economic impact
(local services, travel
accommodation, taxes)
ⓒ UFI 2013
UFI is conducting a
study on economic
impact,
to be published in
2014

The look and feel of trade fairs
are changing….
Progress?

Multi-dimensional
events
Successful new-look events
Conference
Entertainment
Live-streaming Unconventional
layouts
Traditional trade show
floor
ⓒ UFI 2013

Engaging
Participants
• Personalize events
• Provide a richer experience
– Critical to attracting next generation participants
– Make event experiences more unique
– Work jointly with exhibitors, visitors and suppliers
• Engage them year round
– The community you serve is key – give them the feel of
‘ownership’
– Social media is only one element of this engagement but a
potentially powerful one
ⓒ UFI 2013

Integrating
content
• Develop “thought leadership”:
– Use the combined brain power of the whole
audience to add value by inviting customers to
participate
– Educate and entertain
– Easy to say but difficult to do
• Explore new options in digital content
– Bring in industry digitally if not in person
– 3D printing can transform what happens at your
events
ⓒ UFI 2013

Progress?
ⓒ UFI 2013

The look and feel
of events
Can we move away from the conventional floor
plan?
– More imaginative development of ‘prime’ locations (and
value-based pricing incorporating psychological pricing)
• Use ‘anchor’ exhibitors in new ways
– Move away from the grid floor plan
• IKEA options
– Cluster attendee groups into interest areas
– What alternatives?
– Freemium models for attendees:
• How to attract customers with free content without going broke in
the process?
• Everyone gets some value, but those who pay get a lot more
(LinkedIn, SurveyMonkey etc.) ⓒ UFI 2013
New pricing models
• Others?
– How to sell the space?
– Yield management models?
– Exhibition industry equivalent of “pay per click”?
– Look at how other industries have been transformed
• Smaller, more intimate events
– Can these be combined with the highly profitable ‘blockbuster’
fairs?
ⓒ UFI 2013 31

Smarter databases
are key
• They are our key assets
• How do we move beyond them being a simple, functional tool to being the heart of the communities we serve
• CRM: knowing our customers is the key to:
– successful thought leadership,
– business retention,
– Predictive marketing and hence improved sales, etc. etc. etc.
• Matchmaking facilitator
• “The random contact model is over”
• High on the agenda for 5 – 10 years • But what real progress outside travel industry events?
ⓒ UFI 2013

Matchmaking
ⓒ UFI 2013

The social media
challenge/opportunity
• May be key to managing communications
with the communities we serve
• Speed of change represents significant
management challenge
• How to staff?
• How to fund?
• Which channels to follow?
• Which media, if any, can this replace?
ⓒ UFI 2013

Mobile
•Apps at the heart of the
communication mix
•Augmented reality an interesting
tool but not a game changer
•Significant bandwidth, privacy
and commercial concerns due to
switch from PCs towards tablets
and smart phones
•Google glasses??
ⓒ UFI 2013

Tracking
Source: New York Times
ⓒ UFI 2013

Changing visitor &
exhibitor behaviour
• Understand how their demands are changing
ⓒ UFI 2013
If you are doing the same thing year on year
your customers may be someplace else by the
time you take a step back…

Selling space
• Square metres
• Complimentary services
• Catalogue entry
• Basic technical services
Service orientation
• Integrated services
• Stand building
• Catering
CRM
• Database marketing
• Target group orientation
• Bundling
• Exhibitor debit card
• Online reorder system
• Individual placement of stands
Thought leadership
• New business ideas for clients
• Inter event activities
• Information brokering
• Matchmaking
Evolution of
Trade Fairs
ⓒ UFI 2013

What about venues?
ⓒ UFI 2013
• What are the options for venues? – Need to increase revenues, decrease expenses and
increase services
• How? – Attendance and exhibit space growth
– Sales and marketing
– HR changes
– Technology
– Space repurposing
– Changing traditional service models
– Revisit policies
– Advertising and sponsorship.
– Naming rights?
– Sustainability initiatives, green buildings….

Key challenges
for exhibitions • Competition (in some markets) from over-capacity in
venues
• Online marketing and product news release – Continued uncertainties over balance of internet and face-
to-face marketing
– Media integration versus media competition…
– The industry needs better to communicate how a combination of these is the key to marketing effectiveness.
– In-house activities and product launches have eaten into traditional events spend.
– Will this be the source of tomorrow’s competition?
• Targeting the Facebook generation with real world events.
• Pressures on business travel – Cost controls
– Environmental constraints
ⓒ UFI 2013

In Summary:
• The industry is healthy and reflecting better condition
of world economy
• We face many challenges from changes in the way
people are doing business as well as growing
internal competition
• A lot of thought is going into how the industry will
change: • Our fairs will look and feel different
• We will be finding ways to ‘engage’ new and existing customers
• We will be changing long-established pricing models
• We will leverage the full range of knowledge among our
audiences to become the knowledge centres for our industry
ⓒ UFI 2013

Thank you for your
attention