changes in selected soil physical properties caused by sodicity of soil and irrigation water
TRANSCRIPT

This article was downloaded by: [University of New Mexico]On: 30 November 2014, At: 00:08Publisher: Taylor & FrancisInforma Ltd Registered in England and Wales Registered Number: 1072954 Registered office: MortimerHouse, 37-41 Mortimer Street, London W1T 3JH, UK
Acta Agriculturae Scandinavica, Section B — Soil &Plant SciencePublication details, including instructions for authors and subscription information:http://www.tandfonline.com/loi/sagb20
Changes in selected soil physical properties causedby sodicity of soil and irrigation waterN.I. Eltaif a , M.A. Gharaibeh a & Z.A. Ababneh aa Department of Natural Resources and the Environment, Faculty of Agriculture , JordanUniversity of Science and Technology , P.O. Box 3030, Irbid, 22110, JordanPublished online: 02 Feb 2011.
To cite this article: N.I. Eltaif , M.A. Gharaibeh & Z.A. Ababneh (2011) Changes in selected soil physical properties causedby sodicity of soil and irrigation water, Acta Agriculturae Scandinavica, Section B — Soil & Plant Science, 61:1, 84-91, DOI:10.1080/09064710903544193
To link to this article: http://dx.doi.org/10.1080/09064710903544193
PLEASE SCROLL DOWN FOR ARTICLE
Taylor & Francis makes every effort to ensure the accuracy of all the information (the “Content”) containedin the publications on our platform. However, Taylor & Francis, our agents, and our licensors make norepresentations or warranties whatsoever as to the accuracy, completeness, or suitability for any purpose ofthe Content. Any opinions and views expressed in this publication are the opinions and views of the authors,and are not the views of or endorsed by Taylor & Francis. The accuracy of the Content should not be reliedupon and should be independently verified with primary sources of information. Taylor and Francis shallnot be liable for any losses, actions, claims, proceedings, demands, costs, expenses, damages, and otherliabilities whatsoever or howsoever caused arising directly or indirectly in connection with, in relation to orarising out of the use of the Content.
This article may be used for research, teaching, and private study purposes. Any substantial or systematicreproduction, redistribution, reselling, loan, sub-licensing, systematic supply, or distribution in anyform to anyone is expressly forbidden. Terms & Conditions of access and use can be found at http://www.tandfonline.com/page/terms-and-conditions
ORIGINAL ARTICLE
Changes in selected soil physical properties caused by sodicity of soiland irrigation water
N.I. ELTAIF, M.A. GHARAIBEH & Z.A. ABABNEH
Department of Natural Resources and the Environment, Faculty of Agriculture, Jordan University of Science and Technology,
P.O. Box 3030, Irbid 22110, Jordan
AbstractSodic water and spring water percolated through clay, clay loam, and sandy loam (SL) soils with exchangeable sodiumpercentages (ESPs) of 0, 10, 30, and 50. Reduction in saturated hydraulic conductivity and water stable aggregates recordedat higher ESPs. At ESP :30, application of sodic and spring water to clay soil (C) reduced saturated hydraulic conductivityfrom 1.2 to 3 mm hr�1, whereas in SL soil, the values were 2.8 and 6.2 mm hr�1, respectively. Results indicated that at anyESP and water source, the highest free swelling obtained was in the C soil. This study has practical importance to themanagement of irrigation water quality with respect to soil deterioration.
Keywords: Aggregate stability, hydraulic conductivity, sodicity, swelling, water quality.
Introduction
Irrigated soils in arid and semi arid lands often
experience declining soil quality as a result of
excessive exchangeable sodium content. High levels
of sodium cause slaking of aggregates, swelling/
dispersion of clay particles and this would decrease
hydraulic conductivity through reduction of soil
aggregate stability and plugging of soil pores by
dispersed clay particles (Mace & Amrheim, 2001).
Swelling reduces the sizes of the interaggregate pore
spaces in the soil and, therefore, produces a sub-
stantial reduction in the hydraulic conductivities of
soils. Swelling is particularly important in soils that
contain expandable clay minerals and have ex-
changeable sodium percentages (ESPs) of greater
than about 15.
Soil structure and permeability are very sensitive
to the type of exchangeable ions present in irrigation
water. Frequently, the nearby water may be the only
water available to overcome the limitation of sustain-
able supplies of renewable water resources. How-
ever, different water supplies in arid and semi arid
regions may be taken into consideration as one of the
limitations that imposes using low quality of irriga-
tion water.
Shainberg and Letey (1984) reported that ESP in
agricultural soils ranged from 1 to 30. However,
sodicity may be apparent at any ESP level and
should not confine to the traditional definitions
(Sumner, 1993). The deterioration in these soils
occurs through changes in the proportions of soil
solution and exchangeable ions that lead to osmotic
and specific ion effect together with imbalances in
plant nutrition (Qadir & Schubert, 2002). However,
the ESP boundary between stable and unstable
conditions varies from one soil to another (Pratt &
Suarez, 1990). The presence of swelling clay in soils
also increases the risks of dispersion as the soil comes
into contact with irrigation waters of high sodium
adsorption ratio (SAR). Pons et al. (2000) reported
that swelling is the primary physical process asso-
ciated with high sodium concentrations in soils. The
dispersive effect of Na� as it enters the soil promotes
the development of a thick diffuse double layer
around the colloid particle. This behavior is con-
sidered in relation to the operation of van der Waals
forces, hydration forces, and osmotic repulsive forces
Correspondence: N.I. Eltaif, Department of Natural Resources and the Environment, Faculty of Agriculture, Jordan University of Science and Technology,
P.O. Box 3030, Irbid 22110, Jordan. Tel: 096227201000. Fax: 096227201078. E-mail: [email protected]
Acta Agriculturae Scandinavica Section B � Soil and Plant Science, 2011; 61: 84�91
(Received 1 September 2009; accepted 9 December 2009)
ISSN 0906-4710 print/ISSN 1651-1913 online # 2011 Taylor & Francis
DOI: 10.1080/09064710903544193
Dow
nloa
ded
by [
Uni
vers
ity o
f N
ew M
exic
o] a
t 00:
08 3
0 N
ovem
ber
2014
arising from the development of diffuse double layers
on particle surfaces (Quirk, 1986). The generated
repulsive forces are strong enough to overcome the
van der Waals attractive forces and enhance colloid
dispersivity especially in soils with significant
amounts of 2:1 minerals (Pons et al., 2000). Swelling
also is one of the most important factors affecting
soil structure and its stability as well as its effects on
soil physical status. Numerous attempts made to
develop reliable methods for determining the swel-
ling properties of soils. Kariuki and Van der Meer
(2003) reported that swelling prediction depended
on factors related to clay minerals such as plasticity
index (PI), cation exchange capacity (CEC), colloid
content, and X-ray diffraction (XRD). Classification
of swelling soils usually relates swelling potential to
PI. Seed et al. (1962) suggested classification of soils
according to their swelling potential indices: low
(0.0�1.5); moderate (1.5�5.0); and high (5.0�25.0).
Moreover, understanding the behavior of sodic soils
with application of different water sources to main-
tain acceptable soil physical properties is an impor-
tant issue that should be studied and addressed in
arid and semi-arid regions.
The present study aimed to investigate the effect
of increasing soil sodicity on some physical proper-
ties of three soils varied in their clay contents using
two sources of irrigation water.
Materials and methods
Soil samples
Soil samples of different clay contents from cropped
fields: sandy loam (SL) collected from Az-Zarqa
vicinity located 30 km north east of Amman; clay
loam (CL) collected from Ramtha vicinity located
60 km north of Amman; and clay soil (C) collected
from Noaimeh vicinity located 65 km north west
of Amman. Soils classified as Typic Xerorthents,
Xerochreptic Calciorthids, and Haploxerolls, respec-
tively (JOSCIS, 1995). Scanning electron micro-
scope (SEM) observations and XRD method were
used to identify types of clay minerals. The clay
mineralogy of studied soils is dominated by kaolinite
and vermiculite.
Surface soil samples (0�20 cm) collected from
random locations. Sieved through a 2 mm opening
sieve and kept in plastic jars for analysis. Selected soil
physiochemical properties were determined using
standard methods of soil analysis: particle size
analysis using the pipette method as described by
Gee and Bauder (1986), and bulk density using the
clod method as described by Blake and Hartge
(1986). Soil pH measured in saturated paste extract
as described by McLean (1982), CEC as described by
Palemio and Rhoades (1977), ESP using ammonium
acetate method (Thomas, 1982), soil organic carbon
(SOC) using Walkley�Black methods as described by
Nelson and Sommers (1982), and electrical conduc-
tivity (EC) measured in saturated paste extract as
described by Rhoades (1982). Soil physical and
chemical properties are shown in Table I.
Treatment of Na � soil samples
Three lots of each soil were treated with sodium
bicarbonate (NaHCO3) solutions to obtain ESP’s
equivalent to 10, 30, and 50. The adopted procedure
was similar to that of Bains and Fireman (1964).
Each soil was spread in layers of 10 mm thick on a
polyethylene sheet and the proper amount of sodium
bicarbonate solution sprayed by means of special
sprayer. The treated soil covered for 2 days with
another polyethylene sheet to reduce evaporation
and to provide time for sodium bicarbonate solu-
tions to reach equilibrium with treated soils. Con-
trols treated with distilled water using the same
procedure. All treated soils mixed manually, allowed
drying slowly for several days with 3�4 mixings a day.
Table I. Selected physical and chemical properties of clay (C), clay loam (CL), and sandy loam (SL) used in study.
Texture
Property C CL SL
Sand (%) 28.0 44.7 74.5
Silt (%) 19.3 18.5 11.9
Clay (%) 52.7 36.8 13.6
OC (%) 0.80 0.81 1.59
CEC (cmole(�) kg�1) 30.62 27.21 11.80
BD (Mg m�3) 1.23 1.32 1.45
pH 8.13 8.12 8.08
EC (dS m�1) 0.36 0.63 0.95
Main clay mineral Vermiculite Vermiculite and kaolinite Vermiculite and kaolinite
Note: EC, electrical conductivity; BD, bulk density; CEC, cation exchange capacity; OC, organic carbon. (Average of three replications).
Changes in selected soil physical properties 85
Dow
nloa
ded
by [
Uni
vers
ity o
f N
ew M
exic
o] a
t 00:
08 3
0 N
ovem
ber
2014
The EC and pH of targeted and obtained ESPs of
treated soils presented in Table II.
Chemical analysis of the two irrigation sources,
namely; sodic and spring water is presented in Table III.
Hydraulic conductivity test
Treated soil samples with ESP of 0, 10, 30, and 50
packed in Plexi-glass columns (5 cm ID and 8 cm
length). Two sources of irrigation water percolated
through soil columns at constant hydraulic head and
the flow rates were then measured. Hydraulic con-
ductivity (HC) at steady state is:
HCs�Q
ADt
L
(H2 � H1)
HCs is basic saturated hydraulic conductivity, Q is
the volume of the water that flows through the sample
of cross section area A in time Dt, and (H2�H1) is the
hydraulic head difference imposed across sample
length L.
Aggregate stability test
Aggregate size distribution of treated soils performed
using a wet-sieving method. Approximately, 40 g of
1�2 mm aggregates saturated slowly by capillarity
and placed on a 0.25 mm opening sieve using wet-
sieving apparatus (Kemper & Rosenau, 1986).
Samples immersed in water, raised and lowered
through a 1 cm vertical distance at 30 cycles per
minute for 5 minutes. Stable aggregate mass (SA)
calculated by measuring the oven-dried materials
remaining on the sieve after oscillation (Beare &
Bruce, 1993). The fraction remained on the 0.25
mm sieve immersed in NaOH solution to disperse
the soil particles and then oven dried at 1058C, and
reweighed to obtain sand mass (SM).
Water stable aggregates percentage (WSA) is
calculated as follows:
WSA��
(SA � SM)
(SOM � SM)
��100
WSA is the percentage of water stable aggregate
in the soil, SA is the stable aggregate mass in g,
SM is the sand mass in g, and SOM is soil original
mass in g.
Swelling test
Soil swelling is a term generally applied to the ability
of a soil to undergo large changes in volume due to
increased moisture content. Essentially, the swelling
indices predict whether sodium-induced dispersion
or salinity-induced flocculation will more greatly
affect soil physical properties. Several swelling po-
tential indices used to estimate the swelling potential
(Kariuki & Van der Meer, 2003). An empirical
model by Nayak and Christensen (1974) was applied
to evaluate the swelling potential in treated soils.
os�0:0761548 �Ip �C=wn�0:222854
os is the free swelling magnitude, Ip is the PI, C is the
clay content, and wn is the natural water content.
The PI defined as the numerical difference be-
tween the plastic limit and liquid limit of soil, and it
is an indirect index for free swelling.
The plastic limit is that moisture content of a soil
at which it becomes too dry to be plastic. Approxi-
mately 20 g of soil paste was prepared and a thread
of about 3 mm thickness was rolled uniformly with
equal pressure and then the moisture content was
determined. The liquid limit of a soil can be
Table II. Selected chemical properties of treated clay (C), clay loam (CL), and sandy loam (SL) soils at 0, 10, 30, and 50 exchangeable
sodium percentages (ESP).
Texture EC (dS m�1) pH ESPm SAR ET* (dS m�1) EC�ET
** (dS m�1)
C 0 0.36 8.13 0.90 0.6 0.09 �0.27
10 0.50 8.88 9.20 6.1 0.40 �0.10
30 0.75 9.80 22.9 15.1 0.91 �0.16
50 1.10 10.50 46.20 30.5 1.77 �0.67
CL
/ ES
P
0 0.63 8.12 0.50 0.3 0.08 �0.55
10 0.71 8.85 10.0 6.6 0.43 �0.28
30 1.0 9.65 34.2 22.6 1.32 �0.32
50 1.38 10.1 49.6 32.7 1.89 �0.51
SL 0 0.95 8.08 0.70 0.5 0.09 �0.86
10 1.20 8.70 9.60 6.3 0.41 �0.79
30 1.60 9.20 27.90 18.4 1.09 �0.51
50 1.82 9.9 47.7 31.5 1.82 0.00
Note: EC, electrical conductivity; ESPm, measured exchangeable sodium percentage; SAR, sodium adsorption ratio; ET* , minimum level of
electrolyte required to maintain the soil in permeable conditions in dS m�1. ET�0.056 SAR�0.06 (Quirk, 1986); EC�ET**, surplus of salts
in the minimum level of electrolyte concentration. (Average of three replications).
86 N.I. Eltaif et al.
Dow
nloa
ded
by [
Uni
vers
ity o
f N
ew M
exic
o] a
t 00:
08 3
0 N
ovem
ber
2014
measured by the liquid limit apparatus; in which soil
samples of about 40 g were seated in the dish, mixed
with the different irrigation waters and soil in the cup
divided with a grooving tool, then the cup lifted and
dropped by turning the crank at a rate of approxi-
mately two revolutions per second until the two
halves of the soil pat come together along a distance
of about 13 mm. The moisture content at the
intersection of the flow curve and the 25 hits line is
the liquid limit (Guarnieri et al., 2005).
The experiment was conducted using completely
randomized design (CRD). Each treatment was
replicated three times. Significance was tested using
one-way ANOVA between treatments with subse-
quent mean separation by student’s least significant
difference (LSD) test using the John Macintosh
Product (JMP) 5.1.2 (SAS 2003) program.
Results and discussion
A detailed analysis of the effects of soil sodicity
expressed by ESP on HCs with respect to water
source indicated that HCs for each soil decreased
linearly with increasing soil sodicity. McIntyre
(1979) noticed that the decrease in HC associated
with an increase in the ESP, and the decrease in the
total electrolyte concentration of soil solution.
A regression analysis of the effects of ESP on soil
HCs showed a linear decrease with increasing soil
sodicity (Table V). It is clear that ESP significantly
decreased HCs in all treated samples for both
irrigation water sources. The rate of reduction in
HCs with increased sodicity depended on soil
texture and source of irrigation water.
Water source impact on hydraulic conductivity of sodic
soils
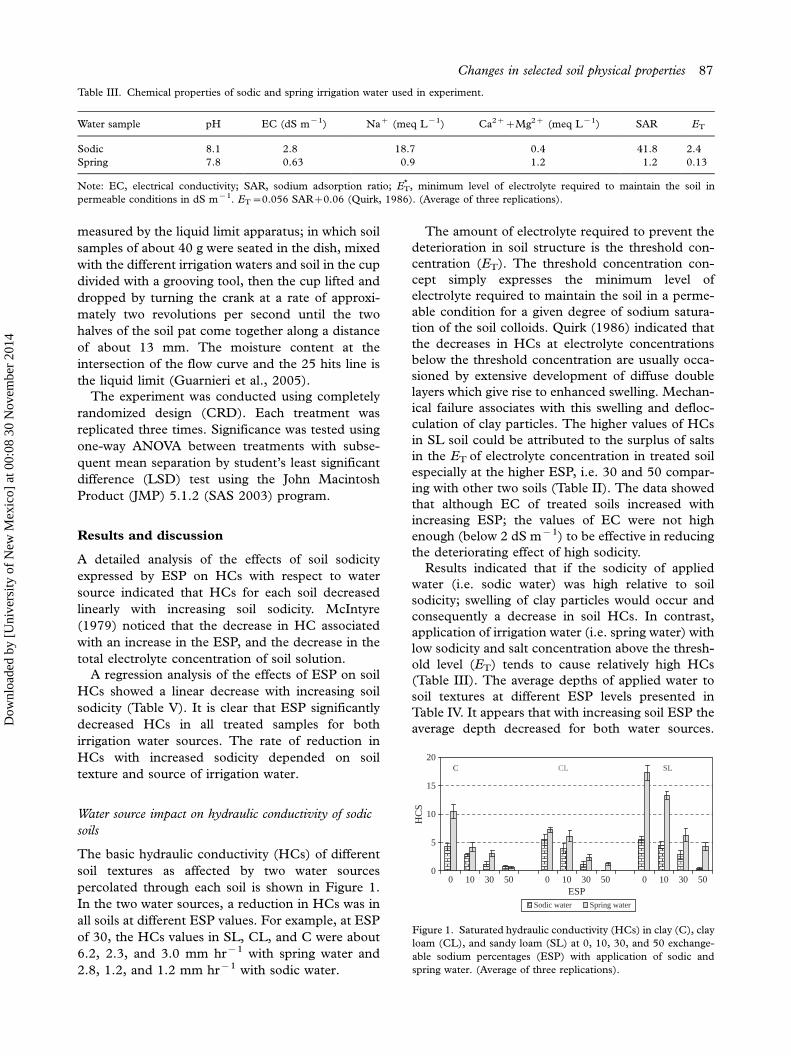
The basic hydraulic conductivity (HCs) of different
soil textures as affected by two water sources
percolated through each soil is shown in Figure 1.
In the two water sources, a reduction in HCs was in
all soils at different ESP values. For example, at ESP
of 30, the HCs values in SL, CL, and C were about
6.2, 2.3, and 3.0 mm hr�1 with spring water and
2.8, 1.2, and 1.2 mm hr�1 with sodic water.
The amount of electrolyte required to prevent the
deterioration in soil structure is the threshold con-
centration (ET). The threshold concentration con-
cept simply expresses the minimum level of
electrolyte required to maintain the soil in a perme-
able condition for a given degree of sodium satura-
tion of the soil colloids. Quirk (1986) indicated that
the decreases in HCs at electrolyte concentrations
below the threshold concentration are usually occa-
sioned by extensive development of diffuse double
layers which give rise to enhanced swelling. Mechan-
ical failure associates with this swelling and defloc-
culation of clay particles. The higher values of HCs
in SL soil could be attributed to the surplus of salts
in the ET of electrolyte concentration in treated soil
especially at the higher ESP, i.e. 30 and 50 compar-
ing with other two soils (Table II). The data showed
that although EC of treated soils increased with
increasing ESP; the values of EC were not high
enough (below 2 dS m�1) to be effective in reducing
the deteriorating effect of high sodicity.
Results indicated that if the sodicity of applied
water (i.e. sodic water) was high relative to soil
sodicity; swelling of clay particles would occur and
consequently a decrease in soil HCs. In contrast,
application of irrigation water (i.e. spring water) with
low sodicity and salt concentration above the thresh-
old level (ET) tends to cause relatively high HCs
(Table III). The average depths of applied water to
soil textures at different ESP levels presented in
Table IV. It appears that with increasing soil ESP the
average depth decreased for both water sources.
Table III. Chemical properties of sodic and spring irrigation water used in experiment.
Water sample pH EC (dS m�1) Na� (meq L�1) Ca2��Mg2� (meq L�1) SAR ET
Sodic 8.1 2.8 18.7 0.4 41.8 2.4
Spring 7.8 0.63 0.9 1.2 1.2 0.13
Note: EC, electrical conductivity; SAR, sodium adsorption ratio; ET* , minimum level of electrolyte required to maintain the soil in
permeable conditions in dS m�1. ET�0.056 SAR�0.06 (Quirk, 1986). (Average of three replications).
0
5
10
15
20
0 10 30 500 10 30 500 10 30 50ESP
HC
S
Sodic water Spring water
C CL SL
Figure 1. Saturated hydraulic conductivity (HCs) in clay (C), clay
loam (CL), and sandy loam (SL) at 0, 10, 30, and 50 exchange-
able sodium percentages (ESP) with application of sodic and
spring water. (Average of three replications).
Changes in selected soil physical properties 87
Dow
nloa
ded
by [
Uni
vers
ity o
f N
ew M
exic
o] a
t 00:
08 3
0 N
ovem
ber
2014

At ESP :50 the average depth was almost the same
in both water sources, indicating that swelling was at
maximum. Moreover, at ESP �30 the average
depth of applied water decreased sharply in all soil
textures and for both water sources. It is worthwhile
to notice that the absolute values of the slopes which
represent the rate of reduction in HCs values with
increasing ESPs of soils were generally higher in
spring water treatments as compared with sodic
water. Table V shows that SL soil gave 0.28 and
0.11 as a rate of decrease in HCs with spring water
and sodic water, respectively. Moreover, in all runs,
no particles in effluent were observed indicating a
limited particle mobility within our soil system. It
seems that clay swelling governed the process of
irrigation of sodic soils, and caused clay particles to
plug soil pores and reduce HCs.
Texture impact on hydraulic conductivity of sodic
conditions
The rates of decrease in HCs with increasing sodicity
were characteristically distinct for unlike soil tex-
tures. The reduction in HCs occurred in all soil
textures but certainly in different ratios according to
soil sodicity, irrigation water source, and clay con-
tent and mineralogy. Irrespective to the water
source, HCs values decreased with increasing ESP
in all studied soils (Figure 1).
In general, the comparison between all soil tex-
tures revealed that SL soil had been distinguished
among the other two soil textures by higher values of
HCs. The lowest HCs values obtained in C soil
especially with spring water application as shown in
Figure 1. Soils with coarser textured soil like SL
contain relatively large number of macropores which
allow for relatively rapid flow of water through the
soil. When swelling induced by application of irriga-
tion water particularly sodic water, this attenuates
soil structure and reduce HCs.
Both C and CL soils showed a noticeable low
values in HCs presumably due to the nature of
expanding clay mineral in these soils (vermiculite).
Furthermore, our results showed that reductions of
HCs in soils containing expanding clay were more
severe at ESP :30 or higher depending on irrigation
water source (Figure 1). Shainberg and Letey (1984)
indicated that swelling and dispersion could cause
plugging of conducting pores with dispersed clay
particles which in this case could be the main cause
of HCs decline. Since clay swelling and pore plug-
ging were responsible for the decrease in HCs, one
would expect that soils with greater proportion of
macropores (i.e. SL soil) to be less susceptible than
soils with finer pore size distribution (CL and C
soils). On the other hand, narrower conducting
pores can significantly decrease the hydraulic con-
ductivity of any soil, because they are more likely to
trap dispersed particles (if any) leading to pore
clogging.
Levy et al. (2003) reported that the higher organic
matter content through the sandy matrix of a poorly
aggregated soil minimized the effect of aggregate
slaking responsible for the decrease in HC in most
cases. SL soil has higher organic matter than C or
CL soils and this may also explain the relatively high
values of HCs for SL soil. Clayey soil with vermicu-
lite clay mineral of specific surface (600�800 m2g�1)
characterized by interlayer water and the ability to
expand experienced noticeable swelling which con-
tributed in HC’s reduction. On the other hand,
kaolinite of specific surface (7�30 m2g�1) which has
no tendency to expand existed in SL soil in
considerable amounts (Table I) and played a role
Table V. Regression equation and coefficient of determination (R2) for saturated hydraulic conductivity (HCs) as related to exchangeable
sodium percentage (ESP) and water source.
Texture Spring water Sodic water
C HCs��0.18 ESP�8.12, R2�0.760 HCs��0.07 ESP�3.71, R2�0.842
CL HCs��0.13 ESP�7.22, R2�0.982 HCs��0.11 ESP�5.21, R2�0.983
SL HCs��0.28 ESP�16.25, R2�0.923 HCs��0.11 ESP�5.66, R2�0.997
Note: Average of three replications.
Table IV. Average depths of applied water to clay (C), clay loam
(CL), and sandy loam (SL) soils related to exchangeable sodium
percentage (ESP) and water source.
Water source
Texture Spring water Sodic water
C 0 74 54
10 62 40
30 40 30
50 8 7
CL
/ ES
P 0 84 64
10 62 55
30 42 38
50 9 7
SL 0 94 72
10 70 67
30 47 37
50 15 14
Note: Average of three replications.
88 N.I. Eltaif et al.
Dow
nloa
ded
by [
Uni
vers
ity o
f N
ew M
exic
o] a
t 00:
08 3
0 N
ovem
ber
2014
in restricting major swelling effects in this soil
texture. In general, HCs decreased with increasing
sodicity of soils; however, the rate of decrease
depends on many factors such as soil texture, clay
content, and the organic matter content (Lado et al.
2004).
Effect of sodicity on aggregate stability
Results of this work indicated that the water stability
of aggregate (WSA) varied according to many factors
such as soil type, ESP level, and source of used
water.
In general, a conspicuous reduction in aggregate
stability observed in the course of using different
water sources with increasing ESP (Figure 2). The
differences in aggregation among the three soil
textures may pertain to many factors, e.g. total clay
content, clay type, and organic matter content. Since
the mineral compositions were not similar for soils;
clay mineralogy was probably the most important
factor affecting soil aggregate stability since the
mineral compositions were not similar for soils
(Table I). Previous study by Barzegar et al. (1977)
showed that soils with high shrink swell potential
associated with high aggregation. However, in sodic
conditions WSA was relatively low in studied soils
and probably this was due to swell and breakdown of
clay domains.
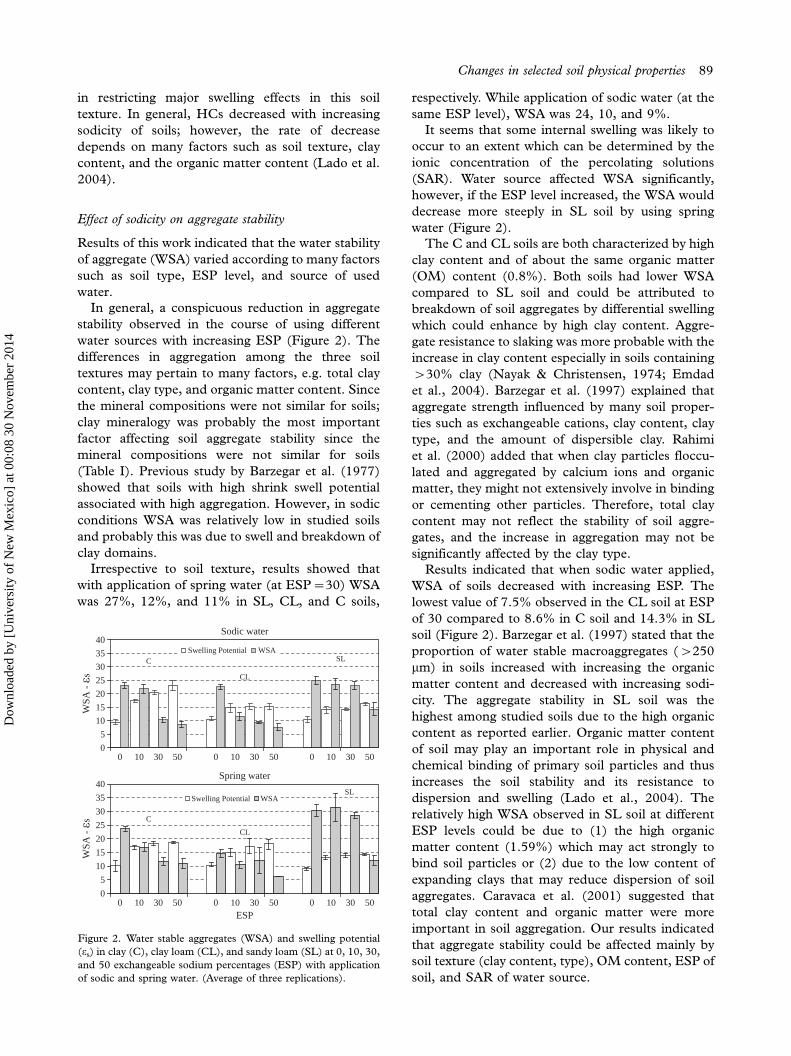
Irrespective to soil texture, results showed that
with application of spring water (at ESP�30) WSA
was 27%, 12%, and 11% in SL, CL, and C soils,
respectively. While application of sodic water (at the
same ESP level), WSA was 24, 10, and 9%.
It seems that some internal swelling was likely to
occur to an extent which can be determined by the
ionic concentration of the percolating solutions
(SAR). Water source affected WSA significantly,
however, if the ESP level increased, the WSA would
decrease more steeply in SL soil by using spring
water (Figure 2).
The C and CL soils are both characterized by high
clay content and of about the same organic matter
(OM) content (0.8%). Both soils had lower WSA
compared to SL soil and could be attributed to
breakdown of soil aggregates by differential swelling
which could enhance by high clay content. Aggre-
gate resistance to slaking was more probable with the
increase in clay content especially in soils containing
�30% clay (Nayak & Christensen, 1974; Emdad
et al., 2004). Barzegar et al. (1997) explained that
aggregate strength influenced by many soil proper-
ties such as exchangeable cations, clay content, clay
type, and the amount of dispersible clay. Rahimi
et al. (2000) added that when clay particles floccu-
lated and aggregated by calcium ions and organic
matter, they might not extensively involve in binding
or cementing other particles. Therefore, total clay
content may not reflect the stability of soil aggre-
gates, and the increase in aggregation may not be
significantly affected by the clay type.
Results indicated that when sodic water applied,
WSA of soils decreased with increasing ESP. The
lowest value of 7.5% observed in the CL soil at ESP
of 30 compared to 8.6% in C soil and 14.3% in SL
soil (Figure 2). Barzegar et al. (1997) stated that the
proportion of water stable macroaggregates (�250
mm) in soils increased with increasing the organic
matter content and decreased with increasing sodi-
city. The aggregate stability in SL soil was the
highest among studied soils due to the high organic
content as reported earlier. Organic matter content
of soil may play an important role in physical and
chemical binding of primary soil particles and thus
increases the soil stability and its resistance to
dispersion and swelling (Lado et al., 2004). The
relatively high WSA observed in SL soil at different
ESP levels could be due to (1) the high organic
matter content (1.59%) which may act strongly to
bind soil particles or (2) due to the low content of
expanding clays that may reduce dispersion of soil
aggregates. Caravaca et al. (2001) suggested that
total clay content and organic matter were more
important in soil aggregation. Our results indicated
that aggregate stability could be affected mainly by
soil texture (clay content, type), OM content, ESP of
soil, and SAR of water source.
Sodic water
0
5
10
15
20
25
30
35
40
WSA
- ε
s
Swelling Potential WSAC
CL
SL
Spring water
0
5
10
15
20
25
30
35
40
ESP
WSA
- ε
s
Swelling Potential WSA
C
CL
SL
0 10 30 500 10 30 500 10 30 50
0 10 30 500 10 30 500 10 30 50
Figure 2. Water stable aggregates (WSA) and swelling potential
(os) in clay (C), clay loam (CL), and sandy loam (SL) at 0, 10, 30,
and 50 exchangeable sodium percentages (ESP) with application
of sodic and spring water. (Average of three replications).
Changes in selected soil physical properties 89
Dow
nloa
ded
by [
Uni
vers
ity o
f N
ew M
exic
o] a
t 00:
08 3
0 N
ovem
ber
2014
Swelling determination
Swelling of soils can be determined in different
techniques, but most of these are rather expensive
and provide little information about the parameters
controlling the swelling process. In C soil, swelling
potential os was 10 in the control and ranged from 14
to 22 in other treatments regardless of the water
source (Figure 2). According to Seed et al. (1962)
classification, the resultant (os) values were above 5
in all treatments, and this classified as a high swelling
value. In CL soil, application of spring water
increased os from 10 to 18 at ESP :10 and 50,
respectively (Figure 2). On the other hand, applica-
tion of sodic water had little effect on os regardless of
the ESP value.
When spring water applied to SL soil, the os
increased from 13 to 14.3, and with sodic water
from 14 to 16 at ESP :10 and 50, respectively. In
general, C soil experienced the highest free swelling
levels possibly due to the amount and type of clay.
Vermiculite as the dominant mineral in such soils has
ability to expand freely in the presence of sodium
ions in waters especially in sodic water.
This work concluded that if soil sodicity combined
with the used marginal water quality, this could lead
to low permeability, clay swelling, and eventually to
land deterioration. However, further research and
more data are needed to delineate more clearly the
interrelationship between surface charge density and
swelling of clay minerals which could then be
correlated with forces that could cause problems to
physical properties of soils.
References
Bains, S.S., & Fireman, M. (1964). Effect of sodium percentage
on the growth and absorption of essential nutrients and
sodium by five crop plants. Agronomy Journal, 56, 432�435.
Barzegar, A.R., Nelson, P.N., Oades, J.M., & Rengasamy, P.
(1997). Organic matter, sodicity and clay type: Influence on
soil aggregation. Soil Science Society of America Journal, 61,
1131�1137.
Beare, M.H., & Bruce, R.R. (1993). A comparison of methods for
measuring water stable aggregates: Implications for deter-
mining environmental effects on soil structure. Geoderma, 56,
87�104.
Blake, G.R., & Hartge, K.H. (1986). Bulk density. In A. Klute
(Ed.), Method of Soil Analysis. Part I. Physical and Miner-
alogical Methods (2nd ed.) (pp. 363�382). American Society
of Agronomy, Madison, WI.
Caravaca, F., Lax, A., & Albaladejo, J. (2001). Soil aggregate
stability and organic matter in clay and fine silt fractions in
urban refuse amended semiarid soils. Soil Science Society of
America Journal, 65, 1235�1238.
Emdad, M.R., Raine, S.R., Smith, R.J., & Fardad, H. (2004).
Effect of water quality on soil structure and infiltration under
furrow irrigation. Irrigation Science, 23, 55�60.
Gee, G.W., & Bauder, J.W. (1986). Particle size analysis: Pipette
method. In A. Klute (Ed.), Method of Soil Analysis. Part I.
Physical and Mineralogical Methods (2nd ed.) (pp. 383�411).
American Society of Agronomy, Madison, WI.
Guarnieri, A., Fabbri, A., & Molari, G. (2005). Influence of
sodicity and salinity on the mechanical properties of two
Italian soils. Biosystems Engineering, 91, 239�243.
Jordan Soil and Climatic Information System (JOSCIS). (1995).
The Soils of Jordan (Jordan: National Soil Map and Land Use
Project, Ministry of Agriculture).
Kariuki, P.C., & Van der Meer, F.D. (2003). Issues of effectives in
empirical methods for describing swelling soils. International
Journal of Applied Earth Observation and Geoinformation, 4(3),
231�241.
Kemper, W.D., & Rosenau, R.C. (1986). Aggregate stability and
size distribution. In A. Klute (Ed.), Method of Soil Analysis.
Part I. Physical and Mineralogical Methods (2nd ed.) (pp. 425�442). American Society of Agronomy, Madison, WI.
Lado, M., Paz, A., & Ben-Hur, M. (2004). Organic matter and
aggregate size interactions in saturated hydraulic conductiv-
ity. Soil Science Society of America Journal, 68, 234�242.
Levy, G.J., Mamedov, A.I., & Goldstein, D. (2003). Sodicity and
water quality effects on slaking of aggregates from semi arid
soils. Soil Science, 168, 552�562.
Mace, J.E., & Amrheim, C. (2001). Leaching and reclamation of a
soil irrigated with moderate SAR waters. Soil Science Society
of America Journal, 65, 199�204.
McIntyre, D.S. (1979). Exchangeable sodium subplasticity and
hydraulic conductivity of some Australian soils. Australian
Journal of Soil Research, 17, 115�120.
McLean, E.O. (1982). Soil pH and lime requirements. In A. Klute
(Ed.), Method of Soil Analysis. Part II. Chemical and Micro-
biological Methods (2nd ed.) (pp. 199�224). American Society
of Agronomy, Madison, WI.
Nayak, N.V., & Christensen, R.W. (1974). Swelling characteristics
of compacted expansive soils. Clays and Clay Minerals, 19,
251�261.
Nelson, D.W., & Sommers, L.E. (1982). Total carbon, organic
carbon and organic matter. In A.L. Page, R.H. Miller, &
D.R. Keeny (Eds.), Method of Soil Analysis. Part II. Chemical
and Microbiological Methods (2nd ed.) (pp. 593�577). Amer-
ican Society of Agronomy, Madison, WI.
Palemio, M., & Rhoades, J.D. (1977). Determining cation
exchange capacity: A new procedure for calcareous and
gypsiferous soils. Soil Science Society of America Journal, 41,
524�528.
Pons, Y., Capillon, A., & Cheverry, C. (2000). Water movement
and stability of profiles in drained, clayey and swelling soils:
At saturation, the structural stability determines the profile
porosity. European Journal of Agronomy, 12, 269�279.
Pratt, P.F., & Suarez, D.L. (1990). Irrigation water quality
assessments. In Agricultural Salinity Assessment and Manage-
ment. Tanji, K.K. (ed.). ASCE Manuals and Reports on
Engineering Practice (No. 71) (Reston, VA: ASCE), pp.
220�236.
Qadir, M., & Schubert, S. (2002). Degradation processes and
nutrient constraints in sodic soils. Land Degradation and
Development, 13, 275�294.
Quirk, J.P. (1986). Soil permeability in relation to sodicity and
salinity. Philosophical Transactions of the Royal Society of
London. Series A, Mathematical and Physical Sciences, 316,
297�315.
Rahimi, H., Pazira, E., & Tajik, F. (2000). Effect of soil organic
matter, electrical conductivity and sodium adsorption ratio
on tensile strength of aggregates. Soil and Tillage Research, 54,
145�153.
90 N.I. Eltaif et al.
Dow
nloa
ded
by [
Uni
vers
ity o
f N
ew M
exic
o] a
t 00:
08 3
0 N
ovem
ber
2014

Rhoades, J.D. (1982). Soluble salts. In A.L. Page, R.H. Miller, &
D.R. Keeny (Eds.), Method of Soil Analysis. Part II. Chemical
and Microbiological Methods (2nd ed.) (pp. 176�179). Amer-
ican Society of Agronomy, Madison, WI.
Seed, H.B., Woodward, R.J., & Lungreen, R. (1962). Predicting
of swelling potential of compacted clay. Journal of Soil
Mechanics and Foundation Division, 88, 53�87.
Shainberg, I., & Letey, G.J. (1984). Response of soils to sodic and
saline conditions. Hilgardia, 52, 1�57.
Statistical Analysis System (SAS). (2003) SAS User’s Guide
(version 5th ed.) (Cary, NC, USA).
Sumner, M.E. (1993). Sodic soils: New perspectives. Australian
Journal of Soil Research, 31, 683�750.
Thomas, G.W. (1982). Exchangeable cations. In A.L. Page, R.H.
Miller, & D.R. Keeny (Eds.), Method of Soil Analysis. Part II.
Chemical and Microbiological Methods (2nd ed.) (pp. 159�165). American Society of Agronomy, Madison, WI.
Changes in selected soil physical properties 91
Dow
nloa
ded
by [
Uni
vers
ity o
f N
ew M
exic
o] a
t 00:
08 3
0 N
ovem
ber
2014