irrigation: soil-plant-water relationships
TRANSCRIPT

Utah State University Utah State University
DigitalCommons@USU DigitalCommons@USU
All U.S. Government Documents (Utah Regional Depository)
U.S. Government Documents (Utah Regional Depository)
3-1964
Irrigation: Soil-Plant-Water Relationships Irrigation: Soil-Plant-Water Relationships
Soil Conservation Service, Engineering Division
Follow this and additional works at: https://digitalcommons.usu.edu/govdocs
Part of the Environmental Indicators and Impact Assessment Commons
Recommended Citation Recommended Citation Soil Conservation Service, Engineering Division, "Irrigation: Soil-Plant-Water Relationships" (1964). All U.S. Government Documents (Utah Regional Depository). Paper 516. https://digitalcommons.usu.edu/govdocs/516
This Report is brought to you for free and open access by the U.S. Government Documents (Utah Regional Depository) at DigitalCommons@USU. It has been accepted for inclusion in All U.S. Government Documents (Utah Regional Depository) by an authorized administrator of DigitalCommons@USU. For more information, please contact [email protected].

PB85-182269 11111111/1111111111111111111/11111 III
'0'" .,., REPOIIT aocu....,.AT10" II ... ".,.,. .. 1&
.. ................... ,~ . SCS/ENG/NE~l?~ 1 PB85-182269 -.. Title ............ .. .... 0..
Irrigation March 1964
• Soil-Plant-Water Relationships . -
,.~ .. ... , ... ,,.. OJ,,,' WlhM ........
Soil Conservation Service - En2.ineer in!? Division t. ............ a..ot ....... "_ ........ .- 10. ~_,..... UIIIt ,...
Soil Conservation Service P.O. Box 2890 IL eu*WUCI ., ~ ,...
Washington DC 20013 (e)
!GI f-aa ",=1.0,_ I -.......... ~,.. ............. c-
Engineering Division Final
I Soil Conservation Service, USDA P.O. Box 2890 IA.
~"'D'" Washington, DC 20013
stIL, ....
-.. __ (\JIOIIe --- Soil-Plant-Water relationships describes those properties of soils and plants that affect the movement, retention, and use of 'water essential to plant growth. This publication attempts to provide engineers the basic data necessary to plan and maintain efficient conservation irrigation practices to provide a permanent irrigated agriculture engineering principles and research findings have been screened to give emphasis to the information needed to design, install~ and operate irrigation systems on farms or groups of farms.
17. a.-- ........ D_ .... " Soil Conservation Service Plant rooting Irrigation Consumvt·ive ~ge' Soil-Water-Plant Irrigation water requirements Water intake Irrigation scheduling
lao .-.... ,a-. ....... T_
REPRODUCED BY U.S. DEPARTMENT OF COMMERCE
NATIONAL TECHNICAL INFORMATION SERVICE
e.COM"~'~ SPRINGFIELD, VA 22161
aa. .. _ _. __ r lAo ....., 0.. C'IIIIa "-'I n.._ ........ Release unlimited, available from National . Unclassified 7'1 Technical Information Service, Springfield,
~ ..... -... ,,-. ....... Virginia 22151 I Unclassified
( ...... ....a&I. -.- ............. WI. t-lL ~ 171 ,...", (~"" ... 04 Ii _ ,.,cca: __ ...


SCS NATIONAL ENGINEERINC'r HANDBOOK
SECTION 15 - IRRIGATION
ClliiPTER 1 - SOIL-PLANT-WATER RELATIONSHIPS
CONTENTS
Soils ............................ . Physical properties of soils ..
Soi 1 texture ..•. Soil structure. Til tho
Soil water .. Kinds of water in the soil. Movement How water
of water in the soil. is held in the soil.
Availatle water ..... •....•.. ::.~alculating available water.
~ater intake ..... .
:'lants ...
Infiltration. Percolation ... Factors affecting intake rate. Variation in intake rate by irrigation method. In Lake characteristics ••.......••• Intake families ..... Int.aKe variability •. j\~ethods of determining intake •• . . . . . . . . . . . . . . . . . . . . .
Roo:ing characteristics •. How plants get their moisture •• Kinds of root systems •••.••••• Soil effects on root development. Effects cf climate on root development •. Moisture-extraction patterns ••..• Design moisture-extraction depth .•
Conslilllpti ve use ............ . Daily consumptive use .. Seasonal consumptive use Peak-period consumptive use .. Irrigation-water requirements.
. "
Effect of soil-moisture level on crop growth and yield .• Critical periods .•.•..
Moisture levels for irrigation .. fJid-area levels •• . .... Humid-area levels.
1-1 1-]
.,.(.. .
l-2 1-4 1-5 1-6 1-6 1-7 1-7
l-:LO 1-14 1-.1'7 1-1'7 J. -1'7 1-18 1-20 1-22 1-25 1-26 1-28 1-28 1-29 1-29 1-29 1-38 1-30 1-30 1-33 1-35 1_1'7
1-38 1-38 1-41 1-41 1-42 1-42 1-44 1-44

l-lDisture to be replaced at each irrigation .••••••.••.••.••••• Net water application .................................. . Gross water application ................................ . Varying applications ................................... .
Villen to irrigate .......................................... I •••••••
1-1
1-2
1-3 1-4 1-5
1-6
1-7 1-8 1-9
Irrigation frequenc:l ........................................ . Irrigation period ............................................ . Irrigating by crop appearance .•.•.•.•••••••..•..•..•.•••••••. Irrigating by determining soil-moisture level •..•.•••...••.••
Location of soil-moisture measurements •. ' ..•..•••••.••.•. Reading and recording measurements .••..•..••.•••••. •..•• Soil-sa.rnpling method ............................•....... ~J1easuring instru.rnents .................................. . Feel and appearance method ............................. . Moisture-accounting method ..••.. ..•.••.•••...••..•.••.•• Evaporation-pa.:n methcxl ................................. .
FIGURES
Proportions of sand, silt, and clay in the basic soil-textural classes .......................................... . Ty~es of soil structure and their effect on downward mov eraen t of ,vater ......................................... . Examples of water penetration from an irrigation furrow ... . lvioisture-characteristic" Cllrves ............................ . Kinds of water in the soil and difference in availablemoisture content between a sandy ],oam and a silt loam ....•. Relation between soil-~oisture content and soil-moisture tension in a sandy loam and a silt loam ................... . Water-intake rate varies with method of irrigation •••••...• Relation of total intake to time for three soils •.••.•....• Relation of intake rate to time for the three soils shown in fig1J.I'e 1-8 ............................................. .
1-10 1-11
Intake families for surface-irrigation design •.•..•.•..•... Example of the classification of a soil in an intake
1-46 1-46 1-47 1-48 1-48 1-48 1-49 1-52 1-52 1-52 1-54 1-54 1-55 1-58 1-60 1-64
1-3
1-5 1-8
1-10
1-11
1-13 1-21 1-23
1-23 1-25
family by test.............................................. 1-26 1-12 Total intake and time relation for two soils that crack
on drying.................................................. 1-27 1-13 Example of variation in intake characteristics and
distribution in intake families f.Jr a group of mediwn-textured soils ......... ~ . . . . . . . . . . . . . . . . . . . . . . . . . . . . . .. . . .. 1-27
1-14 Root systems of field and vegetable crops in deep irrigated
1-15 1-16
soils of central United states ..•.•.•••••.•...••..•..•.••.• Soil effects on root development •...••.•.....••••••••...•.. Average moisture-extraction pattern of plants growing in a soil without restrictive layers and with an adequate supply of available moisture throughout the root zone •••.•.•••••••
1-31 1-32
1-34

Figure
1-17
1-18
1-19 1-20
1-21 1-22 1-23 1-24 1-25
1-26
Moisture-extraction patt.erns as determined by availablemoisture content in various parts of soil profile ....•..... Moisture-extraction patterns for a low and a high moisture level ..................................................... . Diagram of consumptive use .................•.••........•... Average daily consumptive use for irrigated corn and meadow at Coshocton, Ohio ........•.....•.••.•.............. Moisture-release curves for three soils ......•....•.....•.. Linli ting soil-moisture deple~tion in humid areas ......•..... Tensiometers used to measure soil moisture ...•.....•.••...• Electrical-resistance soil-moisture meters ...•...•.•.••.... Cumulative curves for measured consumptive use (U) and for evaporation (E) from a USDA BPI pan at Prosser, Wash ••...•. Relation of measured evapotranspiration for irrigated corn and alfalfa-timothy to evaporation from a BPI-type pan at
1-34
1-35 1-36
1-39 1-43 1-51 1-56 1-57
1-65
Coshocton, Ohio ................ r ..... " • • .. • •• • • • • • • .. • • • • • • • • • 1-67 1-27 Relation of average daily evapotranspiration for ryegrass
+00 evaporation from a U.S. Weather Bureau class-A pan by months at Davis, Calif..................................... 1-68
1-28 Eelation of cumulative evapotranspiration for pere1U1ial ryegrass to evaporation fror.J two t~fPes of pans in dif-ferent environments at Davis, Calif........................ l-W
1-29 Ratio of aver'age evapotranspirati_on to pan evaporation for tr~ee fields by age of sugarcane .•......................... 1-69
1-30 Standard Weather Bureau evaporation pan ..........•.....•... 1-72
Table
1-1 1-2
1-3 1-4
1-5
TABLES
General terms for basic soil-textural classes ............. . Moisture content of a Hinc1dey loamy sand at various tensions .................................................. . Physical properties of a Hir.ckley loamy sand .............. . Design moisture-extraction depth and peak-period consumptive-use rate of various crops grown on deep, medium-:'extured, mocie:-ately permeable soils ......................• 1,~oisture available tetween the 15-percent level and the permanent wilting point for the three soils shown in
1-2
1-15 1-15
1-40
figUl"'e 1-21 ... III • • • • • • • • • • • • • • • • • • • • • • • • • • • • • • • • • • • • • • • • • • • • 1-45 1-6 Frac-:ical interpretation chart of soil moisture for various
1-7 1-8
1-9 1-10
soil textures and conditions ............•..•.•..•....•..... 1-59 Soil moisture and appeara.'1ce relationship chart ....... -.•... Values for daily consumptive use that reflect variations in temperature and sunshine duration for July ...•.•.......•... Moisture-balance sheet for scheduling irrigation .......... . Crop-factor values for computing estimated consumptive use from pan-evaporation data for several crops grovm in
1-60
1-62 1-63
central Viashington.......................................... 1-70
. . .


1-1
SCS NATIONAL ENGINEERING HANDBOOK
SECTION 15
IRRIGATION
CH~TER I--SOIL-PLANT-WATER RELATIONSHIPS
This chapter on soil-plant-water relationships treats those physical properties of soils and plants that affect the movement, retention, and use of we:ter and t~1at must be considered in designing and operating conservation irrigation systems.
In ple 1111:lng an i l'riga tiOll system, an engineer is concerned primarily with the '-iater-holding capacity of a soil, particularly in a plant's root zone; the water-intake rate of the soil; the root system of the :-orop to be growll; and the amount of water that the crop uses. But he must also have a working Imowledge of all soil-plant-water relationships in order to plan efficient irrigation for particular crops grown on particular soi13 and to adjust the design to various conditions. This general knowledge also enables him to assist an irrigator in managing the system efficiently.
Soils
Soil is a storehOllse of planl nut:iients, a habitat for bacteria, an anchorage for planis, and a reservoir that holds th8 water needed for plant gro;;-t:.h. The amount of water a soil Call hold available for plant use is dete::"TIlin3d by Hs physical proper-des. This amount determines the length of "time a plant can s-Lll'yive v:ithout water being added. It deter;:-lines bOl;h the frequency of irrj_gation and the capacity of the irrigation system needed to insure ccntinuous crop growth.
PHYSICAL PROPERTIES OF SOIlS
Mineral soils are porous mixtures of inorganic (mineral) particles, decaying organic matter, air, and water. They also contain a variety of living organisms. The parent material of mineral soils consists of loose unconsolidated fragments of weathered rocks or unconsolidated sediments of various kinds. Physical and chenrlcal weathering give rise to a horizontal layering in the soil mass. These different soil layers can be seen in trenches, eroded banks, and road cuts. Collectively these layers (horizons) from top to bottom are called the soil,profile. Their arrangement and the kinds of material in the layers affect both root growth and the movement and retention of water in the soil.
Two important physical properties of soils are texture and structure. Soil texture refers to the relative proportion of the various size groups of mineral particles in a given soil. Soil structure refers to the manner in which the soil particles are arranged in groups or aggregates. Together, soil texture and soil structure help to determine the supply of water and air in a soil.

1-2
Soil Texture
The various size-groups of mineral particles in a soil are called separates. The classification of soil separates used by the U.S. Department of Agriculture and their range in diameter size are shown in the following list. Coarse fragments, those larger than 2 millimete·rs in diameter, are not included.
Soil separate:
Very coarse sand ..•....••••• Coarse sand ................ . !v1ed i UD1 S' and •.••••••••••••••• Fine sand .................. . Very fine sand ..•••.•..••••• Si 1 t ....................... . Clay ....................... .
Particle diameter (millimeters) -
2.0 1.0 1.0 .5
.5 .25
.25 .1
.1 .05
.05 .002 Less than .002
Soil textural classes are based on different combinations of sand, silt, and clay. For some kinds of work it is necessary to make fine distinc"Lions in texture; the basic classes used in terms of size distribution as determined by mechanical analysis in the laboratory are E:hown graphically in figure 1-1. In seme places it is convenient to speak more gener-ally of texture; acceptable terms for groups of the basic classes are shoi'm in table 1-1.
Table 1-1. --General terms for basic soil textural classes 1
General terms Basic soil textural
classes
Sandy soils ....... Ccarse-textured soils •.••....••••• Sands Loamy sands
Loamy soils ....•.. Moderately coarse textured soils •• Sandy loam Fine sandy loam
l.~edi urn-textured soils ..•..•..••••. Very fine sandy loam Loam Silt loa.m Silt
Moderately fille textured soils •.•• Clay loam Sandy c lay loam Silty clay loam
Clayey soils ...... Fine-textured soils .•..••.•..•••.. Sandy clay Silty clay Clay
1 From U. S. Dept. Agr. Handbook 18. Soil Survey Manual. 503 pp., ill-USe 1951.

lit PERC~NT SAND
Figure l-l.--Proportions of sand, silt, and clay in the basic 80iltextural classes. (From U.S. Dept. Agr. Handb. 18. Soil Survey Manual. 503 pp., illus. 1951.)
1-3
In the field soil texture is determined by feeling the 80il with the fingers. If necessary, this determination can be checked later in the laboratory. The general definitions of soil textural classes in terms of field experience and feel that are included in the USDA Soil Survey Manual follow.
SAND. Sand is loose and single grained. The individual grains can be seen-or felt readily. Squeezed in the hand when dry, sand falls apart when pressure is released. Squeezed when moist, it forms a cast but . crumbles when touched.
SA!l:l)Y LOAM. A sandy loar.l is soil containing a high percentage of sand but having enough silt and clay to make it somewhat coherent. The individual sand grains can be readily seen and felt. Squeezed when dry, a sandy loam forms a cast that falls apart readily. If squeezed when moist, a cast can be formed that bears careful handling without breaking.

1-4
Lo.A1vi. A loam is soH having a relatively even mixture of Mfferent grades of sand, silt, and clay. It is mellow with a .3omewhat gritty feel but is fairly smooth and slightly plastic. Squeezed when dry, it forms a cast that bears careful handling, and the cast formed by squeez5.ng the moist soil can be handled freely without breaking.
SILT LOAM. A silt loam is soil having a moderate amount of fine sand and only a small amount of clay; over half of the particles are of the siz.e called silt. When dry, a silt loam appears cloddy but the lumps can be broken readily; when pulverized, it feels soft and floury. When wet, the soil runs together readily and puddles. Either dry or moist, it forms a cast that can be handled freely without breaking; when moistened and squeezed between thumb and finger, it does not ribbon but has a bro~en appearance.
CLAY LOA'-il. A clay loam is fine-textured soil that usually breaks into clods or lumps that are hard when dry. When the moist soil is pinched be"tween the thwnb and finger, it forms a thin ribbon that brea:k:s readily} barely sL;.stainiEg its mill weight. The moist soil is plastic and forms a cast that bears much handling. V,'hen lrneaded in the hand, it does not crumble readily but works into a heavy compact mass.
CLAY. A clay is fine-textcred soil that usually forms very h.ard lumps or clods when dry and is very plastic and usually sticky when wet. \'iben the moist soil is pinched out between the thumb and finger, it forms a long, fexible ribbon. Sume clays very high in colloids are friable and lar.k plasticity at all conditions of moisture.
Organic soils are soils in which the organic-matter content ranges from 20. percent to as high as 95 percent. They generally are classified on the basis of degree of decompositioll of the organic deposits. Those deposits that are o::11y slightly decayed or 110ndecayed are called peat; in peat soils t1:e kinds of plants that make up the deposits c:an be identified. Well-decomposed deposits in wltich the original plant parts cannot be idelltified are called muck. The word mucky is used also as an adjective in the textural'class name for horizons of mineral soils that cont.ain 15 percent or more partially decomposed organic mattE!r. Examples are mucky loam and mucky silt loam.
Soil Structure
Structure influences the rate at which water and air enter and move through the soil; it also affects root penetration and the soills nutrient supply. structure refers to the particular kind of particle grouping that predominates in a soil, but in many soils the kind of structure differs in different horizons.
Single-grained and massive soils are structureless. In single-~rained soils such as loose sands, water percolates very rapidly. Water moves very slowly through massive soils. Df the four primary types of structure shown in figure l-2--platy, prismatic, blocky, and granular--the

1-5
-"- .,'
. ~::~ ~f; -~--~ \:.'
RAPI,D, MO~ERATE I
Figure 1-2 , --Types of soil structure 8.!1d their effect on do;m-;la.rd Dovement of water. (From U. S. Dept. i'/;:'. ar:.d U. S. Dept. Into /17,:'. bf. Bandb. 199. Irrigation on Western .7arms. 53 pp., illus. 1959.)
more favorable water relations are usu,8.::"ly i~130ils t;lat leave prisTi'.atic, block], and granular structure. Platy S"',l"l.1.c:tlJ..!'C impedes U!2 'iu:::,:::ard r.-,ovement of \,later.
iJnlike textcre, structure of the s~fa(;e soil can be chan,sed.. Excellent strudure develops in the smface layer of ov)ils high in organic matter and on which a perennial gl't3,SS is growing. C~'cles of wetting and drying or of free zing and tha-uing improve structUTe in the plow lE.yer. en iihe other hand, ~ultivation of nedium- or fir!2-textllI'ed soils when their moisture content is high tends to destroy structure. Ij,~rigation water containing large amoilllts of sodium causes very undesirable structure by dispersir~ the soil aggregates.
Tilth
The physical condition of the soil in relation to plant growth and ease of tillage is commonly called tilth. It depends partly on granulation and on stability of the granules. Tilth is commonly evaluated as good, fair, or poor, according to the ease with which the soil can be worked and the rate at which it takes in water. Soils in good tilth are mellow, crumbly, and easily worked; they take up water readily when dry. Soils in poor tilth generally are hard, cloddy, and difficult to work; they take up water slowly and run together when wet. Good soil tilth can be

1-6
developed and maintained on most soils by using good soil management practices.
SOIL WATER
Since a constant supply of water in the soil is necessary for plant survi val and growth, the irrigation engineer is concerned wi t,h how water moves in a given soil, how much water a soil can hold and hCM' much of it is available to plants, and how the water supply can be reple~nished. The first two are related to size and distribution of the soil pelres and to size of the soil particles and their attraction for moisture. The amount of water a soil holds also depends on the amount of organic n~tter in the soil. Generally, the finer the soil particles and the larger the amount of organic matter, the more water a soil holds.
Kinds of water in the Soil
The soil pores, spaces between the particles, form a network of connected cavities of every conceivable shape and size. When water is added to a dry soil by either rain or irrigation, it is distributed around the soil particles where it is held by adhesive and cohesive forc:es; it displaces air in the pore spaces and eventually fills the pores .. When all the pores, large and small, are filled, the soil is said to be saturated and is at its maximum retentive capacity.
The water in the large pores that moves downward freely under the influence of gravity is called gravitational water or free watE!r. When the supply of water to the surface is cut off, water continues to drain from the large pores for a few days. In well-dFained soils, the free water near the surface usually has moved out before crops are damaged. The large pores are again filled with air; water in the small pores moves because of capillary forces and is called capillary water. It moves more slowly than free water; it can move in any direction but always in the direction of the greatest tension.
Evaporation from the surface and absorption of moisture by growing plants further reduce the amount of water in the soil until nater no longer moves because of capillary forces. It is held so tightly as very thin films around the soil particles and in minute wedges bet,ween the particles at their points of contact that it carmot be used by plants and they begin to wilt. Eventually the soil is so dry that plants die if water is not added to the soil. The remaining water is held on the particle surfaces, particularly the soil colloids, so tightly that much of it is. nonliquid and moves as a vapor. This is called hygroscopic water.
Of these three forms of water, gravitational, capillary, and hygroscopic, the irrigation engineer is concerned primarily wi th I~ravi tational and capillary water since hygroscopic water is not aVliilable to plants.

1-7
Movement of water in the Soil
The movement of water in the soil is complex because of the various states and directions in which water moves and because of the forces that cause it to move. Because of gravity, water moves downward. Because of adhesive and cohesive forces, it moves in small pores by capillarity. Because of heat, it vaporizes and diffuses through the soil air.
The rate at which gravitational water percolates through the soil is determined chiefly by the size and continuity of the pore spaces. Water usually moves freely through the large pores in coarse-textured soils. It moves less rapidly through fine-textured soils because of the resistance to flow in small pores, which may also be blocked by swollen colloidal gels and trapped air. Percolation is retarded by a slowly permeable layer such as a claypan or plowpan. A sand lens temporarily halts percolation; but once water penetrates such a layer, it continues to move downward. These different conditions are illustrated in figure 1-3.
Irrigation water moves as a front--from a saturated soil layer to an unsaturated layer. Movement of the front is unsteady; water builds up behind the front until the large pores are filled and then moves to the next layer of large pores. In moist soils water movement is more uniform than in dry soils.
The movement of capillary water is affected by soil texture. The forces that cause capillary movement in small pores l'esul t largely from the difference in tension between films of different thickness around soil particles; the movement is from thick films to thin films. If these forces are expressed in terms of tension, water moves from an area where tension is low to an area where te"nsion is high. At saturation, capillary movement is most rapid in sandy soils and slowest in clay soils. But in drier or unsaturated soils capillary water moves slowly in sands and more rapidly in clays.
Heat causes water to move as a vapor. As water vapor diffuses through the soil air near the surface, it either condenses in another part of the pore space or escapes into the atmosphere. As water is evaporated from the surface, capillary water rises and replaces part of the evaporated water. This continues until the upper few inches of the soil become dry and capillarity is broken. Water then leaves the 80il only by vaporizing at the upper capillary fringe and diffusing through the overlying dry soil.
How Water Is Held in the Soil
Work must be done (energy used) to remove water from a soil. The force (tension) with which water is held depends on the amount in the soil--the smaller the amount, the greater the tension. The forces that determine tension are adhesion, the attraction of soil-particle ~urfaces for water, and cohesion, the attraction o~ water molecules fo~ each other. By adhesion water is held tightly at the soil-water interface. By cohesion these

/-8
. UNIFORM.· S·OfL .
WATER PENETRATION IN UNIFORM SOIL
. -. ~.. . . . ~ - .. : -' -- - - .
2
:", . .: ." ..
* CDI3MIN ®22MIN. ®40MIN. @)64MIN ®74MIN. ®125MIN. I:l) 196 MIN.
EFFECT OF A PLOWPAN ON WATER PENETRATION
EFFECT OF A SAND LENS ON WATER PENETRATlON
* TIME IN MINUTES SHOWN IN SKETCHES IS THE ELAPSED TIME FROM START OF WATFR APPLICATION.
Figure 1-3. --Examples of water penetration from an irrigation furrow.

water molecules hold other water molecules. Because. of the3e forcl2s water fills the small pores in the soil and is in fairly thick films ·in the large pores. As the films become thicker, however, the water molecules at the outer surface, the liquid-air interface, are held less tightly. They can move in response to the pull of gravity and to the pull of less thick films nearby. Thus not much work or energy is requir~d to remove water from a soil near saturation. But as more and more water is removed, more and more energy is required.
SOIL-MOISTURE TENSION. Soil-moisture tension is a measure of the tenacity with which water is retained in the soil and shows the force per unit area that must be exerted to remove water from a soil. It is usually expressed in atmospheres, the average air pressure at sea level, but other pressure units can be used. At a temperature of 210 C. (
0 . 69.8 F.),
1 atmosphere = a pressure of 14.71 pounds per square inch, = a column height of 76.39 centimeters of
mercury = a column height of 34.01 feet or 1,036
centimeters of water.
f.Jl expression of soil-moisture tension does not indicate the amount of water a soil conta::'ns nor does it indicate the amount of water that can bl':! :-emoved at that tension. These amounts, which depend on both texture ar.d structure, must be determined. Generally sandy soils drain almost completely at low tension, but fine-textured clays still hold a considerable amoilllt of moisture even at such high tensions that plants growing in the soil wilt.
To show the amount of moisture a given soil holds at various tensions, moi3~ure-extraction curves must be developed. This can be done by plotting tension in atmospheres against moisture content in percentage by weight. Tension values indicate the ease or difficulty with which moisture call be removed from a soil, and moisture percentage indicates the amount of water still in the soil.
Figure 1-4 shows moisture-extraction curves, also called moisturecharacteristic curves, for three soils of different texture. The curve for the clay shows that moisture is released in fairly even increments as tension increases. The curve for the sand shows a proportionately greater release of moisture at low tension than the curve for the clay. The curve for the loam is intermediate in shape between toe curves for the clay and the sand.
Soil-moisture tension as discussed in the preceding paragraphs is based on pure water. Salts in soil water increase the force that must be exerted to extract water and thus affect the amount of water available to plants. The increase in tension caused by salts is from osmotic pressure. If two solutions differing in concentration are separated by a membrane impermeable to the dissolved substance, such as a cell membrane

1-10
30
28
26
~ :x: 24 ~ w ~ 22 )0-CD I- 20 z w u a:: 18 w ~ I- 16 z w I- 14 z 0 u 12 w a:: ::J 10 I-fII 0 8 :::!!
6
4
2
\ \
'---0.... __
1 \ '0 __
~--..boam ~
-~ ----- -----<»
--<>-- _ _ Sand ~--------~--------------~
L-~ ___ -L ___ ~ ___ ~~~~ ___ ~ ___ ~ ___ ~~~~~~---~---~~ 2. 3 4 5 6 7 e 9 10 II 12 13 14 15
SOIL-MOISTURE TENSION (ATMOSPHERES)
Fig'-lTe 1-4.--Moisture-characteristic curves. (From Thorne, M.D., and Raney, W. A. Soil ~bisture Evaluation. U.S. Dept. Agr. ARS 41-6. 14 pp., illus. 1956.)
in a plaClt root, water moves from the solution of lower concentration to the one of higher concentration. The force with which water moves across such a membrane is called osmotic pressure and is measured in atmospheres.
In many irrigated soils, the soil solution contains an appreciable ~ount of salts. The osmotic pressure developed by the soil solution retards the uptake of water by plants since the total moisture stress is the sum of the soil-moisture tension and the osmotic pressure of the soil solution. Plants growing in a soil in which the soil-moisture tension is 1 atmosphere apparently can extract enough moisture for good growth. But if the osmotic pressure of the soil solution is 10 atmospheres, the total stress is 11 atmospheres and plants cannot extract enough water for good growth.
Available Water
In designing an irrigation system and in making recommendations for i;;,proved techniques of applying water, the engineer needs to know how much of the water in a soil is available to plants. The soil is like a

1-11
tank and holds just so much available water. Its capacity is limited by the total amount of water it can hold between field capacity and the permanent wilting point (fig. 1-5). In addition to soil-moisture tension and the osmotic pressure of the soil solution, availability of water also depends on the temperature of the soil. Low soil temperatures decrease availability.
Ovendry __
Ultimate
wi 11 ii o.l!!.L
WILTING RANGE
-~-Permanent wilting point
Available moisture for sandy loom
---------~a~able --1--to plants HYGROSCOPIC
i WATER
____________ Hygroscopic_
coefficient
Available for survival
Wilting _ coefficient
Available for plant growth
,
CAPILLARY WATER
Limited amt. \ available GRAVITATIONAL
Available moisture ~ ", OR FREE
______ for si_lt loa~ __ __ "", Wf4TER Saturation__ __-.l
I I I I I o 10 20 30 40
SOIL MOISTURE CONTENT (PERCENT BY DRY WEIGHT)
Figure 1-5. --Kinds of water in the soil and difference in availablemoisture content between a sandy loam and a silt loam. The silt loam contains more than twice as much readily available water.
Field capacity is usually considered as the amount of water a Wt:J.1.
drained soil holds after free water has drained off or the maximum amount it can hold against gravity. The large pores in the soil are filled with air, the micropores are filled with water, and any further drainage is slow. In this condition, the soil is said to be at field capacity.
Soil-moisture tension in a salt-free soil at field capacity ranges from less than 0.1 to nearly 0.7 atmosphere, depending on soil texture. Research shows that sands are at field capacity when tension is nea.r 0.06 atmosphere, and laamy sands, such as those in the Norfolk, Lakeland,
1·J2
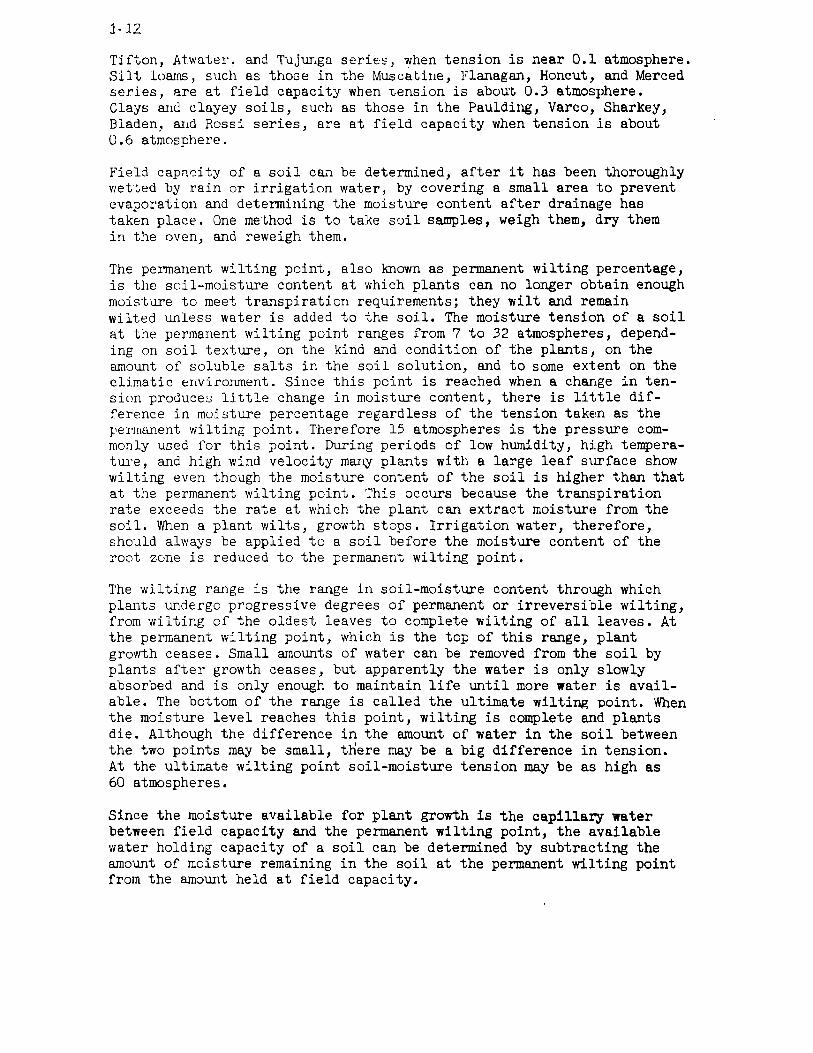
T:ifton, AtwuteL and Tujur,gu seriE.:~, when tension is near 0.1 atmosphere. Silt 1 o allIS , such as thoGe in the Muscatine, Flanagan, Honcut, and Merced series, are at field capacity when tension is about. 0.3 atmosphere. Clays and clayey soils, such as those in the Paulding, Varco, Sharkey, Bladen, and Rossi series, are at field capacity when tension Is about 0.6 atmosphere.
Field capRcity of a soil c~, be determined, after it has been thoroughly wetted by rain or irrigation water, by covering a small area to prevent evaporation and determining the moisture content after drainage has taken place. One method is to take soil samples, weigh them, dry them in the Qven, and reweigh them.
The permanent wilting point, also known as permanent wilting percentage, is the scil-moisture content at which plants can no longer obtain enough moisture to meet transpiration requirements; they wilt and remain wilted unless water is added to the soil. The moisture tension of a soil at the permanent wilting point ranges from 7 to 32 atmospheres, depending on soil texture, on the kind and condition of the plants, on the amount of soluble salts in the soil solution, and to some extent on the climatic erlvirorunent. Since this point is reached when a change in tension produce~3 little change in moisture content, there is little difi'erence in muisture percentage regardless of the tension taken as the J:'ermanent wilting point. Therefore 15 atmospheres is the pressure commonly uDed for this point. During periods of low humidity, high temperature, and high wind velocity many plants with a large leaf surface show wilting even though the moisture content of the soil is higher than that at the permanent wilting point. This occurs because the transpiration rate exceeds the rate at which the plant can extract moisturE~ from the soil. When a plant wilts, gro"Nth stops. Irrigation water, therefore, should always be applied to a soil before the moisture content of the root zone is reduced to the permanent wilting point.
The wilting range is the range in soil-moisture content through which plants undergo progressive degrees of permanent or irreversible wilting, from wilting of the oldest leaves to complete wilting of all leaves. At the permanent wilting point, which is the top of this range, plant growth ceases. Small amounts of water can be removed from the soil by plants after growth ceases, but apparently the water is only slowly absorbed and is only enough to maintain life until more water is available. The bottom of the range is called the ultimate wilting point. When the moisture level reaches this point, wilting is complete and plants die. Although the difference in the amount of water in the soil between the two points may be small, there may be a big difference in tension. At the ultimate wilting point soil-moisture tension may be 8.8 high as 60 atmospheres.
Since the moisture available for plant growth is the capilla.ry water between field capacity and the permanent wilting point, the available water holding capacity of a soil can be determined by subtra.cting the amount of moisture remaining in the soil at the permanent w1.1ting point from the amount held at field capacity.

1-13
Soil texture is of primary importance. For soils low in soluble salts, the finer the texture, the greater the available moisture holding capacity. Figure 1-6 shows the difference in soil-moisture content of a sandy loam and a silt loam at the same tension. But some sandy soils actually hold more available water than some clays, chiefly because in fine-textured soils so much water is held on the particles. Even at the permanent wilting point, the moisture content of some clays is fairly high.
~ :x: ~ 40 LLI ~
>CD
~ Z 30 LLI U a: LLI ~
~ Z 20 LLI ~ Z o U
LLI
~ 10 ~ tn o ~ I ..J
~Field capacity
I Permanent
wi1tin9 paint----..!
6 04-------~-------r------_+--tn 0 5 10
SOIL-MOISTURE TENSION (ATMOSPHERES)
15
Figure 1-6.--Relation between soil-moisture content and soil-moisture tension in a sandy loam and a silt loam.
Well-drained sandy soils have a low available water holding capacity. At field capacity, most of the pore space in sandy soils is filled with air and thus there is little available moisture. Silty soils generally have a good available water holding capacity since a soil made up of silty particles of about the same size releases most of its moisture at tensions ranging from one-third atmosphere to 15 atmospheres. But in same silty soils the spaces between large particles may be filled with smaller particles, resulting in a low available moisture holding capacity. Some silt loarns hold more than 2 inches of available .moisture per foot of soil, but some silty soils are very droughty. Clays and clay loarns are usually high in available'water--about 2 inches per foot of soil--and still hold a considerable amount of unavailable moisture at the wilting point. Organic soils hold a considerable amount of water at field capacity, but since much of the water is not available, they also have a high moisture content at the wilting point.

1-14
The range in available moisture holding capacity common in soils of different texture is given in the following list.
Inches of water per foot of soil
Very coarse texture--very coarse sa.n.ds ••••••••• II ••••••••••••
Coarse,texture--coarse sands, fine sands, and loamy sands ..•....
Moderately coarse texture--sandy loams and fine sandy loams •..•..•.
Medium texture--very fine sandy loams, loams, and silt loams .....•
Moderately fine texture--clay loams, silty clay loams, and sandy clay 10 runs • • • • • . • • • • • • • •••••
Fine texture--sandy clays, silty clays, and clays .....•.•••..
Peats aIld mucks ........ II ••••••••••••
0.40 - 0.75
.75 - 1.25
1.25 - 1.75
1.50 - 2.30
1.75 - 2.50
1.60 - 2.50 2.00 - 3.00
Since accurate evaluation of available moisture is extremely important in designing and operating an irrigation system, available moisture should always be measured or measurements from comparable soils used.
So far in this discussion, field capacity has been considered the upper limit of available moisture. This is not entirely true. In sprinkler and surface irrigation, water applied to the surface of the soil moves dovmward as a front, saturating the upper layers in most soils before the irrigation application is completed. Plant yoots in the upper soil layers take up some of the water between saturation and field capacity. The amount plants use depends on how fast the soil drains to field capacity and on how often it is irrigated. Under good irrigation management on most soils, the length of time in which plants can use the extra moisture before the soil reaches field capacity is limited. For design purposes, therefore, this water is not considered.
Calculating Available Water
The available water in a soil can be calculated if the moisture content (percentage) and physieal properties of the various horizons are lmmm. Table 1-2 shows the moisture content of a Hinckley loamy sand at different tensions and table 1-3, its physical properties.

1-15
Table 1-2.--Moisture content of a Hinckley loamy sand at various tensions
Moisture content at tension of-- Available water
Horizon Depth 1/101
atrnos.
In. Pct. - --A"fJ •••••• 0- 8 21.1
B21 •••• 8-14 22.5
B22 • ••• 14-20 17.0
c ...... 20-26 9.8
D •••••• 26-32 6.0
1 Field capacity. 2 ",'Ii: ting point.
1/3 2/3 atmos. atrnos.
Pct. Pct. -- -13.7 12.5
16.9 13.8
13.2 10.8
7.6 5.8
5.5 3.0
5 15 2 In atrnos. atrnos.
In soil horizon
Pct. Pct. In. per In. -- -- in. -8.3 8.3 0.147 1.18
8.7 8.7 .173 1.04
6.2 5.1 .146 .88
3.9 3.0 .095 .57
2.0 1.4 .068 .41
Total-- 4.08
Table 1-3.--Physica1 properties of a Hinckley loamy sand (Soil analysis by Agricultural Research Service)
Bulk Particle-size distribution Textural Organic Horizon Depth deusity class matter Sand Silt Clay
Inches Percent Perc.ent Percent Percent
Ap ..... 0- 8 1.15 80.6 16.9 2.5 Loamy sand 3.57 I
B21 ··· . 8-14- 1.25 76.8 20.7 2.5 Loamy sand 1.90
B22 •·· . 14-20 1.23 78.7 18.8 2.5 Loamy sand 1.02
C •••••• 20-26 1.39 86.8 10.7 2.5. Sand .62
D .•.... 26-32 1.47 95.0 2!5 2.5 Sand .25

1-16
For irrigation, moisture content is expressed preferably in inches of water per inch of soil or in inches of water per foot of soil instead of percentage by weight. To convert soil-moisture content from percentage by weight to a volwne basis, the following equation can be used.
db x d x P w D=
d x 100 w
'Ii'here D = inches of water in soi 1 depth (d)
d bulk densit ~.!~ight of ovendry soil in grams \ b = Y \fleld volwne of sample in cubic centimeters)
d = depth of soil sample in inches
P = moisture content between field capacity and wilting point in w percentage by weight
d = density of water taken as 1 w
The last two coluJIms in table 1-2 were calculated by using tLis formula. For examFle, the available-moisture content of the Ap horizon is calculated from data in tables 1-2 and 1-3 for a soil depth of 1 i.nch as follows:
db = 1.15 (from table 1-3)
d = 1 inch
d = 1 w
P = 21.1 - 8.3 = 12.8 (table 1-2) Vi
D = 1.15 x 1 x 12.8 = 0.147 inch 1 x 100
Therefore, the total available water in the Ap horizon, which is 8 inches deep, is 0.147 x 8, o~ 1.18 inches.
For irrigation-system design, the total available water is ce.lculated for a soil depth based on the root system of a mature plant of the crop to be grown. For any soil this amount is different for different crops, depending on their rooting characteristics. Root systems of plants are discussed on pages 1-29 to 1-3'1. The total amount of available water in t.he 32-inch depth of the soil shovm in table 1-2, for example, is 4.08 inches, the sum of that in the five horizons. If a shallow-rooted crop growing in this soil were to be irrigated to a 20-inch depth, the total amount of available water could be determined by adding the amount that can be he ld in hori zons Ap 1 B211 and B221 whi ch is 1.18 + 1. 04 + 0.88, or 3.10 inches.

1-17
WATER INTAKE
The movement of irrigation water from the surface into and through the soil is called water intake. It is the expression of several factors, including infiltration and percolation.
Infiltration
The downward flow of water from the surface into the soil is known as infiltration. Water enters the soil through pores, cracks, worm and decayed-root holes, and cavities introduced by tillage. In many places infiltration is restricted by surface sealing or crusting.
Per~olation
For irrigation water to be effective in replenishing the soil's water supply, it must be able to move down, or percolate, through the soil to a predetermined irrigation depth. This movement of water through the soil profile is kno,vn as percolation. The percolation rate is governed by the permeability of the soil or its hydraulic conductivity. Both terms are used to describe the ease with which soil transmits water.
Permeability is the quality of soil that enables it to transmit air and water. It is independent of the viscosity of water. The relative permeability of soils is described in general terms as rapid, moderate, and slow.
Hydraulic conductivity is determined by both the soil and the fluid transmitted. It expresses the readiness of a soil to let a particular fluid flow through it for a given potential gradient. It is the coefficient "k" in Darcy's Law (v = ki) in which v is the effectiv02 flow velocity and i is the hydraulic gradient. The values of k depend on the properties of the fluid as well as on those of the soil, and they reflect ~~y interactions of the fluid with the porous medium, such as swelling of a soil and the attendant reduced porosity.
Since water percolates chiefly through the large pores in a soil, percolation depends on the relative number and continuity of these pores. A soil that has high porosity and coarse open texture has a high hydraulic-conductivity value. For two soils of the same "total" porosity, the soil with small pores has lower conductivity than the soil with large pores because of the resistance to flow in small pores. A soil with pores of many sizes conducts water faster if the large pores form a continuous path through the profile. In fine-textured soils, conductivity depends almost entirely on structural pores. In some soils, particles are cemented together to form nearly impermeable layers commonly called hardpans. In other soils, very finely divided or colloidal material expands on absorbing water to form an impervious gelatinous mass that restricts the movement of water.

1-18
The quality of the water trru1smitted, particularly its salinity and alkalinity, has a marked effect on hydraulic conductivity. A change in the viscosity of water has an effect. A chemical change in water may greatly affect hydraulic conductivity without changing viscosity. The addition of a small amount of sodium chloride to the soil water, insufficient to make any noticeable difference in viscosity, may affect soil structure so much that hydraulic conductivity is greatly reduced.
Factors Affecting Intake Rate
The intake rate of a soil is a measure of its capacity to take in and absorb irrigation water applied to the soil surface during the period of time in which water is applied. The amotll1t of moisture already in the soil greatly influences the rate at which water enters the soil. The soil takes in and absorbs irrigation water rapidly when water is first applied to the field surface. As the irrigation application continues, the surface soil gradually becomes saturated and the intake rate decreases until it reaches a nearly constant value.
The intake rate of any soil is limited by any restriction to the flow of water into or through the soil profile. The soil layer with the lowest transmission rate, either at the surface or below it, usually determines intake rate. The most important general factors that influence intake rate are the physical properties of the soil and in sprinkler irrigation the plant cover. But for any given soil other factors may affect the intake rate.
SURFACE SEALING. The formation of a thin compact layer on th.e ground surface rapidly reduces the rate of water intake through the surface. This layer results from a breakdo~n in structure, in part because of the beating action of raindrops or sprinkler drops and in part be-cause of the action of water flowing over the surface whereby fine particles are fitted around larger particles to form a relatively impervio~~ seal.
The effect of surface sealing on intake can be greatly reduce'd, if not eliminated, by protecting the soil surface with a mulch or some other permeable material. Grasses or other close-growing vegetatioT.L will help to prevent surface sealing. The hardened or compact surface of a soil subject to surface sealing can be broken up by a light cultivation before irrigation water is applied.
SOIL COMPACTION. On some wet soils tillage operations may cause compaction and the formation of a plowpan just below cultivation depth. A plowpan impedes water movement and reduces the intake rate. The intake rate is materially reduced in furrows where tractor wheels operate. Subsoiling helps to improve the movement of water through a plowpan and thus the intake rate, particularly in soils that have a relatively impermeable sublayer that can be broken up. The soil takes in more water through the enlarged openings and continues to take in water so long as they remain.

1-19
SOIL CRACKING. On heavy clay soils that crack on drying, irrigation generally can be accomplished by rapidly filling the cracks before the soil starts to swell. The amount of water that can be applied depends on the number and size of the cracks. As soon as the soil particles become wet, they begin to swell; eventually the cracks are closed so that further intake is either impossible or extremely slow.
TILLAGE. The intake rate may be increased by plowing, cultivating, or any other stirring that increases the size of openings. But the beneficial effect of cultivation on soil porosity and intake lasts only until the soil settles back to its former condition of density because of subsequent rain or irrigation. The intake rate of loose, porous sands is not likely to be increased by any artificial disturbance. On some soils, cultivation reduces intake by closing up the natural surface openings that lead into the body of the soil. The most important effect of tillage on water movement is to break up a surface seal.
CROP ROTATIONS. If coarse organic materials are evenly incorporated into the soil, porosity remains high for comparatively long periods, depending mostly on the rate of decomposition of the materials. The intake rate can be maintained and even increased by using a cropping system that provides for incorporating crop residues in the upper few inches of the soil, growing grasses and legumes, and using any other methods that increase the organic-matter content of the soil. If a good crop rotation is followed, the proportion of stable soil aggregates is increased, which means large pores and consequently a high water-intake rate. '
SOIL AND WATER SALTS. Any salts contained in irrigation water accumulate in irrigated soils and in time may change their character. This accumulation is serious in the arid West where almost all water is supplied by irrigation. In humid areas rainwater percolating through the soi 1 leaches out most accumulated substances. But, in arid regions it is often necessary to overirrigate (leach) periodically to remove soluble salts from the soil.
Some soluble salts in irrigation water such as potassium nitrate may be directly beneficial to crops. Under some conditions, calcium and magnesium have a beneficial effect on the physical condition of the soil. High concentrations of sodi~~ chloride or sodium sulfate, however, have a detrimental effect. If the sodium concentration is high, soil structure breaks down and eventually the soil colloids are dispersed, resulting in a tough or rubbery condition. Tilth and permeability are reduced. This sealing is noticeable even in some sandy soils.
The physicaf properties of some alkali soils, including intake, can be improved by adding chemicals or soil amendments through which exchangeable sodium is replaced by calcium. A comparatively economical and often used soil amendment is calcium sulfate, or gypsum. In some soils, its use results in improved perrne,abili ty and aeration and thus better root development and plant growth. Other chemicals that can be used on some soils are sulfur and aluminum sulfate.

1-20
SEDIMENTS IN IRRIGATION WATER. In some places, fine silt and clay particles carried in suspension affect the quality of irrigation water. Whether this is detrimental or beneficial depends on the amotmt of silt transported, the length of time the silty flow continues, and the texture of the soil to which the water is applied. Occasional deliveries of silty water may be beneficial on coarse sandy soils inasmuch as the sediments improve the physical condition of the root zone, thereby reducing the rate of water mover:lent. They also add some plant Ilutrients such as potassium, calcium, and phosphates to the- soil. But silty water applied to fine-textured soils generally makes the surface of the soil still more slowly permeable and difficult to cultivate.
SOIL EROSION. As erosion progresses, the intake rate of many soils is reduced since less permeable material such as a dense clay subsoil is wlcovered. In other soils erosion exposes coarse-textured la;fers such as sand and gravel. Here the intake rate is increased and irrigation efficiency is greatly reduced.
LAND LEVELING. 'lhe moving and IDlXlng of soil in land leveling may change the water-intake rate of any given area. The effects are similar to those of erosion in that either more permeable or less permeable soil material is uncovered. Earth-moving equipment used in land l,:veling may compact the soil and thereby reduce the intake rate. Subsoiling is often necessary after land leveling.
TEMPERATURE. Tests show that water intake is greater during surraner rains than during winter rains. Apparently the temperature of irrigation water has some effect on intake rate since the coefficient of viscosity of water decreases rapidly as temperatures increase. This effect is not considered significant by most authorities.
Variation in Intake Rate by Irrigation Method
The water-intake rate varies with the method of water application (fig. 1-7). Since sprinkler irrigation is similar to rainfall, a soills intake rate under this method is modified by the amount of cover. Bare fields, fields newly seeded, and fields in row crops take in water more slowly than fields that have a good grass-legume crop or mulch cover. Soils that are subje-ct to surface sealing under rainfall are likely to seal under sprinkler irrigation. For sprinkler irrigation, intake rate is expressed in inches per hour.
In partial-flooding methods, water is applied by running small streams in fillTows or corrugations and 'only a part of the soil surfa.ce is flooded. Water moves both dovmward and outward from a furrow, and the intake rate depends on the capacity of the soil to transmit water both vertically and laterally. The intake rate depends also on th.e wetted perimeter of the furrow. It is higher in furrows having large wetted perimeters than in furrows having small wetted perimeters. For furrow irrigation, the intake rate usually is expressed in gallons per minute per 100 feet of furrow.

1-21
SPRINKLER
WAr€R .MOV€M€Nr VERrlCALLr DOWNWARD
BORDER
..
WAr€R MOV€M€Nr V€RrICALLr DOWNWARD
WArER MOVEM€Nr BorH DOWNWARD AND ourWARD FROM FURROW
Figure 1-7.--Water-intake rate varies with method of irrigation.

1-22
Under flooding methods--border, contour levee, and contour ditch--the surface of the soil is completely flooded. Water moves into the soil vertically. Although depth of flooding has some effect on the intake rate, it is generally ignored in designing an irrigation system because the effect is so small. For flooding methods, the intake rate is expressed in inches per hour.
Intake Characteristics
Since so many factors affect water intake, it is not surprising that it varies so much among soils. Furthennore, the intake characteristics of a given field vary from place to place, from irrigation to irrigation, and from season to season. The intake characteristics that must be considered in sprinkler-irrigation design differ from those for surface methods.
RELATION OF TOTAL INTAKE TO TlME. This relation is an expression of the time (measured from the beginning of an irrigation application) required for a soil to absorb a specified amount of water. A lmowledge of the relation between time and total intake is especially important in surface methods of irrigation. Figure 1-8 shows this relation for three soils, representing a high, a moderate, and a low intake rate. The soil that has a moderate intake rate absorbs 3 inches of water in about 1-3/4 hours. For a 3-inch application it can be concluded that an irrigator in flooding his land would waste water if he applied water for longer than 1-3/4 hours. This same soil needs to be wetted for only one-third of an hour for a l-inch application and for about 4-1/2 hours for a 6-inch application. The irrigator can control amount of intake by varying the length of time water flows over the field. This relation between total intake and time helps to determine the speed with which the wet franc advances across a field and thus to a great degree controls the permissible length of run. Curves to show this relation can be developed by following the procedures outlined W1der methods of determining intake.
RELATION OF INTAKE RATE TO TDJE. This relation is an expression of the instantaneous rate (inches per hour) at which water enters the soil measured at some time after the application is started. It is especially important in sprinkler irrigation and in surface methods where the stream size varies. Figure 1-9 shows this relation for the same soils shovm in figure 1-8.
Note that at the start of irrigation the intake rate is high but that it declines rapidly. After some time, it reaches a point beyond which it r.hanges very little. A comparison of figures 1-8 and 1-9 shows that the high-intake-rate soil absorb.s 3 inches of water in about one-third of an hour and that at the end of that time the intake rate has declined to about 4.6 inches per hour. The moderate-intake-rate soil absorbs 3 inches in 1-3/4 hours, by which time the intake rate has declined to about 1.2 inches per hour. In the low-intake-rate soil, the total time is 6-1/2 hours, by ",thicl: time the rate is 0.3 inch per hour. The relative position on the intti1<e-rate curve at the time irrigution is completed is markedly

II! • \.J J: U Z ,
\.J • II: (
I-Z 3
.J ( I I-o I-
1-23 HIGH-INTAKE-RATE SOIL.
-IZ-V- +------+----- ./"""r'" i
~ ----- I-
j[c::;. MODERATE-iNTAKE-RATE SOIL .,.-
! ./ V / £ LOW-INTAKE-RATE SOIL
/ / I! ./
VI I
vy I I
V 1 i
0 5 ! 10 IS 20 25 30
• TIME (HOURS)
Figure l-S.--Relation of total intake to time for three soils. A 3-inch application is absorbed by the high-intake-rate soil in one-third of an hour, by the moderate-intake-rate soil in 1-3/4 hours, and by the low-intake-rate soil in 6-1/2 hours.
II: :::I o 6 T
"-II! 5 \.J J: U
Z •
\.J l I-(
II:
\.J
II:
( I I-Z
o
I , I I I I I
I I
I I I , : I I
~l i'-I I
\ 1 l\l '- i
I I
! I I
I I i
I I I
I
! ,--- I- HIGH-INTAKE-RATE SOIL
I I
r I I
i ! r MODE:RATE-INTAKE-RATE SOIL i I
I ,-- LOW-INTAKE-RATE SOIL I 10 15 20 30
TIME (HOUR!»
Figure l-9.--Relation of intake rate to time for the three soils shown in figure l-S. At end of the 3-inch 'application, the intake rate in the high-intake-rate soil has declined to 4.6 inches per hour, in the moderate-intake-rate soil to 1.2 inches per hour, and in the lowintake-rate soil to 0.3 inch per hour.

different for the three soils. In the high-intake-rate so~l, the intake rate is still declining rapidly; in the low-intake-rate soil, the intake rate is nearly stable.
BASIC INTAKE RATE. Although the term "basic intake" (or "final intake") has been widely used, it. has been only loosely defined. Generally, it has meant the nearly constant rate that develops after some time has e lapsed from the start of irrigation. Thus, the low-intake-ra-~e soi 1 shown in figure 1-9 probably would be assigned a basic rate of about 0.3 inch per hour. Assigning a basic rate to a high-intake-rate soil is more difficult because usually irrigation ceases before anything approaching the basic rate has been reached. In the Soil Conservation Service, a change in intake rate of 10 percent or less in an hour has been considered unimportant. Hence, the basic rate is considered to be the point on the curve Elt which the change in rate is 10 percent. Since the significrulce of the terms basic rate and final rate often has been misllilderstood, they are seldom used by SCS.
AVERAGE INTAKE RATE. The average intake rate, which has been used in some areas in designing surface-irrigation systems, is computed by di viding total intake by time. The average intake rate for thl: moderateintake-rate soil iIl figure 1-9, for example, c;:m be computed in the following way.
Ar:1Clllilt of Time in Average intake rate in intaJ.:e in inches hours inches--E:r hour
1 1/3 3.0
., 1-3/4 1.7 -"
6 4-1/2 1.3
The average intake rate for a given soil changes when the amount of intake changes, v,hereas the basic rate remains the same. Complete intake curves as expressed by intake families provide a much better tool and are now used in SCS for irrigation design.
INTAKE RELATIONSHIP FOR DESIGN. For sprinkler irrigation, the rate of application is plrulIled to be no higher than the rate at which a soil can absorb water, and so the intake rate-time relationship (fig. 1-9) is the basis for design. It should be pointed out that soils that respond similarly when flooded may sho}\' widely different responses under the impact of droplets. The general shape of the curve, however, remains the same as that sho'l.11 in figure 1-9 and indicates that for a gi vl:!n soil the maximum rate of application may be higher for light applications than for heavy applications. To be of value for sprinkler design, these curves must be developed by applying water in a manner sWlar to sprinkler application and for cover similar to the crop that :is to be irrigated.

1-25
In surface methods of irrigation, the relation of total intake to time is the basis for system design. This curve (fig. 1-8) shows the length of time water must be applied to a given soil for a specified application amount. Such curv~s can be developed by following the procedures outlined under Methods of Determining Intake.
Intake Families
Each kind of soil has its own intake characteristics, but the differences between some soils are so minor that for all practical purposes several soils can be considered together. Eight groups, shown in figure 1-10, can be used to characterize intake. These groups, called intake families, have been assigned numbers such as 0.1, 0.3, and 0.5, which are merely designations that approximate the basic-rate values for soils in those families.
e • · , u ! w · ~ z ,
D
" 5 , I , u u <
1"./; ./.. V.c ./
Figure l-lO.--Intake families for surface-irrigation design.
The intake families shown in figure 1-10 were developed by analyzing cylinder-infiltrometer data for a large number of sites. For most soils, curves developed from measured data closely parallel those shown in this figure. These typical curves apply only to soils that do not crack much on drying. They were plotted on a logarithmic scale to better represent values for short periods of time.
The families shown represent about equal increments in the change of recommended length-of-run for surface methods. Comparison of a series of intake measurements for a given soil with figure 1-10 will help to determine the correct intake curve to be used for design. Thus, the moderateintake-rate soil shown in figure 1-8 may be considered to be in the 1.0-intake family because its values show that it has a very close resemblance to the 1.0 curve in figure 1-10.
Although the typical intake families shown in figure 1-10 were determined from test results applicable only to surface-flooding methods, it is logical to assume that the same general relationships hold for other surface-irrigation methods. Thus, soils that are in the same intake

1-26
family when irrigated by surface-flooding methods can be expected to be in the same family when irrigated by other surface methods su.ch as furrows.
Figure 1-11 shows the intake characteristics measured by cylinderinfiltrometer tests for two soils. Each of these curves represents a single test of five cylinders each. Test A follows the typiCB.1 curve very closely and indicates that this soil is in the 0.5 family. Test B does not follow the typical curve so closely, but ,the soil tested is well within the 2.0 family for a total intake of 2-1/2 to 8 inches. The normal irrigation application on this deep silt loam for the crops grown ranges from 3 to 6 inches. We can conclude, therefore, that for design purposes this soil is in the 2.0 family.
· ~ , u ~ · · (
~ , e 5 , , J , u u (
","" ..... ~ ,,-
10
I" /
..- ~ V / ~ '"
)'A,o, "
I~~ ~ '/.~, \~ ,.../\9
"'" ~.". " v "" '" v'" ,/ ~ " .... "'/ ~ ~
,,-'" ..... 1-' ",," L· ... I ....
~ ,,-
~...- ..... " "," V i.;" I)'" , .... ,; ...- ./ ",
'" 10 so 70 100
~ "" ~ " I~ I " L""- ..
'. '~"' ,,': "'/ V '.,/
,'" rJ!' ~ ",,' ~~. o~
I" 0)
./ "', '" ,,'"
,;.. ... .....
100 ... lIDO 70CI 1000 - -TINE (MINUT •• )
Figure l-ll.--Example of the classification of a soil in an intake family by test.
0<1>0
Figure 1-12 shows intake curves for two soils that crack. Here the water that enters the cracks is an appreciable amount of the total irrigation, and the intake rate is very slow after the first few minutes .. Soils with these characteristics must be specially evaluated in designir~ a system.
Intake Variability
If a series of tests is made on the same field at different times under different conditions, the results may seem to place the soilE! in several intake families. Seldom, if ever, do all parts of a field or a soil type have the same intake rate since minor variations affect intake. The effect of any compaction caused by operating farm equipment over the field is particularly noticeable. Even the most uniform soil has some variation in physical properties, and no two soil samples give exactly the same test results.
In designing an irrigation system, therefore, the engineer ml~t determine the intake rate that most nearly represents the usual condition and then provide facilities that permit changes in management th~lt may be needed for other intake conditions. If this is done, irrigat:Lon efficiency will be highest when the actual field condition matchE~s that used to design the system. Satisfactory efficiency can be had witll little

-· U · , U
• - . u
• J (
• z
J • (
• C
•
-~
"
I
5,",-"A~E:'f c.L..JIo."
I 'J><
;'U~;::;;.... .... ~~
~ r--
! ..
1-27
L".o~"" L,...--~
-~ f--"
I .. 'ao I. roo IOGD lOGO JOOCI
TIMII: (MIHUTIl.)
Figure 1-12.--Total intake and time relation for two soils that crack on drying.
change in procedure if the actual field condition is no more than one intake family different from that used for design. If there is more variation in intake, the stream size used may need to be adjusted to maintain acceptable irrigation efficiency with surface methods.
~igu.re 1-13 shows the amount of variation in test results for a group of deep, uniform, medium-textured soils in one State. Of the 286 sites tested, 26 percent are in the 0.3, 25 percent in the 0.5, and 16 percent in the 1 intake family. The midpoint is 0.5, and this is probably the logical design family for these soils. This particular grouping is based on texture alone. If other physical properties in addition to texture had been used to characterize these soils, this one group might have been broken up and there might be considerably less variation in any one group.
26% 26
23% "0 24 III 22 ....
"0 :! 20 ..... 1Il
!Jl 18 16%
III 16 14% ..... .... 14 !Jl
..... 12 0 III 10 8% 01 ro 6 ....
5% c: 6 4% aJ u
4 2% 2% 1-0 (J)
Q., 2 .. .. 0
0.1 0.3 0.5 1.0 1.5 2.0 3.0 4.0 Over 4.0
lntake family
Figure 1-13.--Example of variation in intake characteristics and distribution in intake families for a group of medium-textured soils.

1-28
Methods of Determining Intake
Many of the present irrigation systems, both surface and sprj.nkler, are poorly suited to the soils and topography on which they are \~ed. Often the intake rate was not }mown before a field was laid out and an irrigation system designed. In most areas where irrigation is now being developed, few data on intake rate are available. For successful irrigation, studies to determine the effective intake rate must be made in all irrigated areas in order to improve design criteria and operational techniques. Standard methods and procedures for these stUdies have been developed.
For sprinkler-irrigation design, a good way to determine the intake rate is to measure the water-application rate at selected points jln the distribution pattern of operating sprinklers. Measurement should be delayed until near the end of a normal irrigation "set," at which time the intake rate of the soi 1 is approaching the minimum value. To mflke the measurements, catch cans are placed at the points at which the application rate seems to equal the intake rate. The water collected in these cans in a given length of time is then measured to determine the application rate (maximum design intake rate) in inches per hour. ~lere a low application rate is commonly used, it may be necessary to change the nozzles on one or two sprinklers to obtain a rate adequate for one evaluation.
For furrow and corrugation methods of irrigation, intake ch~racteristics usually are determined by inflow-outflow measurements. This procedure, which includes measuring the water entering the furrow, its :rate of advance, and the outflow from the lower end, supplies a complete intake curve to use as a basis for design and operation.
For border and other controlled-flooding methods of irrigation, intake characteristics are often estimated by using cylinder infilt:rometers. These intake curves are then used as a basis for designing irrigation systems and for management criteria. Inflow-outflow measurements, which include the rate of advance, time of recession, and depth of flow can also be used to determ.:l.ne intake characteristics for design and operation of border systems.
Plants
To design a successful irrigation system, the irrigation eng:Lneer must know the rooting characteristics of plants and how plants USt~ moisture. Since a continuous supply of available moisture is necessary for good plant growth, the irrigation system for any given crop must ·be designed to supply the right amount of water during that crop's peak-use period. To determine the amount of soil moisture available to that crop, it is necessary to know from what depth of soil tbe plants get the:ir moisture, or their moisture-extraction pattern, and how fast they use lDQisture.

1-29
ROOTING CHARCTERISTICS
The size of the soil reservoir that holds water available to a plant is determined mostly by that plant's rooting characteristics. The distribution of its roots determines its moisture-extraction pattern.
How Plants Get Their Moisture
Most plants have an enormous absorbing root surface. Near the growing tip of each root or rootlet, there are many root hairs in close contact with soil particles and with the air spaces from which roots get their oxygen. Through osmotic and other forces, root hairs extract moisture from the film of water that surrounds each soil particle.
Two phenomena seem to explain how a plant gets the enormous amount of water it takes in and transpires: (1) Capillary movement of water to plant roots and (2) growth of roots into moist soil.
As roots take up moisture, tension around the soil particles increases and water moves toward these points of plant absorption. How effective capillary movement is depends on how much water can be delive~ed to the soil around the roots and how fast it gets there. But since there is little root extension when the soil-moisture content is low, it is likely that near the wilting point any water that reaches plant roots must move-to them.
During favorable growing periods, roots often elongate so rapidly that sa~isfactory moisture contacts can be maintained even when the soilmoisture content declines and without much help from capillary movement. Where a good root system has developed during favorable growing periods, a plant can draw its moisture supply from deeper soil layers. Thus if the roots in the upper part of the soil have depleted the moisture there to below the wilting point, plant needs can still be met provided roots have already grown into deeper layers that contain an adequate moisture supply.
Kinds of Root Systems
The kind of root system a plant develops is fixed by heredity. Each species has its own characteristic growth habit. Some plants have a tap root that penetrates deeply into soil under favorable conditions. Other plants are slow growing and develop shallow primary roots and many lateral roots.
Most of the roots of spinach and celery are in the surface foot of soil, and those of potatoes are within the upper 2 feet. Corn, cotton, and tomatoes permeate an open soil to a depth of 4 feet or more. Alfalfa and asparagus roots penetrate good soils to a depth of 8 to 10 feet or more. Cucumber roots extend laterally 5 or 6 feet in the plowed layer. Asparagus roots make little lateral spread in comparison with their depth.
1-30
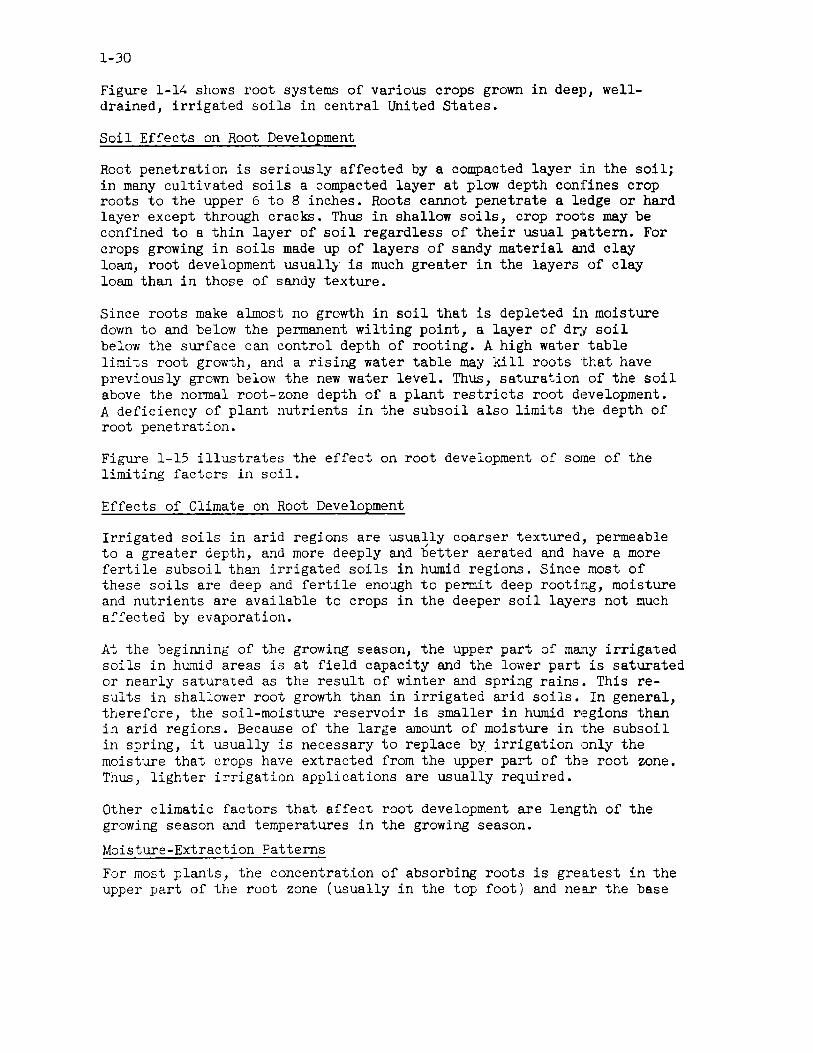
Figure 1-14 shows root systems of various crops grown in deep, welldrained, irrigated soils in central United states.
Soil Effects on Root Development
Root penetration is seriously affected by a compacted layer in the soil; in many cultivated soils a compacted layer at plow depth confines crop roots to the upper 6 to 8 inches. Roots cannot penetrate a ll~dge or hard layer except through cracks. Thus in shallow soils, crop roots may be confined to a thin layer of soil regardless of their usual pattern. For crops growing in soils made up of layers of sandy material wld clay loam, root development usuallJ is much greater in the layers of clay loam than in those of sandy texture.
Since roots make almost no growth in soil that is depleted in moisture down to and below the permanent wilting point, a layer of dr.f soil below the surface can control depth of rooting. A high water table limits root growth, and a rising water table may kill roots that have previously grown below the new water level. Thus, saturation of the soil above the normal root-zone depth of a plant restricts root development. A deficiency of plant nutrients in the subsoil also limits the depth of root penetration.
Figure 1-15 illustrates the effect on root development of some of the limiting factors in soil.
Effects of Climate on Root Development
Irrigated soils in arid regions are usually coarser textured, permeable to a greater depth, and more deeply and better aerated and have a more fertile subsoil than irrigated soils in humid regions. Since most of these soils are deep and fertile enough to permit deep rooting, moisture and nutrients are available to crops in the deeper soil layers not much affected by evaporation.
At the beginning of the growing season, the upper part of ma~y irrigated soils in humid areas is at field capacity and the lower part is saturated or nearly saturated as the result of winter and spring rains. This results in shallower root growth than in irrigated arid soils. In general, tberefore, the soil-moisture reservoir is smaller in humid r'::!gions than in arid regions. Because of the large amount of moisture in the subsoil in spring, it usually is necessary to replace by irrigation only the moisture that crops have extracted from the upper part of th::! root zone. Thus, lighter irrigation applications are usually required.
Other climatic factors that affect root development are length of the growing season and temperatures in the growing season.
Moisture-Extraction Patterns
For most plants, the concentration of absorbing roots is greatest in the upper part of the root zone (usually in the top foot) and near the base

POTATO
5UGAfI BE£T SANor SOIL W/rH LA"£RS Of' CL;4r IN 2Q6AND tlllJ. Fr.
-?:
1FT "] ~-
."
;
.... ~ I!!!
L.IMA BCAN
a
rOMATO
SVGAR BEET IRRIGATCD
ONION
SPINACH
IIATURe CORN
CUCUMBER
ALrAL'A IRRIGATeD
qeD CLoveR MATURe
srRA~BERR"
1-31
Figure 1-14.--Root systems of field and vegetable crops in deep irrigated soils of central United States.

1-32
HIGH WATER TABLE
DRY SOIL AT OR BELOW WILTING PERCENTAGE-'----
Figure 1-15.--S011 effects on root development.

1-33
of the plant. Extraction of water is most rapid in the zone of greatest root concentration and under the most favorable conditions of temperature and aeration. Since water also evaporates from the upper few inches of soil, moisture is withdrawn rapidly from the upper part of the soil. As the amount of moisture in this part of the root zone is diminished, soil-moisture tension increases. Plants then get moisture from lower parts of the root zone.
In uniform soils that are fully supplied with available moisture, plants use water rapidly from the upper part of the root zone and slowly from the extreme lower part. Basic moisture-extraction curves indicate that almost all plants growing in a uniform soil with an adequate supply of available moisture have similar moisture-extraction patterns. The usual extraction pattern (fig. 1-16) shows that about 40 percent of the extracted moisture aomes from the upper quarter of the root zone, 30 percent from the second quarter, 20 percent from the third quarter, and 10 percent from the bottom quarter. Values for individual crops are within a range of ~ 10 percent.
In nonuniform soils, the amount of moisture available for crop growth may be determined by the soil layer that has the lowest amount of available moisture. If the top layer of a soil has a low water-holding capacity, the available moisture is soon exhausted. If the moisture supply is not immediately replenished, plants can draw moisture only from lower levels at a less efficient rate and their growth is retarded. Any lower' layer in the soil that has a low water-holding capacity also limits the total amount of moisture that plants can use. Some examples of limiting layers are shown in figure 1-17.
The usual extraction pattern for a given crop is changed by any barrier in the soil that restricts root development. Similarly, if the moisture level in the upper layers of the soil drops much below field capacity, a plant IS extraction pattern differs greatly from its usual pattern (fig. 1-18).
Design Moisture-Extraction Depth
This is the soi 1 depth used' to dete-rmin~' irrigation-water requirements for design. It is the depth in which a high moisture level must be maintained for top production of agricultural crops. It is not necessarily the maximum root depth for any giv~n plant, especially for plants that have a long tap root. For best results, it should be the depth from which most of the feeder roots of an average mature plant extract moisture.
Since root development for any one crop varies in different parts of the country because of soil and climatic differences, the design depth should be based on local moisture';::&:traction data for locally adapted crops. If two or more plant species Vrl.t.p different rooting characteristics are to be grown together, the design._depth should be that of the plant having the shallower root system.

1-34
% _ .... '.': 40% EXTRACTION . .
1° W. ------O:J: ~I-
~ 30% HERE I-Q. !!!w 0 0 4 ~z ------wo
% z-01-N U
<I 1-0: -------01-
~ ox o:w
4 ------
Figure l-16.--Average moisture-extraction pattern of plants growing in a soil without restrictive layers and with an adequate supply of available moisture throughout the root zone.
0 0
I ¢
I ..... ~ 0.. 0
""' 0 ¢ ..... ILl Z 0 0
¢ N ..... ~
0 0 0 <: a:: :::::
Uniform Limilin4ij Profile
L -Top 1/4 oyer
Mod. Coorse o ... er Medium
Top 1/4
Mediumover Mod.Coorse
2 nd. 1/4
Medium over Mod. Coorse
Top 1/4
Medium over Coarse 3rd.I/4
Figure 1-17. --Moisture-extraction patterns as determined by availablemoistllre content in various parts of soil profile. Width of each profile represents available moisture; gross area (height and width) 9f each profile represents total available moisture in profile; hatched area shows moisture-extraction pattern for each profile. (Redrawn from Shockley, Dale R. Capacity of Soil To Hold Moisture. Agr. Eng in. 36(2): 109-112. 1955.)
/

1-35
Moisture level low Moisture level high Aug. 13-25 Aug. 26-31
- - - 0 - - - - - - - - - - - - - - - - - - - - - - -,-------, -~ .051 0.136 .r= u 7 ---- ---------------- Ioo--------r- ---C
.054 Data from the :z: to.. W Q
14----0.12'2
Coshocton Ohio ------------------ -- ----- r-- -----
..J
o (f)
.053 Soil and Water .055 Research Station 21----- -------------------------
.044 .046
--28-----~~-----------------------~~------0.202 ----Total used---0.363
Average daily values (inches)
ngure 1-18. --Moisture-extraction patterns for a low and a high moIsture level. (Redrawn from l:iarrc1d, 1. 1. AvailablE: Moisture for Crops. Agr. Engin. 35: 99-101. 1954.)
Table 1-4 gives examples of the design moisture-extraction depth for various crops and geographical areas for deep, medium-textured, moderately permeable soils. -
CO!"!SUMFTIVE USE
Consumptive use, often called evapotranspiration, includes water used by plants in transpiration and growth and that evaporated from the adjacent soil and from precipitation intercepted by plant foliage (fig. 1-19). It is expressed in acre-feet or acre-inches per acre or in depth in feet or inches.
Transpiration is ;the process by which water is removed from the soil by a plant, moved through the plant to the leaves, and lost to the atmosphere in vapor form. For irrigatiol1, the moisture used in plant growth and that retained by the plant is included. Evaporation from the soil surface is not included in trallspiration but is inclt;,ded in consumptive use.
Tra..'1spiration occurs most.ly from the leaves of a plant, but -a small part of the emitted moisture comes from the y.ounger sterns. It occurs mostly during the daylight hours, and only a small amount, possibly 5 to 10 percent, occurs during the night. The rate of transpiration is lowest just before sunrise and usually reaches a maximum shortly before noon. Transpiration accounts for a substantial part of the total consumptive use of a crop.
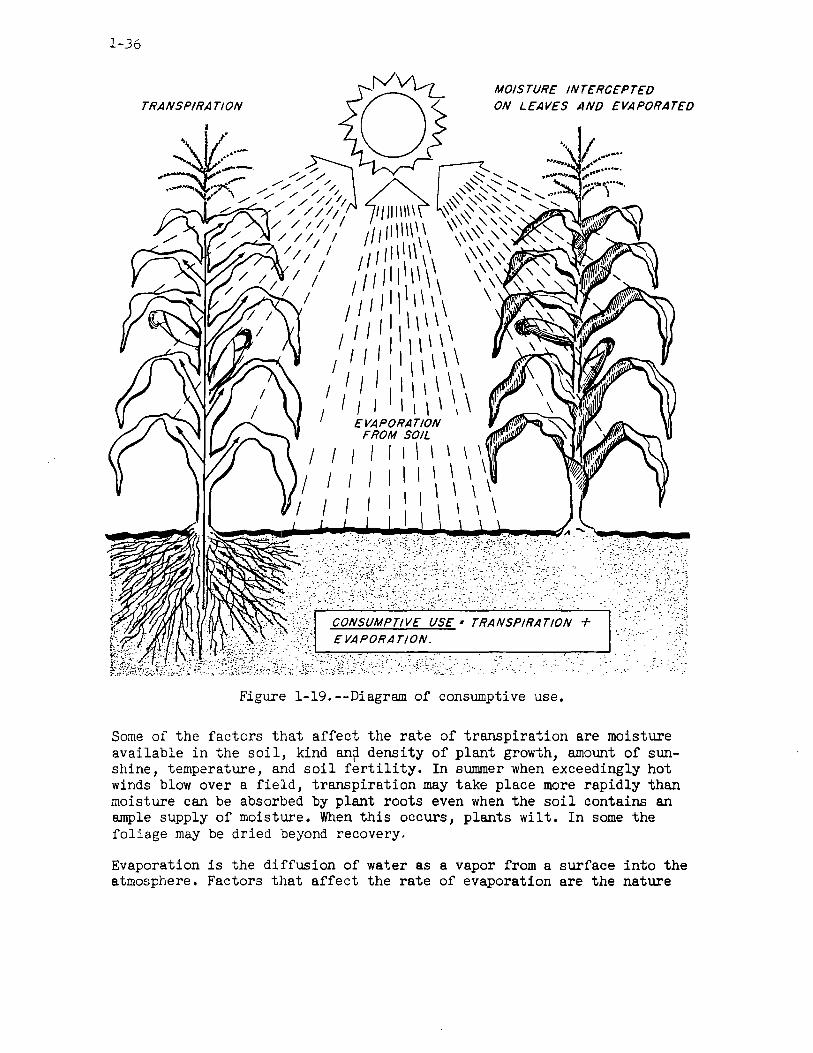
1-36
MOISTURE INTERCEPTED TRANSPIRATION ON LEAVES "INO EVAPORATED
... ;.i.:;i;.\~:;if:,'C.~_,. ; ?rs~c'.;~.·, C:,:;"C1t':r
" ... ---"
C CCC C';~~~:jt;L~~;: T~~~;PIRATI:~:-]': ~W{t~~/J.,)~; !':::/'t ~~(~~):::·F1I~i~j~,l:::;~\:.:;::: ~·.]~:{:::;~)i\:~'::::"<; :~: "'~:::.r~Y::~~.:~:;·: . .... ;: . '.". : .. :.' .. '.: ::'.:'
Figure l-19.--Diagram of consumptive use.
Some of the factors that affect the rate of transpiration are moisture available in the soil, kind an~ density of plant growth, amount of sunshine, temperature, and soil fertility. In summer when exceedingly hot winds blow over a field, transpiration may take place more rapidly than moisture can be absorbed by plant roots even when the soil contains an ample supply of moisture. When this occurs, plants wilt. In some the foliage may be dried beyond recovery.
Evaporation is the diffusion of water as a vapor from a surface into the atmosphere. Factors that affect the rate of evaporation are the nature

1-37
of the evaporating surface and differences in vapor pressure as determined by temperature, wind, and atmospheric pressure. In determining consumptive use, evaporation includes both evaporation from the ground surface and evaporation of the water intercepted by vegetation.
In irrigated fields, frequent shallow irrigations tend to increase water loss by soil evaporation. If less frequent heavy irrigations are used, the soil surface is wetted less often and water penetrates to a greater depth in the soil. Consequently, a larger part of the irrigation water is available "for crop use. In fields of hay, pasture, or other closegrowing crops, evaporation from the soil is reduced not only because the plants transpire a large proportion of the soil moisture but also because they shade the soil.
Soil texture affects evaporation. Evaporation is higher in soils in which capillary movement of water to the surface is rapid. Conversely, evaporation is not so high in soils through which water percolates freely. Losses of water from soil by evaporation vary greatly not only in different parts of the United States but also at different times and under different conditions in the same part. Appreciable wind movement, high temperature, and low humidity generally result in a high rate of evaporation if there is enough moisture at the soil surface.
After an irrigation, evaporation from the surface of the soil is high so long as the topsoil remains saturated; the rate is about the same as that fro~ a water surface of the same temperature. Depletion of the moisture in the topsoil rapidly reduces the rate of evaporation. The evaporation rate between irrigations depends somewhat on tillage operations, cultivation, and mulching as well as on soil texture, weather conditions, kind of crop, stage of crop growth, and the method, frequency, and depth of irrigation. As plants develop and provide increasingly more shade, the amount of evaporation is progressively reduced.
Daily Consumptive Use
Daily consumptive use, that in a 24-hour period, varies as the factors that influence evaporation and transpiration vary. Consumptive use is low at the start of the growing season, increases as plant foliage develops and days become longer and warmer, generally reaches a peak during the fruiting period, and then rapidly declines to the end of a crop's growing season. From the time seed is planted until plants emerge, soil-moisture loss is by evaporation. As plants emerge, transpiration begins and increases in amount as they d~velop. After the plants die, transpiration ceases and further soil-moisture loss is by evaporation. If all" the physical and climatic conditions remain the same, daily consumptive use drops in hay and pasture fields immediately after cutting or grazing because of the reduction in transpiration. If the field is irrigated immediately after cutting, however, there is no reduction in daily consumptive use and the rate may even increase because of high evaporation.

1-38
Figure 1-20 shows how daily consumptive use varies throughout the year for corn and meadow at Coshocton, Ohio.
Seasonal Consumptive Use
The total amount of water used in evaporation and transpiration by a crop during its growing season is called seasonal consumptive use. It is expressed usually as acre-inches per acre or as depth in inches but sometimes as acre-feet per acre or depth in feet. Seasonal consumptiveuse values are needed to evaluate and determine'seasonal irrigationwater supplies.
Peak-Period Consumptive Use
The average daily water-use rate during the 6 to 10 days of the highest consumptive use of the season is called the peak-period use rate and is the design rate to be used in planning an irrigation system. The peakuse period generally occurs when the crop is starting to produce its harvest, vegetation is most abundant, and temperatures are high.
Since the average consumptive-use rate is higher for a very short peakuse period (2 or 3 days) than for a longer peak-use period, the design rate varies with the amount of water that can be used from the root zone (the normal depth of water application per irrigation). In shallow soils, in soils with a low water-holding capacity, or for plants with shallow root systems, the depth to which water is applied is shallow and irrigation frequency during the peak-use period ranges from 3 to 6 days. The peak-use period for plants with a moderately deep root system growing in deep soils with a good water-holding capa~ity may range from 8 to 15 days. The average use rate for these short periods is considerably higher than the average rate for the month of greatest moisture use and is generally less than the peak daily-use rate. Deep-rooted crops, such as alfalfa, growing in deep soils have a large reservoir to draw on, and the irrigation interval may range from 3 weeks to 1 month; the design rate is equal to or possibly slightly higher than the average rate in the month of greatest moisture use.
The peak-use period for various crops in a given area may occur at different times in the growing season. Early-maturing crops have their peak-use period in late spring or early summer and late-maturing crops, in late summer or early fall. Knowing when these peaks occur is important in working out a cropping plan in which the peak-use periods are staggered, thus reducing the total capacity requirement of the irrigation system. If two or more crops are grown in the same field, such as a permanent cover crop in an orchard or grain with a new alfalfa seeding, the peak mois ture requirement of the crop or crop cOll1bination that uses more water must be met.
Table 1-4 gives some examples of the peak-period design ra.te for va,rious crops grown on deep, medium-textured, moderately permeable soils in selected areas.

... :: ... <:>
'" .., ... 0,
'"" :.. 't
1-39
-*~;Jij;",*a;** II: *-*ii5 II; • 51 ~ I o -- ~. ~ EMERGENCE -~ /j \ ~~ CORN PLANTiNG CORN HARVEST
~ ~~PEAK
~ USE
~ PErOO
PLOWING I : ~: SElOEO TO WHEAT 3
COkN ,,".,tv v~ ~ --
1\ 2
[;PV / \ .1
V V \
~ I---I--.
~ of..-----: --
0
JAN FEB MARr;/1 APRIL MAr JUNE JULr Aue SEPT oeT flO V OEC _ .. CO~'SvMI'TIVE USE FOR 'EAR 19'~ WITH CORN, FOLLOWEO By WINTER WHEAT UNDER IRR"ATIDN ON USIMETER r 102 C
AT THE SOIL AND WArER CONSERvAnON RESEARCH STATION, COSHOCTON, OHIO.
.-~
1----1----+---1---4------+----+---1-------+------+--- -- --"---' .IAN FEB MARCH APRIL MAr JUNE JULY AUG SE~~ __ L~?~ .OEC j
COlltSUMDilt{ VS{ FOR YEAR 195~ WITH IRRIGATEO ~/qsr r'£AR MEADOW 0,. At.FA(.FA, REO C:.ov£R, TiMOTH'f O~
LrSIMETEH r loe C Ar THE SOIL ANO WArER CONSERVATION RESEARCH 5 TArION , COSHocrCN. CkfO
Figure 1-20. --Average daily consumptive use foI' irrigated COl'n and meadow at Coshocton, Ohio. (From Harrold, L. 1., and Dreibelbis, F. R. Evaluation of Agricultural Hydrology by Monolith Lysimeters, 1944-55. U.S. Dept. Agr. Tech. Bu1. 1179, 166 pp. 1958.)

1-40
T<.,·...:1t.: 1-1 •• --l)o:_:;i[~n mui!)·"'urC::-cxtrac .... ir)n depth and peak-period confa.:.mptj ve-uSc rntc for variOULi Crl'pE' grown on_ <leep, med;u.."I-textured, moderatel,y penoeoble soils1
:3lJincton ----JII~ Calir:>nia Texas Ark"nsBs Uebraskn Co~orad:>
"JIUJ:lt:i~ (C (San c1:>aqu in (Southern (Mississippi (eastern (western
C-OI Basin; Valley) 1I1gh Plains', b::>ttoms I part) part)
Ocp th Use Depth Use
Del-'th UDe Depth
Use Depth Use Depth Use rate rate r~te rate r!:it~ rate
------- ,
i In.
Curl!............ L.2 fJ.!'olfo.......... 60
I'ostul'('......... I 024
Groin..... ...... 48 :;ur,or beets..... 3& Cott"n ......... . rot[\~"""D........ 2" 11 .... cldur,;f"
c:r('iln:"'(H.:, ••••• i..:i i rdS ar::'.harc.s. G~c..pcs .......... . A:~llu:ll lE:ffUJDeG •• ,sOyt"l1:1..n.::3 •.•••••• Shalluw trJck ...
Deer t'-"ck ..... . To;r.aL:.;C'.f- •••••••• Tct:acco ........ . Rjc.:e ••••••••••••
-
In. per dE,)' .!.!!!.
0.27 60 .25 72
.29 24
.21 413
.26 72 n
.29 48
96 72 72
I , , ,
_____ L_
In. In. per dgy .!.!!!. per day
0.26 '/2 0.30 .25 72 .30
J 42 .25 .n 472 .30
.17 72 .15
.22
.22 72 .25
.24
.21
.19
.18 48 .18
In. In. In.
!E.=.. per day In. per <L"li !E.=.. per day
30 0;23 72 0.2/! 48 0.23 42 .24 96 .27 72 .23
) 36 .U 4 36 .22
48 .29 36 .23
;:>4 .15 48 .26 36 .22 48 .26 48 .20
36 .18 36 .26 36 .22
72 .18
! 18 .28 36 .19 60 .,:7
5 Hi .20 6 18 .12
36 .22
24 .17
-----------------,------------------------,------------r-----------,------------Wisconsin Indi""a Piedmont Virginia I
(Slate) (Sta~e) Plateau< (C03.s"."l I Plain)
~e .. York (State;
Use UEe Use Use I Depth rnte Depth rate Depth rate Depth rate I' _ Depth
----------1---+------ ---+----+---+----+--+---In. In. In. In.
In. per day !E.=.. per day !E.=.. per day !E.=.. per day !E.=.. 24 0.30 : 24 0.30 24 0.22 24 0.18 24 36 .30)LJ .30 36 .25 36 .22 30
COl"n .•••••••••••••••• Alfalfa ...•.......•.•
I
Use rate
I In. I per day
0.20 .20
Pa5ture ....••....•...
Gr,ci" ... _ ........... . ~u~ar ce~ts ....... , .. Cot to" .... _ ... _ ..... . rot3:oes .. _ ......... . ~c::idL:.ou.s
C'rc~&rds ...•..• " .• Citr'lls :)I'ch8.!"ds .•... o
r,rnpeb ...........•... Annu~l legumes ...... . " uybc:lIls ............ . ~;nallcm Lruck .•......
Mcdh", t~uck ..•..•.•.
Deep truck .........•. Tom8.'!.oes ••••••••••••• Tobaoco ...••.•...•... nice ........•.....••.
24
Ib 18
18
36
Hi 12
16
I 24 I 18
I From c'~rrent irrigation guides.
.20 30
.25 .25
.20
.30
.25
.20
.20
.20
.20
12
24
24 9
12
IS 18 24
.30
.25
.25
.'>0
.20
.20
.20
.20
.25
24
24
24 24
30
24 12
18
24 24 18
Parts of Geori5ia, Alabama, tlorth Carolina, and South Carolina. J Cocl-~eeson pasture.
Narnl-season pasture. 5ur.,mer.
• FalL
.25
.16
.21
.18
.25
.20
.11l
.14
.14
.16
.21
.18
20
18
36
18
24 18
.22 I
I .
18
1
18
.22 36
.16
.18
.17
12
18
24 24
.Hi
.20
.18
.16
.16
.18

1-41
Irrigation-water Requirements
The net irrigation-water requirement is the amount of water excl~sive of precipitation required for crop production. In other words, it is the amount of irrigation water that must be stored in the root zone to meet the consumptive-use requirement of a crop. The gross irrigation-water requirement includes the net requirement and also any losses incurred in distributing and applying water and in operating the system.
Effect of Soil-Moisture Level on Crop Growth and Yield
Crops vary in the soil-moisture level that must be maintained for optimum yields and quality. Most plants are more efficient in taking up water if the soil-moisture level is high. AI3 the moisture level drops, soil-moisture tension increases and eventually plants cannot extract enough moisture for maximum growth. Plants begin to wilt, and growth is retarded or completely stopped. When the moisture level is again restored by irrigation, some crops continue to grow and show little or no permanent damage. Other crops, however, are permanently damaged, and if the moisture level is at or near the wilting point for a considerable period, complete crop failure is possible. Even if a crop recovers without serious damage, the growing time lost affects possible maximum yields. .
Moisture-level studies by Mech at Prosser, Washington, show that depletion of moisture to the wilting point markedly depressed yields of corn. A moisture deficit for 1 or 2 days during the tasseling or pollination period reduced yields by as much as 22 percent. A moisture deficit for 6 or 8 days reduced yields by 50 percent. For production of high yields, moisture sufficient to prevent any wilting throughout the growing season is essential.
If sugar beets are allowed to reach the wilting point, yields are materially reduced. Since cotton uses varying amounts of water efficiently, a high moisture level is not so important as for some other crops. Cotton should not be allowed to be at stress, however, or yields Vii 11 be reduced. The trend in cotton irrigation is to maintain a high maisture level during the latter part of the growing season. Tobacco is easily damaged by excess moisture, particularly in the early growth period when the moisture level should be fairly low. But a higher moisture level is required during the later growth period.
Early short-season truck crops benefit from a high moisture level. Indications are that other truck crops, such as. onions and potatoes" also produce higher yields of better quality at a relatively high moisture level. Research in New York State at Cornell University showed an increase for onions of more than 140 bushels between moisture levels of 25 and 50 percent. For potatoes, the increase was about 80 bushels per acre.

1-42
To avoid the prolonged application that is required for a normal full irrigation, soils with a very low intake rate sometimes are irrigated when the moisture level is relatively high. These soils, on which water must be ponded for more than 12 hours or must be run in furrows for more than 48 hours to complete a normal irrigation, usually should be irrigated when the required application is equivalent to the amount the soil can absorb in this time.
Critical Periods
For most crops there a~e critical periods in the growing season ,when a high moisture level must be maintained for high yields. If there is enough moisture for germination and for the development of an adequate stand, the critical period almost always occurs in the latter part of the season when the crop is approaching harvest. The critical period for a number of commonly irrigated crops is shown in the following list.
Potatoes ..•••.••. Blossom to harvest. Melons ••••••••••• Blossom to harvest. Sweet corn •••.•.• Tasseling through silking. Tobacco •••••••••• Knee-high to blossom. Cotton •...••••••• First bloom through boll-maturing stage. Strawberries •• , •. Fruit development to ripening. Field corn •.••••• Tasseling through silking. Sugar beets ...... 3 to 4 weeks after emergence. Small grain ..•.•• Boot to heading stage. Pasture ..••.••••• After grazing. Alfalfa .••••••••• Start of flowering and after cutting. Orchard •••••••••• Fruit development.
Moisture Levels For Irrigation
It is not practical and probably not desirable to maintain the same soil-moisture level throughout the growing season. The objec:tive of irrigation is to eliminate the limitation to crop productiorL from lack of moisture. This can be done by providing at all times within the root zone of a given crop a supply of moisture at sufficiently low tension to be readily available.
The most desirable moisture level has not been determined quantitatively for all crops. Some crops require a relatively high moisture level for crop quality and high yields,Le., between field capacity and a lower limit well above the wilting point. Thus, a high moisture level might mean that the moisture in the root zone is between the total amount that can be held by the soil (field capacity) and possibly 65 percent of the amount that can be held. The moisture level for irrigation would then be 65 percent. A high moisture level has been variously described by different authorities. Some consider a JO-percent level high, fmd others do not consider anything less than a 70- or 80-percent level high. For most crops, a low moisture level is generally considered to be 20 to 30-percent.
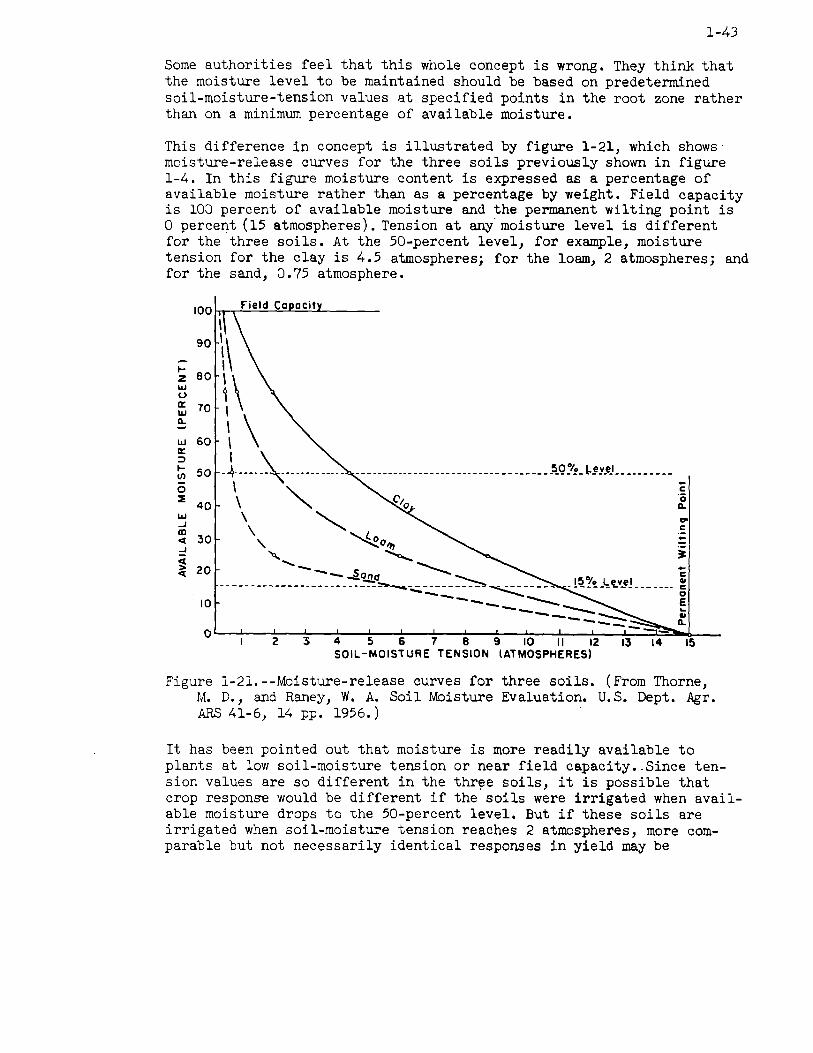
1-43
Some authorities feel that this whole concept is wrong. They think that the moisture level to be maintained should be based on predetermined soil-moisture-tension values at specified points in the root zone rather than on a minimum percentage of available moisture.
This difference in concept is illustrated by figure 1-21, which shows moisture-release curves for the three soils previously shown in figure 1-4. In this figure moisture content is expressed as a percentage of available moisture rather than as a percentage by weight. Field capacity is 100 percent of available moisture and the permanent wilting point is o percent (15 atmospheres). Tension at any. moisture level is different for the three soils. At the 50-percent level, for example, moisture tension for the clay is 4.5 atmospheres; for the loam, 2 atmospheres; and for the sand, 0.75 atmosphere.
100~~~~~~~------, ~ 90 \\
~ 80 ~ \
: :: \ \ ~ 50 -1- --- \----- -- ----- ------------------ ---- ----- -- ----- __ 5_Q~/!,_ !,.!y,J ______ - ---
~ 40 \ '" ~ UJ ...J III <[ 30 ...J
~ 20
10
\ "" \, ~o." -... "-0.....
...... - ............... --~'?a..d ___ - - --- --- -- -- ----- ---------~--;.;;;. ---- - -- ---~--- ------ -------- ----------~ ---
.. 15"10 Level ~
----------------- c: o E
O~~--~2~~3~~4--~5~~6--~7~~8--~9--~IO~~II--~12~~--~~~15---
SOIL-MOIS1URE TENSION (ATMOSPHERES)
Figure 1-21.--Moisture-release curves for three soils. (From Thorne, M. D., and Raney, W. A. Soil Moisture Evaluation. U.S. Dept. Agr. ARS 41-6, 14 pp. 1956.)
It has been pointed out that moisture is more readily available to plants at low soil-moisture tension or near field capacity •. Since tension values are so different in the thr~e soils, it is possible that crop response would be different if the soils were irrigated when available moisture drops to the 50-percent level. But if these soils are irrigated when soil-moisture tension reaches 2 atmospheres, more comparable but not necessarily identical responses in yield may be

1-41,
expected. At a tension of 2 atmospheres, the available-moisture content in the clay is 75 percent; in the loam, 50 percent; and in the sand, 25 percent.
Regardless of whether irrigation is specified by soil-moist~re tension or by percentage of available moist~e, a constant value can~ot be used for all crops on all soils and be expected to provide unifonn results. Different erops grown on various soils must be evaluated. It must be remembered also that many fields cannot be irrigated from one set or be covered in 1 day. In many places, several days are required to irrigate a field. The economic feasibility of covering a field in a given time and maintaining an adequate moist~e level in the last part of the field to be irrigated must also be considered in determining the moist~e level at \'Illich irrigation is to be started. The cost in labor and equipment required to maintain a high moist~e level in the soil :must be carefully balanced against any possible effects on crop yield, crop quality, and market price.
ARID-AREA LEVELS
In the arid and semiarid regions of the Western states, where nearly all the moist~e for crop growth is supplied by irrigation, experience indicates the desirability of maintaining a minimum soil-moist~e level of about 50 percent for most crops. Irrigation water is then applied when the soil-moist~e level drops to about 50 percent. If the soil is brought up to field capacity at each irrigation, this provides a moist~e level between field capacity and 50 percent at all times. A few crops, howe\,er, are benefited by maintaining a somewhat higher moisture level.
In these low-rainfall regions, irrigations are cyclic. After the first irrigations in the season, a pattern of soil-moist~e levels is established across a field that coincides with the various irrigation "sets" required to cover the field. In later irrigations, each part of the field receives water when it reaches a specified minimum moist~e level.
HillvlID- AREA LEVELS
In humid areas, the problem is somewhat different from that in arid areas. Since precipitation in the growing season generally contributes materially to the soil moist~e required for crop growth, irrigation is not continuous throughout the season. To make maximum use of rainfall d~ing the growing season, research and experience indicate that irrigation can be scheduled by perln.1tting the average moist~e level of a field to range between a high point somewhat below field capacity and a low point somewhat above the wilting point.
The moisture level at which to start irrigation must be dete!rmined from a practical standpoint as well as from the requirements for optimum crop production. In htUnid areas, irrigation generally is an addit.ional farm chore that must be fitted into the ordinary farm work. An irrigator

1-45
generally is reluctant to start irrigation at a high moisture level because the soil does not seem dry enough to warrant the trouble and labor of adding water when it may rain in a few days. Available research data on moisture and crop yields show that for most crops it is usually most practical to start irrigation when the available moisture in the root zone is 55 to 60 percent of capacity. This allows time to complete an irrigation before the last area to receive water becomes too dry. For some high-value crops on some soils that show great response to a highmoisture level, it may be economical to start irrigation when the level is 65 to 70 percent.
The lower limit of moisture depletion is an important determination in humid areas. Plants cannot extract the required amount of moisture when the available-moisture level approaches the wilting point because soilmoisture tension is high. Research shows a marked reduction in yield for nearly all crops if the moisture in the root zone falls to much less than 20 percent of the total amount of available water. On some soils, some crops are affected at the 35 to 50 percent level.
The critical moisture level varies with the soil as well as with the crop. Figure 1-21 shows that at a moisture level of 15 percent the soilmoisture tension for the sand is 5.8 atmospheres; for the loam, 8.7; and for the clay, 10.7. On the basis of tension, the moisture in the sand is more readily available than that in the clay. The moisture content of the sand, however, is almost down to the wilting point as shown in table 1-5. To provide a safety factor in operating the irrigation system, therefore, the lower limit of moisture depletion in the sand should be higher than 15 percent for some crops. More energy is required for a plant to extract moisture from the clay at the 15-percent level than from the sand at that level. But more moisture is available, which provides a greater safety factor.
Table 1-5.--Moisture available between the 15-percent level and the permanent wilting point for the three soils shown in figure 1-21
MOisture content at--
15-percent level Permanent wilting Differ-Soil Soil-moisture point ence
tension .AmoWlt (15 atmospheres)
Percent b;:t Atmospheres weight Percent by weight Percent ,
SaIld .•...... 5.8 5.3 4.8 0.5
Loam .......• 8.7 10.0 11.3 1.3
Cl~ .•.••••. 10.7 19.3 17.0 2.3

1-46
Thus to be sure that plan~s are not overstressed, the lower limit of moisture depletion will not be the same for anyone crop growing on different soils in different locations. Research and experience indicate that a moisture level of between 15 and 20 percent of the total available water generally is a good lower limit to use for design purposes for most irrigated crops. Certain special crops on particular soils may require a higher level for optimum economic returns.
MOISTURE TO BE REPLACED AT EACH IRRIGATION
The correct amount of water must be applied when it is needed to insure efficient operation of an irrigation system and optimum returns from the investment in irrigation. If more water is applied than is needed to bring the moisture level up to field capacity, the additional amount is lost by deep percolation. Unless the extra water is needed for leaching or for temperature control, there is no benefit from the higher cost. On soi Is in which internal drainage is slow, the addi tional watE~r may result in reduced yields. But if not enough water is supplied, crop yields are also reduced.
The amount of water to be replaced at each irrigation, therefore, depends on the amount of available moisture the soil can hold in the moisture-extraction depth used in designing the system and on the moisture level selected for the start of irrigation.
Net Water Application
The net amount of moisture to be replaced at each irrigation is the amount that the soil can hold between field capacity and the starting moisture level. If the starting moisture ievel is set at 60 percent, the crop can use as much as 40 percent of the available moisture in the root zone before it is time to apply irrigation water. It is then necessary to add an amount of water equal to 40 percent of the available moisture the soil can hold in order to bring the root zone up to field capacity. If, for example, a soil holds 8 inches available in the design moistureextraction depth and if irrigation starts at the 60-percent level, the net amount that must be added to the soil at each irrigation is equal to 40 percent of 8 inches, or 3.2 inches.
Another method of estimating the net amount of moisture to bt= replaced was suggested by Dale R. Shockley. In this method, which is "oased on the usual moisture-extraction pattern of irrigated crops, the available moisture that can be held in the upper fourth of the root zone is taken as about 40 percent of the total amount of water that can be used by plants between irrigations. It is also the net amount that must be replaced by irrigation. This is a maximum figure, and Shockley suggests reducing the total available moisture so computed by 1 inch to provide a reasonable safety factor. Thus for most irrigated crops on uniform soils, the net amount of moisture to be replaced can be estimated in the following way.

1. Determine the available moisture that can be held in the upper fourth of the crop root zone in the soil to be irrigated.
2. Divide this amount by 0.40 and subtract 1 inch. This is the net amount of moisture to be replaced.
1-47
The net amount of ffi'::Jisture to be replaced usually is 40 to 50 percent of the total amount of available moisture in the root zone of soils that have a wliforrn moisture-holding capacity in all increments of depth.
For low-moisture-holding soils underlain by subsoils that have a higher moisture~holding capacity, the net amount of moisture to be replaced, as determined by this procedure, is a smaller percentage of the total amount of available moisture than that for uniform soils. But for highmoisture-holding soils underlain by subsoils that have a lower moistureholding capacity in the second or third quarter (fig. 1-17), the percelltage is larger.
The followIng example shows how to estimate the net aJnount of moisture to be replaced in nonuniform soils.
1. Ass~~e a soil that has an available moisture holding capacity of 1. 75 inches in the upper foot and of 2 inches in each of the second, third, fourth, and fifth feet of depth and assume a root zone depth of 5 feet.
2. Since one quarter of the root zone is 1.25 feet and the amount of avai~able moisture in the upper quarter is 2.25 inches (1.75 plus 1/4 of 2), the net amo~t of moisture to be replaced is 4.6 inches (2.25. l' '0.40 r.nnus ) .
Gross Water Application
The gross amount of water to be applied at each irrigation is the amount that must be applied to the surface to be sure enough water enters and is held in the soil to meet the net n:quirernent for eaC!h irrigation. ?l.egard:i.ess of "",he method used, n') irrigation system is 1O:J :r:-ercent t:fLcient and IlO-:' all the 'NateI' aI_'f!lied during an irr_~gati(,;a enters and is held in -che root zone.
Unavoidable losses are caused by unequal distribution of water over a field,by percolation below the root zone, and by waste at the ends of borders and furrows. In sprinkler irrigation, additional losses are caused by evaporation from the spray and by the retent.ion of water on plant foliage.
For a given irrigation method, field efficiency varies with the skill ".1sed in pla::ming, laying out, and operating the system; with climatic conditions; and w:f:th the physical properties of the soil. To be sure that the net amount of moisture to be replaced at each irrigation enters and is retained in the root zone, it is necessary to apply a larger amount of water to the soil sUrface to offset any losses. This gross

1-48
amollilt to be applied can be determined according to the following equation.
Gross amount =
Varying Applications
l~et amollilt to be replaced (net water application for design)
Efficiency of system
In humid areas, different amollilts of water are applied during any given irrigation to provide a high moisture level in the·entire field. In many places, it is not possible to irrigate an entire field in 1 day, and several days are required. This means that the moisture level at the end of the field opposite to that from which irrigation is started is well below the prescribed starting moisture level by the time water is applied Lo that end of the field and the moisture level in much of the field is below the pres(!ri bed starting level.
This lower moisture level is not important for crops that do not require a high moisture level for optimum yields. But yields of crops that benefit grea-:'ly by a sll.'3tained high moisture level will be reduced. For certain high,value crops, it may be advantageous to maintain a high moisture level 8\'er an ent..ire field. This can be done by applying increasing amounts of water as irrigation progresses across a field. One method is to increase the application each day by an amount equal to the daily moisture-use rate of the crop. Some irrigators prefer to increase the amollilt for each one-third of the field. For example, if irrigation is started at the 60-percent moisture level and the mlDlmum level is 20 percent, an amount of water equal to 40 percent of the total amount of available moLsture is applied to the first one-third of the field. The amount is increased to 55 percent for the second third and to 70 percent for the last third of the field. If it is necessary to irrigate again irrunediately, the st.arting amollilt can be used throughout the second and each succeeding cycle since all parts of the field are then brought up to field capacity with each irrigation application.
When To Irrigate
IRRIGATION FREQUENCY
Irrigation frequency refers to the number of days between wattr applications or irrigations. It depends on the consumptive-use rate of a crop and on the amollilt of available moisture in the root zone (mo:~stureextraction depth) between field capacity and the starting moisture level for irrigation. It is 'a fllilction of both soil and crop: for any given crop, open shallow soils must be irrigated more often than finetextured deep soils; the moisture-use rate varies with the kind of crop and increases as t.he crop grows larger and the days become hotter.
Irrigation frequency in the growing season depends mostly on the stage of plant development. There must be plenty of water dming germination and plant emergence for good stands. Then the crop must be irrigated
1-49
often with fewer and fewer days between irrigations until flowering time. During the maturing period, not so many irrigations are needed with more days between them. Usually no irrigation is needed during ripening .
The irrigation frequency to be used for design is the time (in days) be"tween irrigations in the period of highest consumptive use of the crops grO~TI. Since frequency depends on how long water added to the soil and held there lasts when a crop is transpiring at its maximum rate, the average Doisture-use rate during this period is the rate to be used in designing and planning irrigation systems, as discussed earlier under Peak-Period Consumptive Use. For an irrigation system to be adequate for all the requirements of a crop, it must be large enough to supply the water necessary during this period.
Design frequency
IRRIGATION PERIOD
Net amount of moisture between field = capacity and starting level
Peak-period moisture-use rate of crop
Net depth of application Peak-period use rate
or
Irrigation period refers to the number of days that can be allowed for applying ·one irrigation to a given design area during thE rr::ftk consumptive-use period of the crop being irrigated. It is the ba3is for capacity and equi:r:;ment design.
Since the peak-use period is generally the critical time in the crop cycle and since a shortage of moisture during this period greatly affects yields, a system that carmot furnish water to an entire field or farm in the allowable number of days is not satisfactory. The irrigator sacrifices top yields for a smaller initial cost, and his net returns generally are lower over the life of the irr:.i.gation system.
For arid regions where irrigations are cyclic and the moisture level is maintained between field capacity and about 50 percent, irrigation period and irrigation frequency are identical.
In humid regions, irrigation period is not always the same as irrigation frequency because irrigations generally are not cyclic and application procedures are somewhat different from those in arid regions. When rainfall brings the entire field up to field capacity, soil moisture can be depleted to some predetermined percentage of that in the extraction . depth before irrigation is started. The amount of moisture remaining in the soil then determines the amount of time that can be allowed for covering the field in one irrigation. If the starting level is set at some 10Vi percentage of the total amount of available moisture, the mois· ture remaining in the soil is already low and the time that can be allowed for covering the field before wilting occurs on the far side is

1-50
much less than it is when irrigation is started at a higher moisture level. For this reason, irrigation period may not be the same! as irrigation frequency. In other words, the amoW1t of available moisture in the soil between the starting moisture level and the lower limit of moisture depletion is the amount of water the crop has available for growth during the irrigation cycle. Thus,
Net amount of moisture in s,oil between start of irrigation and lower limit of moisture
Irrigation period = ____ ~~--__ ~~~d~e~p~17e~t~i~0~n~----~--~------Peak-period moisture-use rate of crop
In the following example, the total amount of available moisture in the extraction depth of a given soil is 6 inches, the crop to be irrigated has a peak-period use rate of 0.3 inch per day, and irrigation is to be started when moisture level is 50 percent and is to be finished when the moisture level at the far end of the field is 20 percent. The net amount to apply is
6 inches x 50 percent or 3 inches,
and the irrigation frequency is
3 inches o 3' h~ or 10 days . lnc / ay
The moisture in the soil between the starting level and the lower limit of moisture depletion is
6 inches x (50 percent - 20 percent) or 1.8 inches,
and the irrigation period is
1.8 inches 0.3 inch/day or 6 days.
The irrigation system, therefore, must have the capacity and equipment for covering the entire field by one irrigation in 6 days. If 3 inches of water is applied durillg the irrigation, however, it is necessary to irrigate only every 10 days during the peak-use period.
In humid areas the procedure generally used to limit moisture depletion is to set moisture levels for the start' and finish Df an irrigation so that ·the difference between field capacity and the starting level is the same as that between the starting level and the finishing level, as shown in figure 1-22. With this procedure, irrigation period eq~als irrigation frequency.

1-51
I
I I I
Slarl I"igall on here when Ovallable --------1f+i. maislure in f,eld drop& 10 60~ level
! ~ ...... -P
I I
I
Field capacllr IOO~ I .... el
I -Add a minimum 01
I -40\ 0' 10101
(·-·~-~O'olOIIOble mOisture
I 10 Ihe sool 01 each ,sell,ng at Ihe sp" nklers
I
L _____ _
I I I
! I I I I
-------~I--~-~-_r-_r-_+-~-~-~~~ I
I IRRIGATION PERIOD ! .1. I
i
I I J
Figure 1-22. --Limiting soil-moisture depletion in humid areas.
An irriga-~ion system designed to cover an area in approximately the time represented by the irrigation period requires a minimum system capaci~y and for a given water-application rate a minimum amount of irrigation equipment.. The system m~ be designed for fewer days than specified by -:.he irriga':ion period for one or more of the following reasons.

1-52
1. The irrigator desires some free time between irrigations. 2. Delivery or rotation schedules of irrigation enterprises. 3. Harvesting operations when it may be necessary to apply wa.ter during
a relatively short period so that harvesting can be started. For hay it may be desirable to irrigate immediately after haying, and thus the area should be covered in a shorter time than the allowable irrigation period.
4. Special applications of water may be needed for crop quality, as for truck crops grown for canning or freezing.
~xample 1-1 illustrates the principles of applying irrigation. water in arid areas to a soil in which different layers have different waterholding capacities. Example 1-2 illustrates the principles in humid areas.
IRRIGATING BY CROP APPEARANCE
The appearance of the crop gives some indication of when to start irrigation. But crop appearance is often deceptive and its significance varies for different crops. Temporary wilting during the hottest part of the day sometimes indicates the need for water. But basing irrigation on crop appearance alone is dangerous, for some plants may not show any wilting until growth has been seriously retarded or some othe·r injury has occurred. Generally if the irrigator waits for some sure sign of wilting, he may not be able to irrigate the entire field before the crop is seriously damaged.
IRRIGATING BY DETERlvUNING SOIL-MOISTURE LEVEL
The best and most effective way of determining when to irriga.te is to neasure or to estimate the moisture level in the soil. By knowing the amount of moisture that is available, the irrigator who has ~nowledge of and experience with a particular crop on a particular soil can accurately determine when irrigation is needed.
Of the nwnerous methods that can be used to measure and estimate soil moisture, many are not suited to field use. But several methods are now being used by irrigators and others are being developed that show promise as methods of determining when to irrigate. Some of these methods are discussed in the following pages.
Location of Soil-Moisture Measurements
The location pf any soil-moisture measurements is highly important. Selection of places that will give a good estimate of the moisture level over a field generally is a matter of knowing the soil, previ.ous experience, and good judgement. Locating the places for examination is not so difficult in fields of the same kind of soil as in fields of different kinds.
It is generally recommended that one location be near the sid.e of the field where irrigation is to be started as a reference point for
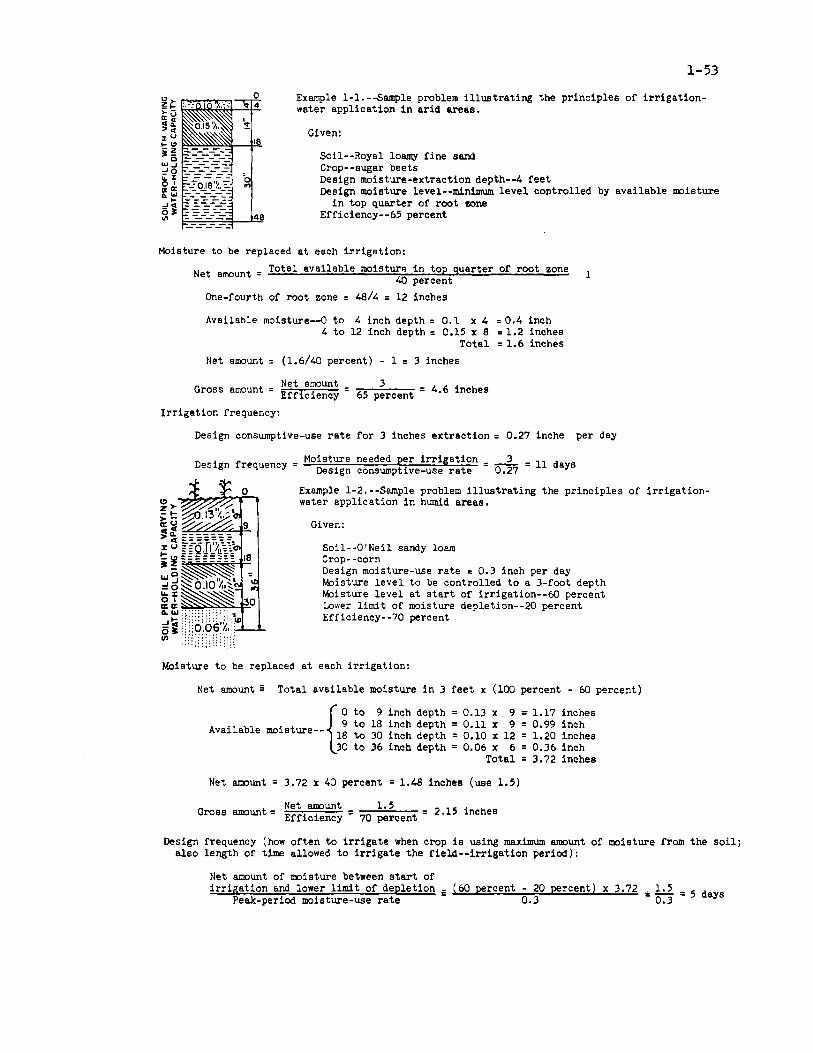
1-53
~ ~ ~"~"~i~~~1~t°,,-~u ~
Example l-l.--Sample problem illustrating the principles of irrigationwater application in arid areas. ....
>~ XU Given: .... <:>~~~~-¥ i~ ...... "0 ;:;:x
Soil--Royal loamy fine sand Crop--sugar beets Design moisture-extraction depth--4 feet 0'
Ita: a.~ ----- Design moisture level--minimum level controlled by available moisture
in top quarter of root zone .JCl ___ _
53: '" ---- 48 Efficiency--65 percent
Moisture to be replaced at each irrigation:
N t t Total available moisturp. in top quarter of root zone e arrDun = 40 percent 1
One-fourth of root zone = 48/4 = 12 inches
Available moisture--O to 4 inch depth = 0.1 x 4 = 0.4 inch 4 to 12 inch depth = C.15 x 8 = 1.2 inches
Total = 1.6 inches
Net amount = (1.6/40 percent) - 1 = 3 inches
Gross amount = ~~ii~~~~~ = 65 p;rcent = 4.6 inches
Irrigation frequency:
Design consumptive-use rate for 3 inches extraction = 0.27 inche per day
Design fre uenc = Moisture needed per irrigation = ___ 3_ = 11 days q y Design consumptive-use rate 0.27
Example l-2.--Sample problem illustrating the principles of irrigationwater application in humid areas.
Given:
Soil--O'Neil sandy loam Crop--corn Design moisture-use rate = 0.3 inch per day Moisture level to be controlled to a 3-foot depth Moisture level at start of irrigation--60 percent Lower limi t of moisture depletion- -20 percent Efficiency--70 percent
Moisture to be replaced at each irrigation:
Net amount = Total available moisture in 3 feet x (100 percent - 60 percent)
{
0 to 9 inch depth = 0.13 x 9:: 1.17 . 9 to 18 inch depth = 0.11 x 9 = 0.99
Avallable moisture-- 18 to 30 inch depth = 0.10 x 12 1.20 30 to 36 inch depth = 0.06 x 6 = 0.36
Total = 3.72
Net amount = 3.72 x 40 percent = 1.48 inches (use 1.5)
Net amount 1 5 Gross amount = Efficiency = 70 ~rcent = 2.15 inches
inches inch inches inch inches
Design frequency (how often to irrigate when crop is using maximum amount of moisture from the soil; also length of time allowed to irrigate the field--irrigation period):
Net amount of moisture between start of irrigation and lower limit of depletion _
Peak-period moisture-use rate (60 percent - 20 percent) x 3.72 * ~ = 5 days
0.3 0.3

1-54
starting the irrigation I::!ycle. At least one location should be at the opposite end of the field to determine if the field is being covered fast enough to maintain an adequate moisture level there. Measurements should be made at other locations as indicated by any critical condition in the soil, such as an area that dries out first or stays wet longest. It is good practice to have at least two measurement stations in each critical area and possibly two or three stations in areas that are typical of most of the field. An adequate system of moisture measurement provides the irrigator with enough data to manage his system so that the moisture level is controlled over the entire field. This kind of information serves as a guide in varying both the amount and the frequency of irrigation for different parts of the field or for different periods in the growing season.
For row crops, measurements should be made in the row or near the plants. In sprinkler irrigation, the measuring stations should. be between the sprinkler heads and 10 to 15 feet away from the lateral. For trees, measurements generally are made 4 to 6 feet from the trunk but inside the drip line.
Measurements should be made in that part of the soil from which plant roots extract their moisture and according to the moisture-extraction pattern of the particular crop. One measurement should be madE~ in the upper quarter of the root zone and one or two more measurements, at lower levels. If the maximum moisture-extraction depth for a given crop is 24 inches, for example, measurements probably should be made at about 6, 12, and 18 inches. To predict when to irrigate during the E~arly stages of root development, the 6-inch measurement is all that is needed for most crops. As the root system reaches maturity, measurememts from all three locations are needed for a clear picture of the moisture level throughout the moisture-extraction zone. Generally, the pract:~ce is to average the measurements from the three depths.
Reading and Recording Measurements
Measurements may need to be taken twice a week in spring and ::all and daily during hot weather and the critical periods for the crop grov.n. The irrigator may be able to reduce the frequency of readings after he has become thoroughly familiar with the pattern of moisture depletion. After he gains experience, he should be able to determine from each day's reading what the conditions will be several days hence, so that he can complete an irrigation cycle before the crops irrigated at the end of the cycle show signs of stress. To accurately predict moisture levels, measurements must be taken and recorded regularly, regardless of the time "of year or the stage of crop growth. Comparison of yearly records that are tied to crop yields helps the irrigator to improve his management of the irrigation system.
Soil-Sampling Method
Soil samples are taken from the desired depth at several locations.for each soil type. They are weighed, dried in an oven, and then weighed

1-55
again. The difference in weight is the amount of moisture in the ~Ol.~.,
which can be converted to inches of water remaining in the soil(p. 1-16).
Although this method gives good results, it is not l~ed generally on farms. Its accuracy depends on the number of samples taken and on the skill used in mixing and handling the samples. It requires using facilities not ordinarily owned by farmers and much time and labor. It is used principally in experimental work and is a standard against which other methods of moisture determination can be compared.
Measuring Instruments
Various instrl~ents for measuring soil moisture are available commercially. These instruments may not give such accurate results as the soil sampling and drying procedure, but they are being improved. If the instruments are well located and if the irrigator reads them consistently and interprets the results according to his knowledge of both crop and soil, he can closely predict the time to irrigate.
The instruments now available are of two general types: tensioroeters and electrical-conductivity measuring devices.
TENSIOMETERS. Tensiometers (fig. 1-23) work on the principle that a partial vacuum is created in a closed chamber when water moves out through a porous ceramic tip to the surrounding soil. Tension is measured by a water manometer, a mercury manometer, or a vacuum gage. The scales are generally calibrated in either'hundredths of an atmosphere or in centimeters of water. Tensiometers that utilize a mercury manometer are usually preferred as research tools because they afford great precision. Because of thei-r simplicity, tensiometers equipped with Bourdon vacuum gages are better suited to practical use and to irrigation control.
After the cup is placed in tl:e soil at the desired depth, the instrument must be filled VI lth water. Water moves through the porous cup unti 1 the water in the cup and the water in the soil reach equilibrium. Any increase in tension that occurs as the soil dries causes the vacuum-gage reading, which can be read above ground, to increase. Conversely J an increase in soil-water content reduces tension and lowers the gage reading. The tensiometer continues to record fluctuations in soil-water CCl1-
tent unless the teDsion exceeds 0.85 atmosphere, at which point air enters the system and the instrument ceases to function. After an irrigation or rain, the instr~~ent must again be filled with water before it can operate.
Some experience is required to use a tensiometer. If air enters the unit through any leaks at the rubber connections, measurements are not reliable. Air leaks can result from faulty cups. They may occur also at the contact poir.ts of the setscrews used to secure the porous cup to the metal support. Some manufacturers provide a test pump that can be used to test the gage and to remove air from the instrument.

1-56
Figure 1-23.--Tensiometers used to measure soil moisture.
Tensiometer readings reflect soil-moisture tension only; that is, they indieate the relative wetness of the soil surrounding the por::>us tip. They do not provide direct information on the amount of water held in the soil. Tension measurements are useful in deciding when to irrigate, but they do not indicate how much water should be applied. A special moist'Jrc-charact8ristic curve for the particular soil is needed to convert moisture-tension measurements into available-moisture percentages. Typical curves for three sample soils are shoVv'11 in figure 1-21 (p. 1-43).
Tensiometers do not satisfactorily measure the entire range of available moisture in all soil types. But they probably are the best field instruments to use to determine moisture conditions in the wet range. They are best suited to use in sandy soils since in these soils a large part of the moisture available to plants is held at a tension of less than 1 atmosphere. Tensiometcrs are less well suited to use in fine-textured soils in which only a small part of the available moisture is held at a tension of less than 1 a~mosphere.
ELECTRICAL-RESISTANCE INSTRUMENTS. These instruments (fig. 1-24) use she principle that a change in'moisture content produces a change in some electrical property of the soil or of an inst~ument in the soil. They consist of two electrodes permanently mounted in conductivity units, usually blocks of plaster of paris, nylon, fiber glass, gypsum, or combinations of these materials. Electrodes in the blocks are attached by wires to a resistance or conductance meter that measures changes in electrieal resistance in the blocks. When the units ar~ buried in the soil, they become almost a part of the soil and respond to changes in soil-moisture content. Since the amount of moisture in the
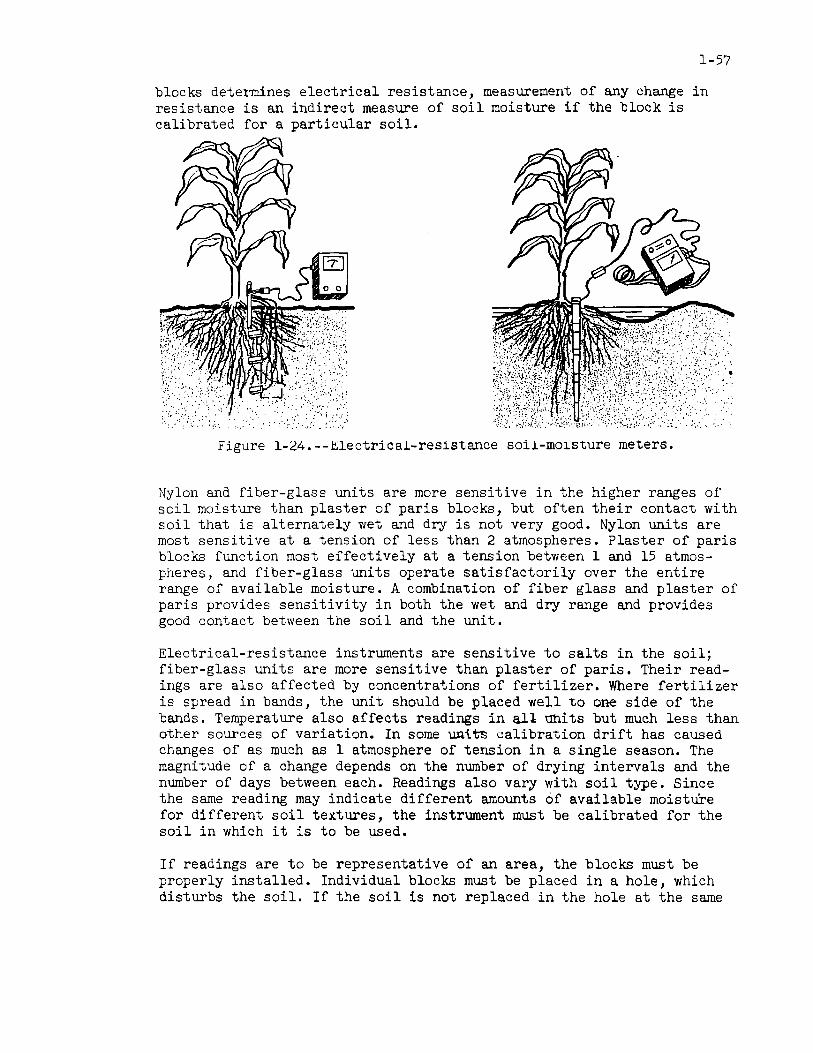
1-57
blocks determines electrical resistance, measurement of any change in resistance is an indirect measure of soil moisture if the block is calibrated for a particular soil.
," , :, ~:' :
, ,., .. ::.,,:.: ,:'.', ,,' .. . '. '.-
" :. ;'"'~ ; ,:::',:-~ " . ~ '. :.'. " ~ . ' .' ~,~ :
Figure l-24.--tlectrical-resistance soil-mo~sture meters.
Nylon and fiber-glass units are more sensitive in the higher ranges of soil moisture than plaster of paris blocks, but often their contact with soil that is alternately wet and dry is not very good. Nylon units are most sensitive at a tension of less than 2 atmospheres. Plaster of paris bl08ks function most effectively at a tension between 1 and 15 atmospheres, and fiber-glass units operate satisfactorily over the entire range of available moisture. A combination of fiber glass and plaster of paris provides sensitivity in both the wet and dry range and provides good contact between the soil and the unit.
Electrical-resistance instruments are sensitive to salts in the soil; fiber-glass units are more sensitive than plaster of paris. Their readings are also affected by concentrations of fertilizer. Where fertilizer is spread in bands, the unit should be placed well to one side of the bands. Temperature also affects readings in all units but much less than other sources of variation. In some ~tts calibration drift has caused changes of as much as 1 atmosphere of tension in a single season. The magnitude of a change depends on the number of drying intervals and the number of days between each. Readings also vary with soil type. Since the same reading may indicate different amounts of available moisture for different soil textures, the instrument must be calibrated for the soil in which it is to be used.
If readings are to be representative of an area, the blocks must be properly installed. Individual blocks must be placed in a hole, which disturbs the soil. If the soil is not replaced in the hole at the same

1-58
density and in the same way as in the rest of the profile, the rootdevelopment and moisture pattern may not be representative. A good method is to force the block into undisturbed soil along the~ sides of the hole dug for placement of the blocks (fig. 1-24). In one~ type, the blocks are cast in a tapered stake. A tapered hole, the same~ size as the stake, is bored into the ground with a special auger. The stake is saturated with water and then pushed into the hole so that c:lose contact is made between the stake and the soil.
Most of the commercial. instruments give good indications of moisture content if they are used according to the manufacturer's instructions. For good results, however, the blocks need to be calibrated in the field for each job. Experience and careful interpretation of instl~ent readings are needed to get a good estimate of soi I-moisture concH tions •
Feel and Appearance Method
How soil samples taken in the field from appropriate locations and depths feel and look gives some indication of moisture content. A shovel can be used to get samples, but for some soils a soil auger or a sampling tube is better. The appearance and feel of a handful ()f soil that has been squeezed very firmly can be compared with descript:lons in a guide of estimated available-moisture content for different soil textures and conditions. Table 1-6 is a guide that has been used for some time.
A slightly different and probably simpler guide was developc~d by JOM L. Merriam. In this guide (table 1-7) moisture deficiency can be read directly in inches per foot. The description at the top of I~ach textural column is of the soil at field capacity. The description at the bottom of each column is of the soil at the wilting point. Descriptions of intermediate conditions of soil-moisture deficiency are opposite the corresponding numerical values of inches of water per f~:)Qt of soil. Table 1-7 is for a specific group of soils, and it may not ;apply to m8.11Y other groups. Descriptions for other soils may be somewhat different. Probably the best practice is to prepare a chart for a given area and for specific soils and then to furnish each irrigator with a chart that describes only the soils to be irrigated on his farm. These special charts should be developed by using laboratory methods to determine the soil-moisture deficiency that corresponds to each feel and appearance condition.
Although gaging moisture conditions by feel and appearance is not the most accurate method, with experience and judgement the irrigator should be able to estimate the moisture level within 10 to 15 percent. This method is one of the cheapest, but it requires a lot of work to get soil samples.

Table 1-6.--practical interpretation chart of soil moisture for various soil textures and conditions
Available Feel or appearance of soil mOisture
Fine and very fine in soil Coarse-textured soils Moderately coarse Medium-textured soils
textured soils textured soils
a percent---- Dry, loose, and single- Dry and loose; flows Powdery dry; in some Hard, baked, and grained; flows through through fingers. places slightly crusted cracked; has loose fingers. but breaks down easily crumbs on surface
into powder. in some places.
50 percent Appears to be dry; does Appears to be dry; does Somewhat crumbly but Somewhat pliable; or less. not. fonn a bnll under not fonn a ball under holds together under balls under
pressure.~ pressure.~ pressure. pressure.~
50 to 75 Appears to be dry; does Balls under pressure Fonns a ball under pres- Fonns a ball; rib-percent. not form a ball under but seldom holds to- sure; somewhat plastic; bans out between
pressure.~ gether. slicks slightly under ' thumb and fore-pressure. finger.
75 percent Sticks together slightly; Fonns weak ball that I Forms ball; very pliable; Ribbons out between to field may form a very weak breaks easilyj does slicks readily if rel- fingers easilyj capacity. ball under pressure. not slick. I ati vely high in clay. has a slick feel-
ing.
At field On squeezing, no free Same as for coarse- Same as for coarse- Same as for coarse-capacity water appears on soil textured soils at textured soils at field textured soils at (100 per- but wet outline of field capacity. capacity. field capacity. cent) • ball is left on hand.
Above field Free water appears when Free water is released Free water can be Puddles; free water capacity. soil is bounced in wi th kne ading • squeezed out. forms on surface.
__ I hand. I - - - -- - '----
~ Ball is formed by SQueezing a handful of soil very firmly.
I-' I
VI \0

1-60
Table 1-7.--Soil moisture and appearance relationship chart1
Mnisturp ____________ ...:S:..::O:..::I:::L,--T.:.E=:..::X..:.T..:U..:.R:::E:.....,:C:::L;;,;A;,:;S.;:.SI:,:F...:I..:C.:.A:,:T..:.IO.;:..:.N'--________ • ___ Moisture
deficiency. Coarse Light Medium Fine cleliclency, in. 1ft. (loamy sand) (sandy loam) (loam) (day loam) In.lft.
0.0
0.2
0.4
0.6
0.8
1.0
1.2
1.4
\.6
1.8
2.0
(field capacity) (field capacity) (field capacity) (field capacity)
Lca\"e~ wet outline on Appears very dark, leaves Appears very dark: leaves Appears very d.arlc: leaves hand when squeezed. wet olltline on hand: a wet nutli~ on hand: .light moistur,e on band
Apl",ah moist: makes a wc;,k ball.
ApfK'1I1"S slightly moist. Slicks together .lightly.
Very dry. loose: Rows through fingers. (Wilting point)
makes a short ribbon. will ribbon out about one when SQueezed: will rib-inch. bon out about two Inches.
Qllite dark color: makcs a hnrd ball.
FRirly d;lTk color, makes 1\ ~ood boll.
SI;shtly dark color. makes a weak ball.
Lightly colored hr moi.· til"' will not bal.
Very slight color due to moisture. (wilting point)
I>.rk color; forms a plas. tic ball; llicks wben n.bbed. .
Quite dark. fornu a hard hall.
Fairly dark, fnnns a good hAil.
Dark color'i
will slick and ribbon eul y.
Qllite dark, will make II
thick ribbon: may slick when rubbed.
Fairly dark, malles a lood hall.
Slightly dark, forms a Will ball, small c10ch will weak hAil. Aallen oul ra ther Ihan
,·n.mble.
Lightly colored: small clod. crumble fairly SIiJ:htly dark, clod. Clum· pasil)". ble.
Slight <olor dlle to mois· tu",. ,mall clod, liTe hanl. (wilting pnint) Smne darkness due to un·
available moisture, clod. Arp hard, craclc,'" , (wilting pn;nt)
0.0
0.2
0.4
0.6
0.8
1.0
1.2
1.6
1.8
2.0
THIS chart indicates apprnximatc relationship between field capacity and wilting r:int. For more a<'Curate infonnation, lhe soil must b. checked by dryi,,!: samples of it. The descriptions at the top of each textura column cOITe.pond to the (:ondition of zero loil· moistuTC deficiency, i.e., field capacity. Those descriptions at the bottom of a column delCribe a lOil havinJ Ih" muimum deficiency, i.e., at wilting point. The soil· moisture deficiency at this condition is numerically equal to Ihe available moisture range of the soil. Intermediate soil. moisture deficiency descriptions occur opposite corresponding numerical value. of Inches of ... ·Iter per foot of depth at whi"h the .nil is deficient. This chart describes a specific group of soils and thoud> it has been found 10 ha,'e general application, it mAY nnt npply to many othe, grnups. Where this is the case, new descriptions will need to be prepared corTtspondin, to particular .nil.";oi5lIl,e deficiency, feel, and appearnnce relationships.
1 From Merriam, J. L. Field Method of Approximating Soil Moisture For Irrigation. Amer. Soc. Agr. Engin. Trans. 3(1): 31-32. 1960.
Moisture-Accounting Method
The moisture-accounting method is a bookkeeping procedure developed and used to some Axtent in the East to estimate soil-moisture content by using climatological data. It is based on two important principles:
1. If there is an adequate supply of available moisture in the soil, the consumptive-use (evapotranspiration) rate for any given crop depends primarily on climatological conditions.
2. If the moisture content of ' a soil is known for any given time, the moisture content at any later time can be computed by adding water gains (effective rainfall and/or irrigation) and subtracting water losses (consumptive use) during the elapsed period.
One of the problems in using this method is ma~ng a reliable es~imate of the daily consumptive-use rate for the crop grown. If research has already established an average daily consumptive-use rate for the same

1-61
8rop in nearby areas, this rate should be used. Generally such data are not available, however, and the consumptive-use rate must be estimated. To arrive at an accurate estimate of the consumptive-use rate for any given day, it is necessary to correct the average rate for the weather conditions of that day.
The four principal climatological factors that influence a change in consumptive use for any given day are: (1) Average temperature, (2) percentage of possible sunshine hours or sunshine duration, (3) average relative humidity, and (4) average wind sp~ed. Of the four factors, tempera~ure and sunshine duration are by far the most significant. Temperature can easily be measured on the site with a reliable thermometer. The average of the high and low readings for a 24-hour period can be taken as the average temperature for that day. The same readings can often be obtained from a nearby Weather Bureau station. Either sunshine duration or cloudiness can be estimated visually with sufficient accuracy for ordinary farm irrigation. Relative humidity and wind speed are of minor significance and can be ignored without seriously affecting the data. They are difficult to measure, and measurements are not available [ram the Weather Bureau in most areas.
Variations [rom the average daily consumptive use caused by fluctuations ir. temperature and sunshine duration can be computed by the Penman procedure and can be used to modify average daily consumptive-use values. The modified values can then be tabulated in some convenient way, as shown in table 1-8. The applicable consumptive-use rate for any GeL. of Weather conditions for a given day can be read directly from the table.
The noisture-accounting method requires a daily measurement of rainfall at the site. A small, inexpensive rain gage is satisfactory if it is read carefully. It should be located away from buildings, trees, and high vegetation so t.hat it accurately measures the amount of rainfall. It should be read early each morning.
Keefing the daily balance is a simple procedure, but it must be done each day. By knowing the daily values for rainfall, the estimated rate of consumftive use, and the amount of available water that can be deple~ed safely before irrigation, the daily balance can be computed in the following marmer.
computation must be started when it is certain that the soil is at field capacity, which it usually is on the day following a heavy rain or an irrigation. Then each morning the amount of available moisture in the soil is computed by subtracting the estimated co"nsumptive use for the' previous day from the previous morning's balance. The previous day's irrigation and rainfall, if any, is added to the previous morning's balance. Early morning (7 orB a.m.) has been selected as a convenient time to compute the daily balance since weather data for the previous 24 hours are usually available from local Weather Bureau stations and local radio programs at this time.

1-62
Table 1-8.--Values for daily consumptive use that reflect variations in temperature and sunshine duration for July
Location: Greensboro, N.C. Latitude: 360
_05' N. Crop: Alfalfa
Observed Daily consumptive use for
observed daily sunshine duration of--average daily 8.9 hours 14.4 hours
temperature 0 hours 5 hours (average) -10 hours (maximum possible)
o F. Inches Inches Inches Inches Inches --65 0.13 0.16 0.19 0.20 0.23
70 .. 13 .17 .21 .22 .25
75 .14 .18 .22 .23 .26
77.21 - - .23 - -80 .15 .20 .24 .25 .28
85 .16 .22 .26 .27 .30
90 .17 .23 .27 .28 .33
1 Average.
When rainfall causes the daily balance to exceed the field-ca.pacity level, the excess is presumed to be lo[;t either to surface runoff or to deep percclation. Then the daily 'balance is recorded as the field-capacity level. Some rains may be of such high intensity that they cause surface rW10ff before the soil is filled to field capacity. When this occurs, investigations should be made so that the amC)W1t of moisture that en-c.ered the soil can be estimfl.ted. This arr:.OW1t should be entered instead of the total rainfall amoW1t.
~~en the daily balance reaches the point at which soil moistl~e is depleted to the predetermined allowable limit, it is time to irrigate. Ignoring application efficiency, the amount of water to be replaced in the soil by irrigation is the amount that brings the moisture level up to field capacit.y. To arrive at the balance on the morning following irrigation, this amount is added. The balance is then computed daily until another irrigation is indicated. Table 1-9 shows the method of moisture accoun-;.;ing used for alfalfa during July at Greensboro, N.C., and is suggested for use elsewhere.

1-63
Table 1-9.--Moisture-balance sheet for scheduling irrigation
Farm JOM Doe Field No._....;5~_Crop Alfalfa Month July Year 1957
County Guilford State North Carolina Soil type Silt loam
Moisture-holding capacity in root zone ___ 4~.5....;0~ ________ inches
Net moisture to apply at each irrigation 2.25 inches~
''I Temperature ~
I 0 Remarks: o ·rl Po-t-> I=: (Appearance of "Cl ro d 0
Day "Cl Q) Q) > H o-i ·rl plant, height of
.~ .~ Q) Q) I=: -t-> Q) ·rl o-i -t-> Q) tID > ·rl a:I Po ro ro Q
plant, wind, etc. ) ro H';:; ~~~ 'i:1 bO ~§ H ~ ~ ·rl
~ Q) -t->·rl e ·rl ~ • .-1 o-i
~ > <3 ~ til ro &! ro ro « ~"Cl-t-> H 0.0
0 0 of. • ~ F. Hr. In. In. In. In. - - - - Balance brought 1.48
forward from 6/30. 1 85 65 75 14 0.26 1.22 2 81 61 71 13 .24 .98 3 86 59 72 14.5 .25 I .73 4 90 64 7? 14.5 .27 .46 5 91 69 80 10.5 .25 .26 .47 6 85 63 74 14.5 .26 .21 7 89 58 74 14.5 .26 2.25 2.20 8 93 65 79 14 .28 1.92 9 94 70 8~
~ 12 .27 1.65 10 89 69 79 14.5 .28 1.37 11 87 63 75 14 .26 1.11 12 93 60 76 14 .26 .85 13 95 66 80 13.5 .27 .58 14 96 73 84 13.5 .29 .29 15 93 70 81 10 .25 .04 16 92 69 80 11 .26 2.25 2.03 17 89 68 78 5 .19 1.63 2.25 1.22 inches lost 18 80 69 74 2 .16 .12 2.21 19 85 66 75 11 .24 1.97 20 87 62 74 14 .26 1.71 21 90 67 78 14 .27 1.44 22 92 69 80 11.5 .26 l.18 23 93 72 82 9.5 .25 .11 1.04 24 81 66 73 8.5 .21 .02 .85 25 83 60 71 14 .25 .60 26 83 59 71 13 .24 .36 27 82 67 74 13 .25 .11 28 86 62 74 13.5 .25 2.25 2.11 29 88 63 75 14 .26 1.85 30 92 64 78 12.5 .26 1.59 31 93 67 80 13 .27 1.32 Totals .......................... 2.14 6.75 1.32 Carry over to
Aug. 1
1 Based on replacing 2.25 inches of moisture when the 50-percent level has been reached.
2 Values taken from table 1-10.
•

l-l::4
The moisture-accmmting method has the obvious advantage of l:,equiring no ccstly equipment and very little labor. Its accuracy depends on accurate estimates of the; water-holding capacity of the soil, on accurate computation of the daily water-use rate, and on good judgment in Ildjusting the rate for each day's weather. As more consumptive-use data become available and practical methods of adjusting the daily use rate for climatological variations are developed, this method seelDS to have greater possibilities for determining when to irrigate than any of the other methods.
Using a few well-placed soil-moisture measuring units to sup:plement moisture accounting improves irrigation scheduling. The accounting procedure indicates the overall pattern of moisture depletion. The moisture-measuring units serve to check conditions at particular locations in n field as well as to indicate the depth to which rainfall or irrigation water has penetrated the soil. They provide a check on the accounting for the crop, soil, and weather conditions in a particular field in a particular ;fear. They also are good tools to use in auditing the daily bnla!1,_'e rCl.!ords for arithmetical mistakes and inaccurate consumptive-use rates.
Evaporation-Pan Method
Interest in using evaporation pans to schedule irrigation is growing. Research in various parts of the country shows a close relation between -+:.he rate of consumptive use by crops (evapotranspiration) and the rate of evaporation from a well-located evaporation pan. This correlation indicates that measw'ements of pan evaporation are accurate enough for schedulinG irrj gution. This method is cheap and simple.
Pruitt and Jensen have reported comparisons of actual consumptive use and pan evaporation for four crops at Prosser, Washington. They use threE; levels of moistu.re treatment--wet, medium, and dry. Th.ree of their compariscns for the weL treatment and the period of good ground cover are shown in figure 1-25. The evaporation data are for a pan located about 3 miles south of the experimental site in an environment similar to that of the experimental site. The evaporation pan was 6 feet in diameter and 2 feet deep and was set in the ground with the rim about 2 inches above the surface. The water level was kept at between 2 and 4 inches from the top of the pan.
The g:)od correlation shovm was obtained by multiplying pan-evaporation data by a crop factor. Pruitt, and Jensen report that during the early stages of plant growth, when plants are small and provide little ground cover, the measured consumptive use for sugar beets and potatoes is considerably lower than the average pan evaporation. In almost all later periods when the crop provides good ground cover, however, eonsumptive use is about equal to or greater than pan evaporation. The ratio for alfalfa varies throughout the season. During periods when cuttings are taken off, there is a consistent reduction in the ratio between consumptive use and pan evaporation as compared with periods when no cuttings are taken.

1-65
30 / "
2.8
2.6
2.4
2.2.
til a: 2.0 III III
X > 0
u u z ~
18
- 0 a: u
III e 16 III 0 ::l 0
C)
IiJ ... 14
> 0
l- e 0 « 12. a: .J III
::l ~
~ a: 10
::l 0 ... U
B
6
4
2.
/ I
/1 !I'
WET TREATMENT Jv,/ I ... :J /;1 ~ if -;:? V
..,'" ~.
// ~I / ~
(/ A ~ I
P7J~ l / l 1l 1$ /' 4~ ~ I.; I'" I- j'
il /ll,l // 1;- ,t
'f .:JC3
'~ III .1"
/; j( J // I 1 0---0 MEASURED CONSUMPTIVE
USE (U) I I fr .1 ! ~-.. EVAPORATION (E) )( CROP FACTOR
SUGAR BEETS,. E )I 1,02
0
II ! V EARLY POTATOES. EX" 32.
~ J ALFALFA = E)( 1,09 I - .. APR MAY JUNE JULY AUG SEPT OCT NOV
TIME (MONTHS)
Figure 1-25. --Cumulative curv,es for measured consumptive use (U) and for evaporation (E) from a USDA BPI pan at Prosser, Wash. (Redrawn from Pruitt, W.O., and Jensen, M. O. Determining ilhen To Irrigate.· Agr. Engin. 36: 181-184. 1955.)
1-66
Pruit t and J ens en conc lude that consumptive use dropped off w:i th the dry moisture treatment but that the decrease was not large unless yields were materially lowered. The difference between U and adjusted E was slightly more for alfalfa than for row crops, probably because of the effect of cuttings. The favorable correlation between E modified by a crop constant and U indicates promise of the development of evaporation equipment that a farmer can use to tell when to irrigate.
Harrold got similar results at the Coshocton, Ohio, Hydrologic Station (fig. 1-26). The irrigated corn was grown in 1953 on lysimeter YI02 on land having a l2-percent east slope. The alfalfa data are for alfalfatimothy grown on lysimeter Y102 in 1952. Correlation constants for these two sets of data are shovm for the various months in the growing season. The data for irrigated corn indicate a relationship between evapotranspiration and pan evaporation during July and August, a period in which an adequate soil-moisture content was maintained by irrigation. Harrold points out that in May and June the relation seems to be influenced by surface moisture and that evaporation is relatively more important then since transpiration is low. A sunken 6-foot BPI pan was used to get the evaporation data. The consumptive-use data were from the Coshocton weighing-recording lysimeters.
Harrold concludes that if an irrigation farmer has evaporation-pan data Oil a site and has factors for deriving therefrom day-by-day moistureuse values for his crop throughout the season he may be able to keep a set of books on available moisture--rain and irrigation on the plus side and cons\®ptive use on the minus side of the ledger.
Figure 1-27 shows the relation of the avera,ge daily evapotranspiration for ryegrass to evaporation from a U.S. Weather Buxeau class·-A pan by months as determined by Pruitt and Angus from studies at the University of California at Davis. The average daily evapotranspiration by months plotted against pan evaporation indicates that there is a close relation throughout the season if dry, north-wind days are not considl~red. On such days the departuxe from normal is extreme, especially in the fall. Figure 1-27 Rlso shows that the ratio of evapotranspiration to pan evaporation ranges from about 0.73 to 0.8 and that the average is 0.77 from April to September.
Vaughn E. Hansen and his associates at Utah State University have experimented with the relation of evapotranspiration to pan evaporation. Their work indicates that measuring evaporation is a practical approach that can be used by farmers to schedule irrigation. In addition to using a Weather Bureau pan, they found that measurements from a 50-gallon oil drum bUried in thp soil give a reasonable correlation but that the ratios are somewhat higher than those shown by Weather Bureau pan data.
The location of the evaporation pan is important. The data from Davis, Calif .. , shown in figure 1-28 indicate that the wetness or dryness of the area immediately surrounding the pan is highly important. Th.e U.S. Weather Bureau recommends that the site be nearly level, sodded, and

a5~ ____ ~ ____ ~~ ____ ~ ____ ~ ____ ~
til <Il .c U
(DOUBLE MASS-CURVE PLOTTING)
ao ~----~------~----4----
C 15~----4------+--!::!. c o ..... .... ~ IQ~----~--~~~----4------+----·~ ... o a. ~ > <Il
C ~
p..
a. ~
til <Il .c U
It
0
as
ao
~ 10 I' ao
Evapotrans;)lration (Inches) lET) IRRIGATED CORN 1953
(OOUBLE MASS-CURVE PLOTTING)
c 15~----~·-----4---
c o ..... .... ~ 10 ~-----+--... o a. ~ > <Il
C ~
0..
o 10 15 zo
Evapotranspiration (Inches) (ET) ALFALFA-TIMOTHY 1952
a5
z,
May 1-31 ET = 1.0Ep
June 1-30 ET = 0.5Ep
1-67
July 1 - Aug.31 ET = 1.5Ep
Sept. 1-15 ET = 1.2Ep
May 1-31 ET = 1.6E p
June 1- July 15 ET 1.1Ep
July 16 - Sept. 30 ET = O.SEp
Figure 1-26.--Relation of measured evapotranspiration for irrigated corn and alfalfa-timothy to evaporation from a BPI-type pan at Coshocton} Ohio. (Redrawn from Harrold, L. L. Evapotranspiration Rates for Various Crops. Agr. Engin. 36: 669-773. 1955.)

1-68
I .. u~ II!!9
"Y~.P DAVIS/CALIF".
5=' < 0 6
~ ~
~"UN , 91;0
AUG~
SEPT,b V .... Ay
Z 0 ~ < • 0:: n. III Z 3 < 0:: I-
~ z < > W
pf. ./ ~~
MARV
F"EB~
~ ~NOV
JAN """""0' DEC
o
196
1 'T z 3 • 5 • • 10
EVAPORATION (MM-DAY) (USWB CLASS A PAN)
Figure 1-2?--Relatlon of average daily evapotranspiration for ryegrass to evaporation from a U.S. Vvea Lher nW'eau class-A pan by months at Davis, Calif.
free of o~structions. Trees, buildings, and shrubs should be no closer to the pan than two times and preferably foW' times their height above the pan. Weeds and grass in and around the pan should be mowed often enough to keep them below the level of the pan. The pan ShOl,ld be free of any obstructions that cast shadows over it dW'ing any part of the day other than brief periods near sunrise or sunset. At reservoirs a site on the upwind side is preferable, based on the prevailing direction of the strongest ·winds. ':'he pan should also be far enough. away so that waterdrops from spillways or those picked up by strong onshore winds are not deposited in the pan.
The effect of the stage of p1apt growth on the ratio of evapotranspiration to pan evaporation is shown in figure 1-29, which is based on studies of sugarcane in Hawaii. After the fourth month, the ratio is between 1 and 1.2. But for the first 4 months, it is between 0.4 and 1. This study fW'ther indicates that irrigation can be scheduled from panevaporation data.
The factor (ratio) for any crop seems to depend mostly on foliage characteristics, stage of growth, environment, and geographical location.

1-69
'0 - - t;;." - ~+ - ---1-;-- 7"
~~ 'f/~-~~E.J.<-;t/ IS
30
. ~
SE"TEMBEI< 1 /" /' , 1 I I ! i-r: ..... -- L_,",- L ... _ ,L' - 1
1
-- I I y i .-1 " ,/ '
-! -!/Gu:: -~</f' /~ /' t- --1- . - I : /t-- - 7~-' ~7~ I I l-/ - .--./-,7'~. -.--- ------ ---- -1----.- j--- -I
I l~/./ ~ USDA B_ P, I. I'DIA_, " DEEP PAN (LARGE GRASS "ELD)
, ~,( ,....-" I x-.-y uswe CLASS A PAN (LARGE GRASS F.ELD) I I /- --v~.(,:~~· - r --- -:-- 0---0--_ USWB CLASS A PAN C .. 'FETCH OF GRASS 'N ;;-;:-Y-~A~~~~EAI
/,'~ ~ . -'-' USWB CLASS /II. PAN (CRY-L..AND AREA) I J u N E ..".'. I / ~y T- ------ -- --- ---- ----- -r- --- ----I -- - - -
.0
10 " 20 30 '0 05 ~o ., 10 " 10
CUMULATiVE EVAPOA ... TlnN F"ROM PANS (INCHES)
Figure 1-28.--Relation of cumulative evapotranspiration for perennial ryegrass to evaporation from two types of pans in different environments at Davis, Calif.
AVERAGE EVAPOTRANSPIRATION/PAN EVAPORATION RATIOS
FROM THREE FIELDS COMPAREDTO AGE OF CANE
0 I- 1.1 « It ., I Z
2 '-0 I-« 10: D •• 0 II.
v ....... I""'" "-
--' V "' i,......--"
I if
« D_ I > W D, 7 Z « D. 0"
/ /
"Z 0 D_ 5 / i= ( D, • I:
./ a:
D, J II Z « o. z It I-
2 D. I
« > w • • ID " 12 U II 15 I. 17 • "
CANE AGE (MONTHS)
Figure 1-29.--Ratio of average evapotranspiration to pan evaporation for three fields by age of sugarcane. (Redrawn from Chang, Jen-Hu. Microclimate of Sugarcane. Hawaii Planters' Rec. 56(3): 195-225. 1961. )

1-70
The effect of some individual factors is shown in figures 1-~~5, 1-26, and 1-29. Jensen, Middleton, and Pruitt developed the crop feLctors shown in table 1-10 for several crops grown in central Washil~ton.
Table l-lO.--Crop-factor values for computing estimated COll5\~ptive use from pan-evaporation data for several crops grown in central Washington1
C r 0 p
Corn, grapes, and clean-cultivated peach orchard •••••••••••• Alfalfa, grains, Ladino-grass pasture, and sugar beets •••••• Beans, peach orchard with cover crop, and potatoes .••••••••• Apple orchard with grass cover •••••••••••••.••••••••••••••••
Crop factor2
0.85 .95
1.00 1.05
1 From Jer.sen, M. C., Middleton, J. E., and Pruitt, W. O. Scheduling Irrigation From Pan Evaporation. Wash. Agr. Expt. sta. Cir. 386, 14 pp. 1961.
2 To provide a safety margin for field use, these recorronended values are 0.05 larger than the average measured values.
It must be remembered that evaporation-pan data are approxim~tions of consumptive use and are not measurements of soil moisture. The amount of soil moisture used in a given period must be calculated. This can be done by applying the factor for the crop to be irrigated to the amount of water, or depth of water, evaporated from the pan during that period. This calculated amount then represents the soil moisture (in inches) used by the crop. In other words,
Evapotranspiration (U) = pan evaporation (E) x crop factor.
In using evaporation-pan data to schedule irrigation, it is necessary to know only the amount of moisture to be replaced at each irrigation. It is then a simple matter to determine what depth of water must be evaporated from the ,pan to equal the amount to be replaced in the soil.
Jensen, Middleton, and Pruitt based their method for scheduling irrigation from pan-evaporation data on a "water account" of the moisture in the soil. Deposits to the account are from irrigations and precipitation. Withdrawals from the account are from crop consumptive use (evapotranspiration). Crop consumptive use is determined by multiplying measured evaporation from an evaporation pan 4 feet in diameter by the established constant (crop factor) shown in table 1-10. The pan should be located in an area 50 x 50 feet on which there is a lawn-type cover that is kept green and clipped like a lawn. The station should be fully exposed to sunlight and wind and be within a field in which the estab~ lished crop, such as pasture or alfalfa, is no higher than the top of the pan. A water-supply tank is used. By means of a float vB.lve the

1-71
water level is kept 2-1/2 inches from the top of the pan. Rainfall is measured by a rain gage. Significant amounts of rainfall are considered in addition to evaporation. For runoff-producing storms, the wastedwater is deducted from the reported rainfall.
M. D. Shaw at Pennsylvania State University found that using evaporation data from 5-quart oil cans 9-1/2 inches high is a successful farm method of determining when to irrigate. The oil cans are painted with metallic zinc paint for uniformity and to prevent rusting. Evaporation from a can set with one-fourth of its height in the ground is very close to that from a standard Weather Bureau evaporation pan. These cans serve as rain gages as well as evaporation cans. The cans are filled to a 7 .. inch depth when it is known that the soil-moisture level is at field capacity. When the water level in the can has dropped an amount equal to the amount of water to be applied at each irrigation, it is time to irrigate. The can should be filled to the starting level after each irrigation or after a rainfall that brings the soil-moisture level up to field capacity. Small rains add water to the pan as well as to the soil, keeping both in balance. After an intense rain that produces rapid runoff, it is necessary to make the best estimate possible of the soilmoisture level.
The standard Weather Bureau evaporation pan shown in figure 1-30, which is generally used in research, probably is too cumbersome to be practical for most irrigators to use and its installation is expensive for the small-scale irrigator. A simpler type of evaporation pan tha~ provides fairly close correlation is needed for farm use. The 50-gallon oil drums used by Hansen and the 5-quart oil cans used by Shaw indicate that relatively cheap pans can be used provided they are well located and the evaporation data are correlated with the consumptive use of the crops to be irrigated.
Evaporation-pan data, like the accounting method, indicate the probable overall pattern of moisture depletion for a field. A few well-placed soil-moisture-measuring units are valuable for checking the crop factors used and provide a basis for adjusting a factor to the particular soil, crop, and weather conditions in each year. These units can also be used to check moisture conditions at troublesome spots in a field as well as to indicate the depth to which rainfall or irrigation water penetrates the soil.
•

1-7Z
-- PLAN Outline of pan.
t ' \---
~• , "-l,q
III
Ne. , - -' - - • - • - - grOWlQ. I :
L.. __ --- -------- --- - - - - - ~ ~':'rn -J-r,,""~ ~r7T~~"""'J"'r~Tr>T7EIrr.,..,-r. TTrr? , ~. " ,,7/~ ",,, """"'''.'"'- Original ground surface.
ELEVATION
?igure 1-30. --Standard Weather Bureau evaporation pan. (FrOIr, U. ;'i. Weather Bur. Instructions for C::'imato1ogicaJ. Obser-.,rers. 10th ell.. rev. 1955.)
'IJ S GOYEM!ElIT PRIIIT::IG OffICE, 1981 728-97911959